Fredriksson (2007)
14
Ocean Engineering 34 (2007) 2124–2137 Development of structural modeling techniques for evaluating HDPE plastic net pens used in marine aquaculture David W. Fredriksson a, , Judson C. DeCew b , Igor Tsukrov c a Department of Naval Architecture and Ocean Engineering, United States Naval Academy, 590 Holloway Road, Annapolis, MD 21402, USA b Center for Ocean Engineering, University of New Hampshire, 24 Colovos Road, Durham, NH 03824, USA c Department of Mechanical Engineering, Kingsbury Hall, University of New Hampshire, Durham, NH 03824, USA Received 6 February 2007; accepted 18 April 2007 Available online 3 May 2007 Abstract Finite-element modeling (FEM) techniques are developed to determine the structural capabilities of net pen flotation structures made of high-density polyethylene (HDPE). The modeling approach uses shell elements and localized failure criteria to predict critical loading conditions. Finite element modeling simulations were performed using values for the modulus of elasticity for weathered HDPE determined from a series of tensile tests. Poisson’s ratio and yield stress used with the approach were obtained from standard manufacturers values. To investigate the method, a series of experiments were performed in the laboratory by testing circular sections of HDPE pipe to localized failure (‘‘kinking’’). The same test was replicated with the FEM using localized failure techniques. Laboratory and model results were within 16%. A FEM was then built to represent the complex geometry of a net pen flotation structure deployed at an operational fish farm located in Eastport, ME, USA. Simulations were performed using attachment line tension values measured at the site. The goal was to assess flotation pipe stress levels for typical operational conditions. Simulations were also performed to investigate the maximum capabilities of the net pen structure with different attachment line configurations. Quantifying the operational limits will become more important as these systems are considered for more exposed, energetic environments. r 2007 Elsevier Ltd. All rights reserved. Keywords: Coastal aquaculture; Aquacultural engineering; Finite-element analysis; Fish cages 1. Introduction Most of the existing marine aquaculture installations are presently located in protected near-shore areas. Many in the industry are considering moving operations into exposed sites because of coastal multi-use issues. The development of inshore marine aquaculture technology has evolved over the past several years (decades) primarily through operational experience. It is now common to find flotillas of surface gravity cages constructed using high- density polyethylene (HDPE) pipe in most marine finfish- producing countries. The use of HDPE pipe for this application is advantageous because the components are relatively easy to fabricate and repair, the plastic has outstanding corrosion characteristics and the material is compliant and (historically) inexpensive. As the industry investigates the option of moving to exposed sites, it is unclear how the existing equipment will be able to withstand higher energy environments. The structural integrity of a surface gravity cage system is investigated as part of a comprehensive study working with a marine aquaculture company facility with 20 deployed net pens. The project included the installation of current meters and load cells to measure the forcing and resulting loads in components of the farm (Fredriksson et al., 2006). The components consist of anchor leg assemblies, net pen attachment lines and HDPE net pen structures. As part of the project, a fluid–structure interaction model (Tsukrov et al., 2003, 2005) was used with the field measurements to assess mooring gear ARTICLE IN PRESS www.elsevier.com/locate/oceaneng 0029-8018/$ - see front matter r 2007 Elsevier Ltd. All rights reserved. doi:10.1016/j.oceaneng.2007.04.007 Corresponding author. Tel.: +1 410 293 6434. E-mail addresses: [email protected] (D.W. Fredriksson), [email protected] (J.C. DeCew), [email protected] (I. Tsukrov).
description
acuicultura
Transcript of Fredriksson (2007)
ARTICLE IN PRESS
0029-8018/$ - see
doi:10.1016/j.oc
�CorrespondiE-mail addre
Ocean Engineering 34 (2007) 2124–2137
www.elsevier.com/locate/oceaneng
Development of structural modeling techniques for evaluatingHDPE plastic net pens used in marine aquaculture
David W. Fredrikssona,�, Judson C. DeCewb, Igor Tsukrovc
aDepartment of Naval Architecture and Ocean Engineering, United States Naval Academy, 590 Holloway Road, Annapolis, MD 21402, USAbCenter for Ocean Engineering, University of New Hampshire, 24 Colovos Road, Durham, NH 03824, USA
cDepartment of Mechanical Engineering, Kingsbury Hall, University of New Hampshire, Durham, NH 03824, USA
Received 6 February 2007; accepted 18 April 2007
Available online 3 May 2007
Abstract
Finite-element modeling (FEM) techniques are developed to determine the structural capabilities of net pen flotation structures
made of high-density polyethylene (HDPE). The modeling approach uses shell elements and localized failure criteria to predict
critical loading conditions. Finite element modeling simulations were performed using values for the modulus of elasticity for weathered
HDPE determined from a series of tensile tests. Poisson’s ratio and yield stress used with the approach were obtained from standard
manufacturers values. To investigate the method, a series of experiments were performed in the laboratory by testing circular sections
of HDPE pipe to localized failure (‘‘kinking’’). The same test was replicated with the FEM using localized failure techniques.
Laboratory and model results were within 16%. A FEM was then built to represent the complex geometry of a net pen flotation structure
deployed at an operational fish farm located in Eastport, ME, USA. Simulations were performed using attachment line tension
values measured at the site. The goal was to assess flotation pipe stress levels for typical operational conditions. Simulations were
also performed to investigate the maximum capabilities of the net pen structure with different attachment line configurations.
Quantifying the operational limits will become more important as these systems are considered for more exposed, energetic
environments.
r 2007 Elsevier Ltd. All rights reserved.
Keywords: Coastal aquaculture; Aquacultural engineering; Finite-element analysis; Fish cages
1. Introduction
Most of the existing marine aquaculture installations arepresently located in protected near-shore areas. Many inthe industry are considering moving operations intoexposed sites because of coastal multi-use issues. Thedevelopment of inshore marine aquaculture technology hasevolved over the past several years (decades) primarilythrough operational experience. It is now common to findflotillas of surface gravity cages constructed using high-density polyethylene (HDPE) pipe in most marine finfish-producing countries. The use of HDPE pipe for thisapplication is advantageous because the components are
front matter r 2007 Elsevier Ltd. All rights reserved.
eaneng.2007.04.007
ng author. Tel.: +1410 293 6434.
sses: [email protected] (D.W. Fredriksson),
J.C. DeCew), [email protected] (I. Tsukrov).
relatively easy to fabricate and repair, the plastic hasoutstanding corrosion characteristics and the material iscompliant and (historically) inexpensive. As the industryinvestigates the option of moving to exposed sites, it isunclear how the existing equipment will be able towithstand higher energy environments.The structural integrity of a surface gravity cage system
is investigated as part of a comprehensive study workingwith a marine aquaculture company facility with 20deployed net pens. The project included the installationof current meters and load cells to measure the forcing andresulting loads in components of the farm (Fredrikssonet al., 2006). The components consist of anchor legassemblies, net pen attachment lines and HDPE net penstructures. As part of the project, a fluid–structureinteraction model (Tsukrov et al., 2003, 2005) was usedwith the field measurements to assess mooring gear

ARTICLE IN PRESSD.W. Fredriksson et al. / Ocean Engineering 34 (2007) 2124–2137 2125
operational limits (Fredriksson et al., 2007). In this study,the structural capabilities of the HDPE net pens used tocontain the finfish product are examined.
Fish farm component details used in the comprehensivestudy were obtained from an operational facility located inEastport, ME, USA (Fig. 1). The Eastport site is located inBroad Cove near the border of New Brunswick, Canada.Deployed at the site is an array of net pens configured in a5� 4 near-surface mooring grid system. It is oriented in anorth–south direction and held up with flotation elements(Fig. 2). The surface portion of the farm has theapproximate dimension of 219m� 274m. Each of the netpens has a nominal radius of 15.9m.
The aquaculture site in Broad Cove is influenced bythe extreme tides of the Bay of Fundy (Dudley et al.,2000). The predominant forcing on the farm components isa result of the tidal currents. The tidal currents interactwith the nets and HDPE pipe components to createdrag forces. The loads on each net pen are transferredto the mooring grid system, ground tackle and anchorsusing sets of attachment lines (y-lines). To quantify theforcing at the site, a current meter was installed at anexterior farm location (see the focus area in Fig. 2). Inaddition to the current meter, four load cells were installedon the West (W), Southwest (SW), East (E) and Southeast(SE) y-lines. Instrument positions and y-line compo-nents are shown superimposed on the aerial photographin Fig. 2.
Fig. 1. The Broad Cove fish farm is
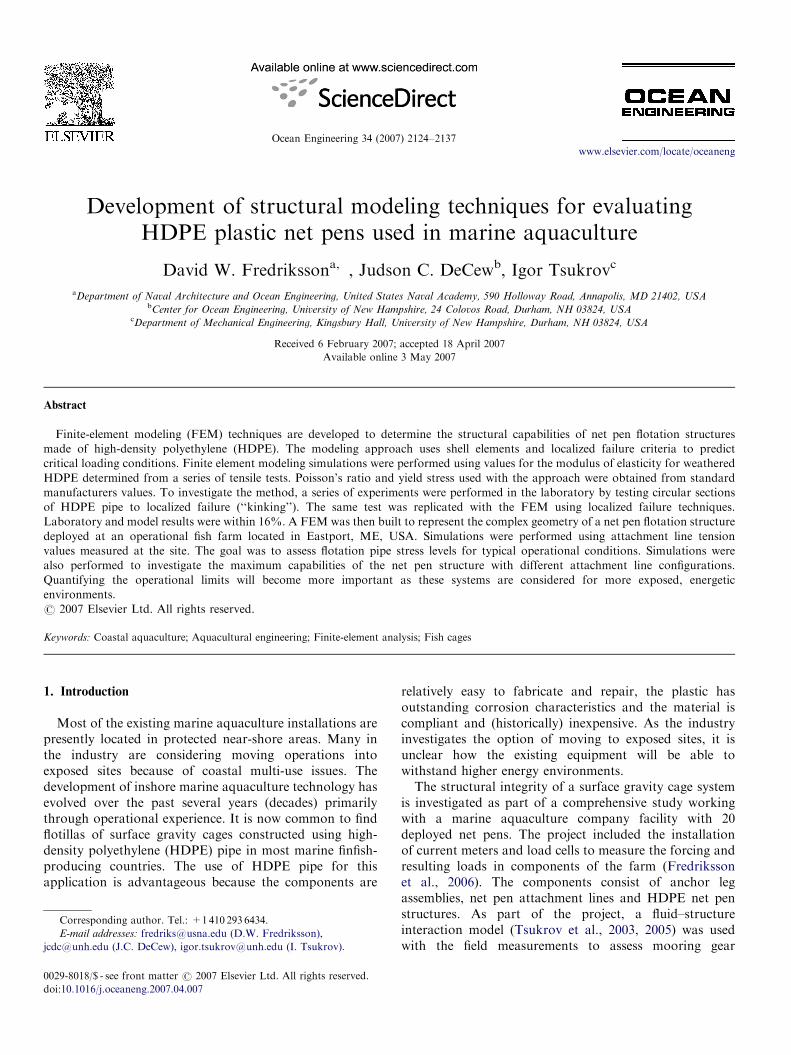
Each of the 20 net pens at the site is circular and isconstructed with HDPE pipe. The surface flotation rimstructure of each net pen consists of two concentric rings ofpipe with a nominal diameter and thickness of 323 and19.8mm, respectively. The pipes are held together bypassing them through 48 brackets constructed of two largerpipe sections (diameter ¼ 406mm, thickness ¼ 6.9mm).The brackets also incorporate a handrail support assemblymade with 114mm diameter pipe with a thickness of5.7mm with vertical and angled members through which acircular ‘‘handrail’’ is passed. These components are shownin Fig. 3 (a load cell recorder strapped to one of the net penstanchions is also shown in the figure).For most deployments at this site, the net pen
components have been specified appropriately throughyears of operational experience. However, the actualcapabilities of these components are rarely quantified.If the same structures are to be deployed in a moreenergetic environment, the point of failure will need to bepredicted to prevent escapement, which can havedire economic and environmental consequences. Therefore,the objective is to develop a technique for predicting thestructural integrity of the flotation structure of HDPEnet pens. The technique is developed utilizing a combina-tion of laboratory and computer model experiments. Usingthe technique, finite-element modeling (FEM) simulationsare performed for loading conditions at the Broad Covesite. The same model is then used to investigate maximum
located in Eastport, ME, USA.

ARTICLE IN PRESS
Fig. 2. The fish farm consists of 20 net pens each with an approximate radius of 15.9m. Instrumentation was deployed in the SW portion of the farm (see
focus area). Load cells were installed on the W, SW, E and SE y-lines on the southern portion of the pen and a current meter at an external farm location.
D.W. Fredriksson et al. / Ocean Engineering 34 (2007) 2124–21372126
loading conditions at estimated yield values for thematerial.
The first step in the approach was to carry out a series oflaboratory tensile tests to determine the modulus ofelasticity for samples of weathered HDPE using a rangeof loading rates. The next step was to develop the modelingprocedure for HDPE pipe, including stress–strain char-acteristics and FEM techniques. This was done by utilizingshell elements and employing localized failure criteria.Circular ring experiments were then performed where fivesamples of actual pipe were tested to localized failure in thelaboratory. The laboratory tests were replicated usingFEM simulations. The results were then compared.Finally, the FEM approach was applied to the morecomplex geometry of the pen flotation structure deployedat the Broad Cove site. Calculations were performed toexamine the stresses in the pipe during operation at thefarm and to investigate the maximum load the net pen pipeassemblies can withstand.
2. Finite-element procedure and material modeling
2.1. Experimental study investigating mechanical properties
of HDPE
Unlike linear elastic materials such as steel, HDPE isconsidered viscoelastic because the material behavesdifferently depending upon the load rate. A slowly appliedload will cause the HDPE to undergo large deformations asthe polymer bonds of HDPE ‘‘settle’’ and ‘‘unwind.’’However, if the same load is applied quickly, the bonds donot have sufficient time to react, resulting in less deforma-tion. As a result, the modulus of elasticity relating stressand strain can be substantially different. Net pens that arelocated in exposed marine environments where waves andcurrents are prevalent may have a range of loading ratesthat are structure and site specific. To investigate themodulus of elasticity characteristics for weathered HDPE,a series of tensile tests were performed using samples of
ARTICLE IN PRESS
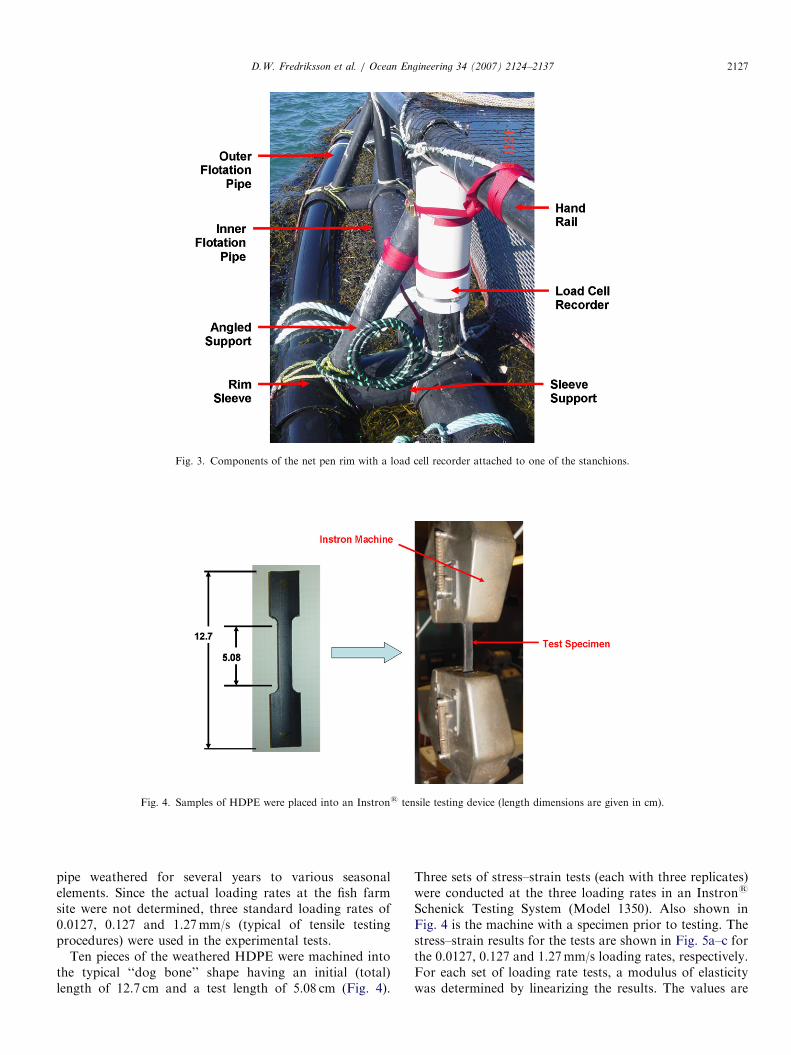
Fig. 4. Samples of HDPE were placed into an Instrons tensile testing device (length dimensions are given in cm).
Fig. 3. Components of the net pen rim with a load cell recorder attached to one of the stanchions.
D.W. Fredriksson et al. / Ocean Engineering 34 (2007) 2124–2137 2127
pipe weathered for several years to various seasonalelements. Since the actual loading rates at the fish farmsite were not determined, three standard loading rates of0.0127, 0.127 and 1.27mm/s (typical of tensile testingprocedures) were used in the experimental tests.
Ten pieces of the weathered HDPE were machined intothe typical ‘‘dog bone’’ shape having an initial (total)length of 12.7 cm and a test length of 5.08 cm (Fig. 4).
Three sets of stress–strain tests (each with three replicates)were conducted at the three loading rates in an Instrons
Schenick Testing System (Model 1350). Also shown inFig. 4 is the machine with a specimen prior to testing. Thestress–strain results for the tests are shown in Fig. 5a–c forthe 0.0127, 0.127 and 1.27mm/s loading rates, respectively.For each set of loading rate tests, a modulus of elasticitywas determined by linearizing the results. The values are

ARTICLE IN PRESS
Fig. 5. Stress–strain data results (with three replicates) when loaded at (a) 0.0127mm/s, (b) 0.127mm/s and (c) 1.27mm/s.
Table 1
Modulus of elasticity values obtained from tensile using weathered HDPE
samples
Sample Modulus of elasticity (Pa)
Rate 1, 0.0127mm/s Rate 2, 0.127mm/s Rate 3, 1.27mm/s
1 7.80� 108 9.52� 108 1.18� 109
2 5.10� 108 6.73� 108 7.72� 108
3 7.13� 108 9.27� 108 1.17� 109
S.D. 1.41� 108 1.54� 108 2.33� 108
average 6.67� 108 8.37� 108 1.04� 109
D.W. Fredriksson et al. / Ocean Engineering 34 (2007) 2124–21372128
provided in Table 1. Also provided in Table 1 are thestandard deviation and average of the modulus of elasticityvalues. Tensile testing results show a dependence on theloading rate, though the results from using specimen 2 werelower than those of specimens 1 and 3 for each of the testsets. It is possible that the difference can be attributed tovaried weathering conditions. The average value of themodulus of elasticity for the slowest loading rate, equal to6.67� 108 Pa, was used as input for the FEM calculations.It should be noted that a value 8.00� 108 Pa was used byVikestad and Lien (2005) to examine the bending stiffnessof fish cage collars.
2.2. Finite-element analysis of HDPE pipes and localized
failure criteria
FEM of the HDPE pipe was performed by utilizing shellelements developed to analyze thin structural componentswith high bending stiffness. These elements combine bothmembrane and bending resistance to applied loads. It isassumed that the flexural deformation of the shell occursaccording to the Kirchhoff–Love hypotheses, so thatbending stresses and strains are proportional to thedistance from the mid-surface of the shell. The bilinearfour-node thin-shell elements used in the analysis have sixdegrees of freedom per node. Bilinear approximation of thedisplacements provides continuity of the displacementfunctions through the boundary of the element (see forexample, Zienkiewicz et al., 2005). Models were developedin the commercially available finite-element programMSC.MARC (www.mscsoftware.com). Models con-structed in the software program were denominated astype 139 as defined in the MSC.MARC element library andfollow a coordinate system as shown in each resultingfigure. Results from the simulations are presented in theform of von Mises stress for comparison with yield values.von Mises stress is an equivalent scalar representation ofthe calculated stress tensor that characterizes the strain

ARTICLE IN PRESSD.W. Fredriksson et al. / Ocean Engineering 34 (2007) 2124–2137 2129
energy of distortion per unit volume. It has been shown toadequately predict plastic flow and failure of structuralmaterials.
To model the HDPE pipes used as net pen structuralmembers, a simplified material model was used. Themodulus of elasticity of the material was assumed to beconstant as long as the material is within its elastic region(i.e. stress is not larger than the material yield limit). Theyield strain of a typical ductile polymer ranges from 5% to10% strain (where a metal yields less than 0.1% strain).Once the stress in the material passes the yield stress,plastic deformation begins to occur (where the material willno longer return to its original shape after the load isremoved). The material then follows a stress–strainrelationship similar to that shown by the dashed curve inFig. 6. The material will eventually fail or fracture as thestrain increases. Modeling the stress–strain characteristicsis possible but requires an extensive number of tests toresolve the plasticity of the material under various loadingrates. Instead, the simplified structural model, shown as thesolid curve in Fig. 6, was chosen to represent the HDPEbehavior. In this case, the critical point to determine failureis the yield stress s(y).
Thus, finite-element analysis of the HDPE pipe requiresthe following material parameters: modulus of elasticity�(E), Poisson’s ratio and yield stress. The modulus ofelasticity was determined from the series of tensile testsusing weathered HDPE samples as described in Section 2.1.Values for Poisson’s ratio were taken from manufacturers’standards as 0.42. A sensitivity study was performedchanging Poisson’s ratio value in a series of FEMsimulations and the results compared. It was found thatthe results did not vary significantly at the time steps usedin the model. This result was similar to that found bySuhey et al. (2005) in their numerical model study ofmembrane structures used for open ocean aquaculturecages. Yield stress was taken from the standard manufac-turer published value of 2.413� 107 Pa. In this study,weathered HDPE components are considered, but accord-ing to Ollick and Al-Amir (2003), weather does notsignificantly affect the yield stress of HDPE.
In the FEM procedure, localized failure criteria areapplied as follows. Loads acting on a set of closely spaced
Fig. 6. General characteristics of a viscoelastic material (dashed) and the
simplified model assumed for the numerical procedure (solid).
shell elements are slowly increased. When the yield stress ata certain element is reached, the model distributes the loadto the surrounding elements (effectively decreasing thestress at the time step). The load is increased and theprocedure is repeated until enough elements, consisting ofapproximately half the circumference of the pipe, reach theyield stress. At this point, it is assumed that the cross-section of the pipe fails, and the simulation is terminated.Using this simplified representation will have the effect ofover-predicting the material failure (conservative ap-proach) because the polymer will be ductile at this point,but may still have limited load-bearing capabilities,whereas the model will not. The predictions of criticalstresses, using this criterion, are dependent upon the finite-element mesh. In the analyses, multiple simulations wereconducted, each time decreasing the size of the elements,until a negligible stress difference occurred.
2.3. Circular ring experiments
To investigate the effectiveness of the FEM localizedfailure criteria and the applicability of the tensile tests, a setof experiments were conducted using circular rings ofHDPE pipe. Tests were first conducted in the laboratorywhere circular rings of HDPE pipe were deflected until theyield point. Then the laboratory tests were simulated usingthe FEM technique.
Fig. 7. (a) Test setup for the weathered circular ring experiments. (b) Each
sample was pulled until localized failure occurred.
ARTICLE IN PRESSD.W. Fredriksson et al. / Ocean Engineering 34 (2007) 2124–21372130
The laboratory experiment consisted of five individualpull tests performed on 3.66m diameter circular rings ofHDPE pipe (pipe diameter ¼ 88.9mm; pipe thick-ness ¼ 5.74mm) having the same exposure as the materialused in the tensile tests. The rings were fixed at two
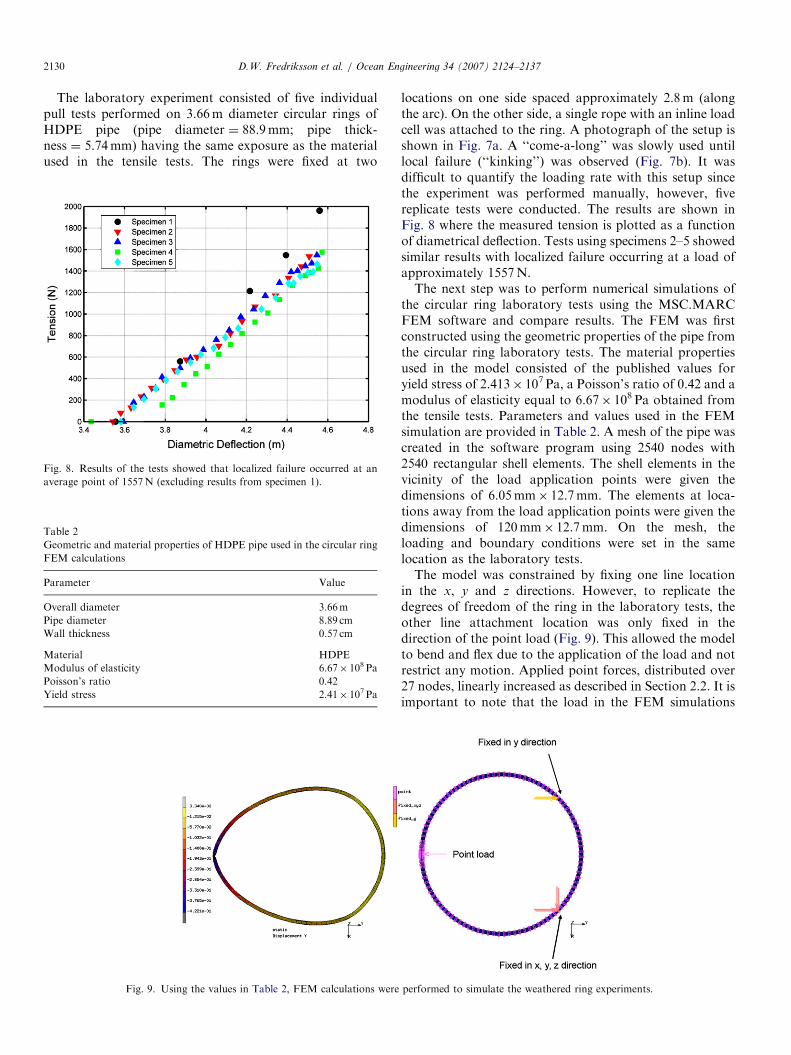
Fig. 8. Results of the tests showed that localized failure occurred at an
average point of 1557N (excluding results from specimen 1).
Table 2
Geometric and material properties of HDPE pipe used in the circular ring
FEM calculations
Parameter Value
Overall diameter 3.66m
Pipe diameter 8.89 cm
Wall thickness 0.57 cm
Material HDPE
Modulus of elasticity 6.67� 108 Pa
Poisson’s ratio 0.42
Yield stress 2.41� 107 Pa
Fig. 9. Using the values in Table 2, FEM calculations were
locations on one side spaced approximately 2.8m (alongthe arc). On the other side, a single rope with an inline loadcell was attached to the ring. A photograph of the setup isshown in Fig. 7a. A ‘‘come-a-long’’ was slowly used untillocal failure (‘‘kinking’’) was observed (Fig. 7b). It wasdifficult to quantify the loading rate with this setup sincethe experiment was performed manually, however, fivereplicate tests were conducted. The results are shown inFig. 8 where the measured tension is plotted as a functionof diametrical deflection. Tests using specimens 2–5 showedsimilar results with localized failure occurring at a load ofapproximately 1557N.The next step was to perform numerical simulations of
the circular ring laboratory tests using the MSC.MARCFEM software and compare results. The FEM was firstconstructed using the geometric properties of the pipe fromthe circular ring laboratory tests. The material propertiesused in the model consisted of the published values foryield stress of 2.413� 107 Pa, a Poisson’s ratio of 0.42 and amodulus of elasticity equal to 6.67� 108 Pa obtained fromthe tensile tests. Parameters and values used in the FEMsimulation are provided in Table 2. A mesh of the pipe wascreated in the software program using 2540 nodes with2540 rectangular shell elements. The shell elements in thevicinity of the load application points were given thedimensions of 6.05mm� 12.7mm. The elements at loca-tions away from the load application points were given thedimensions of 120mm� 12.7mm. On the mesh, theloading and boundary conditions were set in the samelocation as the laboratory tests.The model was constrained by fixing one line location
in the x, y and z directions. However, to replicate thedegrees of freedom of the ring in the laboratory tests, theother line attachment location was only fixed in thedirection of the point load (Fig. 9). This allowed the modelto bend and flex due to the application of the load and notrestrict any motion. Applied point forces, distributed over27 nodes, linearly increased as described in Section 2.2. It isimportant to note that the load in the FEM simulations
performed to simulate the weathered ring experiments.

ARTICLE IN PRESS
Fig. 10. A visual comparison between the localized buckling of the weathered ring from the laboratory experiment and the FEM approach.
Fig. 11. A plot showing the load versus the percentage of pipe circumference element failure. The figure also shows the progression of stress contours using
the localized failure technique.
D.W. Fredriksson et al. / Ocean Engineering 34 (2007) 2124–2137 2131
was applied quasi-statically so that the rate of loading wasaccounted for by the choice of material parameters only.
During the simulation, the rim deformed until the yieldstress criteria were met. The original and deformed modelsof the rim are shown in Fig. 9. The load at failure wascalculated to be 1877N, approximately 16% greater thanthe laboratory tests. Fig. 10 shows a visual comparison ofthe ‘‘kinking’’ observed from both the laboratory and thecomputer model tests.
Although in the study the failure criteria are setwhen 1/2 the pipe circumference elements yield, the failure
of a few elements can constitute concern. Fig. 11 showsthe total applied load on the rim versus the percent ofpipe circumference ‘‘failure.’’ Some residual stress existedat locations around the rim, but the highest levelswere at load application points. This plot shows theamount of rim failure as a function of load, at theload application point. It can be seen that once failureoccurs in 25% of the pipe, total collapse occurs shortlythereafter. From these results, a certain amount ofconfidence was obtained to further use this modelingapproach.
ARTICLE IN PRESSD.W. Fredriksson et al. / Ocean Engineering 34 (2007) 2124–21372132
3. Modeling of the net pen flotation structure
3.1. Boundary conditions and geometric and material
properties
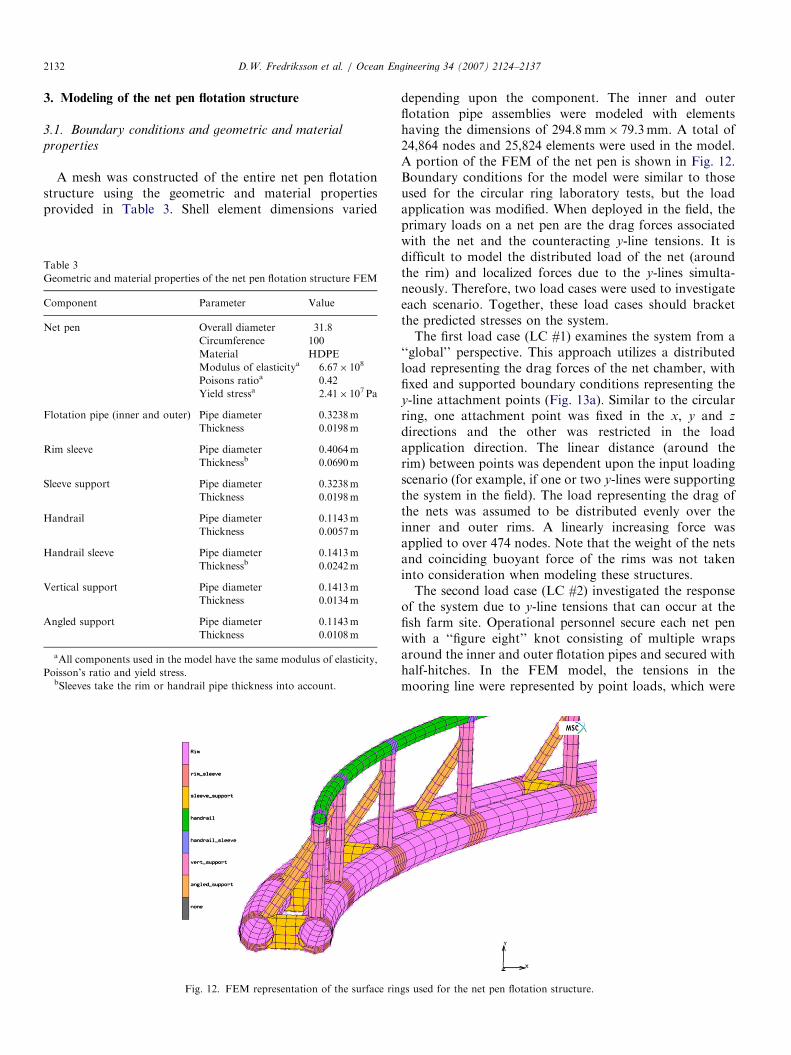
A mesh was constructed of the entire net pen flotationstructure using the geometric and material propertiesprovided in Table 3. Shell element dimensions varied
Table 3
Geometric and material properties of the net pen flotation structure FEM
Component Parameter Value
Net pen Overall diameter 31.8
Circumference 100
Material HDPE
Modulus of elasticitya 6.67� 108
Poisons ratioa 0.42
Yield stressa 2.41� 107 Pa
Flotation pipe (inner and outer) Pipe diameter 0.3238m
Thickness 0.0198m
Rim sleeve Pipe diameter 0.4064m
Thicknessb 0.0690m
Sleeve support Pipe diameter 0.3238m
Thickness 0.0198m
Handrail Pipe diameter 0.1143m
Thickness 0.0057m
Handrail sleeve Pipe diameter 0.1413m
Thicknessb 0.0242m
Vertical support Pipe diameter 0.1413m
Thickness 0.0134m
Angled support Pipe diameter 0.1143m
Thickness 0.0108m
aAll components used in the model have the same modulus of elasticity,
Poisson’s ratio and yield stress.bSleeves take the rim or handrail pipe thickness into account.
Fig. 12. FEM representation of the surface rin
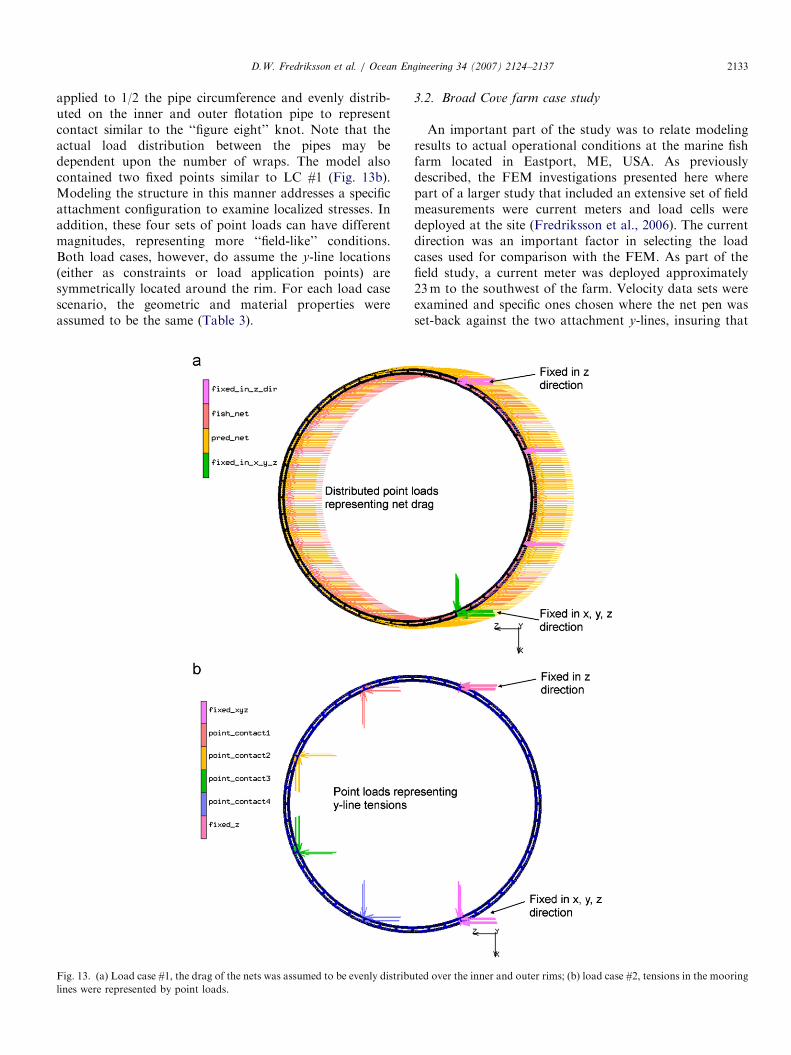
depending upon the component. The inner and outerflotation pipe assemblies were modeled with elementshaving the dimensions of 294.8mm� 79.3mm. A total of24,864 nodes and 25,824 elements were used in the model.A portion of the FEM of the net pen is shown in Fig. 12.Boundary conditions for the model were similar to thoseused for the circular ring laboratory tests, but the loadapplication was modified. When deployed in the field, theprimary loads on a net pen are the drag forces associatedwith the net and the counteracting y-line tensions. It isdifficult to model the distributed load of the net (aroundthe rim) and localized forces due to the y-lines simulta-neously. Therefore, two load cases were used to investigateeach scenario. Together, these load cases should bracketthe predicted stresses on the system.The first load case (LC #1) examines the system from a
‘‘global’’ perspective. This approach utilizes a distributedload representing the drag forces of the net chamber, withfixed and supported boundary conditions representing they-line attachment points (Fig. 13a). Similar to the circularring, one attachment point was fixed in the x, y and z
directions and the other was restricted in the loadapplication direction. The linear distance (around therim) between points was dependent upon the input loadingscenario (for example, if one or two y-lines were supportingthe system in the field). The load representing the drag ofthe nets was assumed to be distributed evenly over theinner and outer rims. A linearly increasing force wasapplied to over 474 nodes. Note that the weight of the netsand coinciding buoyant force of the rims was not takeninto consideration when modeling these structures.The second load case (LC #2) investigated the response
of the system due to y-line tensions that can occur at thefish farm site. Operational personnel secure each net penwith a ‘‘figure eight’’ knot consisting of multiple wrapsaround the inner and outer flotation pipes and secured withhalf-hitches. In the FEM model, the tensions in themooring line were represented by point loads, which were
gs used for the net pen flotation structure.
ARTICLE IN PRESSD.W. Fredriksson et al. / Ocean Engineering 34 (2007) 2124–2137 2133
applied to 1/2 the pipe circumference and evenly distrib-uted on the inner and outer flotation pipe to representcontact similar to the ‘‘figure eight’’ knot. Note that theactual load distribution between the pipes may bedependent upon the number of wraps. The model alsocontained two fixed points similar to LC #1 (Fig. 13b).Modeling the structure in this manner addresses a specificattachment configuration to examine localized stresses. Inaddition, these four sets of point loads can have differentmagnitudes, representing more ‘‘field-like’’ conditions.Both load cases, however, do assume the y-line locations(either as constraints or load application points) aresymmetrically located around the rim. For each load casescenario, the geometric and material properties wereassumed to be the same (Table 3).
Fig. 13. (a) Load case #1, the drag of the nets was assumed to be evenly distribu
lines were represented by point loads.
3.2. Broad Cove farm case study
An important part of the study was to relate modelingresults to actual operational conditions at the marine fishfarm located in Eastport, ME, USA. As previouslydescribed, the FEM investigations presented here wherepart of a larger study that included an extensive set of fieldmeasurements were current meters and load cells weredeployed at the site (Fredriksson et al., 2006). The currentdirection was an important factor in selecting the loadcases used for comparison with the FEM. As part of thefield study, a current meter was deployed approximately23m to the southwest of the farm. Velocity data sets wereexamined and specific ones chosen where the net pen wasset-back against the two attachment y-lines, insuring that
ted over the inner and outer rims; (b) load case #2, tensions in the mooring
ARTICLE IN PRESSD.W. Fredriksson et al. / Ocean Engineering 34 (2007) 2124–21372134
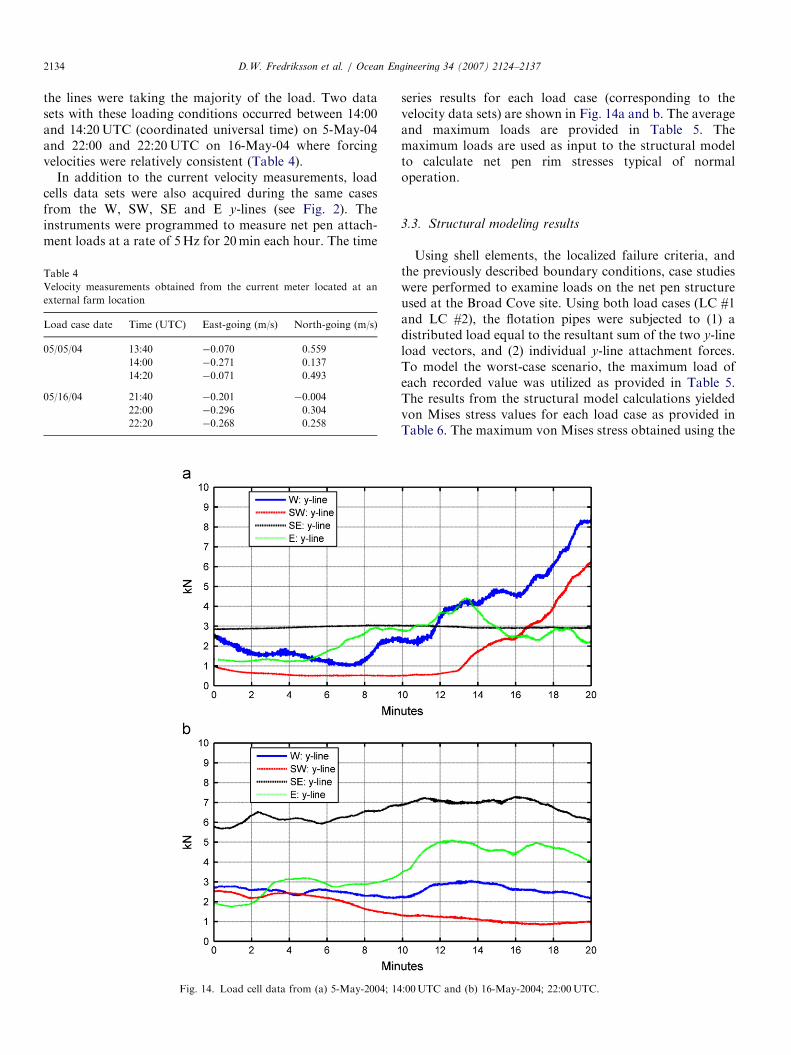
the lines were taking the majority of the load. Two datasets with these loading conditions occurred between 14:00and 14:20UTC (coordinated universal time) on 5-May-04and 22:00 and 22:20UTC on 16-May-04 where forcingvelocities were relatively consistent (Table 4).
In addition to the current velocity measurements, loadcells data sets were also acquired during the same casesfrom the W, SW, SE and E y-lines (see Fig. 2). Theinstruments were programmed to measure net pen attach-ment loads at a rate of 5Hz for 20min each hour. The time
Table 4
Velocity measurements obtained from the current meter located at an
external farm location
Load case date Time (UTC) East-going (m/s) North-going (m/s)
05/05/04 13:40 �0.070 0.559
14:00 �0.271 0.137
14:20 �0.071 0.493
05/16/04 21:40 �0.201 �0.004
22:00 �0.296 0.304
22:20 �0.268 0.258
Fig. 14. Load cell data from (a) 5-May-2004; 14
series results for each load case (corresponding to thevelocity data sets) are shown in Fig. 14a and b. The averageand maximum loads are provided in Table 5. Themaximum loads are used as input to the structural modelto calculate net pen rim stresses typical of normaloperation.
3.3. Structural modeling results
Using shell elements, the localized failure criteria, andthe previously described boundary conditions, case studieswere performed to examine loads on the net pen structureused at the Broad Cove site. Using both load cases (LC #1and LC #2), the flotation pipes were subjected to (1) adistributed load equal to the resultant sum of the two y-lineload vectors, and (2) individual y-line attachment forces.To model the worst-case scenario, the maximum load ofeach recorded value was utilized as provided in Table 5.The results from the structural model calculations yieldedvon Mises stress values for each load case as provided inTable 6. The maximum von Mises stress obtained using the
:00UTC and (b) 16-May-2004; 22:00UTC.
ARTICLE IN PRESSD.W. Fredriksson et al. / Ocean Engineering 34 (2007) 2124–2137 2135
structural model was 4.23� 106 Pa, which is more than fivetimes smaller than the 2.41� 107 Pa yield value for HDPE.This result may seem obvious since during normaloperation, the net pen rims rarely fail. However, themodeling technique now allows the operational limits to bequantified.
3.4. Estimated maximum load
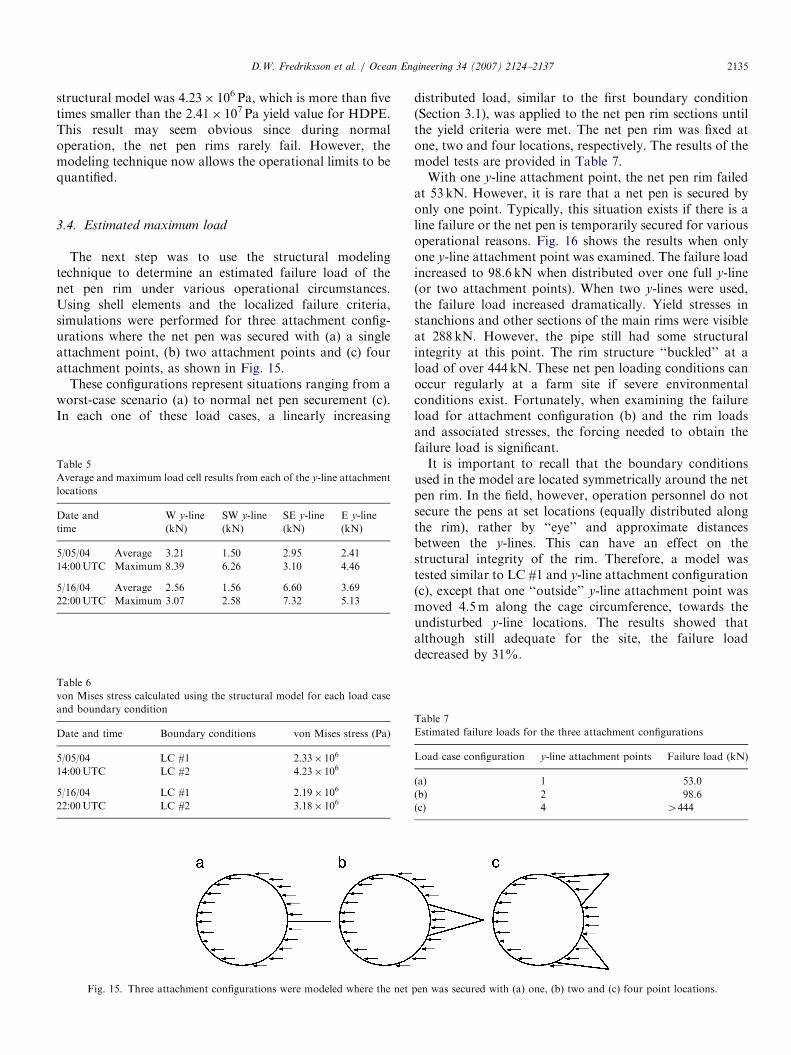
The next step was to use the structural modelingtechnique to determine an estimated failure load of thenet pen rim under various operational circumstances.Using shell elements and the localized failure criteria,simulations were performed for three attachment config-urations where the net pen was secured with (a) a singleattachment point, (b) two attachment points and (c) fourattachment points, as shown in Fig. 15.
These configurations represent situations ranging from aworst-case scenario (a) to normal net pen securement (c).In each one of these load cases, a linearly increasing
Table 5
Average and maximum load cell results from each of the y-line attachment
locations
Date and
time
W y-line
(kN)
SW y-line
(kN)
SE y-line
(kN)
E y-line
(kN)
5/05/04 Average 3.21 1.50 2.95 2.41
14:00UTC Maximum 8.39 6.26 3.10 4.46
5/16/04 Average 2.56 1.56 6.60 3.69
22:00UTC Maximum 3.07 2.58 7.32 5.13
Table 6
von Mises stress calculated using the structural model for each load case
and boundary condition
Date and time Boundary conditions von Mises stress (Pa)
5/05/04 LC #1 2.33� 106
14:00UTC LC #2 4.23� 106
5/16/04 LC #1 2.19� 106
22:00UTC LC #2 3.18� 106
Fig. 15. Three attachment configurations were modeled where the net
distributed load, similar to the first boundary condition(Section 3.1), was applied to the net pen rim sections untilthe yield criteria were met. The net pen rim was fixed atone, two and four locations, respectively. The results of themodel tests are provided in Table 7.With one y-line attachment point, the net pen rim failed
at 53 kN. However, it is rare that a net pen is secured byonly one point. Typically, this situation exists if there is aline failure or the net pen is temporarily secured for variousoperational reasons. Fig. 16 shows the results when onlyone y-line attachment point was examined. The failure loadincreased to 98.6 kN when distributed over one full y-line(or two attachment points). When two y-lines were used,the failure load increased dramatically. Yield stresses instanchions and other sections of the main rims were visibleat 288 kN. However, the pipe still had some structuralintegrity at this point. The rim structure ‘‘buckled’’ at aload of over 444 kN. These net pen loading conditions canoccur regularly at a farm site if severe environmentalconditions exist. Fortunately, when examining the failureload for attachment configuration (b) and the rim loadsand associated stresses, the forcing needed to obtain thefailure load is significant.It is important to recall that the boundary conditions
used in the model are located symmetrically around the netpen rim. In the field, however, operation personnel do notsecure the pens at set locations (equally distributed alongthe rim), rather by ‘‘eye’’ and approximate distancesbetween the y-lines. This can have an effect on thestructural integrity of the rim. Therefore, a model wastested similar to LC #1 and y-line attachment configuration(c), except that one ‘‘outside’’ y-line attachment point wasmoved 4.5m along the cage circumference, towards theundisturbed y-line locations. The results showed thatalthough still adequate for the site, the failure loaddecreased by 31%.
pen was secured with (a) one, (b) two and (c) four point locations.
Table 7
Estimated failure loads for the three attachment configurations
Load case configuration y-line attachment points Failure load (kN)
(a) 1 53.0
(b) 2 98.6
(c) 4 4444

ARTICLE IN PRESS
Fig. 16. The von Mises stress distribution on the net pen rim when 53 kN is applied as a single point load.
D.W. Fredriksson et al. / Ocean Engineering 34 (2007) 2124–21372136
4. Conclusion
The technique to structurally model HDPE pipe used infish farm net pens shows promise as an effective tool forspecifying these components. As with many modelingapplications, however, these results must be consideredapproximate. For example, the value of 6.67� 108 Pa usedfor the modulus of elasticity may have been underestimatedand should be further investigated by performing addi-tional tensile tests with a larger number of samples. Inaddition, the failure criteria are subjective and theboundary conditions simplified. The question also remainsas to the appropriate loading rate, which affects themodulus of elasticity for viscoelastic materials.
Quantifying the load rate in environments with wavesand currents may not be trivial. This will become moreimportant if these structures are considered for moreexposed or open ocean environments. For example, tidalcurrents are often considered to be quasi-static, sinceforcing periods are on the order of hours. In thiscondition, slower loading rates may be considered. Inconditions where intense waves exist, forcing periods areon the order of seconds, so a faster load rate may beappropriate. At many open ocean sites, both waves andcurrents provide dominant forcing components, so acombination may also need to be considered. It is clearthat since the structural integrity of HDPE pipe is relatedto the loading rate, future work should be conducted tooptimize the approach.
Nevertheless, this present study shows (through normaloperation) that the HDPE pipe used for this near-shorefish farming application is appropriate. The structural
modeling techniques developed, however, enables theevaluation of acceptability margins. In the Broad Covecase, the estimated operational von Mises stress valueswere more than five times less than the yield stress. Forthe maximum load condition, it was necessary to considerthe attachment configuration, where the worst-casesituation would occur as a point load. Utilizing two setsof y-lines (four attachment locations) minimizes thechance of this occurring. Using the developed techniques,additional studies can be conducted to optimize net pendesigns and attachments (other than the ‘‘figure eight’’knot) for specific environments, especially if similartechnologies are considered for more exposed, open oceanconditions.
Acknowledgments
The authors acknowledge the operational and manage-ment staff at the Heritage Salmon site in BroadCove located in Eastport, ME, USA. The authors alsoacknowledge Professors Todd Gross, Barbaros Celikkol,Rob Swift and Ken Baldwin of University of NewHampshire for their advice and support. Additionalthanks go to Jim Irish, Glenn McGillicuddy andChad Turmelle for technical assistance (also at theUniversity of New Hampshire). Discussions with Profes-sors Mayer and Hudson (United States Naval Academy)were valuable. Funding for this project was obtainedthrough the National Oceanic and Atmospheric Adminis-tration, Saltonstall–Kennedy program under GrantNAO3NMF4270183.

ARTICLE IN PRESSD.W. Fredriksson et al. / Ocean Engineering 34 (2007) 2124–2137 2137
References
Dudley, R.W., Panchang, V.J., Newell, C.R., 2000. Application of a
comprehensive modeling strategy for the management of net-pen
aquaculture waste transport. Aquaculture 187 (3), 319–340.
Fredriksson, D.W., DeCew, J.C., Irish, J.D., 2006. A field study to
understand the currents and loads of a near shore fish farm. In:
Proceedings of the Oceans 2006 MTS/IEEE Conference, Boston, MA,
September 19, 2006.
Fredriksson, D.W., DeCew, J.C., Tsukrov, I., Swift, M.R., Irish, J.D.,
2007. Development of large fish farm numerical modeling techniques
with in-situ mooring tension comparisons. Aquacultural Engineering
36, 137–148.
Ollick, A.M., Al-Amir, A.M., 2003. Weathering effects on mechanical
properties of low and high density polyethylene pipes used in irrigation
networks. Alexandria Engineering Journal 42 (6), 659–667.
Suhey, J.D., Kim, N.H., Niezrecki, C., 2005. Numerical modeling and
design of inflatable structures—application to open ocean aquaculture
cages. Aquacultural Engineering 33 (4), 285–303.
Tsukrov, I., Eroshkin, O., Fredriksson, D.W., Swift, M.R., Celikkol, B.,
2003. Finite element modeling of net panels using consistent net
element. Ocean Engineering 30, 251–270.
Tsukrov, I., Eroshkin, O., Paul, W., Celikkol, B., 2005. Numerical
modeling of nonlinear elastic components of mooring systems. Special
issue on open ocean aquaculture engineering. IEEE Journal of Oceanic
Engineering 30 (1), 37–46.
Vikestad, K., Lien, E., 2005. Bending stiffness of a clamps-connected
2-rings PE fish cage collar. In: Proceedings of the 12th International
Congress of the International Maritime Association of the Mediterra-
nean (IMAM 2005), vol. 2, Lisboa, Portugal, pp. 1293–1299.
Zienkiewicz, O.C., Taylor, R.L., Zhu, J.Z., 2005. The Finite Element
Method: Its Basis and Fundamentals. Elsevier Butterworth-Heinemann.