FRBNY Blackbook RESEARCH AND STATISTICS GROUP · FRBNY: Blackbook, May 4, 2006 Confidential(FR)...
73
CONFIDENTIAL(FR) Class II FOMC FRBNY Blackbook RESEARCH AND STATISTICS GROUP FOMC Background Material May 2006 FRBNY - cleared for release
Transcript of FRBNY Blackbook RESEARCH AND STATISTICS GROUP · FRBNY: Blackbook, May 4, 2006 Confidential(FR)...

CONFIDENTIAL(FR) Class II FOMC
FRBNY Blackbook
RESEARCH AND STATISTICS GROUP
FOMC Background Material
May 2006
FRBNY - cleared for release

FRBNY: Blackbook, May 4, 2006 Confidential(FR) Class II FOMC 2
CONTENTS
1. Overview 3
2. Recent Developments 5
i. U.S. 5
ii. Global 8
iii. Trade 10
iv. Financial 11
a. Domestic markets 11
b. Monetary Policy and Global Bond Markets 13
c. Oil Market Developments 15
v. Second District 16
3. Outlook 18
i. FRBNY’s Central Forecast 18
ii. Comparison with Greenbook Forecasts 19
iii. FRBNY Alternative Scenarios and Risks 23
Special Topic I: Free Lunch 29
4. Policy Alternatives 30
Special Topic II: Case for Pausing at 5% 34
Special Topic III: Case for Inflation Vigilance 36
ExhibitsA. Forecast Details 37
B. Financial Markets 49
C. FRBNY Forecast Distributions 60
D. FRBNY Fed Funds Rate Projections 63
E. Regional Charts 71
FRBNY BLACKBOOK
May 2006
FRBNY - cleared for release

FRBNY: Blackbook, May 4, 2006 Confidential(FR) Class II FOMC 3
1. Overview
Our outlook has real GDP growing around its potential rate in both 2006 and 2007. Core
PCE inflation is expected to be around 2% over the same period, but with a slight hump
in overall inflation in the near term. We have kept the path of the FFR target implicit in
our near-term forecast at 5% and removed the small cut in the FFR target in 2007. This
is roughly equivalent to the path currently priced into financial markets.
There is little difference between our central forecast and the Board’s Greenbook
forecast, and our assessment of the appropriate path for policy would be unchanged if we
were to base it on the Greenbook forecast. While there are slight differences in the
profiles for productivity growth, compensation, and unit labor cost growth over the
forecast horizon, the profiles for core PCE inflation correspond quite closely. We expect
employment to grow near its trend, the unemployment rate to level off at 4.7%, and the
labor force participation rate to remain near 66%. The behavior of the labor market in the
Greenbook differs fairly markedly from ours in 2007: the unemployment rate is
substantially higher, with the labor force participation rate and payrolls being
substantially lower. While these differences seem unlikely to have a material effect on
the current policy decision, they do seem to reflect some differences across our two staffs
in the assessment of certain underlying features of the economic landscape.
Though our central forecast has core inflation returning in 2007 to a level within the
range viewed as consistent with long-term price stability, we see the preponderance of
risks as residing on the upside. Furthermore, we believe these risks embed the possibility
that further rises in inflation at or near the top of the implicit range are more costly than
similar increases near the implicit target. Under our assessment of the risks, a more
hawkish (defined in the Policy Alternatives section below) policymaker would want to
follow a path higher than the one embedded in our central forecast. It appears that
financial markets currently place at least some weight on this more hawkish view of
future policy.
FRBNY - cleared for release

FRBNY: Blackbook, May 4, 2006 Confidential(FR) Class II FOMC 4
We see the risks for near-term real growth as being roughly balanced, with the risks on
both sides having increased since March. On the upside, business investment is stronger
than expected, world growth continues to improve, and recent exchange rate depreciation
may help improve the external balance. On the downside, there are the recent large
increases in energy prices and increases in global long-term interest rates, both of which
could diminish real household spending. Financial conditions have changed in such a
way as to indicate a reduced threat of a yield curve inversion, though it is difficult at this
juncture to parse the increases in longer-term forward rates into changes in risks versus
changes in expected return. In addition, the sustainability of both the federal budget and
current account deficits are ongoing concerns.
Relative to the situation the committee faced a year ago, it is fair to say that the
appropriate near-term path of policy is more contingent—in both directions—on the
aspects of the economic environment about which we are least certain. One way to see
this is to note that in late 2004 and early 2005, it is unlikely that even a 50 to 75 basis
point increase in the committee’s assessment of the neutral FFR rate would have changed
the upcoming policy move, and possibly not even the move following that. A similar
statement can be made regarding the committee’s assessment of underlying trend
productivity growth, potential output growth, and even moves in medium and long-
horizon inflation expectations. At this juncture, though, it is precisely these factors that
matter the most in determining the appropriate course for monetary policy.
One implication of the committee reaching a point where fundamental factors such as the
neutral rate or the trend productivity growth rate matter more for policy is that incoming
data will necessarily help them learn more about these factors than might have been the
case a year or year and a half ago. Moreover, what they learn will have a more significant
effect on their assessment of the appropriate course for monetary policy over the very
near term. In contrast, the FOMC has had little occasion up to this point in the
tightening cycle to witness a sufficiently large deviation from its current projections for
output and inflation to cause them to depart from the near-term guidance they had
provided. This is not to say that the committee did not need to update frequently the
FRBNY - cleared for release

FRBNY: Blackbook, May 4, 2006 Confidential(FR) Class II FOMC 5
markets expectations for policy—there were often times when the committee reassessed
the medium-term outlook in such as way as to lead them to alter the trajectory of
expectations for future policy with their statement or inter-meeting speeches. It is only to
say that these updates rarely had implications for the next policy move. To illustrate, this
can help explain that although the expected May 2006 FF rate in August 2005 was nearly
100 basis points below the probable rate for May 2006, financial markets were still not
surprised by any given decision regarding the FF target rate.
The message from this discussion is two-fold. First, it now seems less likely that the
committee can keep steadily increasing rates as before, with the consequence that
markets may need to expect greater (and possibly less uniformly sized) gaps between
policy moves going forward. Second, in the event that incoming data departs sufficiently
from the committee’s central forecast, the moves may need to be larger than the 25 basis
point increments that have prevailed during the current tightening cycle.
The policy decisions now being contemplated are a function of the economic landscape
confronting the committee, just as the decisions made in 2003 were a function of that
landscape. In the same way, the committee’s communication should be designed to
prepare markets for what are likely to be unavoidable changes in the behavior of policy,
just as the communication strategy chosen in 2003 reflected the changes necessary at that
time. Most importantly, current communications should not attempt to mimic all of the
techniques used to communicate effectively in that period.
2. Recent Developments
U.S.
Summary. Measures of underlying inflation have risen a bit recently, thus indicating
greater near-term upside risk to implicit targets. Real GDP growth and productivity
growth rebounded in 2006Q1. The early data for 2006Q2 point to some moderation in
real activity toward its potential growth rate. The labor market continued to be firm with
FRBNY - cleared for release

FRBNY: Blackbook, May 4, 2006 Confidential(FR) Class II FOMC 6
robust payroll growth, declining unemployment, and a rising employment-population
ratio. Consumer and business survey measures generally remained at levels consistent
with solid growth; however, some measures slipped in late April, likely reflecting
concerns about recent energy price rises.
Inflation. Core inflation measures remain somewhat elevated compared to desired levels,
with readings in April raising some concerns [see Exhibit A-6]. The (annualized)
monthly change in the core PCE deflator increased from 1.6% in February to 3.9% in
March. While the core PCE deflator is up 2.0% on a 12-month change basis, it is up 2.4%
(annual rate) and 2.5% (annual rate) over the 6- and 3-month horizons respectively. As
with the PCE deflator, there was a dramatic increase in the monthly change in core CPI
from 1.8% (annual rate) in February to 4.2% (annual rate) in March. The pattern of the
core CPI over various horizons was also similar to that of the PCE deflator, with 12-, 6-,
and 3-month changes (at annual rates) of 2.1%, 2.7%, and 2.8%, respectively.
Overall inflation rates remain elevated, with energy prices being a key factor. The total
PCE deflator and the total CPI rose 4.5% and 4.2% (annual rates), respectively, in March.
Our underlying inflation gauge (UIG), however, has only shown a slight rise at the short
(2-year) horizon [see Exhibit A-7]. Some alternative measures of “core” inflation have
turned up recently [see Exhibit A-8], but all are now above the upper end of the
acceptable range. Medium- and long-term inflation expectations from TIPS increased,
with a fairly pronounced rise at the 2-year horizon. Household survey expectations of
inflation, which had been steady recently, rose in late April. The median expected one-
year-ahead rate climbed to 3.3% in April from 3.0% in March, while the expected 5-year-
ahead rate rose from 2.9% to 3.1% over the same period.
Real activity. Real GDP growth in 2006Q1 was 4.8% (annual rate), a rebound from the
slow growth in 2005Q4, and consistent with our outlook. With the rebound in output
growth, productivity growth also bounced back in the quarter. The recent monthly real
FRBNY - cleared for release

FRBNY: Blackbook, May 4, 2006 Confidential(FR) Class II FOMC 7
activity indicators and the extremely limited data for the current quarter suggest that real
growth in 2006Q2 (and the rest of 2006) should be near its potential growth rate.
Real personal consumption expenditures (PCE) were strong in 2006Q1. Personal income
growth was robust in March, which should support PCE growth in coming months, but
the recent rises in energy prices could mitigate this effect. The early data for 2006Q2
appear consistent with moderate growth over the near term: auto sales for April were
about equal to their level of the previous two months and preliminary MasterCard data
indicate moderate growth in retail sales excluding autos for April.
The recent housing indicators were generally consistent with a moderate slowdown in the
market. Housing starts dropped sharply in March in a payback from January and
February; nevertheless, housing completions rose. Existing home sales increased slightly
in March, while new home sales rose more strongly. Their levels, however, are below
the peaks from last summer. Mortgage purchase applications in April remained near the
lower levels (comparable to early 2004) of the previous two months. Although the new
home inventories-sales ratio fell in March, it remains elevated compared to its levels over
the past decade. Housing prices displayed some further moderation.
Business investment spending was robust in 2006Q1, as it rebounded from a weak
2005Q4. Growth in equipment spending returned to near the levels that have prevailed
over the past three years. The near-term momentum appears strong as capital goods
orders increased in March. Nonresidential construction displayed greater vigor than it
has in recent years, even though it was flat in March. Businesses remain cautious in their
inventory behavior as inventories-sales ratios remain low. Even so, manufacturing
production was robust in 2006Q1 and the capacity utilization rate again exceeded 80% in
March, the fourth consecutive month it has done so. Production growth in the IT sector
was strong, consistent with the growth in our Tech Pulse index.
FRBNY - cleared for release

FRBNY: Blackbook, May 4, 2006 Confidential(FR) Class II FOMC 8
Labor market. The labor market continued to be firm. Payroll growth remained strong
through March. The growth in aggregate hours in 2006Q1 was about 3% (annual rate),
near the prevailing range over the past two years. The unemployment rate fell to 4.7% in
March, equal to its low in the current cycle. The labor force participation rate has
changed little over recent months, but the employment population ratio has risen slowly
to its highest level since 2002. Measures of labor compensation continue to give
somewhat conflicting signals. Growth in average hourly earnings has increased over
recent months, but that of the employment cost index has remained flat. The growth of
compensation per hour rebounded somewhat in 2006Q1, but its four-quarter change
remained rather subdued. The four-quarter change in unit labor costs also changed little
and do not indicate a substantial increase in labor cost pressures.
Surveys. Readings during March and into early April had suggested consumers were
fairly upbeat. Recently, however, there appears to have been a change in consumers’
spirits. Readings in late April revealed a decline in both the current and future
expectations components. One explanation for the change is that the continued rise on gas
prices may have finally impacted on sentiment. Business surveys suggest that US
manufacturing remains on a reasonably firm growth path. The ISM manufacturing and
non-manufacturing indices as well as the Philadelphia Fed index increased in April.
Several other surveys, however, showed a modest pullback in April including the Empire
State Index, the Chicago ISM index as well as purchasers’ surveys in Milwaukee and
Cincinnati. In addition, a look at the prices paid index associated with these surveys has
generally indicated some intensification in price pressures.
Global
Global growth is projected to slow to 3.0 percent (Q4/Q4) in 2006, down from 3.4
percent in 2005. The forecast has Asian growth moderating to a more sustainable pace
after growing quite strongly in 2005. Growth rates in the euro area, the United Kingdom
and Brazil are expected to increase relative to last year. The forecast is essentially
FRBNY - cleared for release

FRBNY: Blackbook, May 4, 2006 Confidential(FR) Class II FOMC 9
unchanged since the last FOMC, with the exception of an upward revision to the outlook
for Mexico based on recent data.
Industrial Countries. Data for the euro area are coming in a bit stronger than expected,
causing a slight upward revision to the 2006 growth forecast. Industrial production and
orders were both robust in February, while exports were up 13 percent over the year. The
industrial confidence index rose again in April to well above the previous peak in mid-
2003. It is, though, still significantly below its 1999-2000 highs, when the economy was
growing at a 4 percent pace. Credit growth was up 10.8 percent over the year in March,
with strong demand for both mortgages and commercial loans. The forecast is for euro
area growth to accelerate to 2.2 percent (Q4/Q4) in 2006 from 1.8 percent last year. The
region’s economy is expected to slow modestly in the second half of the year in response
to tighter monetary policy in the euro area and other major economies.
The Japanese economy appears to have eased to a more sustainable pace after a surge in
output at the end of 2005. While industrial production was soft in March, it has been
steadily expanding since July 2005 and is 3.1 percent above its level of a year ago. The
labor market is also improving, with employment up 0.8 percent over the year in March
and the unemployment rate at its lowest level since 1998. CPI inflation is making a
gradual comeback, with prices up 0.5 percent over the year to March, making that the
fifth consecutive month of increasing prices. The economy is projected to expand at just
above its potential rate, which would represent a substantial slowdown from last year’s
impressive performance.
The Canadian economy should continue to grow near 3.0 percent for the rest of the year
as the economy benefits, on net, from higher commodity prices. Private consumption in
the U.K. remains subdued, but output growth is nevertheless approaching trend growth.
Emerging Economies. Asian data suggest a continuation of recent trends, with robust
growth in China and solid growth in the rest of Emerging Asia. Chinese GDP grew 10.2
percent over the year in Q1, close to forecast. The trade surplus for Q1 totaled $24
FRBNY - cleared for release

FRBNY: Blackbook, May 4, 2006 Confidential(FR) Class II FOMC 10
billion, up 40 percent from a year earlier. New lending growth has been quite rapid while
capital expenditure is running ahead of last year’s pace. The authorities have responded
to these developments by launching a new campaign against over-investment, including
new sector-specific controls and a surprise 27 basis point hike in the loan rate. In Q1,
Korea recorded a fourth consecutive quarter of annualized growth exceeding 5 percent.
Elsewhere in the region, strong production and export data suggest that growth continues
at a healthy pace.
Domestic demand in the major Latin American countries is growing robustly and external
conditions remain favorable. In Mexico, activity is growing at a much stronger pace
than had been expected, with growth in the first half of 2006 expected to be the strongest
in several years. Brazilian growth appears to have accelerated in 2006Q1 and the
outlook is supported by rising real income and consumer confidence, lower interest rates
and strong credit growth. In Argentina, activity is moderating more gradually than
originally anticipated. The monthly indicator of economic activity was up 9.5 percent
over the year in February.
Trade
The U.S. trade deficit narrowed to $65.7 billion in February from its record $68.6 billion
in January. The February decline in imports, reflecting a fall in purchases of computers,
autos and other consumer goods, should be seen as a payback for January’s high growth
rather than as a sign of a fundamental easing in the demand for foreign goods and
services. February’s $1.1 billion decline in exports was broad based, including all major
categories except aircraft.
In the initial GDP release, the drag from net exports on 2006Q1 growth was estimated at
a larger-than-expected 0.8 percentage point. The BEA estimate assumes a March surge
in imports. For 2006 as a whole, the forecast is for net exports to take 0.5 percentage
point off GDP growth (Q4/Q4). This is essentially unchanged since the last Blackbook,
with less drag assumed in Q2 to make up for the larger-than-expected drag in Q1.
FRBNY - cleared for release

FRBNY: Blackbook, May 4, 2006 Confidential(FR) Class II FOMC 11
The current account deficit is projected to be almost $1.0 trillion in 2006, or just under 8
percent of nominal GDP. Higher current and expected oil prices account for most of the
increase in the projected deficit relative to the last FOMC outlook.
Financial
Domestic markets
Over the inter-meeting period, short-term and longer-term inflation expectations
increased moderately. Zero-to-two year implied inflation (carry-adjusted) rose 31 basis
points from 2.58% to 2.89%, while the corresponding five-to-ten year inflation
expectations increased 23 basis points to 2.74% [Exhibit B-1].
The yield curve has steepened during the inter-meeting period [Exhibit B-3]. The closely
watched 10-year to 3-month spread increased from 8 basis points to 34 basis points: the
3-month yield is currently 4.81% and the 10-year yield is 5.14%. During the same period,
the nominal 4-to-5 year forward rate increased 45 basis points from 4.64% to 5.09%. This
change reflects a 23 basis point rise in the real 4-to-5 year forward rate (from 2.23% to
2.56%) combined with a similar sized increase in 4-to-5 year inflation compensation.
Fed Funds rate expectations for the May meeting, based on Fed Funds futures prices,
indicate virtual certainty (greater than 99% probability) of a 25 basis point increase to
5.00%. Similarly, current expectations inferred from Fed Funds options prices point to a
less than 1% chance of rates remaining at 4.75% at the May meeting. There has been a
generally steady rise in expectations of a rate increase over the inter-meeting period.
Views about the probability of a further rate increase to 5.25% at the June meeting have
fluctuated significantly over the inter-meeting period with a low of 24% and a high of
68%. As of May 3, market participants assign a probability of 47% to a pause (rates
remain at 5.00% in June) versus a probability of 50% of a 25 basis point increase.
Interestingly, market expectations have been especially sensitive to “Fed talk.” The
FRBNY - cleared for release

FRBNY: Blackbook, May 4, 2006 Confidential(FR) Class II FOMC 12
FOMC minutes release (4/18) and the Chairman’s testimony to the Joint Economic
Committee (4/27) increased expectations of a pause in rate hikes at the June meeting. In
contrast, expectations about the probability of a move to 5.25% have generally increased
in response to economic releases indicating higher inflation or stronger growth such as
the CPI (4/19), consumer confidence (4/25), new home Sales (4/26), and ISM
manufacturing index (5/1).
The expected Fed Funds rate path has also adjusted to incorporate expectations of a
possible lengthy pause in rate increases. In particular, the current Fed Funds curve is
fairly flat from September 2006 (implied rate of 5.17%) to February 2007 (implied rate of
5.15%). The Fed Funds rate is expected to decline to 4.95% in May 2008. Since March
27th, the expected rate in September 2006 is up 20 basis points, and the August 2008
expected rate is up 33 basis points [Exhibit B-4].
Corporate credit spreads over Treasuries widened in the inter-meeting period with BBB,
BB, and B spreads rising by 31, 18, and 2 basis points respectively. Over the same
period, equity market performance was mixed with the S&P500 index up 0.48%, and the
NASDAQ down 0.50%. Equity market volatility remains at relatively low levels;
S&P500 implied volatility is 11.99%, while NASDAQ implied volatility is 15.79%.
Since the March meeting, implied interest rate skewness has moved from -1.6 to -0.9
[Exhibit B-5], indicating heightened concern about an unexpected policy rate increase.
This is consistent with higher expectations of a rate pause. Despite changing views about
the likelihood of a rate pause versus a rate increase in June, interest rate implied volatility
remains at low levels and has only increased slightly over the inter-meeting period. The 6
month LIBOR confidence interval is 102 basis points, an increase of only 13 basis points
since March 27 [Exhibit B-6]. Implied 10-year interest rate volatility rose from 4.28% to
4.41%, while 30-year Treasury volatility declined from 6.84% to 7.18%.
FRBNY - cleared for release

FRBNY: Blackbook, May 4, 2006 Confidential(FR) Class II FOMC 13
Monetary Policy and Global Bond Markets
As the global expansion appears on solid footing, financial developments during the
inter-meeting period were shaped by tightening monetary conditions in the main
economic areas. The United States’ more advanced position on the tightening cycle
relative to its partners, however, caused renewed downward pressure on the dollar, after a
relative tranquil period.
In the euro area, encouraging data on growth and heightened inflation risks tied to higher
energy prices are sustaining a gradual rise in policy rates. The ECB is expected to raise
its policy rate once in early June, and at least once more by year-end. Similarly in Japan,
where the central bank has been draining banks’ excess reserves after the end of
quantitative easing to clear the way for higher overnight rates. The first rate hike is
expected near the end of the summer, with a second increase expected by year-end.
A drift towards tighter monetary conditions is also apparent in the rest of the industrial
world. The Bank of Canada again raised its policy rate at end-April, although it hinted to
an incipient end of its tightening cycle. Policy rates have also been raised in Australia in
May, in Switzerland in March, and in Sweden twice since the beginning of the year.
After putting on hold its easing cycle last fall, the Bank of England now has become
concerned with slowly-building expectations of inflation.
In the emerging world, the key monetary event was the People’s Bank of China late April
surprise increase of 27 basis points to 5.85 percent in its official loan rate. This increase
was aimed at slowing the neck-breaking pace of Chinese domestic investment. Monetary
policy also remains on a tightening path in the rest of Emerging Asia, although the pace
of rate hikes is likely to remain contained. At the same time, regional central banks
continue to build up their stocks of foreign reserves. The pace of reserve purchases
appears to have increased after the recent G7 statement, which urged more flexibility in
China’s exchange rate and ignited pressure towards Asian currencies’ appreciation.
FRBNY - cleared for release

FRBNY: Blackbook, May 4, 2006 Confidential(FR) Class II FOMC 14
In Latin America, Mexico’s easing cycle appears about complete after the late-April rate
cut, while the pace of easing is slowing in Brazil. Argentina's monetary policy remains
accommodative, although it has tightened somewhat in recent months.
Supported by tighter policy conditions, debt yields have risen worldwide since the last
FOMC meeting, leading to broadly steeper yield curves. In Japan and in the euro area,
long rates have risen by around twenty basis points more than short rates, driven by
higher expected real rates. Indeed, break-even rates from inflation-indexed bonds in the
main issuing countries were generally stable over the period.
Equity Markets
Continuing strong corporate profit growth offset higher interest rates in Europe, lifting
major equity indices. From March 27 to May 2, the DJ Stoxx and FTSE-100 indices rose
1.6 and 2.5 percent respectively. In Japan, equity prices reached new multi-year highs in
early April, reflecting both strong buying at the start of the new fiscal year and continued
confidence about corporate prospects. These gains, however, were largely lost following
a sharp appreciation of the yen after the G7 meeting on April 21st, which heightened
investors’ concern with exporting firms’ earnings. For the period as a whole, both the
TOPIX and the Nikkei rose 2.7 percent. Elsewhere, the Brazilian Bovespa and the
Mexican Bolsa posted gains of about 10 percent, with commodity-related companies
attracting special interest. Equity indices were buoyant throughout the rest of emerging
markets.
Exchange Rates and Capital Flows
With the U.S. monetary tightening cycle apparently approaching its end, investors’ focus
is shifting toward global structural imbalances, thus fostering a resurgence of dollar
weakness.
FRBNY - cleared for release

FRBNY: Blackbook, May 4, 2006 Confidential(FR) Class II FOMC 15
The yen and the euro gained substantially on the dollar since the last FOMC meeting.
The yen strengthened from ¥117 to ¥113 per dollar, with acute investor interest after a
statement by the G7 in April called for greater flexibility in China’s exchange rate.
Meanwhile, the euro strengthened from $1.20 to $1.26 per euro. Emerging Asian
currencies (except China’s) also appreciated against the dollar over the inter-meeting
period. In response to this pressure, Emerging Asia’s central banks appear to have
stepped up their effort to check the pace of currency appreciation by intervening in the
foreign exchange market. Elsewhere, Brazil’s real appreciated 8 percent during the inter-
meeting period, supported by strong balance of payments data and favorable interest rate
differentials, while the currencies of commodity-producing countries (notably Canada
and Australia) also rose sharply against the dollar. Bucking the trend, the Mexican peso
and China’s RMB have moved sideways against the dollar over the past few weeks.
Altogether, the dollar lost almost 5 percent (in both nominal and real terms) of its trade-
weighted value from March 28 to May 2.
Option-implied volatilities of major exchange rates – especially for the yen/dollar pair –
have risen sharply during the period, as investors appear to be seeking direction on the
future course of exchange rate policies.
U.S.-bound capital flows continued at a smooth pace, with oil-exporting countries
increasing their share of global savings. Elsewhere, there was likely some unwinding of
carry positions in March out of Iceland’s krona and New Zealand’s dollar. Other high-
yielding currencies, such as the Australian dollar and the Brazilian real, have so far
staved off similar unwinding, partly because of the supportive role of rising commodity
prices for these currencies.
Oil Market Developments
Supported by strong global growth, oil prices have been on an up-trend since the
beginning of the year. WTI prices have hovered around $70-$75 a barrel in recent
weeks, up from an average of $62 in March. The fundamentals in the market are not
FRBNY - cleared for release

FRBNY: Blackbook, May 4, 2006 Confidential(FR) Class II FOMC 16
expected to improve over the rest of 2006: strong oil demand, especially from China and
the United States; capacity constraints in the OPEC area; declining productivity in the
North Sea; and production shortfalls in Nigeria, Iraq, and elsewhere should continue to
combine to keep the market tight. Political tensions with Iran also have contributed to oil
price instability, while Bolivia’s recent decision to nationalize its natural gas industry has
contributed to instability to other energy products. Oil futures contracts point to WTI
prices of $75.50 in 2006Q4, falling marginally to $74.25 in 2007Q4, up from $66.50 and
$67.00, respectively, at the time of the last FOMC meeting.
Second District
Our Indexes of Coincident Economic Indicators for March indicate robust economic
growth in New York State and New York City along with moderate growth in New
Jersey; New York City’s index recently surpassed its previous cyclical peak, set in early
2001 [Exhibit E-1]. Looking ahead to the next nine months, our leading indexes predict a
roughly 2% annualized rate of economic growth for New Jersey, a 4% rate for New York
State and a 6% rate for New York City [Exhibit E-2]. Local-area inflation moderated
noticeably, on a year-over-year basis, in March, but this largely reflects the reversal of an
aberrant spike in imputed out-of-town lodging costs in March 2005. The 12-month
change in metropolitan New York City's Consumer Price Index (CPI) was 2.7%, down
from 3.6% in February and about a ½ percentage point below the U.S. rate. Similarly,
the core CPI decelerated to a 1.7% (12-month) rate, down from 2.6% in February and
almost a ½ percentage point below the U.S. rate. [We estimate that out-of-town lodging
costs accounted for a third of the drop in the overall 12-month rate and half the decline in
the core rate.]
Labor Markets. The region's job market showed signs of strengthening in March. Based
on the establishment survey, private-sector employment grew at a 1.1% annual rate in
both New York and New Jersey, a bit faster than in February. Between March 2005 and
March 2006, private-sector employment increased by about 1.2% in both states and rose
FRBNY - cleared for release

FRBNY: Blackbook, May 4, 2006 Confidential(FR) Class II FOMC 17
by a robust 1.9% in New York City [Exhibit E-3]. Turning to the labor force data, the
unemployment rate held steady at 4.7% in New York State and edged down from 4.7% to
4.5% in New Jersey [Exhibit E-4]. While unemployment rates in the region have
hovered near cyclical lows in recent months, labor force participation has climbed
steadily, pushing employment-population ratios to near record highs.
Real Estate. Commercial real estate markets were mixed but generally stable in April,
while residential markets showed substantial signs of softening in the first quarter. In
April, office vacancy rates across the New York City metro area were steady to slightly
higher, while rental rates were up modestly overall. There are indications of some
tightening in Manhattan’s retail market: a recently released report indicates that the
average asking rent per square foot rose 4.9% from a year earlier, with prime areas
registering much steeper increases. In the residential sector, recently-released data
indicate substantial softening during the first quarter: the New York State Association of
Realtors reports that the median price for single-family homes, which had been posting
double-digit year-over-year gains for a number of years, fell sharply in March and was
unchanged from a year earlier. Similarly, prices of Manhattan co-ops and condos, which
had been rising by more than 15% through the end of 2005, were up just 6% from a year
earlier in the first quarter. Moreover, unit sales of both houses and apartments are down
moderately from a year ago, and the inventory of homes on the market has risen sharply.
Surveys and Other Business Activity. Recent surveys indicate moderate and steady
growth in the region’s manufacturing sector. Preliminary results from the May Empire
State Manufacturing Survey suggest that manufacturing activity continues to expand at a
steady pace, though respondents are not quite as optimistic about the six-month outlook
as in recent months. Manufacturers also report more widespread increases in both input
prices and selling prices. Similarly, purchasing managers in both the New York and
Buffalo areas indicate steady and strong growth, as well as increased price pressures.
The Conference Board’s latest survey of regional residents (NY, NJ, PA) shows
FRBNY - cleared for release

FRBNY: Blackbook, May 4, 2006 Confidential(FR) Class II FOMC 18
consumer confidence retreating marginally in April, after vaulting to a nearly four-year
high in March; consumers’ assessment of current conditions is the most positive it has
been since August 2001.
3. Outlook
FRBNY’s Central Forecast
There are three fundamental factors behind our central projection [see Exhibits A-1 to A-
5].
1. Inflation expectations are expected to remain contained.
2. There is little if any slack remaining in resource utilization. Therefore, if there areno large shocks, and if fiscal and monetary policies maintain a near-neutralstance, then growth over the medium term will be near its potential rate ofapproximately 3¼-3½% (2¼-2½% long-run productivity growth [GDP basis] plus1% labor force growth).
3. The term premium is expected to remain low.
These underlying assumptions for the central forecast have not changed from the last
Blackbook. However, some recent developments have led us to be more cautious about
these assumptions. Inflation expectations in both financial markets and consumer
surveys displayed some increases during the inter-meeting period, especially in late
April. There may also be some modest payback from the robust growth in 2006Q1 in the
near term. While we do not anticipate that these factors will persist, they raise the
uncertainty around our forecast.
In regard to the monetary policy path, our forecast is consistent with the Fed funds target
rate remaining at 5% over the forecast horizon. This path is in general agreement with
that underlying the Greenbook forecast.
FRBNY - cleared for release

FRBNY: Blackbook, May 4, 2006 Confidential(FR) Class II FOMC 19
Inflation. Monthly changes in headline and core price indices rose significantly in April.
In addition, oil prices rose during the inter-meeting period from already high levels. We
expect little net change in oil prices over the forecast horizon, so these developments
have led us to raise our inflation forecast only at the short-term horizon. Another reason
for the increase to be temporary is that we expect only modest pass-through of energy
price increases to other goods and services due to an environment of flexible product and
labor markets as well as continued FOMC credibility. Consequently, we expect core
PCE inflation to be little over 2% in 2006; with relatively little change in energy prices
expected, overall PCE inflation should be slightly higher. In 2007, a slow moderation
begins as FOMC credibility and monetary tightening effects take hold, leading core PCE
inflation to decline gradually toward its implicit target.
Real Activity. We expect the economy to grow slightly below our estimate of its potential
rate (3¼%-3½%) in the current quarter, with a subsequent return to potential growth over
the remaining forecast horizon. After the very strong rebound in real GDP growth in
2006Q1, there are some indications of a slight payback. These indications include the
recent monthly patterns of construction spending, consumer expenditures, and auto sales.
In the second half of 2006, strong business investment should continue to support growth,
counteracting a moderating housing market. Beyond this, our forecast remains largely
unchanged with growth near its potential rate through 2007. With average real growth
close to its potential rate over the forecast horizon, we expect little change in the
unemployment rate from its current level.
Comparison with Greenbook Forecasts
GDP and Inflation Forecast. The Greenbook baseline forecast is conditioned on a policy
path roughly unchanged from March, except at the very end of the forecasting period: the
policy rate is expected to rise to 5% at the May meeting and to stay at that level through
the end of 2007. The March Greenbook policy path assumed a cut to 4.75% in 2007H2.
There are larger changes in the conditioning assumptions on energy prices, long-term
FRBNY - cleared for release

FRBNY: Blackbook, May 4, 2006 Confidential(FR) Class II FOMC 20
interest rates and the dollar. There are only very minor changes in the conditioning
assumptions for household wealth. For the first two there are relatively large increases
from the March Greenbook, thus they dampen real activity. For the dollar, the
depreciation in the inter-meeting period adds some small stimulus. Overall these changes
in conditioning assumptions produce a more abrupt slowing in real activity in 2006H2
and a small increase in the core inflation forecast.
Other major features of the current Greenbook forecast are the following.
Core PCE inflation is revised up 0.1 percentage point for 2006, when it isexpected to be 2.2%, and revised up 0.1 percentage point in 2007 to 2%.Real GDP growth forecast for 2006 is 3.8%, similar to March.Potential GDP growth is still projected to rise over the forecast period to 3.3%due to an increase in structural productivity sustained by the pick-up in capitalspending of the past few years.Relative to the March projections, there is no change in output per hour in NFBsector, maintained at 2.8%.Payroll employment is expected to slow substantially over the forecast horizon(slightly more than in the March Greenbook) as labor force participationcontinues a secular decline. The slowdown in real activity is expected to producean increase in the unemployment rate in 2007 to return to the assumed NAIRU of5.0%.
Our staff forecast of real GDP growth shows, as in March, a slightly smoother path than
the Greenbook forecast [see Exhibit A-2]. Our projection for 2006 is 0.2 percentage point
below the Greenbook forecast for 2006 (3.6% vs. 3.8%) but 0.3 percentage point above
the 2007 Greenbook projection (3.3% vs. 3.0%). The slower growth in 2007 appears to
be due primarily to the Greenbook forecasting slower growth in equipment and software
expenditures and government expenditures than is in our staff forecast.
For inflation, the FRBNY central forecast and the Greenbook forecast are essentially the
same. A substantial difference appears, as has been the case for the last few FOMC
cycles, in the outlook for productivity and unit labor costs. In 2006, both forecasts have a
rebound of compensation per hour from the low growth rate (3.8%) in 2005; however,
our forecast of a 4.7% growth is lower than the Board’s forecast of 5.2%. The
discrepancy persists for 2007: 4.6% vs. 5.4%. Since our forecast for labor productivity is
FRBNY - cleared for release
FRBNY: Blackbook, May 4, 2006 Confidential(FR) Class II FOMC 21
similar to the Board’s, the different projections for compensation growth translate into a
much lower unit labor cost in our forecast, 1.8% for both 2006 and 2007, vs. 2.3% in the
Greenbook.
To reconcile different projections of unit labor costs with similar inflation projections we
must infer that the Board continues to assume some contraction of profit margins.
Alternative Greenbook forecasting scenarios. These simulations are constructed using the
FRB-US model (after its residuals have been adjusted to match the Greenbook forecast).
Maintaining the innovations introduced in the March Greenbook, these projections are
not conditioned on an assumed exogenous path for the federal funds rate: the path of the
target rate is instead simultaneously generated by the policy rule incorporated in the
model. This rule is the Bluebook “outcome-based” Taylor rule, estimated on real-time
data since 1988. The sample period used to compute forecast intervals starts, as in the
March GB, from 1986 in order to eliminate the volatility of the 1970s.
Note the simulations are (as in previous Greenbooks) are derived from ad hoc scenarios
that take the form of either changes in assumptions about the path of a particular variable
or the value of a particular parameter in the model, as opposed to changes in the
probability distribution of the shocks. In our opinion, couching the scenarios in terms of
the probability distribution of the shocks is more desirable because it maps directly into
the thing we care about—specifically, our overall confidence in the central scenario
presented in the Greenbook. For example, one of the alternatives presented in this
Greenbook is a domestic boom. Presumably the decision to present this scenario was
implicitly linked to the fact that Q1’s GDP growth came more from final sales and less
from inventory accumulation than was forecasted in March. But rather than being framed
as depicting the increase in upside risk to the central forecast, it is simply presented as an
independent alternative that would seem no more or less likely to occur this time than it
would have been had it been presented in the March Greenbook.
The alternative scenarios considered in the Greenbook span variations to both the supply-
side baseline assumptions and demand-side baseline with an additional focus on energy
FRBNY - cleared for release

FRBNY: Blackbook, May 4, 2006 Confidential(FR) Class II FOMC 22
price pass-through to core inflation. The lower NAIRU and less room to grow (i.e.,
slower growth of structural productivity) are similar to the last Greenbook. Perhaps the
most interesting new scenario is a domestic boom since as noted above it captures some
of the surprising momentum in the US economy. Under this scenario output growth
remains above potential in 2007, but the impact on inflation is muted, according to the
FRBUS simulations, as the Fed reacts by increasing the FFR past 6% by late 2007 and
thus raising the real rate of interest by about 100 basis points. Another scenario that
implies a tighter policy than the assumed baseline is the “greater pass-through with
unanchored expectations” scenario: in this case the FFR is projected to rise to 5.5% to
keep real activity as in the baseline. Despite the nominal tightening, in this scenario core
inflation increases outside the comfort zone to about 2.5%, leaving real rates essentially
unaffected. Overall, the policy responses that we observe in these scenarios appear to be a
consequence of the weights of the outcome based policy rule used. This policy rule in
conjunction with the inertial movement of inflation built into FRBUS produces very mild
policy responses to inflation compared to other policy rule and economic models.
Foreign Outlook. There is little difference between our forecast and the Board’s foreign
outlook for 2006. They have slightly faster growth in Japan (2.2 percent vs. 2.4 percent)
and slower growth in China (9.0 percent vs. 8.6 percent). The differences between the
forecasts have narrowed, as we raised our Mexico forecast closer to the Board’s, while
the Board raised its forecast for China closer to our number.
U.S. Trade. Our forecast has somewhat more drag from net exports (0.5 percentage
point, Q4/Q4) in 2006 then the Board’s forecast (0.3 percentage point), with the
difference tied to our forecast of more import growth this year. Our forecasts for exports
are similar. Of note is that the Board tries to predict large swings in oil imports, while
our forecast takes a more cautious approach. One consequence is that their prediction of
a steep drop in oil imports in Q2 leads the Board to forecast a small contribution of net
exports to GDP growth in Q2, while we forecast a small drag.
Comparison with Private Forecasters
FRBNY - cleared for release

FRBNY: Blackbook, May 4, 2006 Confidential(FR) Class II FOMC 23
The broad contours of the FRBNY forecast for real GDP growth match those produced
by our PSI model as well as those shown in externally produced forecasts. On the
inflation front, the FRBNY forecast shows considerably more CPI inflation in Q2 than is
indicated in any of the private sector forecasts, but this may reflect the timing of the most
recent CPI release relative to the release of the reported forecast values rather than any
difference in views about inflation. The FRBNY forecast for core CPI in Q2 is also
higher than what Macro Advisors released on April 14th. FRBNY is similar to the other
forecasts for 2006Q3.
FRBNY Alternative Scenarios and Risks
In addition to the central projection discussed at the beginning of this section, we also
consider a number of alternative scenarios that have different implications for monetary
policy. Our approach differs from that in the Greenbook in that we attach probabilities to
our alternative scenarios and usually maintain the same scenarios across FOMC cycles.
This allows us to interpret more easily the forecast distribution for output and inflation, as
well as analyze the impact from the variation of those probabilities over time. Once
introduced, we keep an alternative scenario until its probability is assessed to be minimal;
for example, we introduced the hurricane-induced sharp slowdown scenario in September
2005 after the landfall of Hurricane Katrina and then removed it in December 2005 when
it became clear that such a slowdown was extremely unlikely.
We also can generate (when necessary) other forecast distributions that place a much
higher probability on a specific alternative scenario in order to examine its implications
for policy. This was done in January 2006 in response to the near inversion of the yield
curve and the surprisingly low advance reading on 2005Q4 GDP growth. To capture
these developments, we produced a forecast distribution where we doubled the
probability of a productivity slowdown.
FRBNY - cleared for release

FRBNY: Blackbook, May 4, 2006 Confidential(FR) Class II FOMC 24
FRBNY Alternative 1: Overheating. The extremely accommodative policy stance
adopted in the US and other countries in response to the global slowdown of 2000-2003
may produce a persistent move in inflation above implicit targets with an abrupt
slowdown in real output growth starting in mid-2006. There are two potentially
connected channels at work here. The first is a continued underestimate of the
equilibrium real rate (i.e., an overestimate of slack in the global economy) and the second
is higher energy and commodity prices. Sustaining the real policy rate below the
equilibrium rate for a long time will tend to switch the impact of monetary policy from
increasing real output to raising inflation due to an eventual increase in inflation
expectations. The recent evidence from core consumer inflation reports has been more
supportive of this viewpoint. TIPS implied inflation rates give some indication that
markets are pricing in an increase in underlying inflation, and many measures of
underlying inflation are above the “comfort zones” of policymakers. [For an alternative
specification of this alternative scenario, see the Special Topic “The Free Lunch.”]
FRBNY Alternative 2: Productivity Shifts. In the post-war era, the United States has
experienced three productivity epochs (pre-1973, High I; 1973 to mid-1990s, Low I; and
mid-1990s onward, High II). Our current central projection for productivity in the
medium-term assumes a growth rate similar to the pre-1973 epoch. There are two
alternatives to this projection.
2a. Productivity Boom
The developments in the labor market and the continued strength of labor productivity
over the longer-term—despite some recent short-term moderation—suggest that firms
have become more efficient in using labor. As such, strong productivity growth could
persist, which would imply that the potential growth rate is higher than our current
estimate. Strong productivity growth would also limit labor cost pressures, and thereby
help to keep inflation subdued. 2005Q4 productivity growth was less supportive of this
scenario, but the solid productivity growth in 2006Q1 suggests the recent slowdown in
FRBNY - cleared for release

FRBNY: Blackbook, May 4, 2006 Confidential(FR) Class II FOMC 25
productivity was temporary. Moreover, this scenario is supported by the continued
strength in IT industrial production growth, the FRBNY Tech pulse index, and hi-tech
equipment and software expenditure indicators.
2b. Productivity Slump
It is possible that the recent upswing in productivity may not be sustained. Further, the
persistent increase in the level and volatility of energy and commodity prices also could
result in lower labor productivity growth. The recent slowing in productivity growth is
consistent with this scenario as is the signal from the Kahn-Rich productivity model.
However, strong economic activity in 2006Q1 has lowered the probability of this
scenario.
FRBNY Alternative 3: Global Deflation. This scenario is related to changes in the world
economy over the past few years, particularly the growth of the Chinese economy and the
stagnation of the economies of Europe and Japan. The growth of the Chinese economy
represents a shift in the aggregate supply curve, leading to higher growth and lower
inflation in the US. On the other hand, the stagnation of the European and Japanese
economies represent a shift in the aggregate demand curve, leading to lower inflation and
lower growth in the US. The net effect of these shifts has been unambiguous in terms of
lowering inflation and lowering long-term yields. These developments have been
supportive of recent growth in the US. However, the downside risk in this scenario comes
from an abrupt slowdown in Chinese growth without a compensating increase in Europe
or Japan, thereby generating an unfavorable deflationary shock to the world economy.
The recent signs of strength in Europe and Japan, continued robust growth in China,
continued increases in energy and commodity prices as well as the rise in world interest
rates have lowered the probability of this scenario. If these developments continue for the
remainder of the second quarter, then this scenario will be dropped from the June
Blackbook.
FRBNY - cleared for release

FRBNY: Blackbook, May 4, 2006 Confidential(FR) Class II FOMC 26
Additional Uncertainties
Foreign Outlook. Solid 2006Q1 data suggesting a healthy global economy are balanced
by concerns about tighter monetary policies and high commodity prices.
In the euro area, measures of business optimism have yet to peak, suggesting the
economy has noteworthy upside potential. Of particular note is that business surveys find
more firms willing to hire, which may lead to more consumption growth than currently
projected. Downside concerns include the impact of higher interest rates and the
appreciation of the euro since the start of the year, which may have a greater-than-
expected impact on output. Increases in crude oil prices are also a concern, although the
euro area has done well so far in dealing with last year’s increase in oil prices.
A major uncertainty in Japan is the future conduct of monetary policy following the
recent announcement of a new monetary framework. There is some concern that a rise in
the overnight interest rate could take place too soon, although the economy appears
strong enough to weather an early policy tightening. Other risks include the uncertain
impact of the recent rise in long-term rates and of the appreciating yen on demand.
In China, more rapid RMB appreciation may be needed to forestall trade tensions with
the United States. The U.S. Treasury may still label China a currency manipulator, with
unpredictable – but likely – negative market consequences. Investment in China remains
unsustainably high as a share of GDP and is still rising. Growth in Emerging Asia
outside China remains vulnerable to the global cycle and would be put at risk if a
significant slowdown in global growth were to occur. The region is also vulnerable to
high oil prices.
In Latin America, notable risks include the reaction of financial market to upcoming
elections in Mexico and Brazil. Mexico’s July 2nd presidential race has tightened, as the
center-left candidate, Andres Manuel Lopez Obrador, has lost his lead in the polls to
market-favorite Felipe Calderón. In Brazil, the approaching presidential elections in
FRBNY - cleared for release

FRBNY: Blackbook, May 4, 2006 Confidential(FR) Class II FOMC 27
October 2006 reenergized government corruption investigations, forcing the replacement
of Finance Minister Palocci with less-orthodox Guido Mantega. As a result, fiscal policy
has come under greater scrutiny, particularly given election year spending pressures. In
Argentina, inflation and the government’s heterodox policy response remain key
concerns.
U.S. Trade Forecast. The forecast assumes import growth will remain moderate relative
to domestic demand growth, as was the case in 2005. One concern is that the pick-up in
import volumes in the first quarter of 2006 might be more persistent than currently
assumed and lead to higher-than-expected imports for the year as a whole. A
countervailing risk is that investment spending might rise more rapidly than assumed in
Europe and Japan, causing faster-than-expected growth in U.S. exports.
Quantifying the Risks. The inflation data over the inter-meeting period have been less
consistent with our central scenario. Therefore, we are lowering the current likelihood of
the central scenario to 66% (it was 69.5% for the March FOMC). We assume that the
most likely scenario is overheating at 12% (6% in March) and the productivity surge at
10% (10% in March). These are followed by the productivity slowdown at 8% (10% in
March) and the global deflation at 1% (1.5% in March). The remaining 3% (3% in
March) is split evenly between upside and downside risks. The implied dynamic balance
of risks is shown in Exhibit C-1.
The forecast distributions for core PCE inflation and GDP growth produced by the
standard risk assessments are shown in Exhibits C-4 and C-5. The Bank forecast has
been extended through the end of 2008 under the assumption that output grows at the
potential rate of 3.3% and core PCE inflation is converging back to the implicit inflation
target of 1.5%. The probability of core PCE inflation exceeding 2.5% by the end of 2008
is now 65% (55% in March)--this probability is produced by considering the share of
inflation paths that exceed 2.5% and cannot be obtained directly from the forecast
FRBNY - cleared for release

FRBNY: Blackbook, May 4, 2006 Confidential(FR) Class II FOMC 28
distribution presented in Exhibit C-4. The probability that the expansion continues
through the end of 2008 is unchanged at 95%.
The FRBNY “confidence intervals” can be compared to those presented in the
Greenbook. In general we have a similar level of confidence for 2006 as the Board, but
less confidence in 2007 on inflation. For example, the Greenbook has a 70% probability
interval of 1.2% to 2.8% for core PCE inflation in 2007, while our interval ranges from
0.8% to 3.6%. The source of the wider interval is the weight we place on our alternative
scenarios. These scenarios do not receive the same weight in the historical data since
1986 from which the Greenbook derives its forecast errors.
FRBNY - cleared for release


FRBNY: Blackbook, May 4, 2006 Confidential(FR) Class II FOMC 30
4. Policy Alternatives
Under our main forecast and risk assessment, the target FFR should be raised by 25 basis
points to 5.0% at the upcoming meeting. This rate is higher than the peak FFR level that
has been implied by our forecasts and risk assessments for most of the current tightening
cycle. The primary factor behind the increase in our recommended policy rate is that our
assessment of the neutral policy rate has increased—from a range of 3.75% to 4.25%
over the early part of the tightening cycle to our recent assessment of a 4.0% to 4.5%
range. The increase in our assessment of the neutral rate was prompted mainly by the
continued momentum of the U.S. economy despite the 15 consecutive increases in the
FFR, with further corroboration coming from the recent increase in medium-term real
forward rates worldwide.
Maintaining the FFR at 5% through the end of 2007 is consistent with our central forecast
scenario as discussed in Special Topic 1, “The case for pausing at 5%.” However, we
have reduced the likelihood of our central forecast scenario from March and have
increased the likelihood of the overheating scenario. The combined increase in the
weight we now place on scenarios entailing short-run upside risk to inflation (overheating
and productivity slowdown) leads us to raise our expectation that the FFR will be between
5% and 5.5% through the end of 2007. For example, under our Inflation Hawk policy
rule (described in more detail below) we generate an expected FFR of 5.5% in 2006Q4.
In this Blackbook, we also have reduced the weight further on the global deflation
scenario, a reduction that implies a corresponding decline in the risks of a large policy
mistake induced by over-tightening. Special Topic 2, “The Case for Inflation Vigilance,”
repeats some arguments in favor of increased vigilance on the price stability objective
from the March Blackbook.
It is fair to say that our current assessment of the appropriate near-term path of policy is
more contingent—in both directions—on the aspects of the economic environment about
FRBNY - cleared for release

FRBNY: Blackbook, May 4, 2006 Confidential(FR) Class II FOMC 31
which we are least certain. One way to illustrate this point is that in late 2004 and early
2005, it is unlikely that even a 50 to 75 basis point increase in the committee’s
assessment of the neutral FFR within the inter-meeting period would have changed the
upcoming policy move, and possibly not even the move following that one. The same
can be said of the committee’s assessment of underlying trend productivity growth, or
potential output growth, and even moves in medium and long-horizon inflation
expectations. At this juncture, though, it is precisely these factors that matter the most in
determining the conduct of monetary policy going forward.
For example, we are in a situation in which the future path of the FFR is more dependent
on views about the costs of core inflation running close to the top of the implicit range
(and its potential harm to credibility) versus the risks to real activity of trying to reduce
the core inflation rate. If the FOMC’s credibility is not at stake, then we can tolerate
temporary upward movements in core inflation due to energy price shocks or other
factors. However, once inflation expectations at medium- to long-horizons begin to rise,
a loss of credibility could be triggered that would require a more significant tightening in
the future. The trade-off between moving now to maintain credibility and moving later
so as not to inadvertently over tighten is determined both by policymaker preferences and
their assessment of the current situation. Our analysis of the policy alternatives is
couched in terms of the assessment of the current situation, but it is possible to re-frame
our discussion in terms of two policymakers who possess the same assessment of the
current situation but hold different views of the trade-off between inflation and real
activity.
Finally, in considering the policy alternatives it is important to keep in mind that the
current tightening cycle has been unusual with regard to the behavior of long forward
rates. As the FFR has risen, long forward rates declined in such a way that there was little
if any increase in long-term rates. In the last six months, however, long forward rates
have increased in the US and the off the run 10 year Treasury yield has remained above
5% for the whole inter-meeting period. On the one hand, the increase in long-term rates
implied a need for less tightening to slow the economy going forward. On the other hand,
FRBNY - cleared for release

FRBNY: Blackbook, May 4, 2006 Confidential(FR) Class II FOMC 32
the lack of any restraint from an increase in long-term rates until now might have built
considerable momentum into the economy.
To provide a quantitative analysis of the germane policy alternatives, we examine the
prescriptions implied by three different policy rules:
1. Standard Policy Rule (very close to market expectations). Increase by 25 basis pointsin May, and send a mild positive signal regarding future actions.
2. Pause (slightly below market expectation). Increase by 25 basis points in May, andsignal short-run flexibility to respond to data that produces large changes in theforecast.
3. Inflation Hawk (above market expectations). Increase by 25 basis points in May, andstrongly signal a desire to reduce core inflation to the (implicit) target or range on asustained basis unless incoming data reduces the inflation forecast.
The preamble to the D-Exhibits contains a description of how the various rules react to
incoming data.
Exhibit D-1 contains the results of averaging the prescription of these three rules over the
Bank forecast distribution. It shows the implied (quarterly average path) of FFR through
the end of 2007 compared to that currently priced into markets. The Inflation Hawk rule
produces a level for the FFR at the end of 2006 about 40 basis points higher than that
currently priced into financial markets. The other two rules produce very similar
tightening to that currently priced into markets in 2006, and are a little higher than the
market in 2007. Exhibit D-6 contains the probabilistic metric for comparing the market
implied paths of the FFR with those of our policy rules at the end of 2006. It appears the
market is pricing in behavior very close to that represented by our standard rule.
Exhibit D-5 shows there is a high probability that the FFR would be 5% under the Pause
rule for the rest of 2006 (probability of 5% in 2006Q3 is 0.98 and in 2006Q4 is 0.65),
while the Standard Policy is symmetric around 5% in 2006Q3. The distribution implied
by the Inflation Hawk rule has a bimodal distribution with a 35% probability of the FFR
remaining at 5% in 2006Q3, but with a 64% probability of increases in June and August.
FRBNY - cleared for release

FRBNY: Blackbook, May 4, 2006 Confidential(FR) Class II FOMC 33
Both the standard policy rule and the pause are very close to the market path. We focus
on the Pause rule because it exhibits some interesting properties across our scenarios.
Exhibit D-2 contains the path of the nominal FFR and Exhibit D-3 contains the path of
the real FFR for our four main alternative scenarios through the end of 2008.
Exhibit D-2 shows the projected path of the FFR is much higher under the FRBNY
overheating scenario in 2007 than under our central projection or the market-implied
path, with Exhibit D-3 showing that the real FFR takes longer to catch up in the
overheating scenario. The central forecast scenario and the productivity surge both
produce expected paths that are effectively equal to 5% through the end of 2007. For the
productivity surge scenario, the real rate in Exhibit D-3 increases from below 3% to 3.5%
by the end of 2007. This scenario captures an environment similar to 1996-1998 where
the nominal FFR was approximately constant, while real rates increased and inflation
declined.
Exhibit D-4 shows the result of running our standard gradualist policy rule—setting the
initial FFR at its average value of 1.9 in 2004Q4—with a 1.5% inflation target and a
1.75% inflation target (see the preamble to the Exhibit D for more information on the
standard policy rules as well as this exercise). The path derived from the 1.5% target
closely follows the actual FFR path until the middle of 2005. After this, the slope of
actual policy has been considerably steeper than that implied by the standard policy rule.
The policy rule with the 1.5% inflation target does reach the level of the FFR currently
priced into markets in late 2007. The exhibit also includes the implications of averaging
our three policy rules, where the average was chosen to match the market-implied
expected path as closely as possible.
FRBNY - cleared for release


FRBNY: Blackbook, May 4, 2006 Confidential(FR) Class II FOMC 37
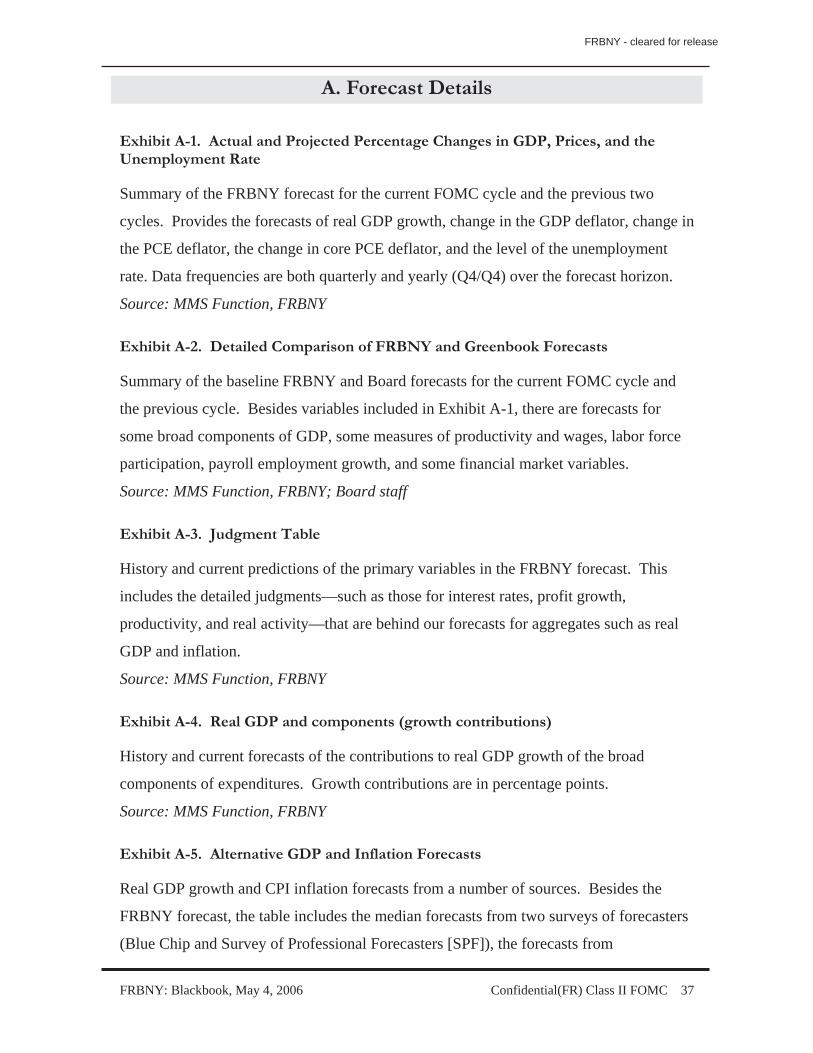
Exhibit A-1. Actual and Projected Percentage Changes in GDP, Prices, and the Unemployment Rate
Summary of the FRBNY forecast for the current FOMC cycle and the previous two
cycles. Provides the forecasts of real GDP growth, change in the GDP deflator, change in
the PCE deflator, the change in core PCE deflator, and the level of the unemployment
rate. Data frequencies are both quarterly and yearly (Q4/Q4) over the forecast horizon.
Source: MMS Function, FRBNY
Exhibit A-2. Detailed Comparison of FRBNY and Greenbook Forecasts
Summary of the baseline FRBNY and Board forecasts for the current FOMC cycle and
the previous cycle. Besides variables included in Exhibit A-1, there are forecasts for
some broad components of GDP, some measures of productivity and wages, labor force
participation, payroll employment growth, and some financial market variables.
Source: MMS Function, FRBNY; Board staff
Exhibit A-3. Judgment Table
History and current predictions of the primary variables in the FRBNY forecast. This
includes the detailed judgments—such as those for interest rates, profit growth,
productivity, and real activity—that are behind our forecasts for aggregates such as real
GDP and inflation.
Source: MMS Function, FRBNY
Exhibit A-4. Real GDP and components (growth contributions)
History and current forecasts of the contributions to real GDP growth of the broad
components of expenditures. Growth contributions are in percentage points.
Source: MMS Function, FRBNY
Exhibit A-5. Alternative GDP and Inflation Forecasts
Real GDP growth and CPI inflation forecasts from a number of sources. Besides the
FRBNY forecast, the table includes the median forecasts from two surveys of forecasters
(Blue Chip and Survey of Professional Forecasters [SPF]), the forecasts from
A. Forecast Details
FRBNY - cleared for release
FRBNY: Blackbook, May 4, 2006 Confidential(FR) Class II FOMC 38
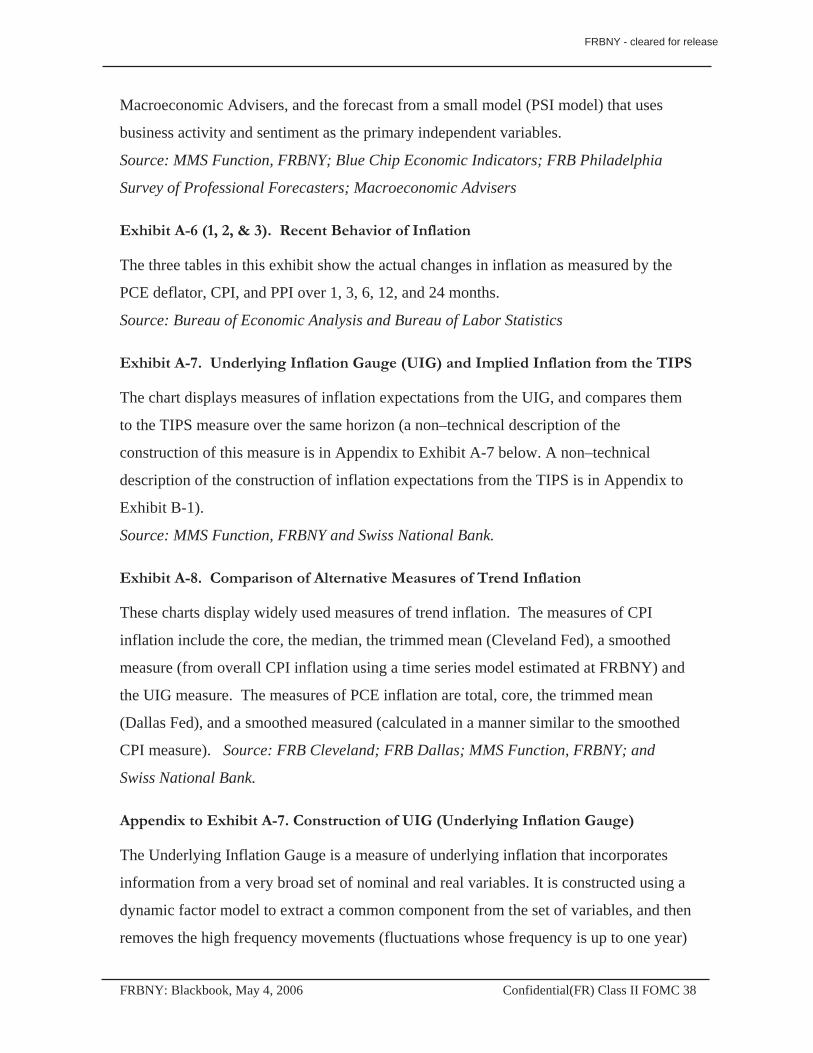
Macroeconomic Advisers, and the forecast from a small model (PSI model) that uses
business activity and sentiment as the primary independent variables.
Source: MMS Function, FRBNY; Blue Chip Economic Indicators; FRB Philadelphia
Survey of Professional Forecasters; Macroeconomic Advisers
Exhibit A-6 (1, 2, & 3). Recent Behavior of Inflation
The three tables in this exhibit show the actual changes in inflation as measured by the
PCE deflator, CPI, and PPI over 1, 3, 6, 12, and 24 months.
Source: Bureau of Economic Analysis and Bureau of Labor Statistics
Exhibit A-7. Underlying Inflation Gauge (UIG) and Implied Inflation from the TIPS
The chart displays measures of inflation expectations from the UIG, and compares them
to the TIPS measure over the same horizon (a non–technical description of the
construction of this measure is in Appendix to Exhibit A-7 below. A non–technical
description of the construction of inflation expectations from the TIPS is in Appendix to
Exhibit B-1).
Source: MMS Function, FRBNY and Swiss National Bank.
Exhibit A-8. Comparison of Alternative Measures of Trend Inflation
These charts display widely used measures of trend inflation. The measures of CPI
inflation include the core, the median, the trimmed mean (Cleveland Fed), a smoothed
measure (from overall CPI inflation using a time series model estimated at FRBNY) and
the UIG measure. The measures of PCE inflation are total, core, the trimmed mean
(Dallas Fed), and a smoothed measured (calculated in a manner similar to the smoothed
CPI measure). Source: FRB Cleveland; FRB Dallas; MMS Function, FRBNY; and
Swiss National Bank.
Appendix to Exhibit A-7. Construction of UIG (Underlying Inflation Gauge)
The Underlying Inflation Gauge is a measure of underlying inflation that incorporates
information from a very broad set of nominal and real variables. It is constructed using a
dynamic factor model to extract a common component from the set of variables, and then
removes the high frequency movements (fluctuations whose frequency is up to one year)
FRBNY - cleared for release
FRBNY: Blackbook, May 4, 2006 Confidential(FR) Class II FOMC 39
from this component. This filtering reflects our view that monetary policy is primarily
interested in shocks with a medium-term impact on inflation. In terms of units, the UIG
maps into a measure of consumer price index.
FRBNY - cleared for release

A.F
orec
ast
Det
ails
Clas
s II F
OM
C-Re
stric
ted
FR 4
0FR
BNY
: Blac
kboo
k, M
ay 4
, 200
6
Exh
ibit
A-1
: Act
ual
an
d P
roje
cted
Per
cen
tage
Ch
ange
s of
GD
P, P
rice
s, a
nd
th
e U
nem
plo
ymen
t R
ate
Chai
n Ty
peRe
al G
DPGD
P Pr
ice
Inde
xCo
re P
CEUn
empl
oyme
nt R
ate
Jan0
6M
ar06
May
06Ja
n06
Mar
06M
ay06
Jan0
6M
ar06
May
06Ja
n06
Mar
06M
ay06
Jan0
6M
ar06
May0
6
2005
Q1
3.8
3.8
3.8
3.1
3.1
3.1
2.3
2.3
2.3
2.4
2.4
2.4
5.2
5.2
5.2
2005
Q2
3.3
3.3
3.3
2.6
2.6
2.6
3.3
3.3
3.3
1.7
1.7
1.7
5.1
5.1
5.1
2005
Q3
4.1
4.1
4.1
3.3
3.3
3.3
3.7
3.7
3.7
1.3
1.3
1.3
5.0
5.0
5.0
2005
Q4
1.1
1.6
1.7
3.0
3.3
3.5
2.6
2.7
2.9
2.1
2.1
2.4
5.0
5.0
5.0
2006
Q1
4.0
4.7
4.8
3.2
2.1
3.3
2.5
2.0
2.0
2.0
2.0
2.0
4.9
4.8
4.8
2006
Q2
3.2
3.4
3.1
2.3
2.3
1.9
2.4
2.4
3.8
2.0
2.1
2.4
4.9
4.7
4.7
2006
Q3
3.4
3.5
3.5
2.3
1.8
1.9
2.2
2.2
2.2
2.0
2.1
2.2
4.9
4.7
4.7
2006
Q4
2.8
2.9
3.0
2.3
2.1
2.1
2.2
2.2
2.2
2.0
2.0
2.1
4.9
4.7
4.7
2007
Q1
3.3
3.4
3.2
2.4
2.3
2.4
2.1
2.1
2.1
1.9
1.9
2.0
4.9
4.7
4.7
2007
Q2
3.4
3.5
3.2
2.1
2.0
2.1
1.9
1.9
1.9
1.8
1.9
2.0
4.9
4.7
4.7
2007
Q3
3.5
3.2
3.4
2.1
2.3
2.1
2.0
2.0
2.0
1.8
1.8
1.9
4.9
4.7
4.7
2007
Q4
3.2
2.9
3.4
2.0
1.9
2.1
1.9
1.9
1.9
1.8
1.8
1.8
4.9
4.7
4.7
2003
Q4
to3.
83.
83.
82.
92.
92.
93.
13.
13.
12.
22.
22.
2-0
.4-0
.4-0
.4*
2004
Q4
2004
Q4
to3.
13.
23.
23.
03.
13.
13.
03.
03.
01.
91.
92.
0-0
.5-0
.5-0
.5*
2005
Q4
2005
Q4
to3.
43.
63.
62.
52.
12.
32.
32.
22.
52.
02.
12.
20.
0-0
.2-0
.2*
2006
Q4
2006
Q4
to3.
33.
23.
32.
12.
12.
22.
02.
02.
01.
81.
81.
90.
00.
00.
020
07 Q
4*
Q4
to Q
4 ab
solut
e ch
ange
Note
s: C
olum
ns re
flect
the
date
of a
fore
cast
. Ital
ics in
dicat
e a
data
relea
se p
rior t
o da
te o
f a fo
reca
st
PCE
Defla
tor
FRB
NY
- cl
eare
d fo
r rel
ease

A.F
orec
ast
Det
ails
Clas
s II F
OM
C-Re
stric
ted
FR 4
1FR
BNY
: Blac
kboo
k, M
ay 4
, 200
6
Exh
ibit
A-2
: Det
aile
d C
omp
aris
on o
f F
RB
NY
an
d G
reen
boo
k F
orec
asts
MAR
MAY
MAR
MAY
MAR
MAY
MAR
MAY
MAR
MAY
MAR
MAY
REAL
GDP
(Q4/
Q4)
3.2
3.2
3.6
3.6
3.2
3.3
3.3
3.2
3.8
3.8
3.1
3.0
GRO
WTH
CO
NTRI
BUTI
ONS
(Q4/
Q4)
FI
NAL
SALE
S TO
DO
MES
TIC
PURC
HASE
RS3.
63.
53.
94.
03.
73.
83.
53.
54.
14.
23.
33.
2CO
NSUM
PTIO
N2.
12.
12.
72.
72.
22.
22.
12.
12.
72.
82.
32.
2BF
I0.
70.
71.
11.
11.
11.
10.
70.
70.
91.
00.
70.
7 S
TRUC
TURE
S0.
00.
00.
10.
10.
10.
10.
00.
00.
20.
30.
10.
2
EQ
UIPM
ENT
& SO
FTW
ARE
0.7
0.7
1.0
1.0
0.9
0.9
0.7
0.7
0.7
0.7
0.6
0.5
RESI
DENT
IAL
INVE
STM
ENT
0.4
0.4
-0.3
-0.3
-0.1
-0.1
0.4
0.4
0.1
0.0
0.0
0.0
GO
VERN
MEN
T0.
30.
30.
50.
60.
50.
60.
30.
30.
40.
40.
30.
3 F
EDER
AL0.
20.
20.
20.
30.
20.
20.
20.
20.
20.
20.
00.
0 S
TATE
& L
OCA
L0.
10.
10.
30.
20.
40.
40.
10.
10.
20.
20.
30.
3
IN
VENT
ORY
INVE
STM
ENT
-0.2
-0.1
0.1
0.1
0.0
0.0
-0.1
-0.1
0.0
0.0
0.2
0.1
NE
T EX
PORT
S-0
.2-0
.2-0
.5-0
.6-0
.5-0
.5-0
.2-0
.2-0
.3-0
.3-0
.4-0
.3
INFL
ATIO
N/PR
ODU
CTIV
ITY/
WAG
ES (Q
4/Q
4)
GDP
DEF
LATO
R3.
13.
12.
12.
32.
12.
23.
13.
12.
52.
62.
12.
3PC
E3.
03.
02.
22.
52.
02.
03.
03.
02.
02.
51.
92.
0CO
RE P
CE1.
92.
02.
12.
21.
81.
91.
92.
02.
12.
21.
92.
0
COM
PENS
ATIO
N PE
R HO
UR3.
83.
84.
44.
74.
64.
63.
83.
75.
25.
25.
35.
4O
UTPU
T PE
R HO
UR2.
52.
52.
92.
93.
02.
82.
52.
52.
82.
83.
13.
1UN
IT L
ABO
R CO
STS
1.3
1.3
1.5
1.8
1.6
1.8
1.3
1.2
2.3
2.2
2.1
2.3
EMPL
OYM
ENT
VARI
ABLE
SUN
EMPL
OYM
ENT
RATE
(Q4
LEVE
L)5.
05.
04.
74.
74.
74.
75.
05.
04.
84.
84.
95.
0PA
RTIC
IPAT
ION
RATE
(Q4
LEVE
L)66
.166
.166
.166
.166
.166
.166
.166
.166
.066
.065
.865
.8
NONF
ARM
PAY
ROLL
EM
PLO
YMEN
T (Q
4/Q
4 CH
ANG
E) T
OTA
L, IN
THO
USAN
DS19
1719
1720
5418
6712
2915
1419
0019
0020
0019
0010
0090
0 A
VERA
GE
PER
MO
NTH,
IN T
HOUS
ANDS
160
160
171
156
102
126
158
158
167
158
8375
FINA
NCIA
L M
ARKE
T VA
RIAB
LES
FED
FUND
S RA
TE (P
ERCE
NT)
3.97
3.97
5.00
5.00
4.75
5.00
4.25
4.25
5.00
5.00
4.75
5.00
BAA
BOND
YIE
LD (P
ERCE
NT)
6.3
6.3
6.6
7.0
6.6
7.0
6.3
6.3
6.5
6.7
6.5
6.7
EFFE
CTIV
E EX
CHAN
GE R
ATE
(Q4/
Q4
% C
HANG
E)-1
.0-1
.4-3
.1-4
.0-1
.5-1
.52.
62.
6-2
.4-4
.4-1
.3-1
.9
2007
Boar
d20
0720
0520
0620
0520
06FR
BNY
FRB
NY
- cl
eare
d fo
r rel
ease

A.F
orec
ast
Det
ails
Clas
s II F
OM
C-Re
stric
ted
FR 4
2FR
BNY
: Blac
kboo
k, M
ay 4
, 200
6
Exh
ibit
A-3
: Ju
dg
men
t T
able
NO
TE:
All
serie
s ot
her t
han
inte
rest
rate
s an
d th
e fe
dera
l def
icit
are
seas
onal
ly a
djus
ted.
Ita
lics
indi
cate
a re
port
ed v
alue
.1\
Gro
wth
con
trib
utio
n to
real
GD
P 2\
Annu
al v
alue
s ar
e en
d of
Q4
leve
ls 3
\In
clud
es d
omes
tic a
nd im
port
ed a
uto
and
light
truc
k sa
les
4\Ye
arly
num
bers
are
bas
ed o
n th
e fis
cal y
ear
2005
:01
2005
:02
2005
:03
2005
:04
2006
:01
2006
:02
2006
:03
2006
:04
2007
:01
2007
:02
2007
:03
2007
:04
2004
2005
2006
2007
REAL
GD
P AN
D C
OM
PONE
NTS
(% C
hang
e, A
R)
G
DP…
……
……
……
……
……
..……
……
……
……
……
…..…
……
……
……
3.8
3.3
4.1
1.7
4.8
3.1
3.5
3.0
3.2
3.2
3.4
3.4
3.8
3.2
3.6
3.3
C
HANG
E IN
INVE
NTO
RIE
S
(GR
OW
TH C
ONT
RIB
UTIO
N) 1
\……
…0.
3-2
.1-0
.41.
9-0
.50.
90.
20.
00.
00.
00.
00.
10.
2-0
.10.
10.
0
D
OM
ESTI
C P
RIV
ATE
PUR
CHA
SES…
……
……
……
……
……
..……
…4.
02.
14.
02.
95.
43.
43.
73.
33.
53.
53.
73.
64.
53.
23.
93.
6
CO
NSUM
PTIO
N EX
PEND
ITUR
ES…
……
……
……
……
……
..……
…3.
53.
44.
10.
95.
53.
03.
53.
33.
23.
23.
23.
23.
82.
93.
83.
2
BUS
INES
S FI
XED
INVE
STM
ENT…
……
……
……
……
……
..……
…5.
78.
88.
44.
514
.37.
89.
69.
910
.110
.29.
48.
710
.96.
810
.49.
6
RES
IDEN
TIAL
INVE
STM
ENT…
……
……
……
……
……
..……
……
…9.
510
.87.
32.
82.
6-1
0.0
-5.0
-6.0
-6.0
-3.0
0.0
2.0
6.6
7.6
-4.7
-1.8
N
ET E
XPO
RTS
(GR
OW
TH C
ONT
RIB
UTIO
N) 1
\.....
......
......
......
......
......
..-0
.41.
1-0
.1-1
.4-0
.8-0
.4-0
.5-0
.5-0
.5-0
.5-0
.5-0
.5-0
.9-0
.2-0
.6-0
.5
EXP
OR
TS
……
……
……
……
……
…..…
……
……
……
……
……
..…7.
510
.72.
55.
012
.13.
05.
55.
96.
56.
86.
56.
56.
16.
46.
66.
6
IM
POR
TS
……
……
……
……
……
…..…
……
……
……
……
……
..……
7.4
-0.2
2.4
12.1
13.0
4.5
6.2
6.8
7.1
7.2
7.1
7.0
10.6
5.3
7.6
7.1
F
EDER
AL G
OVE
RNM
ENT…
……
……
……
……
……
..……
……
……
……
2.3
2.4
7.5
-2.6
10.8
2.0
4.0
2.0
6.0
2.0
4.0
2.0
4.2
2.3
4.6
3.5
S
TATE
& L
OC
AL G
OVE
RNM
ENTS
……
……
……
……
……
…..…
……
…1.
62.
60.
20.
30.
02.
03.
03.
03.
03.
03.
03.
00.
91.
22.
03.
0
INTE
REST
RAT
E AS
SUM
PTIO
NS (%
)
FED
ERAL
FUN
DS
RAT
E (T
ARG
ET).…
……
……
……
……
……
..……
……
…2.
442.
923.
433.
974.
434.
895.
005.
005.
005.
005.
005.
001.
943.
975.
005.
00
YIEL
D O
N 10
-YR
GO
VER
NMEN
T…..…
……
……
……
……
……
..……
……
…4.
34.
24.
24.
54.
65.
15.
35.
35.
35.
35.
35.
34.
24.
55.
35.
3
BAA
BOND
YIE
LD…
……
……
……
……
……
……
……
……
……
……
……
…6.
06.
06.
06.
36.
36.
97.
07.
07.
07.
07.
07.
06.
26.
37.
07.
0
INC
OM
E (%
Cha
nge,
AR)
PER
SONA
L IN
CO
ME…
……
……
……
……
……
..……
……
……
……
……
…..
2.0
4.5
2.6
9.4
6.2
6.5
7.3
4.2
6.3
6.6
7.3
4.6
7.5
4.6
6.0
6.2
REA
L PE
RSO
NAL
DIS
POSA
BLE
INC
OM
E……
……
……
..……
……
…-3
.40.
2-1
.46.
73.
22.
65.
21.
84.
24.
75.
42.
54.
10.
53.
24.
2
PER
SONA
L SA
VING
RAT
E (%
OF
DPI
)……
……
……
……
……
…..…
……
0.5
-0.2
-1.6
-0.2
-0.7
-0.7
-0.3
-0.7
-0.5
-0.1
0.4
0.2
1.7
-0.4
-0.6
0.0
CO
RPO
RAT
E PR
OFI
TS B
EFO
RE
TAXE
S……
……
…..…
……
……
……
…24
.519
.7-1
5.2
71.1
15.0
-0.9
-1.2
-4.0
-4.1
-2.6
-2.1
-2.9
9.6
21.3
2.0
-2.9
PRIC
ES &
PRO
DUC
TIVI
TY (%
Cha
nge,
AR)
GD
P IM
PLIC
IT D
EFLA
TOR
……
……
……
……
……
…..…
……
……
……
……
3.1
2.6
3.3
3.5
3.3
1.9
1.9
2.1
2.4
2.1
2.1
2.1
2.9
3.1
2.3
2.2
PER
SONA
L C
ONS
UMPT
ION
EXPE
NDIT
URES
……
……
……
……
……
….
2.3
3.3
3.7
2.9
2.0
3.8
2.2
2.2
2.1
1.9
2.0
1.9
3.1
3.0
2.5
2.0
CO
RE
PER
SONA
L C
ONS
UMPT
ION
EXPE
NDIT
URES
……
……
……
……
2.4
1.7
1.3
2.4
2.0
2.4
2.2
2.1
2.0
2.0
1.9
1.8
2.2
2.0
2.2
1.9
CO
NSUM
ER P
RIC
E IN
DEX
……
……
……
……
……
…..…
……
……
……
……
2.5
3.7
5.5
3.2
2.2
4.8
2.5
2.4
2.4
2.3
2.3
2.2
3.3
3.7
3.0
2.3
CO
RE
CO
NSUM
ER P
RIC
E IN
DEX
……
……
……
……
……
…..…
……
……
…2.
52.
01.
62.
42.
42.
72.
42.
42.
32.
22.
12.
12.
12.
12.
52.
2
CO
MPE
NSAT
ION
PER
HO
UR (N
ONF
ARM
BUS
INES
S)…
……
……
……
…5.
61.
35.
52.
75.
74.
14.
64.
34.
64.
64.
64.
65.
93.
84.
74.
6
OUT
PUT
PER
HO
UR (N
ONF
ARM
BUS
INES
S)…
……
……
……
……
……
..3.
82.
44.
2-0
.33.
22.
82.
82.
82.
82.
82.
82.
82.
62.
52.
92.
8
UNIT
LAB
OR
CO
ST (N
ONF
ARM
BUS
INES
S)…
……
……
……
……
……
..…1.
8-1
.01.
23.
02.
51.
31.
81.
61.
91.
91.
91.
93.
31.
31.
81.
8
REAL
AC
TIVI
TY
CAP
ACIT
Y UT
ILIZ
ATIO
N (M
ANUF
ACTU
RIN
G, %
)……
……
……
……
……
78.7
78.6
78.5
79.8
80.4
80.8
81.2
81.5
81.9
82.0
82.1
82.1
77.1
78.9
81.0
82.0
CIV
ILIA
N UN
EMP
RAT
E (%
) 2
\……
……
……
……
……
…..…
……
……
…5.
25.
15.
05.
04.
84.
74.
74.
74.
74.
74.
74.
75.
45.
04.
74.
7
PRIV
ATE
HOUS
ING
STA
RTS
(THO
US, A
R)…
……
……
……
……
……
..…20
8320
4421
0120
5921
3119
7019
3019
0018
9018
8018
7018
5019
5020
7219
8318
73
LIG
HT V
EHIC
LE S
ALES
(MIL
UNI
TS, A
R)
3 \…
……
……
……
……
……
..16
.517
.217
.915
.916
.916
.816
.816
.916
.916
.916
.917
.016
.916
.916
.816
.9
FED
ERAL
SUR
PLUS
/DEF
ICIT
(Uni
fied
Bas
is, B
il$, N
SA)
4\…
……
……
…-1
76.6
45.2
-69.
2-1
19.3
#N/A
#N/A
#N/A
#N/A
#N/A
#N/A
#N/A
#N/A
-412
.3-3
17.7
-357
.2-2
98.6
Q4/
Q4
% C
HANG
E/Q
4 LE
VEL/
ANNU
AL A
VERA
GE
FRB
NY
- cl
eare
d fo
r rel
ease

A. F
orec
ast
Det
ails
Clas
s II F
OM
C-Re
stric
ted
FR 4
3FR
BNY
: Blac
kboo
k, M
ay 4
, 200
6
Exh
ibit
A-4
: Rea
l GD
P a
nd
Com
pon
ents
(G
row
th C
ontr
ibu
tion
s)
Not
e: C
ontr
ibut
ions
may
not
add
up
to G
DP
grow
th d
ue to
roun
ding
.
Q
1Q
2Q
3Q
4Q
1Q
2Q
3Q
4Q
1Q
2Q
3Q
420
0420
0520
0620
07
R
EAL
GD
P (G
row
th, A
nnua
l Rat
e)...
......
......
......
......
....
3.8
3.3
4.1
1.7
4.8
3.1
3.5
3.0
3.2
3.2
3.4
3.4
3.8
3.2
3.6
3.3
Con
tribu
tions
to G
DP
gro
wth
:
FINA
L SA
LES
TO D
OM
ESTI
C P
URC
HASE
RS...
......
3.9
4.4
4.7
1.1
6.2
2.6
3.8
3.5
3.7
3.6
3.9
3.8
4.5
3.5
4.0
3.8
CO
NS
UM
PTI
ON
EX
PE
ND
ITU
RE
S...
......
......
2.4
2.4
2.9
0.6
3.8
2.1
2.4
2.3
2.2
2.2
2.2
2.2
2.7
2.1
2.7
22
BU
SIN
ES
S F
IXE
D IN
VE
STM
EN
T....
......
......
.0
60.
90.
90.
51.
50
81
01.
11.
11.
11.
11.
01.
10.
71.
11.
1
RE
SID
EN
TIA
L IN
VE
STM
EN
T....
......
......
......
...0
50.
60.
40.
20.
2-0
.6-0
.3-0
.4-0
.4-0
20.
00.
10.
40.
4-0
.3-0
.1
FE
DE
RA
L G
OV
ER
NM
EN
T....
......
......
......
......
..0
20.
20.
5-0
.20.
70.
10
30.
10.
40.
10.
30.
10.
30.
20.
30
2
STA
TE &
LO
CA
L G
OV
ER
NM
EN
TS...
......
......
......
.....
02
0.3
0.0
0.0
0.0
02
0.4
0.4
0.4
0.4
0.4
0.4
0.1
0.1
0.2
0.4
NET
EXPO
RTS.
......
......
......
......
......
......
......
......
......
......
.-0
.41.
1-0
.1-1
.4-0
.8-0
.4-0
.5-0
.5-0
.5-0
.5-0
.5-0
.5-0
.9-0
.2-0
.6-0
.5
EX
PO
RTS
......
......
......
......
......
......
......
......
......
......
......
...0.
71.
10.
30.
51.
20
30.
60.
60.
70.
70.
70.
70.
60.
60.
70.
7
IM
PO
RTS
......
......
......
......
......
......
......
......
......
......
......
....
-1.1
0.0
-0.4
-1.9
-2.1
-0.8
-1.1
-1.2
-12
-12
-1.2
-1.2
-1.5
-0.9
-1.3
-1.2
CHA
NGE
IN IN
VENT
ORI
ES...
......
......
......
......
......
......
..0.
3-2
.1-0
.41.
9-0
.50.
90.
20.
00.
00.
00.
00.
10.
2-0
.10.
10.
0
2006
2005
2007
Q4/
Q4
% C
HAN
GE/
Q4
LEVE
L
FRB
NY
- cl
eare
d fo
r rel
ease
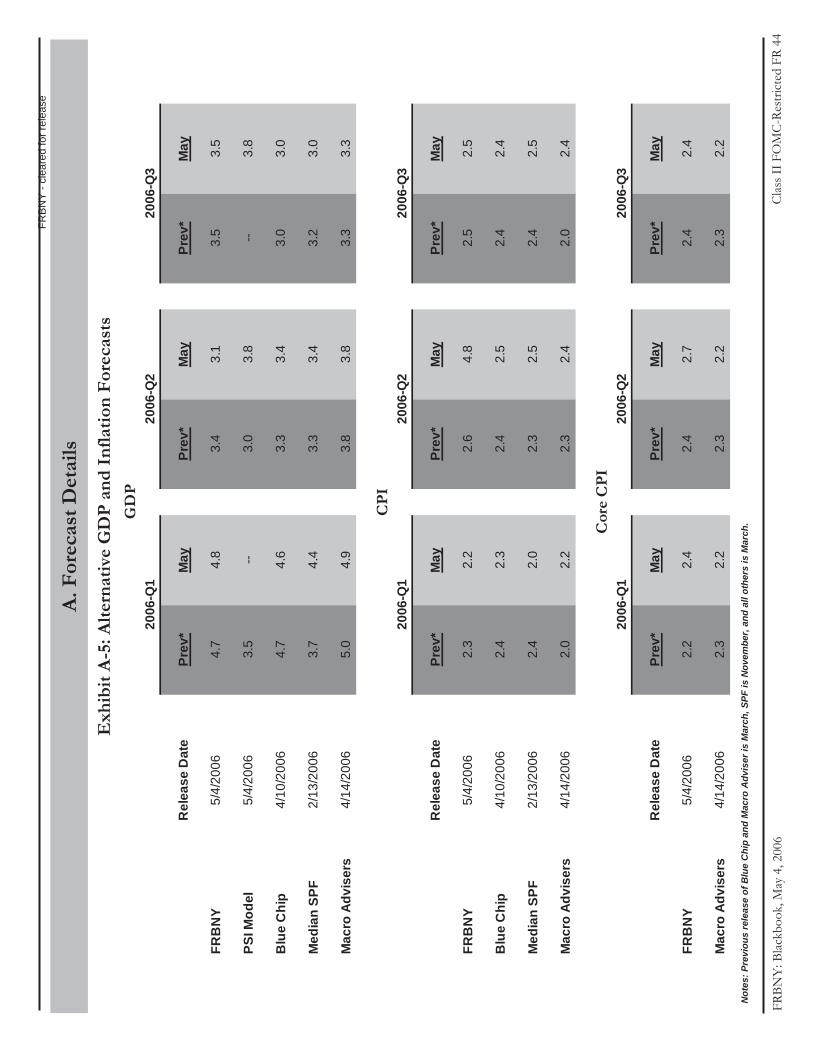
A. F
orec
ast
Det
ails
Clas
s II F
OM
C-Re
stric
ted
FR 4
4FR
BNY
: Blac
kboo
k, M
ay 4
, 200
6
Exh
ibit
A-5
: Alt
ern
ativ
e G
DP
an
d I
nfl
atio
n F
orec
asts
Not
es: P
revi
ous
rele
ase
of B
lue
Chi
p an
d M
acro
Adv
iser
is M
arch
,SPF
is N
ovem
ber,
and
all o
ther
s is
Mar
ch.
Rel
ease
Dat
ePr
ev*
May
Prev
*M
ayPr
ev*
May
FRB
NY
5/4/
2006
4.7
4.8
3.4
3.1
3.5
3.5
PSI M
odel
5/4/
2006
3.5
--3.
03.
8--
3.8
Blu
e C
hip
4/10
/200
64.
74.
63.
33.
43.
03.
0
Med
ian
SPF
2/13
/200
63.
74.
43.
33.
43.
23.
0
Mac
ro A
dvis
ers
4/14
/200
65.
04.
93.
83.
83.
33.
3
Rel
ease
Dat
ePr
ev*
May
Prev
*M
ayPr
ev*
May
FRB
NY
5/4/
2006
2.3
2.2
2.6
4.8
2.5
2.5
Blu
e C
hip
4/10
/200
62.
42.
32.
42.
52.
42.
4
Med
ian
SPF
2/13
/200
62.
42.
02.
32.
52.
42.
5
Mac
ro A
dvis
ers
4/14
/200
62.
02.
22.
32.
42.
02.
4
Rel
ease
Dat
ePr
ev*
May
Prev
*M
ayPr
ev*
May
FRB
NY
5/4/
2006
2.2
2.4
2.4
2.7
2.4
2.4
Mac
ro A
dvis
ers
4/14
/200
62.
32.
22.
32.
22.
32.
2
2006
-Q2
2006
-Q3
2006
-Q1
2006
-Q1
2006
-Q1
2006
-Q3
2006
-Q3
2006
-Q2
2006
-Q2
GD
P
CP
I
Cor
e C
PI
FRB
NY
- cl
eare
d fo
r rel
ease
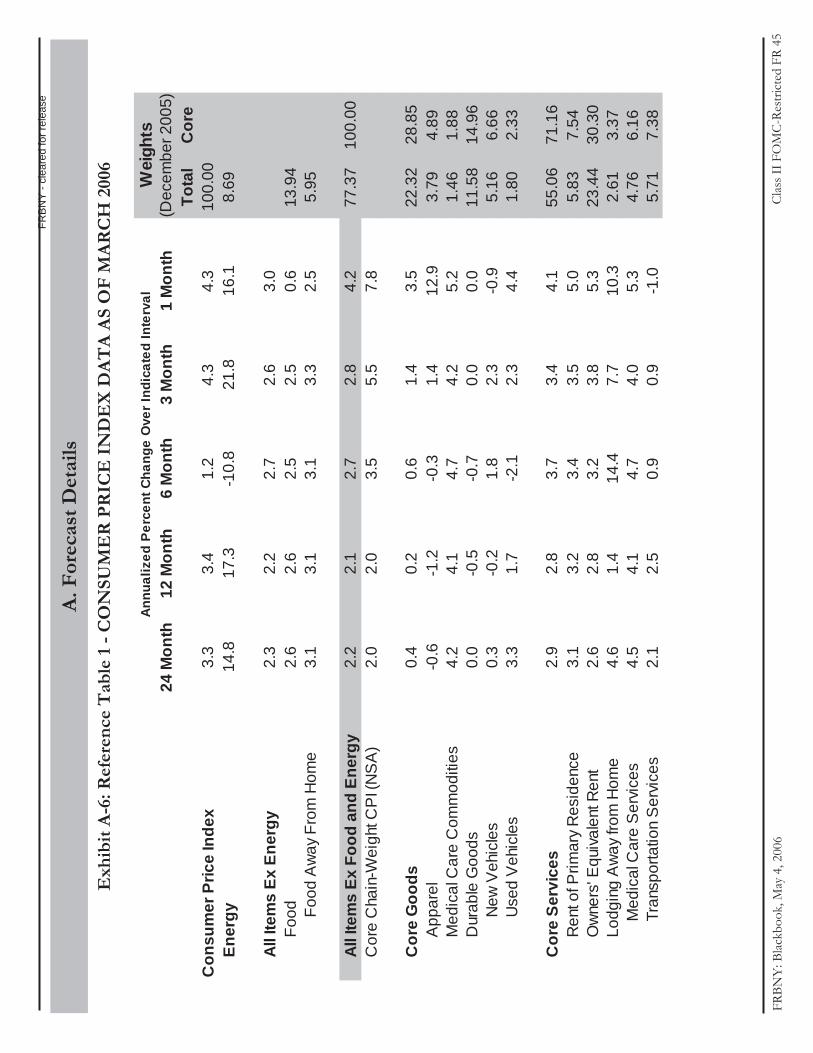
A. F
orec
ast
Det
ails
Clas
s II F
OM
C-Re
stric
ted
FR 4
5FR
BNY
: Blac
kboo
k, M
ay 4
, 200
6
Exh
ibit
A-6
: Ref
eren
ce T
able
1 -
CO
NSU
ME
R P
RIC
E I
ND
EX
DA
TA
AS
OF
MA
RC
H 2
006
24 M
onth
12 M
onth
6 M
onth
3 M
onth
1 M
onth
Tota
lC
ore
Con
sum
er P
rice
Inde
x 3.
33.
41.
24.
34.
310
0.00
E
nerg
y14
.817
.3-1
0.8
21.8
16.1
8.69
A
ll Ite
ms
Ex E
nerg
y 2.
32.
22.
72.
63.
0
Foo
d 2.
62.
62.
52.
50.
613
.94
Fo
od A
way
Fro
m H
ome
3.1
3.1
3.1
3.3
2.5
5.95
A
ll Ite
ms
Ex F
ood
and
Ener
gy2.
22.
12.
72.
84.
277
.37
100.
00
Cor
e C
hain
-Wei
ght C
PI (
NS
A)
2.0
2.0
3.5
5.5
7.8
C
ore
Goo
ds0.
40.
20.
61.
43.
522
.32
28.8
5
App
arel
-0.6
-1.2
-0.3
1.4
12.9
3.79
4.89
M
edic
al C
are
Com
mod
ities
4.2
4.1
4.7
4.2
5.2
1.46
1.88
D
urab
le G
oods
0.0
-0.5
-0.7
0.0
0.0
11.5
814
.96
N
ew V
ehic
les
0.3
-0.2
1.8
2.3
-0.9
5.16
6.66
U
sed
Veh
icle
s3.
31.
7-2
.12.
34.
41.
802.
33
C
ore
Serv
ices
2.9
2.8
3.7
3.4
4.1
55.0
671
.16
R
ent o
f Prim
ary
Res
iden
ce3.
13.
23.
43.
55.
05.
837.
54
Ow
ners
' Equ
ival
ent R
ent
2.6
2.8
3.2
3.8
5.3
23.4
430
.30
L
odgi
ng A
way
from
Hom
e4.
61.
414
.47.
710
.32.
613.
37
M
edic
al C
are
Ser
vice
s4.
54.
14.
74.
05.
34.
766.
16
T
rans
porta
tion
Ser
vice
s2.
12.
50.
90.
9-1
.05.
717.
38
(Dec
embe
r 200
5)An
nual
ized
Per
cent
Cha
nge
Ove
r Ind
icat
ed In
terv
al
Wei
ghts
FRB
NY
- cl
eare
d fo
r rel
ease

A. F
orec
ast
Det
ails
Clas
s II F
OM
C-Re
stric
ted
FR 4
6FR
BNY
: Blac
kboo
k, M
ay 4
, 200
6Exh
ibit
A-6
: Ref
eren
ce T
able
2 -
PC
E D
EF
LA
TO
R D
AT
A A
S O
F M
AR
CH
200
6
24 M
onth
12 M
onth
6 M
onth
3 M
onth
1 M
onth
PCE
Def
lato
r 2.
82.
91.
43.
74.
4M
arke
t Bas
ed P
CE
Def
lato
r2.
62.
81.
03.
64.
6
D
urab
le G
oods
-0.9
-1.4
-1.0
-0.8
-1.8
M
otor
Veh
icle
s an
d P
arts
1.7
0.8
2.8
2.7
1.9
N
ondu
rabl
e G
oods
3.3
3.4
-2.0
6.1
9.0
C
loth
ing
and
Sho
es
-0.9
-1.8
0.1
1.6
15.8
S
ervi
ces
3.2
3.4
3.6
3.4
3.5
H
ousi
ng
2.8
2.7
3.7
3.9
5.3
T
rans
porta
tion
3.3
4.1
3.3
3.6
2.9
M
edic
al C
are
2.9
2.7
2.8
2.6
4.7
P
CE
Def
lato
r Ex
Food
and
Ene
rgy
2.0
2.0
2.4
2.5
3.9
M
arke
t Bas
ed C
ore
PCE
Def
lato
r 1.
71.
62.
02.
24.
0
P
erso
nal B
usin
ess
Ser
vice
s-M
arke
t Bas
ed2.
42.
01.
6-0
.4-1
.6
Per
sona
l Bus
ines
s S
ervi
ces-
Not
Mar
ket B
ased
2.6
2.8
2.3
1.9
1.8
Annu
aliz
ed P
erce
nt C
hang
e O
ver I
ndic
ated
Inte
rval
FRB
NY
- cl
eare
d fo
r rel
ease
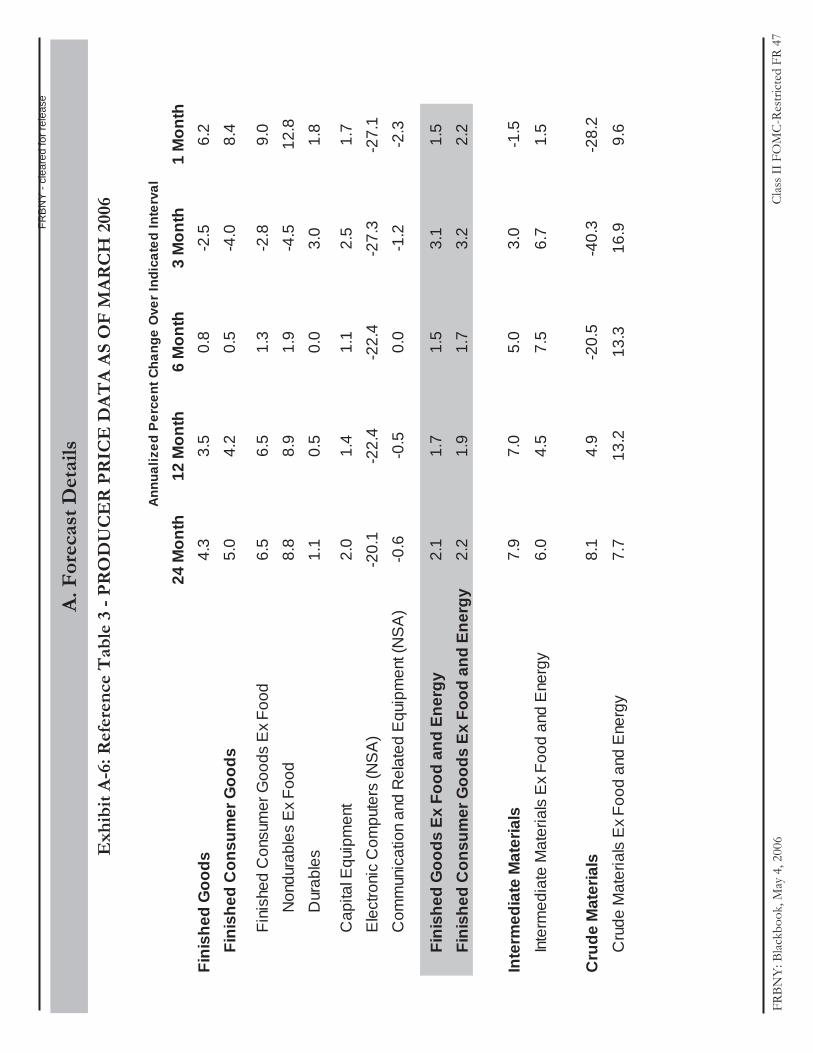
A. F
orec
ast
Det
ails
Clas
s II F
OM
C-Re
stric
ted
FR 4
7FR
BNY
: Blac
kboo
k, M
ay 4
, 200
6
Exh
ibit
A-6
: Ref
eren
ce T
able
3 -
PR
OD
UC
ER
PR
ICE
DA
TA
AS
OF
MA
RC
H 2
006
24 M
onth
12 M
onth
6 M
onth
3 M
onth
1 M
onth
Fini
shed
Goo
ds4.
33.
50.
8-2
.56.
2
Fin
ishe
d C
onsu
mer
Goo
ds5.
04.
20.
5-4
.08.
4
F
inis
hed
Con
sum
er G
oods
Ex
Food
6.5
6.5
1.3
-2.8
9.0
N
ondu
rabl
es E
x Fo
od8.
88.
91.
9-4
.512
.8
Dur
able
s1.
10.
50.
03.
01.
8
C
apita
l Equ
ipm
ent
2.0
1.4
1.1
2.5
1.7
E
lect
roni
c C
ompu
ters
(NS
A)
-20.
1-2
2.4
-22.
4-2
7.3
-27.
1
Com
mun
icat
ion
and
Rel
ated
Equ
ipm
ent (
NS
A)
-0.6
-0.5
0.0
-1.2
-2.3
F
inis
hed
Goo
ds E
x Fo
od a
nd E
nerg
y2.
11.
71.
53.
11.
5
Fin
ishe
d C
onsu
mer
Goo
ds E
x Fo
od a
nd E
nerg
y2.
21.
91.
73.
22.
2
Inte
rmed
iate
Mat
eria
ls7.
97.
05.
03.
0-1
.5
I
nter
med
iate
Mat
eria
ls E
x Fo
od a
nd E
nerg
y6.
04.
57.
56.
71.
5
Cru
de M
ater
ials
8.1
4.9
-20.
5-4
0.3
-28.
2
C
rude
Mat
eria
ls E
x Fo
od a
nd E
nerg
y7.
713
.213
.316
.99.
6
Annu
aliz
ed P
erce
nt C
hang
e O
ver I
ndic
ated
Inte
rval
FRB
NY
- cl
eare
d fo
r rel
ease


FRBNY: Blackbook, May 4, 2006 Confidential(FR) Class II FOMC 49
Exhibit B-1. TIPS Implied Inflation at Various Horizons
The first chart in this exhibit displays the time series of implied expected CPI inflation
from the TIPS market (a non–technical description of the construction of this measure is
in Appendix to Exhibit B-1 below). The second chart shows the computed change in
carry-adjusted measures from January 30th to March 23rd.
Source: Capital Markets Function, FRBNY
Exhibit B-2. Breakeven Inflation Table
The breakeven inflation table reports yields on the most recently issued five- and ten-year
nominal Treasury securities and Treasury inflation indexed securities as well as the
spreads between comparable maturities.
Source: Capital Markets Function, FRBNY
Exhibit B-3. Smoothed Treasury Yield Curve and Implied Forward Rate Curve
The five charts in this exhibit are: (1) the path of the 3-month and 10-year Treasury rates
since March 2003; (2) the smoothed (off-the-run) Treasury yield curve on December 12
(prior to the December FOMC meeting), January 30 (prior to the January FOMC
meeting), and March 24 (current); (3) the implied forward rate curve for the same three
dates; (4) the path of the implied 4-5 year nominal and real forward rate since March
2004; and (5) the path of the implied 4-5 nominal forward rate and inflation
compensation since March 2004.
Source: Capital Markets Function, FRBNY; Monetary Affairs, BofG
Exhibit B-4. Expected Path of Fed Funds Target Rate Derived from Futures
The chart in this exhibit shows the changes in expected path of the Fed Funds target rate
since the last FOMC meeting, derived from Fed Funds and Eurodollar futures. A constant
term premium risk adjustment is made in these calculations but there is no allowance for
time-varying risk.
Source: MMS Function, FRBNY chart; Monetary Affairs, BofG data
B. Financial Markets
FRBNY - cleared for release

FRBNY: Blackbook, May 4, 2006 Confidential(FR) Class II FOMC 50
Exhibit B-5. Implied Skewness and Implied Volatility (percentages)
The chart in this exhibit shows the recent behavior of a measure of implied skewness
derived from Eurodollar options. Positive (negative) implied skewness means that a
tightening (easing) surprise around expected rate is expected to be larger than an easing
(tightening) surprise. In addition, implied volatility in percentages is plotted. Both
measures are averages of 3-, 6- and 9-month values. No risk adjustment is made.
Source: Capital Markets Function, FRBNY
Exhibit B-6. Implied Volatility on Eurodollar Options (Basis Points)
The charts in this exhibit show the current and historical behavior of the 90% confidence
interval (i.e., financial markets expect 90% of the time the actual FFR at the specified
date will be within the interval) for the Fed Funds Target implied from financial markets
options. The first two charts show how the 90% confidence interval has changed since
the last FOMC meeting. The next chart shows the current confidence interval around the
expected path. The final two charts show a long history of the behavior of the confidence
interval at the 6- and 12-month horizons. No risk adjustment is made.
Source: Monetary Affairs, BofG
Exhibit B-7. Dollar Exchange Rates
This exhibit contains four charts showing the behavior of the dollar in the last five years.
All series are defined so that a decline in the index represents a depreciation of the dollar.
Effective rates are computed by the Board of Governors using a “narrow” set of weights,
for 16 major exchange rates.
Source: BofG; BIS; International Research Function, FRBNY
Exhibit B-8. Implied Volatility on Yen/Dollar and Euro/Dollar Exchange Rates
The first set of charts in this exhibit contains the one month ahead implied volatility on
Yen/Dollar and Euro/Dollar exchange rates as measured by the width of a 90 percent
confidence interval. The second set of charts show the change in the expected implied
volatility over the next six months.
Source: Markets Group, FRBNY; Reuters
FRBNY - cleared for release

FRBNY: Blackbook, May 4, 2006 Confidential(FR) Class II FOMC 51
Exhibit B-9. Energy Futures Curves
This exhibit contains charts showing futures curves for gasoline, heating oil, natural gas,
and crude oil. August 26 represents the state of the futures markets just before Hurricane
Katrina. December 7 represents the state of the markets prior to the December FOMC
meeting, January 27 represents the state prior to the January FOMC meeting, and March
23 represents current data.
Source: Bloomberg.
Appendix to Exhibit B-1. Construction of Implied Inflation from TIPS
The implied inflation series are estimates of the inflation expectations derived from TIPS
and nominal Treasury securities, not accounting for risk premia or other technical factors.
They differ from the simpler breakeven inflation rates which just subtract the real yield
on TIPS securities from the on-the-run treasury yield with the same maturity. For each
individual TIPS, we solve for the inflation rate that equates the discounted payments of
the TIPS to its price, where the discount rates are derived from off-the-run nominal
Treasury securities. We then calculate two-, three-, and five-year inflation rates as the
inflation rate corresponding to a TIPS with duration of two, three or five years
respectively. Finally, we compute approximate forward rates from the rates at the shorter-
and longer-dated durations. For example, the two-to-three year forward rate is computed
from the two-year and three-year implied inflation values. The five-to-ten year forward
rate uses the five-year implied inflation value and the implied inflation rate on the most
recently issued ten-year TIPS.
The carry-adjusted implied inflation series are measures of inflation expectations that
remove the impact of forecast inflation accrual in NSA CPI over the 2.5 month
indexation lag period in TIPS. Since inflation over that period is either known or largely
predictable, it induces predictable variation in the unadjusted implied inflation series that
is not necessarily related to future expected inflation. Our adjustment is derived from the
forecast of NSA CPI implicit in same day CME CPI futures contracts.
FRBNY - cleared for release


FRBNY: Blackbook, May 4, 2006 Confidential(FR) Class II FOMC 53
Real and Nominal Yield Spreads31-Jan-05 30-Nov-05 30-Dec-05 31-Jan-06 28-Feb-06 31-Mar-06 28-Apr-06 4-May-06
Five-year Spread (%) 2.55 2.37 2.23 2.52 2.68 2.58 2.65 2.72Ten-year Spread 2.48 2.37 2.31 2.51 2.54 2.51 2.64 2.68
Five-year Real Yield (%) 1.17 2.01 2.08 1.94 1.95 2.23 2.31 2.32Ten-year Real Yield 1.67 2.09 2.04 2.03 2.03 2.34 2.45 2.48Five-year Nominal Yield 3.72 4.38 4.31 4.46 4.63 4.81 4.96 5.04Ten-year Nominal Yield 4.15 4.46 4.35 4.54 4.57 4.85 5.09 5.16Source: FRBNY. 8:40am quotes.
B. Financial Markets
Exhibit B-2: Breakeven Inflation Table
FRBNY - cleared for release

FRBNY: Blackbook, May 4, 2006 Confidential(FR) Class II FOMC 54
0
1
2
3
4
5
6
May-03 Oct-03 Apr-04 Sep-04 Mar-05 Aug-05 Feb-060
1
2
3
4
5
6
Short- and Long-Term RatesPercentPercent
10-Year Treasury
3-Month Treasury
Note: Yields of on-the-run securitiesSource: Bloomberg
4.3
4.5
4.7
4.9
5.1
5.3
5.5
5.7
5.9
0 1 2 3 4 5 6 7 8 9 104.3
4.5
4.7
4.9
5.1
5.3
5.5
5.7
5.9
Source: 8:40AM quotes and FRBNY Calculations
Percent Percent
January 30
May 4
Treasury Yield Curves
Maturity (Years)
March 27
Note: Estimated using off-the-run securities
4.3
4.5
4.7
4.9
5.1
5.3
5.5
5.7
5.9
0 1 2 3 4 5 6 7 8 9 104.3
4.5
4.7
4.9
5.1
5.3
5.5
5.7
5.9
Source: 8:40AM quotes and FRBNY Calculations
Percent Percent
January 30
May 4
Treasury Yield Curves: Implied One-Year Forward Rates
Maturity (Years)
March 27
Note: Estimated using off-the-run securities
1.5
2.5
3.5
4.5
5.5
May-03 Oct-03 Apr-04 Oct-04 Apr-05 Sep-05 Mar-061.5
2.5
3.5
4.5
5.5
4-5 Year Forward RatesPercentPercent
Nominal
Real
Source: 8:40AM quotes; CPI and CME CPI futures; and FRBNY calculations
Note: Carry-adjusted data from 3/17/04. Data from 8/19/05-8/31/05 unavailable.
B. Financial Markets
Exhibit B-3: Interest Rates
FRBNY - cleared for release


FRBNY: Blackbook, May 4, 2006 Confidential(FR) Class II FOMC 56
B. Financial Markets
Exhibit B-6: Implied Volatility on Fed Funds Options
FRBNY - cleared for release

FRBNY: Blackbook, May 4, 2006 Confidential(FR) Class II FOMC 57
B. Financial Markets
Exhibit B-7: United States Exchange Rates
0.7
0.8
0.9
1
1.1
1.2
1.3
1.4
2000 2001 2002 2003 2004 2005 20060.7
0.8
0.9
1
1.1
1.2
1.3
1.4
Source: Reuters
Euros per Dollar
Dollars per Euro
Ratio Ratio
Dollar-Euro Exchange Rates
100
105
110
115
120
125
130
135
140
2000 2001 2002 2003 2004 2005 2006100
105
110
115
120
125
130
135
140
Source: Reuters
Ratio Ratio
Yen per Dollar
75
80
85
90
95
100
105
110
115
2000 2001 2002 2003 2004 2005 200675
80
85
90
95
100
105
110
115
Source: Reuters
Ratio Ratio
Nominal Effective Exchange RateMajor Currency Narrow Index, 2000=100
75
80
85
90
95
100
105
110
115
2000 2001 2002 2003 2004 2005 200675
80
85
90
95
100
105
110
115
Source: Reuters
Ratio Ratio
Real Effective Exchange RateMajor Currency Narrow Index, 2000=100
FRBNY - cleared for release

FRBNY: Blackbook, May 4, 2006 Confidential(FR) Class II FOMC 58
6 5
7
7 5
8
8 5
9
9 5
10
May-05 Jul-05 Oct-05 Jan-06 Apr-066.5
7
7.5
8
8.5
9
9.5
10
Source: Reuters
One-Month Volatility – Past YearPercentage points
Width of a 90% Confidence Interval
Percentage points
6 5
7
7 5
8
8 5
9
9 5
Feb-06 Mar-06 Apr-06 May-066.5
7
7.5
8
8.5
9
9.5
Source: Reuters
One-Month Volatility – Past 60 DaysPercentage points
Width of a 90% Confidence Interval
Percentage points
-1
-0.5
0
0.5
1
1.5
May-05 Jul-05 Oct-05 Jan-06 Apr-06-1
-0.5
0
0 5
1
1 5
Source: Reuters
Changes in Expected Volatility – Past YearPercent
Difference between 6-Month and 1-Month Option Volatility
Percent
-1
-0.5
0
0.5
1
1.5
Feb-06 Mar-06 Apr-06 May-06-1
-0.5
0
0.5
1
1.5
Source: Reuters
Changes in Expected Volatility – Past 60 DaysPercent
Difference between 6-Month and 1-Month Option Volatility
Percent
B. Financial Markets
Exhibit B-8: Euro and Yen Implied Option Volatility
Euro options are in red and Yen options are in blue
FRBNY - cleared for release

FRBNY: Blackbook, May 4, 2006 Confidential(FR) Class II FOMC 59
1.6
1.7
1.8
1.9
2
2.1
Sep-05 Jan-06 May-06 Sep-06 Jan-071 6
1.7
1 8
1 9
2
2.1
Source: Bloomberg
Gasoline Futures$/gallon
January 30
$/gallon
May 3
Months Forward
March 27
August 26
1.7
1.8
1.9
2
2.1
2.2
2.3
Sep-05 Jan-06 May-06 Sep-06 Jan-07 May-071.7
1.8
1.9
2
2.1
2.2
2.3
Source: Bloomberg
Heating Oil Futures$/gallon
January 30
$/gallon
May 3
Months Forward
March 27
August 26
6
7
8
9
10
11
12
13
Sep-05 Mar-06 Sep-06 Mar-07 Sep-07 Mar-08 Sep-08 Mar-096
7
8
9
10
11
12
13
Source: Bloomberg
Natural Gas Futures$/MMBtu
January 30
$/MMBtu
May 3
Months Forward
March 27August 26
64
66
68
70
72
74
76
Sep-05 Mar-06 Sep-06 Mar-07 Sep-07 Mar-0864
66
68
70
72
74
76
Source: Bloomberg
Crude Oil Futures$/Barrel
January 30
$/Barrel
May 3
Months Forward
March 27
August 26
B. Financial Markets
Exhibit B-9: Energy Futures Curves
FRBNY - cleared for release

FRBNY: Blackbook, May 4, 2006 Confidential(FR) Class II FOMC 60
Background
The FRBNY forecast distributions are a generalization of techniques used at the Bank of
England and other central banks to show future uncertainties and the balance of risks.
The generalization allows for a dynamic balance of risks that is jointly assessed over
inflation and output. There are two classes of shocks to current central projections that
are of interest to central banks: supply shocks, which move inflation and output in
opposite directions; and demand shocks, which move inflation and output in the same
direction. Instead of providing a static assessment of the risks we use a dynamic one that
allows the probability of a deviation to build over time. After a deviation, it is assumed
that the economy returns to its average long run behavior centered at the implicit inflation
target and potential growth. Although this is not a substitute for a dynamic model with an
explicit transmission mechanism for monetary policy, it can have good properties in
mimicking the behavior of an economy where the central bank has sufficient credibility
to achieve its long-run inflation target while pursuing short-run stabilization policy.
Exhibit C-1: Risks
This exhibit shows the “balance of risks” for the individual alternative scenarios listed in
Section 3 (“FRBNY Alternative Scenarios and Risks”) and the central scenario contained
in the Bank’s forecast. Two types of measures of the balance of risks are shown. One
type indicates the probability of being in a particular scenario at a specific date. These
scenarios are mutually exclusive so at any specific date they add up to one.
A second type calculates the probability of being in a particular scenario at any time
through 2008. The one exception is for the central scenario, where the probability shown
is for not deviating from this scenario at any time through 2008. Hence, one minus this
latter probability is the risk of deviating from the central scenario at some point over the
forecast horizon and this is equal to the sum of the probabilities of the other scenarios
occurring.
C. FRBNY Forecast Distributions
FRBNY - cleared for release

FRBNY: Blackbook, May 4, 2006 Confidential(FR) Class II FOMC 61
Exhibit C-2 & C-3: Alternative Scenarios
These exhibits take the balance of risks for each scenario and show their implications for
GDP growth and core PCE inflation. They plot the expected path (calculated by
averaging all paths that have at least one quarter in that scenario) of four-quarter changes
in the core PCE deflator and real GDP under the central scenario and the alternative
scenarios.
The global deflation scenario assumes that output growth is slower than the central
scenario and inflation is dramatically lower. The overheating scenario assumes that for
two quarters the economy grows quicker than expected under the central scenario, with
both inflation and output higher than our central forecast. Then the real economy slows
dramatically but inflation continues to be above the central forecast.
Exhibit C-4 & C-5: Fan Charts
Fan charts are shown for the core PCE deflator [Exhibit C-4] and real GDP growth
[Exhibit C-5]. These charts are constructed to represent the overall uncertainty contained
in our main scenario and alternative scenarios. They combine the information contained
in the previous exhibits with the additional uncertainty that we cannot predict perfectly
the path of the economy, even if we knew which scenario was true. The amount of total
uncertainty in the forecast distributions is now calibrated to imply fundamental interest
rate volatility lower than that given by the implied Eurodollar forward volatility curve
averaged across possible policy rules from a market perspective (see the text for Exhibit
D-4 ). In addition the expected value for each of the two forecast distributions is included
in the fan chart. These expected values are computed as averages over the realizations
across all possible scenarios considered in Exhibit C-1.The difference between this
profile and the central bank scenario is another measure of the balance of risks. If they
are equal the risks are balanced; if the expected value is above the central bank scenario,
there is upside risk; if it is below, there is downside risk.
Source: MMS Function, FRBNY
FRBNY - cleared for release


FRBNY: Blackbook, May 4, 2006 Confidential(FR) Class II FOMC 63
The exhibits in this section are constructed using the baseline specification, and two
modifications, of the policy rule detailed below, the Bank forecast distribution, and
information from Fed Funds futures and Eurodollar futures. The policy rules convert the
uncertainty over future inflation and output into uncertainty about future values of the
Fed Funds rate. This allows us to use information from financial markets to calibrate the
type and amount of uncertainty.
In all specifications the policy rate responds to deviation of inflation from target and
output from potential, and incorporates some degree of inertia. We draw the future paths
of these deviations from the forecast distribution of inflation and output (we specify an
implicit inflation target of 1.5%, and assume potential output growth is 3.3%.
The two modifications of the baseline rule that we use in this cycle, labeled Pause and
Inflation Hawk, are obtained as follows.
The “pause” is obtained as follows. We compute the level of the FFR implied by our
baseline Taylor rule, given the realizations of inflation and output gap, and imputing
4.9% as initial value for the forecast (this is the assumed average for the FFR in 2006-
Q2). We denote this rate as r* and then apply the mapping described in the table below to
produce a policy rate for the last two quarters of 2006.
D. FRBNY Fed Funds Rate Projections
FRBNY - cleared for release

FRBNY: Blackbook, May 4, 2006 Confidential(FR) Class II FOMC 64
Standard
Policy Rule
Prescription
Average FFR in
2006Q3
Average FFR in
2006Q4
r* < 3.00 4.0 r*
3.00 < r* <
3.75 4.0 4.0
3.75 < r* <
4.00 4.5 4.5
4.00 < r* <
4.25 4.75 4.75
4.25 < r* < 4.5 4.75 4.75
4.5 < r* < 4.75 5.0 4.75
4.75 < r* <
5.00 5.0 5.0
5.0 < r*<5.25 5.0 5.0
5.25< r*<5.5 5.0 5.25
5.5< r*<5.75 5.0 5.5
5.75<r*<6 5.25 5.5
r*>6 5.25 r*
The “inflation hawk” policy rule follows the “pause” rule in 2006Q3 if four-quarter core
PCE inflation remains below 2.1% but increases the FFR twice by 25 basis points in June
and August if its does not. In 2006Q4 the prescription of the standard policy rule (with
initial condition from the inflation hawk rule from the previous quarter is followed)
unless inflation remains above 2.1%. Then the maximum of 5.75% or the prescription of
the standard policy rule is followed.
FRBNY - cleared for release

FRBNY: Blackbook, May 4, 2006 Confidential(FR) Class II FOMC 65
Exhibit D-1: Implications of Different Policy Rules for Nominal Fed Funds Rate
Exhibit D-1 shows the expected path of the FFR under the three rules described, together
with the most recent implied market path from Exhibit B-5.
The paths under each rule are constructed by evaluating the policy rule at each of the
draws from the forecast distribution of output and inflation and then averaging them to
produce an expected path under that particular rule.
Exhibit D-2 & D-3: Alternative Forecast Scenarios: Nominal and Real Federal Funds Rate
In these exhibits, we focus on the policy rule “pause” and evaluate it under the Bank’s
central projection, and under the alternative scenarios of a productivity slowdown, a
productivity boom, and overheating. Each path is obtained by evaluating the “pause” rule
at each of the draws from a forecast distribution of output and inflation under that
particular scenario, and averaging them to produce an expected path. The pause rule is
also evaluated at the Bank’s central forecast. Exhibit D-2 presents the implications for the
nominal FFR. Exhibit D-3 presents the implications for average ex post real rate
obtained by subtracting the four-quarter lagged change of core PCE inflation from the
paths of the nominal rate.
Exhibit D-4: Effect of different inflation targets and recent actual FFR target decisions.
This exhibit shows the effect of different inflation targets and gives a measure of how the
recent actual path of the FFR has differed from the prescription of our policy rule. This is
implemented by running the standard policy rule with two different inflation targets and
not using the information about the 10 most recent increases in the FFR. Thus, policy
rule paths are conditioned on the average FFR in 2004 Q4 of 1.9%. It also plots an
average over the three rules evaluated this cycle, with weights of 0.1, 0.6 and 0.3
respectively and the implied market path.
FRBNY - cleared for release

FRBNY: Blackbook, May 4, 2006 Confidential(FR) Class II FOMC 66
Exhibit D-5: FFR Distributions
In this exhibit we examine the distribution of the FFR under the three different policy
rules through the second quarter of 2007. We also include the market distribution by
assuming it has a normal distribution centered at the market path from Exhibit B-5 with a
standard deviation derived from Exhibit B-6. The distribution is represented by a boxplot
to this allow more direct comparison of the implications of different policy rules. The box
represents the 50% probability interval, the line in the box the median and the tails the
90% probability interval.
Source: MMS Function, FRBNY
Exhibit D-6: Comparing Market Beliefs to FRBNY
In this exhibit, two metrics of measuring the distance between the market-implied path
and the FRBNY implied path are shown:
1. The percentile of the market distribution of the prediction from our policy rule.
2. The percentile of our policy rule distribution of the expected path priced into
markets.
There are many other sources of differences between the two paths. One important
consideration is the adjustment for risk in constructing the market path. We use an
adjustment from the Board that is constant over time but there is some evidence that the
adjustment may be time varying. Furthermore, the market faces uncertainty over the
policies and targets used by the FOMC. We can attempt to capture this uncertainty but
again it might vary over time.
Source: MMS Function, FRBNY
Policy Rule: Baseline Specification
FRBNY - cleared for release

FRBNY: Blackbook, May 4, 2006 Confidential(FR) Class II FOMC 67
rategrowth potential 3.3% using GapOutput :xaverage Q 4 PCE Core :
0.51.5
5.125.4i
4.9i0.8
xi1ii
t
t
x
*
*
2006Q2
tx*
t*
1tt
Source: MMS function, FRBNY
FRBNY - cleared for release


FRBNY: Blackbook, May 4, 2006 Confidential(FR) Class II FOMC 69
Percentile of FRBNY Expectation in Market
Distribution
Percentile of Market Expectation in FRBNY
Distribution
Pause 37 72
Policy Rule 47 53
Inflation Hawk 78 27
Average 51 38
Note: "Average" weights pause at .6, rule at .1, and hawk at .3.
D. FRBNY Fed Funds Rate Projections
Exhibit D-5: Fed Funds Rate Distributions
Exhibit D-6: Market Expectations of Future FFR and FRBNY Outlook for FFR
FRBNY - cleared for release

FRBNY: Blackbook, May 4, 2006 Confidential(FR) Class II FOMC 70
D. FRBNY Fed Funds Rate Projections
2 8
3
3 2
3.4
3 6
3 8
4
2007 20082 8
3
3 2
3.4
3 6
3 8
4
D-7: Implied Forecast Differences from Wait/Don’t Wait4 Quarter GDP Growth% Change - Year to Year % Change - Year to Year
Source: MMS Function (FRBNY)
Wait
Don't Wait
Average
1.4
1.6
1.8
2
2.2
2.4
2.6
2.8
2007 20081.4
1.6
1.8
2
2.2
2.4
2.6
2.8
D-8: Implied Forecast Differences from Wait/Don’t Wait4 Quarter Core PCE Inflation% Change - Year to Year % Change - Year to Year
Source: MMS Function (FRBNY)
Wait
Don't WaitAverage
1.4
1 6
1 8
2
2 2
2.4
2 6
2 8
3
2007 20081.4
1 6
1 8
2
2 2
2.4
2 6
2 8
3
D-9: Implied Forecast Differences from Wait/Don’t Wait1 Quarter Core PCE Inflation (Annualized)% Change - Annual Rate % Change - Annual Rate
Source: MMS Function (FRBNY)
Wait
Don't WaitAverage
4.6
4.8
5
5.2
5.4
5.6
5.8
2007 20084.6
4.8
5
5.2
5.4
5.6
5.8
D-10: Implied Forecast Differences from Wait/Don’t WaitFFR Quarterly AveragePercent Percent
Source: MMS Function (FRBNY)
Wait
Don't Wait
Average
FRBNY - cleared for release

FRBNY: Blackbook, May 4, 2006 Confidential(FR) Class II FOMC 71
Exhibit E-1. Federal Reserve Bank of New York’s Indexes of Coincident Economic Indicators
The chart in this exhibit shows our monthly coincident indexes for New York, New
Jersey, and New York City through March 2006. The indexes are a composite of four
economic indicators: payroll employment, unemployment rate, average weekly hours in
manufacturing, and real wage & salary earnings.
More details on the methodology and construction of these indexes can be found at
http://www.ny.frb.org/research/regional_economy/coincident_summary.html
Source: MaRS Function, FRBNY
Exhibit E-2. Federal Reserve Bank of New York’s Indexes of Leading Economic Indicators
This chart shows the growth in our monthly leading indexes for New York, New Jersey,
and New York City through March 2006. The growth in the index for a given month
represents a forecast of the growth in the coincident index nine months ahead. The
components used in these three indexes differ slightly, but include: housing permits,
stock prices, the national leading index, the lagged coincident index.
[NOTE: This index is not released publicly.]
More details on the methodology and construction of these indexes can be found at:
http://www.ny.frb.org/research/regional economy/coincident summary.html
Source: MaRS Function, FRBNY
Exhibit E-3. Private-Sector Job Growth in the U.S. and the Region
This chart shows the 12-month growth rate of private-sector employment for New York-
New Jersey (combined), New York City, and the U.S. (bars) from 1996 to present.
Underlying data can be found at:
http://stats.bls.gov/news.release/laus.t06.htm and
http://stats.bls.gov/news.release/metro.t02.htm
Source: U.S. Bureau of Labor Statistics
E. Regional Charts
FRBNY - cleared for release
FRBNY: Blackbook, May 4, 2006 Confidential(FR) Class II FOMC 72
Exhibit E-4. Unemployment Rates
This chart shows the monthly unemployment rate for New York State, New Jersey, New
York City, and the U.S. from 1992 to present.
Source: U.S. Bureau of Labor Statistics, New York State Dept. of Labor and the New
Jersey Department of Labor.
Data can be found at:
http://www.labor.state.ny.us/agency/pressrel/pruistat.htm
http://www.wnjpin.net/OneStopCareerCenter/LaborMarketInformation/lmi16/release1.ht
m
FRBNY - cleared for release