
Financial Crime and Fraud Investigation: Historical Perspectives
© The Author(s) 2018. Published by Oxford University Press on behalf of Zhejiang University Press. 1
Food Quality and Safety, 2018, XX, 1–13doi:10.1093/fqsafe/fyy017
Review
This is an Open Access article distributed under the terms of the Creative Commons Attribution Non-Commercial License (http://creativecommons.org/licenses/by-nc/4.0/), which permits non-commercial re-use, distribution, and reproduction in any medium, provided the original work is properly cited. For commercial re-use, please contact [email protected]
Review
Fraud investigation in commercial coffee by chromatographyVíctor de Carvalho Martins,*,** Ronoel Luiz de Oliveira Godoy,*,** Ana Cristina Miranda Senna Gouvêa,** Manuela Cristina Pessanha de Araujo Santiago,** Renata Galhardo Borguini,** Elaine Cristina de Oliveira Braga,**,*** Sidney Pacheco** and Luzimar da Silva de Mattos do Nascimento**
*Departamento de Tecnologia de Alimentos, Instituto de Tecnologia, Universidade Federal Rural do Rio de Janeiro, CEP 23890-000, Seropédica-RJ, Brazil, **Laboratório de Cromatografia Líquida, Embrapa Agroindústria de Alimentos, CEP 23020-470, Rio de Janeiro-RJ, Brazil, ***Centro de Tecnologia, Instituto de Química, Universidade Federal do Rio de Janeiro, CEP 22290-180, Rio de Janeiro-RJ, Brazil
Correspondence to: Víctor de Carvalho Martins. E-mail: [email protected]
Received 7 March 2018; Revised 15 May 2018; Editorial decision 28 May 2018.
Abstract
Coffee is currently the second largest commodity on the world market today, and there is great concern about the quality of the beans exported from producer countries to Europe and USA. Practices such as using blends of different species and adding low-cost raw materials, such as chicory, corn, and soybean, impair the sensory and functional characteristics of the drink made from roasted and ground coffee beans. There is a need to adopt more efficient analytical methods than the microscopy technique currently used. The first chromatographic method used to determine fraud was reported in 1958. This method used paper chromatography to differentiate between coffee and chicory based on the free reducing sugars. As of the 1980s, different methods involving high-performance liquid chromatography and gas chromatography were developed in order to demonstrate geographic authenticity, distinction between species, occurrence of adulteration, and the presence of defective beans by determining the monosaccharides, oligosaccharides, tocopherols, fatty acids, volatiles, diterpenes, sterols, and phenolic substances, among others. As far as the authors know, there are no papers published in the literature that have compiled such an extensive set of information about these chromatographic methods as here. Over the last 2 years, there has been a trend to develop analytical methods for ultra-performance liquid chromatography coupled with tandem mass spectrometry to confirm fraud in coffee, due to high sensitivity and selectivity.
Key words: adulteration; coffee; chromatographic methods; carbohydrates; volatile substances.
Introduction
Coffee fruits are responsible for providing one of the most popular beverages in the world. Considered the second largest commodity in international trade, the global consumption of coffee has doubled
over the last 40 years, mainly due to its sensory and functional properties such as its stimulating and antioxidant characteristics (Domingues et al., 2014; Hall et al., 2015). The strong economic value of this commodity benefits the producer countries, like Brazil,
Downloaded from https://academic.oup.com/fqs/advance-article-abstract/doi/10.1093/fqsafe/fyy017/5041966by Empresa Brasileira de Pesquisa Agropecuaria (EMBRAPA) useron 22 June 2018

Vietnam, Colombia, Indonesia, and Ethiopia. Currently, Brazil is the leader in coffee bean production and export, mainly to the USA and the European Union (ABIC, 2018; ICO, 2018).
Considering the economic value of coffee, quality has become one of the most important aspects for the industry. Quality var-ies according to the species, the geographical region, the roasting process, and also the occurrence of different types of fraud (Franca et al., 2005; Barbin et al., 2014). Reports of fraud by adding other plant sources have been observed since 1851 (THE LANCET, 1851). In Brazil, the most common materials added are corn, soy-bean, barley, rye, caramel, and coffee husks (Tavares et al., 2012; Oliveira et al., 2015).
Currently, microscopy is the main technique used to control the quality of Brazilian coffee, but other techniques with greater sensi-tivity and specificity, such as chromatography, can be used for this analysis. Chromatography, through the use of different columns, solvents, and detectors, is able to make detailed investigations into fraud. This article aims to review the main chromatographic meth-ods applied to evaluate coffee quality, especially for the detection of adulterants in coffee samples, and to report on the economic impor-tance of coffee and its quality. No other papers available in the lit-erature have compiled such an extensive set of information about these chromatographic methods and, therefore, this review can be considered an important tool to guide evaluations of coffee com-mercialized worldwide.
Technological Aspects and Processing
The coffee tree belongs to the family Rubiaceae and the genus Coffea. Coffea arabica and Coffea canephora, known, respectively, as arabica and robusta, are the main species used for coffee pro-duction worldwide (Parras et al., 2007). Its fruit consists of an oval drupe of approximately 10 mm, subdivided into six parts (Esquivel and Jiménez, 2012; Bresciani et al., 2014):
1. pericarp or an external rigid smooth skin, whose colour ranges from green to dark red, depending on the maturation stage;
2. external mesocarp that is a yellowish and fibrous pulp;3. layer of mucilage and pectin, considered translucent, thin and
highly viscous and hydrated;4. endocarp or parchment, a thin, yellowish layer;5. perisperm or silverskin, responsible for covering the coffee bean;6. endosperm or coffee bean.
Different ideal climatic conditions are described for these two prin-cipal species: basically arabica coffee is cultivated at higher altitudes and lower temperatures than robusta coffee (Paterson et al., 2014; ICO, 2016).
There are two main methods used for processing the coffee bean after harvesting. In the dry process, the beans are dried in the sun, after which the skin, pulp, mucilage, and parchment are removed mechanically. In the wet process, the fruit is initially floated in water to classify and separate the ripe fruits. This is followed by removal of the skin and pulp by mechanical pressing of the fruit in water; the mucilage is removed by controlled fermentation over 12 to 48 h or by mechanical friction; and, finally, the beans are dried and stripped to remove the parchment (Gonzalez-Rios et al., 2007a; Gonzalez-Rios et al., 2007b; Esquivel and Jiménez, 2012).
Coffee is essentially traded internationally as green beans, but is also sold after the roasting stage (Esquivel and Jiménez, 2012). This thermal processing can be divided into three phases: the first corresponds to releasing water vapour and volatile substances of the bean at temperatures higher than 50°C; the second, with increas-ing temperatures up to 200°C, when volatilizable substances, sulfur compounds, and melanoidins are produced by pyrolysis, and the Maillard and caramelization reactions occur, all of which contribute to the final sensory properties of the product; and the third stage is immediate cooling, stopping these chemical reactions (Franca et al., 2005; Bicho et al., 2012).
The final product tends to have a weight loss between 14% and 23%, due to the loss of water and volatile substances. There is an increase in volume due to cell swelling and the destruction of poly-mers such as cellulose and lignin. Also the beans have a darker col-our (higher melanoidin content) and an aroma with pleasant fresh roasted to even burned notes (Parras et al., 2007; Bagdonaite et al., 2008).
Economic Value
Coffee is the second most important commodity in international trade, behind petroleum, mainly due to the increased consumption, which has almost doubled in the last 40 years (Parras et al., 2007; Paterson et al., 2014). According to Barbin et al. (2014), coffee can be considered as the most popular beverage in the world after water.
More than 60 tropical and subtropical countries, located mostly in the “Coffee Belt” (between latitude 25° north and 25° south of the Equator Line), produce the green coffee beans for worldwide consumption (Esquivel and Jiménez, 2012; Narita & Inouye, 2014). According to International Coffee Organization—ICO (2018), the major producer countries are Brazil, Vietnam, Colombia, Indonesia, and Honduras, representing over 63% of world coffee production (Table 1).
According to Instituto Brasileiro de Geografia e Estatística—IBGE (2018), in January 2018, Brazilian production was esti-mated at nearly 3.2 million tons of coffee beans, with arabica representing 75% (more than 2.4 million tons) and robusta coffee
Table 1. Coffee production and export statics
Total production
2014 2015 2016 2017 %
Brazil 52.3 50.4 55.0 51.5 -6.4Vietnam 26.5 28.7 25.5 28.5 11.6Colombia 13.3 14.0 14.6 14.0 -4.3Indonesia 11.4 12.3 11.5 10.8 -6.1Honduras 5.3 5.8 7.5 8.4 12.0Global Scale 149.1 152.1 157.7 158.9 0
Data of the main producer countries in million bags of 60 kg (ICO, 2018).
2 V. de C. Martins et al.
Downloaded from https://academic.oup.com/fqs/advance-article-abstract/doi/10.1093/fqsafe/fyy017/5041966by Empresa Brasileira de Pesquisa Agropecuaria (EMBRAPA) useron 22 June 2018
25% (708.0 tons). Considering only Brazil, which currently is the second largest consumer of the product, there has been a signifi-cant increase in the domestic sale of coffee, which over the last 20 years has doubled. Also data referring to Brazilian exports indicate a progressive growth in recent decades, especially to countries like the USA, Germany, Italy, Belgium, and Japan (ABIC, 2018).
As a result of the increased value and consumption of coffee in recent years, the quality of commercialized coffee has become of great importance and there has been increased interest in improving the handling techniques, as well as investing in better quality control of the raw material and the final product.
Coffee Quality
Quality has become one the most important aspects for the cof-fee industry and various factors can affect the final product, such as the different species used, the coffee growing region, and the degree of roasting applied (Franca et al., 2005; Barbin et al., 2014; Oliveira et al., 2015).
One important aspect that has a negative impact on the coffee industry is the occurrence of fraud. Fraud includes the marketing of coffee and coffee products with the addition of low-cost materials and/or the presence of defective beans and even low-quality coffees or beans from different geographical regions to that reported on the product label.
Adulteration of the product is one of the main types of fraud and this was first reported in the literature in 1851, when the British scientific journal The Lancet (1851) highlighted the use of chicory root, corn, bean, and potato as adulterants in coffee. Two years later, another paper reported that some commercial coffee con-tained chicory root in concentrations of up to 50% (w/w), which was tolerated but the consumers were not adequately informed (THE LANCET, 1853).
In Brazil, a significant proportion of roasted coffee commercial-ized for the domestic market presents adulterants that are added before or during the roasting process, in concentrations of up to 40% (w/w). The most commonly used adulterants are corn, soybean, barley, rye, caramel, and coffee husks (Tavares et al., 2012; Oliveira et al., 2015).
This high level of adulteration is considered a serious threat to the sustainable development of the coffee industry and some inter-national organizations are involved in quality assurance of coffee worldwide, such as ICO, the Institute for Scientific Information on Coffee and the Food and Agriculture Organization (FAO) (Oliveira et al., 2015; Cai et al., 2016). Until the beginning of 2013, the Brazilian Normative Instruction no. 16, of 24 May 2010, of Ministério da Agricultura, Pecuária e Abastecimento (BRASIL, 2010), regulated that roasted coffee beans and roasted and ground coffees could not contain impurities, sedi-ment, and foreign matter greater than or equal to 1.0% (w/w). Consequently, the use of more sensitive and specific analytical techniques is necessary to ensure the quality of coffees commer-cialized worldwide.
Currently, the main Brazilian laboratories that are author-ized to analyse coffee for adulterations use microscopy methods (Tavares et al., 2012). According to Oliveira et al. (2015), the first methodologies were based on the removal of the lipid fraction of organic solvents and then these samples were compared with potential adulterants. This initial step also served as the basis for
subsequent methodologies using optical microscopy, scanning electron microscopy, and image analysis (Amboni et al., 1999; Sano et al., 2003). The difficulty to detect the presence of for-eign substances is basically due to adulterants that have the same degree of roasting and particle size as the ground coffee. These difficulties require a long time for the analysis as well as the need for professionals qualified in the histological characterization of plants.
Other analytical techniques include infrared spectroscopy, poly-merase chain reaction (PCR), and chromatography. Near and mid-infrared spectroscopy is used for quality control in the food industry. The article of Tavares et al. (2012) differentiated samples of pure and adulterated coffee with coffee husks using the intensity of spec-tral bands at specific wavelengths and principal component analy-sis (PCA). This method reduced the time of analysis and increased reliability.
Methods based on the replication of DNA molecules also have various advantages such as high specificity and sensitivity com-pared with conventional methods, because the DNA molecules remain stable during the coffee roasting process. The use of PCR in real time using fluorescent reagents allows the quantification of DNA initially present in the samples (Oliveira et al., 2015). Ferreira et al. (2016) developed a methodology by Real-Time PCR to detect barley, corn, and rice in ground roasted coffee and soluble coffee using specific nucleic acid sequences, which was successfully applied to commercial samples from different countries.
Chromatography is currently one of the most versatile ana-lytical techniques used to determine different types of fraud. Organic compounds with different polarities and molecular weights in concentrations up to trace level can be detected and quantified through the combination of columns, mobile phases, and detectors.
Chromatographic Methods to Investigate Fraud in Coffee
Various different methodologies have been developed to evalu-ate the quality of commercialized coffee in recent decades since Skarka and Radej (1958) applied paper chromatography to dif-ferentiate coffee and chicory by quantifying the free reducing sug-ars. Tables 2 and 3 show, respectively, the main methods used to determine adulteration and other fraud types in commercial coffee samples.
Due to its versatility, various techniques of chromatography have been employed to investigate coffee fraud, such as high-performance liquid chromatography (HPLC) with different types of separation (normal phase, reverse, and ion exchange) and detection (absorp-tion in ultraviolet and visible region—UV/Vis, fluorescence, pulsed amperometric detector—PAD, and refractive index—RI); gas chro-matography (GC) with a capillary column and flame ionization detector (FID), thermionic detector (TID), or mass spectrometry (MS); and the latest advances which include HPLC or ultra-perfor-mance liquid chromatography (UPLC) coupled with detection by mass spectrometry.
High-performance liquid chromatographyThe first attempt to develop a method to detect fraud in coffee by HPLC was at the beginning of the 1980s. Still based on adultera-tion with chicory root, Smith (1981) separated and quantified the
Fraud Investigation in Coffee by Chromatography 3
Downloaded from https://academic.oup.com/fqs/advance-article-abstract/doi/10.1093/fqsafe/fyy017/5041966by Empresa Brasileira de Pesquisa Agropecuaria (EMBRAPA) useron 22 June 2018

levels of caffeine and 5-hydroxymethylfurfural (HMF), one of the Maillard reaction products, using a Shandon column filled with silica gel Hypersil™, 5% isopropanol in dichloromethane as the mobile phase at low pressure (160 psi), and detection by absorp-tion at a wavelength of 280 nm. This study evaluated only three samples of instant coffee and one sample of “French” coffee, a product consisting of 49% (w/w) chicory and which presented an HMF content of at least three times higher than pure coffee (Figure 1). The author proposed using the ratio between the HMF and caffeine levels as a marker of distinction among products, but he indicated that the extraction method would not be suitable for the quantification of HMF. Another paper, by Clifford et al. (1987), also emphasized HMF as a marker for coffee adulteration but with a different methodology using a column containing Spherisorb 5 ODS, a mobile phase in the gradient mode with a formic acid 0.5% (v/v) aqueous solution and acetonitrile and quantification at 313 nm.
Although HMF was the initial component for comparative ana-lysis, the main methods nowadays to detect adulteration in coffee samples by HPLC involve the determination of the carbohydrate profile. Initially, the use of a detector by absorbance in the UV/vis regions was a limiting factor, and post-column derivatization steps of the samples were necessary to include chromophore groups in carbohydrate molecules (Oliveira et al., 2015).
An example of this strategy was described by Blanc et al. (1989), in which pure and adulterated soluble coffees were dif-ferentiated through the determination of their free and total
carbohydrate profiles, after acid hydrolysis. These authors pre-pared the soluble coffee standards from light-roasted coffee beans by a process similar to the industrial processes. They also pre-pared samples of a mix with 1% (w/w) coffee husks. The carbo-hydrate analysis was carried out with an HPLC in normal phase, with a stationary phase such as silica previously impregnated with ammonia solution modified and a mobile phase in isocratic elution with acetonitrile and phosphate solution (80:20 v/v), a post-column derivatization with Tetrazolium Blue solution and detection by spectrophotometry in the visible region, at a wave-length of 530 nm. A method by GC with a fused silica capillary column and helium (He) as the carrier gas also was employed to analyse maltose and sucrose. Based on the specific carbohydrate profile for the pure and adulterated instant coffee, the results of a large number of commercial samples (n = 122) confirmed that high levels of total xylose, maltose, and sucrose can be, respect-ively, indicative of the presence of coffee husks, maltodextrins, and caramelized sugars.
An official HPLC method to determine carbohydrate in instant coffee is recommended by ISO 11292 (1995), using ion-exchange columns and a pulsed amperometric detector. Bernal et al. (1996) employed it to verify adulteration in instant coffee. These authors used a Carbo-Pac PA1 column and a Carbo-Pac Guard pre-column, both Dionex™, and a mobile phase in a gra-dient mode with nano-filtered water and a NaOH 0.2 mol.L−1 solution. This method is highlighted because of its low detection limits, which were found between 1.0 ppm and 2.5 ppm for the
Table 2. Main methods developed to determine adulteration in coffee
Reference Analyte Method
Skarka and Radej (1958) Free reducing sugars Paper ChromatographySmith (1981) 5-Hydroxymethylfurfural and caffeine High-performance liquid chromatography
(HPLC) in normal phase and detection by absorption in Ultraviolet (UV) region
Clifford et al. (1987) 5-Hydroxymethylfurfural HPLC in reverse phase and detection by absorp-tion in ultraviolet (UV) region
Blanc et al. (1989) Arabinose, fructose, galactose, glucose, mannose, xylose
HPLC in normal phase and, post derivatization, detection by absorption in visible region
Bernal et al. (1996) Arabinose, fucose, fructose, galactose, glucose, mannitol, mannose, rhamnose, sucrose
HPLC by ion exchange and pulsed amperometric detector
Jham et al. (2007) α-, β-, γ-, δ-Tocopherol HPLC in normal phase and detection by fluorescence
Jham et al. (2008) Palmitic, stearic, oleic, linoleic, linolenic and arachidic Acid
Gas chromatography (GC) in capillary column and detection by flame ionization
Garcia et al. (2009) Mannitol, arabinose, galactose, glucose, xylose, mannose, fructose
HPLC by ion exchange and pulsed amperometric detector
Oliveira et al. (2009) Volatile and semivolatile substances GC in capillary column and detection by mass spectrometry
Santiago et al. (2012) Maltose, raffinose, stachyose, kestose, nystose, 1-β-frutofuranosylnystose
HPLC in reverse phase and detection by refrac-tive index
Pauli et al. (2014) Arabinose, fructose, galactose, glucose, mannose, xylose
HPLC by ion exchange and pulsed amperometric detector
Domingues et al. (2014) Arabinose, galactose, glucose, mannose, xylose HPLC by ion exchange and detection by pulsed amperometric and, post derivatization, by absorption in visible region
Cai et al. (2016) Oligosaccharides ultra performance liquid chromatography (UPLC)-hydrophilic interaction liquid chroma-tography (HILIC) and detection by high resolu-tion mass spectrometry
Tavares et al. (2016) α-, β-, γ-, δ-Tocopherol HPLC in normal phase and detection by fluorescence
4 V. de C. Martins et al.
Downloaded from https://academic.oup.com/fqs/advance-article-abstract/doi/10.1093/fqsafe/fyy017/5041966by Empresa Brasileira de Pesquisa Agropecuaria (EMBRAPA) useron 22 June 2018

analysed substances. Coffees adulterated with cereals and 5% chicory extract showed higher levels of free glucose and fructose than pure samples (Figure 2).
The same methodology with modifications in the mobile phases and programmed pulses was applied recently in arabica roasted and ground coffee by Garcia et al. (2009), Domingues et al. (2014), and
Table 3. Main methods used to investigate other types of coffee frauds
Reference Analyte Method Fraud type
Clifford and Jarvis (1988) Chlorogenic acids High-performance liquid chromatog-raphy (HPLC) in reverse phase and detection by absorption in ultraviolet (UV) region
Geographical authenticity
Correia et al. (1995) Phenolic substances HPLC in reverse phase and detection by absorption in ultraviolet (UV) region
Geographical authenticity
Hashim and Chaveron (1995) Methylpyrazines Gas chromatography (GC) in capil-lary column and thermionic detector
Geographical authenticity
Lercker et al. (1995) Diterpenic alcohols and sterols GC in capillary column and detec-tion by flame ionization and by mass spectrometry
Differentiation among species
Carrera et al. (1998) Sterols GC in capillary column and detec-tion by flame ionization and by mass spectrometry
Differentiation among species
Martín et al. (1998) Caffeine HPLC in reverse phase and detection by absorption in ultraviolet (UV) region
Differentiation among species
Freitas and Mosca (1999) Volatile substances GC in capillary column and detec-tion by flame ionization and by mass spectrometry
Geographical authenticity
Valdenebro et al. (1999) Sterols GC in capillary column and detec-tion by flame ionization and by mass spectrometry
Differentiation among species
González et al. (2001) α-, β-, γ-, δ-Tocopherol HPLC in normal phase and detection by fluorescence
Differentiation among species
Martín et al. (2001) Fatty acids GC in capillary column and detec-tion by flame ionization
Differentiation among species
Kamm et al. (2002) 16-O-Methylcafestol and sterols On-line HPLC in normal phase and GC in capillary column and detec-tion by flame ionization
Differentiation among species
Murkovic and Derler (2006) Carbohydrates and amino acids HPLC by ion exchange and detection by pulsed amperometric and, post derivatization, by fluorescence
Differentiation among species
Agresti et al. (2008) Volatile substances GC in capillary column and detec-tion by mass spectrometry
Presence of defective coffee beans
Akiyama et al. (2008) Volatile substances GC in capillary column and detec-tion by mass spectrometry and by olfactometry
Geographical authenticity
Risticevic et al. (2008) Volatile and semi-volatile substances GC in capillary column and detec-tion by mass spectrometry
Geographical authenticity
Toci and Farah (2008) Volatile substances GC in capillary column and detec-tion by mass spectrometry
Presence of defective coffee beans
Alves et al. (2009) α-, β-, γ-, δ-Tocopherol HPLC in reverse phase and detection by absorption in ultraviolet (UV) region and by fluorescence
Differentiation among species
Pacetti et al. (2012) Diterpenic alcohols GC in capillary column and detec-tion by flame ionization
Differentiation among species
Romano et al. (2014) Fatty acids GC in capillary column and detec-tion by flame ionization
Differentiation among species
Toledo et al. (2014) Volatile substances GC in capillary column and detec-tion by flame ionization and by mass spectrometry
Differentiation among coffee types
Jumhawan et al. (2015) Metabolite fingerprinting GC in capillary column and detec-tion by flame ionization
Differentiation among coffee types
Mehari et al. (2016) Phenolic substances ultra performance liquid chroma-tography (UPLC) in reverse phase and detection by absorption in ultraviolet (UV) region and by mass spectrometry
Geographical authenticity
Fraud Investigation in Coffee by Chromatography 5
Downloaded from https://academic.oup.com/fqs/advance-article-abstract/doi/10.1093/fqsafe/fyy017/5041966by Empresa Brasileira de Pesquisa Agropecuaria (EMBRAPA) useron 22 June 2018

Pauli et al. (2014) to investigate the addition of different vegetable materials. The first paper managed to distinguish mixtures of cof-fee, coffee husks, and corn through chemometric methods based on the carbohydrate content. The other studies concluded stat-istically that glucose could be a chemical marker for triticale and wheat, mannose for açaí seeds, and fructose for soybean. Although the detector employed is highly selective and sensitive, the chroma-tographic method has a run time of 72.6 min, because it employs an anionic column, which requires regeneration at each run for a good resolution and quantification at the desired levels of legislation. Including the sample preparation steps, it can be considered a long-time analysis and therefore impair the routine application for inspec-tion laboratories. Another less time-consuming alternative, however, which presents lower chromatography resolution, is still described by Domingues et al. (2014). It used the same extraction method as ISO 11292:1995, but employed a cationic column (Aminex
HPX-87P, Bio-Rad) at 85°C, which does not require regeneration between the runs and its detection was done by UV-vis spectrum with post-column reaction with 4-aminobenzoyl-hydrazide (ABH).
The use of RI detectors can also be applied to determine adulter-ants. Santiago et al. (2012) developed a quantification method in roasted and ground coffee samples for the carbohydrates: maltose (indicative of the addition of corn), raffinose, and stachyose (indica-tive of soybeans) and 1-kestose, nystose, and β-frutofuranosylnystose (marker for barley and wheat middling) by HPLC in reverse phase, with a Agilent® Zorbax Carbohydrate column and a mobile phase in isocratic mode with acetonitrile and ultra-purified water. The analy-sis, from analytical standards, obtained a good chromatographic res-olution, unlike the samples when the elution of contaminants with maltose and kestose were observed. To overcome this problem, an initial analysis with the mobile phase containing 75% (v/v) acetoni-trile and 25% (v/v) water was carried out for the separation of these peaks, and then another analysis with an increase in the percentage of water to 30% (v/v) for the separation of the remaining analytes. However, this chromatographic method was not successfully applied to commercial ground and roasted coffee due to its limit of detection (LOD) and, therefore, it was not recommended for these types of commercial samples.
Other analytes were used to verify these fraud types in coffee, such as tocopherol, which has great potential as a marker of adul-teration, according to Jham et al. (2007). Using the HPLC method recommended by AOAC, in normal phase (Inertsil® silica column and mobile phase consisting of hexane and 2-propanol, at a rate of 99.5:0.5) and fluorescence detection with excitation and emis-sion wavelengths of 290 nm and 330 nm, respectively, these authors highlighted the γ-tocopherol contents that contributed significantly to the detection of the addition of corn in Brazilian arabica coffee samples rather than other tocopherols (α-, β-, and δ-tocopherol), with a detection limit of 0.5 µg.ml−1 for γ-tocopherol. The applica-tion of this method indicated, on the basis of linear regression for corn contamination and γ-tocopherol levels, among six commercial samples collected in Viçosa—Minas Gerais, one coffee with an 8.9% (w/w) addition of corn. Nine years later, Tavares et al. (2016) also tested the known potential of tocopherols profile for adulteration detection with coffee by-products. These authors prepared samples with husks and cleaned husks (without parchment), using a medium-dark roast level, as well as maize for distinction. The hexane extracts were injected into the HPLC in normal phase, with a SupelcosilTM LC-SI column and isocratic mobile phase n-hexane and 1.4-dioxane (98:2), a photodiode arrangement detector and fluorescence detec-tor as described by Jham et al. (2007). The results were statistically treated and demonstrated that this adulteration can be perceived at low amounts (5% w/w) and distinguished at 10% (w/w) for maize and 20% (w/w) for coffee by-products. This methodology was sim-pler than the one reported in the previous article.
To investigate other types of fraud, liquid chromatography has also been used. In the 1980s and 1990s, two articles, based on the classic knowledge that chlorogenic acids (CGA) are present in cof-fee, applied HPLC with a column containing Spherisorb® 5 ODS stationary phase and detection by absorption in the UV region (280 and 313 nm) to try a differentiation between the robust coffee from Angola and other growing regions. The first, published by Clifford and Jarvis (1988), indicated that the levels of CGA in samples from the species C. canephora are influenced by the geographical region and reported that four substances derived from the CGA showed restricted occurrence in Angolan coffees. Seven years later, Correia et al. (1995) proved that two substances, one of them identified as
Figure 2. Chromatogram by high-performance liquid chromatography (HPLC)-PAD of a soluble coffee. Peaks: 1 = mannitol; 2 = fucose; 3 = arabinose; 5 = galactose; 6 = glucose; 8 = xylose; 10 = fructose. Coffees adulterated with cereals and 5% chicory extract showed higher levels of free glucose (peak 6) and fructose (peak 10). *Reprinted (adapted) with permission from Bernal et al. (1996). Copyright © 1996 Published by American Chemical Society.
Figure 1. Chromatograms of extracts of (a) coffee powder and (b) coffee/chicory powder, separated on Hypersil™, solvent 5% isopropanol/dichloromethane and detector at 280 nm, which the majorities peaks is HMF (kʹ 0.67) and caffeine (kʹ 3.45). *Reprinted (adapted) with permission from Smith (1981). Copyright © 1981 Published by Elsevier Ltd.
6 V. de C. Martins et al.
Downloaded from https://academic.oup.com/fqs/advance-article-abstract/doi/10.1093/fqsafe/fyy017/5041966by Empresa Brasileira de Pesquisa Agropecuaria (EMBRAPA) useron 22 June 2018

caffeoyl-tyrosine, were only detected in clarified aqueous extracts of Angolan robusta coffees rather than Angolan arabica coffees and robust coffees from other countries, and therefore can be used as markers for authenticity. Both articles showed initial data to authen-ticate Angolan robusta coffee. However, there are few details about the type of quantification employed and the definition of validation parameters.
The differentiation between arabica and robusta species has also featured in many articles with emphasis on different analytes. Among several chemical analyses performed, Martín et al. (1998) used the caffeine content, HPLC in reverse phase (Lichrosorb RP-18 column and isocratic elution with methanol 20% v/v aqueous solution at pH 4.5), quantification at a wavelength of 254 nm and applied a statisti-cal treatment to differentiate between the two species. Robusta green coffee showed a maximum content of 5.9% (w/w) on a dry basis, whereas the arabica green coffee had 1.8% (w/w). Also Murkovic and Derler (2006), in their study concerning the amount of Maillard reaction precursors in coffee, differentiated the green beans of these two species for their contents of sucrose (higher in arabica coffee), alanine, and asparagine (greater concentrations in robusta coffee), through HPLC by anionic exchange and PAD for carbohydrates, and in reverse phase with, post-derivatization with 6-amino-N-hydrox-ysuccinimidyl-carbamate quinolyl, fluorescence detection for amino acids. These papers only studied green beans, and therefore, it would be necessary to investigate whether these substances could be used to differentiate roasted coffees, due to the effects of the thermal roast-ing process.
Some years before the work of Jham et al. (2007), the tocophe-rols had been studied for the discrimination of this species by other authors. González et al. (2001) tested the profile of tocopherols and also triglycerides as an authentication parameter by HPLC, respec-tively, in normal phase (Lichrosphere Si-60 column and as mobile phase n-hexane and propan-2-ol, 99:1 v/v) and fluorescence detec-tion similar to Jham et al. (2007), and in reverse phase (Superspher 100 RP-18 Merck column and as mobile phase acetonitrile and acetone, 1:1 v/v) and RI detector. Based on 32 samples, these authors managed to differentiate C. arabica and C. canephora through the both profiles. However, the statistical tests, PCA and linear discrimi-nation analysis (LDA), confirmed that the tocopherols profile con-stitutes better parameters than triglycerides for this purpose. The article of Alves et al. (2009) showed similar results: they proved that C. arabica, when compared with C. canephora, has higher levels of α-tocopherol (2.7 ± 0.4 mg.100 g−1 against 1.7 ± 0.3 mg.100 g−1) and β-tocopherol (8.0 ± 0.9 mg.100 g−1 against 2.1 ± 0.2 mg.100 g−1). However, these levels tend to reduce 10%, on average, after roast-ing the beans, and, furthermore, the data interpretation, through ANOVA, t-tests, and cluster analysis (CA), allows the discrimination of both species (either green or roasted) according to the tocophe-rols profile. These studies differ mainly by their extraction method-ologies, in which the first was based on the conventional Soxhlet method per 8 h with 18 g of sample and the other applied a method for exhaustion, extracting overnight at 4°C and a smaller sample mass (150 mg). The chromatographic methodology used by Alves et al. (2009) was applied in the study of Tavares et al. (2016), previ-ously related in this present article.
Gas chromatographyMethodologies involving GC techniques have also been tested to determine fraud in coffee samples. The main chemical marker to detect fraud, in general, is 16-O-methylcafestol (16-OMC) and was first reported in the article of Speer (1989). This cyclic diterpene
alcohol (Figure 3) shows heat stability and is considered absent in arabica coffee, which facilitates the quantification of the robusta cof-fee percentage in roasted coffee. There is an HPLC method validated by the German Institute for Standardization—DIN 10799 (1999), but, in recent years, many authors have employed GC analysis to detect and quantify the levels of this compound. Pacetti et al. (2012) developed a new predictive model to quantify the content of robusta in blends used for the Italian Espresso coffee, through the cubic pol-ynomial function with the absolute GC area of 16-OMC and the other diterpene kahweol. To carry out this, a large study with 82 samples of these species using two roasting processes and mixtures with different amounts of coffee species was made. The unsaponifi-able fraction of oils extracted from roasted coffees were analysed by GC using a column CP-TAP Varian coated with phenyl and meth-ylpolysiloxane (1:1 w/w), He as the carrier gas and FID. The PCA test indicated that the results in percentage of chromatographic area of these terpenes can be used as an indicator for coffee species. The percentage of robusta in eight commercial roasted blends was pre-dictive by this model (R2 = 0.998) and no significant difference (two-tailed t-test, P > 0.05) was determined based on label information. Although the article also concluded that these compounds are not degraded during the analytical procedure and this method was vali-dated for both species, the results concerning such information were not available in that article.
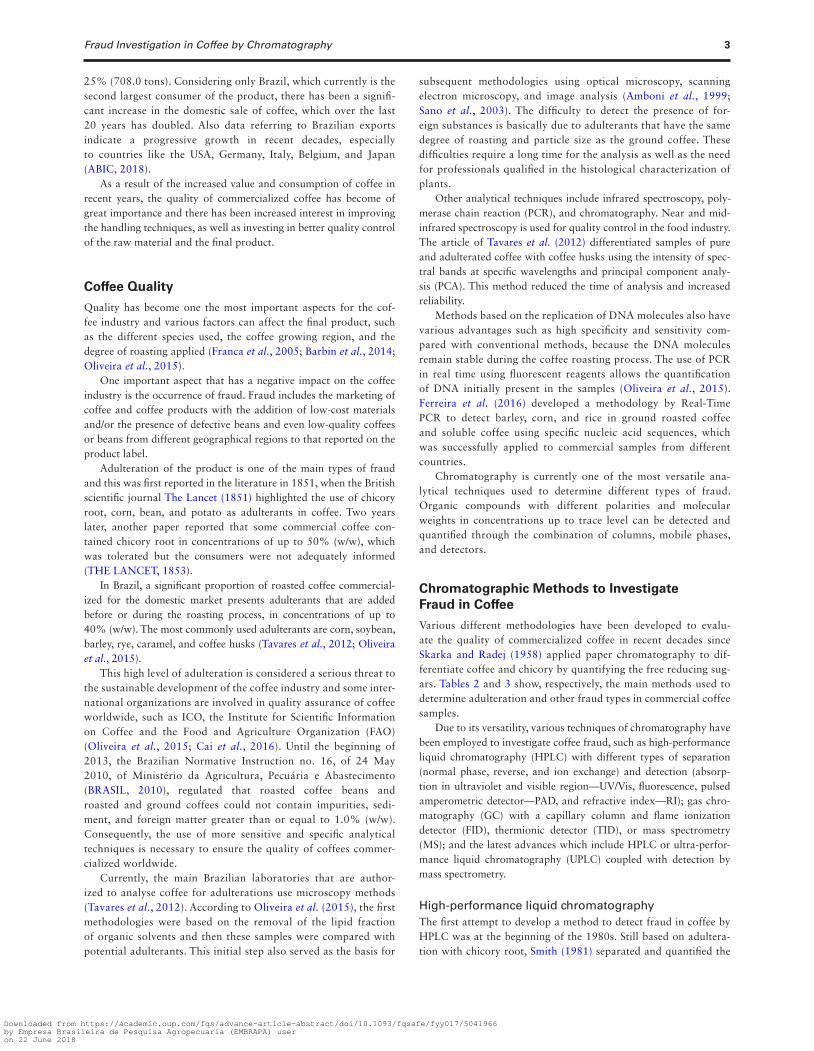
Still in the 1990s, Lercker et al. (1995) conducted a preliminary study determining the composition of diterpenic alcohols, such as 16-OMC, and sterols in the same unsaponifiable fraction of green and roasted coffee oils by GC-FID, under the same conditions as the previous article, and GC-MS by chemical ionization (CI) with meth-ane as the reagent gas and an ion trap (IT) analyser (Figure 4). Some years later, this principle was used to distinguish, on the basis of the profile of sterols, C. arabica and C. canephora green and roasted beans, respectively, by Carrera et al. (1998) and Valdenebro et al. (1999). In these papers, the applied methodology consisted of an ini-tial separation of the unsaponifiable fraction by thin-layer chroma-tography (TLC), sequence conversion into trimethyl silyl (TMS) with a derivatizing reagent, and analysis by GC-FID in a column coated with a bonded stationary phase HP-5 (5% diphenyl and 95% meth-ylpolysiloxane) and Hydrogen (H2) as the carrier gas. According to Carrera et al. (1998) and their studies of 31 green coffee with PCA and CA, the samples may be easily classified based on the content of sitostanol and Δ5-avenasterol. For roasted beans, a group of sam-ples (n = 40), including preparations and commercial blends, was analysed and the results, through principal component regression,
Figure 3. The structural formula of 16-O-methylcafestol.
Fraud Investigation in Coffee by Chromatography 7
Downloaded from https://academic.oup.com/fqs/advance-article-abstract/doi/10.1093/fqsafe/fyy017/5041966by Empresa Brasileira de Pesquisa Agropecuaria (EMBRAPA) useron 22 June 2018
indicated Δ5-avenasterol as the most adequate chemical descriptor for predicting the content of the both species of roasted coffee sam-ples due to the good linearity and reduction of the noise caused by other analytes. Valdenebro et al. (1999) claimed that this application in nine commercial coffees also showed excellent results, but there were no statistical tests to confirm this conclusion, as the more recent article of Pacetti et al. (2012).
A rapid and simultaneous methodology involving the detection of the previously mentioned substances (16-OMC and sterols) in green coffee was developed by Kamm et al. (2002), using a fully automated online LC–GC instrument Dualchrom 3000. The authors eliminated some stages of sample preparation, such as oil saponifica-tion (basic hydrolysis), preliminary separation by TLC, and derivati-zation with TMS, which were considered tedious processes. Their methodology consists in the transesterification of the oil, pre-separa-tion of the fractions of interest by HPLC, and online transfer to GC. For the HPLC analysis, a silica gel column Hypersil™ and a solution of 2-propanol 0.8% (v/v) in n-hexane as the mobile phase was used. After the initial separation, two fractions (I and II) were redirected to the GC-FID system with a fused-silica capillary CP-Sil8CB con-nected in series with an uncoated phenyldimethyl silylated fused-silica capillary and H2 as carrier gas. The fraction I was calculated based on internal standards and the fraction II that contained 16-OMC was injected into GC-MS with electron impact ionization
(EI) to confirm its identity and calculated its contents via external standards (dynamic range between 0.6 μg/ml and 153.9 μg/ml; R2 = 0.999). These results also reported 16-OMC and Δ5-avenasterol as key markers for this fraud, but the specific equipment used, the low number of samples and the lack of statistical treatments impair the implementation of this methodology for routine analysis.
Fatty acids (FA) have also been widely used in research for this fraud investigation. At the beginning of the previous decade, Martín et al. (2001) applied the detection of methyl ester derived from fatty acids (FAME) to attempt to differentiate between the C. ara-bica (n = 27) and C. canephora species (n = 13). The authors used a GC-FID with a SP-2380 Supelco® capillary column and H2 as the carrier gas to evaluate the levels of ten of the FA from the heptanic extracts, after esterification reaction with potassium hydroxide (KOH) in methanol (Figure 5). Based on PCA, it was possible to highlight oleic (C18:1), linolenic (C18:3), myristic (C14:0), and lin-oleic acid (C18:2) as markers to distinguish between the two species. By internal normalization, linoleic acid showed the highest quan-tities in all samples (average percentage of 44% of the total FA). Thirteen years later, Romano et al. (2014) based their work on a similar methodology for the differentiation of 19 coffee blends. The samples consisted of 13 commercial products with their label infor-mation and six mixtures prepared in the laboratory. The authors reported similar results to the previous article in terms of the FA lev-els, such as the concentration of linoleic acid, and they emphasized parameters that are influenced significantly by the percentage of ara-bica coffee in blends, such as the linolenic acid content, the total level of monounsaturated fatty acids (MUFA), the ratio between the total concentration of MUFA and saturated fatty acids (SFA) and between the content of stearic (C18:0) and oleic acid.
Other types of fraud have also been investigated by GC, and usu-ally with arabica coffee, valued for its sensory characteristics, and, recently, solid phase microextraction (SPME) and statistical analy-sis, mainly by PCA, has been used. Geographical authentication was first attempted and published by Hashim and Chaveron (1995). This study was related to levels of methylpyrazines with different roasting degrees. The levels of these compounds and the ratios of 2-methylpyrazine and 2,6-dimethylpyrazine and 2-methylpyrazine and 2,5-dimethylpyrazine of commercial roasted arabica coffees from three different origins were evaluated with GC-FID using a fused silica Chrompack capillary column and He as the carrier gas. The authors reported no significant difference between the samples; however, the low number of samples used should be emphasized.
Freitas and Mosca (1999) employed a GC-MS with EI ionization and IT analyser to identify the analytes responsible for arabica and robusta roasted coffee aromas, previously separated and detected by GC-FID, with a SuOx-01 capillary column and He as the car-rier gas. Using roasted coffee samples imported from eight differ-ent countries (Brazil, Costa Rica, Honduras, Ivory Coast, Angola, Uganda, India, and Cameroon) and provided by Nestlé Portugal SA, the authors obtained the geographical differentiation from specific substances detected in some samples, such as furan, 3-pentyl (Brazil), γ-butyrolactone and methyl-pyrazine (Costa Rica), and pyrazine-3-ethyl-2,5-dimethyl (Ivory Coast). The study was not able to iden-tify some compounds, and therefore, the results were not conclusive for the proposed aim.
Risticevic et al. (2008) characterized the volatile and semivolatile profile of arabica coffee beans from different geographical origins (Brazil, Colombia, Costa Rica, Guatemala, Ethiopia, and Indonesia) by SPME and GC with an SLB-5 column, consisting of 5% diphenyl and 95% dimethylpolysiloxane, He as the carrier gas and detection
Figure 4. Gas chromatography (GC)-ion trap MS traces of the unsaponifiable matter (after diazomethane and silylation treatment): arabica coffee and robusta coffee. Peaks: 22 = kahweol; 27 = cafestol; 33 = 16-O- methylcafestol; A = cholesterol; C = campesterol; D = 24-methylencholesterol; E = stigmasterol; F = β-sitosterol; G = Δ5-avenasterol; I = cycloartenol; M = 24-methylencycloartanol. *Reprinted (adapted) with permission from Lercker et al. (1995). Copyright © 1995 Friedr. Vieweg & Sohn Verlagsgesellschaft mbH. Published by Springer.
8 V. de C. Martins et al.
Downloaded from https://academic.oup.com/fqs/advance-article-abstract/doi/10.1093/fqsafe/fyy017/5041966by Empresa Brasileira de Pesquisa Agropecuaria (EMBRAPA) useron 22 June 2018

by MS-EI and the mass analyser time of flight (TOF). Initially, the authors made a comprehensive study based on a multivariate experimental design and statistical tests such as ANOVA, PCA, and Doehlert Design. They used the best SPME coating for application in coffee beans, which in this case is a fibre consisting of divinylben-zene, carboxen, and polydimethylsiloxane (DVB/CAR/PDMS). Also they optimized the experimental variables that affect the extraction efficiency. The results with their coffee samples showed that it was possible to discriminate between Brazilian and Colombian samples by PCA, which demonstrated a great potential for their classification study. However, parameters such as the climatic conditions in terms of cultivation and the thermal roasting processes were not associated in the article.
Following the same research strategy, Akiyama et al. (2008) applied SPME with the same coating to differentiate the aroma from freshly brewed Ethiopian arabica coffee from the beans pro-duced in Guatemala and Tanzania. The GC analysis, with fused silica capillary column DB-WAX and He as a carrier gas, used a dif-ferent detector by olfactometry (O) that distinguished the samples mainly through the detection of 4-(4’-hydroxyphenyl)-2-butanona. This compound was quantified by internal normalization at levels of 1.63 ppb in lightly roasted coffee, using GC-MS under same conditions as GC-O and significantly higher ppb levels than other samples (Tukey’s HSD test, P < 0.01). Also the sensorial analyses provided an important contribution to characterize the aroma of Ethiopian coffee.
In addition to the use of HPLC, a few researchers have investi-gated the adulteration of coffee with addition of vegetable matter by GC. To identify the addition of corn, Jham et al. (2008) tested, after tocopherols by HPLC-fluorescence, the possibility to detect FA profiles based on the same methodology used by Martín et al. (2001). First, the authors evaluated the ratios between six FAs (pal-mitic, stearic, oleic, linoleic, linolenic, and arachidic acids) identified in Brazilian arabica coffee varieties in an analysis lasting only 6 min and they defined the ratio of linoleic and stearic acid as the most significant difference between coffee and corn (1.0% and 15.7% of average area). Despite the good correlation of this ratio with the percentage of roasted corn added in pure coffee (R2 = 0.996), this study was not a success, because the commercial coffee sam-ples, previously analysed using the tocopherol methodology, did
not show any significant difference from pure coffees by ANOVA (F-test, P > 0.05), preventing the use of these analytes as markers of adulteration with corn.
Oliveira et al. (2009) employed a methodology using SPME-GC-MS, similar to the Risticevic et al. (2008), with this objec-tive. The authors performed a comparison of the main substances responsible for the aroma of roasted coffee and roasted barley, at different roasting degrees, and, differently from the work by Jham et al. (2008), this method was efficient to check adulteration with barley at levels as low as 1% (w/w). Through the PCA analysis and a clear separation of the plots from roasted coffee and roasted bar-ley, the viability of the method was emphasized in the published article, especially for more severe conditions of the thermal process. Research involving the identification of the volatile compounds of roasted barley and other vegetable matrices would be a continua-tion to this paper.
GC-MS can also be applied to differentiate between different types of coffees such as the sensorial quality and presence of defects. Toledo et al. (2014) investigated blends of fleshly ground roasted arabica coffee certified with roasted arabica coffee of low quality, through SPME using a polymer ionic liquid sorbent previously syn-thesized and GC-FID with an SLB-5ms Supelco® capillary column, filled with polydiphenyldimethylsiloxane and 5% (w/w) diphenyl-siloxane, and He as the carrier gas. Among the analytes identified by GC-MS-EI, 11 volatile substances, including pyrazines, pyrazoles, ketones, furans, pyridines, and methoxyphenols, were highlighted as chemical markers for coffees of different qualities. This article differs from the others that used SPME as it applied different polymer ionic liquid sorbents.
Jumhawan et al. (2015) compared detection by FID and MS to authenticate Kopi Luwak coffee or civet coffee, the highest price coffee that is obtained from the excretions of civets (Paradoxurus hermaphroditus), a small Asian mammal whose gastrointestinal tract changes the chemical composition of coffee beans and con-fers a distinct and much appreciated sensory aspect to the bev-erage. Certified and commercial Kopi Luwak coffee, as well as regular coffee and blends of both types (n = 37), was used for the experiments. These authors used a GC with a CP-SIL 8 CB low bleed capillary column, consisting of polydimethylsiloxane with 5% (w/w) phenolic substances, and He as the carrier gas,
Figure 5. Chromatogram by gas chromatography (GC)-FID of the methyl esters of fatty acids in a coffee sample. Peaks: 1 = myristic acid (C14:0); 2 = palmitic acid (C16:0); 3 = palmitoleic acid (C16:1 cis, trans); 4 = C18:0, (5) C18:1 (v9cis, v7cis), (6) C18:2, (7) C18:3, (8) C20:0, (9) C20:1, (10) C22:0. *Reprinted (adapted) with permission from Martín et al. (2001). Copyright © 2001 Published by Elsevier Science B.V.
Fraud Investigation in Coffee by Chromatography 9
Downloaded from https://academic.oup.com/fqs/advance-article-abstract/doi/10.1093/fqsafe/fyy017/5041966by Empresa Brasileira de Pesquisa Agropecuaria (EMBRAPA) useron 22 June 2018
and statistical treatment by PCA and orthogonal projection to latent structures-discriminant analysis (OPLS-DA). According to the authors, the peaks by FID, such as citric and malic acid that contribute significantly to quality evaluation of this coffee type, showed higher intensity by MS and, therefore, a higher sensitivity and thus indicating the possibility of adopting GC-FID for routine analysis of authentication in the food industry.
Studies to differentiate healthy and defective beans, different maturation points or beans in the fermentation state at harvest of coffees often consumed in Brazil, were investigated in two studies by Agresti et al. (2008) and Toci and Farah (2008). The first authors discriminated the volatile fraction of defective beans (black, imma-ture, and sour) and non-defective beans, after the roasting process, by SPME with DVB/CAR/PDMS and GC-MS-EI under conditions similar to the previous article. Through PCA and CA, the results indicated that black and sour beans can be associated with fer-mentation of immature and healthy beans, respectively. Toci and Farah (2008), applying the same methodology, advanced this line of research, and suggested some potential chemical markers, among 97 substances identified in the raw and roasted defective Brazilian arabica beans such as 2-methylpyrazine and 2-furyl-methanol acetate (raw black-immature); butyrolactone (raw sour
beans); benzaldehyde and 2,3,5,6-tetramethylpyrazine (raw defect-ive beans in general); and pyrazine, 2,3-butanediol meso, 2-methyl-5-(1-propenyl)pyrazine, hexanoic acid, 2-methoxy-4-ethyl-phenol, and 1-methyl-4-[(1-methylethyl)thio]benzene (roasted defective beans in general). However, no statistics were disclosed by these authors; thus, further studies with a larger number of samples are needed to confirm these results.
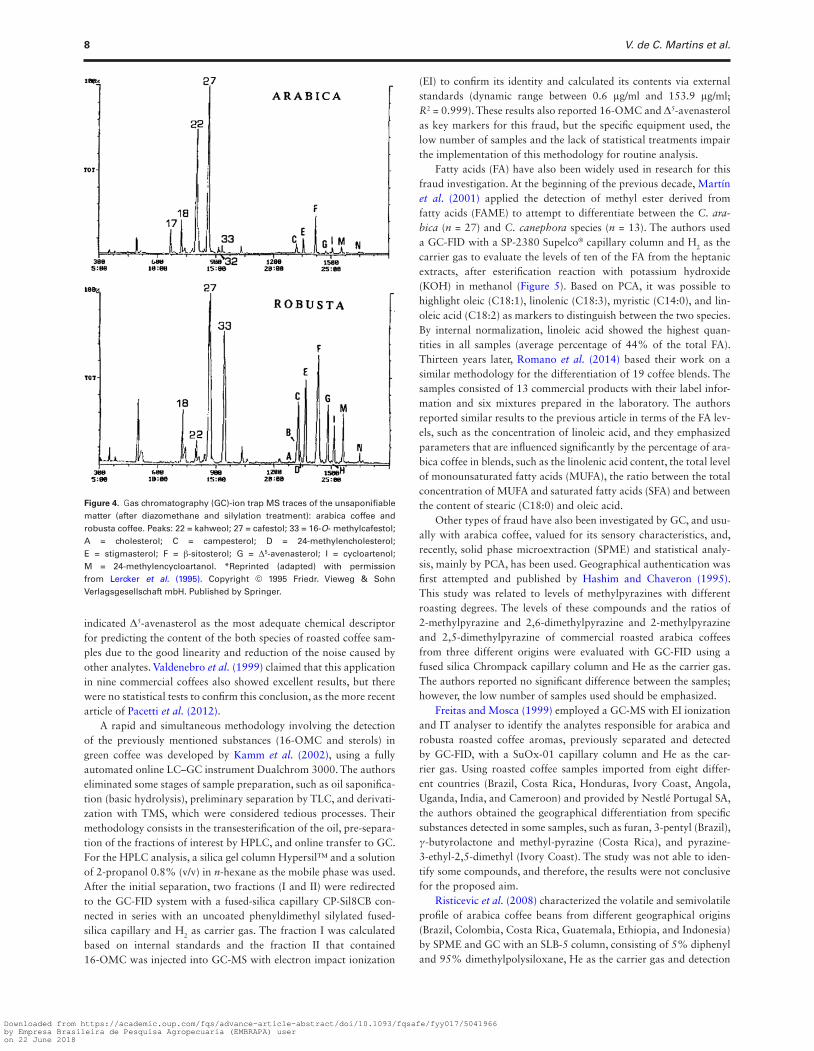
Latest advances of fraud analysis in coffeeVarious studies developed in the last year have employed liquid chromatography coupled to detection by MS, ensuring analyses with greater sensitivity, selectivity, and reliability. The study of betaines present in Coffea genus by Servillo et al. (2016) showed the possibility of using this distinct compound as an authentication marker for the presence of robusta coffee in commercial blends. The compound called homostachydrine or pipecolic acid betaine is a derivative from N-methylpipecolic acid. It was detected by HPLC, with a Supelco Discovery C8 column and mobile phase formic acid 0.1% aqueous solution, coupled to MS-ESI with a mass analyzer quadrupole (Q) and IT (Figure 6). The analysis of certified coffee showed, through external standard calibration, homostachydrine levels of 1.5 ppm and 31.0 ppm for arabica and
Figure 6. High-performance liquid chromatography (HPLC)-MSn analysis of extracts of green arabica and robusta beans, with representative MS2 extracted ion chromatograms conducted in MRM mode. (A) MS2 fragmentation patterns of homostachydrine (tr = 27.4 min), isolating at m/z 158.1. (B) MS2 (left) and MS3 (right) fragmentation patterns of N-methylpipecolic acid (tr = 20.2 min), isolating at m/z 144.1 (MS2) and at m/z 98.1 (MS3). *Reprinted (adapted) with permission from Servillo et al. (2016). Copyright © 2016 Published by Elsevier Ltd.
10 V. de C. Martins et al.
Downloaded from https://academic.oup.com/fqs/advance-article-abstract/doi/10.1093/fqsafe/fyy017/5041966by Empresa Brasileira de Pesquisa Agropecuaria (EMBRAPA) useron 22 June 2018

robusta samples, respectively. The potential use of this marker is also because of some characteristics such as the minimal sample treatment for the analysis, when compared with the 16-OMC extraction; the absence of variation in its content under similar conditions to the industrial roasting process (maximum of 210°C for 30 min); and a good correlation between declared percent-ages of robusta coffee in commercial roasted ground coffee blends tested by this methodology and estimated percentage by inverse regression line.
Research involving UPLC-MS is being developed for fraud analysis in coffee. The article of Mehari et al. (2016) investi-gated the profile of phenolic substances from 100 green coffee samples from different regions of Ethiopia by UPLC in reverse phase (Acquity BEH C18 Waters UPLC® column and mobile phase composed of a gradient mode with acetonitrile and formic acid 0.1% aqueous solution) coupled to a photodiode array detector and tandem MS-ESI in negative mode and QTOF. The analysis of the clarified extract in methanol identified 11 chlorogenic acids, among 18 detected substances in a run time of only 9 min, using the spectrum in the UV region, the ratio of mass/charge, and the fragmentation by MS-MS (Figure 7). The most important results pointed out the relation between high levels of 5-O-caffeoylquinic acid (5-CQA) and the samples of low sensory quality (46% to 59% of the total CGA), making it possible also to distinguish, by the content of the 4,5-O-dicaffeoylquinic acid, calculated in reference to 5-CQA, between coffee beans cultivated around the city of Harar, located in the eastern region and considered of higher quality and price compared with other Ethiopian coffees. The implementation of this strategy in monitoring of the coffee market depends on the future studies with roasted coffee, due to the known reductions in CGA levels in the thermal processing of green beans.
In addition to this article, investigations into coffee adulteration have returned to carbohydrates, such as in the previously mentioned articles by Santiago et al. (2012), Domingues et al. (2014), and Pauli et al. (2014), because these are usually adopted by public inspection agencies. The monosaccharide and oligosaccharide profiles can be determined by UPLC-MS for each adulterant. The application of UPLC in hydrophilic interaction liquid chromatog-raphy (HILIC) and high-resolution mass spectrometry (HRMS)
by Cai et al. (2016) also demonstrates the possibility of using this technique for quality control in the coffee industry. With 111 substances detected in a run time of 15 min, these authors determined the oligosaccharide profiles in coffee beans, soybeans, and rice, after derivatization with 2,4-bis-(diethylamino)-6-hydra-zine-1,3,5-triazine, and demonstrated by OPLS-DA that 8 and 5 of the substances originally present in rice and soybean, respectively, can be used as chemical markers to detect fraud in coffee. Through the results of five ground coffees plotted on a contour map gen-erated by a series of mixtures composed of rice and soybean, it was possible to estimate for one sample that the level of rice was approximately 10%. According to the authors, this methodol-ogy exhibited significant potential as a powerful tool for coffee qualification.
This last method seems promising for the number of compounds analysed in time, although only rice and soybean were tested, adul-terants less common than corn and husks, which has profiles very similar to coffee. Thus, it is necessary for more accurate evalua-tion to verify its efficiency, as to find qualitatively distinct markers for the different adulterants and quantitatively in relation to ion suppression.
Conclusion
Thus, the different research that has been developed over the last 30 years to investigate fraud in coffee has contributed to improve coffee quality and the sustainability of the coffee indus-try. Currently, there is no consensus on which is the most suit-able method for certain types of fraud, but some methodologies have been routinely applied such as carbohydrate analysis by HPLC and, mainly, pulsed amperometric detector, suggested by ISO 11292 (1995), SPME for volatile compounds, quantification of 16-O-methylcafestol in coffee blends, among others. However, analyses with the most accurate results and low sample prepa-ration and analysis time are extremely important in combating fraud. UPLC-MS analysis seems to be promising, due to low analysis time, greater sensitivity, and selectivity, but future studies should be performed with other common adulterants, to ensure qualitative and quantitative results imposed by the legislation and concerning routine analysis.
Figure 7. Typical chromatogram by ultra performance liquid chromatography coupled with tandem mass spectrometry (UPLC-MS-MS) of an Ethiopian green coffee extract, indicating the presence of eighteen phenolic compounds. Peaks: 4 = 3-O-caffeoylquinic acid (3-CQA); 5 = 5-O-caffeoylquinic acid (3-CQA); 6 = 4-O-caffeoylquinic acid (3-CQA); 8 = cis-5-O-caffeoylquinic acid (cis-5-CQA); 9 = 5-O-p-coumaroylquinic acid (5-pCoQA); 10 = 5-O-feruloylquinic acid (5-FQA); 12 = 3,4-di-O-caffeoylquinic acid (3,4-diCQA); 13 = 3,5-di-O-caffeoylquinic acid (3,5-diCQA); 14 = cis-3,5-di-O-caffeoylquinic acid (cis-3,5-diCQA); 15 = 4,5-di-O-caffeoylquinic acid (4,5-diCQA). *Reprinted (adapted) with permission from Mehari et al. (2016). Copyright © 2015 Published by Elsevier Inc.
Fraud Investigation in Coffee by Chromatography 11
Downloaded from https://academic.oup.com/fqs/advance-article-abstract/doi/10.1093/fqsafe/fyy017/5041966by Empresa Brasileira de Pesquisa Agropecuaria (EMBRAPA) useron 22 June 2018

AcknowledgementsThe authors acknowledge to Universidade Federal Rural do Rio de Janeiro (UFRRJ), Empresa Brasileira de Pesquisa Agropecuária (Embrapa) and Coordenação de Aperfeiçoamento de Pessoal de Nível Superior (CAPES) for their financial support (1020010/00542).
Conflict of interest statement. The authors declare that there is no conflict of interest.
ReferencesABIC – Associação Brasileira da Indústria de Café. (2018). Indicadores de
Desempenho da Cafeicultura Brasileira. http://abic.com.br/estatisticas/indicadores-da-industria/ accessed 6 March 2018.
Agresti, P. D. C. M., Franca, A. S., Oliveira, L. S., Augusti, R. (2008). Discrimination between defective and non-defective Brazilian coffee beans by their volatile profile. Food Chemistry, 106: 787–796.
Akiyama, M., et al. (2008). Characterization of headspace aroma com-pounds of freshly brewed arabica coffees and studies on a characteris-tic aroma compound of ethiopian coffee. Journal of Food Science, 73: C335–C346.
Alves, R. C., Casal, S., Alves, M. R., Oliveira, M. B. (2009). Discrimination between arabica and robusta coffee species on the basis of their tocopherol profiles. Food Chemistry, 114: 295–299.
Amboni, R. D. M. C., Francisco, A. D., Teixeira, E. (1999). Utilização de microscopia eletrônica de varredura para detecção de fraudes em café tor-rado e moído. Food Science and Technology, 19: 311–313.
Bagdonaite, K., Derler, K., Murkovic, M. (2008). Determination of acrylamide during roasting of coffee. Journal of Agricultural and Food Chemistry, 56: 6081–6086.
Barbin, D. F., Felicio, A. L. S. M., Sun, D-W., Nixdorf, S. L., Hirooka, E. Y. (2014). Application of infrared spectral techniques on quality and com-positional attributes of coffee: an overview. Food Research International, 61: 23–32.
Bernal, J. L., Del Nozal, M. J., Toribio, L., Del Alamo, M. (1996). HPLC Analysis of Carbohydrates in Wines and Instant Coffees Using Anion Exchange Chromatography Coupled to Pulsed Amperometric Detection. Journal of Agricultural and Food Chemistry, 44: 507–511.
Bicho, N. C., Leitão, A. E., Ramalho, J. C., Lidon, F. C. (2012). Use of colour parameters for roasted coffee assessment. Food Science and Technology, 32: 436–442.
Blanc, M. B., Davis, G. E., Parchet, J. M., Viani, R. (1989). Chromatographic profile of carbohydrates in commercial soluble coffees. Journal of Agricultural and Food Chemistry, 37: 926–930.
BRASIL – MINISTÉRIO DA AGRICULTURA, PECUÁRIA E ABASTECIMENTO. (2010). Instrução Normativa nº 16, de 24 de maio de 2010 – Regulamento Técnico para o Café Torrado em Grão e para o Café Torrado e Moído. http://sistemasweb.agricultura.gov.br/sislegis/action/detalhaAto.do?method=visualizarAtoPortalMapa&chave=794116535 accessed 6 March 2018.
Bresciani, L., Calani, L., Bruni, R., Brighenti, F., Del Rio, D. (2014). Phenolic composition, caffeine content and antioxidant capacity of coffee silver-skin. Food Research International, 61: 196–201.
Cai, T., Ting, H., Jin-Lan, Z. (2016). Novel identification strategy for ground coffee adulteration based on UPLC-HRMS oligosaccharide profiling. Food Chemistry, 190: 1046–1049.
Carrera, F., León-Camacho, M., Pablos, F., González, A. G. (1998). Authentication of green coffee varieties according to their sterolic profile. Analytica Chimica Acta, 370: 131–139.
Clifford, M. N., Jarvis, T. (1988). The chlorogenic acids content of green robusta coffee beans as a possible index of geographic origin. Food Chemistry, 29: 291–298.
Clifford, M. N., Shutler, S., Thomas, G. A., Ohiokpehai, O. (1987). The chlo-rogenic acids content of coffee substitutes. Food Chemistry, 24: 99–107.
Correia, A. M. N. G., Leitão, M. C. A., Clifford, M. N. (1995). Caffeoyl-tyrosine and Angola II as characteristic markers for Angolan robusta cof-fees. Food Chemistry, 53: 309–313.
DIN 10779. (1999). Analysis of coffee and coffee products – Determination of 16-O-methylcafestol content of roasted coffee – HPLC-method. Deutsches Institut für Normung e. V., Berlin.
Domingues, D. S., et al. (2014). Detection of roasted and ground coffee adul-teration by HPLC and by amperometric and by post-column derivatiza-tion UV-vis detection. Food Chemistry, 146: 353–362.
Esquivel, P., Jiménez, V. M. (2012). Functional properties of coffee and coffee by-products. Food Research International, 46: 488–495.
Ferreira, T., Farah, A., Oliveira, T. C., Lima, I. S., Vitório, F., Oliveira, E. M. (2016). Using real-time PCR as a tool for monitoring the authenticity of commercial coffees. Food Chemistry, 199: 433–438.
Franca, A. S., Mendonça, J. C. F., Oliveira, S. D. (2005). Composition of green and roasted coffees of different cup qualities. LWT – Food Science and Technology, 38: 709–715.
Freitas, A. M. C., Mosca, A. I. (1999). Coffee geographic origin—an aid to cof-fee differentiation. Food Research International, 32: 565–573.
Garcia, L. M., Pauli, E. D., Cristiano, V., da Camara, C. A., Scarminio, I. S., Nixdorf, S. L. (2009). Chemometric evaluation of adulteration profile in coffee due to corn and husk by determining carbohydrates using HPAEC-PAD. Journal of Chromatographic Science, 47: 825–832.
González, A. G., Pablos, F., Martín, M. J., León-Camacho, M., Valdenebro, M. S. (2001). HPLC analysis of tocopherols and triglycerides in coffee and their use as authentication parameters. Food Chemistry, 73: 93–101.
Gonzalez-Rios, O., Suarez-Quiroz, M. L., Boulanger, R., Barel, M., Guyot, B., Guiraud, J-P., Schorr-Galindo, S. (2007a). Impact of “ecological” post-harvest processing on the volatile fraction of coffee beans: I. Green coffee. Journal of Food Composition and Analysis, 20: 289–296.
Gonzalez-Rios, O., Suarez-Quiroz, M. L., Boulanger, R., Barel, M., Guyot, B., Guiraud, J-P., Schorr-Galindo, S. (2007b). Impact of “ecological” post-harvest processing on coffee aroma: II. Roasted coffee. Journal of Food Composition and Analysis, 20: 297–307.
Hall, S., et al. (2015). A review of the bioactivity of coffee, caffeine and key coffee constituents on inflammatory responses linked to depression. Food Research International (Ottawa, Ont.), 76: 626–636.
Hashim, L., Chaveron, H. (1995). Use of methylpyrazine ratios to monitor the coffee roasting. Food Research International, 28: 619–623.
IBGE - Instituto Brasileiro de Geografia e Estatística. (2018). Levantamento Sistemático da Produção Agrícola – Janeiro de 2018. https://www.ibge.gov.br/estatisticas-novoportal/economicas/agricultura-e-pecuaria/9201-levantamento-sistematico-da-producao-agricola.html?&t=resultados accessed 6 March 2018.
ICO - International Coffee Organization. (2016). Guidelines for the Prevention of Mould Formation in Coffee. http://dev.ico.org/documents/ed1988e.pdf accessed 6 March 2018.
ICO - International Coffee Organization. (2018). Trade Statistic Tables. http://www.ico.org/trade_statistics.asp?section=Statistics accessed 6 March 2018.
Jham, G. N., Berhow, M. A., Manthey, L. K., Palmquist, D. A., Vaughn, S. F. (2008). The use of fatty acid profile as a potential marker for Brazilian coffee (Coffea arabica L.) for corn adulteration. Journal of Brazilian Chemical Society, 19: 1462–1467.
Jham, G. N., Winkler, J. K., Berhow, M. A., Vaughn, S. F. (2007). Gamma-tocopherol as a marker of brazilian coffee (coffea arabica L.) Adulteration by corn. Journal of Agricultural and Food Chemistry, 55: 5995–5999.
Jumhawan, U., Putri, S. P., Yusianto, Bamba, T., Fukusaki, E. (2015). Application of gas chromatography/flame ionization detector-based metabolite fingerprinting for authentication of asian palm civet cof-fee (kopi luwak). Journal of Bioscience and Bioengineering, 120: 555–561.
Kamm, W., Dionisi, F., Fay, L. B., Hischenhuber, C., Schmarr, H. G., Engel, K. H. (2002). Rapid and simultaneous analysis of 16-O-methylcafestol and sterols as markers for assessment of green coffee bean authenti-city by online LC–GC. Journal of American Oil Chemical Society, 79: 1109–1113.
Lercker, G., Frega, N., Bocci, F., Rodriguez-Estrada, M. T. (1995). High reso-lution gas chromatographic determination of diterpenic alcohols and ster-ols in coffee lipids. Chromatographia, 41: 29–33.
12 V. de C. Martins et al.
Downloaded from https://academic.oup.com/fqs/advance-article-abstract/doi/10.1093/fqsafe/fyy017/5041966by Empresa Brasileira de Pesquisa Agropecuaria (EMBRAPA) useron 22 June 2018

Martín, M. J., Pablos, F., González, A. G. (1998). Discrimination between arabica and robusta green coffee varieties according to their chemical composition. Talanta, 46: 1259–1264.
Martin, M. X., Pablos, F., González, A. G., Valdenebro, M. X., León-Camacho, M. (2001). Fatty acid profiles as discriminant parameters for coffee varie-ties differentiation. Talanta, 54: 291–297.
Mehari, B., Redi-Abshiro, M., Chandravanshi, B. S., Combrinck, S., Atlabachew, M., McCrindle, R. (2016). Profiling of phenolic compounds using UPLC–MS for determining the geographical origin of green cof-fee beans from Ethiopia. Journal of Food Composition and Analysis, 45: 16–25.
Murkovic, M., Derler, K. (2006). Analysis of amino acids and carbohydrates in green coffee. Journal of Biochemical and Biophysical Methods, 69: 25–32.
Narita, Y., Inouye, K. (2014). Review on utilization and composition of coffee silverskin. Food Research International, 61: 16–22.
Oliveira, E. M. M., Farah, A., Freitas-Silva, O., de Souza, A. M., dos Santos, M. T. F., Santiago, M. C. P. A. (2015). Chapter 105: Overview of currently applied techniques for detection of adulterants in coffee and potential use of DNA-based methods as promising new analytical tools. In: Preedy V. R. (ed.) Coffee in Health and Disease Prevention. Academic Press, San Diego, pp. 953–961.
Oliveira, R. C. S., Oliveira, L. S., Franca, A. S., Augusti, R. (2009). Evaluation of the potential of SPME-GC-MS and chemometrics to detect adulteration of ground roasted coffee with roasted barley. Journal of Food Composition and Analysis, 22: 257–261.
Pacetti, D., Boselli, E., Balzano, M., Frega, N. G. (2012). Authentication of italian espresso coffee blends through the GC peak ratio between kahweol and 16-O-methylcafestol. Food Chemistry, 135: 1569–1574.
Parras, P., Martínez-Tomé, M., Jiménez, A. M., Murcia, M. A. (2007). Antioxidant capacity of coffees of several origins brewed following three different procedures. Food Chemistry, 102: 582–592.
Paterson, R. R. M., Lima, N., Taniwaki, M. H. (2014). Coffee, mycotoxins and climate change. Food Research International, 61: 1–15.
Pauli, E. D., et al. (2014). Detection of ground roasted coffee adulteration with roasted soybean and wheat. Food Research International, 61: 112–119.
Risticevic, S., Carasek, E., Pawliszyn, J. (2008). Headspace solid-phase micro-extraction-gas chromatographic-time-of-flight mass spectrometric meth-odology for geographical origin verification of coffee. Analytica Chimica Acta, 617: 72–84.
Romano, R., Santini, A., Le Grottaglie, L., Manzo, N., Visconti, A., Ritieni, A. (2014). Identification markers based on fatty acid composition to
differentiate between roasted Arabica and Canephora (Robusta) coffee varieties in mixtures. Journal of Food Composition and Analysis, 35: 1–9.
Sano, E. E., Assad, E. D., Cunha, S. A. R., Correa, T. B. S., Rodrigues, H. R. (2003). Quantifying adulteration in roast coffee powders by digital image processing. Journal of Food Quality, 26: 123–134.
Santiago, M. C. P. A., Godoy, R. L. O., Licurgo, F. M. S., Rosa, J. S., Pacheco, S., Nascimento, L. S. M. (2012). Adaptations in HPLC method for fraud determination in coffee. Presented at the 7º Encontro Nacional de Cromatografia da Sociedade Portuguesa de Química, Porto, Portugal, Jan 9–11, 2012.
Servillo, L., et al. (2016). Homostachydrine (pipecolic acid betaine) as authen-tication marker of roasted blends of Coffea arabica and Coffea canephora (robusta) beans. Food Chemistry, 205: 52–57.
Skarka, B. S., Radej, Z. (1958). Proof of adulteration of coffee with substitutes by means of paper chromatography. Průmysl potravin, 4.
Smith, R. M. (1981). Determination of 5-hydroxymethylfurfural and caffeine in coffee and chicory extracts by high performance liquid chromatog-raphy. Food Chemistry, 7: 41–45.
Speer, K. (1989). 16-O-Methylcafestol – ein neues Diterpen im Kaffee. Z Lebensm Unters Forsch, 189: 326–330.
Tavares, K. M., Lima, A. R., Nunes, C. A., Silva, V. A., Mendes, E., Casal, S., Pereira, R. G. F. A. (2016). Free tocopherols as chemical markers for Arabica coffee adulteration with maize and coffee by-products. Food Control, 70: 318–324.
Tavares, K. M., Pereira, R. G. F. A., Nunes, C. A., Pinheiro, A. C. M., Rodarte, M. P., Guerreiro, M. C. (2012). Espectroscopia no infravermelho médio e análise sensorial aplicada à detecção de adulteração de café torrado por adição de cascas de café. Química Nova, 35: 1164–1168.
THE LANCET. (1851). The Analytical Sanitary Commission. Coffee and its adulterations. The Lancet, 57: 21–26.
THE LANCET. (1853). The Analytical Sanitary Commission. Coffee and its adulterations. The Lancet, 61: 418.
Toci, A. T., Farah, A. (2008). Volatile compounds as potential defective coffee beans’ markers. Food Chemistry, 108: 1133–1141.
Toledo, B. R., Hantao, L. W., Ho, T. D., Augusto, F., Anderson, J. L. (2014). A chemometric approach toward the detection and quantification of coffee adulteration by solid-phase microextraction using polymeric ionic liquid sorbent coatings. Journal of Chromatography. A, 1346: 1–7.
Valdenebro, M. S., León-Camacho, M., Pablos, F., González, A. G., Martín, M. J. (1999). Determination of the arabica/robusta composition of roasted coffee according to their sterolic content. The Analyst, 24: 999–1002.
Fraud Investigation in Coffee by Chromatography 13
Downloaded from https://academic.oup.com/fqs/advance-article-abstract/doi/10.1093/fqsafe/fyy017/5041966by Empresa Brasileira de Pesquisa Agropecuaria (EMBRAPA) useron 22 June 2018


