FRAPCON-3 Updates, Including Mixed-Oxide Fuel Properties · FRAPCON-3 Updates, Including...
144
NUREG/CR-6534, Vol. 4 PNNL–11513 FRAPCON-3 Updates, Including Mixed-Oxide Fuel Properties Pacific Northwest National Laboratory U.S. Nuclear Regulatory Commission Office of Nuclear Regulatory Research Washington, DC 20555-0001
Transcript of FRAPCON-3 Updates, Including Mixed-Oxide Fuel Properties · FRAPCON-3 Updates, Including...

NUREG/CR-6534, Vol. 4
PNNL–11513
FRAPCON-3 Updates, IncludingMixed-Oxide Fuel Properties
Pacific Northwest National Laboratory
U.S. Nuclear Regulatory Commission
Office of Nuclear Regulatory Research
Washington, DC 20555-0001

DISCLAIMER: This report was prepared as an account of work sponsored by an agency of the U.S. Government. Neither the U.S. Government nor any agency thereof, nor any employee, makes any warranty, expressed orimplied, or assumes any legal liability or responsibility for any third party’s use, or the results of such use, of anyinformation, apparatus, product, or process disclosed in this publication, or represents that its use by such thirdparty would not infringe privately owned rights.
AVAILABILITY OF REFERENCE MATERIALS
IN NRC PUBLICATIONS
NRC Reference Material
As of November 1999, you may electronically accessNUREG-series publications and other NRC records atNRC’s Public Electronic Reading Room at http://www.nrc.gov/reading-rm.html. Publicly releasedrecords include, to name a few, NUREG-seriespublications; Federal Register notices; applicant,licensee, and vendor documents and correspondence;NRC correspondence and internal memoranda;bulletins and information notices; inspection andinvestigative reports; licensee event reports; andCommission papers and their attachments.
NRC publications in the NUREG series, NRCregulations, and Title 10, Energy, in the Code ofFederal Regulations may also be purchased from oneof these two sources.1. The Superintendent of Documents U.S. Government Printing Office Mail Stop SSOP Washington, DC 20402–0001 Internet: bookstore.gpo.gov Telephone: 202-512-1800 Fax: 202-512-22502. The National Technical Information Service Springfield, VA 22161–0002 www.ntis.gov 1–800–553–6847 or, locally, 703–605–6000
A single copy of each NRC draft report for comment isavailable free, to the extent of supply, upon writtenrequest as follows:Address: Office of the Chief Information Officer, Reproduction and Distribution Services Section U.S. Nuclear Regulatory Commission Washington, DC 20555-0001E-mail: [email protected] Facsimile: 301–415–2289
Some publications in the NUREG series that are posted at NRC’s Web site addresshttp://www.nrc.gov/reading-rm/doc-collections/nuregs are updated periodically and may differ from the lastprinted version. Although references to material foundon a Web site bear the date the material wasaccessed, the material available on the date cited maysubsequently be removed from the site.
Non-NRC Reference Material
Documents available from public and special technicallibraries include all open literature items, such asbooks, journal articles, and transactions, FederalRegister notices, Federal and State legislation, andcongressional reports. Such documents as theses,dissertations, foreign reports and translations, andnon-NRC conference proceedings may be purchasedfrom their sponsoring organization.
Copies of industry codes and standards used in asubstantive manner in the NRC regulatory process aremaintained at—
The NRC Technical Library Two White Flint North11545 Rockville PikeRockville, MD 20852–2738
These standards are available in the library for reference use by the public. Codes and standards areusually copyrighted and may be purchased from theoriginating organization or, if they are AmericanNational Standards, from—
American National Standards Institute11 West 42nd StreetNew York, NY 10036–8002www.ansi.org 212–642–4900
Legally binding regulatory requirements are statedonly in laws; NRC regulations; licenses, includingtechnical specifications; or orders, not in NUREG-series publications. The views expressedin contractor-prepared publications in this seriesare not necessarily those of the NRC.
The NUREG series comprises (1) technical andadministrative reports and books prepared by thestaff (NUREG–XXXX) or agency contractors(NUREG/CR–XXXX), (2) proceedings ofconferences (NUREG/CP–XXXX), (3) reportsresulting from international agreements(NUREG/IA–XXXX), (4) brochures(NUREG/BR–XXXX), and (5) compilations of legaldecisions and orders of the Commission andAtomic and Safety Licensing Boards and ofDirectors’ decisions under Section 2.206 of NRC’sregulations (NUREG–0750).

NUREG/CR-6534, Vol. 4
PNNL-11513
FRAPCON-3 Updates, Including
Mixed-Oxide Fuel Properties
Manuscript Completed: May 2005
Date Published: May 2005
Prepared by
D. D. Lanning, C. E. Beyer, K.J.Geelhood
Pacific Northwest National Laboratory
Richland, WA 99352
Prepared for
Division of Systems Analysis and Regulatory Effectiveness
Office of Nuclear Regulatory Research
U.S. Nuclear Regulatory Commission
Washington, DC 20555-0001
NRC Job Code Y6586


ABSTRACT
The FRAPCON-3 code has been altered by a number of additions to form version FRAPCON-3.3.
The major changes include an improved model for the urania fuel pellet thermal conductivity; the
addition of mixed plutonia-urania oxide (MOX) fuel pellet thermal properties and other parameters to
facilitate analysis of MOX fuel rod performance; and the addition of corrosion and hydrogen pickup
parameters appropriate to advanced cladding types. This volume contains descriptions and discussions
of these and other revisions.
The document also contains code-data comparisons of MOX fuel temperatures used to verify the
MOX fuel pellet thermal conductivity model, and similar comparisons for urania fuel rods. The total
sequence of code revisions that have led from the last-published version of FRAPCON-3 (NUREG/
CR-6534, Volume 2, 1997) to the latest issued version, FRAPCON-3.3, is also given.
iii


v
FOREWORD
Computer codes related to fuel performance have played an important role in the work of the U.S.
Nuclear Regulatory Commission (NRC) since the agency’s inception in 1975. Formal requirements for
fuel performance analysis appear in several of the agency’s regulatory guides and regulations, including
those related to emergency core cooling system evaluation models, as set forth in Appendix K to Title 10,
Part 50, of the Code of Federal Regulations (10 CFR Part 50), “Domestic Licensing of Production and
Utilization Facilities.” Nonetheless, these codes and requirements must evolve to reflect changes in the
reactor fuel design. For example, recent initiatives in the U.S. Department of Energy’s Surplus Plutonium
Disposition Program will incorporate urania-plutonia or mixed-oxide (MOX) fuel for the first time in a
commercial nuclear power plant. This made it necessary to seek new experimental data, and to modify
and validate the code predictions for proposed new fuel designs.
FRAPCON-3.3, described in this report, is the most recent addition to the series of fuel performance
codes developed by Pacific Northwest National Laboratory (PNNL) and used by the NRC. This version
of the FRAPCON code incorporates modifications to predict the behavior of material used in the Surplus
Plutonium Disposition Program. Although similar in many respects to more traditional low-enrichment
urania fuel, MOX fuel exhibits some differences. For fuel performance, the most notable difference is
thermal conductivity, which is suppressed with the addition of plutonia. This difference results in higher
fuel temperatures at a given linear heat generation rate and must be accounted for in fuel performance
analyses.
Changes in the FRAPCON code to account for the addition of plutonia were documented and made public
during the MOX hearings for the Catawba Nuclear Station. This report formally captures that
information along with other recent code changes, and reviews the experimental data used to validate the
code predictions. In so doing, this report supplements three previous volumes of information on
FRAPCON in the NUREG/CR-6534 series.
The current report is also noteworthy because of its extensive use of experimental data from test reactor
programs (particularly the Halden Reactor Project sponsored by the Nuclear Energy Agency of the
Organization for Economic Cooperation and Development). These data, which the NRC obtained under
an international agreement, demonstrate that the analytical tools used by the NRC staff are more than
adequate for a wide variety of fuel designs and reactor conditions. As presented in this report, these data
and the PNNL analyses have contributed significantly to our understanding of nuclear fuel behavior.
Carl J. Paperiello, Director
Office of Nuclear Regulatory Research
U.S. Nuclear Regulatory Commission


vii
CONTENTS
Abstract ........................................................................................................................................................ iii
Foreword....................................................................................................................................................... v
Contents ......................................................................................................................................................vii
List of Figures ......................................................................................................................................... ix
List of Tables ........................................................................................................................................... x
Executive Summary ..................................................................................................................................... xi
Abbreviations.............................................................................................................................................xiii
1.0 INTRODUCTION ......................................................................................................................... 1.1
2.0 URANIA FUEL PELLET THERMAL CONDUCTIVITY UPDATE......................................... 2.1
2.1 Revised Urania Pellet Thermal Conductivity Model........................................................... 2.1
2.2 Adjustment for Gadolinia Additions.................................................................................... 2.4
2.3 Verification of the Urania Pellet Thermal Conductivity...................................................... 2.5
2.3.1 Verification of the Urania-Gadolinia Model .......................................................... 2.9
2.4 Range of Application and Uncertainties ............................................................................ 2.11
3.0 MODELING CHANGES FOR EXTENSION TO MOX FUEL................................................... 3.1
3.1 Thermal Conductivity Model for MOX Fuel Pellets ........................................................... 3.1
3.1.1 Background on MOX Fuel Thermal Conductivity................................................. 3.1
3.1.2 Description of the MOX Fuel Thermal Conductivity Models................................ 3.2
3.1.3 Verification of the Duriez/NFI Combined Model .................................................. 3.5
3.1.4 Range of Application and Uncertainties for MOX Thermal Conductivity ............ 3.7
3.2 Fission Gas Release Model Changes for MOX ................................................................... 3.8
3.2.1 The Model Changes................................................................................................ 3.8
3.2.2 Model Verification ................................................................................................. 3.8
3.3 Xe/Kr Ratio.......................................................................................................................... 3.9
3.4 Helium Production and Release........................................................................................... 3.9
3.5 Input Plutonium Isotopes for Radial Power Profile........................................................... 3.10
3.6 MOX Fuel Heat Capacity .................................................................................................. 3.11
3.7 Melting Temperature for MOX ......................................................................................... 3.13
3.8 Thermal Expansion, Densification, and Swelling for MOX.............................................. 3.13
4.0 REVISED PARAMETERS FOR THE URANIA FGR MODEL ................................................. 4.1
4.1 Massih Diffusion Coefficient Model Changes .................................................................... 4.1

viii
4.1.1 Model Verification ................................................................................................. 4.1
4.1.2 Ranges of Application and Uncertainties for Urania FGR..................................... 4.5
4.2 Numerical Solution Improvements ...................................................................................... 4.5
4.2.1 Improved Numerical Solution ................................................................................ 4.5
4.2.2 Use of Radial Burnup Profile ................................................................................. 4.6
4.2.3 Modeling of Fission Gas Release During Power Ramps ....................................... 4.6
4.3 Corrections to the ANS5.4 Model ....................................................................................... 4.6
5.0 MODIFICATIONS FOR CLADDING CORROSION AND ITS EFFECTS .............................. 5.1
5.1 Modifications for ZIRLOTM Cladding: Changes and Verification ...................................... 5.1
5.2 Modifications for M5TM Cladding: Changes and Verification ............................................ 5.4
5.3 Ranges of Application and Uncertainty for Cladding Corrosion......................................... 5.5
5.4 Confirmation BWR Corrosion Rate and Hydrogen Pickup for Zircaloy-2 ......................... 5.5
5.5 Adjustment of Stress Calculations for Clad Wall Thinning Due to Corrosion.................... 5.8
5.6 New Hydrogen Solubility Function for Zircaloy Cladding ................................................. 5.9
6.0 CODE CAPABILITY ENHANCEMENTS .................................................................................. 6.1
6.1 Input Option to Restrict Fission Gas Release ...................................................................... 6.1
6.2 Input Option to Impose Cladding Surface Temperature Profiles ........................................ 6.1
6.3 FORTRAN 90 Compliance ................................................................................................. 6.2
7.0 REFERENCES .............................................................................................................................. 7.1
Appendix A – Code-Data Comparisons for MOX Fuel Temperatures..................................................... A.1
Appendix B – Summary of Code Changes Since FRAPCON Version 1.0 .............................................. B.1
Appendix C – Input Instructions for FRAPCON-3.3 ............................................................................... C.1

ix
LIST OF FIGURES
2.1 The Lucuta, Unmodified NFI, and Modified NFI Fuel Pellet Thermal Conductivity Models
Compared at 5 GWd/tU Burnup ........................................................................................................ 2.3
2.2 The Lucuta, Unmodified NFI, and Modified NFI Fuel Pellet Thermal Conductivity Models
Compared at 30 GWd/tU Burnup ...................................................................................................... 2.3
2.3 The Lucuta, Unmodified NFI, and Modified NFI Fuel Pellet Thermal Conductivity Models
Compared at 60 GWd/tU Burnup ...................................................................................................... 2.4
2.4 Modified NFI and Lucuta Model Predictions Compared to Measured Conductivity on
Unirradiated Pellet Material (Ronchi et al., 1999 ITU Data)............................................................. 2.5
2.5 Comparison of Modified NFI Fuel Pellet Thermal Conductivity to Ronchi et al. (2004)
ITU Data for High Burnup Pellet Material ........................................................................................ 2.6
2.6 The Lucuta and Modified NFI Models Compared to Postirradiation Thermal Conductivity
Measurements from Carrol et al. (1994) for BWR Pellet Samples with 40 GWd/tU Burnup........... 2.7
2.7 FRAPCON-3 Fuel Temperature Predictions Compared to the Halden Ultra High
Burnup (HUHB) Data with the Indicated Thermal Conductivity Models in the Code...................... 2.7
2.8 Code-Data Comparison for Fuel Center Temperatures for Rod-3 of Halden Experiment
IFA-432.............................................................................................................................................. 2.8
2.9 Code Data Comparison for Fuel Center Temperatures for Halden Experiment
IFA-597.3 Rod 8 ................................................................................................................................ 2.9
2.10 The Modified NFI Model with the Massih Adjustment for Gadolinia, Compared to
Various Data Correlations at 8.0 Wt.% Gadolinia........................................................................... 2.10
2.11 Comparison between Modified NFI (with Massih correction for Gadolinia) and
Unirradiated Urania Gadolinia Data Trend from Hirai and Ishimoto (1991) at
8.5 wt.% Gadolinia Content............................................................................................................. 2.10
3.1 Predicted vs. Measured Fuel Center Temperatures for Halden MOX Tests...................................... 3.6
3.2 Predicted Minus Measured Normalized Temperature Difference for MOX Test Cases
as a Function of Burnup..................................................................................................................... 3.6
3.3 Predicted Minus Measured Normalized Temperature Difference for MOX Test Cases
as a Function of LHGR...................................................................................................................... 3.7
3.4 Predicted vs. Measured FGR, Diffusion Constant x 1.75.................................................................. 3.8
3.5 MCNP and FRAPCON-3 Calculations of Normalized Radial Power Profile in PWR
MOX Fuel at 50 GWd/MTHM........................................................................................................ 3.11
3.6 Urania and Plutonia Heat Capacities and Heat Capacity for 7 wt.% plutonia MOX....................... 3.12
3.7 Urania and Plutonia Heat Capacities as Calculated by MATPRO-11 Correlation and by the
Correlation of Popov et al. (2000) ................................................................................................... 3.13

x
4.1 Predicted vs. Measured FGR for Steady-State Assessment Cases Using FRAPCON-3.3 ................ 4.3
4.2 Predicted vs. Measured FGR for Power Ramp Assessment Cases Using FRAPCON-3.3................ 4.4
4.3 Predicted Minus Measured FGR as a Function of Burnup for Steady State Assessment
Cases Using FRAPCON-3.3.............................................................................................................. 4.4
4.4 Predicted Minus Measured FGR as a Function of Burnup for Power Ramp Assessment
Cases Using FRAPCON-3.3.............................................................................................................. 4.5
5.1 Comparison of FRAPCON-3 (Zircaloy-4) Calculated Corrosion with Westinghouse
Data (Small Dots) for ZIRLO™, as a Function of Fuel Duty Index (FDI) ....................................... 5.2
5.2 Comparison of FRAPCON-3 Calculated Zircaloy-4 Corrosion (Closed Symbols),
Modified FRAPCON-3 (ZIRLOTM) Calculated Corrosion (Open Symbols), and
Westinghouse Data Trend for ZIRLOTM (Solid Line), as a Function of FDI .................................... 5.2
5.3 Hydrogen Pickup Data (Closed Circles) and Modified FRAPCON-3 Calculations
(Open Symbols), for ZIRLO™ Cladding .......................................................................................... 5.3
5.4 Comparison of Unmodified FRAPCON-3 Zircaloy-4 Corrosion (Solid Symbols, x Symbol,
and Modified FRAPCON-3 [M5TM] Corrosion (Open Symbols and + Symbol) Against
FRAMATOME Corrosion Data for M5TM Cladding......................................................................... 5.4
5.5 Hydrogen Pickup Data (Closed Circles) and Modified FRAPCON-3 Calculations for
M5TM Cladding (Hydrogen Pickup Fraction is Reduced from 15% to 7.5%) ................................... 5.5
5.6 Japanese/Spanish BWR Zircaloy-2 Corrosion Data and FRAPCON 3 Calculations ........................ 5.6
5.7 Japanese Halden Test BWR Zircaloy-2 Corrosion Data and FRAPCON-3 Calculations ................. 5.6
5.8 GE BWR Zircaloy-2 Corrosion Data and FRAPCON-3 Calculations .............................................. 5.7
5.9 Measured In-Reactor Hydrogen Pickup Fractions in Zircaloy-2 Coupons Compared to
the FRAPCON-3 Value ..................................................................................................................... 5.8
LIST OF TABLES
2.1 Measured Fuel Pellet Material Thermal Conductivity and Calculated Values.................................. 2.6
3.1 Instrumented MOX Tests in Halden. All with Re-fabricated PWR Rod Sections
Containing MIMAS MOX Fuel......................................................................................................... 3.5
3.2 Helium Results from Halden Test High-Burnup PWR MOX “Mother Rods”................................ 3.10
3.3 Parameter Values for Urania and Plutonia Fuel Heat Capacity and Enthalpy................................. 3.12
4.1 Steady State Cases Used in the Assessment and Validation of FRAPCON-3.3................................ 4.2
4.2 Power Ramp Cases Used in the Assessment and Validation of FRAPCON-3.3............................... 4.3

EXECUTIVE SUMMARY
The FRAPCON-3 fuel rod performance code is sponsored by the U.S. Nuclear Regulatory Commission
(NRC) for evaluating light water reactor (LWR) fuel performance and is maintained by Pacific Northwest
National Laboratory (PNNL). The code is used by fuel experts from a large number of organizations
worldwide.
This document discusses the modifications and additions to the FRAPCON-3 code that results in the
currently issued version FRAPCON-3.3. The major modifications include an improved thermal
conductivity model for urania that provides a better prediction of fuel temperatures at high burnups and at
high temperatures. The improved model contains the same adjustment for urania-gadolinia conductivity
as provided in the previous conductivity correlation for urania documented in Volume 1 of
NUREG/CR6534. This adjustment for gadolinia additions to the current urania correlation was
confirmed to provide a good prediction to out-of reactor measurements of unirradiated urania-gadolinia
thermal conductivity.
The improved thermal conductivity model also required that the fission gas release (FGR) model be
recalibrated and verified. Several new fuel temperature and FGR data were used to recalibrate and verify
the thermal conductivity and FGR models including new data from the Halden test reactor with fuel
burnups up to 70 GWd/MTU and beyond (temperature only). The modifications to the UO2 models have
shown that the code provides a good prediction of UO2 fuel temperatures and FGR up to rod-average
burnups of 62 GWd/MTU. The code has been verified against a small amount of data beyond this burnup
level but these data are not judged to be of sufficient quantity to provide confidence in predictions beyond
this burnup level.
Additions and modifications were also performed to model the performance of mixed oxide (MOX) fuel
in LWRs. The most important were adding a new thermal conductivity model and increasing the
diffusion coefficient in the FGR model to better predict the measured fuel temperature and FGR data from
MOX fuel. The modifications have shown that the code provides a good prediction of MOX fuel
temperatures up to rod-average burnups of 62 GWd/MTU. While there are FGR data from MOX fuel up
to 65 GWd/MTU the code’s predictions of MOX fission gas release are of much greater uncertainty than
the UO2 FGR model due to the scarcity of the MOX data. Helium production and release models used for
urania are not presently altered for MOX fuel.
The corrosion and hydrogen pickup characteristics of the advanced new alloys of ZIRLOTM and M5TM
were added to the code by modifying the current corrosion model for Zircaloy-4 by multiplication factors
(< 1.0) appropriate to each alloy, and by reducing the current hydrogen pickup fraction. It is anticipated
that a more comprehensive corrosion model will be developed in the future for the code but this simple
modification has been shown to provide a good prediction of corrosion for these advanced alloys.
This document also describes additional updates and corrections to existing models and provides
traceability for all corrections and updates made since the last published code description documentation
(NUREG/CR-6534 Volumes 1, 2 and 3).
xi


ABBREVIATIONS
ALHR average linear heat rate
at.% atom percent
atm atmosphere
ATR advanced test reactor
BOL beginning-of-life
BWR boiling-water reactor
°C degrees Celsius
cm centimeters
DOE U.S. Department of Energy
EOL end-of-life
°F degrees Fahrenheit
FDI fuel duty index
ft feet
FGR fission gas release
Gd2O3 gadolinia
GWd/MTHM gigawatt days per metric ton of heavy metal, referring to MOX fuel
GWd/MTU gigawatt days per metric ton of uranium
GWd/MTUO2 gigawatt days per metric ton of uranium dioxide
GWd/tU gigawatt days per tonne of uranium
HBWR Halden Boiling-Water Reactor
HUHB Halden Ultra High Burnup
in. inches
ITU Institute for Transuranium Elements
K kelvin
kg kilograms
kW/ft kilowatts per foot
kW/m kilowatts per meter
LHGR linear heat generation rate
LSQ least-squares
LWR light-water reactor
MCWO Monte Carlo N-particle (transport) code Coupled With ORIGEN-2
mm millimeters
xiii

MOX mixed oxide
MPa megapascal
NFI Nuclear Fuels Industries
NRC U.S. Nuclear Regulatory Commission
PIE postirradiation examination
PNNL Pacific Northwest National Laboratory
ppm parts per million
psi pounds per square inch
PWR pressurized water reactor
PuO2 plutonia
SBR short binderless route
TD theoretical density
Torr unit of pressure equaling approximately 133.3 pascals (after Torrcelli)
UO2 urania
wt.% weight percent
xiv

1.0 INTRODUCTION
The FRAPCON-3 fuel rod performance computer code is sponsored by the U.S. Nuclear Regulatory
Commission (NRC) and maintained by Pacific Northwest National Laboratory (PNNL). The code is used
in original or modified form by fuel experts worldwide (see for example, Hodge and Ott, 2004; Vallejo et
al., 2004; In de Betou et al., 2004; Kim and Lee, 2004; Hejzlar et al., 2004; Long et al., 2004; Khoruzhii
et al., 2004).
The FRAPCON-3 code has been altered by a number of modifications and additions to form version
FRAPCON-3.3. The major changes include an improved model choice for the urania fuel pellet thermal
conductivity, the addition of mixed PuO2-UO2 (plutonia-urania) oxide (MOX) fuel pellet thermal
properties and other parameters to facilitate analysis of MOX fuel rod performance, and the addition
corrosion and hydrogen pickup parameters appropriate to advanced cladding types. Those models and
subroutines in the code not modified are described in Volumes 1 and 2 of NUREG/CR-6534.
MOX light-water reactor (LWR) fuel pellets are high-density, low plutonia-content mixtures of
plutonia and urania. This MOX fuel has been produced in France, England, Japan, and Germany and
irradiated in European and Japanese power reactors for several decades (Blanpain et al., 2000;
Lippens, 1988). In the United States, interest in LWR MOX fuel has been limited since 1978 due to the
prohibition on fuel recycle. However, interest has revived recently because special MOX rods will be
fabricated to irradiate (fission) excess weapons-grade plutonium in pressurized water reactors (PWRs),
rendering the plutonium non-weapons grade and very difficult to access, and extracting nuclear electricity
in the process (U.S. Department of Energy, 1999). The U.S. Nuclear Regulatory Commission (NRC)
supports MOX fuel performance prediction capability in order to assess vendor assertions of the
performance of special MOX rods.
FRAPCON-3 (Berna et al., 1997) and its antecedents, FRAPCON-1 and FRAPCON-2, contained a
plutonium content dependency for fuel pellet-specific heat and conductivity. However, these dependen-
cies, reflected in MATPRO-11 Rev. 2 (Hagrman et al., 1981) were drawn from relatively old fast-reactor
fuel data that utilized much higher plutonia contents than are currently planned for LWR MOX for
weapons-grade plutonium disposition. In addition, FRAPCON-3 lacked any accommodation for input of
initial Pu isotopic distribution and calculation of Pu isotopic shift sufficient to accurately track the
development of radial power and burnup profiles for MOX fuel.
The NRC, which sponsors the FRAPCON-3 (steady-state) and FRAPTRAN (transient) fuel perform-
ance codes, has requested Pacific Northwest National Laboratory (PNNL) to update the FRAPCON-3
code with fuel pellet properties and parameters appropriate for the LWR MOX planned for Pu disposition.
This effort also includes confirmation of whether the current subcode used for calculating radial
power/burnup distributions (TUBRNP) will adequately predict these profiles when given initial
(as-fabricated) plutonium content and weapons-grade isotopic distributions.
Section 2 of this volume contains the description of the revised urania fuel thermal conductivity
model, which is shown to better reflect credible recent data both at high temperatures (>2500 K) and at
nominal to high burnup (> 30 GWd/tU). Section 3 contains the revisions that have been made to update
the FRAPCON-3 code for LWR MOX applications. This section addresses fuel pellet thermal
1.11.1

conductivity, fission gas release (FGR), helium production, Xe/Kr ratio for stable fission gas, radial
power/burnup profile predictions, fuel heat capacity, fuel melting, and fuel thermal expansion and
swelling. In each section where an update is described, background is given for the update, the updated
model is described, the verification against measured data is shown, and the limits and uncertainties are
stated.
Updates to the FGR model for urania fuel (in response to the revised urania fuel pellet thermal
conductivity model) are described and confirmed against the FGR data base in Section 4.
The updates to cladding corrosion and hydriding to apply to advanced Zircaloy cladding materials
(ZIRLOTM and M5TM) are discussed in Section 5, together with model corrections for cladding wall
thinning due to corrosion. Specific code capability enhancements are described in Section 6. References
are given in Section 7.
Appendix A contains code-data comparisons on MOX fuel temperatures used to verify the MOX fuel
pellet thermal conductivity model. Appendix B describes the code updates made from the first published
version (described in Volumes 1 and 2 of NUREG/CR-6534) up to the present version, FRAPCON-3.3.
Appendix C describes the revised code input instructions.
Errata to the various volumes of this NUREG are collected as a list on the PNNL
FRAPCON/FRAPTRAN website, www.pnl.gov/frapcon3.
1.21.2

2.0 URANIA FUEL PELLET THERMAL
CONDUCTIVITY UPDATE
The Lucuta formula for urania pellet thermal conductivity (Lucuta et al., 1996) used in previous
versions of FRAPCON-3 was found to have two inaccuracies: It predicts values at high temperature
(> 2200 K) that are too large relative to credible modern data for unirradiated fuel pellet material
(Ronchi et al., 1999), and it had too little burnup degradation (and hence was non-conservative above
~30 GWd/tU burnup) compared to both in-cell laser-flash diffusivity measurements on high-burnup pellet
samples and in-reactor fuel temperatures measured at nominal to high burnup. The form of the Lucuta
equations was also non-standard and did not facilitate comparisons between models. A revised model
was developed, as described below.
2.1 Revised Urania Pellet Thermal Conductivity Model
Following examination of several thermal conductivity models, the Nuclear Fuels Industries (NFI)
model (Ohira and Itagaki, 1997) (with modifications) was selected as a replacement for the Lucuta model
in FRAPCON-3 and FRAPTRAN. This model, as published, applies to urania fuel pellets at ~95% of
theoretical density (TD). Similar to most other fuel thermal conductivity models utilized in fuel
performance codes, the NFI model consists of a lead term that is inversely proportional to the temperature
function A + BT (phonon term), with burnup dependence factors in its denominator, plus terms that
model the electronic contribution to fuel heat transfer at high temperature. In the revised model, the
temperature-dependent portion of the burnup function in the phonon term is altered, and the form of the
electronic term is changed, as shown below:
UNMODIFIED NFI MODEL (for 95% TD pellet material)
42
)()()(
1DTCT
ThBugBufBTAK (2.1)
MODIFIED NFI MODEL
)/exp()()()04.0exp(9.01)(
12
TFT
E
ThBugBuBufBTAK (2.2)
where:
K = thermal conductivity, W/m-K
T = temperature in Kelvin
Bu = burnup in GWd/MTU
f(Bu) = effect of fission products in crystal matrix (solution)
= 0.00187•bu
g(Bu) = effect of irradiation defects, = 0.038•Bu0.28,
h(T) = temperature dependence of annealing on irradiation defects
2.12.1

TQe /3961
1
Q = temperature dependence parameter (“Q/R”) = 6380 K
A = 0.0452 m-K/W
B = 2.46E-4 m-K/W/K
C = 5.47E-9 W/m-K3
D = 2.29E14 W/m-K5
E = 3.5E9 W-K/m
F = 16361 K
As applied in FRAPCON-3, the above model is adjusted for as-fabricated fuel density (in fraction of
TD) using the Lucuta recommendation for spherical-shaped pores (Lucuta et al., 1996), as follows:
Kd = 1.0789*K95*[d/{1.0 + 0.5(1-d)}] (2.3)
where:
d = density in fraction of TD
K 95 = as-given conductivity (reported to apply at 95% TD)
The factor 1.0789 adjusts the conductivity back to that for 100% TD material.
This model is activated when the user-input integer flag IMOX has the value 0 (the code defaults to
IMOX = 0)
The phonon-term modification applies nearly full irradiation defect annealing at low burnup but
restores the temperature-dependent annealing at higher burnups such that for burnups greater than
30 GWd/MTU, the phonon term is equivalent to that in the original NFI model. The electronic terms
(which in either case become significant only above ~1500 K) are altered to a more theoretically based
equation (see Hagrman et al., 1981; Popov et al., 2000). The magnitude is slightly lower than the original
NFI model at high temperature. This adjustment was indicated by Institute for Transuranium Elements
(ITU) data at on unirradiatied PWR pellet material at temperatures approaching fuel melting
(Ronchi et al., 1999).
At low burnup (<20 GWd/MTU) and low temperatures (< 1000 K), the modified model is higher than
the unmodified NFI model and roughly equivalent to the Lucuta model without its radiation term. At
higher burnup (> 30 GWd/MTU), the revised model is equivalent to the original NFI model with the
exception of the small reduction at very high temperatures. These trends are demonstrated in Figures 2.1
through 2.3.
2.22.2

0.0
0.5
1.0
1.5
2.0
2.5
3.0
3.5
4.0
4.5
5.0
500 1000 1500 2000 2500 3000
Temperature, K
Co
nd
uc
tivit
y, W
/m-K
Lucuta UnmodNFI ModNFI
Figure 2.1 The Lucuta, Unmodified NFI, and Modified NFI Fuel Pellet Thermal
Conductivity Models Compared at 5 GWd/tU Burnup
0.0
0.5
1.0
1.5
2.0
2.5
3.0
3.5
4.0
4.5
5.0
500 1000 1500 2000 2500 3000
Temperature, K
Co
nd
ucti
vit
y, W
/m-K
Lucuta Mod.NFI UnMod. NFI
Figure 2.2 The Lucuta, Unmodified NFI, and Modified NFI Fuel Pellet Thermal
Conductivity Models Compared at 30 GWd/tU Burnup
2.32.3

0.0
0.5
1.0
1.5
2.0
2.5
3.0
3.5
4.0
4.5
5.0
500 1000 1500 2000 2500 3000
Temperature, K
Co
nd
uc
tiv
ity
, W
/m-K
Lucuta UMod.NFI Modified .NFI
Figure 2.3 The Lucuta, Unmodified NFI, and Modified NFI Fuel Pellet Thermal
Conductivity Models Compared at 60 GWd/tU Burnup
2.2 Adjustment for Gadolinia Additions
Gadolinia (Gd2O3) additions to reactor fuel provide a burnable absorber for power peaking control
early in the life of a fuel assembly. The additions are typically limited to less than 10 wt.%. The impact
of limited gadolinia additions on the unirradiated fuel thermal conductivity is somewhat significant due to
its disturbance of the lattice and of phonon-type heat transfer. Various commercial fuel vendors have
their own data sets and proprietary modeling approaches. In FRAPCON, it will suffice to have a model
that captures the effect, and is publicly available. The data correlation in Massih et al. (1992) provides
such a model.
Massih found a parameter to be used the denominator in the phonon term of standard equations for
urania conductivity that correlated the laser-flash diffusivity data for urania gadolinia conductivity
reported by Babcock and Wilcox in Newman et al. (1984). The form of the Massih adder to the phonon
term denominator is simply “a” times “g,”
where
a = constant = 1.1599
gad = weight fraction of gadolinia.
Therefore, the modified NFI model with the gadolinia term becomes
)/exp()()()04.0exp(9.01)(
12
TFT
E
ThBugBuBufBTgadaAK (2.4)
2.42.4

2.3 Verification of the Urania Pellet Thermal Conductivity
In Figure 2.4, the model predictions at zero burnup (unirradiated) are shown in comparison to the
Ronchi (1999) data on unirradiated pellet material at nominal and high temperatures to demonstrate that
the revised model accounts for the high-temperature portion of that data better than the Lucuta model.
The modified NFI model was also compared to recent laser-flash diffusivity/conductivity data taken
post irradiation at ITU on both high-burnup PWR fuel pellet samples and on flat, thin urania disks
irradiated at constant temperature to varying burnup levels in the Halden Reactor under the High Burnup
Rim Project (Ronchi et al., 2004). The data were compared to the model only at the irradiation
temperatures, although data were taken over a large range of temperatures (from room temperature to
1500 K). The comparison is tabled in Table 2.1 and plotted in Figure 2.5. On average, the model
overpredicts the data for unannealed material by 8% relative. Since some in-reactor annealing is expected
at temperatures of interest, especially in overpower transients when fuel pellet temperatures themselves
are of interest, the FRAPCON (modified NFI) model is considered adequate.
The modified NFI model was also compared to postirradiation conductivity from laser flash
diffusivity data reported by Carrol et al. (1994) on test fuel irradiated in the Halden Reactor to
40 GWd/tU burnup. The results again show improvement over the Lucuta model (Figure 2.6).
FRAPCON-3 predictions (with the modified NFI pellet thermal conductivity model) are compared to
in-reactor test fuel center temperatures in Figure 2.7. The data in this figure come from the Halden Ultra
High Burnup instrumented fuel assembly (Wiesenack and Tverberg, 2000). The tendency for the over-
prediction at low burnup with the unmodified NFI model and for underprediction at high burnup with the
Lucuta model has both been significantly reduced by the revised thermal conductivity model.
0
1
2
3
4
5
6
0 500 1000 1500 2000 2500 3000 3500
Temperature, K
Co
nd
ucti
vit
y,
W/m
-K
Ronchi Data Lucuta Modified NFI
Figure 2.4 Modified NFI and Lucuta Model Predictions Compared to Measured
Conductivity on Unirradiated Pellet Material (Ronchi et al., 1999 ITU Data)
2.52.5

Table 2.1 Measured High Burnup Fuel Pellet Material Thermal Conductivity and Calculated Values (see
also Figure 2.5)
Burnup
GWd/tU
Reported Irradiation
Temperature, K
Measured Conductivity
(before annealing)
W/cm-K
Calculated Conductivity,
W/m-K
34 730 2.57 2.76
34 860 2.41 2.60
33 1020 2.16 2.49
34 1210 1.86 2.31
55 680 2.24 2.28
51 890 2.14 2.22
51 1100 1.86 2.11
51 1300 1.92 2.00
82 700 2.10 1.83
96 730 1.98 1.63
92 1490 1.49 1.52
0.0
0.5
1.0
1.5
2.0
2.5
3.0
0.0 0.5 1.0 1.5 2.0 2.5 3.0
Measured conductivity, W/m-K
Pre
dic
ted
Co
nd
ucti
vit
y,
W/m
-K
Data Predicted = Measured Least Squares Fit
Figure 2.5 Comparison of Modified NFI Fuel Pellet Thermal Conductivity to
Ronchi et al. (2004) ITU Data for High Burnup Pellet Material
2.62.6

0.0
0.5
1.0
1.5
2.0
2.5
3.0
3.5
4.0
0 200 400 600 800 1000 1200 1400 1600
Temperature, K
Co
nd
ucti
vit
y, W
/m-K
Lucuta Modified NFI Sample 1 Sample 2
Figure 2.6 The Lucuta and Modified NFI Models Compared to Postirradiation
Thermal Conductivity Measurements from Carrol et al. (1994) for BWR
Pellet Samples with 40 GWd/tU Burnup
700
800
900
1000
1100
1200
1300
1400
1500
0 10 20 30 40 50 60 70 8
Burnup GWd/MTU
Ce
nte
r T
em
pe
ratu
re, K
0
Data Lucuta UnMod. NFI Modified NFI
Figure 2.7 FRAPCON-3 Fuel Temperature Predictions Compared to the Halden Ultra
High Burnup (HUHB) Data with the Indicated Thermal Conductivity Models
in the Code (Wiesenack and Tverberg, 2000)
2.72.7

Code-data comparisons for test fuel center temperatures have been made for two other experiments in
Halden. The center temperatures from the lower thermocouple in a small-gap boiling-water reactor
(BWR)-type test rod (Rod 3 of IFA-432) (Lanning, 1986) are compared to code prediction in Figure 2.8.
In this case, use of the modified NFI model results in a slight overprediction of the temperatures at
~40 GWd/tU, but this could be partly due to overprediction of the FGR for this test rod. A similar
comparison is made in Figure 2.9 for a test involving a re-fabricated instrumented high-burnup BWR fuel
section, IFA-597.3, with base-irradiation burnup at ~66 GWd/tU. (Matsson and Turnbull, 1998). In this
case, due to the refabrication process and the pellet cladding gap closure in the high burnup fuel section,
uncertainties in predicted fuel temperature due to uncertainty in gap size and FGR/gap gas composition
are minimized. The use of the modified NFI model results in improved code-data comparison in this
case.
Based on these comparisons, the FRAPCON-3 code with the Modified NFI model is considered a
best-estimate predictor (i.e., not intentionally conservative) for fuel temperatures.
0
200
400
600
800
1000
1200
1400
0 5 10 15 20 25 30 35 40
Burnup, GWd/MTU
Ce
nte
r T
em
pera
ture
,C
Data Lucuta Modified NFI
Figure 2.8 Code-Data Comparison for Fuel Center Temperatures for Rod-3 of
Halden Experiment IFA-432 (Small-Gap BWR-Style Test Rod)
2.82.8

0
200
400
600
800
1000
1200
0 20 40 60 80 100
Time in Test, Days
Cen
ter
Te
mp
era
ture
,C
Data Lucuta Modified NFI
Figure 2.9 Code Data Comparison for Fuel Center Temperatures for Halden Experiment
IFA-597.3 Rod 8 (Re-fabricated, Instrumented BWR Fuel Section with
~66 GWd/tU Burnup)
2.3.1 Verification of the Urania-Gadolinia Model
Because the data base for the Massih model only includes gadolinia contents up to 5.66%
(Newman, 1984), the model was also compared to data correlations from other studies that included
higher gadolinia contents. Hirai and Ishimoto (1991) measured thermal conductivities by the laser-flash
diffusion method on sintered samples containing 0, 3, 5, 7, and 10 wt.% gadolinia over the temperature
range from 20 to 1750°C. These authors developed a thermal conductivity correlation using a special
form for the phonon term that includes point-defect interactions and adding a high-temperature term that
fit their data with a standard error of only 6% relative. In an earlier study, Fukushima et al. (1982)
measured thermal diffusivities and deduced conductivities in the temperature range from 400 to 1335 C
for gadolinia contents of 0 to 10.3 wt.%. A thermal conductivity correlation was also developed by
Fukushima et al. (1982) based on their data.
The modified NFI model is compared to the Hirai and Ishimoto (1991), Massih et al. (1992), and
Fukushima et al. (1982) data correlations at an example gadolinia content of 8.0 wt.% in Figure 2.10. The
Massih model, and the modified NFI model with the Massih gadolinia adjustment, are very similar and
show the same qualitative degradation of the thermal conductivity with increasing gadolinia content as the
other two correlations and remain intermediate between them in the operating temperature range (above
300°C). The Fukushima et al. (1982) data have been found to be low relative to results of other investiga-
tions such as that of Hirai and Ishimoto (1991). We recommend using the Massih correction for gadolinia
in FRAPCON, both because of its slightly conservative predictions and its straightforward application
within the existing MATPRO fuel thermal conductivity equations.
2.92.9

0.0
0.5
1.0
1.5
2.0
2.5
3.0
3.5
4.0
4.5
5.0
5.5
0 500 1000 1500 2000 2500
Temperature, K
Co
nd
ucti
vit
y,
W/m
-K
Fukushima Hirai and Ishimoto Massih Modified NFI
Figure 2.10 The Modified NFI Model with the Massih Adjustment for Gadolinia,
Compared to Various Data Correlations at 8.0 Wt.% Gadolinia
The modified NFI model with the Massih adjustment for the phonon term was also compared to data
from Hirai and Ishimoto (1991). The comparison, for example at 8.5 wt.%, is shown in Figure 2.11. This
is further confirmation that the model is not overpredicting the thermal conductivity at this level of
gadolinia content.
0.0
0.5
1.0
1.5
2.0
2.5
3.0
3.5
4.0
4.5
5.0
0 500 1000 1500 2000 2500
Temperature, K
Co
nd
ucti
vit
y,
W/m
-K
Data Data NFI Mod
Figure 2.11 Comparison between Modified NFI (with Massih correction for Gadolinia)
and Unirradiated Urania Gadolinia Data Trend from Hirai and Ishimoto
(1991) at 8.5 wt.% Gadolinia Content
2.102.10

All these comparisons are shown for unirradiated pellet material. As burnup progresses, there is
mounting evidence from comparative fuel temperature data taken in the Halden Reactor that a synergism
exists between burnup-induced conductivity degradation and that induced from gadolinia addition, such
that the two effects are not completely additive. At present, the model in FRAPCON treats these effects
as additive, and hence it is likely low (conservative) for high-burnup urania-gadolinia fuel. This aspect is
a subject for continued data monitoring and model adjustment in the future.
2.4 Range of Application and Uncertainties
The recommended ranges of application for the urania and urania-gadolinia fuel pellet thermal
conductivity expressions are given below. These ranges represent PNNL-estimated limits for reliable
model-to-data comparisons to-date, and not necessarily the outer bounds of all available data. No attempt
has been made to bias the conductivity in any direction.
Temperature: 300 to 3000 K
Rod-Average Burnup: 0 to 62 GWd/MTU (Urania only*)
As-fabricated Density: 92 to 97% TD
Gadolinia Content: 0 to 10 wt.%
*The current model underestimates thermal conductivity at nominal to high burnup for
urania-gadolinia pellets. The Halden Reactor Project currently has integral experiments
(fuel centerline temperature data) of urania-gadolinia fuel at nominal burnups that
demonstrate some conservatism in the current model. Further Halden experiments are
planned that will measure fuel temperatures in urania-gadolinia fuel up to high
burnups.
The uncertainty on the thermal conductivity is on the order of the uncertainty of verification for fuel
temperature rise from pellet surface to pellet center, i.e., from about 10 to 15%.
2.112.11


3.0 MODELING CHANGES FOR EXTENSION TO MOX FUEL
This section contains the various model and code changes that have been made or considered to
extend the code to apply to MOX fuel. In the United States, the introduction of MOX fuel into LWRs is
planned solely as part of the conversion and disposition effort for plutonium metal contained in excess
weapons parts. The changes described below are limited, in part, by that sole application.
3.1 Thermal Conductivity Model for MOX Fuel Pellets
The major modification to FRAPCON-3.3 for application to MOX fuel was the addition of a fuel
thermal conductivity model specific to MOX fuel. This was selected as a combination of the Duriez
stoichiometry-dependent correlation, derived from diffusivity measurements on unirradiated fuel pellets
(Duriez et al., 2000), plus the burnup degradation contained in a modified version of the NFI fuel thermal
conductivity model (Lanning and Beyer, 2002; Ohira and Itagaki, 1997). Background on MOX fuel
pellet thermal conductivity considerations is given in Section 3.1.1. The combined model is described in
Section 3.1.2.
The model was verified by inserting it into the FRAPCON-3.3 code and comparing predicted fuel
center temperatures to measured values for several instrumented Halden Reactor test irradiations on fuel
segments, which were re-fabricated from irradiated full-length MOX PWR rods and instrumented with
centerline thermocouples. The results of this verification process are described in Section 3.1.3. The
ranges of application for the MOX model and the estimated uncertainty are stated in Section 3.1.4.
3.1.1 Background on MOX Fuel Thermal Conductivity
Significant experimental investigations and modeling efforts are ongoing concerning the thermal
conductivity of LWR-type MOX fuel pellets. Thermal diffusivity/conductivity measurements at
Cadarache Laboratory on unirradiated hypostoichiometric MOX pellets have confirmed a strong
dependence of the MOX thermal conductivity on deviations from stoichiometry, but only a minor
dependence on plutonia content over the range of 1 to 15 wt.% (Duriez et al., 2000). Duriez et al. (2000)
reported measurements on unirradiated pellets only and did not discuss burnup-induced thermal
conductivity degradation. In contrast, the Halden Reactor Project recommends a function for burnup
degradation, derived from their extensive data base on measured urania and MOX fuel temperatures
(Wiesenack and Tverberg, 2000). However, the Halden Reactor Project model overpredicts recently
published urania thermal conductivity data at high temperatures (> 2500 K), and the Halden adaptation of
their model for MOX fuel lacks an explicit dependence on stoichiometry. Various organizations are
proposing models that combine the current understanding of stoichiometry, plutonia content, burnup
degradation, and high temperature effects on MOX fuel pellet thermal conductivity.
3.13.1

PNNL has installed an LWR MOX fuel pellet thermal conductivity model in FRAPCON 3.3. The
key features of this model are as follows:
(a) The previous dependence in the model on plutonia content (derived from MATPRO-11) is
eliminated, especially since FRAPCON-3 applications for MOX will be at less than 15 wt.% plutonia
while the MATPRO model is based on ~ 25% plutonia data
(b) The Duriez model for unirradiated fuel is applied, with its stoichiometry dependence
(c) Revised functions are used for burnup degradation and high-temperature thermal conductivity based
on urania data.
3.1.2 Description of the MOX Fuel Thermal Conductivity Models
At the request of the NRC, two thermal conductivity models for MOX fuel are made available in
FRAPCON-3.3. The first, the Duriez-Modified NFI model (described in Section 3.1.2.1), is the
recommended model and the one that PNNL has verified against in-reactor fuel temperature data. The
second is the Halden MOX fuel model (described in section 3.1.2.2), which has not been verified by
PNNL but has been verified by Halden Reactor Project staff against a similar set of in-reactor MOX fuel
temperature data. The two models are similar at normal operating fuel temperatures (< 2000 K) but
diverge at higher temperatures. The burnup degradation in the recommended model is also somewhat
stronger than in the Halden model.
3.1.2.1 The Duriez-Modified NFI Model
The Duriez model for the thermal conductivity, K95, of unirradiated MOX fuel pellets at a nominal
density of 95% TD, is as follows:
)exp()()(
1295
T
D
T
C
TxBxAK (3.1)
where:
K95 = Conductivity in W/m-K, at 95% TD
x = 2.00 – O/M (i.e., oxygen-to-metal ratio)
T = temperature in K
A(x) = 2.85x + 0.035 m-K/W
B(x) = (2.86 - 7.15x)*1E-4 m/W
C = 1.689E9 W-K/m
D = 13520 K.
3.23.2

PNNL has modified this model to include a burnup dependence, a gadolinia dependence, and a
slightly reduced high-temperature term, as follows:
)exp()()()04.0exp(9.01)()()(
12
mod95
T
D
T
C
ThBugBuBufTxBgadaxAK (3.2)
where:
x, T, A(x), B(x), and D are as defined above
a = 1.1599, “gad” = weight fraction gadolinia (not expected in MOX)
Bu = burnup in GWd/tHM
f(Bu) = effect of fission products in crystal matrix (solution) = 0.00187•Bu
g(Bu) = effect of irradiation defects = 0.038•Bu0.28
)exp(T
Q3961
1h(T) = temperature dependence of annealing on irradiation defects
Q = temperature dependence parameter (“Q/R”) = 6380K
Cmod = 1.5E9 W-K/m.
In the first term of the modified model (the “phonon conduction” term), the expressions describing
the effect of dissolved fission products [f(Bu)], irradiation induced defects [g(Bu)], and the temperature-
dependent defect healing (annealing) [h(T)] are the original functions put forward by Ohira and Itagaki
(1997) of NFI. The term multiplying the product g(Bu)h(T) is a PNNL modification that reduces the
annealing at low burnup (<20 GWd/MTM) and brings it back at nominal-to-high burnup (see Lanning
and Beyer, 2002).
The second term in the model describes high-temperature electronic heat conduction. The constant
“C” has been reduced in the modified model to agree with recent high-temperature diffusivity-derived
conductivity measurements on unirradiated fuel pellets (Ronchi et al., 1999). These data are lower than
previously measured values, but the older values have high uncertainty, and the more recent data appear
to be very credible.
As applied in FRAPCON-3, the above model is adjusted for as-fabricated fuel density (in % of TD)
using the Lucuta recommendation for spherical-shaped pores (Lucuta et al., 1996) as follows:
In the first term of the modified model (the “phonon conduction” term), the expressions describing
the effect of dissolved fission products [f(Bu)], irradiation induced defects [g(Bu)], and the temperature-
dependent defect healing (annealing) [h(T)] are the original functions put forward by Ohira and
Itagaki (1997) of NFI. The term multiplying the product g(Bu)h(T) is a PNNL modification that reduces
the annealing at low burnup (<20 GWd/MTM) and brings it back at nominal-to-high burnup (see Lanning
and Beyer, 2002).
The second term in the model describes high-temperature electronic heat conduction. The constant
“C” has been reduced in the modified model to agree with recent high-temperature diffusivity-derived
conductivity measurements on unirradiated fuel pellets (Ronchi et al., 1999). These data are lower than
previously measured values, but the older values have high uncertainty, and the more recent data appear
to be very credible.
3.33.3
As applied in FRAPCON-3, the above model is adjusted for as-fabricated fuel density (in % of TD)
using the Lucuta recommendation for spherical-shaped pores (Lucuta et al., 1996) as follows:
Kd = 1.0789*K95*[d/{1.0 + 0.5(1-d)}] (3.3)
where:
d = density in fraction of TD.
The factor 1.0789 adjusts the conductivity back to that for 100% TD material.
This model is activated when the user-input integer flag IMOX has the value 1.
3.1.2.2 The Halden Project MOX Fuel Thermal Conductivity Model
The Halden Reactor Project has developed a variant of their urania fuel pellet thermal conductivity
model for MOX fuel, based on their extensive in-reactor data base for fuel temperatures and linear heat
generation rates (LHGRs) for both fuel types. This model is included in the FRAPCON-3.2 code as a
user option (utilized when the user-input integer flag IMOX has the value 2).
The structure of the Halden model for urania fuel is very straightforward, consisting of a phonon
conduction term plus an electronic conduction term. The effects of burnup are contained solely in the
phonon conduction term, as follows:
TeBBxgada
K 00188.0
495 0132.000333.0110475.20040.01599.11148.0
1(3.4)
where:
K95 = conductivity in W/m-K, at 95% TD
T = temperature in degrees Celsius
B = burnup, MWd/kg urania
= Minimum of: 1650°C or current temperature in degrees Celsius
a = 1.1599, “gad” = weight fraction gadolinia (not expected in MOX).
In applying this equation, one must recognize that the units for temperature and for burnup (degrees C
and MWd/kg urania) deviate from the units used for most models in the literature (degrees Kelvin and
MWd/kgU or atom % burnup) and adjust accordingly.
The change to the above equation for MOX is to multiply the phonon term by the factor 0.92. The
Halden equation for MOX fuel conductivity is thus:
TeBBxgada
K 00188.0
495 0132.000333.0110475.20040.01599.11148.0
92.0(3.5)
3.43.4
The above conductivity is adjusted for fuel pellet density by the same Kd factor applied above to the
Duriez-NFI model.
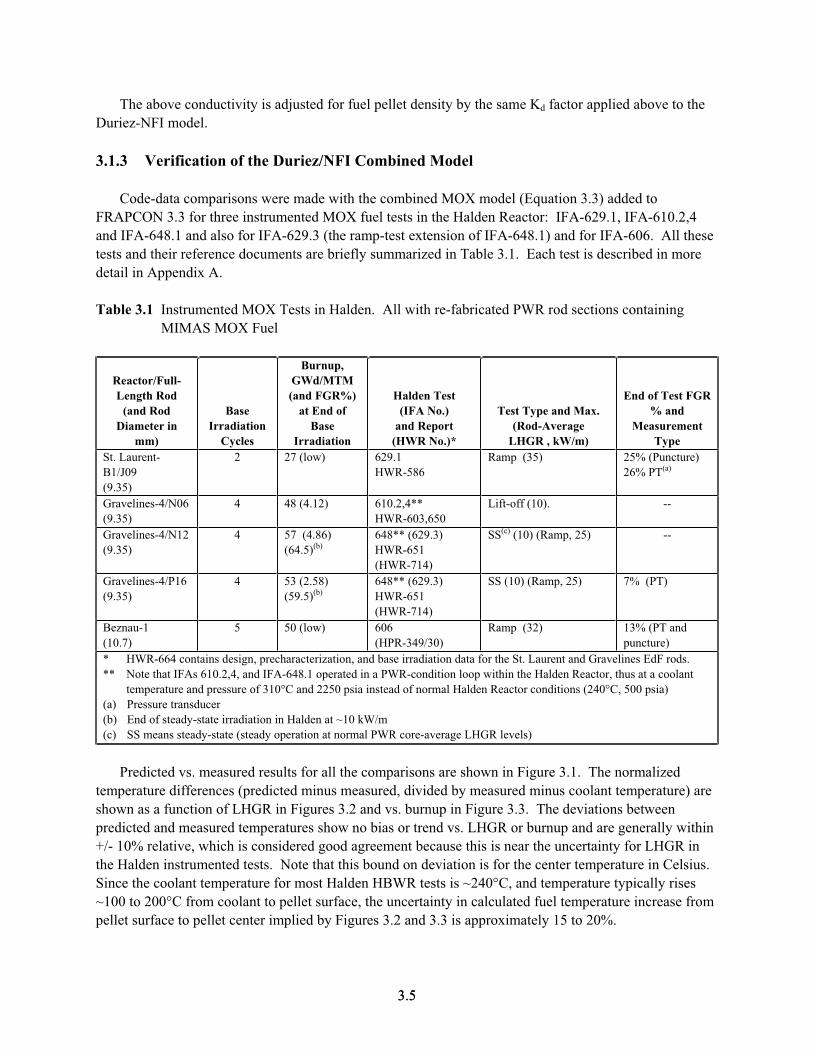
3.1.3 Verification of the Duriez/NFI Combined Model
Code-data comparisons were made with the combined MOX model (Equation 3.3) added to
FRAPCON 3.3 for three instrumented MOX fuel tests in the Halden Reactor: IFA-629.1, IFA-610.2,4
and IFA-648.1 and also for IFA-629.3 (the ramp-test extension of IFA-648.1) and for IFA-606. All these
tests and their reference documents are briefly summarized in Table 3.1. Each test is described in more
detail in Appendix A.
Table 3.1 Instrumented MOX Tests in Halden. All with re-fabricated PWR rod sections containing
MIMAS MOX Fuel
Reactor/Full-
Length Rod
(and Rod
Diameter in
mm)
Base
Irradiation
Cycles
Burnup,
GWd/MTM
(and FGR%)
at End of
Base
Irradiation
Halden Test
(IFA No.)
and Report
(HWR No.)*
Test Type and Max.
(Rod-Average
LHGR , kW/m)
End of Test FGR
% and
Measurement
Type
St. Laurent-
B1/J09
(9.35)
2 27 (low) 629.1
HWR-586
Ramp (35) 25% (Puncture)
26% PT(a)
Gravelines-4/N06
(9.35)
4 48 (4.12) 610.2,4**
HWR-603,650
Lift-off (10). --
Gravelines-4/N12
(9.35)
4 57 (4.86)
(64.5)(b)
648** (629.3)
HWR-651
(HWR-714)
SS(c) (10) (Ramp, 25) --
Gravelines-4/P16
(9.35)
4 53 (2.58)
(59.5)(b)
648** (629.3)
HWR-651
(HWR-714)
SS (10) (Ramp, 25) 7% (PT)
Beznau-1
(10.7)
5 50 (low) 606
(HPR-349/30)
Ramp (32) 13% (PT and
puncture)
* HWR-664 contains design, precharacterization, and base irradiation data for the St. Laurent and Gravelines EdF rods.
** Note that IFAs 610.2,4, and IFA-648.1 operated in a PWR-condition loop within the Halden Reactor, thus at a coolant
temperature and pressure of 310°C and 2250 psia instead of normal Halden Reactor conditions (240°C, 500 psia)
(a) Pressure transducer
(b) End of steady-state irradiation in Halden at ~10 kW/m
(c) SS means steady-state (steady operation at normal PWR core-average LHGR levels)
Predicted vs. measured results for all the comparisons are shown in Figure 3.1. The normalized
temperature differences (predicted minus measured, divided by measured minus coolant temperature) are
shown as a function of LHGR in Figures 3.2 and vs. burnup in Figure 3.3. The deviations between
predicted and measured temperatures show no bias or trend vs. LHGR or burnup and are generally within
+/- 10% relative, which is considered good agreement because this is near the uncertainty for LHGR in
the Halden instrumented tests. Note that this bound on deviation is for the center temperature in Celsius.
Since the coolant temperature for most Halden HBWR tests is ~240°C, and temperature typically rises
~100 to 200°C from coolant to pellet surface, the uncertainty in calculated fuel temperature increase from
pellet surface to pellet center implied by Figures 3.2 and 3.3 is approximately 15 to 20%.
3.53.5

0
200
400
600
800
1000
1200
1400
0 200 400 600 800 1000 1200 1400
Measured Center Temperature, Deg. C
Pre
dic
ted
Te
mp
era
ture
, D
eg
. C
629-1r1 629-1r2 610.2
610.4 648.1r1 648r2
IFA-yyyr5 IFA-yyyr6" IFA-xxx
Predicted = Measured Pred.=Meas.*1.1 Pred.=Meas.*0.9
Figure 3.1 Predicted vs. Measured Fuel Center Temperatures for Halden MOX Tests
-0.20
-0.15
-0.10
-0.05
0.00
0.05
0.10
0.15
0.20
0 10 20 30 40 50 60 7
Burnup, MWd/kgM
No
rma
lize
d T
em
p.
Dif
fere
nc
e
0
629-1r1 629-1r2 610.2 610.4 648.1r1 648r2 629.3r5 629.3r6 606
Figure 3.2 Predicted Minus Measured Normalized Temperature Difference for MOX Test
Cases as a Function of Burnup
3.63.6

-0.20
-0.15
-0.10
-0.05
0.00
0.05
0.10
0.15
0.20
0 5 10 15 20 25 30 35 40
LHGR, kW/m
No
rma
lize
d T
em
p.
Dif
fere
nc
e.
629-1r1 629-1r2 610.2 610.4 648.1r1 648.1r2 629.3r5 629.3r6 606
Figure 3.3 Predicted Minus Measured Normalized Temperature Difference for MOX Test
Cases as a Function of LHGR
3.1.4 Range of Application and Uncertainties for MOX Thermal Conductivity
The recommended ranges of application for the MOX fuel pellet thermal conductivity models are
given below. These ranges represent PNNL-estimated limits for reliable model-to-data comparisons to
date and not necessarily the outer bounds of all available data. No attempt has been made to bias the
conductivity in any direction:
Temperature: 300 to 3000 K
Rod-Average Burnup: 0 to 62 GWd/MTU
Plutonia Content: 0 to 7 wt.%
As-fabricated Density: 92 to 97% TD
Plutonia Particle Size < 20 microns*
*The majority of the code-data comparisons involves EdF fuel rod sections, for which the
plutonia particle size is reported at 15 to 18 microns.
The uncertainty on the thermal conductivity is on the order of the uncertainty of verification for fuel
temperature rise from pellet surface to pellet center, i.e., from 15 to 20%. This is greater uncertainty than
that estimated for urania thermal conductivity because urania fuel thermal conductivity is verified not
only from in-reactor instrumented fuel tests but also from ex-reactor diffusivity/conductivity on irradiated
fuel samples. This latter data set is now becoming quite extensive for urania (see Ronchi et al., 2004, for
example).
3.73.7

3.2 Fission Gas Release Model Changes for MOX
FGR model parameters have been modified for MOX fuel and verified against available data. Well-
qualified FGR data for MOX fuel is rather sparse. What data have been reported have not suggested a
large difference in FGR between urania and MOX, given equivalent duty cycles (Cook et al., 2003). This
has been indicated again, in particular for LWR-weapons grade Pu source MOX tested to date in the
Advanced Test Reactor (ATR) (Hodge et al., 2003). Therefore, only an incremental change in the
existing FRAPCON-3 FGR model for urania (the Massih model) is proposed for MOX. This change
takes the form of an altered diffusion constant for fission gas diffusing from the fuel grains to the grain
boundary.
3.2.1 The Model Changes
The diffusion constant was increased by the factor 1.75 for MOX, based on preliminary comparisons
of code predictions to data for Halden ramp tests.
3.2.2 Model Verification
Design, operation, and FGR data provided by Halden have provided an opportunity to compare code
predictions to the steady-state FGR from three full-length MOX PWR rods (the “mother rods” N06, N12,
and P16 used as sources for instrumented sections tested in Halden Reactor tests, IFAs 610.2,4, and
IFA-648.1/629.3). Comparison has also been made to end-of-ramp FGR for the power-ramp tested
instrumented fuel rod sections in IFAs 629.1, 629.3, and 606. The results, with and without the
modification to the FGR model, are shown in Figure 3.4. It is clear that FRAPCON-3.2 is generally
under predicting the FGR for these six cases. Multiplying the diffusion constant by 1.75 raises the FGR
to a closer overall comparison with this available data and has been incorporated for MOX into
FRAPCON-3.3.
1
10
100
1 10 100
Measured FGR, %
Pre
dic
ted
FG
R,
%
Base-Irradiation, D*1.75 Ramped, D*1.75
Base-Irrad.Original Model Ramped, Original Model
Predicted = Measured
Figure 3.4 Predicted vs. Measured FGR, Diffusion Constant x 1.75
3.83.8
3.2.2.1 Ranges of Application and Uncertainties for MOX FGR
The recommended ranges of application for MOX fuel FGR are given below. The uncertainties on
the present MOX FGR model, at all burnup levels, are considered large and indeterminate due to the
scarcity of validation data. No attempt has been made to bias the FGR in any direction.
Temperature: 300 to 2300 K
Rod-Average Burnup: 0 to 62 GWd/MTU
Plutonia Content: 0 to 7 wt.%
As-fabricated Density: 92 to 97% TD
Mean Plutonia Particle Size < 20 microns*
*The majority if the code-data comparisons involve EdF fuel rod sections, for which the plutonia
particle size is reported at 15 to 18 microns.
3.3 Xe/Kr Ratio
Ranges of application and uncertainties are not provided for Xe/Kr ratio or the other following
models and correlations.
Fission gas is partitioned into krypton and xenon fractions within the code. Currently, the code uses
Xe/Kr ratio of 5.67 in making this partition, which is appropriate for urania fuel at low burnup. For MOX
fuel, the majority of fissions occur in plutonium, and the xenon stable isotope yields are higher. Halden
gas analysis data from MOX rod punctures at nominal to high burnup indicate Xe/Kr ratios of
approximately 19; however, Xe/Kr fission yields for plutonium indicate a value of 16 (White et al., 2001).
The code has been altered to use the ratio of 16 when MOX fuel is being analyzed. The effects of this
change are a small decrease in gas conductivity and a very small decrease in gap conductance for cases
where fission gas concentration in the plenum gas becomes significant. However, the output gas species
ratios now reflect a more realistic Xe/Kr ratio for MOX.
3.4 Helium Production and Release
Helium production in MOX rods can be expected to be higher than in urania rods due to higher
actinide decay sources from the plutonium. Halden puncture data and gas analysis were provided for
two of the three mother rods, N12 and P16. This permits evaluation of the change to rod helium
inventory from beginning-of-life (BOL) to end of life (EOL). The results indicate negligible change
(~1% relative) in the helium inventory from BOL to EOL. These results are summarized in Table 3.2.
This is consistent with current FRAPCON-3.2 predictions, and no change to FRAPCON-3.2 regarding
helium release is recommended at this time. It should be noted that the initial fill gas pressure for these
rods was relatively high at 363 psia, vs. a somewhat smaller expected value for MOX rods used in the
United States for plutonium disposition. There is some evidence and theory that suggests higher fill
gas pressure will reduce helium release.
Examples where release of created helium was possibly detected in low-pressure rods (1 atmosphere
fill gas pressure at room temperature) include the Pu-Disposition program MOX test rodlets irradiated in
3.93.9

the ATR. The rods were punctured, and the postirradiation pressure was measured. FGR was deduced
from the Kr-85 activity in the gas. By difference, an additional source of pressurizing gas was deduced,
on the order of 3E-5 moles per 82-gram (15-pellet) rodlet at 42 GWd/tHM. This corresponds to a release
of created helium equal to 9E-9 mole He per gram fuel per GWd/tHM, which is a 5 to 6% increase in the
helium inventory in an LWR MOX rod. However, this amounts to only about 10 psi pressure increase at
room temperature or 20 to 25 psi increase at reactor operating temperatures. Due to the small amount of
additional helium production and release that is expected and the lack of quantitative measured release
data, the previous helium release model in FRAPCON-3 is unaltered in the current version.
Table 3.2 Helium Results from Halden Test High-Burnup PWR MOX “Mother Rods”
Reactor/Full-Length Rod
(Rod Diameter in mm)
Base Irradiation
Cycles
Initial Fill Pressure,
MPa at Room
Temperature
Burnup,
GWd/MTM
BOL/EOL Helium
inventory, STPcc
Gravelines-4/N12 (9.35) 4 2.6 50 449/454
Gravelines-4/P16 (9.35) 4 2.6 47 417/422
3.5 Input Plutonium Isotopes for Radial Power Profile
Input parameters have been added to signal when MOX fuel is being analyzed and to initialize the
concentrations of plutonium isotopes in the TUBRNP subcode, which calculates radial power and burnup
profiles within the fuel pellets. Given this isotope initialization, TUBRNP calculates the radial profiles
for LWR MOX fuel with acceptable accuracy. This was assessed by comparing code calculations to
Monte Carlo N-particle (transport) (MCNP) code calculations for radial power profiles (where the MCNP
results were provided by Oak Ridge National Laboratory). The code MCWO (MCNP Coupled With
ORIGEN-2) was used to analyze the detailed fuel rod radial burnup characteristics. This code was
validated by comparing the MCWO-calculated concentration profiles with the postirradiation examination
(PIE) data. For detailed radial profile analyses, a typical PWR unit cell model with a 0.915-cm-diameter
fuel pin was set up. The radial mesh contained 100 subdivided, equal-volume sub-cells in the fuel rod.
An example of the results of this code in comparison with TUBRNP is shown in Figure 3.5.
3.103.10

0.0
0.5
1.0
1.5
2.0
2.5
0.0 0.1 0.2 0.3 0.4 0.5 0.6 0.7 0.8 0.9 1.0
Normalized Radius
Lo
ca
l-to
-av
era
ge
Ra
tio
FRAPCON-3 MCNP
Figure 3.5 MCNP and FRAPCON-3 Calculations of Normalized Radial Power Profile in
PWR MOX Fuel at 50 GWd/MTHM (Initial content = 5 wt.% WG Plutonia in
MOX)
3.6 MOX Fuel Heat Capacity
The MATPRO-11 correlations for the heat capacity of urania, plutonia, and MOX have been retained
in FRAPCON-3.2. The heat capacity equation was derived in MATPRO-11 as:
)/exp(221)/exp(
)/exp(2
32
2
2
1 RTERT
EYKTK
TT
TKFCP D
D (3.6)
and the fuel enthalpy is the integral of the above equation with respect to temperature:
)/exp(221)/exp(
3
2
21 RTEKYTK
T
KFENTHL D (3.7)
In the above,
FCP = specific heat capacity (J/kg-K)
FENTHL = fuel enthalpy (J/kg)
T = temperature (K)
K1, K2, and K3 are constants (see Table 3)
Y = oxygen-to-metal ratio
R = universal gas constant = 8.315 J/mole-K
= Einstein temperature (K)
ED = Activation energy for Frenkel defects (J/mole).
3.113.11
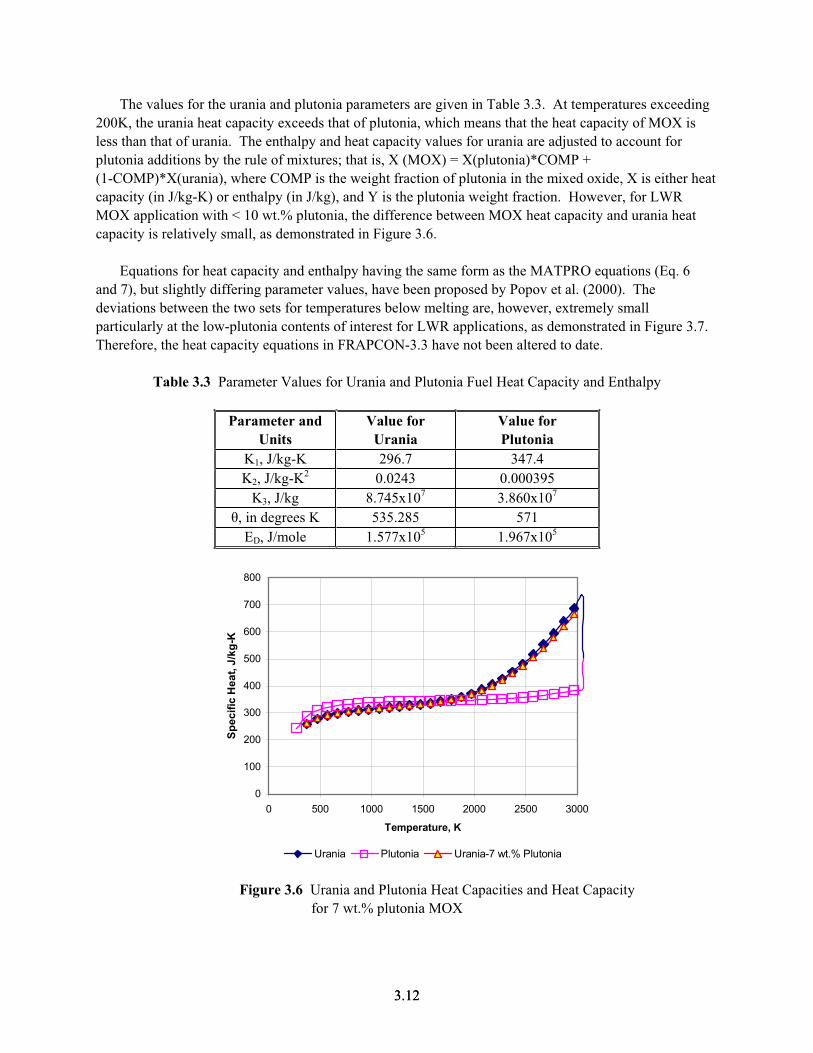
The values for the urania and plutonia parameters are given in Table 3.3. At temperatures exceeding
200K, the urania heat capacity exceeds that of plutonia, which means that the heat capacity of MOX is
less than that of urania. The enthalpy and heat capacity values for urania are adjusted to account for
plutonia additions by the rule of mixtures; that is, X (MOX) = X(plutonia)*COMP +
(1-COMP)*X(urania), where COMP is the weight fraction of plutonia in the mixed oxide, X is either heat
capacity (in J/kg-K) or enthalpy (in J/kg), and Y is the plutonia weight fraction. However, for LWR
MOX application with < 10 wt.% plutonia, the difference between MOX heat capacity and urania heat
capacity is relatively small, as demonstrated in Figure 3.6.
Equations for heat capacity and enthalpy having the same form as the MATPRO equations (Eq. 6
and 7), but slightly differing parameter values, have been proposed by Popov et al. (2000). The
deviations between the two sets for temperatures below melting are, however, extremely small
particularly at the low-plutonia contents of interest for LWR applications, as demonstrated in Figure 3.7.
Therefore, the heat capacity equations in FRAPCON-3.3 have not been altered to date.
Table 3.3 Parameter Values for Urania and Plutonia Fuel Heat Capacity and Enthalpy
Parameter and
Units
Value for
Urania
Value for
Plutonia
K1, J/kg-K 296.7 347.4
K2, J/kg-K2 0.0243 0.000395
K3, J/kg 8.745x10⁷ 3.860x10⁷
, in degrees K 535.285 571
ED, J/mole 1.577x10⁵ 1.967x10⁵
0
100
200
300
400
500
600
700
800
0 500 1000 1500 2000 2500 3000
Temperature, K
Sp
ec
ific
He
at,
J/k
g-K
Urania Plutonia Urania-7 wt.% Plutonia
Figure 3.6 Urania and Plutonia Heat Capacities and Heat Capacity
for 7 wt.% plutonia MOX
3.123.12

0
100
200
300
400
500
600
700
800
0 500 1000 1500 2000 2500 3000
Temperature, K
Sp
ecif
ic H
eat,
J/k
g-K
Urania-MATPRO Plutonia-MATPRO
Urania-Popov Plutonia-Popov
Figure 3.7 Urania and Plutonia Heat Capacities as Calculated by
MATPRO-11 Correlation and by the Correlation of
Popov et al. (2000)
3.7 Melting Temperature for MOX
FRAPCON-3 contains the MATPRO values for unirradiated urania and plutonia melt temperatures of
3113 K and 2647 K, respectively. Popov et al. (2000) recommend values of 3120 K and 2701 K for
urania and plutonia, respectively. The code has not been altered with regard to the melt temperature of
the unirradiated fuel because these differences are very small as applied to LWR MOX. The melt
temperature Tmelt for MOX is calculated from the urania and plutonia contents in a manner similar to the
calculation of fuel specific heat; that is,
Tmelt(MO) = Y*Tmelt(plutonia) + (1-Y)*Tmelt(urania),
where Y = the weight fraction of plutonia.
The MATPRO burnup dependence (reduction) in melt temperature is 3.2 K per MWd/kgU, whereas
Popov et al. (2000) recommend 0.5 K per MWd/kgU on the basis of two references (Adamson et al.,
1985; Komatsu et al. 1988). The code has been altered to include this lower burnup dependence because
it is based on more reliable data.
3.8 Thermal Expansion, Densification, and Swelling for MOX
Following the comparisons and recommendations of Popov et al. (2000), the current (MATPRO-11)
thermal expansion correlation for urania is also applied to LWR MOX fuel.
The current expressions for urania for in-reactor densification and solid fission product-induced
swelling are also applied to MOX. MOX test rod irradiation experiments that include assessment of fuel
densification are ongoing in the Halden Reactor and at the ATR reactor in the United States, but the
3.133.13

results to date are inconclusive regarding significant difference between LWR MOX and urania fuel (see
for example, Tolonen et al., 2001; Hodge et al., 2003). Therefore, the current urania-fuel solid fission
product-induced swelling rate is also applied to MOX fuel.
The in-reactor creep of MOX fuel has been demonstrated to be greater than that of urania fuel (see,
for example, Petiprez, 2002). Therefore, the consequence of fuel swelling upon cladding outward strain
and rod axial strain (once fuel-cladding hard contact has occurred) has been shown to be less for MOX
fuel rods (see, for example, White, 1999). However, currently, FRAPCON-3 does not model fuel creep
for either fuel type.
3.143.14

4.0 REVISED PARAMETERS FOR THE
URANIA FGR MODEL
When a change is made to the code that significantly affects the predicted fuel temperature for the
confirmation cases, the constants in the Massih FGR model must be re-tuned to fit data from steady-state
and slow power ramp cases and thus keep the model best estimate. As discussed in Section 2.0, the
urania thermal conductivity model was changed. As a result of this change, the fuel temperatures
predicted by FRAPCON-3 will be significantly changed. Therefore, the constants in the Massih FGR
model will also be re-tuned to a data base consisting of measured FGR from steady-state and power
ramped rods.
4.1 Massih Diffusion Coefficient Model Changes
The following are the constants that were changed in the Massih FGR model:
The multiplier on the recommended resolution rate was increased from 250 to 300
The divisor on burnup in the adjustment to the diffusion constant for burnup was increased from
35 GWd/MTU to 40 GWd/MTU
The multiplier on the diffusion constant was decreased from 14 to 12.
4.1.1 Model Verification
The current model changes were verified by comparing the model predictions to the measured gas
release values from 23 steady-state rods and 18 power ramp cases. These cases were drawn from the
“development data base” described in Volume 3 of this NUREG, plus additional verification cases.
These steady-state and power-ramp cases are listed in Tables 4.1 and 4.2, respectively. The predicted vs.
measured gas release values for the steady-state cases are shown in Figure 4.1. This figure shows that the
FRAPCON-3 model fits these data quite well. The standard deviation on the predicted minus measured is
2.77% FGR. The predicted vs. measured gas release values for the power ramp cases are shown in Figure
4.2. This figure shows that the FRAPCON-3 model fits these data acceptably. The standard deviation on
the predicted minus measured is 5.32% FGR.
The code-to-data comparison was also examined for bias or trend as a function of burnup. The
predicted-minus measured FGR difference is plotted vs. test rod burnup for the steady-state and power
ramp cases in Figures 4.3 and 4.4, respectively. No significant bias or trend is evident for the cases
portrayed here.
4.14.1

Table 4.1 Steady-State Cases Used in the Assessment and Validation of FRAPCON-3.3
Case
Measured Rod
Average
Burnup
GWd/MTU
Measured
Fission Gas
Release
%
Predicted
Fission
Gas
Release
% Reference
24i6 60.1 21.8 22.90 Balfour, 1982
3618 61.5 33.8 38.40 Balfour, 1982
111i5 48.6 14.4 15.07 Balfour, 1982
28i6 53.3 13.2 13.63 Balfour, 1982
30i8 57.85 34.5 36.76 Balfour, 1982
BNFL-DE 42 10.7 9.22 Lanning et al., 1987
See also Garlick et al.,1982
BNFL-DH 33.9 20 15.54 Lanning et al., 1987
LFF 3.29 17.3 19.81 Notley et al., 1965, 1967
CBP 2.61 14.1 14.82 Notley et al., 1965, 1967
CBR 2.7 14.1 17.96 Notley et al., 1965, 1967
CBY 2.65 16.8 19.80 Notley et al., 1965, 1967
4110-AE2 6.2 22.1 17.81 Janvier et al., 1967
4110-BE2 6.6 15.9 17.78 Janvier et al., 1967
332 56.8 20.9 17.44 Balfour et al., 1982
ELP-4 10.4 17.3 18.00 De Meulemeester et al., 1973
FUMEX 6F 55.45 45±5 43.02 Chantoin et al., 1997
FUMEX 6S 55.45 50±5 56.49 Chantoin et al., 1997
IFA 597.3 70 15.8 12.62 Matsson and Turnbull, 1998
IFA429DH 73 24 44.63 Devold and Wallin, 1994, Waterman, 1978
ANO
TSQ002
53.2 1 1.78 Smith et al., 1994
Oconee
15309
50 0.8 1.25 Newman, 1986
M2-2C 43.75 35.6 41.16 Bagger et al., 1978
PA29-4 47.39 48.1 45.59 Bagger et al., 1978
4.24.2

Table 4.2 Power Ramp Cases Used in the Assessment and Validation of FRAPCON-3.3
Case
Measured
Rod Average
Burnup
GWd/MTU
Measured
Fission
Gas
Release
%
Predicted
Fission
Gas
Release
% Reference
D200 25 38 17.32 Barner et al., 1990
D226 44 44.1 32.19 Barner et al., 1990
PK6-2 36.8 3.5 9.30 Djurle, 1985
PK6-3 36.5 6.7 10.2 Djurle, 1985
PK6-S 35.9 6.1 10.36 Djurle, 1985
IRRMP 16 21 16 15.05 Mogard, 1979
IRRMP 18 18 4 6.40 Mogard, 1979
RISO F14-6 27 22.1 14.67 Knudsen, 1983
RISO F7-3 35 11.5 13.71 Knudsen, 1983
RISO F9-3 33 17.5 17.42 Knudsen, 1983
GE2 41.9 24.6 26.98 Chantoin et al., 1997
GE4 23.96 27 18.27 Chantoin et al., 1997
GE6 42.29 26 33.64 Chantoin et al., 1997
GE7 41 14.4 11.78 Chantoin et al., 1997
RISO AN1 41.3 31.16 26.15 Chantoin et al., 1997
RISO AN8 40.3 13.85 5.73 Chantoin et al., 1997
B&W Studsvik R1 62.3 9.4 11.88 Wesley et al., 1994
B&W Studsvik R3 62.1 11.3 13.60 Wesley et al., 1994
0
10
20
30
40
50
60
0 10 20 30 40 50 6
Measured FGR, %
Pre
dic
ted
FG
R, %
0
FRAPCON-3.3 Predicted = Measured
Figure 4.1 Predicted vs. Measured FGR for Steady-State Assessment Cases
Using FRAPCON-3.3
4.34.3

0
5
10
15
20
25
30
35
40
45
50
0 10 20 30 40
Measured FGR,
50
%
Pre
dic
ted
FG
R,
%
FRAPCON-3.3 Predicted = Measured
Figure 4.2 Predicted vs. Measured FGR for Power Ramp Assessment Cases Using
FRAPCON-3.3
-6
-4
-2
0
2
4
6
0 10 20 30 40 50 60 70 8
Burnup, GWd/MTU
Pre
dic
ted
-Me
as
ure
d F
GR
,%
0
Figure 4.3 Predicted Minus Measured FGR as a Function of Burnup for Steady
State Assessment Cases Using FRAPCON-3.3
4.44.4

-10
-5
0
5
10
0 20 40 60 8
Burnup, GWd/MTU
Pre
dic
ted
-Me
as
ure
d F
GR
, %
0
Figure 4.4 Predicted Minus Measured FGR as a Function of Burnup for Power
Ramp Assessment Cases Using FRAPCON-3.3
4.1.2 Ranges of Application and Uncertainties for Urania FGR
The recommended ranges of application for the urania FGR model are given below. These ranges
represent PNNL-estimated limits for reliable model-to-data comparisons to date and not necessarily the
outer bounds of all available data. No attempt has been made to bias the FGR in any direction:
Temperature: 300 to 2300 K
Rod-Average Burnup: 0 to 62 GWd/MTU
As-fabricated Density: 92 to 97% TD.
The uncertainties on the present urania FGR model are considered good based on the comparison to
assessment data. The standard deviation for the steady-state cases is 2.8% FGR, and the standard
deviation for the power ramp cases is 5.3% FGR.
4.2 Numerical Solution Improvements
Several improvements were made to the Massih gas release model to increase the accuracy of the
FGR predictions. The first change was to replace the three-term approximation to the integration kernel
with a more accurate four-term approximation. The second change was to use the radial burnup profile
rather than the radial power profile to weight the release from each radial ring in the calculation of the gas
release for the current axial node.
4.2.1 Improved Numerical Solution
Hermansson and Massih have recently published a paper (Hermansson and Massih, 2002) where they
use a four-term approximation to the integration kernel in their gas release model rather than the three-
4.54.5

term approximation that was used in the original publication of the model (Forsberg and Massih, 1985).
The use of the four-term approximation in the Massih model in FRAPCON-3 resulted in negligible
changes to the overall FGR prediction for the assessment cases.
4.2.2 Use of Radial Burnup Profile
The original version of FRAPCON-3 used the radial power profile to weight the contribution of
released gas from each radial ring when calculating the total gas release from each axial node. This is not
correct because the gas release value is a fraction of the total produced gas; therefore, a quantity
proportional to the total produced gas should be used to weight the contribution of gas release from each
radial ring. The radial power profile is proportional to the gas produced in the current time step, but since
the power changes with time, it is not proportional to the total gas production. The radial burnup profile
is proportional to the total gas production. For this reason, the code was changed to use the radial burnup
profile to weight the gas release from each radial ring in the calculation of the total gas release from each
axial node.
4.2.3 Modeling of Fission Gas Release During Power Ramps
A clarification is offered here on the recommended use of the code for power ramp cases, which
relates to the current logic within the Massih FGR model. In the Massih gas release model, if the current
time step is less than 1 day, the code assumes that no re-solution occurs during that time step. Thus, more
gas will accumulate in the grain boundary bubbles, which in turn promotes grain boundary saturation and
FGR from more nodes relative to the case where resolution is allowed. This behavior simulates the
enhanced release that is known to occur during power ramps following significant burnup accumulation at
steady-state power operation.
This enhanced release is not appropriate for steady-state power operation. Therefore, if steady-state
operation is being modeled, then time steps greater than 1 day should be used so that the re-solution is
modeled for the entire power-time history.
This guideline on the size of time steps will also be reflected in the input instructions for the latest
version of FRAPCON-3 under the variable, ‘ProblemTime.’ Future issues of the code are expected to
contain a revised version of the Massih model that will more robustly incorporate both high-burnup
effects and power ramp-related effects.
4.3 Corrections to the ANS5.4 Model
Several errors were discovered and corrected in the alternate gas release model, ANS5.4:
The ANS5.4 model was modified to calculate gas release based on the current time step radial power
and burnup profile. In the previous version of FRAPCON-3, the BOL power and burnup profiles
were used throughout life.
4.64.6

A typographical error was discovered in an intermediate version of the code (FRAPCON-3.2), which
resulted in the ANS5.4 subroutine excluding the thermal release portion in the calculation of the total
gas release. The total gas release only reflected the athermal gas release fraction. This error was
corrected, so both the thermal release and the athermal release are included in the calculation of total
gas release.
Note: No adjustments have been made to the ANS5.4 gas release model parameters to account for the
new thermal conductivity model or the addition of MOX fuel properties. PNNL has not assessed the
impact of these code changes on ANS5.4 predictions relative to data. PNNL does not recommend the
use of the ANS5.4 model to make quantitative estimates of FGR. The changes described in this section
have been made simply to bring the ANS5.4 model in FRAPCON-3.3 into agreement with the original
reference (ANSI/ANS-5.4-1982).
4.74.7


5.0 MODIFICATIONS FOR CLADDING
CORROSION AND ITS EFFECTS
Improved zirconium alloys have now been developed and deployed for PWR fuel rod cladding that
demonstrate significantly reduced corrosion and hydrogen pickup compared to Zircaloy-4. These include
“ZIRLOTM” (developed by Westinghouse) and “M5TM” (developed by FRAMATOME). The extensive
use of these new alloys, and the recent availability of published performance data for them, makes it both
possible and necessary to make preliminary updates to the corrosion model and hydrogen uptake model in
the FRAPCON-3 code to apply to cases where these cladding alloys are used.
Sections 5.1 and 5.2 describe the corrosion model updates that have been made for each of the new
alloys. It should be emphasized that these changes are empirical corrections to the existing FRAPCON-3
models for Zircaloy-4 corrosion and hydrogen pickup, not new models.
Note that changes for the new alloys to other cladding models, such as axial growth, thermal
expansion, mechanical properties, and thermal conductivity have not been made. The current Zircaloy-4
models continue in use for these properties because published data for the new alloys are sparse, and
proprietary data indicate that the variations from the Zircaloy-4 models present in FRAPCON-3 are not
large in general. (The exception to this is axial growth, which will be examined in a subsequent fuel code
update.) Ranges of application and uncertainties for the advanced cladding corrosion models are given in
Section 5.3.
NRC Staff questioned whether the existing corrosion and hydrogen pickup models for Zircaloy-2
cladding (used in BWR fuel rods) are applicable to the higher burnup and varying water chemistries
typical of modern BWR fuel and operation. Section 5.4 demonstrates, by data comparisons drawn from
recent references, that the existing models for Zircaloy-2 cladding on BWR rods are still applicable, even
to higher burnup. Section 5.5 describes the adjustment now made to cladding stress calculation from
corrosion-related wall thinning. The revised hydrogen solubility model in Zircaloy cladding is described
in Section 5.6.
5.1 Modifications for ZIRLOTM
Cladding: Changes and Verification
ZIRLOTM cladding differs from Zircaloy-4 primarily by the addition of 1% niobium and reduced iron
and tin content. These changes result in significantly reduced corrosion (Knott et al., 2003) (see
Figure 5.1) and slightly reduced hydrogen pickup fraction. The FRACPON-3 input signal ICM (cladding
type indicator) is given the value 4 for Zircaloy-4. In the modified code, this variable can now be given
the value 6 to indicate that modified corrosion appropriate for ZIRLOTM will be used.
It was found by trial that reducing the FRAPCON-3 calculated Zircaloy-4 corrosion rate by the factor
2.0 results in corrosion layer thickness predictions that compare closely to the ZIRLOTM corrosion data
trend presented by Knott et al. (2003). (Much of these data were also presented earlier in Kaiser et al.,
[2000].) The least-squares (LSQ) curve presented with this data in Figures 5.1 and 5.2 represents the least
squares fit to the ZIRLOTM data. Figure 5.2 demonstrates the effect of this change in FRAPCON-3
5.15.1

0
20
40
60
80
100
120
0 200 400 600 800 1000
FDI
Oxid
e T
hic
kn
ess,
mic
ron
REPNA8 TSQ002 17x17case
BFM034 ZIRLO(TM) Data LSQ ZIRLO
Figure 5.1 Comparison of FRAPCON-3 (Zircaloy-4) Calculated Corrosion (Various Symbols
Noted in Legend) with Westinghouse Data (Small Dots) for ZIRLO™, as a
Function of Fuel Duty Index (FDI)
0
20
40
60
80
100
120
0 100 200 300 400 500 600
FDI
Ox
ide T
hic
kn
es
s, m
icro
ns
REPNA8 TSQ002 17x17case
BFM034 REPNA8Mod TSQ002Mod
17x17Mod BFM034Mod ZIRLO(TM) Data Trend
Figure 5.2 Comparison of FRAPCON-3 Calculated Zircaloy-4 Corrosion (Closed Symbols),
Modified FRAPCON-3 (ZIRLOTM) Calculated Corrosion (Open Symbols), and
Westinghouse Data Trend for ZIRLOTM (Solid Line), as a Function of FDI
5.25.2

predictions, relative to the ZIRLOTM corrosion data. The closed data points are FRAPCON-3 predictions
for these fuel rods with Zircaloy-4 cladding, and the open data points and (+) symbols are for these same
fuel rods with ZIRLOTM cladding.
Note that both Kaiser et al. (2000) and Knott et al. (2003) present the ZIRLOTM corrosion data as a
function of the so-called fuel duty index (FDI), which is proportional to the product of cladding surface
temperature and time, integrated over the operational history of the fuel rod segment corresponding with
the cladding sample. Hence, the calculated oxide layer thicknesses are plotted against this same index,
using the axial nodal cladding surface temperatures for each time step and the case power history time
step sizes, and applying the formula for FDI given by Knott et al. (2003):
dttT
FDI ave
1000100
580(5.1)
where
t = time in hours
Tave = local average cladding oxide layer outer surface temperature in ºF.
The hydrogen pickup fraction for ZIRLOTM was reduced from the 15% derived for Zircaloy-4 to
12.5%, based on data from the irradiation tests reported in the Japanese/Spanish TopFuel paper (Tsukuda
et al., 2003) (see Figure 5.3.) The overall hydrogen absorption is reduced significantly relative to that of
Zircaloy-4 at equivalent duty factor because of the significant reduction in oxidation.
0
20
40
60
80
100
120
140
0 10 20 30 40 50 60 7
Oxide Thickness, microns
Hyd
rog
en
Pic
ku
p,
mic
rog
ram
/cm
^2
0
REPNA8Base TSQ002 17x17
BFM034 ZIRLO(TM) Data 12.5% Pickup
Figure 5.3 Hydrogen Pickup Data (Closed Circles) and Modified FRAPCON-3
Calculations (Open Symbols), for ZIRLO™ Cladding
5.35.3
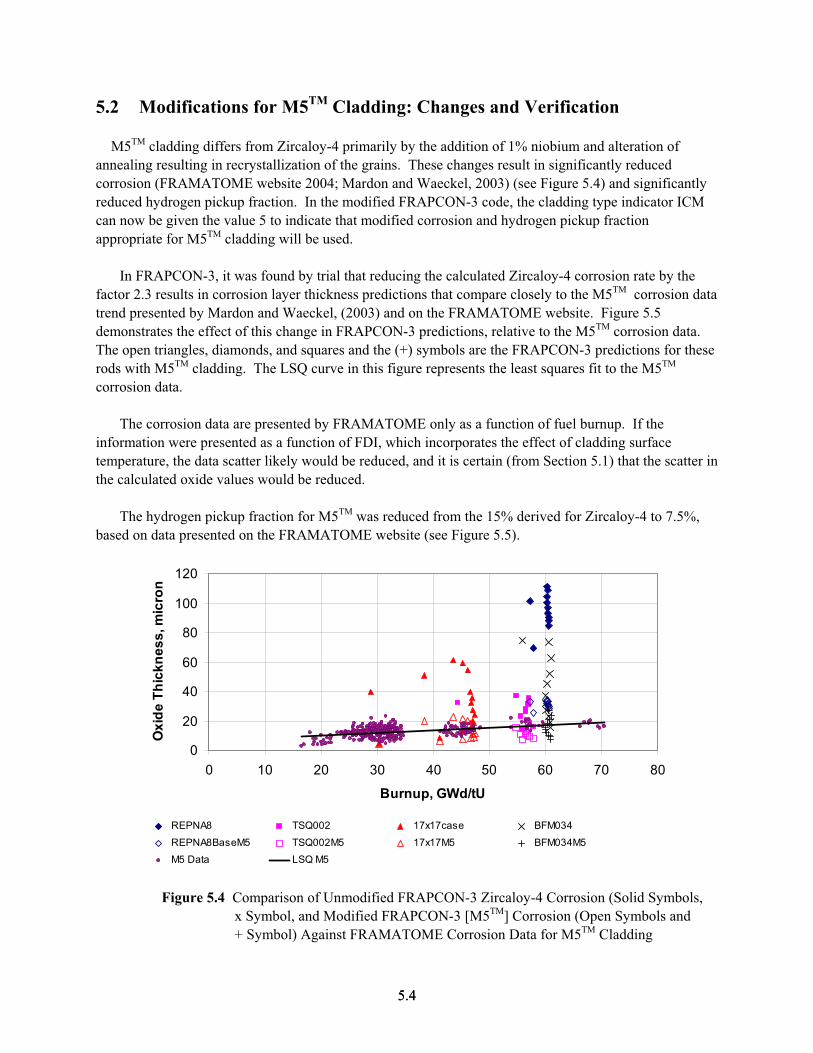
5.2 Modifications for M5TM
Cladding: Changes and Verification
M5TM cladding differs from Zircaloy-4 primarily by the addition of 1% niobium and alteration of
annealing resulting in recrystallization of the grains. These changes result in significantly reduced
corrosion (FRAMATOME website 2004; Mardon and Waeckel, 2003) (see Figure 5.4) and significantly
reduced hydrogen pickup fraction. In the modified FRAPCON-3 code, the cladding type indicator ICM
can now be given the value 5 to indicate that modified corrosion and hydrogen pickup fraction
appropriate for M5TM cladding will be used.
In FRAPCON-3, it was found by trial that reducing the calculated Zircaloy-4 corrosion rate by the
factor 2.3 results in corrosion layer thickness predictions that compare closely to the M5TM corrosion data
trend presented by Mardon and Waeckel, (2003) and on the FRAMATOME website. Figure 5.5
demonstrates the effect of this change in FRAPCON-3 predictions, relative to the M5TM corrosion data.
The open triangles, diamonds, and squares and the (+) symbols are the FRAPCON-3 predictions for these
rods with M5TM cladding. The LSQ curve in this figure represents the least squares fit to the M5TM
corrosion data.
The corrosion data are presented by FRAMATOME only as a function of fuel burnup. If the
information were presented as a function of FDI, which incorporates the effect of cladding surface
temperature, the data scatter likely would be reduced, and it is certain (from Section 5.1) that the scatter in
the calculated oxide values would be reduced.
The hydrogen pickup fraction for M5TM was reduced from the 15% derived for Zircaloy-4 to 7.5%,
based on data presented on the FRAMATOME website (see Figure 5.5).
0
20
40
60
80
100
120
0 10 20 30 40 50 60 70
Burnup, GWd/tU
Ox
ide
Th
ick
ne
ss
,m
icro
n
80
REPNA8 TSQ002 17x17case BFM034
REPNA8BaseM5 TSQ002M5 17x17M5 BFM034M5
M5 Data LSQ M5
Figure 5.4 Comparison of Unmodified FRAPCON-3 Zircaloy-4 Corrosion (Solid Symbols,
x Symbol, and Modified FRAPCON-3 [M5TM] Corrosion (Open Symbols and
+ Symbol) Against FRAMATOME Corrosion Data for M5TM Cladding
5.45.4

0
10
20
30
40
50
0 20 40 60 8
Burnup, GWd/MTU
Hyd
rog
en
, m
icro
gra
m p
er
cm
^2.
0
REPNA8BaseM5 TSQ002M5
17x17M5 BFM034M5
M5 Data Data LSQ = ~7.5% Pickup
Figure 5.5 Hydrogen Pickup Data (Closed Circles) and Modified FRAPCON-3 Calculations
for M5TM Cladding (Hydrogen Pickup Fraction is Reduced from 15% to 7.5%)
5.3 Ranges of Application and Uncertainty for Cladding Corrosion
The recommended ranges of application for the cladding corrosion models are given below. These
ranges represent PNNL-estimated limits for reliable model-to-data comparisons to date and not
necessarily the outer bounds of all available data:
Temperature: 570 to 650 K (PWR)
520 to 550 K (BWR)
Rod-Average Burnup: 0 to 62 GWd/MTU
Oxide Thickness: 1 to ~150 microns.
The uncertainty on oxide thickness is approximately 5 microns up to 50 microns layer thickness, and
10% relative for thicker oxide layers. The uncertainty on hydrogen content in the cladding (for a given
oxide layer thickness) is approximately 15% relative.
5.4 Confirmation BWR Corrosion Rate and Hydrogen Pickup for
Zircaloy-2
It is apparent that the current BWR-condition corrosion model in FRAPCON-3 (applied to
Zircaloy 2) predicts well to high burnup and should be retained based on comparison to data from GE fuel
presented by Potts (2000), and Japanese BWR and Zircaloy-2 corrosion data presented by Itagaki et al.
(2003) and Ishimoto et al. (2000). This is demonstrated in Figures 5.6 - 5.8.
5.55.5

0
10
20
30
40
50
0 500 1000 1500 2000 2500 3000 3500
Irradiation Time (d)
Oxid
e T
hic
kn
es
s, m
icro
ns
Data FRAPCON-3
Is
Figure 5.6 Japanese/Spanish BWR Zircaloy-2 Corrosion Data and FRAPCON 3 Calculations
(from Ishimoto et al. [2003])
0
5
10
15
20
25
0 10 20 30 40 5
Burnup GWd/tU
Ox
ide
Th
ick
ne
ss
, m
icro
ns
0
.
Data FRAPCON-3
Figure 5.7 Japanese Halden Test BWR Zircaloy-2 Corrosion Data and FRAPCON-3
Calculations (from Itagaki et al. [2003])
5.65.6

0
25
50
75
100
0 10 20 30 40 50 60 70 8
Bundle Average Exposure, GWd/MTU
Ro
d A
vera
ge
Co
rro
sio
n f
rom
L
ift-
Off
,
mic
ron
s..
0
Process 5 - IPHT (Beta) - ZN-injection plants Process 3 - Tubeshell HT (alpha +beta)
Process 5 - IPHT (Beta) Process 6 - IPHT (alpha + beta) - ZN-injection plants
Process 4 - Tubeshell HT (alpha + beta) - ZN-injection plants Process 4 - Tubeshell HT (alpha + beta)
Process 6 - IPHT (alpha + beta) FRAPCON-3
Figure 5.8 GE BWR Zircaloy-2 Corrosion Data and FRAPCON-3 Calculations (from Potts [2000])
It is also apparent that the current hydrogen pickup fraction of 29% used in FRAPCON 3 is
appropriate to high burnup and should be retained, based on irradiation test data and autoclave test data
presented by Itagaki et al. (2003), and Ishimoto et al. (2000) (see Figure 5.9).
5.75.7

0
10
20
30
40
0 10 20 30 40 50
Assembly AverageBurnup (GWd/t)
Hyd
rog
en
Pic
ku
pF
rac
tio
n(%
)
60
Zry-2 Data FRAPCON-3
Figure 5.9 Measured In-Reactor Hydrogen Pickup Fractions in Zircaloy-2 Coupons (from
Itagaki et al. [2003]) Compared to the FRAPCON-3 Value
5.5 Adjustment of Stress Calculations for Clad Wall Thinning Due to
Corrosion
As the cladding oxidizes, the wall thickness that should be used to calculate stress decreases as more
of the Zircaloy is consumed in the oxidation reaction. This thinning of the cladding had not been
modeled in previous versions of FRAPCON-3. The latest version of FRAPCON-3 accounts for the effect
of clad wall thinning due to corrosion on the calculation of stress.
To account for this wall thinning, at each time step the variable, ‘dco’, which stores the clad outer
diameter, is reduced by the oxide thickness increase from the previous time step divided by 1.56, which is
the ratio of the volume of ZrO2 to the volume of Zircaloy. This value of ‘dco’ is stored for each axial
node and goes into the mechanical calculations, so the cladding stress is calculated based on a reduced
wall thickness.
In FRAPCON-3, the variable, ‘dco’, which is modified as described above, is used to convert surface
heat flux to LHGR and back to surface heat flux in several places throughout the code. To keep the
LHGR values consistent with the input values a new variable is defined as the initial cladding outer
diameter, which was input, and this variable, which is not modified for the thinning due to oxidation, is
used to convert between surface heat flux and LHGR.
It is known that at high burnup, as the cladding begins to pick up a significant quantity of hydrogen,
the outer edge of the cladding begins to exhibit a structure known as a hydride rim, characterized by
dense circumferential hydrides. This hydride rim is very brittle and most likely does not contribute to the
5.85.8

strength of the cladding. Currently in FRAPCON-3, this hydride rim is not modeled, and the stress in the
cladding is divided equally across the entire thickness of the cladding that has not been consumed by
oxidation.
5.6 New Hydrogen Solubility Function for Zircaloy Cladding
The model in FRAPCON-3 for the solubility of hydrogen in Zircaloy was changed from the Sawatzky
model (Sawatzky and Wilkins, 1967) to the Kearns model (Kearns, 1967). FRAPCON 3 does not
explicitly use the amount of hydrogen in solution in any of its calculations. It does, however, output the
amount of precipitated hydrogen at each axial node that is calculated using a hydrogen solubility model.
The transient companion code to FRAPCON-3, FRAPTRAN, uses the amount of precipitated hydrogen
in the calculation of its strain-based failure criteria. To keep the two codes consistent with each other, the
hydrogen solubility model in FRAPCON-3 was changed to the Kearns model used in FRAPTRAN, and
that is more widely used in the literature.
The model for hydrogen solubility in Zircaloy in FRAPCON-3 is now given by the following
equation.
H = 1.2 x 10⁵ exp(-8550/[1.986T]) (5.2)
where:
HSol = Solubility of hydrogen in Zircaloy (ppm)
T = Zircaloy temperature (K).
5.95.9


6.0 CODE CAPABILITY ENHANCEMENTS
Several significant changes have been made to FRAPCON-3 since its original release that do not fall
into the category of new or updated models. Rather, these changes represent enhancements to the basic
code structure that allow the user to perform calculations that previously had not been possible without
altering the code.
6.1 Input Option to Restrict Fission Gas Release
A new input variable was added to the data block, $frpcon, called ‘igas.’ The default value for ‘igas’
is 0. This variable is defined as the time step when FGR will begin. For all time steps prior to this value,
the code will calculate a value of 0 for the gas release. For steps including and after the value specified in
‘igas,’ the calculation of FGR will proceed as if the rod had released gas in the prior steps, except the
released gas from prior steps is not included in the rod void volume and therefore does not contribute to
the gas mixture for gap gas thermal conductivity and gap conductance calculations or to the rod internal
pressure.
This option is useful in performing a calculation where a rod is irradiated for some time, refabricated
and refilled with gas, and then the refabricated rod is irradiated for another period of time. If the user is
interested in the gas release behavior of the refabricated rod, the user can run the code with no gas release
during the initial irradiation to calculate the burnup effects from the initial irradiation, and then specify a
time step where gas release will begin for the second irradiation period.
This option only applies to the Massih FGR model. PNNL has not included this option in the
ANS5.4 model.
6.2 Input Option to Impose Cladding Surface Temperature Profiles
In some cases, it may be necessary for the user to be able to specify the cladding surface temperature
at each axial node (as a function of time). The previous version of the code did not facilitate this because
it calculated the cladding temperature for each node based on the coolant inlet temperature, enthalpy rise,
and film coefficient, where the latter two are in turn functions of input flow rate, LHGR (hence heat flux),
and coolant system pressure. Potential applications of this option are analysis of a test rod irradiated
within a capsule and simulation of an irradiated rod in cask storage conditions. The latest version of
FRAPCON-3.3 has been modified as described below to allow the user to input the temperature profile
for the cladding surface for use during specified time steps.
The application of this option follows a pattern similar to that for axial power shape input.
The following is a list of the new variables that were added to the $frpcon input block in order to add
this capability.
ifixedtsurf – default value =0, in order for the input surface temperature to be used for a time step,
‘ifixedtsurf’ must be equal to 1 and the input variable, ‘go,’ must be equal to 0.0 for that time step.
6.16.1

xt(1) – input elevations for the first temperature profile. The first value must be 0.0 and the last value
must equal ‘totl.’ Begin the input elevations for the second temperature profile at xt(n+1), where n is
the number of values in the first profile. Input value in feet or meters, depending on the type of input
units being used.
cladt(1) – input cladding temperatures corresponding to the values in the ‘xt’ array. Begin the
temperature values for the second temperature profile at cladt(n+1), where n is the number of values
in the first profile. Input value in °F or K, depending on the type of input units being used.
jstsurftemp – array of integer values that show which temperature profile to use for each time step.
Similar to ‘jst’ for the axial power profiles.
jnsurftemp – array of integer values that show how many values are in each temperature profile.
Each temperature profile may have a different number of values. The number of values does not need
to correspond with the number of axial nodes. The code will interpolate values for each axial node
based on the input.
The plenum region rod outer surface temperature equals the top-node input surface temperature. The
plenum (gas) heatup model remains unchanged (but that model adds no heat in a zero-power application).
6.3 FORTRAN 90 Compliance
The development and release of the FRAPCON-3 code has moved from a UNIX-based system to a
PC-based system. The benefit is that more users have access to PC systems, and the speed of these
systems is sufficient to run the code. With each release of FRAPCON-3, PNNL sends the code to the
user group as an executable that can be run on any PC system capable of executing a WIN32 application.
PNNL also distributes the FORTRAN source code so users can compile the code and make changes if
they wish. Due to the number of different systems and compilers used to develop and maintain the code,
the source code was not compatible with all FORTRAN compilers. Therefore, PNNL made the extensive
(non-modeling) revisions to bring the code into compliance with the FORTRAN 90 standard. Now, any
compiler that can compile a FORTRAN 90 program will be able to compile the program regardless of the
operating system or computer type in use.
During this process of bringing the code into compliance with the FORTRAN 90 standard, an
extensive quality assurance program was in place whereby the output of the code was checked
electronically relative to the output of the original code after each set of changes were made. This
program ensured that the output of the FORTRAN 90 compliant code was identical to the output of the
original code.
6.26.2

7.0 REFERENCES
Adamson, M.G., E.A. Aitken, and R.W. Caputi. Journal of Nuclear Materials, vol. 130 p. 245. 1985.
Bagger, C., H. Carlson, and P. Knudson. Details of Design Irradiation and fission Gas Release for the
Danish UO2-Zr Irradiation Test 022, RISP-M-2152, Riso National Laboratory, Denmark. 1978.
Balfour, M.G. BR-3 High burnup Fuel Rod Hot Cell Program, Final Report, Vol. 1. D0E/ET/34073-1,
Westinghouse Electric Corporation, Pittsburgh, Pennsylvania. 1982.
Balfour, M.G., E. Roberts, E. DeQuidt, and P. Blanc, Zorita Research and Development Program
Volume 1: Final Report, WCAP-10180, Westinghouse Electric Corporation, Pittsburgh, Pennsylvania.
1982.
Barner, J.O., M.E. Cunningham, M.D. Freshley and D.D. Lanning, High Burnup Effects Program: Final
Report, HBEP-61, Pacific Northwest National Laboratory, Richland, Washington. 1990.
Berna. G.A., C.E. Beyer, K.L. Davis and D. D. Lanning. FRAPCON-3: A Computer Code for the
Calculation of Steady-State, Thermal Mechanical Behavior of Oxide Fuel Rods for High Burnup,
NUREG/CR-6534, volume 2 (PNNL-11513 v.2, Pacific Northwest National Laboratory, Richland,
Washington). 1997.
Blanpain, P, L. Brunel, X. Thibault, and M. Trotabas. “MOX Fuel Performance in the French PWRs:
Status and Development,” in Proceedings of the ANS/ENS Topical Meeting on Light Water Reactor Fuel
Performance, Park City, Utah, April 10-13, 2000, pp. 973-989. 2000.
Carrol, J.C., R.A. Gomme, and N.A. Leech. “Thermal Diffusivity Measurements on Unirradiated
Archive Fuel, and Fuel Irradiated in the Halden IFA-558 Experiment,” paper 13 in Proceedings of the
Enlarged HPG Meeting on High Burnup Fuel Performance, Safety and Reliability and Degradation of
In-Core Materials and Water Chemistry Effects and Man-Machine Systems Research, 1994 HWR-345,
Bolkesjo, Norway Limited Distribution. 1994.
Chantoin, P.M., E. Sartori, and J.A. Turnbull. “The Compilation of a Public Domain Database on
Nuclear Fuel Performance for the Purpose of Code Development and Validation,” presented in
Proceedings of the ANS/ENS International Topical Meeting on Light Water Reactor Fuel Performance,
Portland, Oregon, March 2-6, 1997, pp. 515-522. 1997.
Cook, P., B. Christiansen, G. Dassel, E. Matthews, I. Robins. R. Stratton, C. Walker, and R. Weston.
“Performance of BNFL MOX Fuel,” in Proceedings of the ENS TopFuel 2003 Meeting, March 16 to 19,
2003, Wurzburg, Germany, p. 117. 2003.
De Meulemeester, E., N. Hoppe, G. de Contenson, M. Watteau “Review of Work Carried out by
BELGONUCLEAIRE and CEA on the Improvement and Verification of the COMETHE Computer Code
with the Aid of In-Pile Experimental Results,” paper ECS-EEC-73-595, BNES International Conference
on Nuclear Fuel Performance. 1973.
7.17.1

Devold, H., and H. Wallin. PIE Results from the High Burnup Rods CD/CH (IFA 429) and Comparison
with In Pile Data, HWR 409. Halden Reactor Project, Halden, Norway. 1994.
Djurle, S. Final Report of the Super Ramp Project, D0E/ET/34032 1. U.S. Department of Energy,
Washington, D.C. 1985.
Duriez, C., J.-P. Allesandri, T. Gervais, and Y. Philipponneau. “Thermal Conductivity of
Hypostoichiometric Low Pu Content (U,Pu)O2-x Mixed Oxide,” Journal of Nuclear Materials, vol. 277,
pp. 143-158. 2000.
FRAMATOME (website http://www.framatech.com/pdf/m5.pdf )
Forsberg, K. and A.R. Massih, “Fission Theory of Fission Gas Migration in Irradiated Nuclear Fuel
UO2,” Journal of Nuclear Materials, vol. 135, pp. 140-148. 1985.
Fukushima, S. T. Oishi, A. Maeda, and H. Watanabe. “The Effect of Gadolinium Content on the Thermal
Conductivity of Near-Stoichiometric (U,Gd)O2 Solid Solutions,” Journal of Nuclear Materials vol.105,
pp. 201-210. 1982.
Garlick, A., A.L. Goldsmith, P.D. Kennedy, P. Mellor and J.F.W. Thompson, Destructive Examinations
of KWU/CE and BNFL Rods at Windscale Task 2A, HBEP 24. Pacific Northwest Laboratory, Richland,
Washington. 1982.
Hagrman, D.L., A. Reymann, and R.E. Mason. MATPRO-Version II (Revision 2): A Handbook of
Materials Properties for Use in the Analysis of Light Water Reactor Fuel, NUREG/CR 0497
(TREE-1280), Rev.2. 1981.
Hejzlar, P., D. Feng, Y. Yuan, M.S. Kazimi, He Feinroth, B. Hao, E.J. Lahota and H. Hamilton. 2004.
“The Design and Manufacturing of Annular Fuel For High Power Density and Improved Safety in
PWRs,” the ANS/ENS/JAES International Meeting on Light Water Reactor Fuel Performance, Orlando
Florida, September 19-22, 2004, p.41. 2004
Hermansson, P., and A.R. Massih, “An Effective Method for Calculation of Diffusive Flow in Spherical
Grains,” Journal of Nuclear Materials, vol. 304, pp. 204-211. 2002.
Hirai, M. and S. Ishimoto. “Thermal Diffusivities and Thermal Conductivities of UO2-GD2O3,” Journal
of Nuclear Science and Technology, vol. 28, pp. 995-1000. 1991.
Hodge, S.A., and L.J. Ott. 2004. “Irradiation Tests of Mixed Oxide Fuel Prepared with Weapons
Derived Plutonium,” the ANS/ENS/JAES International Meeting on Light Water Reactor Fuel
Performance, Orlando Florida, September19-22, 2004, p. 273. 2004
7.27.2

Hodge, S.A., L.J. Ott, and F.P. Griffin. Implications of the PIE Results for the 40-GWd/MT-Withdrawal
MOX Capsules, ORNL/MD/LTR-241, Oak Ridge National Laboratory, Oak Ridge, Tennessee, vol. 2.
2003.
In de Betou, J., L.O.Jernkvist, A.R. Massih, P. Rudling, G. Ronnberg, M. Stepniewski, and G. Wiksell.
2004. “Assessment of Burnup Dependent Fuel Rod Failure Threshold under Reactivity Initiated
Accidents in Light Water Reactors,” the ANS/ENS/JAES International Meeting on Light Water Reactor
Fuel Performance, Orlando Florida, September 19-22, 2004, p.516. 2004
Ishimoto, S., T. Kubo (NFD), R.B Adamson, (GE Nuc.Energy), Y. Etoh (Hitachi), K. Ito (Toshiba), and
Y. Suzawa (TEPCO). “Development of New Zirconium Alloys for Ultra-High Burnup Fuel,” ANS/ENS
Topical Meeting on LWR Fuel Performance, April 10-13, 2000, Park City, Utah, pp. 499 -510. 2000.
Itagaki, N., K., Kakuichi, F. Yasuhiro, and T. Furuya, (NFI) and O. Kubota, (TEPCO), “Development of
New High Corrosion Resistance Zr Alloy ‘HIFI,” in ENS TopFuel 2003 Meeting, March 16-19, 2003,
Wurzburg, Germany. 2003.
Janvier, J C., de Bernardy de Sigoyer, B, and Delmas, R., Irradiation of Uranium Oxide in Strong
Cladding Effect of Initial Diametral Gap on Overall Behavior, Program CC 7, 1st and 2nd Sections, CEA
R 3358. Centre d’Etudes Atomique, France. 1967.
Kaiser, R.S., W.J. Leech, and A.L. Casadei. “The fuel duty index (FDI) – a New Measure of Fuel Rod
Cladding Performance,” in ANS/ENS Topical Meeting on LWR Fuel Performance, April 10-13, 2000,
Park City, Utah, pp. 393-400. 2000.
Kakiuchi, K., N. Itagaki, T. Furuya. (NFI), A. Miyazaki, Y. Ishii, and S. Susuki (TEPCO) and
M. Yamawaki (U. of Tokyo). “Effect of Iron for Hydrogen Absorption Properties of Zirconium Alloys,”
in ENS TopFuel 2003 Meeting, March 16-19, 2003, Wurzburg, Germany. 2003.
Kearns, J.J., “Terminal solubility and Partitioning of Hydrogen in the Alpha Phase of Zirconium,
Zircaloy-2 and Zircaloy-4,” Journal of Nuclear Materials, Vol. 22, pp. 292-303. 1967.
Khoruzkii, O.V., V.D. Kanyukova, V.V. Likhanskii, and A.A. Sorokin. 2004. “Thermophysical
Modeling of High Burnup WWER Fuel by the RTOP Code,” the ANS/ENS/JAES International Meeting
on Light Water Reactor Fuel Performance, Orlando Florida, September 19-22, 2004, p. 770. 2004
Kim, Y.S., and C.B. Lee. 2004. “Two-Step, Two-Stage Fission Gas Release Model,” the
ANS/ENS/JAES International Meeting on Light Water Reactor Fuel Performance, Orlando Florida,
September 19-22, 2004, p.727. 2004
Knott, R.P., R.L. Kesterson, L.G. Hallstadius, and M.Y. Young (Westinghouse-Columbia). “Advanced
PWR Fuel Designs for High Duty Operation” in ENS TopFuel 2003 Meeting, March 16-19, 2003,
Wurzburg, Germany. 2003.
7.37.3

Knudsen, P., C. Bagger, H. Carlsen, I. Misfeldt, and M. Mogensen. Riso Fission Gas Release Project
Final Report, DOE/ET/34033 1. 1983. U.S. Department of Energy (Prepared for DOE by Riso
Laboratory (Metallurgical Department), Roskilde, Denmark.
Komatsu, J., T. Tachibana, and K. Konashi. “The Melting Temperature of Irradiated Oxide Fuel,”
Journal of Nuclear Materials, Volume 154, pp. 38-44. 1988.
Lanning, D.D. Irradiation History and Final Postirradiation Data for IFA-432, NUREG/CR-0862,
PNL-2948, Pacific Northwest Laboratory, Richland, Washington. 1986.
Lanning, D.D., M.E. Cunningham, J.O. Barner, and E.R. Bradley. Qualification of Fission Gas Release
Data from Task 2 Rods, HBEP 25, Final Report. Pacific Northwest Laboratory, Richland, Washington.
1987.
Lanning, D.D., and C.E. Beyer. “Revised UO2 Thermal Conductivity for NRC Fuel Performance Codes.”
Transactions of the American Nuclear Society, 2002 Annual Meeting, vol. 86, pp 285-287. June 9-13,
2002, Hollywood, Florida. 2002.
Lippens, M. “A European Investigation of MOX Fuel Performance in Light Water Reactors,” in
Proceedings of the ANS/ENS Topical Meeting on Light Water Reactor Fuel Performance, Williamsburg,
Virginia, April 17-20, 1988, pp. 54-68. 1988.
Long, Y., Y. Yuan, A. Romano, and M.S. Kazimi. 2004. “Fission Gas Release of Heterogeneous Fuels
for Plutonium Burnup,” the ANS/ENS/JAES International Meeting on Light Water Reactor Fuel
Performance, Orlando Florida, Sept 19-22, 2004, p. 596. 2004
Lucuta, P.G., H.S. Matzke, and I.J. Hastings, “A Pragmatic Approach to Modeling Thermal Conductivity
of Irradiated UO2 Fuel: Review and Recommendations,” Journal of Nuclear Materials, vol. 232 (1996),
pp 166-180.
Mardon, J.P., and N. Waeckel (FRAMATOME-ANP and EdF). “Behavior of M5TM Alloy Under LOCA
Conditions,” in ENS TopFuel 2003 Meeting, March 16-19, 2003, Wurzburg, Germany. 2003.
Massih, A.R., S. Persson and Z. Weiss. “Modeling of (U,Gd)O2 Fuel Behavior in Boiling Water
Reactors,” in Proceedings of Symposium E on Nuclear Materials for Fission Reactors of the 1991 E-MRS
Fall Conference; Journal of Nuclear Materials vol. 188, pp 323-330. 1992.
Matsson, I., and J.A. Turnbull. The Integral Fuel Rod Behaviour Test IFA-597.3: Analysis of the
Measurements, HWR-543 Halden Reactor Project, Norway (Limited distribution). 1998.
Mogard, H., project manager. Final Report of the Inter Ramp Project, STIR 53. ABB Atomenergi,
Studsvik Laboratory, Nykoping, Sweden. 1979.
Newman, L.W. Development and Demonstration of an Advanced Extended-Burnup Fuel Assembly
Design Incorporating Urania-Gadolinia, DOE/ET/34212-36, BAW-1681-2. Babcock and Wilcox Inc.,
Lynchburg, Virginia. 1982.
7.47.4

Newman, L.W., project manager. Thermal and Physical Properties of Urania-Gadolinia Fuel,
DOE/ET/34212-43, BAW-1759. Babcock and Wilcox Inc., Lynchburg, Virginia. 1984.
Newman, L.W., project manager. The Hot Cell Examination of Oconee 1 Fuel Rods after Five Cycles of
Irradiation, DOE/ET/34212 50, BAW 1874. Babcock and Wilcox Inc., Lynchburg, Virginia. 1986.
Notley, M.J.F., and J.R. MacEwan. The Effect of UO2 Density on Fission Gas Release and Sheath
Expansion, AECL-2230, Atomic Energy of Canada, Ltd., Chalk River, Canada. 1965.
Notley, M.J.F., R. DesHais, and J.R. MacEwan. Measurements of the Fission Product Gas Pressures
Developed in UO2 Fuel Elements During Operation, AECL-2662, Atomic Energy of Canada, Ltd., Chalk
River, Canada. 1967.
Ogata, K., T. Karasawa, T. Anegawa, S. Koizumi, and K. Ito. “Japanese BWR Fuel Performance and
Recent R& D Activities,” in ANS/ENS Topical Meeting on LWR Fuel Performance, April 10-13, 2000,
Park City, Utah, pp. 108-117. 2000.
Ohira, K., and N. Itagaki. “Thermal Conductivity Measurements of High Burnup UO2 Pellet and a
Benchmark Calculation of Fuel Center Temperature,” in Proceedings of the ANS International Topical
Meeting on LWR Fuel Performance, pp. 541-549. March 2-6, 1997, Portland, Oregon. 1997.
Peititprez, B., Ramp Tests with Two High Burnup MOX Fuel Rods in IFA-629.3, HWR 714, Halden
Reactor Project, Norway (Limited Distribution), 2002.
Popov, S.G., J.J. Carbajo, VK. Ivanov, and G.L. Yoder, Thermophysical Properties of MOX and UO2
Fuels Including the Effects of Irradiation, ORNL/TM 2000/351, Oak Ridge National Laboratory,
Oak Ridge, Tennessee. 2000.
Potts, G.A. “Recent GE BWR Fuel Experience,” ANS/ENS Topical Meeting on LWR Fuel Performance,
April 10-13, 2000, Park City, Utah, pp. 95-107. 2000.
Ronchi, C., M. Sheindlin, M. Musella, and G.J. Hyland. “Thermal Conductivity of Uranium Dioxide Up
to 2900K from Simultaneous Measurement of the Heat Capacity and Thermal Diffusivity.” Journal of
Applied Physics 85(2):776-789. 1999.
Ronchi, C., M. Sheindlin, D. Staicu, and M. Kinoshita. “Effect of Burnup on the Thermal Conductivity
of Uranium Dioxide up to 100,000 MWd/t,” Journal of Nuclear Materials, volume 327, pp. 58-76. 2004.
Sabol, G.P., R.J. Comstock, R.A. Weiner, P. Larouere, and R.N. Stanutz. “In-Reactor Corrosion
Performance of ZIRLOTM and Zircaloy-4,” in Zirconium in the Nuclear Industry: Eighth International
Symposium, ASTM STP 1023, L.F.P Van Swam and C.M. Euken, Eds., ASME, Philadelphia,
Pennsylvania, pp. 227-244. 1989.
7.57.5

Sabol, G.P., G.R. Kelp, M.G. Balfour, and E. Roberts. “Development of a Cladding Alloy for High
Burnup,” in Zirconium in the Nuclear Industry: Tenth International Symposium, ASTM STP 1245,
A.M. Garde and E.R. Bradley, Eds., ASME, Philadelphia Pennsylvania. pp. 724-744. 1994.
Sakurai, H., Y. Wakashima, K. Ito, M. Sasaki, T. Nomata, Y. Tsukuda, H. Hayashi, and D. Kubota.
“Irradiation Characteristics of High burnup BWR Fuels,” in ANS/ENS Topical Meeting on LWR Fuel
Performance, April 10-13, 2000, Park City, Utah, pp. 128-138. 2000.
Sawatzky, A., and Wilkins, B.J.S, “Hydrogen Solubility in Zirconium Alloys Determined by Thermal
Diffusion”, Journal of Nuclear Materials, Vol. 22, pp. 304-310. 1967.
Smith, G. P. Jr., Project Manager, et al., The Evaluation and Demonstration of Methods for Improved
Nuclear Fuel Utilization, DOE/ET/34013 15. 1994. Prepared for the U.S. Department of Energy by
Combustion Engineering, Inc., Windsor Lock, Connecticut. 1994
Tolonen, P., M. Pihlatie, and H. Fuji, The MOX Fuel Behaviour Test IFA-597.4/5/6: Thermal and Gas
Release Data to a Burnup of 25 MWd/kgMOX, HWR-652, Halden Reactor Project, Halden, Norway
(Limited Distribution), 2001.
Tsukuda, Y., Y. Kosaka, T. Kido, S. Doi, T. Sendo, P. Gonzales, and J.M. Alonso (Japan-NUPEC, NDC,
MHI, and KEPCO; Spain-ENDESA and ENUSA). “Performance of Advanced Fuel Materials for High
Burnup,” in ENS TopFuel 2003 Meeting, March 16-19, 2003, Wurzburg, Germany. 2003.
U.S. Department of Energy Office of Fissile Materials Disposition. Surplus Plutonium Disposition Final
Environmental Impact Statement, DOE/EIS – 0283. 1999.
Vallejo, I., M.T. del Barrio, and L.E. Herranz. 2004. “Major Sensitivities of Fission Gas Release
Modeling within the FRAPCON-3 Code,” the ANS/ENS/JAES International Meeting on Light Water
Reactor Fuel Performance, Orlando Florida, September 19-22, 2004, p. 263. 2004
Vrtilkova, V., J. Jaos, J. Cmakal, and L. Belovsky (Czech, SKODA). “Corrosion of Zr-Alloys,” in
ANS/ENS Topical Meeting on LWR Fuel Performance, April 10-13, 2000, Park City, Utah, pp. 401-415.
2000.
Waterman, M.E. Corrected and Updated Data for IFA 429 from Beginning of Life Through June 1978,
NUREG/CR 0478, Tree 1269. 1978.
Wesley, D., A., K Mori, and S. Inoue. “Mark BEB Ramp Testing Program” presented in the Proceedings
of the 1994 ANS/ENS International Topical Meeting on Light Water Reactor Fuel Performance, West
Palm Beach, Florida. American Nuclear Society, p. 343. 1994.
White, R.J. “The Re-Irradiation of MIMAS MOX Fuel in IFA-629.1,” HWR-586 Halden Reactor
Project, Halden, Norway. 1999.
White, R.J., S.B. Fisher, P.M.A. Cook, R. Stratton, C.T. Walker, and I.D. Palmer. “Measurement and
Analysis of Fission Gas Release from BNFL’s SBR MOX Fuel.” Journal of Nuclear Materials, vol. 288,
pp. 43-56. 2001.
7.67.6

Wiesenack, W., and T. Tverberg. “Thermal Performance of High Burnup Fuel - In-Pile Temperature
Data and Analysis,” in Proceedings of the ANS International Topical Meeting on Light Water Reactor
Fuel Performance, pp. 730-737. April 2000, Park City, Utah. 2000.
Wright, J. “The SBR MOX and UO2 Comparison Test in Gas Flow Rig IFA-633: Results after Seven
Cycles of Irradiation,” HWR-764, Halden Reactor Project, Halden, Norway. 2004.
7.77.7


Appendix A
Code-Data Comparisons for MOX Fuel Temperatures


Appendix A
Code-Data Comparisons for MOX Fuel Temperatures
A.1 Introduction
Recent instrumented fuel tests in the Halden test reactor are of interest to FRAPCON-3.3 MOX fuel
thermal performance confirmation because they include re-fabricated high-burnup pressurized water
reactors (PWR) mixed plutonia-urania oxide MOX fuel segments. A total of four rod segments are
represented in the five high-burnup tests, with pre-test burnups ranging from 50 to 65 MWd/kgM. These
comparisons include fuel temperature as a function of time and burnup and include fission gas release
(FGR) in the case of experiments IFA 606 and 629.3 (see Sections A.2 through A.5).
Fuel temperature, rod elongation, and FGR data are also available from two additional PWR MOX
fuel rod segments tested in the IFA-629.1 experiment. The base-irradiation burnup for these two rods was
27 and 29 MWd/kgHM. The maximum linear heat generation rates (LHGRs) during the test were
significant (35 to 40 kW/m). Code-data comparisons are shown in Section A.6.
Beginning-of-life (BOL) fuel temperatures have been measured for both UO2 (urania) and MOX fuel
in IFA-633. The IFA-633 code-data comparisons in particular confirm the magnitude of the conductivity
difference between MOX and urania. These are shown in Section A.7.
A.1
A.2 IFA-606 Temperature and FGR Data and Calculations
The IFA-606 test assembly consisted of four re-fabricated rod segments from a full-length PWR
MOX rod irradiated in the Beznau-1 reactor (Switzerland) at nominal LHGRs to a burnup of
50 MWd/kgM. Two test rods were instrumented with a fuel thermocouple and a pressure transducer, and
irradiated under Halden conditions for approximately 30 days at elevated LHGR in “Phase 2” of the test,
to determine FGR behavior (Mertens et al., 1998; Mertens and Lippens, 2001). The code-data
comparisons presented here are for one of these rods with “nominal” (12.5-micron) grain size.
A.2.1 Description of Test Rod and Base Irradiation
The design and operating parameters available for the full-length (“mother”) rod and for the
instrumented rod segments (“daughter rods”) are given in Tables A.2.1 and A.2.2, respectively. Table
A.2.2 does not list the thermocouple well diameter for the instrumented rod, which is assumed to be
2.5 mm based on other Halden irradiation specifications. The rod was base-irradiated at nominal LHGRs
for ~1500 days, as shown in Figure A.2.1. The rod segment reached a burnup of 49.5 MWd/kgM.
A.2.2 Test Rod Instrumentation and Test Conduct
The fuel rod segment was instrumented with a pressure transducer and a fuel centerline thermocouple.
FGR was determined from the rise in pressure readings and was later confirmed by postirradiation
examination puncture. The LHGR history during the test (the segment-average LHGR) is shown in
Figure A.2.2. The neutron flux at the thermocouple position happens to be very close to the rod-average
value; however, this value is adjusted downward by 10% for FRAPCON input because of the effect of the
thermocouple well, which in this case is 30% of the radius and hence about 10% of the fuel volume.
A.2.3 Code-Data Comparisons
The measured and calculated fuel center temperatures vs. burnup are shown in Figure A.2.3. The
data are overpredicted by about 50°C at the highest LHGR but the comparison is closer elsewhere. The
FGR was measured as about 12% by end-of-test compared to a calculated increase in FGR (during the
test) of 13.1%.
A.2

Table A.2.1. IFA 606 Mother Rod
Pellet OD: 9.293 mm
Pellet ID: 0.000 mm
Pellet Ht: 12.555 mm
Dish & Chamfer Volume: 1.2%
RMS Roughness: 0.0025 mm
Avg. Grain Diameter: 0.012 mm
As-Fabricated Density: 95.585%
Resinter Densification: 0.65%
Open Porosity: 0.1%
Pu Content: 5.97 w/o HM
U-235 Enrichment: 0.278 w/o
Pu isotopes: 65.86, 23.83, 7.38, 3.33 est.
(Pu-239, Pu-240, 241, 242) at. %
Fuel Type: AUC
Clad Material: Zr-4
Clad OD: 10.72 mm
Clad ID: 9.48 mm
RMS Roughness: 0.00063 mm
Stack Length: 3028.7 mm
Upper Plenum Volume: 8.96 cm3
Lower Plenum Volume: 0.0 cm3
Total Free Volume: 21.42 cm3
He Backfill Pressure: 2.4 Mpa
Backfill Temperature: 25°C
A.3

Table A.2.2. IFA 606 Daughter Rod
Fuel Rod Diametral Gap: 0.0 mm
Stack Length: 398.2 mm
Upper Plenum Length: 45.0 mm
Upper Plenum Volume: 3.14 cm3
Lower Plenum Volume: 0.0 cm3
Total Free Volume: 3.91 cm3
He Backfill Pressure: 0.511 Mpa
Backfill Temperature: 25°C
Mass Flux: 3280.0 kg/m2s
Hydraulic Diameter: 25.90 mm
Equivalent Heated Diameter: 27.00 mm
Inlet Temp: 220°C
Coolant Pressure: 33.6 bar
0
5
10
15
20
25
30
0 200 400 600 800 1000 1200 1400 1600
Time, Days
LH
GR
, kW
/m
ALHR Segment
Figure A.2.1. IFA-606 Base Irradiation Power History. (“ALHR” is Average Linear Heat
Rate; “Segment” Shows Heat Rating for the Segment of Interest, which was
Re-Fabricated to a Test Rod)
A.4
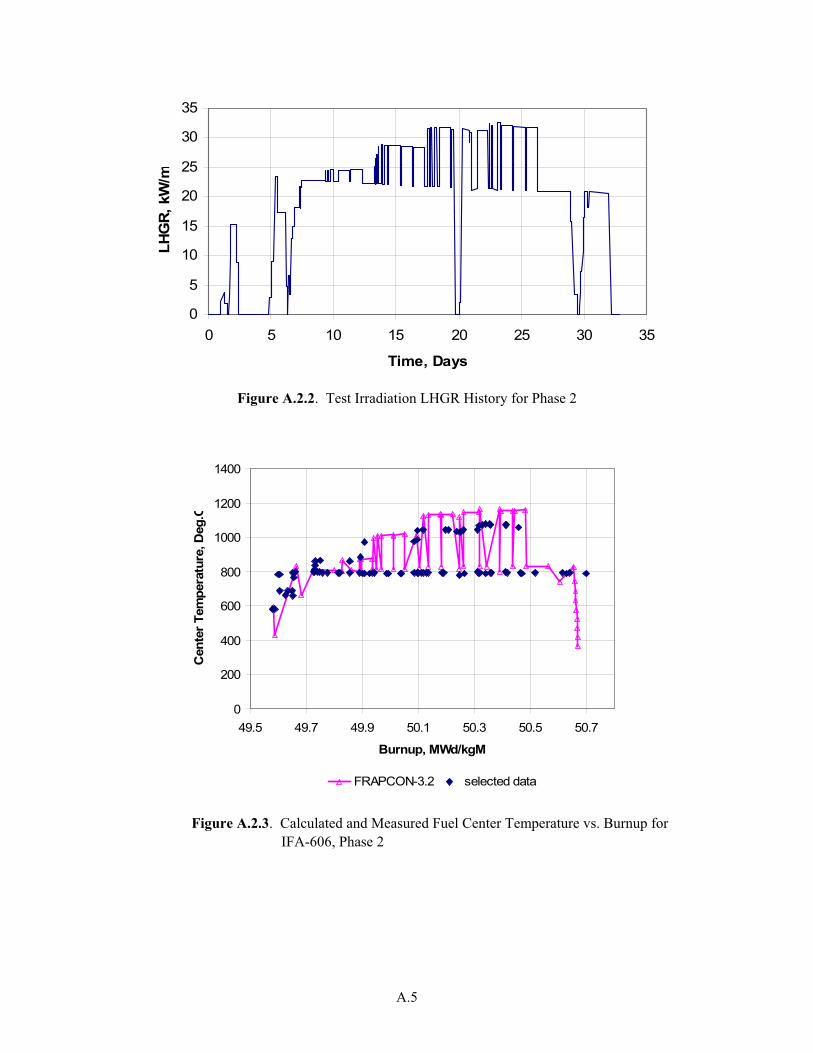
0
5
10
15
20
25
30
35
0 5 10 15 20 25 30 35
Time, Days
LH
GR
, kW
/m
Figure A.2.2. Test Irradiation LHGR History for Phase 2
0
200
400
600
800
1000
1200
1400
49.5 49.7 49.9 50.1 50.3 50.5 50.7
Burnup, MWd/kgM
Cen
ter
Tem
pera
ture
, D
eg
.C
FRAPCON-3.2 selected data
Figure A.2.3. Calculated and Measured Fuel Center Temperature vs. Burnup for
IFA-606, Phase 2
A.5

A.3 IFA-610.2 and 610.4 Fuel Temperature Data and Calculations
One segment from 4-Cycle PWR MOX EdF Rod N016 (which was base-irradiated for four cycles in
the French Gravelines-4 reactors to a burnup of approximately 55 MWd/kgM) was re-fabricated and
instrumented for use in the sequential IFA-610.2,4 cladding liftoff experiments (Nishi and Lee, 2001).
The rod was tested under simulated PWR conditions in a pressurized water loop within the Halden
reactor. The rod was connected to a gas supply system, and temperature measurements were made in
both helium and argon fill gases at varying pressures. Fuel temperature data from helium gas fill periods
are compared to calculations herein.
A.3.1 Description of the Test Rod and Base Irradiation
The design and operating parameters available for the mother (full-length) rod and daughter rod
segment are given in Tables A.3.1 and A.3.2, respectively. The rod was base-irradiated at nominal
LHGRs for ~1500 days, as shown in Figure A.3.1. The final burnup for the segment was
54.5 MWd/kgM.
A.3.2 Test Rod Instrumentation and Test Conduct
The rod was instrumented with a fuel center thermocouple and a rod elongation sensor. Internal gas
pressure was varied throughout the ~100-day IFA-610.2 test to investigate the threshold for cladding
liftoff (Beguin, 1999; Fujii and Claudel, 2001). The LHGR level during the IFA-610.2 test was steady at
about 14 kW/m to 15 kW/m, and LHGR at the thermocouple was about 13.5 to 14 kW/m.
In IFA-610.4, the LHGRs were similar at the beginning and drifted downward to 12.5 and 12.0 kW/m
for rod-average and thermocouple location, respectively (Fujii and Claudel, 2001). The test duration was
similar to that of IFA-610.2 (100 days); however, after 50 days, questions of potential thermocouple
degradation were raised, and code data comparison was only conducted over the first 50 days of the test.
A.3.3 Code-to-Data Comparisons
The measured and predicted temperatures throughout the IFA-610.2 test are shown in Figure A.3.2.
FRAPCON-3 tracked the measured temperatures very closely (+/- 10°C) for this test. For information,
this comparison is plotted vs. rod-average burnup in Figure A.3.3. The fuel picked up about
3.5 MWd/kgM during the test.
The calculated center temperature is shown vs. time-in-test for IFA-610.4 in Figure A.3.4. The code
continued to track the measured center temperature closely in this follow-on test < 20°C overprediction).
During the first half of each test, the rod internal overpressure was 150 to 200 bar, with little apparent
effect upon fuel temperatures.
A.6

Table A.3.1. IFA 610 Mother Rod
Pellet OD: 8.193 mm
Pellet ID: 0.000 mm
Pellet Ht: 11.770 mm
Dish diameter and depth: 4.897, 0.281 mm
RMS Roughness: 0.002 mm est.
Diametral gap: 167 microns
As-Fabricated Density: 94.43%
Resinter Densification: 0.503%
Grain size: 8 microns
Pu Content: 5.95 w/o HM
U-235 Enrichment: 0.229 w/o
Pu isotopes: 0.953, 65.187, 23.215, 7.317, 3.298 (Pu-238,
Pu-239, Pu-240, 241, 242) at. %
O/M Ratio: 1.997
Clad Material: Zr-4 (SR)
Clad OD: 9.50 mm
Clad ID: 8.36 mm
RMS Roughness: 0.001 mm estimated
Stack Length: 3655.9 mm
Lower Plenum Volume: 0.0 mm3
Total Free Volume: 19.7 cm3
He Backfill Pressure: 2.6 Mpa
Backfill Temperature: 25°C
Table A.3.2. IFA 610 Daughter Rod
Fuel Rod Diametral Gap: 0.0 mm
Thermocouple well diameter: 2.3 mm
Stack Length (enriched): 400 mm
Total Free Volume: 3 cm3 est.
He Backfill Pressure: 2.6 Mpa
Backfill Temperature: 25°C
Inlet Temp: 300°C
Outlet Temp: 310°C
Coolant Pressure: 160 bar
A.7

0
5
10
15
20
25
30
0 10 20 30 40 50 6
Rod Average Burnup (MWd/kgU )
Avera
ge P
ow
er
(kW
/m
0
Figure A.3.1. Base Irradiation History of IFA-610.2,4 Rod Segment
300
350
400
450
500
550
600
650
700
750
800
0 20 40 60 80 100 1
Time, Days
Cen
ter
Tem
p.,
20
C
Measured FRAPCON-3.2
Figure A.3.2. Measured and Calculated Fuel Center Temperatures vs. Time-in-
Test for IFA-610.2
A.8

300
350
400
450
500
550
600
650
700
750
800
54.0 54.5 55.0 55.5 56.0 56.5 57.0 57.5 58.0
Rod-Average Burnup, MWd/kgM
Cen
ter
Tem
pera
ture
, d
g.
C
Measured FRAPCON-3.2
Figure A.3.3. Measured and Calculated Fuel Center Temperatures vs. Rod-Average
Burnup for IFA-610.2
300
350
400
450
500
550
600
650
700
750
800
0 10 20 30 40 50 60
Time, Days
Cen
ter
Tem
pera
ture
, D
g.
C
0
5
10
15
20
25
LH
GR
, kW
/m
Data FRAPCON-3.2 LHGR at TC
Figure A.3.4. Measured and Calculated Fuel Center Temperatures vs. Time-in Test for
IFA-610.4 (first 50 days)
A.9

A.4 IFA-648.1 Temperature Data and Calculations
The IFA-648.1 irradiation was simply a burnup extension at low LHGR for two re-fabricated
instrumented segments from Gravelines-4 four-cycle PWR MOX rods, one segment each from Rods N12
and P16. The irradiation was carried on at low LHGR under simulated PWR conditions in a pressurized
water loop within the Halden reactor. The rods were then power-ramped in the follow-on IFA-629.3 test
to investigate FGR and rod elongation behavior.
A.4.1 Test Rod Description and Base Irradiation
The design and operating parameters available for the mother (full-length) rods and daughter rod
segments are given in Tables A.4.1 and A.4.2, respectively (Nishi and Lee, 2001). The mother rods were
base-irradiated at nominal LHGRs for ~1200 days, as shown in Figure A.4.1 and A.4.2. The final burnup
for the Rods N12 and P16 were 57 and 53 MWd/kgM, respectively.
A.4.2 Test Rod Instrumentation and Test Conduct
The two rods were instrumented differently upon refabrication. Rod 1 carried a fuel center
thermocouple and a rod elongation sensor. Rod 2 carried a fuel center thermocouple and a pressure
transducer. The LHGRs were kept deliberately low to accumulate more burnup without inducing FGR
(Claudel and Huet, 2001). The LHGRs at the thermocouple locations are shown in Figures A.4.3 and
A.4.4, respectively. Note that the LHGRs for Rod 1 are slightly higher than those for Rod 2. The rod-
average LHGRs were about 10% higher than those shown in the figures.
A.4.3 Code-to-Data Comparisons
The measured and predicted temperatures throughout the IFA-648.1 irradiation are shown for Rods 1
and 2 in Figures A.4.5 and A.4.6, respectively. Note that the measured temperatures for Rod 1 are
slightly higher than for Rod 2, reflecting the difference in LHGRs. FRAPCON-3 tracked the measured
temperatures very closely for Rod 1 (within 15°C) and underpredicted the temperatures for Rod 2 by
20 to 30°C).
For information, the measured temperatures for the two rods are plotted vs. rod-average burnup in
Figures A.4.7 and A.4.8. The segments accumulated an additional ~7 MWd/kgM burnup during the
IFA-648.1 irradiation.
A.10

Table A.4.1. IFA 648.1 Mother Rods (1st value for Rod N12, 2nd value for Rod P16)
Pellet OD: 8.193,8.190 mm
Pellet ID: 0.000 mm
Pellet Ht: 11.936, 11.897 mm
Dish diameter: 4.864,4.972 mm
Dish depth: 0.292, 0.293 mm
RMS Roughness: 0.002 mm estimated
Diametral gap: 167, 170 microns
As-Fabricated Density: 94.72, 94.62%
Resinter Densification: 0.086, 0.385%
Grain size: 8.0, 6.5 microns
Pu Content: 5.93, 4.69 w/o in HM
U-235 Enrichment: 0.231, 0.225 w/o
Pu isotopes: 0.957, 65.211, 23.175, 7.356, 3.302
(Pu-238, Pu-239, Pu-240, 241, 242) at. % 1.047, 65.296, 23.209, 7.004, 3.444
O/M Ratio: 1.996, 2.000
Clad Material: Zr-4 (SR)
Clad OD: 9.50 mm
Clad ID: 8.36 mm
RMS Roughness: 0.001 mm estimated
Stack Length: 3656.3, 3658.0 mm
Total Free Volume: 19.7, 19.6 cm3
He Backfill Pressure: 2.6 Mpa
Backfill Temperature: 25°C
Table A.4.2. IFA 648.1 Test Rods (Rods 1 and 2)
Fuel Rod Diametral Gap: 0.0 mm
Thermocouple well diameter: 2.5 mm
Stack Length: (enriched): 453.6, 451.3 mm
Total Free Volume: 2.81, 2.81 cm3
Instrumentation: TF/EC, TF/PF
He Backfill Pressure: 2.6 Mpa
Backfill Temperature: 25°C
Coolant Temp: 315 to 325°C
Coolant Pressure: 160 bar
A.11

0
5
10
15
20
25
30
0 200 400 600 800 1000 1200 1400
Time (days )
Avera
ge P
ow
er
(kW
/m)
Figure A.4.1. IFA-648.1 (Rod 1) Base Irradiation Power History (Full-Length Rod N12)
0
5
10
15
20
25
30
0 200 400 600 800 1000 1200 1400
Time (days )
Avera
ge P
ow
er
(kW
/m)
Figure A.4.2. IFA-648.1 (Rod 2) Base Irradiation Power History (Full-length Rod P16)
A.12
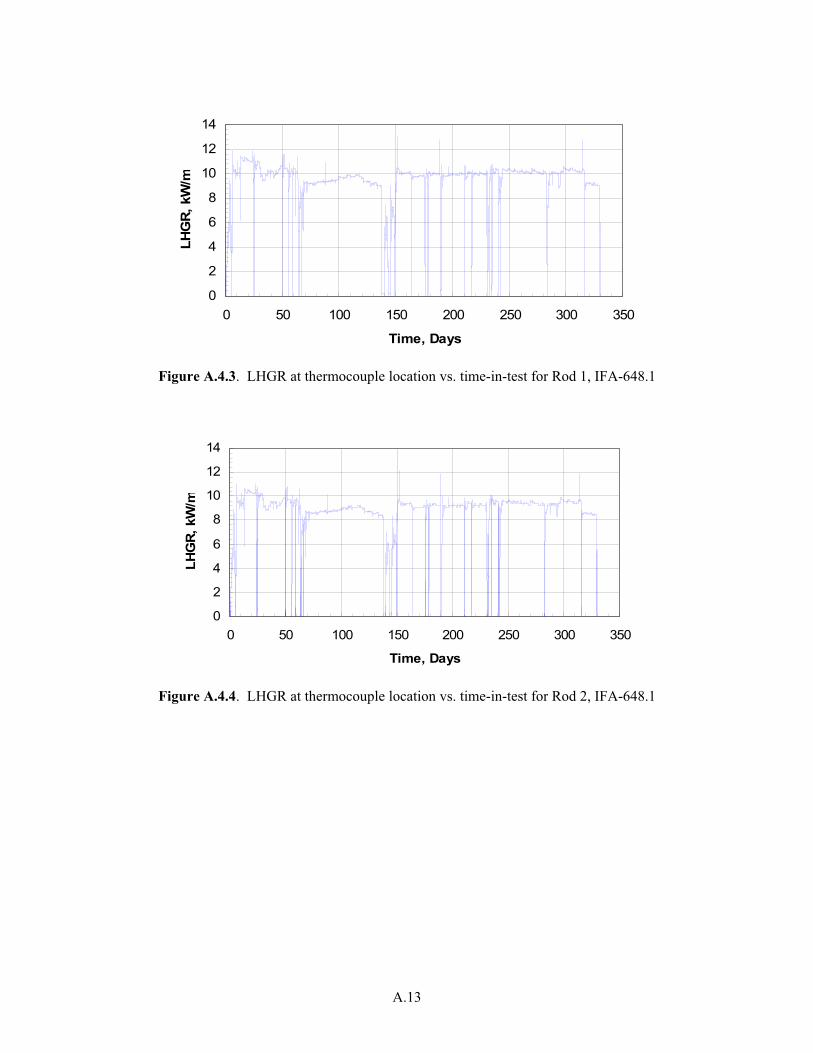
0
2
4
6
8
10
12
14
0 50 100 150 200 250 300 350
Time, Days
LH
GR
, kW
/m
Figure A.4.3. LHGR at thermocouple location vs. time-in-test for Rod 1, IFA-648.1
0
2
4
6
8
10
12
14
0 50 100 150 200 250 300 350
Time, Days
LH
GR
, kW
/m
Figure A.4.4. LHGR at thermocouple location vs. time-in-test for Rod 2, IFA-648.1
A.13

400
500
600
700
0 50 100 150 200 250 300 350
Time, Days
Cen
ter
Tem
pera
ture
., d
g C
Data Data FRAPCON-3.2
Figure A.4.5. Measured and Calculated Fuel Center Temperatures for Rod 1 of
IFA-648.1, vs. Irradiation Time
400
450
500
550
600
650
700
0 50 100 150 200 250 300 350
Time, Days
Cen
ter
Tem
pera
ture
., d
g C
Data Data FRAPCON-3.2
Figure A.4.6. Measured and Calculated Fuel Center Temperatures for Rod 2 of
IFA-648.1, vs. Irradiation Time
A.14
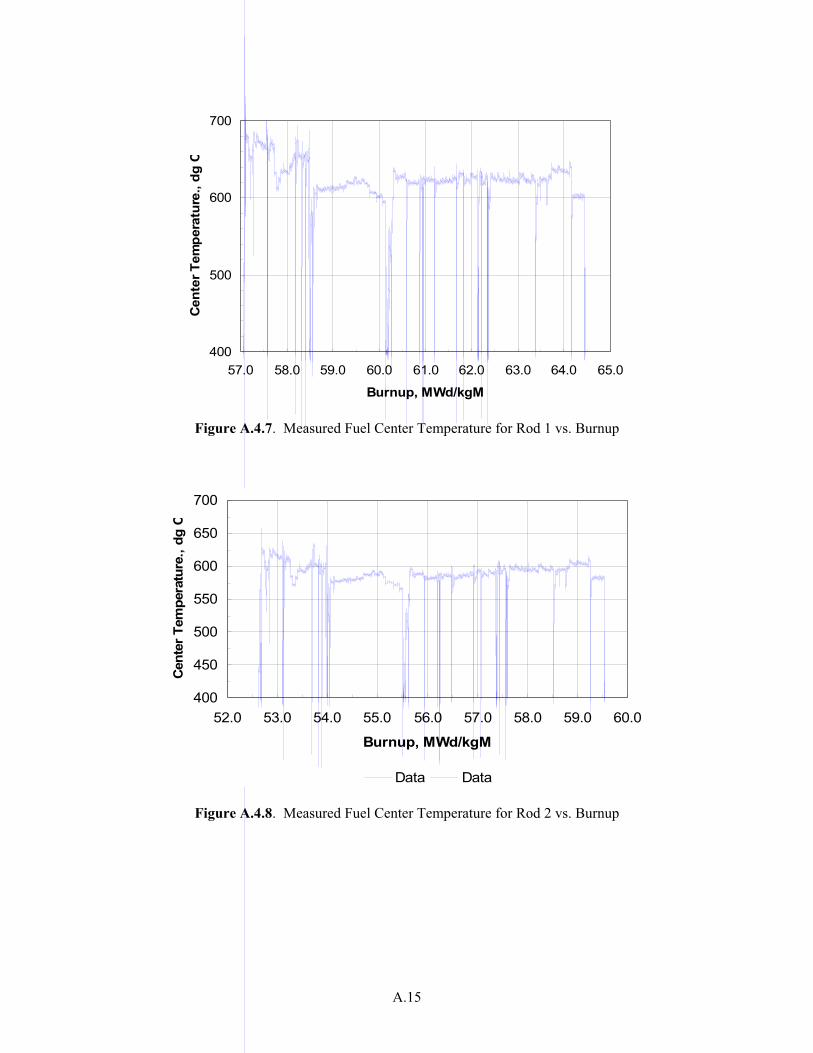
400
500
600
700
57.0 58.0 59.0 60.0 61.0 62.0 63.0 64.0 65.0
Burnup, MWd/kgM
Cen
ter
Tem
pera
ture
., d
g C
Figure A.4.7. Measured Fuel Center Temperature for Rod 1 vs. Burnup
400
450
500
550
600
650
700
52.0 53.0 54.0 55.0 56.0 57.0 58.0 59.0 60.0
Burnup, MWd/kgM
Cen
ter
Tem
pera
ture
., d
g C
Data Data
Figure A.4.8. Measured Fuel Center Temperature for Rod 2 vs. Burnup
A.15

A.5 IFA-629.3 DATA AND CALCULATIONS
The IFA-629.3 test was carried out in a standard Halden Reactor test position under the normal
Halden Reactor coolant conditions (~240°C temperature, 500 psia pressure). The test involved the same
rod segments that were irradiated in IFA-648.1 in a pressurized water loop under simulated PWR coolant
conditions (320°C temperature, 2350 psia pressure). The rod designations changed: Rod 1 in IFA-648.1
is called Rod 5 in IFA-629.3 and Rod 2 is called Rod 6. Between the two tests, Rod 6 was fitted with a
new type of thermocouple not subject to in-reactor decalibration. The LHGRs in IFA-629.3 were much
higher (up to 30 kW/m) since FGR at high burnup was being investigated. Data from the first 30 days of
the irradiation are compared to FRAPCON-3.2 calculations for fuel center temperatures from both rods,
gas pressure/FGR from Rod 6.
A.5.1 Test Rod Description and Base Irradiation
The design and operating parameters available for the mother (full-length) rod and daughter rod
segments are given in Tables A.4.1 and A.4.2, respectively. The mother rods were base-irradiated at
nominal LHGRs for ~1200 days, as shown in Figures A.4.1 and A.4.2 (Nishi and Lee, 2001). The final
burnup for the Rods N12 and P16 were 57 and 53 MWd/kgM, respectively. Following the IFA-648.1
low-power irradiation, these burnups had increased to approximately 64.5 and 59.5 MWd/kgM.
A.5.2 Test Rod Instrumentation and Test Conduct
The two rods were instrumented differently upon refabrication. Rod 5 carried a fuel center
thermocouple and a rod elongation sensor. Rod 6 carried a new type of fuel center thermocouple
(replacing the one used in IFA-648.1) and a pressure transducer. The LHGRs during the first 30 days
of the test were increased slowly in a stepwise fashion to probe for the gas release threshold
(Petitprez, 2002). The LHGRs at the thermocouple locations are shown in Figures A.5.1 and A.5.2,
respectively.
A.5.3 Code-to-Data Comparisons
The measured and predicted temperatures through the first 30 days of the IFA-629.3 irradiation are
shown for Rods 5 and 6 in Figures A.5.3 and A.5.4, respectively. Note that the measured temperatures
for Rod 5 are slightly higher than for Rod 6, reflecting the difference in LHGRs. FRAPCON-3 tracked
the measured temperatures very closely for Rod 5 (within about 10°C). For Rod 6, the temperatures are
over-predicted by 30 to 40°C.
The fact that center temperatures for Rod 2 of IFA-648.1 are underpredicted, whereas the tempera-
tures for Rod 6 of IFA 629.3 are overpredicted, is remarkable since Rod 2 and Rod 6 are just two different
designations for the same rod segment. The measured center temperatures show small differences for
Rod 1/Rod 5 but a larger difference exists for Rod 2/Rod 6, as shown in Figures A.5.5 and A.5.6, respec-
tively. To make these plots, the data from IFA-648.1 were corrected downward by the difference in
coolant temperatures (320°C versus 240°C = 80°C).
A.16

The thermocouple was replaced in Rod 2/6 between the two irradiations, and this may have
contributed to the difference in measurements. The uncertainty in quoted LHGRs at the thermocouple
position between Rod 2 and Rod 6 may also be a contributing factor.
The FGR deduced from pressure measurements on Rod 6 is given in Petitprez (2001) for the first
15 days of the test. These data are plotted in Figure A.5.7 in comparison with the FRAPCON-3.2
calculation of FGR. The agreement is fairly close regarding the onset of FGR during the power
ascensions, and the predicted FGR at the end of 15 days is fairly close to the measured value.
Rod 629-5
0
5
10
15
20
25
30
0 5 10 15 20 25 30 35
Time (days)
LH
GR
(kW
/m)
Figure A.5.1. LHGR at the Thermocouple location for Rod 5, IFA-629.3
Rod 629-6
0
5
10
15
20
25
30
0 5 10 15 20 25 30 35
Time (days)
LH
GR
(kW
/m)
Figure A.5.2. LHGR at the Thermocouple location for Rod 6, IFA-629.3
A.17

200
300
400
500
600
700
800
900
1000
0 10 20 30 4
Time, Days
Ce
nte
r T
em
pe
ratu
re, C
0
Data FRAPCON
Figure A.5.3. Measured and Predicted Fuel Center Temperatures for Rod 5
200
300
400
500
600
700
800
900
0 10 20 30 4
Time, Days
Cente
r T
em
pera
ture
,C
.
0
Data FRAPCON
Figure A.5.4. Measured and Predicted Fuel Center Temperatures for Rod 6
A.18

0
100
200
300
400
500
600
700
800
900
0 5 10 15 20 25
LHGR, kW/m
Measu
red
Tem
p,C
IFA-629.3rod5 IFA-648rod1 Corr.to 240 C
Figure A.5.5. Fuel Center Temperatures for IFA-648 Rod 1 and IFA-629.3 Rod 5
0
100
200
300
400
500
600
700
800
900
0 5 10 15 20 25
LHGR, kW/m
Measu
red
Tem
p,C
IFA-648rod2Corr.to 240 C IFA-629.3rod6
Figure A.5.6. Fuel Center Temperatures for IFA-648 Rod 2 and IFA-629.3 Rod 6
A.19

Rod 629-6
0
2
4
6
8
10
12
0 5 10 15 20 25
Time(days)
FG
R(%
)
FRAPCON DATA
Figure A.5.7. Predicted FGR for IFA-629.3 Rod 6 Compared to Measured FGR in
First 15 Days of the Test (Based on Measured Rod Internal Pressure)
A.6 Data and Calculations for the IFA-629.1 Test
Fuel temperature, rod elongation, and FGR data are available from two additional base-irradiated
PWR MOX fuel rod segments tested under Halden Reactor coolant conditions in the IFA-629.1
experiment. The base-irradiation burnups for Rods 1 and 2 were 27 and 29 MWd/kgHM, respectively,
which were extended to 33 and 40 MWd/kgM, respectively, during the Halden irradiation. The maximum
LHGRs were significant (35 to 40 kW/m).
A.6.1 Description of the Test Rods and Base Irradiation
The mother rod for the IFA-629.1 test rods was a full-length PWR MOX rod irradiated for two cycles
in the Gravelines-4 PWR. The design and operating parameters available for the mother (full-length) rod
and daughter rod segment are given in Tables A.6.1 and A.6.2, respectively (Nishi and Lee, 2001). The
mother rod was base-irradiated at (segment-specific) LHGRs ranging from 18 to 25 kW/m.
A.20

Table A.6.1. IFA 629.1 Mother Rod J09
(Ranges for pellet dimensions and density reflect ranges given for pellet lots used.)
Pellet OD: 8.192 to 8.195 mm
Pellet ID: 0.000 mm
Pellet Ht: 11.83 to 12.02 mm
Dish diameter: 4.879 to 4.907 mm
Dish depth: 0.295 to 0.306 mm
RMS Roughness: 0.002 mm estimated
Diametral gap: 167 microns nominal
As-Fabricated Density: 95.22 to 95.41%
Resinter Densification: 0.669%
Grain size: 11.8 microns
Pu Content: 5.93w/o in HM
U-235 Enrichment: 0.253 w/o
Pu isotopes: 1.187, 60.744, 24.373, 8.957, 4.74
(Pu-238, Pu-239, Pu-240, 241, 242) at. %
O/M Ratio: 1.996 estimated
Clad Material: Zr-4 (SR)
Clad OD: 9.50 mm
Clad ID: 8.36 mm
RMS Roughness: 0.001 mm estimated
Stack Length: 3657 mm estimated
Lower Plenum Volume: 0.0 mm3
Total Free Volume: 19.7 cm3 estimated
He Backfill Pressure: 2.6 Mpa
Backfill Temperature: 25°C
Table A.6.2. IFA 629.1 Test Rods (Rods 1 and 2)
Fuel Rod Diametral Gap: 0.0 mm
Thermocouple well diameter: 1.8 mm
Stack Length: (enriched): 380.7, 451.0 mm
Total Free Volume: 2.81, 3.31 cm3
Instrumentation: TF/EC, TF/PF
He Backfill Pressure: 2.6 Mpa
Backfill Temperature: 25°C
Coolant Temp: 232°C
Coolant Pressure: 160 bar
A.21

A.6.2 Test Rod Instrumentation and Test Conduct
The two rods were instrumented differently upon refabrication. Rod 1 carried a fuel center
thermocouple and a rod elongation sensor. Rod 2 carried a fuel center thermocouple and a pressure
transducer. The LHGRs during the first 30 days of the test were increased slowly to probe for the gas
release threshold (White, 1999). The LHGRs at the thermocouple locations and the rod-average LHGRs
are shown in Figures A.6.1 and A.6.2, respectively. Note that (White, 1999) covers only the first
120 days of operation, whereas LHGR and temperature data plots presented here cover the full 180 days
of operation.
0
5
10
15
20
25
30
35
40
0 20 40 60 80 100 120
Time, Days
LH
GR
, kW
/m
LHGRTF1 LHGRTF2
Figure A.6.1. LHGR at the Thermocouple Location for IFA-629.1 Rods and 2
A.22

0
5
10
15
20
25
30
35
40
45
0 20 40 60 80 100 120 140 160 180 200
Time, Days
LH
GR
, kW
/m
ALHR1 ALHR2
Figure A.6.2. Rod-Average LHGRs for IFa-629.1 Rods and 2
A.6.3 Code-to-Data Comparisons
The measured and predicted temperatures through the first 120 days of the IFA-629.1 irradiation
(spanning the published data set) are shown for Rods 5 and 6 in Figures A.6.3 and 6.4, respectively. Note
that the measured temperatures for Rod 1 are slightly higher than for Rod 2, reflecting the difference in
LHGRs. FRAPCON-3 underpredicts the measured temperatures by 30 to 60°C in the first half of the
irradiation but is much closer thereafter. The code predictions appear closer to data for Rod 2 than for
Rod 1, but this is mainly a consequence of the lower LHGRs for Rod 2.
The FGR was deduced for Rod 2 by rod puncture and gas analysis (Oberlander et al., 2000), as
21.7%. The predicted value for Rod 2 (at the end of 180-day test) was 13.5%. The calculated FGR is
calculated in comparison to the measured rod pressure in Figure A.6.5. It is apparent that the onset of
FGR is well predicted, even though the total FGR is somewhat underpredicted in this case.
A.23

0
200
400
600
800
1000
1200
1400
0 20 40 60 80 100 120
Time, Days
Tem
pera
ture
, d
g.C
Rod 1 Data FRAPCON-3.2
Figure A.6.3. Fuel Temperature Data and Predictions for IFA-629.1, Rod 1
0
200
400
600
800
1000
1200
1400
0 20 40 60 80 100
Time, Days
Te
mp
era
ture
, d
g.
C
120
TF2 Data FRAPCON-3.2
Figure A.6.4. Fuel Temperature Data and Predictions for IFA-629.1, Rod 2
A.24

0
10
20
30
40
50
60
70
80
90
100
0 20 40 60 80 100 120 140 160 180 200
Time, Days
Pre
ssure
, bar
0
5
10
15
20
25
FG
R,%
Pressure Data (Rod2) FRAPCON-3 Pressure FRAPCON-3 FGR
Figure A.6.5. Calculated FGR and Measured/Calculated Rod Pressure vs. time-in-test for
IFA-629.1, Rod 2
A.7 Data and Calculations for the IFA-633 Test
Fuel temperature, rod elongation, pellet stack elongation, and FGR data are becoming available from
six instrumented rods (three MOX rods and three urania rods) irradiated from BOL under Halden Reactor
coolant conditions in the IFA-633 gas flow experiment. Data are available through a burnup of
25 MWd/kg oxide and include a power ramp to achieve fission gas bubble interlinkage (Wright, 2004).
The code-data comparisons presented here are from BOL and used to confirm the difference between
MOX and urania fuel thermal conductivity.
A.7.1 Description of the Test Rods
The test rods were short but had normal PWR 17 x 17 fuel rod radial dimensions (9.5 mm outer
diameter). The rods were heavily instrumented and connected to a gas flow system, which permitted
changes between various gas species and measurement of gas release for both short-lived and long-lived
isotopes.
The short binderless route (SBR) MOX fuel pellets had a small grain size (7.5 microns) in contrast to
the more normal urania pellet grain size (10 microns). Otherwise, the fuel pellets were high-density
stable pellets dished on both ends, which is typical of commercial fuel.
A.7.2 Test Rod Instrumentation and Test Conduct
All six rods had fuel centerline thermocouples in the top and bottom of the fuel stack and were
connected to rod elongation sensors and to gas flow lines. One urania rod and one MOX rod were fitted
with pressure transducers. The remaining two rods of each type had stack elongation sensors. The rod
design parameters are further describes in Table A.7.1.
A.25

Table A.7.1. IFA 633 Rod Dimensions and Fabrication Parameters
Pellet OD: 8.15 mm
Pellet ID: 0.000 mm
(1.8 mm at top/bottom of stack)
Pellet Ht: 12.39 Urania, 12.41 MOX mm
Dish diameter: 6.4 mm
Dish depth: 0.2 mm
Land width: 0.65 mm
RMS Roughness: 0.002 mm estimated
Diametral gap: 210 microns nominal
As-Fabricated Density: 95.4% TD urania 95.4% TD MOX
Resinter Densification: not given
Grain size: 9.95 microns urania,
7.42 microns MOX
Pu Content: 6.04 wt.% Pu-fissile in depleted U
Enrichment: 7.98 wt.% U-235 in urania rods
Pu isotopes (estimated) 1.187, 60.744, 24.373, 8.957, 4.74
(Pu-238, Pu-239, Pu-240, 241, 242)
MOX Fuel Type: SBR
O/M Ratio: 1.996 estimated for MOX
2.00 est. for urania
Clad Material: Zr-4 (SR)
Clad OD: 9.50 mm
Clad ID: 8.36 mm
RMS Roughness: 0.001 mm estimated
Stack Length: 450 mm urania, 447 mm MOX
Lower Plenum Volume: 0.0 mm3
Total Free Volume: 6.0 cm3 with pressure transducer
5.1 cm3 for remaining rods.
He Backfill Pressure: 2 bar nominal
Backfill Temperature: 25°C
A.7.3 Code-to-Data Comparisons for Fuel Center Temperature at Beginning of Test
The predicted and measured centerline temperatures as a function of LHGR in the startup ramps for
urania and SBR MOX rods are shown in Figures A.7.1 and A.7.2, respectively. The agreement is very
close. If the calculated fuel surface temperatures are subtracted from both the measured and calculated
centerline temperature values, the resulting estimated temperature rises across the fuel can be used to
estimate the relative value of the MOX and urania thermal conductivities. The result is shown in
Figure A.7.3. The ratio of MOX conductivity to that of MOX is about 0.92 to 0.94.
Data were also recorded for the effect of exchanging argon gas for helium fill gas. Because the
thermal conductivity of argon is much lower than that of helium, the fuel temperatures rise dramatically
when argon is exchanged for helium gas. The code-to-data comparison for this effect for a urania rod is
shown in Figure A.7.4. The excellent prediction of this dramatic effect indicates the predicted BOL
effective gap sizes are very close to true values.
A.26

200
300
400
500
600
700
800
900
1000
0 5 10 15 20 25
LHGR, kW/m
Cen
er
Tem
p., d
g. C
Predicted Top TC Bottom TC
Figure A.7.1. Measured and Predicted BOL Fuel Center Temperatures for IFA-633 Urania
Rod with Helium Fill Gas
0
200
400
600
800
1000
1200
0 5 10 15 20 25 30
LHGR kW/m
Fu
el D
elt
a-T
. d
g.C
Predicted Top TC Bottom TC
Figure A.7.2. Measured and Predicted BOL Fuel Center Temperature for IFA-633 MOX
Rod with Helium Fill Gas
A.27

1.00
1.02
1.04
1.06
1.08
1.10
0 5 10 15 20 25 30
LHGR kW/m
Rati
o M
OX
/UO
2 F
uel
De
lta
-T
Calculated Data Trends
Figure A.7.3. Ratio of Predicted and Measured MOX Fuel Delta-T (Temperature Rise
from Pellet Surface to Center) to Urania Fuel Delta-T for IFA-633
200
400
600
800
1000
1200
1400
1600
0 5 10 15 20 25
LHGR, kW/m
Cen
er
Tem
pera
ture
, d
g. C
.
Helium Prediction Helium Top TC Helium Bottom TC
Argon Prediction Argon Top TC Argon Bottom TC
Figure A.7.4. Predicted and Measured Fuel Centerline Temperatures with Argon and
Helium Fill Gases for a Urania Rod, IFA-633 Test
A.28
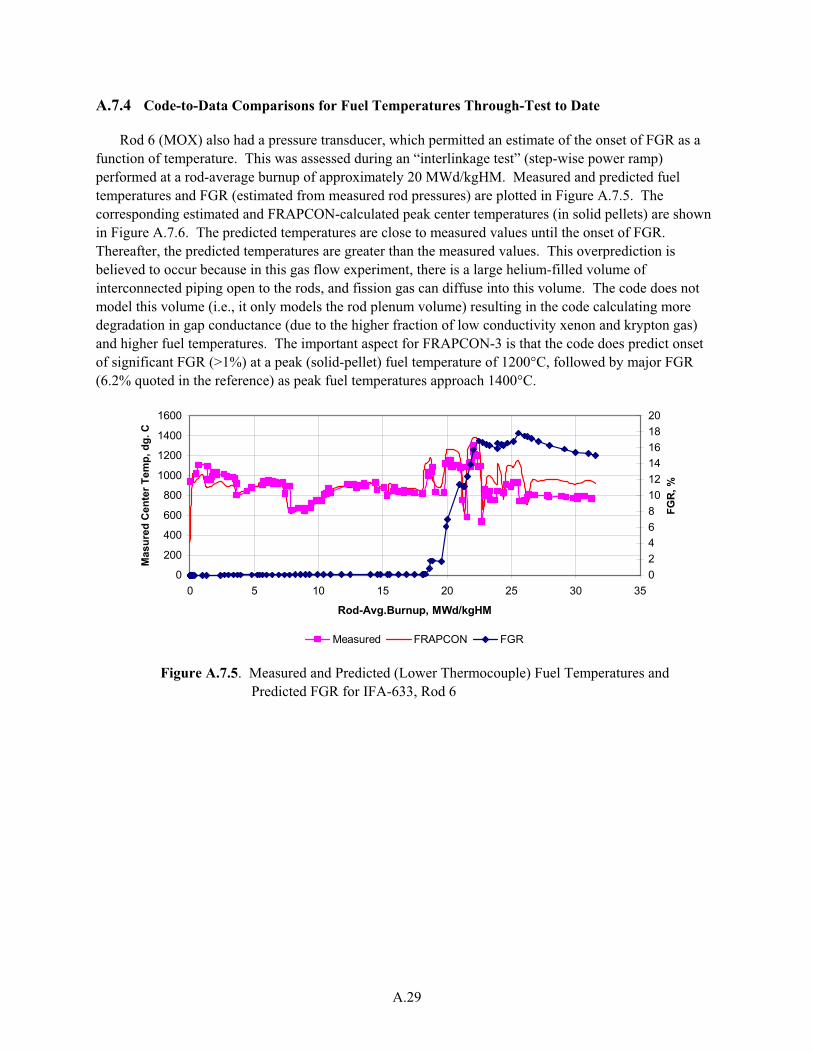
A.7.4 Code-to-Data Comparisons for Fuel Temperatures Through-Test to Date
Rod 6 (MOX) also had a pressure transducer, which permitted an estimate of the onset of FGR as a
function of temperature. This was assessed during an “interlinkage test” (step-wise power ramp)
performed at a rod-average burnup of approximately 20 MWd/kgHM. Measured and predicted fuel
temperatures and FGR (estimated from measured rod pressures) are plotted in Figure A.7.5. The
corresponding estimated and FRAPCON-calculated peak center temperatures (in solid pellets) are shown
in Figure A.7.6. The predicted temperatures are close to measured values until the onset of FGR.
Thereafter, the predicted temperatures are greater than the measured values. This overprediction is
believed to occur because in this gas flow experiment, there is a large helium-filled volume of
interconnected piping open to the rods, and fission gas can diffuse into this volume. The code does not
model this volume (i.e., it only models the rod plenum volume) resulting in the code calculating more
degradation in gap conductance (due to the higher fraction of low conductivity xenon and krypton gas)
and higher fuel temperatures. The important aspect for FRAPCON-3 is that the code does predict onset
of significant FGR (>1%) at a peak (solid-pellet) fuel temperature of 1200°C, followed by major FGR
(6.2% quoted in the reference) as peak fuel temperatures approach 1400°C.
0
200
400
600
800
1000
1200
1400
1600
0 5 10 15 20 25 30 35
Rod-Avg.Burnup, MWd/kgHM
Masu
red
Cen
ter
Tem
p, d
g. C
0
2
4
6
8
10
12
14
16
18
20
FG
R,
%
Measured FRAPCON FGR
Figure A.7.5. Measured and Predicted (Lower Thermocouple) Fuel Temperatures and
Predicted FGR for IFA-633, Rod 6
A.29

0
200
400
600
800
1000
1200
1400
1600
1800
0 5 10 15 20 25 30 35
Rod-Avg.Burnup, MWd/kgHM
Pe
ak
Ce
nte
r T
em
p, d
g. C
0
2
4
6
8
10
12
14
16
18
Ro
d-A
ve
rag
e L
HG
R,k
W/m
Halden Estimate FRAPCON LHGR
Figure A.7.6. Estimated and Predicted Fuel Peak (Solid Pellet) Center Temperatures for IFA-
633, Rod 6
A.8 References
Beguin, S. The Lift-Off Experiment with MOX Fuel Rod in IFA-610.2; Initial Results, HWR-603, Halden
Reactor Project, Halden, Norway. 1999.
Claudel, J., and F. Huet. Results from the Burnup Accumulation Test with High Exposure (63 GWd/kg
HM) MOX Fuel (IFA-648), HWR-651, Halden Reactor Project, Halden, Norway. 2001.
Fujii, H., and J. Claudel. The Lift-Off Experiments IFA 610.3 (UO2) and IFA610.4 (MOX): Evaluation of
In-Pile Measurement Data, HWR-650, Halden Reactor Project, Halden, Norway. 2001.
Mertens L., M. Lippens, and J Alvis. The FIGARO Programme: The Behaviour of Irradiated MOX Fuel
Tested in the IFA-606 Experiment, Description of Results and Comparison with COMETHE Calculation,
HPR 349/30 Halden Reactor Project, Halden, Norway. 1998.
Mertens, L., and M. Lippens. Study of Fission Gas Release on High Burnup MOX Fuel, ENS TOPFUEL
Meeting, May 2001. Stockholm, Sweden. 2001.
Nishi, M., and B.H. Lee. Summary of Pre-Irradiation Data on Fuel Segments Supplied by
EdF/FRAMATOME and Tested in FA-610, 629 and 648, HWR-664 Halden Reactor Project, Halden,
Norway. 2001.
Oberlander, B.C., S. Thoshaug, and M. Espland, DT PIE of Pre-irradiated and Re-Instrumented MOX
Rod after Power Ramp Testing in IFA-629, IFE/KR/F-2000/149 (Limited Distribution), Institute for
Energiteknik, Kjeller Laboratory, Norway. 2000.
Petitprez, B. Ramp Tests with Two high Burnup MOX Fuel Rods in IFA-629.3, HWR-714 Halden
Reactor Project, Halden, Norway. 2002.
A.30

White, R.J. The Re-Irradiation of MIMAS MOX Fuel in IFA-629.1, HWR-586 Halden Reactor Project,
Halden, Norway. 1999.
Wright, J. The SBR MOX and UO2 Comparison Test in Gas Flow Rig IFA-633: Results after Seven
Cycles of Irradiation, HWR-764 Halden Reactor Project, Halden, Norway. 2004.
A.31


Appendix B
Summary of Code Changes Since FRAPCON Version 1.0


Appendix B
Summary of Code Changes Since FRAPCON Version 1.0
B.1 Changes Made for FRAPCON-3 v1.1
Axial array of fast fluence was added to the output
The input variable 'jdlpr' was set equal to 0 (output all axial nodes) when ntape > 0 (create a
FRAPTRAN initialization file)
The hydrogen concentration in the final summary page of the output was corrected to be the peak
node hydrogen concentration
The variable cladding permanent displacement was added to the FRAPTRAN start tape.
B.2 Changes Made for FRAPCON-3 v1.2
The excess hydrogen concentration was added to the FRAPTRAN initialization file
Corrected typographical error in function call statement
Moved continuation markers from column 1 to column 6 in many places to make the code more
compatible with different compilers.
B.3 Changes Made for FRAPCON-3 v1.3
The volume of the central annulus, if present, was included in the calculation of the rod void volume
for the gas pressure calculation
External changes were made to allow the building of the PC version of FRAPCON.
B.4 Changes Made for FRAPCON-3 v1.3a
A typographical error in the constant, 'a2', in the Massih fission gas release model was corrected. The
new value of a2 is as specified in equation 40 by Forsberg and Massih (1985). The earlier value was
in error.
B.5 Changes Made for FRAPCON-3.2
Many changes were made for the release of FRAPCON-3.2. In this section, the changes are divided
into five categories: model changes, input changes, output changes, errors fixed, and changes to clean up
FORTRAN.
B.1

B.5.1 Model Changes
A new thermal conductivity model is now used in FRAPCON. This model is described in Section 2.0
of this report.
Mixed oxide modeling capability was added. The changes made to model mixed oxide are described
in Section 3.0 of this report.
The pre- and post-transition values of hydrogen pickup fraction were made the same for boiling-water
reactor and pressurized water reactor applications.
The alternate fission gas release model, ANS54, was modified to calculate gas release based on the
current time step radial power and burnup profile. Previously, it had used the beginning of life power
and burnup profiles throughout life. (Note: no adjustments were made to the ANS54 gas release
model parameters to account for the new thermal conductivity model. In addition, Pacific Northwest
National Laboratory (PNNL) has not assessed the impact on that change on ANS54 predictions
relative to data).
Tuning parameters in the Massih fission gas release model were changed to better fit data. This
change is due to changes in the new thermal conductivity model. This change is described in Section
4.0 of this report.
Calculation of fraction gas release in the Massih fission gas release model was made a function of
radial burnup profile rather than radial power profile. This change is described in Section 4.0 of this
report.
A four-term approximation, rather than the original three-term approximation, is now used as the
integration kernel in the Massih fission gas release model as given by Hermansson and Massih
(2002). This change is described in Section 4.0 of this report.
B.5.2 Input Changes
Input variable 'time' was changed to 'ProblemTime' to avoid issues with some compilers for which
‘time’ is a reserved variable.
The default value of ‘ngasr’ was changed to 45. This is the value PNNL recommends for the number
of radial fuel nodes used in the gas release calculation.
The input variable 'afsw' was removed. This variable was not described in the input instructions.
The input variable 'ivoid' was removed. This variable was not described in the input instructions.
The input variable 'linkt' was removed. This variable was not described in the input instructions.
The input variable 'rhoh2o' was removed. This variable was not described in the input instructions.
The input variable 'cldwkd' was removed. This variable was not described in the input instructions.
B.2

The input variable 'grnsiz' was removed. This variable was not described in the input instructions.
The input variable 'im93wc' and associated function emftc.f was removed. This function was not
being used in the code.
B.5.3 Output Changes
Write statements were changed to reflect the presence of a dish or a central hole.
A misspelling in the plotter was corrected.
The plotter was corrected to plot the bulk coolant temperature rather than the inlet temperature for
each node.
Error warnings were made to print to the output file, not a separate file.
The output of 'fuel thermal conductivity degradation factor' is removed if FRACAS-1 is used. If
FRACAS-2 is used, this value is output as 'cracked fuel thermal conductivity degradation factor.'
Negative values calculated for uniform strain are changed to 0.0 and the user is warned.
The problem with output value of relocation in microns not being the same as the output value of
relocation in mils was corrected.
A statement was added that the clad-coolant film coefficient includes the effect of the crud layer.
The text in page headers was changed to reflect the current version of FRAPCON-3.
Interface pressure output in peak node summary had been calculated before creep occurred. It was
changed to be calculated after creep was calculated.
In the plotter, one set of data is labeled “Fuel Surface Hoop Strain” but the values are for fuel surface
axial strain. The label was changed to “Fuel Surface Axial Strain.”
A rod average burnup selection was added under the 'data' tab in the plotter.
The output of the 0th time step in the plotting routine was removed.
A mechanical gap selection was added to '1D data' tab in the plotter.
A Fission Gas Release was added to the list of variables that can be plotted in the ‘Data’ tab of the
plotter.
The variable, Yield Stress, was removed from the plotter. This variable is always 0.0.
A relocation to initialization file for FRAPTRAN was added.
B.3

B.5.4 Errors Fixed
Correctly calculate the initial cold void volume in rods with a central hole.
Correctly calculate the fuel volume for dished pellets with a central hole.
Correctly calculate the thermal expansion for annular pellets.
Correct error in subroutine cmlimit under the calculation of uniform strain.
Use the correct conversion factor in fudens.f to convert from MWs/kgU to MWd/kgU.
Use the variable 'gadolin' correctly in calculating fuel enthalpy.
The input variable, 'enrich', is in atom%. Use this variable in the appropriate manner in calculating
the radial power profile.
Use consistent value of 10.96 g/cc for the theoretical density of urania (UO2) throughout the code.
B.5.5 Changes to clean up FORTRAN
The dynamic dimensioning was completely removed, and the a-array was replaced by variables that
make it easier to follow what the code is doing.
The input variable, 'iplant' is used as the universal signal for plant type.
The following subroutines that are never called were removed: fluxd.f, fluxdp.f, radar.f, and voidp.f.
In turbin.f, only one call per ring to turbnp.f is needed to initialize atom concentrations.
The variables drdt, dkdt, and cdkdt were removed. These variable store the uncertainty from models
that are not being used in FRAPCON-3.
'icm' was made the universal index for cladding type (icm=2 - Zircaloy-2, icm=4 - Zircaloy-4), and
the variables ‘iaaha’ and ‘iah’were removed.
Default values were explicitly given to all variables that are not required input.
B.6 Changes made for FRAPCON-3.3
Many changes were made for the release of FRAPCON-3.2. In this section the changes are divided
into five categories: model changes, input changes, output changes, errors fixed, and changes to clean up
FORTRAN.
B.6.1 Model Changes
The capability to run a case with no gas release up to a certain time step was added in order to
model re-fabricated rods.
B.4

The hydrogen solubility model was changed to the Kearns’ hydrogen solubility to be more consistent
with FRAPTRAN and available data.
Oxidation and hydrogen pickup properties were added for ZIRLO™ and M5TM. These changes are
described in Sections 5.1 and 5.2 of this report, respectively.
The cladding stress calculation was modified to account for the clad thinning that occurs as the
cladding oxidizes. This change is described in Section 5.5 of this report.
The code was changed to allow the user to set the cladding surface temperature axial profile for each
time step. This option was added to allow the calculation of fuel rod behavior under spent fuel
storage conditions. This change is described in Section 6.2 of this report.
The burnup dependence for fuel melting temperature was changed from a reduction of
3.2 K/GWd/tHM to 0.5 K/GWd/tHM. This change is described in Section 3.7 of this report.
B.6.2 Input Changes
The default value of fuel sintering temperature was changed to be the same value in regardless of
whether SI or British input units are selected.
If the same value is input for consecutive values of ‘ProblemTime,’ the code will stop and inform the
user to fix the input.
New warning statements have been added so the code stops and informs the user what line of input
has a problem rather than crashing.
The input of the axial power profiles was changed so they do not need to be normalized to an average
value of 1.0. The code will automatically normalize the input axial power profile to a value of 1.0.
This normalization procedure will not be applied to cases where the chopped cosine distribution is
used.
The check that ensured the maximum value of ‘qf’ was not less than 1.0, and the warning if the
maximum value of ‘qf’ was 1.0, were removed now that the code automatically normalizes the input
power profiles.
The fuel grain size was re-added as an input value. The default grain size (effective diameter) is
10 microns.
The ICM variable has the value 5 for M5TM cladding and 6 for ZIRLOTM.
B.6.3 Output Changes
When the input file is in SI units, the output of pitch was in meters and labeled in cm. The output was
changed to cm to match the label.
Changes were made to the page header to better track the current version.
B.5
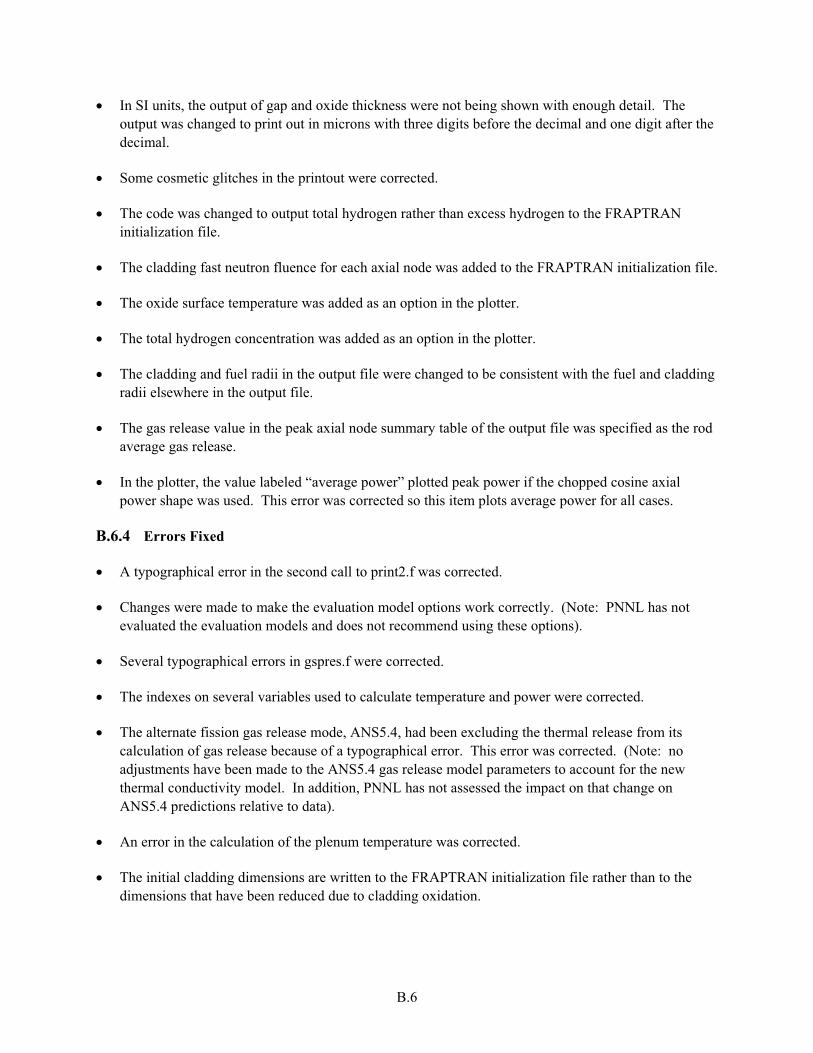
In SI units, the output of gap and oxide thickness were not being shown with enough detail. The
output was changed to print out in microns with three digits before the decimal and one digit after the
decimal.
Some cosmetic glitches in the printout were corrected.
The code was changed to output total hydrogen rather than excess hydrogen to the FRAPTRAN
initialization file.
The cladding fast neutron fluence for each axial node was added to the FRAPTRAN initialization file.
The oxide surface temperature was added as an option in the plotter.
The total hydrogen concentration was added as an option in the plotter.
The cladding and fuel radii in the output file were changed to be consistent with the fuel and cladding
radii elsewhere in the output file.
The gas release value in the peak axial node summary table of the output file was specified as the rod
average gas release.
In the plotter, the value labeled “average power” plotted peak power if the chopped cosine axial
power shape was used. This error was corrected so this item plots average power for all cases.
B.6.4 Errors Fixed
A typographical error in the second call to print2.f was corrected.
Changes were made to make the evaluation model options work correctly. (Note: PNNL has not
evaluated the evaluation models and does not recommend using these options).
Several typographical errors in gspres.f were corrected.
The indexes on several variables used to calculate temperature and power were corrected.
The alternate fission gas release mode, ANS5.4, had been excluding the thermal release from its
calculation of gas release because of a typographical error. This error was corrected. (Note: no
adjustments have been made to the ANS5.4 gas release model parameters to account for the new
thermal conductivity model. In addition, PNNL has not assessed the impact on that change on
ANS5.4 predictions relative to data).
An error in the calculation of the plenum temperature was corrected.
The initial cladding dimensions are written to the FRAPTRAN initialization file rather than to the
dimensions that have been reduced due to cladding oxidation.
B.6

An error was corrected where the calculation of cladding creep used the value of flux from the top
axial node for every axial node. The code now uses the value of flux that corresponds with each axial
node.
B.6.5 Changes to Clean Up FORTRAN
The dimension statements in tapegn.f were changed to be consistent with the other dimension
statements.
The arrays ‘porosnew,’ ‘densp, ‘densf,’ ‘dpw,’ and ‘dpwpp’ were explicitly initialized.
The code was changed to be compliant with the standards of FORTRAN 90. This will ensure that the
code can be compiled on any compiler that complies with FORTRAN 90. This change is described in
Section 6.3 of this report.
B.7 References
Forsberg, K. and A.R. Massih, “Fission Theory of Fission Gas Migration in Irradiated Nuclear Fuel
UO2,” Journal of Nuclear Materials, vol. 135, pp. 140-148. 1985.
Hermansson, P., and A.R. Massih, “An Effective Method for Calculation of Diffusive Flow in Spherical
Grains,” Journal of Nuclear Materials, vol. 304, pp. 204-211. 2002.
B.7


Appendix C
Input Instructions for FRAPCON-3.3


Contents
C.1 Input Structure ..............................................................................................................................C.1
C.2 Input Variables Specifying Rod Design .......................................................................................C.2
C.2.1 Rod Size...........................................................................................................................C.2
C.2.2 Spring Dimensions...........................................................................................................C.2
C.3 Input Variables Specifying Pellet Fabrication ..............................................................................C.3
C.3.1 Pellet Shape......................................................................................................................C.3
C.3.2 Pellet Isotopics.................................................................................................................C.3
C.3.3 Pellet Fabrication .............................................................................................................C.4
C.4 Input Variables Specifying Cladding Fabrication.........................................................................C.5
C.5 Input Variables Specifying Rod Fill Conditions...........................................................................C.6
C.6 Input Variables Specifying Reactor Conditions............................................................................C.7
C.7 Input Variables Specifying Power History ...................................................................................C.9
C.8 Input Variables Specifying Axial Power Profile.........................................................................C.10
C.9 Input Variables Specifying Axial Temperature Distribution (Optional) ....................................C.12
C.10 Input Variables Specifying Code Operation ...............................................................................C.14
C.10.1 Model Selection Variables not Recommended by PNNL .............................................C.15
C.11 Input Variables Specifying Code Output ....................................................................................C.17
C.12 Example Case with MOX Fuel ...................................................................................................C.19
C.13 Input Variables Arranged Alphabetically and by Input Block....................................................C.21
$frpcn input block.......................................................................................................................C.21
$frpmox input block....................................................................................................................C.21
$emfpcn input block ...................................................................................................................C.21
$frpcon input block.....................................................................................................................C.22
C.iii


Appendix C
Input Instructions for FRAPCON-3.3
C.1 Input Structure
The NAMELIST input is divided into four sections: Case control integers (in $FRPCN), case design
and operation descriptors (real and integer variables) located in ($FRPCON), evaluation model options (in
$EMFPCN), and plutonium isotopic distributions (in $FRPMOX). The variables in the first group must
be separated by commas and placed between the statement $FRPCN and $END. Similarly, the variables
in the second, third, and fourth groups must be placed between $FRPCON and $END, between
$EMFPCN and $END, and between $FRPMOX and $END, respectively.
Before the NAMELIST input, the following lines must be included in the input file
FILE05='nullfile', STATUS='UNKNOWN', FORM='FORMATTED',
CARRIAGE CONTROL='NONE'
This line sets up a file called “nullfile,” which is needed by FRAPCON-3.3.
FILE06=’file.out', STATUS='UNKNOWN', CARRIAGE CONTROL='LIST.'
This line specifies the name of the output file. In this case, the output file would be called “file.out.”
FILE66='file.plot', STATUS='UNKNOWN', FORM='FORMATTED',
CARRIAGE CONTROL='LIST.'
This line is needed if a plot output file is being created. (See definition of variable NPLOT in the table
below.) In this case, the plot file would be called “file.plot.”
The above three lines should not exceed 72 spaces, and if they do, continue on the next line with no
continuation symbols needed.
The line below, which is proceeded by the character “/,” tells the code that the lines specifying files are
complete.
/************************************************************************************
The line immediately after this line is reserved for the case description that will be displayed in the page
headers in the output. Up to 72 characters can be inserted here to describe the case.
C.1
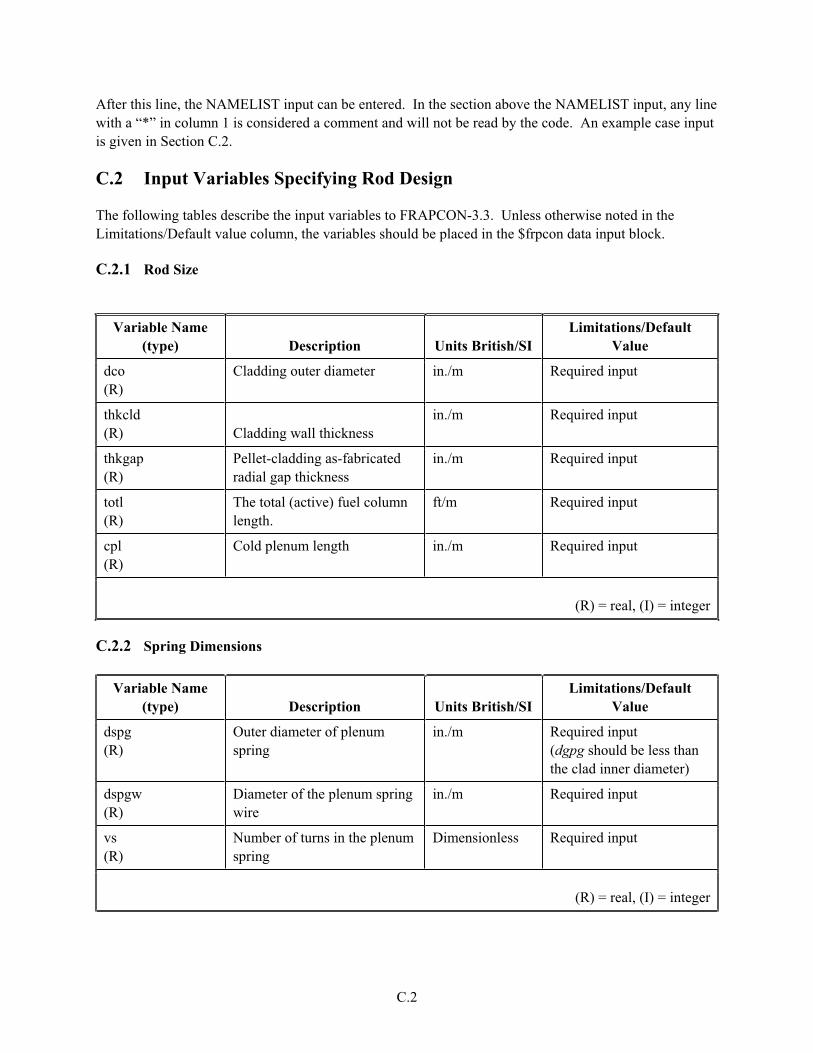
After this line, the NAMELIST input can be entered. In the section above the NAMELIST input, any line
with a “*” in column 1 is considered a comment and will not be read by the code. An example case input
is given in Section C.2.
C.2 Input Variables Specifying Rod Design
The following tables describe the input variables to FRAPCON-3.3. Unless otherwise noted in the
Limitations/Default value column, the variables should be placed in the $frpcon data input block.
C.2.1 Rod Size
Variable Name
(type) Description Units British/SI
Limitations/Default
Value
dco
(R)
Cladding outer diameter in./m Required input
thkcld
(R) Cladding wall thickness
in./m Required input
thkgap
(R)
Pellet-cladding as-fabricated
radial gap thickness
in./m Required input
totl
(R)
The total (active) fuel column
length.
ft/m Required input
cpl
(R)
Cold plenum length in./m Required input
(R) = real, (I) = integer
C.2.2 Spring Dimensions
Variable Name
(type) Description Units British/SI
Limitations/Default
Value
dspg
(R)
Outer diameter of plenum
spring
in./m Required input
(dgpg should be less than
the clad inner diameter)
dspgw
(R)
Diameter of the plenum spring
wire
in./m Required input
vs
(R)
Number of turns in the plenum
spring
Dimensionless Required input
(R) = real, (I) = integer
C.2

C.3 Input Variables Specifying Pellet Fabrication
C.3.1 Pellet Shape
Variable Name
(type) Description Units British/SI
Limitations/Default
Value
hplt
(R) Height (length) of each pellet in./m Required input
rc
(R) Radius of inner pellet in./m Default = 0.0
hdish
(R)
Height (depth) of pellet dish,
assumed to be a spherical
indentation. in./m Default = 0.0
dishsd
(R)
Width of pellet end-dish
shoulder (outer radius of fuel
pellet minus radius of dish) in./m Default = 0.0
(R) = real, (I) = integer
C.3.2 Pellet Isotopics
Variable Name
(type) Description
Units
British/SI
Limitations/Default
Value
enrch
(R)
Fuel pellet U-235 enrichment Atom % U-235
in total U
Required input
imox
(I)
Index for modeling MOX:
0 = urania (UO2) fuel
>0 = mixed oxide fuel
1 = use Duriez/Ronchi/NFI l
thermal conductivity
correlation
2 = use Halden thermal
conductivity correlation
(if imox>0, must include comp
and namelist $FRPMOX)
Dimensionless Default = 0
comp
(R)
Weight percent of plutonia
(PuO2) in fuel
(Must specify if imox>0)
wt.% Default = 0.0
enrpu39
(R)
Fuel pellet Pu-239 content Atom % Pu-239
in total Pu
Default = 0.0
(namelist frpmox)
enrpu40
(R)
Fuel pellet Pu-240 content Atom % Pu-240
in total Pu
Default = 0.0
(namelist frpmox)
enrpu41
(R)
Fuel pellet Pu-241 content Atom % Pu-241
in total Pu
Default = 0.0
(namelist frpmox)
C.3
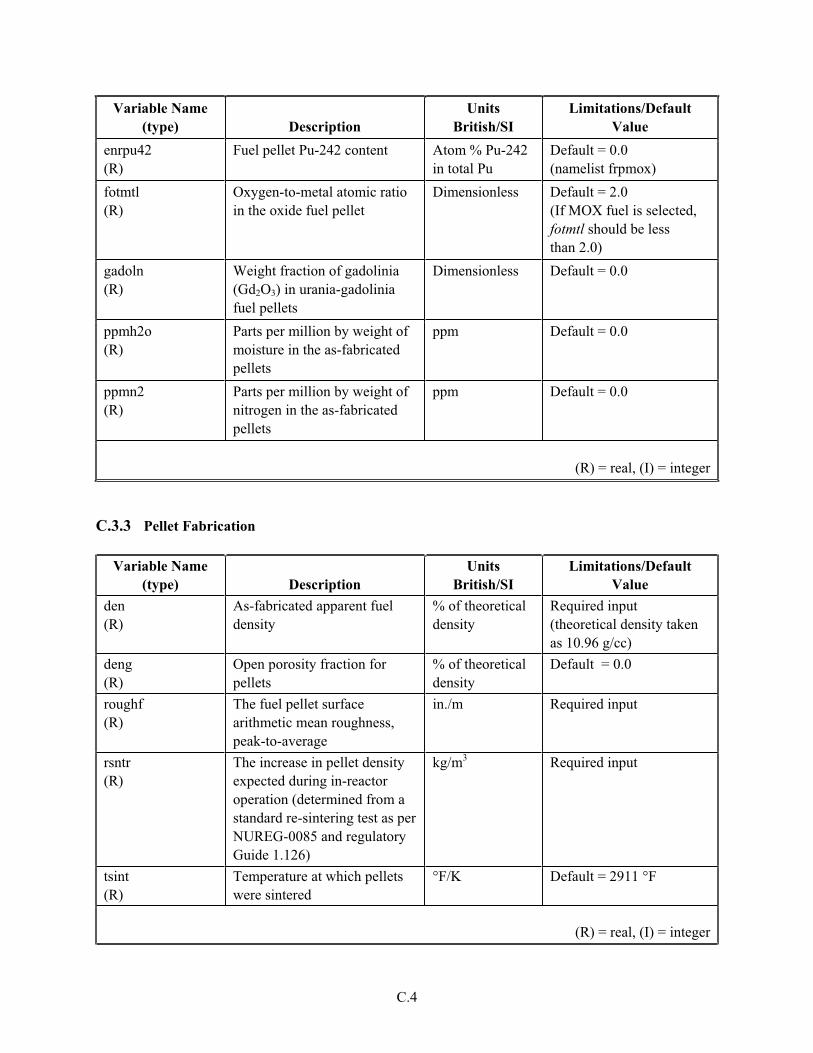
Variable Name
(type) Description
Units
British/SI
Limitations/Default
Value
enrpu42
(R)
Fuel pellet Pu-242 content Atom % Pu-242
in total Pu
Default = 0.0
(namelist frpmox)
fotmtl
(R)
Oxygen-to-metal atomic ratio
in the oxide fuel pellet
Dimensionless Default = 2.0
(If MOX fuel is selected,
fotmtl should be less
than 2.0)
gadoln
(R)
Weight fraction of gadolinia
(Gd2O3) in urania-gadolinia
fuel pellets
Dimensionless Default = 0.0
ppmh2o
(R)
Parts per million by weight of
moisture in the as-fabricated
pellets
ppm Default = 0.0
ppmn2
(R)
Parts per million by weight of
nitrogen in the as-fabricated
pellets
ppm Default = 0.0
(R) = real, (I) = integer
C.3.3 Pellet Fabrication
Variable Name
(type) Description
Units
British/SI
Limitations/Default
Value
den
(R)
As-fabricated apparent fuel
density
% of theoretical
density
Required input
(theoretical density taken
as 10.96 g/cc)
deng
(R)
Open porosity fraction for
pellets
% of theoretical
density
Default = 0.0
roughf
(R)
The fuel pellet surface
arithmetic mean roughness,
peak-to-average
in./m Required input
rsntr
(R)
The increase in pellet density
expected during in-reactor
operation (determined from a
standard re-sintering test as per
NUREG-0085 and regulatory
Guide 1.126)
kg/m3 Required input
tsint
(R)
Temperature at which pellets
were sintered
°F/K Default = 2911 °F
(R) = real, (I) = integer
C.4

C.4 Input Variables Specifying Cladding Fabrication
Variable Name
(type) Description
Units
British/SI
Limitations/Default
Value
icm
(I)
Cladding type indicator:
2 = Zircaloy 2
4 = Zircaloy 4
5 = M5TM
6 = ZIRLOTM
Dimensionless Required input
cldwks
(R)
Cold-work of the cladding
(fractional reduction in cross-
section area due to
processing). PNNL
recommends 0.5 for stress
relief annealed cladding and
0.0 for fully recrystallized
cladding.
Dimensionless Default = 0.2
roughc
(R)
The cladding surface
arithmetic mean roughness,
peak-to-average
in./m Required input
catexf
(R)
Cladding texture factor;
defined as the fraction of
cladding cells with basal poles
parallel to the longitudinal axis
of the cladding tube
Dimensionless Default = 0.05
chorg
(R)
As-fabricated hydrogen in
cladding
ppm wt. Default = 10.0
(R) = real, (I) = integer
C.5

C.5 Input Variables Specifying Rod Fill Conditions
Variable Name
(type) Description
Units
British/SI
Limitations/Default
Value
Fgpav
(R)
Initial fill gas pressure (taken
to be at room temperature)
psia/Pa Required input
Idxgas
(I)
Initial fill gas type indictator:
1 = helium
2 = air
3 = nitrogen
4 = fission gas
5 = argon
6 = user-specified mix, using
the amfxx variables amfair etc.
Dimensionless Default = 1
amfair
(R)
Mole fraction of air; use only
if idxgas = 6.
Mole fraction Default = 0.0
amfarg
(R)
Mole fraction of argon; use
only if idxgas = 6
Mole fraction Default = 0.0
amffg
(R)
Mole fraction of fission gas;
use only if idxgas = 6 and if
amfxe and amfkry = 0.0
Mole fraction Default = 0.0
amfhe
(R)
Mole fraction of helium; use
only idxgas = 6.
Mole fraction Default = 0.0 (note default
on idxgas = 1 initializes
pure He)
amfh2o
(R)
Mole fraction of water vapor;
use only if idxgas = 6.
Mole fraction Default = 0.0
amfkry
(R)
Mole fraction of krypton; use
only if idxgas = 6.
Mole fraction Default = 0.0
amfn2
(R)
Mole fraction of nitrogen; use
only if idxgas = 6
Mole fraction Default = 0.0
amfxe
(R)
Mole fraction of xenon; use
only if idxgas = 6.
Mole fraction Default = 0.0
(R) = real, (I) = integer
C.6

C.6 Input Variables Specifying Reactor Conditions
Variable Name
(type) Description
Units
British/SI
Limitations/Default
Value
iplant
(I)
Signal for which type of
reactor:
-2 = PWR
-3 = BWR
-4 = HBWR
Dimensionless Default = -2
nsp
(I)
Signal for time-dependent
input arrays for p2, tw, and go:
If nsp = 0, single values for
these three variables will be
used for all time steps
If nsp = 1, a value for each
variable for each time step
must be input
Dimensionless Required input
p2(IT)
(R)
Coolant System pressure.
Must be input for each time
step if nsp = 1
psia/Pa Required input
tw(IT)
(R) Coolant inlet temperature.
Enter a value for every time
step if nsp =1
°F/K Required input
go(IT)
(R)
Mass flux of coolant around
fuel rod. Input a value for
each time step if nsp = 1.
Note: go input may have to be
adjusted to yield both desired
coolant and desired cladding
surface temperatures.
Concurrent adjustment of pitch
may also be required.
lb/hr-ft2/
kg/s-m2
Required input
pitch
(R)
Center-to-center distance
between rods in a square array
in./m Required input
(must be greater than dco)
C.7

Variable Name
(type) Description
Units
British/SI
Limitations/Default
Value
icor
(I)
Index for Crud Model:
icor = 0 or 1 yields constant
crud thickness; 0.0 mil crud as
default; input crdt as constant
thickness. Maximum
temperature rise permitted
across this layer is 20 °F.
icor = 2 yields time-dependent
crud; growth rate is crdtr,
starting from zero crud layer.
There is no limit to the
temperature rise across the
crud when icor=2. The
conductivity of the layer is
0.5 Btu/hr/ft-°F.
Dimensionless Default = 0
crdt
(R)
Initial thickness of crud layer
on cladding outside surface
mils/m Default = 0.0
crdtr
(R)
Rate of crud accumulation
(used if icor = 2)
mils/hr/m/s Default = 0.0
flux(J)
(R)
Conversion between fuel
specific power (W/g) and fast
neutron flux (n/m2/s,
E>1MeV). Input as an axial
array; the second value of the
array corresponds to the first
axial node, the na+1 value
corresponds to the top axial
node.
n/m2 /s/W/g of
fuel
Default = 0.221x10¹⁷
(Maximum of 20 values)
(R) = real, (I) = integer
IT = Time Step Index
J = 1 + Axial Node Index
C.8

C.7 Input Variables Specifying Power History
Variable Name
(type) Description
Units
British/SI
Limitations/Default
Value
im
(I)
Number of time steps Dimensionless Greater than 1, less than
400
Required input
(namelist frpcn)
ProblemTime(IT)
(R)
Cumulative time at the end of
each time step. Note: Time
steps greater than 50 days are
not recommended. If steady-
state operation is being
modeled, use time steps
greater than 1 day. Time steps
less than 1 day should only be
used when modeling a fast
power ramp.
Days Required input
Limit 400 steps
qmpy(IT)
(R)
The linear heat generation rate
at each time step. This equals
the rod-average value if iq = 0
and the peak value if iq = 1.
Note: Changes in local LHGR
of greater than 1.5 kw/ft per
time step are not
recommended. Size qmpy
accordingly.
kW/ft / kW/m Required input
Limit 400 steps
R) = real, (I) = integer
IT = Time Step Index
C.9

C.8 Input Variables Specifying Axial Power Profile
Variable Name
(type) Description
Units
British/SI
Limitations/Default
Value
iq
(I)
Indicator for axial power
shape:
0 = User-input power shapes,
with qmpy = rod-average
powers and power shapes
defined by qf,x, and fa = 1.0
1 = Chopped-cosine shape,
with fa = peak-to-average ratio
and qmpy = peak power (use
na=odd to have an axial node
corresponding to the input
peak power)
Dimensionless Required input
x(N)
(R)
The elevations in each qf, x
array defining a power shape.
Note the first value should be
0.0 and the last value must =
totl
ft/m Required input if iq=0
Maximum number of qf, x
pairs is 40
qf(N)
(R)
The ratio of the linear power at
the x(N) elevation to the
axially averaged value for the
M-th power shape. The
number of QF, X pairs for the
Mth power shape is defined by
jn(M). The code will
automatically normalize to an
average value of 1.0
Dimensionless Required input if iq = 0
Maximum number of qf, x
pairs is 40
jn(M)
(I)
The number of qf, x value pairs
for each axial power shape;
required input if iq = 0. Input
in the same sequence as the qf
and x arrays.
Dimensionless Required input if iq=0
Maximum number of
shapes is 20.
Maximum number of qf, x
pairs is 40
jst(IT)
(I)
The sequential number of the
power shape to be used for
each time step. One value of
jst is required per time step if
iq = 0.
Dimensionless Required input if iq=0
Maximum number of
power shapes = 20.
Maximum time steps is
400.
C.10

Variable Name
(type) Description
Units
British/SI
Limitations/Default
Value
fa
(R)
Peak-to-average power ratio
for cosine-type axial power
distribution ( = 1.0, unless iq =
1; see description of iq)
Dimensionless Required input
(R) = real, (I) = integer
N = Axial Node Index for Input Power Profile
M = Power Shape Number
IT = Time Step Index
C.11

C.9 Input Variables Specifying Axial Temperature Distribution (Optional)
Variable Name
(type) Description
Units
British/SI
Limitations/Default
Value
ifixedtsurf
(I)
Indicator for using axial
temperature distribution
0 = Cladding temperature will
be calculated based on input
power and coolant conditions
1 = Cladding temperature will
be specified by the user for
certain time steps. Each time
step where the temperature
will be set by the user, the
input variable, go, should be
set equal to 0.0.
Dimensionless Default value = 0
xt(N)
(R)
The elevations in each cladt, xt
array defining a cladding
temperature profile. Note: the
first value should be 0.0, and
the last value must = totl
Begin the input elevations for
the second temperature profile
at xt(n+1), where n is the
number of values in the first
profile.
ft/m Default value =0.0
cladt(N)
(R)
The cladding surface
temperature xt(N) elevation for
the M-th temperature profile.
The number of cladt, xt pairs
for the Mth power shape is
defined by jnsurftemp(M).
Dimensionless Default value =0.0
Maximum number of
cladt, xt pairs is 40
jnsurftemp(M)
(I)
The number of cladt, xt value
pairs for each axial
temperature distribution; input
in the same sequence as the
cladt and xt arrays.
Dimensionless Default value = 0
Maximum number of
shapes is 20.
Maximum number of
cladt, xt pairs is 40
C.12

Variable Name
(type) Description
Units
British/SI
Limitations/Default
Value
jstsurftemp(IT)
(I)
The sequential number of the
temperature profile to be used
for each time step. One value
of jstsurftemp is required per
time step if ifixedtsurf = 1.
Dimensionless Default value = 0
Maximum number of
shapes = 20.
Maximum time steps is
400.
(R) = real, (I) = integer
N = Axial Node Index for Input Surface Temperature Profile
M = Surface Temperature Profile Number
IT = Time Step Index
C.13

C.10 Input Variables Specifying Code Operation
Variable Name
(type) Description
Units
British/SI
Limitations/Default
Value
nr
(I)
Number of radial boundaries
in the pellet (for temperature
calculations and temperature
distribution output). These are
spaced by the code with
greater fraction in the outer
region to optimize definition
of the heat generation radial
distribution.
Dimensionless Greater than 1, less than
25; suggested minimum
number is 17
Default = 17
(namelist frpcn)
ngasr
(I)
Number of equal-volume
radial rings in the pellet for gas
release calculations. ALSO
SIGNALS WHICH GAS
RELEASE MODEL THE
CODE WILL USE. If ngasr is
10 or less, the ANS5.4 model
is used; if 11 or greater, the
MASSIH subroutine is used.
It is not recommended to use
ANS5.4 for burnups >
50 GWd/MTU
Dimensionless Greater than 6, less than
50; suggested number is
45.
Default = 45
(namelist frpcn)
na
(I)
Number of equal-length axial
regions along the rod, for
which calculations are
performed and output.
Dimensionless Greater than 1, less than 18
Default = 9
(namelist frpcn)
nunits
(I)
Signal for units system to be
used for input and output:
1 = British units
0 = SI units
Note that input of nunits >10
will activate “debug” output,
which is significant in volume.
Dimensionless Default = 1
crephr
(R)
Subdivision for internal creep
steps
(should be set to a minimum of
10 creep steps per time step for
smallest step)
hours Default = 10.0
C.14

Variable Name
(type) Description
Units
British/SI
Limitations/Default
Value
sgapf
(R)
Number of fission gas atoms
formed per 100 fissions.
Dimensionless Default = 31.0
slim
(R)
Limit on swelling Volume fraction Default = 0.05
qend
(R)
Fraction of end-node heat that
transfers to the plenum gas
Dimensionless Default = 0.3
igas
(I)
Time step to begin calculation
of fission gas release. For all
time steps prior to igas, the
calculated gas release will not
be included in the gas in the
rod void volume. (Note: this
option only is available when
using the Massih fission gas
release model)
Dimensionless Default = 0
(R) = real, (I) = integer
C.10.1 Model Selection Variables Not Recommended by Pacific Northwest National Laboratory
Variable Name
(type) Description
Units
British/SI
Limitations/Default
Value
imswch
(I)
Signal for EM models:
= 1 All EM models
= 0 No EM models
= -1 Selected EM models,
input signals in $EMFPCN
Dimensionless Default = 0
impowr
(R)
EM Power requirement index;
= 0, not assumed to be
required
Dimensionless Default = 0
(namelist emfpcn)
imfuel
(R)
Switch on dimensional
changes: = 0, BE changes, =1,
EM changes
Dimensionless Default = 0
(namelist emfpcn)
imdens
(R)
Switch on densification model Dimensionless Default = 0
(namelist emfpcn)
imrelo
(R)
Switch on fuel relocation
model
Dimensionless Default = 0
(namelist emfpcn)
C.15

Variable Name
(type) Description
Units
British/SI
Limitations/Default
Value
imclad
(R)
Switch on cladding
deformation; = 1, no
permanent deformation
Dimensionless Default = 0
(namelist emfpcn)
imgapc
(R)
Switch on gap conductance
calculation
Dimensionless Default = 0
(namelist emfpcn)
imenrg
(R)
Switch on stored energy
reference temperature: = 0
reference = 298 K
= 1, reference = 273 K
Dimensionless Default = 0
(namelist emfpcn)
(R) = real, (I) = integer
C.16

C.11 Input Variables Specifying Code Output
Variable Name
(type) Description
Units
British/SI
Limitations/Default
Value
jdlpr
(I)
Output print control for each
time step:
0 = All axial nodes
1 = peak-power axial node
-1 = axial summary
for NO printout each step, see
nopt
Dimensionless Default = 1
Note: The code sets jdlpr
to 0 (full output) when
ntape is greater than 0, to
assure full axial array of
permanent radial
deformations is passed to
FRAPTRAN
nopt
(I)
Control on printout
= 0, printout each time step,
controlled by jdlpr
= 1, case input and summary
sheet only
Dimensionless Default = 0
nplot
(I)
Control on output of plot file
for excel plotting routine
= 0, No output plot file will be
created
= 1, Plot output file will be
created (File 66). Note: The
name of the plot file should be
specified in the input file
below where the name of the
ordinary output (File 06) is
specified
Dimensionless Default = 0
ntape
(I)
Signal for creating a start tape
for FRAPTRAN, from
subroutine RESTFS. If ntape
> 0, RESTFS is called and a
tape (file 22= “restart”) is
incrementally written each
time step
Dimensionless Default = 0
C.17

Variable Name
(type) Description
Units
British/SI
Limitations/Default
Value
nread
(I)
Signal to start up from a restart
tape (File 13). The value of
nread is the time step to start
from. Note: user must switch
his restart-write tape file
number from 12 to 13 to make
it a restart-read tape. Note: the
restart tape does not currently
contain complete restart
information for the fission gas
release models.
Dimensionless Default = 0
nrestr
(I)
Signal for writing a restart tape
for FRAPCON-3. If nrestr not
equal to 0, subroutine
TAPEGEN generates a restart
tape (file 12) at each time step.
Note: the restart tape does not
currently contain complete
restart information for the
fission gas release models.
Dimensionless Default = 0
(R) = real, (I) = integer
C.18

C.12 Example Case with MOX Fuel
***********************************************************************
* frapcon3, steady-state fuel rod analysis code
*
*----------------------------------------------------------------------------------
*
*
*
* CASE DESCRIPTION: MOX example rod
*
*
*
*UNIT FILE DESCRIPTION
*
*------ ---------------------------------------------------------------Output:
*
* Output :
*
* 6 STANDARD PRINTER OUTPUT
*
*
*
* Scratch:
*
* 5 SCRATCH INPUT FILE FROM ECH01
*
*
*
* Input: FRAPCON3 INPUT FILE (UNIT 55)
*
*
*
***********************************************************************
* GOESINS:
FILE05='nullfile', STATUS='UNKNOWN', FORM='FORMATTED',
CARRIAGE CONTROL='NONE'
*
* GOESOUTS:
FILE06='MOXexample.out', STATUS='UNKNOWN', CARRIAGE CONTROL='LIST'
FILE66='MOXexample.plot', STATUS='UNKNOWN', FORM='FORMATTED',
CARRIAGE CONTROL='LIST'
/**********************************************************************
MOX Example Rod
$frpcn
im=50, na=4,
ngasr = 45,
$end
C.19

$frpcon
cpl = 2., crdt = 0.0, thkcld = 0.0224, thkgap = 0.0033,
dco = 0.374, pitch = 0.5,nplot=1,
rc = 0.0453, fotmtl = 1.997,dishsd=0.06488,
den = 94.43, dspg = 0.3,fa = 1.,
dspgw = 0.03, enrch = 0.229, fgpav = 382, hdish = 0.011,
hplt = 0.5, icm = 4, imox = 1, comp = 5.945,
idxgas = 1, iplant =-2, iq = 0, jdlpr = 0,
jn = 5,5,
totl = 1.31, roughc = 3.94e-5, roughf = 7.9e-5, vs = 10.0,
nunits = 1, rsntr = 52., nsp = 1,
p2(1) = 44*2250., p2(45) = 6*2352,
tw(1) = 44*570, tw(45) = 6*590
go(1) = 50*2.0e6,
jst = 44*1, 6*2
qf(1) = 1.0, 1.0, 1.0, 1.0, 1.0
x(1) = 0.0, 0.3275, 0.6650, 0.9925, 1.31
qf(6) = 0.9, 1.0, 1.1, 1.0, 0.9
x(6) = 0.0, 0.3275, 0.6650, 0.9925, 1.31
ProblemTime=
0.1, 0.2, 0.3, 0.4, 0.5,
0.6, 30., 60., 90., 120.,
150., 180., 210., 240., 270.,
300., 331., 360., 390., 420.,
450., 480., 510., 540., 570.,
600., 625., 650., 700., 750.,
800., 850., 900., 945., 990.,
1000., 1050., 1100., 1150., 1200.,
1250., 1300., 1350., 1400
1401., 1402., 1403., 1404., 1405.,
1406.
qmpy =
1,2,3,4,5,
6., 6.7, 6.7, 6.7, 6.7,
5*6.7
6.7, 6.7, 7.0, 7.0, 7.0,
5*7.0,
7.0, 7.0, 7.0, 5.8, 5.8,
5*5.8,
5*4.11,
4.11, 4.11, 4.11, 4.11,
4.0, 3.5, 3.0,
2.5, 2.0, 1.5
slim = .05,
$end
$frpmox
enrpu39 = 65.83, enrpu40 = 23.45, enrpu41 = 7.39,
enrpu42 = 3.33
$end
C.20

C.13 Input Variables Arranged Alphabetically and by Input Block
$frpcn input block
Variable Name Page Number
im C.9
na C.14
ngasr C.14
nr C.14
$frpmox input block
Variable Name Page Number
enrpu39 C.3
enrpu40 C.3
enrpu41 C.3
enrpu42 C.4
$emfpcn input block
Variable Name Page Number
imclad C.16
imdens C.15
imenrg C.16
imfuel C.15
imgapc C.16
impowr C.15
imrelo C.15
C.21

$frpcon input block
Variable Name Page Number Variable Name Page Number
amfair C.6 imswch C.15
amfarg C.6 iplant C.7
amffg C.6 iq C.10
amfh2 C.6 jdlpr C.17
amfh2o C.6 jn C.10
amfhe C.6 jnsurftemp C.12
amfkry C.6 jst C.10
amfn2 C.6 jstsurftemp C.13
amfxe C.6 nopt C.17
catexf C.5 nplot C.17
chorg C.5 nread C.18
cladt C.12 nrestr C.18
cldwks C.5 nsp C.7
comp C.3 ntape C.17
cpl C.2 nunits C.14
crdt C.8 p2 C.7
crdtr C.8 pitch C.7
crephr C.14 ppmh2o C.4
dco C.2 ppmn2 C.4
den C.4 ProblemTime C.9
deng C.4 qend C.15
dishd C.3 qf C.10
enrch C.3 qmpy C.9
fa C.11 rc C.3
fgpav C.6 roughc C.5
flux C.8 roughf C.4
fotmtl C.4 rsntr C.4
gadoln C.4 sgapf C.15
go C.7 slim C.15
hdish C.3 thkcld C.2
hplt C.3 thkgap C.2
icm C.5 totl C.2
icor C.8 tsint C.4
idxgas C.6 vs C.2
ifixedtsurf C.12 x C.10
igas C.15 xt C.12
imox C.3
C.22

BIBLIOGRAPHIC DATA SHEET(See instructions on the reverse)
NRC FORM 335(9-2004)NRCMD 3.7
U.S. NUCLEAR REGULATORY COMMISSION 1. REPORT NUMBER(Assigned by NRC, Add Vol., Supp., Rev.,
and Addendum Numbers, if any.)
NUREG/CR-6534, Vol. 4PNNL-11513
3. DATE REPORT PUBLISHED
MONTH
May
YEAR
2005
4. FIN OR GRANT NUMBER
Y6586
2. TITLE AND SUBTITLE
FRAPCON-3 Updates, Including Mixed-Oxide Fuel Properties
5. AUTHOR(S)
D. D. Lanning, C. E. Beyer, K.J.Geelhood
6. TYPE OF REPORT
Technical Report
7. PERIOD COVERED (Inclusive Dates)
2002 - 2005
8. PERFORMING ORGANIZATION - NAME AND ADDRESS (If NRC, provide Division, Office or Region, U.S. Nuclear Regulatory Commission, and mailing address; if contractor,
Pacific Northwest National Laboratory
9. SPONSORING ORGANIZATION - NAME AND ADDRESS (If NRC, type "Same as above"; if contractor, provide NRC Division, Office or Region, U.S. Nuclear Regulatory Commission,
Division of Systems Analysis and Regulatory Effectiveness
provide name and mailing address.)
and mailing address.)
10. SUPPLEMENTARY NOTES
11. ABSTRACT (200 words or less)
The FRAPCON-3 code has been altered by a number of additions to form version FRAPCON-3.3. The major changes includean improved model for the urania fuel pellet thermal conductivity; the addition of mixed plutonia-urania oxide (MOX) fuel pelletthermal properties and other parameters to facilitate analysis of MOX fuel rod performance; and the addition of corrosion andhydrogen pickup parameters appropriate to advanced cladding types. This volume contains descriptions and discussions ofthese and other revisions.
The document also contains code-data comparisons of MOX fuel temperatures used to verify the MOX fuel pellet thermalconductivity model, and similar comparisons for urania fuel rods. The total sequence of code revisions that have led from thelast-published version of FRAPCON-3 (NUREG/CR-6534, Volume 2, 1997) to the latest issued version, FRAPCON-3.3, is alsogiven.
12. KEY WORDS/DESCRIPTORS (List words or phrases that will assist researchers in locating the report.)
Computer CodeCladdingFission Gas ReleaseFRAPCONFuel TemperatureMixed OxideNuclear FuelPlutonium Dioxide (Plutonia)Thermal ConductivityUranium Dioxide (Urania)
14. SECURITY CLASSIFICATION
13. AVAILABILITY STATEMENT
unlimited
(This Page)
unclassified
(This Report)
unclassified
15. NUMBER OF PAGES
16. PRICE
NRC FORM 335 (9-2004) PRINTED ON RECYCLED PAPER
P.O. Box 999
Richland, Washington 99352
Office of Nuclear Regulatory Research
U.S. Nuclear Regulatory Commission
Wasington, DC 20555-0001

Printed on recycled
paper
Federal Recycling Program