Financial literacy for investors in the securities market ...

SEMIANNUAL REPORT AND SHAREHOLDER LETTER
FRANKLIN INVESTORS SECURITIES TRUSTApril 30, 2021
Sign up for electronic delivery at franklintempleton.com/edelivery
Franklin Convertible Securities Fund
Franklin Equity Income Fund
Franklin Managed Income Fund
Not FDIC Insured May Lose Value No Bank Guarantee
franklintempleton.com Not part of the semiannual report 1
SHAREHOLDER LETTERDear Shareholder:
During the six months ended April 30, 2021, the U.S. economy continued to recover from the effects of the novel coronavirus (COVID-19) pandemic. U.S. gross domestic product (GDP) reported for 2020’s third and fourth quarters showed a substantial recovery from the contraction experienced in 2020’s first half, based on increased business and residential investment and consumer spending. U.S. economic growth accelerated during 2021’s first quarter as the reopening of businesses, widespread COVID-19 vaccinations and federal assistance programs boosted consumer spending.
Before the reporting period, the U.S. Federal Reserve lowered the federal funds rate twice in March 2020 and implemented broad quantitative easing measures to support credit markets. During the reporting period, the Federal Reserve held its key rate unchanged at 0.25% and continued quantitative easing and its adjusted policy since August to allow more flexibility to keep interest rates low, while maintaining a 2% average inflation target. The 10-year U.S. Treasury yield was 0.88% on October 31, 2020, and it increased to 1.65% by the end of April 2021.
In this environment, the prices of U.S. stocks, as measured by the Standard & Poor’s® 500 Index (S&P 500®), rose 27.87%, (the index increasing from 3,269.96 to 4,181.17).1,2 Investment-grade bonds, as measured by the Bloomberg Barclays U.S. Aggregate Bond Index (Bloomberg Index), posted a -1.52% total return (an index decrease from 2,365.52 to 2,329.61), which includes reinvestment of income and distributions.3
We are committed to our long-term perspective and disciplined investment approach as we conduct a rigorous, fundamental analysis of securities with a regular emphasis on investment risk management.
We believe active, professional investment management serves investors well. We also recognize the important role of financial professionals in today’s markets and encourage investors to continue to seek their advice. Amid changing markets and economic conditions, we are confident investors with a well-diversified portfolio and a patient, long-term outlook should be well-positioned for the years ahead.
Franklin Investors Securities Trust’s semiannual report, covering Franklin Convertible Securities Fund, Franklin Equity Income Fund and Franklin Managed Income Fund, includes more detail about prevailing conditions and a discussion about investment decisions during the period. All securities markets fluctuate, as do mutual fund share prices.
We thank you for investing with Franklin, welcome your questions and comments, and look forward to serving your future investment needs.
Sincerely,
Rupert H. Johnson, Jr.ChairmanFranklin Investors Securities Trust
This letter reflects our analysis and opinions as of April 30, 2021, unless otherwise indicated. The information is not a complete analysis of every aspect of any market, country, industry, security or fund. Statements of fact are from sources considered reliable.
1. Source: Copyright © 2021, S&P Dow Jones Indices LLC. All rights reserved. 2. Source: Morningstar. The changes in index prices shown for the S&P 500 do not include reinvestments of income and distributions, which are included in its total return, which was: S&P 500 +28.85% (index total return resulting in an increase from 6,734.84 to 8,678.16).3. Sources: Morningstar and Bloomberg Barclays indexes. For the Bloomberg Index, only total return as shown is available, not price change without the inclusion of reinvested income and distributions.See www.franklintempletondatasources.com for additional data provider information.

franklintempleton.comSemiannual Report2
ContentsSemiannual ReportEconomic and Market Overview ............................................3Franklin Convertible Securities Fund.....................................4Franklin Equity Income Fund ...............................................10Franklin Managed Income Fund ..........................................15Financial Highlights and Statements of Investments ...........21Financial Statements ...........................................................52Notes to Financial Statements.............................................58Shareholder Information ......................................................77
Visit franklintempleton.com for fund updates, to access your account, or to find helpful financial planning tools.

3franklintempleton.com Semiannual Report
SEMIANNUAL REPORT
Economic and Market OverviewU.S. equities, as measured by the Standard & Poor’s 500 Index (S&P 500), advanced strongly during the six months ended April 30, 2021. Stocks continued to recover from the shock of the novel coronavirus (COVID-19) pandemic amid a rebound in economic activity as many investors anticipated a continued return to normalcy. Two additional fiscal stimulus measures, which included direct payments to many individuals and programs designed to help small businesses keep employees on the payroll, passed in December 2020 and March 2021, further supporting stock prices. In November 2020, news that several vaccines showed high efficacy rates bolstered investor confidence. Additionally, the implementation of mass vaccination programs in early 2021, a significant decline in the U.S. infection rate and continued economic reopening led U.S. equities to reach all-time price highs in April 2021.
The U.S. economic recovery accelerated in 2021’s first quarter after moderating in 2020’s last quarter. Toward period-end, the total economic output nearly reached pre-pandemic levels, as a notable increase in consumer spending bolstered growth. The unemployment rate declined from 6.9% in October 2020 to 6.1% in April 2021, as jobless claims fell and employment openings rose.1
In an effort to support the economy, the U.S. Federal Reserve (Fed) kept the federal funds target rate at a record-low range of 0.00%–0.25%. The Fed also continued quantitative easing measures aimed at ensuring credit flows to borrowers and supporting credit markets with open-ended bond purchasing. Furthermore, the Fed reiterated that interest rates would potentially remain low, even if inflation moderately exceeded its 2% target.
The combination of stimulus payments, increasing asset prices and generally rising savings during lockdowns led to the strengthening of overall household balance sheets. The higher overall household wealth and pent-up consumer demand led to stronger consumer spending in 2021’s first quarter that, along with the shortages of some materials and supplies, drove many investors’ inflation expectations to increase significantly near period-end.
The foregoing information reflects our analysis and opinions as of April 30, 2021. The information is not a complete analysis of every aspect of any market, country, industry, security or fund. Statements of fact are from sources considered reliable.
1. Source: Bureau of Labor Statistics
4 franklintempleton.comSemiannual Report
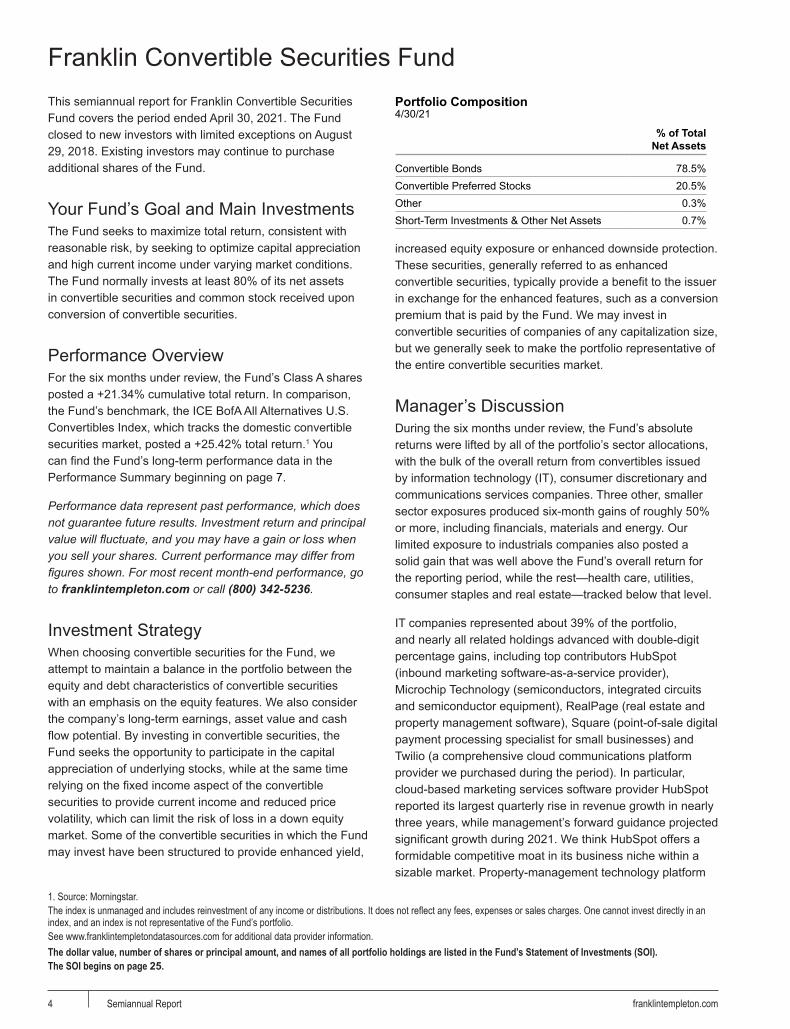
Franklin Convertible Securities FundThis semiannual report for Franklin Convertible Securities Fund covers the period ended April 30, 2021. The Fund closed to new investors with limited exceptions on August 29, 2018. Existing investors may continue to purchase additional shares of the Fund.
Your Fund’s Goal and Main InvestmentsThe Fund seeks to maximize total return, consistent with reasonable risk, by seeking to optimize capital appreciation and high current income under varying market conditions. The Fund normally invests at least 80% of its net assets in convertible securities and common stock received upon conversion of convertible securities.
Performance OverviewFor the six months under review, the Fund’s Class A shares posted a +21.34% cumulative total return. In comparison, the Fund’s benchmark, the ICE BofA All Alternatives U.S. Convertibles Index, which tracks the domestic convertible securities market, posted a +25.42% total return.1 You can find the Fund’s long-term performance data in the Performance Summary beginning on page 7.
Performance data represent past performance, which does not guarantee future results. Investment return and principal value will fluctuate, and you may have a gain or loss when you sell your shares. Current performance may differ from figures shown. For most recent month-end performance, go to franklintempleton.com or call (800) 342-5236.
Investment StrategyWhen choosing convertible securities for the Fund, we attempt to maintain a balance in the portfolio between the equity and debt characteristics of convertible securities with an emphasis on the equity features. We also consider the company’s long-term earnings, asset value and cash flow potential. By investing in convertible securities, the Fund seeks the opportunity to participate in the capital appreciation of underlying stocks, while at the same time relying on the fixed income aspect of the convertible securities to provide current income and reduced price volatility, which can limit the risk of loss in a down equity market. Some of the convertible securities in which the Fund may invest have been structured to provide enhanced yield,
Portfolio Composition4/30/21
% of Total Net Assets
Convertible Bonds 78.5% Convertible Preferred Stocks 20.5% Other 0.3% Short-Term Investments & Other Net Assets 0.7%
increased equity exposure or enhanced downside protection. These securities, generally referred to as enhanced convertible securities, typically provide a benefit to the issuer in exchange for the enhanced features, such as a conversion premium that is paid by the Fund. We may invest in convertible securities of companies of any capitalization size, but we generally seek to make the portfolio representative of the entire convertible securities market.
Manager’s DiscussionDuring the six months under review, the Fund’s absolute returns were lifted by all of the portfolio’s sector allocations, with the bulk of the overall return from convertibles issued by information technology (IT), consumer discretionary and communications services companies. Three other, smaller sector exposures produced six-month gains of roughly 50% or more, including financials, materials and energy. Our limited exposure to industrials companies also posted a solid gain that was well above the Fund’s overall return for the reporting period, while the rest—health care, utilities, consumer staples and real estate—tracked below that level.
IT companies represented about 39% of the portfolio, and nearly all related holdings advanced with double-digit percentage gains, including top contributors HubSpot (inbound marketing software-as-a-service provider), Microchip Technology (semiconductors, integrated circuits and semiconductor equipment), RealPage (real estate and property management software), Square (point-of-sale digital payment processing specialist for small businesses) and Twilio (a comprehensive cloud communications platform provider we purchased during the period). In particular, cloud-based marketing services software provider HubSpot reported its largest quarterly rise in revenue growth in nearly three years, while management’s forward guidance projected significant growth during 2021. We think HubSpot offers a formidable competitive moat in its business niche within a sizable market. Property-management technology platform
1. Source: Morningstar.The index is unmanaged and includes reinvestment of any income or distributions. It does not reflect any fees, expenses or sales charges. One cannot invest directly in an index, and an index is not representative of the Fund’s portfolio.See www.franklintempletondatasources.com for additional data provider information.The dollar value, number of shares or principal amount, and names of all portfolio holdings are listed in the Fund’s Statement of Investments (SOI).The SOI begins on page 25.

FRANKLIN CONVERTIBLE SECURITIES FUND
5franklintempleton.com Semiannual Report
company RealPage agreed to be acquired by private equity firm Thoma Bravo at a substantial premium to its equity value. Thoma Bravo, which focuses on the technology-enabled services sector, is not a Fund holding.
Top 10 Holdings4/30/21
Company Industry, Country
% of Total Net Assets
a a
RH 2.4%Specialty Retail, United StatesSnap, Inc. 2.3%Interactive Media & Services, United StatesHubSpot, Inc. 2.3%Software, United StatesZendesk, Inc. 2.3%Software, United StatesOkta, Inc. 2.2%IT Services, United StatesDanaher Corp. 2.1%Health Care Equipment & Supplies, United
StatesAXA SA 2.0%Insurance, FranceEtsy, Inc. 2.0%Internet & Direct Marketing Retail, United StatesBroadcom, Inc. 2.0%Semiconductors & Semiconductor Equipment,
United StatesKKR & Co., Inc. 1.9%Capital Markets, United States
In the consumer discretionary sector, all of our related holdings advanced, but the best results stemmed from several e-commerce companies and traditional “brick and mortar” retailers that successfully moved more of their operations online during the COVID-19 pandemic. Top contributor RH, the holding company for Restoration Hardware, offers furniture, lighting and a wide range of other home goods, and was a prime example of the latter as the Fund saw the value of its investments (in three separate convertible bonds) nearly double over the reporting period amid a significant spike in its e-commerce sales. In March 2020, RH reported better-than-expected fiscal fourth-quarter results both on revenue and profitability, backed largely by strong demand trends, particularly in the luxury home furnishing market. For its current fiscal year, RH expects topline growth to be well above consensus, with at least half of the contribution expected to come from gross margin expansion. Our position in key contributor Pinduoduo also saw a solid gain. Pinduoduo, which is China’s first social e-commerce platform, has been growing its revenue at an impressive pace as China’s consumers embrace its user-friendly interface and bulk-purchase model, which allows customers to form groups to buy products at a discount. As the second-largest e-commerce company in China,
Pinduoduo appears well-positioned to benefit from the country’s overall economic expansion and higher penetration for online shopping.
Although camera-based social media platform Snap was the top contributor in the communication services sector due to the fact that it was our single-largest position in the group, none had a higher absolute return than second-best contributor Sea. Snap delivered solid quarterly financial metrics on several key fronts, including increased demand from both new and existing advertisers; sharply increased average prices per ad impression; a significant increase in active daily users; higher user retention; higher average time spent on its core Snapchat app; and stronger adoption of its camera products—all of which enabled the company to beat analysts’ revenue and earnings estimates by a wide margin. Singapore-based mobile platform Sea, which has an unusual business model that has catalyzed a tremendous spike in demand across the three highly popular segments in which it operates: digital gaming/entertainment, e-commerce and digital financial services. Sea’s equity value increased significantly from its pandemic lows through year-end 2020 and continued to rise through April 2021 as its gaming division (Garena) has emerged as the dominant player in Southeast Asia and Taiwan, while its online shopping platform (Shopee) is now the e-commerce leader in that region, having surpassed industry giant Alibaba (not a Fund holding) along the way. Sea also saw its financial technology push gain traction, with growing total payment volumes and numbers of consumers using Sea’s mobile wallet services. Sea also secured a digital banking license in Singapore, paving the way for it to become a leading regional financial services player.
Elsewhere in the portfolio, we saw a rally for our position in Lyft, particularly in late 2020. Although Lyft is often discussed as a technology company due to its popular ride-hailing mobile app and its heavy investments in autonomous driving technology, it is officially listed as an industrials sector company, and it was by far our top performer within the group. Although the pandemic continued to hurt Lyft’s core platform business—revenues were down substantially year over year in 2020’s third quarter—it saw a gradual recovery in ride demand from the pandemic lows and its equity value surged following the November 2020 passage of California Proposition 22, which prevented meaningful cost increases by keeping its “gig economy” drivers designated as independent contractors (as opposed to treating them like employees with full benefits). The company also continued to cut costs into 2021, when it saw a more pronounced uptick in ridership amid economic reopening and less restrictive

FRANKLIN CONVERTIBLE SECURITIES FUND
6 franklintempleton.comSemiannual Report
social distancing measures. Lyft also managed to improve its average revenue per rider, a key metric for the company’s operations.
Given the strength and breadth of the Fund’s semiannual performance, there were only a few detractors of consequence scattered across the portfolio, and their combined impact on absolute returns was mild. In the IT sector, overall gains were slightly reduced by losses for Splunk and Alteryx, both of which operate in the increasingly competitive data sciences and analytics software niche. In December 2020, Splunk announced that its fiscal 2021 third quarter (the three months ended October 31, 2020) fell shy of expectations given that year-over-year revenue fell well below recent management guidance. Splunk’s chief executive officer said some large customers were hesitating to commit to long-term contracts due to ongoing uncertainty in the economy, while others were experiencing complications related to the company’s rapid migration to modern cloud-based software. We remained positive on the company’s longer-term prospects even though it expected recent challenges with some of its customer renewals to persist.
In the communication services sector, our convertible investment in China-based online video platform iQIYI posted a modest decline as it tracked the company’s equity value to near a three-year low. iQIYI, one of the biggest streaming-media sites in the world (based on the number of active users and hours spent on its service each month), saw a loss in subscribers versus key competitor Tencent (not a Fund holding). In addition to the reversal in its growth, iQIYI has shown a lack of profits (though it continued to narrow its net losses on a quarter-over-quarter basis) and rising leverage, and the company has also been impacted by a wave of large “block” sales by several institutional investors. China’s technology and digital entertainment companies have been squeezed by regulators in both China and the U.S. recently; companies such as iQIYI face the potential for being delisted from U.S. exchanges. Executives say they have a plan for boosting profitability, including iQIYI’s latest moves into new content offerings like original movies, which may help it return to subscriber growth in the coming months. Elsewhere in the portfolio, the only other notable detractors were three health care companies that failed to advance for the semiannual period: Haemonetics (purchased during the period), a global provider of blood and plasma supplies and services; PTC Therapeutics, a pharmaceutical company focused on small molecule drugs and gene therapies to control certain rare diseases; and
Neurocrine Biosciences, a biopharmaceutical company that develops treatments for neurological and endocrine-related diseases and disorders.
Thank you for your continued participation in Franklin Convertible Securities Fund. We look forward to serving your future investment needs.
Alan E. Muschott, CFALead Portfolio Manager
Eric Webster, CFAPortfolio Manager
The foregoing information reflects our analysis, opinions and portfolio holdings as of April 30, 2021, the end of the reporting period. The way we implement our main investment strategies and the resulting portfolio holdings may change depending on factors such as market and economic conditions. These opinions may not be relied upon as investment advice or an offer for a particular security. The information is not a complete analysis of every aspect of any market, country, industry, security or the Fund. Statements of fact are from sources considered reliable, but the investment manager makes no representation or warranty as to their completeness or accuracy. Although historical performance is no guarantee of future results, these insights may help you understand our investment management philosophy.
CFA® is a trademark owned by CFA Institute.

Performance Summary as of April 30, 2021
FRANKLIN CONVERTIBLE SECURITIES FUND
7franklintempleton.com Semiannual Report
The performance tables do not reflect any taxes that a shareholder would pay on Fund dividends, capital gain distributions, if any, or any realized gains on the sale of Fund shares. Total return reflects reinvestment of the Fund’s dividends and capital gain distributions, if any, and any unrealized gains or losses. Your dividend income will vary depending on dividends or interest paid by securities in the Fund’s portfolio, adjusted for operating expenses of each class. Capital gain distributions are net profits realized from the sale of portfolio securities.
Performance as of 4/30/21Cumulative total return excludes sales charges. Average annual total return includes maximum sales charges. Sales charges will vary depending on the size of the investment and the class of share purchased. The maximum is 5.50% and the minimum is 0%. Class A: 5.50% maximum initial sales charge; Advisor Class: no sales charges. For other share classes, visit franklintempleton.com.
Share ClassCumulative
Total Return1Average Annual
Total Return2
–
A3
6-Month +21.34% +14.66%1-Year +57.04% +48.37%5-Year +149.91% +18.75%10-Year +221.48% +11.75%
Advisor6-Month +21.53% +21.53%1-Year +57.47% +57.47%5-Year +153.17% +20.42%10-Year +229.70% +12.67%
Share ClassDistribution
Rate4
30-Day Standardized
Yield5
A 0.92% 0.37%Advisor 1.20% 0.64%
Performance data represent past performance, which does not guarantee future results. Investment return and principal value will fluctuate, and you may have a gain or loss when you sell your shares. Current performance may differ from figures shown. For most recent month-end performance, go to franklintempleton.com or call (800) 342-5236.
See page 8 for Performance Summary footnotes.
FRANKLIN CONVERTIBLE SECURITIES FUNDPERFORMANCE SUMMARY
8 franklintempleton.comSemiannual Report
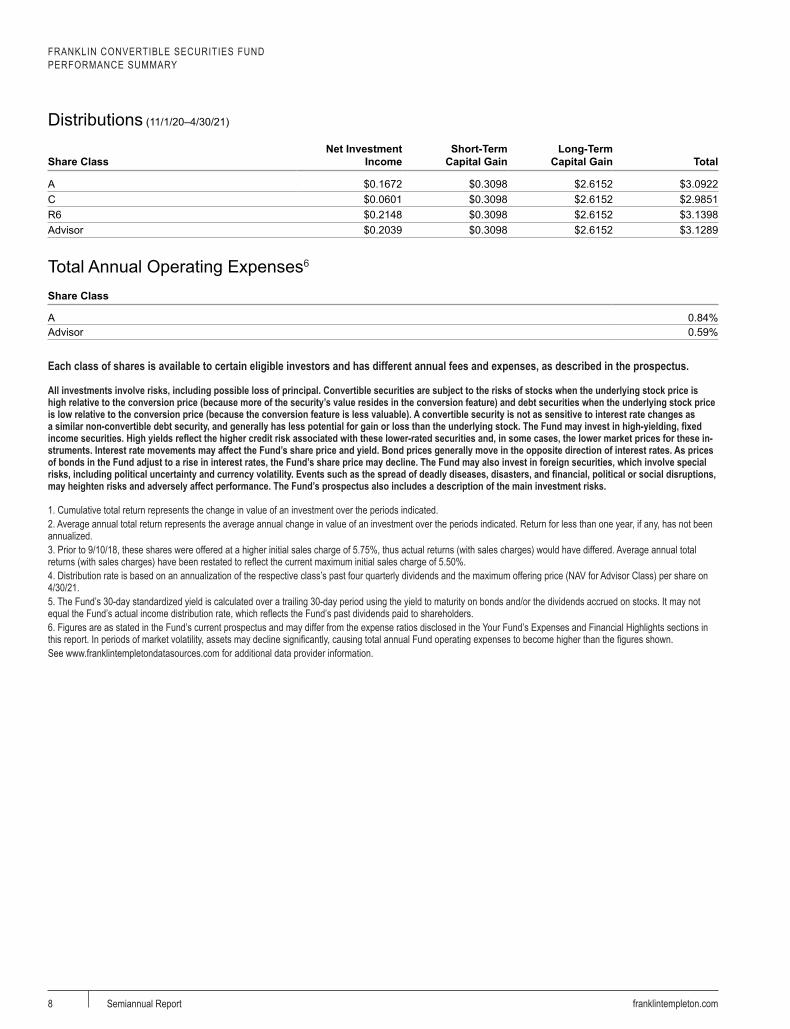
Distributions (11/1/20–4/30/21)
Share ClassNet Investment
IncomeShort-Term
Capital GainLong-Term
Capital Gain Total
A $0.1672 $0.3098 $2.6152 $3.0922C $0.0601 $0.3098 $2.6152 $2.9851R6 $0.2148 $0.3098 $2.6152 $3.1398Advisor $0.2039 $0.3098 $2.6152 $3.1289
Total Annual Operating Expenses6
Share Class
A 0.84%Advisor 0.59%
Each class of shares is available to certain eligible investors and has different annual fees and expenses, as described in the prospectus.
All investments involve risks, including possible loss of principal. Convertible securities are subject to the risks of stocks when the underlying stock price is high relative to the conversion price (because more of the security’s value resides in the conversion feature) and debt securities when the underlying stock price is low relative to the conversion price (because the conversion feature is less valuable). A convertible security is not as sensitive to interest rate changes as a similar non-convertible debt security, and generally has less potential for gain or loss than the underlying stock. The Fund may invest in high-yielding, fixed income securities. High yields reflect the higher credit risk associated with these lower-rated securities and, in some cases, the lower market prices for these in-struments. Interest rate movements may affect the Fund’s share price and yield. Bond prices generally move in the opposite direction of interest rates. As prices of bonds in the Fund adjust to a rise in interest rates, the Fund’s share price may decline. The Fund may also invest in foreign securities, which involve special risks, including political uncertainty and currency volatility. Events such as the spread of deadly diseases, disasters, and financial, political or social disruptions, may heighten risks and adversely affect performance. The Fund’s prospectus also includes a description of the main investment risks.
1. Cumulative total return represents the change in value of an investment over the periods indicated.2. Average annual total return represents the average annual change in value of an investment over the periods indicated. Return for less than one year, if any, has not been annualized.3. Prior to 9/10/18, these shares were offered at a higher initial sales charge of 5.75%, thus actual returns (with sales charges) would have differed. Average annual total returns (with sales charges) have been restated to reflect the current maximum initial sales charge of 5.50%. 4. Distribution rate is based on an annualization of the respective class’s past four quarterly dividends and the maximum offering price (NAV for Advisor Class) per share on 4/30/21.5. The Fund’s 30-day standardized yield is calculated over a trailing 30-day period using the yield to maturity on bonds and/or the dividends accrued on stocks. It may not equal the Fund’s actual income distribution rate, which reflects the Fund’s past dividends paid to shareholders.6. Figures are as stated in the Fund’s current prospectus and may differ from the expense ratios disclosed in the Your Fund’s Expenses and Financial Highlights sections in this report. In periods of market volatility, assets may decline significantly, causing total annual Fund operating expenses to become higher than the figures shown.See www.franklintempletondatasources.com for additional data provider information.

Your Fund’s Expenses
FRANKLIN CONVERTIBLE SECURITIES FUND
9franklintempleton.com Semiannual Report
As a Fund shareholder, you can incur two types of costs: (1) transaction costs, including sales charges (loads) on Fund purchases and redemptions; and (2) ongoing Fund costs, including management fees, distribution and service (12b-1) fees, and other Fund expenses. All mutual funds have ongoing costs, sometimes referred to as operating expenses. The table below shows ongoing costs of investing in the Fund and can help you understand these costs and compare them with those of other mutual funds. The table assumes a $1,000 investment held for the six months indicated.
Actual Fund ExpensesThe table below provides information about actual account values and actual expenses in the columns under the heading “Actual.” In these columns the Fund’s actual return, which includes the effect of Fund expenses, is used to calculate the “Ending Account Value” for each class of shares. You can estimate the expenses you paid during the period by following these steps (of course, your account value and expenses will differ from those in this illustration): Divide your account value by $1,000 (if your account had an $8,600 value, then $8,600 ÷ $1,000 = 8.6). Then multiply the result by the number in the row for your class of shares under the headings “Actual” and “Expenses Paid During Period” (if Actual Expenses Paid During Period were $7.50, then 8.6 x $7.50 = $64.50). In this illustration, the actual expenses paid this period are $64.50.
Hypothetical Example for Comparison with Other FundsUnder the heading “Hypothetical” in the table, information is provided about hypothetical account values and hypothetical expenses based on the Fund’s actual expense ratio and an assumed rate of return of 5% per year before expenses, which is not the Fund’s actual return. This information may not be used to estimate the actual ending account balance or expenses you paid for the period, but it can help you compare ongoing costs of investing in the Fund with those of other funds. To do so, compare this 5% hypothetical example for the class of shares you hold with the 5% hypothetical examples that appear in the shareholder reports of other funds.
Please note that expenses shown in the table are meant to highlight ongoing costs and do not reflect any transactional costs. Therefore, information under the heading “Hypothetical” is useful in comparing ongoing costs only, and will not help you compare total costs of owning different funds. In addition, if transactional costs were included, your total costs would have been higher.
Actual (actual return after expenses)
Hypothetical (5% annual return before expenses)
Share Class
Beginning Account
Value 11/1/20
Ending Account
Value 4/30/21
Expenses Paid During
Period 11/1/20–4/30/211, 2
Ending Account
Value 4/30/21
Expenses Paid During
Period 11/1/20–4/30/211, 2
a
Net Annualized
Expense Ratio2
A $1,000 $1,213.45 $4.46 $1,020.76 $4.07 0.82%C $1,000 $1,209.23 $8.55 $1,017.05 $7.81 1.56%
R6 $1,000 $1,215.84 $2.74 $1,022.32 $2.50 0.50%Advisor $1,000 $1,215.33 $3.09 $1,022.00 $2.82 0.57%
1. Expenses are equal to the annualized expense ratio for the six-month period as indicated above—in the far right column—multiplied by the simple average account value over the period indicated, and then multiplied by 181/365 to reflect the one-half year period.2. Reflects expenses after fee waivers and expense reimbursements. Does not include acquired fund fees and expenses.
10 franklintempleton.comSemiannual Report
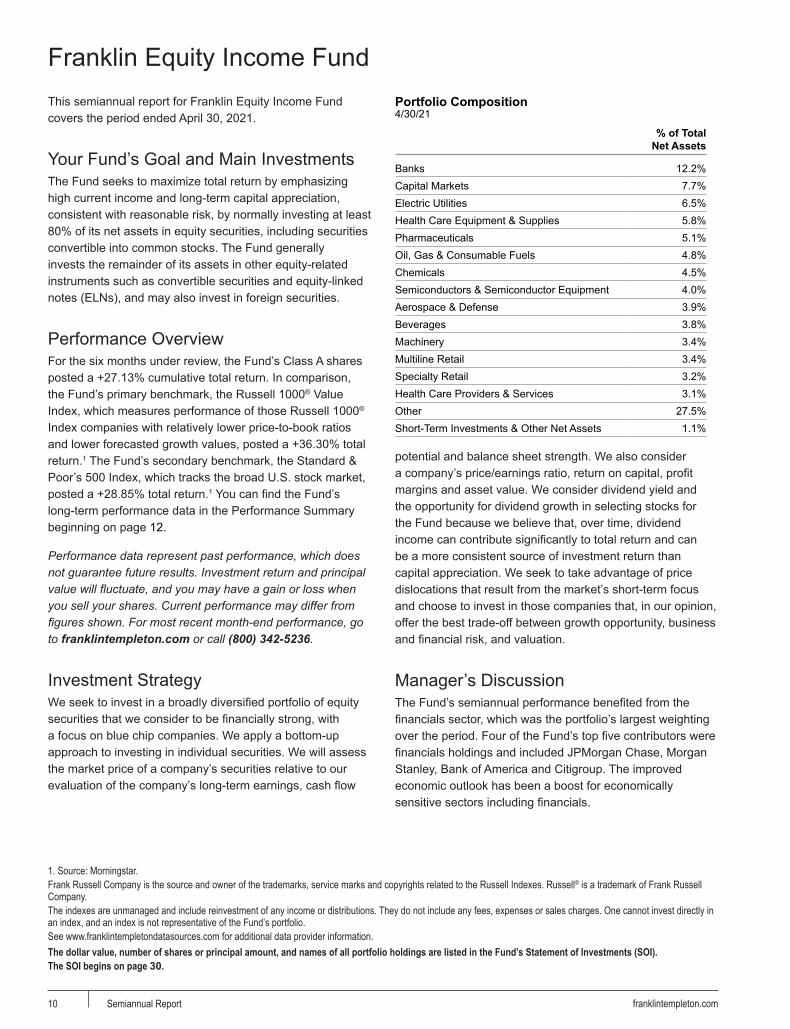
Franklin Equity Income FundThis semiannual report for Franklin Equity Income Fund covers the period ended April 30, 2021.
Your Fund’s Goal and Main InvestmentsThe Fund seeks to maximize total return by emphasizing high current income and long-term capital appreciation, consistent with reasonable risk, by normally investing at least 80% of its net assets in equity securities, including securities convertible into common stocks. The Fund generally invests the remainder of its assets in other equity-related instruments such as convertible securities and equity-linked notes (ELNs), and may also invest in foreign securities.
Performance OverviewFor the six months under review, the Fund’s Class A shares posted a +27.13% cumulative total return. In comparison, the Fund’s primary benchmark, the Russell 1000® Value Index, which measures performance of those Russell 1000®
Index companies with relatively lower price-to-book ratios and lower forecasted growth values, posted a +36.30% total return.1 The Fund’s secondary benchmark, the Standard & Poor’s 500 Index, which tracks the broad U.S. stock market, posted a +28.85% total return.1 You can find the Fund’s long-term performance data in the Performance Summary beginning on page 12.
Performance data represent past performance, which does not guarantee future results. Investment return and principal value will fluctuate, and you may have a gain or loss when you sell your shares. Current performance may differ from figures shown. For most recent month-end performance, go to franklintempleton.com or call (800) 342-5236.
Investment StrategyWe seek to invest in a broadly diversified portfolio of equity securities that we consider to be financially strong, with a focus on blue chip companies. We apply a bottom-up approach to investing in individual securities. We will assess the market price of a company’s securities relative to our evaluation of the company’s long-term earnings, cash flow
Portfolio Composition4/30/21
% of Total Net Assets
Banks 12.2% Capital Markets 7.7% Electric Utilities 6.5% Health Care Equipment & Supplies 5.8% Pharmaceuticals 5.1% Oil, Gas & Consumable Fuels 4.8% Chemicals 4.5% Semiconductors & Semiconductor Equipment 4.0% Aerospace & Defense 3.9% Beverages 3.8% Machinery 3.4% Multiline Retail 3.4% Specialty Retail 3.2% Health Care Providers & Services 3.1% Other 27.5% Short-Term Investments & Other Net Assets 1.1%
potential and balance sheet strength. We also consider a company’s price/earnings ratio, return on capital, profit margins and asset value. We consider dividend yield and the opportunity for dividend growth in selecting stocks for the Fund because we believe that, over time, dividend income can contribute significantly to total return and can be a more consistent source of investment return than capital appreciation. We seek to take advantage of price dislocations that result from the market’s short-term focus and choose to invest in those companies that, in our opinion, offer the best trade-off between growth opportunity, business and financial risk, and valuation.
Manager’s DiscussionThe Fund’s semiannual performance benefited from the financials sector, which was the portfolio’s largest weighting over the period. Four of the Fund’s top five contributors were financials holdings and included JPMorgan Chase, Morgan Stanley, Bank of America and Citigroup. The improved economic outlook has been a boost for economically sensitive sectors including financials.
1. Source: Morningstar.Frank Russell Company is the source and owner of the trademarks, service marks and copyrights related to the Russell Indexes. Russell® is a trademark of Frank Russell Company.The indexes are unmanaged and include reinvestment of any income or distributions. They do not include any fees, expenses or sales charges. One cannot invest directly in an index, and an index is not representative of the Fund’s portfolio.See www.franklintempletondatasources.com for additional data provider information.The dollar value, number of shares or principal amount, and names of all portfolio holdings are listed in the Fund’s Statement of Investments (SOI).The SOI begins on page 30.
FRANKLIN EQUITY INCOME FUND
11franklintempleton.com Semiannual Report
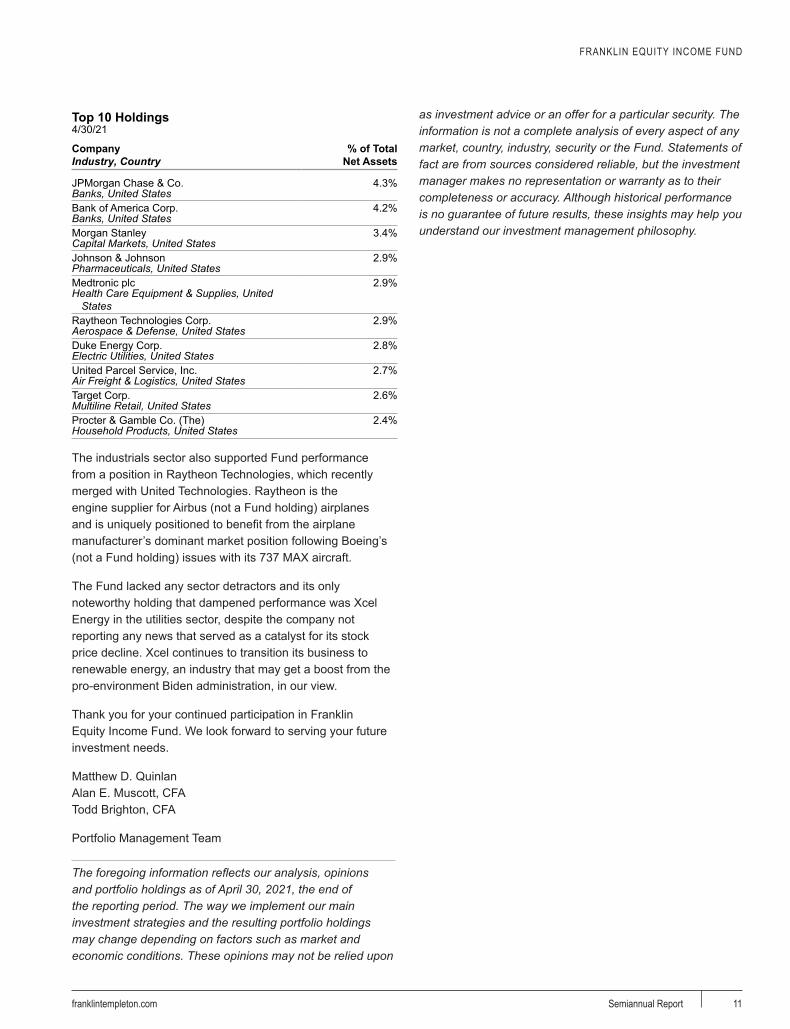
Top 10 Holdings4/30/21
Company Industry, Country
% of Total Net Assets
a a
JPMorgan Chase & Co. 4.3%Banks, United StatesBank of America Corp. 4.2%Banks, United StatesMorgan Stanley 3.4%Capital Markets, United StatesJohnson & Johnson 2.9%Pharmaceuticals, United StatesMedtronic plc 2.9%Health Care Equipment & Supplies, United
StatesRaytheon Technologies Corp. 2.9%Aerospace & Defense, United StatesDuke Energy Corp. 2.8%Electric Utilities, United StatesUnited Parcel Service, Inc. 2.7%Air Freight & Logistics, United StatesTarget Corp. 2.6%Multiline Retail, United StatesProcter & Gamble Co. (The) 2.4%Household Products, United States
The industrials sector also supported Fund performance from a position in Raytheon Technologies, which recently merged with United Technologies. Raytheon is the engine supplier for Airbus (not a Fund holding) airplanes and is uniquely positioned to benefit from the airplane manufacturer’s dominant market position following Boeing’s (not a Fund holding) issues with its 737 MAX aircraft.
The Fund lacked any sector detractors and its only noteworthy holding that dampened performance was Xcel Energy in the utilities sector, despite the company not reporting any news that served as a catalyst for its stock price decline. Xcel continues to transition its business to renewable energy, an industry that may get a boost from the pro-environment Biden administration, in our view.
Thank you for your continued participation in Franklin Equity Income Fund. We look forward to serving your future investment needs.
Matthew D. QuinlanAlan E. Muscott, CFATodd Brighton, CFA
Portfolio Management Team
The foregoing information reflects our analysis, opinions and portfolio holdings as of April 30, 2021, the end of the reporting period. The way we implement our main investment strategies and the resulting portfolio holdings may change depending on factors such as market and economic conditions. These opinions may not be relied upon
as investment advice or an offer for a particular security. The information is not a complete analysis of every aspect of any market, country, industry, security or the Fund. Statements of fact are from sources considered reliable, but the investment manager makes no representation or warranty as to their completeness or accuracy. Although historical performance is no guarantee of future results, these insights may help you understand our investment management philosophy.

Performance Summary as of April 30, 2021
FRANKLIN EQUITY INCOME FUND
12 franklintempleton.comSemiannual Report
The performance tables do not reflect any taxes that a shareholder would pay on Fund dividends, capital gain distributions, if any, or any realized gains on the sale of Fund shares. Total return reflects reinvestment of the Fund’s dividends and capital gain distributions, if any, and any unrealized gains or losses. Your dividend income will vary depending on dividends or interest paid by securities in the Fund’s portfolio, adjusted for operating expenses of each class. Capital gain distributions are net profits realized from the sale of portfolio securities.
Performance as of 4/30/211
Cumulative total return excludes sales charges. Average annual total return includes maximum sales charges. Sales charges will vary depending on the size of the investment and the class of share purchased. The maximum is 5.50% and the minimum is 0%. Class A: 5.50% maximum initial sales charge; Advisor Class: no sales charges. For other share classes, visit franklintempleton.com.
Share ClassCumulative
Total Return2Average Annual
Total Return3
–
A4
6-Month +27.13% +20.13%1-Year +37.26% +29.72%5-Year +78.18% +10.99%10-Year +169.53% +9.80%
Advisor6-Month +27.28% +27.28%1-Year +37.58% +37.58%5-Year +80.39% +12.52%10-Year +176.49% +10.71%
30-Day Standardized Yield6
Share ClassDistribution
Rate5(with fee
waiver)(without fee
waiver)
A 1.96% 1.21% 1.21%Advisor 2.30% 1.53% 1.53%
Performance data represent past performance, which does not guarantee future results. Investment return and principal value will fluctuate, and you may have a gain or loss when you sell your shares. Current performance may differ from figures shown. For most recent month-end performance, go to franklintempleton.com or call (800) 342-5236.
See page 13 for Performance Summary footnotes.

FRANKLIN EQUITY INCOME FUNDPERFORMANCE SUMMARY
13franklintempleton.com Semiannual Report
Distributions (11/1/20–4/30/21)
Share ClassNet Investment
IncomeLong-Term
Capital Gain Total
A $0.3067 $0.2184 $0.5251C $0.2064 $0.2184 $0.4248R $0.2763 $0.2184 $0.4947R6 $0.3500 $0.2184 $0.5684Advisor $0.3402 $0.2184 $0.5586
Total Annual Operating Expenses7
Share ClassWith Fee
WaiverWithout Fee
Waiver
A 0.85% 0.86%Advisor 0.60% 0.61%
Each class of shares is available to certain eligible investors and has different annual fees and expenses, as described in the prospectus.
All investments involve risks, including possible loss of principal. Stock prices fluctuate, sometimes rapidly and dramatically, due to factors affecting individual companies, particular industries or sectors, or general market conditions. Investments in ELNs often have risks similar to their underlying securities, which could include management risk, market risk and, as applicable, foreign securities and currency risks. Convertible securities are subject to the risks of stocks when the underlying stock price is high relative to the conversion price and debt securities when the underlying stock price is low relative to the conversion price. The Fund’s investment in foreign securities also involves special risks, including currency fluctuations and economic as well as political uncertainty. Events such as the spread of deadly diseases, disasters, and financial, political or social disruptions, may heighten risks and adversely affect performance. The Fund’s prospectus also includes a description of the main investment risks.
1. The Fund has a fee waiver associated with any investment it makes in a Franklin Templeton money fund and/or other Franklin Templeton fund, contractually guaranteed through 2/28/22. Fund investment results reflect the fee waiver; without this waiver, the results would have been lower.2. Cumulative total return represents the change in value of an investment over the periods indicated.3. Average annual total return represents the average annual change in value of an investment over the periods indicated. Return for less than one year, if any, has not been annualized.4. Prior to 9/10/18, these shares were offered at a higher initial sales charge of 5.75%, thus actual returns (with sales charges) would have differed. Average annual total returns (with sales charges) have been restated to reflect the current maximum initial sales charge of 5.50%. 5. Distribution rate is based on an annualization of the respective class’s current quarterly dividend and the maximum offering price (NAV for Advisor Class) per share on 4/30/21.6. The Fund’s 30-day standardized yield is calculated over a trailing 30-day period using the yield to maturity on bonds and/or the dividends accrued on stocks. It may not equal the Fund’s actual income distribution rate, which reflects the Fund’s past dividends paid to shareholders.7. Figures are as stated in the Fund’s current prospectus and may differ from the expense ratios disclosed in the Your Fund’s Expenses and Financial Highlights sections in this report. In periods of market volatility, assets may decline significantly, causing total annual Fund operating expenses to become higher than the figures shown.See www.franklintempletondatasources.com for additional data provider information.

Your Fund’s Expenses
FRANKLIN EQUITY INCOME FUND
14 franklintempleton.comSemiannual Report
As a Fund shareholder, you can incur two types of costs: (1) transaction costs, including sales charges (loads) on Fund purchases and redemptions; and (2) ongoing Fund costs, including management fees, distribution and service (12b-1) fees, and other Fund expenses. All mutual funds have ongoing costs, sometimes referred to as operating expenses. The table below shows ongoing costs of investing in the Fund and can help you understand these costs and compare them with those of other mutual funds. The table assumes a $1,000 investment held for the six months indicated.
Actual Fund ExpensesThe table below provides information about actual account values and actual expenses in the columns under the heading “Actual.” In these columns the Fund’s actual return, which includes the effect of Fund expenses, is used to calculate the “Ending Account Value” for each class of shares. You can estimate the expenses you paid during the period by following these steps (of course, your account value and expenses will differ from those in this illustration): Divide your account value by $1,000 (if your account had an $8,600 value, then $8,600 ÷ $1,000 = 8.6). Then multiply the result by the number in the row for your class of shares under the headings “Actual” and “Expenses Paid During Period” (if Actual Expenses Paid During Period were $7.50, then 8.6 x $7.50 = $64.50). In this illustration, the actual expenses paid this period are $64.50.
Hypothetical Example for Comparison with Other FundsUnder the heading “Hypothetical” in the table, information is provided about hypothetical account values and hypothetical expenses based on the Fund’s actual expense ratio and an assumed rate of return of 5% per year before expenses, which is not the Fund’s actual return. This information may not be used to estimate the actual ending account balance or expenses you paid for the period, but it can help you compare ongoing costs of investing in the Fund with those of other funds. To do so, compare this 5% hypothetical example for the class of shares you hold with the 5% hypothetical examples that appear in the shareholder reports of other funds.
Please note that expenses shown in the table are meant to highlight ongoing costs and do not reflect any transactional costs. Therefore, information under the heading “Hypothetical” is useful in comparing ongoing costs only, and will not help you compare total costs of owning different funds. In addition, if transactional costs were included, your total costs would have been higher.
Actual (actual return after expenses)
Hypothetical (5% annual return before expenses)
Share Class
Beginning Account
Value 11/1/20
Ending Account
Value 4/30/21
Expenses Paid During
Period 11/1/20–4/30/211,2
Ending Account
Value 4/30/21
Expenses Paid During
Period 11/1/20–4/30/211,2
a
Net Annualized
Expense Ratio2
A $1,000 $1,271.27 $4.75 $1,020.61 $4.23 0.84%C $1,000 $1,266.75 $8.95 $1,016.90 $7.96 1.59%R $1,000 $1,269.67 $6.07 $1,019.44 $5.40 1.08%
R6 $1,000 $1,273.09 $2.89 $1,022.25 $2.57 0.51%Advisor $1,000 $1,272.76 $3.35 $1,021.85 $2.98 0.60%
1. Expenses are equal to the annualized expense ratio for the six-month period as indicated above—in the far right column—multiplied by the simple average account value over the period indicated, and then multiplied by 181/365 to reflect the one-half year period.2. Reflects expenses after fee waivers and expense reimbursements. Does not include acquired fund fees and expenses.

15franklintempleton.com Semiannual Report
Franklin Managed Income FundThis semiannual report for Franklin Managed Income Fund covers the period ended April 30, 2021.
Your Fund’s Goal and Main InvestmentsThe Fund seeks to maximize income to support monthly distributions, while maintaining the prospects for capital appreciation by investing, under normal market conditions, in a diversified portfolio of stocks (substantially dividend paying) and debt securities. The Fund normally invests at least 25% of its total assets in debt securities, including bonds, notes, debentures and money market securities, and at least 25% of its total assets in equity securities, primarily common and preferred stock.
Performance OverviewFor the six months under review, the Fund’s Class A shares posted a cumulative total return of +17.93%. In comparison, the Fund’s primary benchmark, the Standard & Poor’s 500 Index, which is a broad measure of U.S. stock performance, posted a +28.85% total return.1 The Fund’s secondary benchmark, the Bloomberg Barclays U.S. Aggregate Bond Index, which tracks the U.S. investment-grade, taxable bond market, posted a -1.52% total return.1 The Fund’s third benchmark, the blended 50% MSCI USA High Dividend Yield Index, 25% ICE BofA U.S. Corporate & High Yield Index and 25% Bloomberg Barclays U.S. Aggregate Index (Blended Benchmark), which is a combination of leading stock and bond indexes, posted a +11.47% total return.2 The MSCI USA High Dividend Yield Index is designed to reflect the performance of equities in the MSCI USA Index (excluding REITs) with higher dividend income and quality characteristics than average dividend yields that are both sustainable and persistent. The ICE BofA U.S. Corporate & High Yield Index tracks the performance of U.S. dollar-denominated investment-grade corporate debt publicly issued in the U.S. domestic market, and below investment grade, but not in default, U.S. dollar-denominated corporate bonds publicly issued in the U.S. domestic market, and includes issues with a credit rating of BBB or below, as rated by credit rating agencies Moody’s and Standard & Poor’s. You can find the Fund’s long-term performance data in the Performance Summary beginning on page 18.
Portfolio Composition4/30/21
% of Total Net Assets
Common Stocks 41.9% Corporate Bonds 22.9% Equity-Linked Securities 17.1% Convertible Preferred Stocks 10.8% Management Investment Companies 2.6% U.S. Government and Agency Securities 1.9% Other 1.4% Short-Term Investments & Other Net Assets 1.4%
Performance data represent past performance, which does not guarantee future results. Investment return and principal value will fluctuate, and you may have a gain or loss when you sell your shares. Current performance may differ from figures shown. For most recent month-end performance, go to franklintempleton.com or call (800) 342-5236.
Investment StrategyWe apply a bottom-up approach to investing in individual securities. We will assess the market price of a company’s securities relative to our evaluation of the company’s long-term earnings, asset value and cash flow potential. We also consider a company’s price/earnings ratio, profit margins and liquidation value. In determining an optimal mix of equity and fixed income investments for the Fund, we assess changing economic, market and industry conditions. The Fund seeks income by investing in a combination of corporate, agency and government bonds issued in the U.S. and other countries, as well as common stocks of companies in any market capitalization range and convertible securities. The Fund seeks capital appreciation by investing in equity securities and convertible securities of companies from a variety of industries. The Fund also invests in equity-linked notes, which are hybrid derivative-type instruments designed to combine the characteristics of one or more securities (usually a single stock, a stock index or a basket of stocks) and a related equity derivative. We may, from time to time, use for various purposes equity-related derivatives, including call and put options and futures on equity securities and equity indexes, options on equity index futures, as well as interest-rate, currency and credit-related derivatives.
1. Source: Morningstar.2. Source: FactSet. The Blended Benchmark was calculated internally.The indexes are unmanaged and include reinvestment of any income or distributions. One cannot invest directly in an index, and an index is not representative of the Fund’s portfolio.See www.franklintempletondatasources.com for additional data provider information.The dollar value, number of shares or principal amount, and names of all portfolio holdings are listed in the Fund’s Statement of Investments (SOI).The SOI begins on page 45.
FRANKLIN MANAGED INCOME FUND
16 franklintempleton.comSemiannual Report
These purposes include enhancing Fund returns, increasing liquidity, gaining exposure to securities or markets in more efficient or less expensive ways and/or hedging risks.
Manager’s DiscussionDuring the six-month period, the Fund exhibited strong performance across equity and fixed income sectors. Increased Fund exposure to the equity markets helped drive strong returns while lower exposure to interest-rate sensitive fixed income securities led to strong Fund performance relative to its blended benchmark.
Dividend stocks, particularly those in value-oriented sectors, outperformed during the period under review, and the equity component of the Fund’s blended benchmark increased, with the MSCI USA High Dividend Yield Index posting a +24.15% return for the six-month period.1 The Fund’s equity positions exceeded these returns during the period. Corporate credit spreads continued to narrow as economic reopening and the lingering positive effects of the record fiscal and monetary accommodation continued to support markets. Offsetting narrowing credit spreads were rising interest rates, which weighed on the more duration-sensitive portions of the Fund’s benchmark. Fixed income returns for the Fund during the period also exceeded the Fund’s blended fixed income benchmark (Bloomberg Barclays U.S. Aggregate Bond Index and ICE BofAML U.S. Corporate & High Yield Index).
The Fund entered the period with roughly a two-to-one ratio of equities to fixed income and a modest cash position after making a meaningful asset-mix shift earlier in 2020, which resulted in a reduction in the fixed income weighting and an increase in equity weighting. This shift continued over the period under review, with the equity weighting ending the period at close to three quarters of the Fund’s assets, and fixed income exposure down to around one quarter of assets (while further decreasing cash equivalents).
Fixed income holdings posted positive returns during the period with outperformance relative to the Fund’s blended fixed income benchmark. The Fund’s duration positioning at the front end of the yield curve in the face of rising interest rates during the period was a key source driving the outperformance (U.S. 10-year Treasury yields increased from 0.88% at the start of the period to 1.65% at period-end). As an asset class, fixed income underperformed the equity asset class, which benefited the Fund given our underweighted allocation to fixed income relative to the Fund’s blended benchmark.
Energy was the largest absolute sector performer in the period under review along with strong performance from the
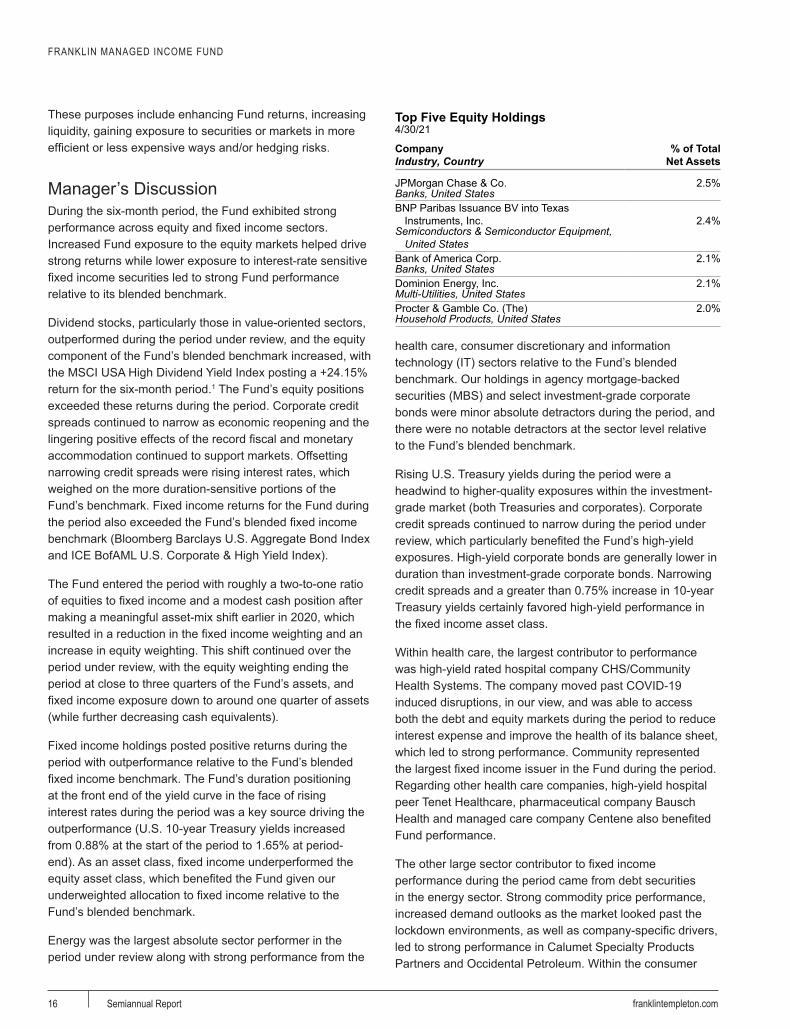
Top Five Equity Holdings4/30/21
Company Industry, Country
% of Total Net Assets
a a
JPMorgan Chase & Co. 2.5%Banks, United StatesBNP Paribas Issuance BV into Texas
Instruments, Inc. 2.4%Semiconductors & Semiconductor Equipment,
United StatesBank of America Corp. 2.1%Banks, United StatesDominion Energy, Inc. 2.1%Multi-Utilities, United StatesProcter & Gamble Co. (The) 2.0%Household Products, United States
health care, consumer discretionary and information technology (IT) sectors relative to the Fund’s blended benchmark. Our holdings in agency mortgage-backed securities (MBS) and select investment-grade corporate bonds were minor absolute detractors during the period, and there were no notable detractors at the sector level relative to the Fund’s blended benchmark.
Rising U.S. Treasury yields during the period were a headwind to higher-quality exposures within the investment-grade market (both Treasuries and corporates). Corporate credit spreads continued to narrow during the period under review, which particularly benefited the Fund’s high-yield exposures. High-yield corporate bonds are generally lower in duration than investment-grade corporate bonds. Narrowing credit spreads and a greater than 0.75% increase in 10-year Treasury yields certainly favored high-yield performance in the fixed income asset class.
Within health care, the largest contributor to performance was high-yield rated hospital company CHS/Community Health Systems. The company moved past COVID-19 induced disruptions, in our view, and was able to access both the debt and equity markets during the period to reduce interest expense and improve the health of its balance sheet, which led to strong performance. Community represented the largest fixed income issuer in the Fund during the period. Regarding other health care companies, high-yield hospital peer Tenet Healthcare, pharmaceutical company Bausch Health and managed care company Centene also benefited Fund performance.
The other large sector contributor to fixed income performance during the period came from debt securities in the energy sector. Strong commodity price performance, increased demand outlooks as the market looked past the lockdown environments, as well as company-specific drivers, led to strong performance in Calumet Specialty Products Partners and Occidental Petroleum. Within the consumer

FRANKLIN MANAGED INCOME FUND
17franklintempleton.com Semiannual Report
discretionary sector, the strength of the consumer and the outlook for an economic reopening led to strong performance from bonds of Ford Motor Credit, United Airlines, Wynn Las Vegas and Las Vegas Sands.
Top Five Fixed Income Holdings4/30/21
Company Industry, Country
% of Total Net Assets
a a
CHS/Community Health Systems Inc 2.0%Health Care Providers & Services, United StatesUnited States of America 1.9%Diversified Financial Services, United StatesCentene Corp 0.9%Health Care Providers & Services, United StatesCVS Health Corp 0.8%Health Care Providers & Services, United StatesGovernment National Mortgage Association 0.8%Diversified Financial Services, United States
Agency MBS holdings were small absolute detractors during the period as described above. Other detractors during the period were mostly bonds of investment-grade companies with intermediate maturity/duration profiles. Some of these included bonds of consumer staples companies Walmart, Anheuser-Busch and Clorox (not held at period-end). Another minor detractor was Vistra Energy, which was negatively impacted by heavy winter storm weather in Texas during the period.
Equity holdings increased over the reporting period. As an asset class, equities outperformed fixed income during the period. We used considerable equity market weakness earlier in 2020 to shift assets out of fixed income and into equities. Dividend-paying companies, which had lagged leading up to the period under review, were strong performers during the period. We continued to selectively add to positions across the equity markets during the period, including common stocks, convertible securities and equity linked notes.
All equity sectors were positive absolute contributors to Fund performance during the period. Financials and energy holdings were large positive absolute contributors (also large contributors relative to the Fund’s equity benchmark), and the Fund’s industrials, materials, IT and consumer discretionary holdings provided notable positive contributions as well. All the Fund’s equity positions in the financials sector were positive contributors during the period amid rising interest rates. Holdings in Bank of America, JPMorgan Chase and Morgan Stanley led returns. Other notable contributors included Truist Financial, U.S. Bancorp and Citigroup. Energy peers Chevron and Exxon were notable positive contributors during the period, as a much better supply and demand forecast for the industry led to strong
performance from depressed valuations. Top performers in the Fund outside of financials and energy were Raytheon Technology and Honeywell International within the industrials sector as well as IT company Cisco Systems.
Despite positive absolute contributions, equity holdings in the consumer staples and health care sectors were modest detractors during the period relative to the Fund’s equity benchmark. At the individual security level, we had minor negative performance from consumer staples giant Procter & Gamble and electric utility company American Electric Power. There were no other notable individual detractors from absolute performance.
During the period, the Fund used derivatives such as equity call and put options to sell and reduce positions and/or to initiate and add to positions which generated gains during the period under review.
Thank you for your continued participation in Franklin Managed Income Fund. We look forward to serving your future investment needs.
Edward D. Perks, CFACo-Lead Portfolio Manager
Brendan Circle, CFACo-Lead Portfolio Manager
Todd Brighton, CFAPortfolio Manager
The foregoing information reflects our analysis, opinions and portfolio holdings as of April 30, 2021, the end of the reporting period. The way we implement our main investment strategies and the resulting portfolio holdings may change depending on factors such as market and economic conditions. These opinions may not be relied upon as investment advice or an offer for a particular security. The information is not a complete analysis of every aspect of any market, country, industry, security or the Fund. Statements of fact are from sources considered reliable, but the investment manager makes no representation or warranty as to their completeness or accuracy. Although historical performance is no guarantee of future results, these insights may help you understand our investment management philosophy.

Performance Summary as of April 30, 2021
FRANKLIN MANAGED INCOME FUND
18 franklintempleton.comSemiannual Report
The performance tables do not reflect any taxes that a shareholder would pay on Fund dividends, capital gain distributions, if any, or any realized gains on the sale of Fund shares. Total return reflects reinvestment of the Fund’s dividends and capital gain distributions, if any, and any unrealized gains or losses. Your dividend income will vary depending on dividends or interest paid by securities in the Fund’s portfolio, adjusted for operating expenses of each class. Capital gain distributions are net profits realized from the sale of portfolio securities.
Performance as of 4/30/211
Cumulative total return excludes sales charges. Average annual total return includes maximum sales charges. Sales charges will vary depending on the size of the investment and the class of share purchased. The maximum is 5.50% and the minimum is 0%. Class A: 5.50% maximum initial sales charge; Advisor Class: no sales charges. For other share classes, visit franklintempleton.com.
Share ClassCumulative
Total Return2Average Annual
Total Return3
–
A4
6-Month +17.93% +11.47%1-Year +23.03% +16.24%5-Year +52.47% +7.58%10-Year +106.27% +6.91%
Advisor6-Month +18.12% +18.12%1-Year +23.38% +23.38%5-Year +54.47% +9.09%10-Year +111.96% +7.80%
30-Day Standardized Yield6
Share ClassDistribution
Rate5(with fee
waiver)(without fee
waiver)
A 3.33% 1.46% 1.46%Advisor 3.75% 1.80% 1.80%
Performance data represent past performance, which does not guarantee future results. Investment return and principal value will fluctuate, and you may have a gain or loss when you sell your shares. Current performance may differ from figures shown. For most recent month-end performance, go to franklintempleton.com or call (800) 342-5236.
See page 19 for Performance Summary footnotes.

FRANKLIN MANAGED INCOME FUNDPERFORMANCE SUMMARY
19franklintempleton.com Semiannual Report
Net Asset Value Share Class (Symbol) 4/30/21 10/31/20 Change
A (FBLAX) $13.49 $11.73 +$1.76 C (FBMCX) $13.35 $11.61 +$1.74 R (FBFQX) $13.54 $11.76 +$1.78 R6 (FBFRX) $13.54 $11.76 +$1.78Advisor (FBFZX) $13.53 $11.76 +$1.77
Distributions (11/1/20–4/30/21)
Share ClassNet Investment
IncomeLong-Term
Capital Gain Total
A $0.2370 $0.0860 $0.3230C $0.1874 $0.0860 $0.2734R $0.2216 $0.0860 $0.3076R6 $0.2586 $0.0860 $0.3446Advisor $0.2534 $0.0860 $0.3394
Total Annual Operating Expenses7
Share ClassWith Fee
WaiverWithout Fee
Waiver
A 0.93% 0.94%Advisor 0.68% 0.69%
Each class of shares is available to certain eligible investors and has different annual fees and expenses, as described in the prospectus.
All investments involve risks, including possible loss of principal. The Fund’s share price and yield will be affected by interest rate movements. Bond prices generally move in the opposite direction of interest rates. As the prices of bonds in the Fund adjust to a rise in interest rates, the Fund’s share price may decline. Stock prices fluctuate, sometimes rapidly and dramatically, due to factors affecting individual companies, particular industries or sectors, or general market conditions. Events such as the spread of deadly diseases, disasters, and financial, political or social disruptions, may heighten risks and adversely affect perfor-mance. The Fund’s prospectus also includes a description of the main investment risks.
The Fund is not guaranteed to achieve its investment goal of making monthly distributions, while maintaining prospects for capital appreciation nor is there any guarantee that the Fund will provide sufficient income at or through the investor’s retirement. In addition, some of its distributions may be treated in part as a return of capital, which will decrease shareholders’ cost basis in the Fund and affect the amount of any capital gain or loss that they realize when selling or exchanging fund shares. The annual payout rate may be adjusted higher or lower from year to year and could vary substantially over time. It is possible for the Fund to suffer substantial investment losses and simultaneously experience additional asset reductions as a result of its distributions to shareholders under the managed distribution policy. Investors who hold the Fund within a tax-advantaged retirement account should consult their tax advisors to discuss tax consequences of receiving cash distributions. In addition, use of the Fund or election of the option to receive distribution payments in cash may be restricted in certain retirement plans by the terms of the governing plan documents and/or the discretion of the plan administrator. Investors are strongly advised to consult with their financial advisor for assistance before selecting the appropriate fund, based on their goals and personal situations, including time horizon, retirement income needs, risk tolerance and tax bracket.
1. The Fund has an expense reduction and a fee waiver associated with any investments it makes in a Franklin Templeton money fund and/or other Franklin Templeton fund, contractually guaranteed through 2/28/22. Fund investment results reflect the expense reduction and fee waiver; without these reductions, the results would have been lower. 2. Cumulative total return represents the change in value of an investment over the periods indicated.3. Average annual total return represents the average annual change in value of an investment over the periods indicated. Return for less than one year, if any, has not been annualized.4. Prior to 9/10/18, these shares were offered at a higher initial sales charge of 5.75%, thus actual returns (with sales charges) would have differed. Average annual total returns (with sales charges) have been restated to reflect the current maximum initial sales charge of 5.50%. 5. Distribution rate is based on an annualization of the respective class’s April dividend and the maximum offering price (NAV for Advisor Class) per share on 4/30/21.6. The Fund’s 30-day standardized yield is calculated over a trailing 30-day period using the yield to maturity on bonds and/or the dividends accrued on stocks. It may not equal the Fund’s actual income distribution rate, which reflects the Fund’s past dividends paid to shareholders.7. Figures are as stated in the Fund’s current prospectus and may differ from the expense ratios disclosed in the Your Fund’s Expenses and Financial Highlights sections in this report. In periods of market volatility, assets may decline significantly, causing total annual Fund operating expenses to become higher than the figures shown.See www.franklintempletondatasources.com for additional data provider information.

Your Fund’s Expenses
FRANKLIN MANAGED INCOME FUND
20 franklintempleton.comSemiannual Report
As a Fund shareholder, you can incur two types of costs: (1) transaction costs, including sales charges (loads) on Fund purchases and redemptions; and (2) ongoing Fund costs, including management fees, distribution and service (12b-1) fees, and other Fund expenses. All mutual funds have ongoing costs, sometimes referred to as operating expenses. The table below shows ongoing costs of investing in the Fund and can help you understand these costs and compare them with those of other mutual funds. The table assumes a $1,000 investment held for the six months indicated.
Actual Fund ExpensesThe table below provides information about actual account values and actual expenses in the columns under the heading “Actual.” In these columns the Fund’s actual return, which includes the effect of Fund expenses, is used to calculate the “Ending Account Value” for each class of shares. You can estimate the expenses you paid during the period by following these steps (of course, your account value and expenses will differ from those in this illustration): Divide your account value by $1,000 (if your account had an $8,600 value, then $8,600 ÷ $1,000 = 8.6). Then multiply the result by the number in the row for your class of shares under the headings “Actual” and “Expenses Paid During Period” (if Actual Expenses Paid During Period were $7.50, then 8.6 x $7.50 = $64.50). In this illustration, the actual expenses paid this period are $64.50.
Hypothetical Example for Comparison with Other FundsUnder the heading “Hypothetical” in the table, information is provided about hypothetical account values and hypothetical expenses based on the Fund’s actual expense ratio and an assumed rate of return of 5% per year before expenses, which is not the Fund’s actual return. This information may not be used to estimate the actual ending account balance or expenses you paid for the period, but it can help you compare ongoing costs of investing in the Fund with those of other funds. To do so, compare this 5% hypothetical example for the class of shares you hold with the 5% hypothetical examples that appear in the shareholder reports of other funds.
Please note that expenses shown in the table are meant to highlight ongoing costs and do not reflect any transactional costs. Therefore, information under the heading “Hypothetical” is useful in comparing ongoing costs only, and will not help you compare total costs of owning different funds. In addition, if transactional costs were included, your total costs would have been higher.
Actual (actual return after expenses)
Hypothetical (5% annual return before expenses)
Share Class
Beginning Account
Value 11/1/20
Ending Account
Value 4/30/21
Expenses Paid During
Period 11/1/20–4/30/21, 2
Ending Account
Value 4/30/21
Expenses Paid During
Period 11/1/20–4/30/211, 2
a
Net Annualized
Expense Ratio2
A $1,000 $1,179.30 $4.90 $1,020.30 $4.54 0.91%C $1,000 $1,174.88 $8.91 $1,016.60 $8.26 1.66%R $1,000 $1,179.16 $6.24 $1,019.07 $5.78 1.16%
R6 $1,000 $1,182.52 $3.17 $1,021.89 $2.94 0.59%Advisor $1,000 $1,181.20 $3.55 $1,021.54 $3.29 0.67%
1. Expenses are equal to the annualized expense ratio for the six-month period as indicated above—in the far right column—multiplied by the simple average account value over the period indicated, and then multiplied by 181/365 to reflect the one-half year period.2. Reflects expenses after fee waivers and expense reimbursements. Does not include acquired fund fees and expenses.
FRANKLIN INVESTORS SECURITIES TRUST
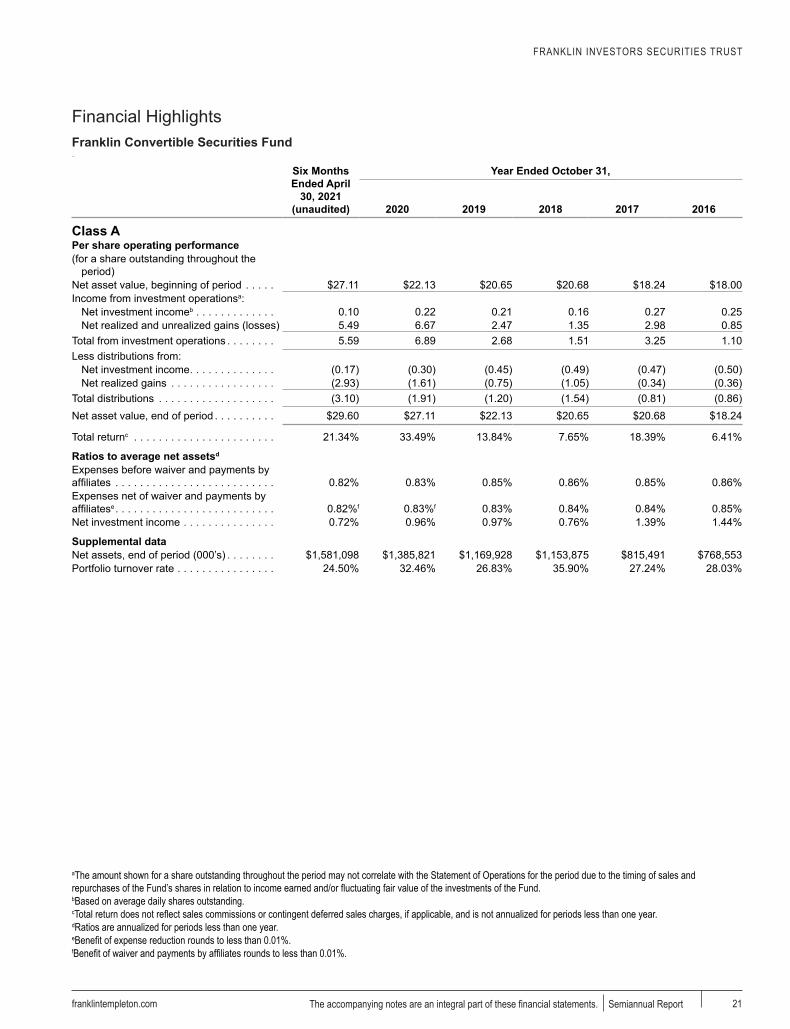
Financial HighlightsFranklin Convertible Securities Fund
franklintempleton.com The accompanying notes are an integral part of these financial statements. Semiannual Report 21
Ratio
a
Six Months Ended April
30, 2021 (unaudited)
Year Ended October 31,
2020 2019 2018 2017 2016
Class APer share operating performance(for a share outstanding throughout the
period)Net asset value, beginning of period . . . . . $27.11 $22.13 $20.65 $20.68 $18.24 $18.00Income from investment operationsa:
Net investment incomeb . . . . . . . . . . . . . 0.10 0.22 0.21 0.16 0.27 0.25Net realized and unrealized gains (losses) 5.49 6.67 2.47 1.35 2.98 0.85
Total from investment operations . . . . . . . . 5.59 6.89 2.68 1.51 3.25 1.10Less distributions from:
Net investment income . . . . . . . . . . . . . . (0.17) (0.30) (0.45) (0.49) (0.47) (0.50)Net realized gains . . . . . . . . . . . . . . . . . (2.93) (1.61) (0.75) (1.05) (0.34) (0.36)
Total distributions . . . . . . . . . . . . . . . . . . . (3.10) (1.91) (1.20) (1.54) (0.81) (0.86)Net asset value, end of period . . . . . . . . . . $29.60 $27.11 $22.13 $20.65 $20.68 $18.24
Total returnc . . . . . . . . . . . . . . . . . . . . . . . 21.34% 33.49% 13.84% 7.65% 18.39% 6.41%
Ratios to average net assetsd
Expenses before waiver and payments by affiliates . . . . . . . . . . . . . . . . . . . . . . . . . . 0.82% 0.83% 0.85% 0.86% 0.85% 0.86%Expenses net of waiver and payments by affiliatese . . . . . . . . . . . . . . . . . . . . . . . . . . 0.82%f 0.83%f 0.83% 0.84% 0.84% 0.85%Net investment income . . . . . . . . . . . . . . . 0.72% 0.96% 0.97% 0.76% 1.39% 1.44%
Supplemental dataNet assets, end of period (000’s) . . . . . . . . $1,581,098 $1,385,821 $1,169,928 $1,153,875 $815,491 $768,553Portfolio turnover rate . . . . . . . . . . . . . . . . 24.50% 32.46% 26.83% 35.90% 27.24% 28.03%
aThe amount shown for a share outstanding throughout the period may not correlate with the Statement of Operations for the period due to the timing of sales and repurchases of the Fund’s shares in relation to income earned and/or fluctuating fair value of the investments of the Fund.bBased on average daily shares outstanding.cTotal return does not reflect sales commissions or contingent deferred sales charges, if applicable, and is not annualized for periods less than one year.dRatios are annualized for periods less than one year.eBenefit of expense reduction rounds to less than 0.01%.fBenefit of waiver and payments by affiliates rounds to less than 0.01%.

FRANKLIN INVESTORS SECURITIES TRUSTFINANCIAL HIGHLIGHTS
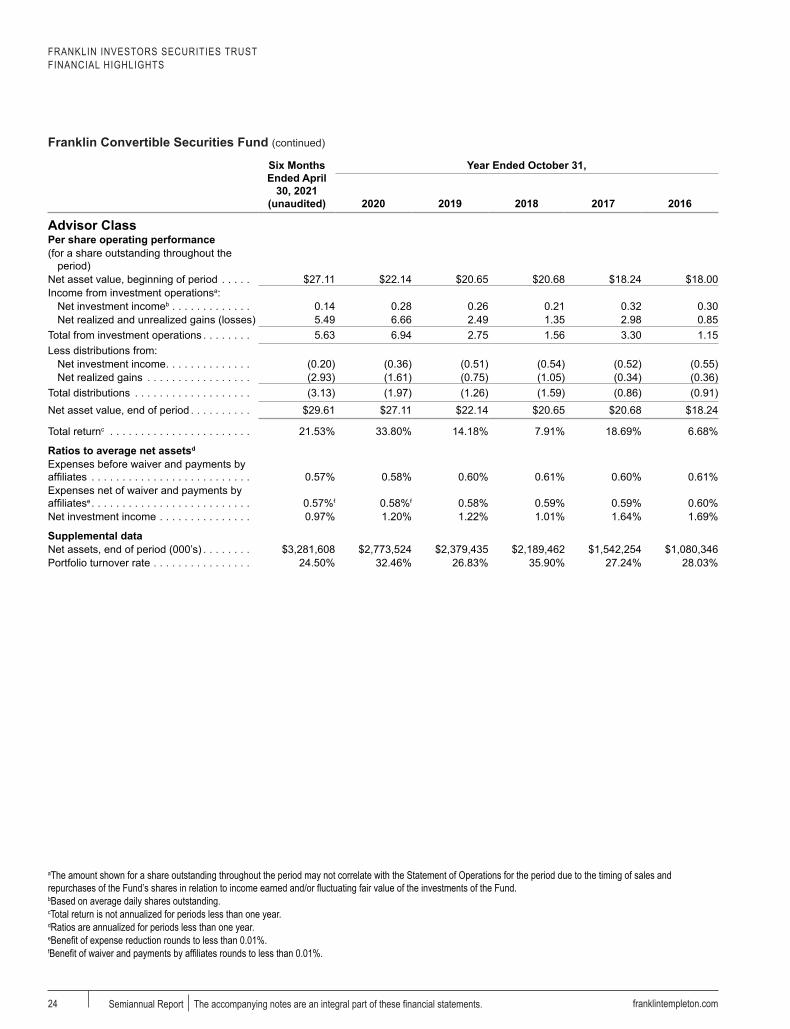
Franklin Convertible Securities Fund (continued)
franklintempleton.comSemiannual Report The accompanying notes are an integral part of these financial statements.22
a
Six Months Ended April
30, 2021 (unaudited)
Year Ended October 31,
2020 2019 2018 2017 2016
Class CPer share operating performance(for a share outstanding throughout the
period)Net asset value, beginning of period . . . . . $26.66 $21.77 $20.31 $20.37 $17.98 $17.75Income from investment operationsa:
Net investment income (loss)b . . . . . . . . (—)c 0.05 0.04 (—)c 0.12 0.12Net realized and unrealized gains (losses) 5.39 6.56 2.45 1.33 2.93 0.84
Total from investment operations . . . . . . . . 5.39 6.61 2.49 1.33 3.05 0.96Less distributions from:
Net investment income . . . . . . . . . . . . . . (0.06) (0.11) (0.28) (0.34) (0.32) (0.37)Net realized gains . . . . . . . . . . . . . . . . . (2.93) (1.61) (0.75) (1.05) (0.34) (0.36)
Total distributions . . . . . . . . . . . . . . . . . . . (2.99) (1.72) (1.03) (1.39) (0.66) (0.73)Net asset value, end of period . . . . . . . . . . $29.06 $26.66 $21.77 $20.31 $20.37 $17.98
Total returnd . . . . . . . . . . . . . . . . . . . . . . . 20.92% 32.48% 13.03% 6.84% 17.49% 5.65%
Ratios to average net assetse
Expenses before waiver and payments by affiliates . . . . . . . . . . . . . . . . . . . . . . . . . . 1.56% 1.59% 1.60% 1.61% 1.60% 1.61%Expenses net of waiver and payments by affiliatesf . . . . . . . . . . . . . . . . . . . . . . . . . . 1.56%g 1.58% 1.58% 1.59% 1.59% 1.60%Net investment income (loss) . . . . . . . . . . (0.03)% 0.21% 0.22% 0.01% 0.64% 0.69%
Supplemental dataNet assets, end of period (000’s) . . . . . . . . $243,666 $233,295 $256,075 $299,716 $303,243 $293,038Portfolio turnover rate . . . . . . . . . . . . . . . . 24.50% 32.46% 26.83% 35.90% 27.24% 28.03%
aThe amount shown for a share outstanding throughout the period may not correlate with the Statement of Operations for the period due to the timing of sales and repurchases of the Fund’s shares in relation to income earned and/or fluctuating fair value of the investments of the Fund.bBased on average daily shares outstanding.cAmount rounds to less than $0.01 per share.dTotal return does not reflect sales commissions or contingent deferred sales charges, if applicable, and is not annualized for periods less than one year.eRatios are annualized for periods less than one year.fBenefit of expense reduction rounds to less than 0.01%.gBenefit of waiver and payments by affiliates rounds to less than 0.01%.

FRANKLIN INVESTORS SECURITIES TRUSTFINANCIAL HIGHLIGHTS
Franklin Convertible Securities Fund (continued)
franklintempleton.com The accompanying notes are an integral part of these financial statements. Semiannual Report 23
a
Six Months Ended April
30, 2021 (unaudited)
Year Ended October 31,
2020 2019 2018 2017 2016
Class R6Per share operating performance(for a share outstanding throughout the
period)Net asset value, beginning of period . . . . . $27.29 $22.28 $20.78 $20.79 $18.33 $18.09Income from investment operationsa:
Net investment incomeb . . . . . . . . . . . . . 0.15 0.31 0.28 0.24 0.34 0.33Net realized and unrealized gains (losses) 5.53 6.69 2.50 1.36 3.00 0.84
Total from investment operations . . . . . . . . 5.68 7.00 2.78 1.60 3.34 1.17Less distributions from:
Net investment income . . . . . . . . . . . . . . (0.21) (0.38) (0.53) (0.56) (0.54) (0.57)Net realized gains . . . . . . . . . . . . . . . . . (2.93) (1.61) (0.75) (1.05) (0.34) (0.36)
Total distributions . . . . . . . . . . . . . . . . . . . (3.14) (1.99) (1.28) (1.61) (0.88) (0.93)Net asset value, end of period . . . . . . . . . . $29.83 $27.29 $22.28 $20.78 $20.79 $18.33
Total returnc . . . . . . . . . . . . . . . . . . . . . . . 21.58% 33.89% 14.26% 8.07% 18.84% 6.78%
Ratios to average net assetsd
Expenses before waiver and payments by affiliates . . . . . . . . . . . . . . . . . . . . . . . . . . 0.52% 0.55% 0.54% 0.55% 0.49% 0.50%Expenses net of waiver and payments by affiliatese . . . . . . . . . . . . . . . . . . . . . . . . . . 0.50% 0.50% 0.49% 0.49% 0.48% 0.49%Net investment income . . . . . . . . . . . . . . . 1.03% 1.30% 1.31% 1.11% 1.75% 1.80%
Supplemental dataNet assets, end of period (000’s) . . . . . . . . $128,424 $113,642 $51,791 $57,824 $22,950 $7,154Portfolio turnover rate . . . . . . . . . . . . . . . . 24.50% 32.46% 26.83% 35.90% 27.24% 28.03%
aThe amount shown for a share outstanding throughout the period may not correlate with the Statement of Operations for the period due to the timing of sales and repurchases of the Fund’s shares in relation to income earned and/or fluctuating fair value of the investments of the Fund.bBased on average daily shares outstanding.cTotal return is not annualized for periods less than one year.dRatios are annualized for periods less than one year.eBenefit of expense reduction rounds to less than 0.01%.
FRANKLIN INVESTORS SECURITIES TRUSTFINANCIAL HIGHLIGHTS
Franklin Convertible Securities Fund (continued)
franklintempleton.comSemiannual Report The accompanying notes are an integral part of these financial statements.24
a
Six Months Ended April
30, 2021 (unaudited)
Year Ended October 31,
2020 2019 2018 2017 2016
Advisor ClassPer share operating performance(for a share outstanding throughout the
period)Net asset value, beginning of period . . . . . $27.11 $22.14 $20.65 $20.68 $18.24 $18.00Income from investment operationsa:
Net investment incomeb . . . . . . . . . . . . . 0.14 0.28 0.26 0.21 0.32 0.30Net realized and unrealized gains (losses) 5.49 6.66 2.49 1.35 2.98 0.85
Total from investment operations . . . . . . . . 5.63 6.94 2.75 1.56 3.30 1.15Less distributions from:
Net investment income . . . . . . . . . . . . . . (0.20) (0.36) (0.51) (0.54) (0.52) (0.55)Net realized gains . . . . . . . . . . . . . . . . . (2.93) (1.61) (0.75) (1.05) (0.34) (0.36)
Total distributions . . . . . . . . . . . . . . . . . . . (3.13) (1.97) (1.26) (1.59) (0.86) (0.91)Net asset value, end of period . . . . . . . . . . $29.61 $27.11 $22.14 $20.65 $20.68 $18.24
Total returnc . . . . . . . . . . . . . . . . . . . . . . . 21.53% 33.80% 14.18% 7.91% 18.69% 6.68%
Ratios to average net assetsd
Expenses before waiver and payments by affiliates . . . . . . . . . . . . . . . . . . . . . . . . . . 0.57% 0.58% 0.60% 0.61% 0.60% 0.61%Expenses net of waiver and payments by affiliatese . . . . . . . . . . . . . . . . . . . . . . . . . . 0.57%f 0.58%f 0.58% 0.59% 0.59% 0.60%Net investment income . . . . . . . . . . . . . . . 0.97% 1.20% 1.22% 1.01% 1.64% 1.69%
Supplemental dataNet assets, end of period (000’s) . . . . . . . . $3,281,608 $2,773,524 $2,379,435 $2,189,462 $1,542,254 $1,080,346Portfolio turnover rate . . . . . . . . . . . . . . . . 24.50% 32.46% 26.83% 35.90% 27.24% 28.03%
aThe amount shown for a share outstanding throughout the period may not correlate with the Statement of Operations for the period due to the timing of sales and repurchases of the Fund’s shares in relation to income earned and/or fluctuating fair value of the investments of the Fund.bBased on average daily shares outstanding.cTotal return is not annualized for periods less than one year.dRatios are annualized for periods less than one year.eBenefit of expense reduction rounds to less than 0.01%.fBenefit of waiver and payments by affiliates rounds to less than 0.01%.

FRANKLIN INVESTORS SECURITIES TRUST
Statement of Investments (unaudited), April 30, 2021Franklin Convertible Securities Fund
franklintempleton.com The accompanying notes are an integral part of these financial statements. Semiannual Report 25
a a Country Shares a Valuea a a a a a
Common Stocks 0.3%Gas Utilities 0.3%South Jersey Industries, Inc. . . . . . . . . . . . . . . . . . . . . . . . . . . . . . United States 613,259 $15,178,160
Total Common Stocks (Cost $18,974,979) . . . . . . . . . . . . . . . . . . . . . . . . . . . . . . . . . . . . . . 15,178,160
Convertible Preferred Stocks 20.5%Auto Components 1.7%Aptiv plc, 5.5%, A . . . . . . . . . . . . . . . . . . . . . . . . . . . . . . . . . . . . . United States 530,000 86,549,000
Capital Markets 1.9%KKR & Co., Inc., 6%, C . . . . . . . . . . . . . . . . . . . . . . . . . . . . . . . . . United States 1,360,000 101,972,800
Chemicals 1.1%International Flavors & Fragrances, Inc., 6% . . . . . . . . . . . . . . . . . United States 1,192,242 59,075,591
Electric Utilities 3.5%American Electric Power Co., Inc., 6.125% . . . . . . . . . . . . . . . . . . United States 440,000 22,083,600American Electric Power Co., Inc., 6.125% . . . . . . . . . . . . . . . . . . United States 600,000 30,708,000NextEra Energy, Inc., 5.279% . . . . . . . . . . . . . . . . . . . . . . . . . . . . United States 1,100,000 55,407,000PG&E Corp., 5.5% . . . . . . . . . . . . . . . . . . . . . . . . . . . . . . . . . . . . United States 430,000 47,467,700Southern Co. (The), 6.75%, 2019 . . . . . . . . . . . . . . . . . . . . . . . . . United States 550,000 28,820,000
184,486,300
Food Products 1.4%Bunge Ltd., 4.875% . . . . . . . . . . . . . . . . . . . . . . . . . . . . . . . . . . . United States 630,000 74,340,000
Health Care Equipment & Supplies 2.1%Danaher Corp., 4.75%, A . . . . . . . . . . . . . . . . . . . . . . . . . . . . . . . . United States 54,000 92,529,540
aDanaher Corp., 5%, B . . . . . . . . . . . . . . . . . . . . . . . . . . . . . . . . . . United States 14,045 19,884,209
112,413,749
Health Care Technology 0.4%Change Healthcare, Inc., 6% . . . . . . . . . . . . . . . . . . . . . . . . . . . . . United States 300,000 22,962,000
Life Sciences Tools & Services 1.6%Avantor, Inc., 6.25%, A . . . . . . . . . . . . . . . . . . . . . . . . . . . . . . . . . United States 820,000 81,048,800
Machinery 0.7%Fortive Corp., 5%, A . . . . . . . . . . . . . . . . . . . . . . . . . . . . . . . . . . . United States 34,350 34,126,725
Multi-Utilities 2.1%DTE Energy Co., 6.25% . . . . . . . . . . . . . . . . . . . . . . . . . . . . . . . . United States 800,000 40,592,000
bNiSource, Inc., 7.75% . . . . . . . . . . . . . . . . . . . . . . . . . . . . . . . . . . United States 450,000 48,190,500Sempra Energy, 6.75%, B . . . . . . . . . . . . . . . . . . . . . . . . . . . . . . . United States 206,000 21,617,640
110,400,140
Semiconductors & Semiconductor Equipment 2.0%Broadcom, Inc., 8%, A . . . . . . . . . . . . . . . . . . . . . . . . . . . . . . . . . . United States 71,100 103,055,895
Water Utilities 0.9%Essential Utilities, Inc., 6% . . . . . . . . . . . . . . . . . . . . . . . . . . . . . . United States 770,000 45,514,700
Wireless Telecommunication Services 1.1%b,c2020 Cash Mandatory Exchangeable Trust, 144A, 5.25% . . . . . . . United States 48,000 56,487,840
b
Total Convertible Preferred Stocks (Cost $853,432,993) . . . . . . . . . . . . . . . . . . . . . . . . . . 1,072,433,540
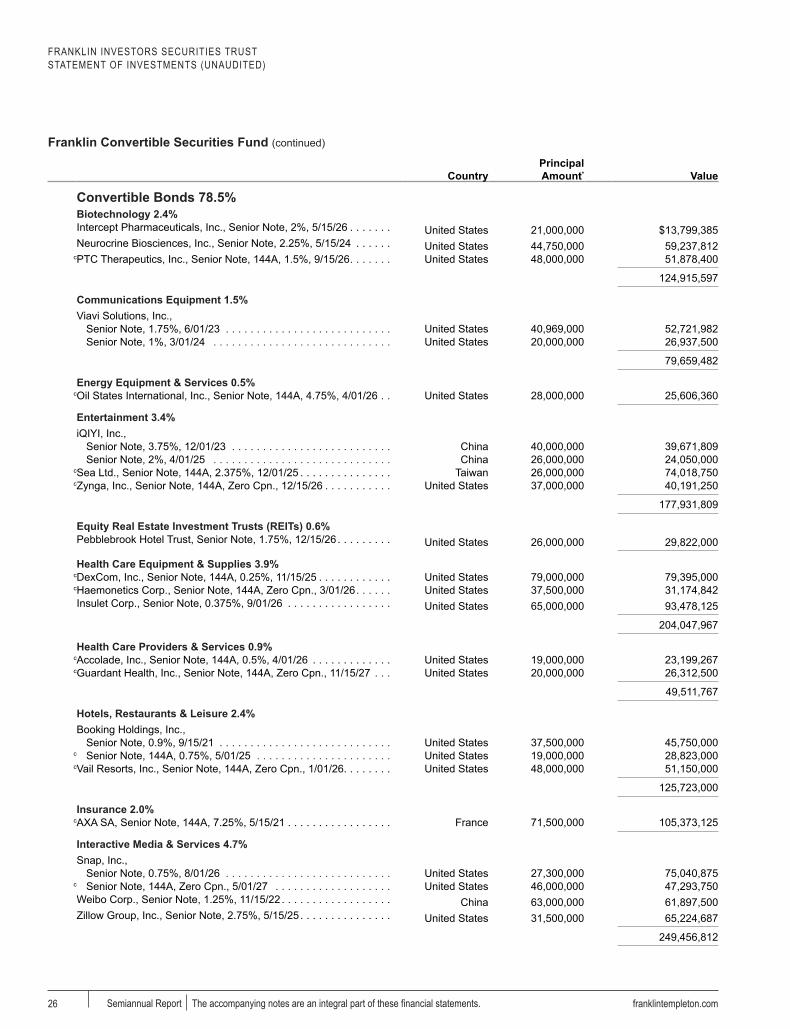
FRANKLIN INVESTORS SECURITIES TRUSTSTATEMENT OF INVESTMENTS (UNAUDITED)
Franklin Convertible Securities Fund (continued)
franklintempleton.comSemiannual Report The accompanying notes are an integral part of these financial statements.26
a a CountryPrincipal Amount*
a Valuea a a a a a
Convertible Bonds 78.5%Biotechnology 2.4%Intercept Pharmaceuticals, Inc., Senior Note, 2%, 5/15/26 . . . . . . . United States 21,000,000 $13,799,385Neurocrine Biosciences, Inc., Senior Note, 2.25%, 5/15/24 . . . . . . United States 44,750,000 59,237,812
cPTC Therapeutics, Inc., Senior Note, 144A, 1.5%, 9/15/26 . . . . . . . United States 48,000,000 51,878,400
124,915,597
Communications Equipment 1.5%Viavi Solutions, Inc.,
Senior Note, 1.75%, 6/01/23 . . . . . . . . . . . . . . . . . . . . . . . . . . . United States 40,969,000 52,721,982Senior Note, 1%, 3/01/24 . . . . . . . . . . . . . . . . . . . . . . . . . . . . . United States 20,000,000 26,937,500
79,659,482
Energy Equipment & Services 0.5%cOil States International, Inc., Senior Note, 144A, 4.75%, 4/01/26 . . United States 28,000,000 25,606,360
Entertainment 3.4%iQIYI, Inc.,
Senior Note, 3.75%, 12/01/23 . . . . . . . . . . . . . . . . . . . . . . . . . . China 40,000,000 39,671,809Senior Note, 2%, 4/01/25 . . . . . . . . . . . . . . . . . . . . . . . . . . . . . China 26,000,000 24,050,000
cSea Ltd., Senior Note, 144A, 2.375%, 12/01/25 . . . . . . . . . . . . . . . Taiwan 26,000,000 74,018,750cZynga, Inc., Senior Note, 144A, Zero Cpn., 12/15/26 . . . . . . . . . . . United States 37,000,000 40,191,250
177,931,809
Equity Real Estate Investment Trusts (REITs) 0.6%Pebblebrook Hotel Trust, Senior Note, 1.75%, 12/15/26 . . . . . . . . . United States 26,000,000 29,822,000
Health Care Equipment & Supplies 3.9%cDexCom, Inc., Senior Note, 144A, 0.25%, 11/15/25 . . . . . . . . . . . . United States 79,000,000 79,395,000cHaemonetics Corp., Senior Note, 144A, Zero Cpn., 3/01/26 . . . . . . United States 37,500,000 31,174,842Insulet Corp., Senior Note, 0.375%, 9/01/26 . . . . . . . . . . . . . . . . . United States 65,000,000 93,478,125
204,047,967
Health Care Providers & Services 0.9%cAccolade, Inc., Senior Note, 144A, 0.5%, 4/01/26 . . . . . . . . . . . . . United States 19,000,000 23,199,267cGuardant Health, Inc., Senior Note, 144A, Zero Cpn., 11/15/27 . . . United States 20,000,000 26,312,500
49,511,767
Hotels, Restaurants & Leisure 2.4%Booking Holdings, Inc.,
Senior Note, 0.9%, 9/15/21 . . . . . . . . . . . . . . . . . . . . . . . . . . . . United States 37,500,000 45,750,000c Senior Note, 144A, 0.75%, 5/01/25 . . . . . . . . . . . . . . . . . . . . . . United States 19,000,000 28,823,000cVail Resorts, Inc., Senior Note, 144A, Zero Cpn., 1/01/26. . . . . . . . United States 48,000,000 51,150,000
125,723,000
Insurance 2.0%cAXA SA, Senior Note, 144A, 7.25%, 5/15/21 . . . . . . . . . . . . . . . . . France 71,500,000 105,373,125
Interactive Media & Services 4.7%Snap, Inc.,
Senior Note, 0.75%, 8/01/26 . . . . . . . . . . . . . . . . . . . . . . . . . . . United States 27,300,000 75,040,875c Senior Note, 144A, Zero Cpn., 5/01/27 . . . . . . . . . . . . . . . . . . . United States 46,000,000 47,293,750Weibo Corp., Senior Note, 1.25%, 11/15/22 . . . . . . . . . . . . . . . . . . China 63,000,000 61,897,500Zillow Group, Inc., Senior Note, 2.75%, 5/15/25 . . . . . . . . . . . . . . . United States 31,500,000 65,224,687
249,456,812

FRANKLIN INVESTORS SECURITIES TRUSTSTATEMENT OF INVESTMENTS (UNAUDITED)
Franklin Convertible Securities Fund (continued)
franklintempleton.com The accompanying notes are an integral part of these financial statements. Semiannual Report 27
a a CountryPrincipal Amount*
a Valuea a a a a a
Convertible Bonds (continued) Internet & Direct Marketing Retail 6.5%
cEtsy, Inc., Senior Note, 144A, 0.125%, 9/01/27 . . . . . . . . . . . . . . . United States 80,000,000 $103,750,000MercadoLibre, Inc., Senior Note, 2%, 8/15/28 . . . . . . . . . . . . . . . . Argentina 5,000,000 17,818,750Pinduoduo, Inc., Senior Note, Zero Cpn., 12/01/25 . . . . . . . . . . . . China 93,000,000 97,557,000
cRealReal, Inc. (The), Senior Note, 144A, 1%, 3/01/28 . . . . . . . . . . United States 30,000,000 31,539,000cWayfair, Inc., Senior Note, 144A, 0.625%, 10/01/25 . . . . . . . . . . . . United States 85,000,000 88,559,375
339,224,125
IT Services 7.2%Okta, Inc., Senior Note, 0.125%, 9/01/25 . . . . . . . . . . . . . . . . . . . . United States 73,000,000 112,739,375
cRepay Holdings Corp., Senior Note, 144A, Zero Cpn., 2/01/26 . . . . United States 19,000,000 18,465,625cShift4 Payments, Inc., Senior Note, 144A, Zero Cpn., 12/15/25 . . . United States 36,000,000 50,716,800cSquare, Inc.,
Senior Note, 144A, Zero Cpn., 5/01/26 . . . . . . . . . . . . . . . . . . . United States 39,500,000 45,622,500Senior Note, 144A, 0.25%, 11/01/27 . . . . . . . . . . . . . . . . . . . . . United States 45,000,000 53,100,000
Wix.com Ltd.,Senior Note, Zero Cpn., 7/01/23 . . . . . . . . . . . . . . . . . . . . . . . . Israel 34,800,000 78,517,500
c Senior Note, 144A, Zero Cpn., 8/15/25 . . . . . . . . . . . . . . . . . . . Israel 15,400,000 16,997,750
376,159,550
Life Sciences Tools & Services 1.7%Illumina, Inc.,
Senior Note, 0.5%, 6/15/21 . . . . . . . . . . . . . . . . . . . . . . . . . . . . United States 32,500,000 50,151,562a Senior Note, Zero Cpn., 8/15/23 . . . . . . . . . . . . . . . . . . . . . . . . United States 25,750,000 30,996,563NeoGenomics, Inc., Senior Note, 0.25%, 1/15/28 . . . . . . . . . . . . . United States 9,500,000 9,642,718
90,790,843
Machinery 0.8%Fortive Corp., Senior Note, 0.875%, 2/15/22 . . . . . . . . . . . . . . . . . United States 40,270,000 40,753,240
Media 4.0%cCable One, Inc.,
Senior Note, 144A, Zero Cpn., 3/15/26 . . . . . . . . . . . . . . . . . . . United States 48,750,000 47,604,375Senior Note, 144A, 1.125%, 3/15/28 . . . . . . . . . . . . . . . . . . . . . United States 26,250,000 26,078,655
cLiberty Broadband Corp.,Senior Bond, 144A, 1.25%, 9/30/50 . . . . . . . . . . . . . . . . . . . . . . United States 57,000,000 56,743,500Senior Bond, 144A, 2.75%, 9/30/50 . . . . . . . . . . . . . . . . . . . . . . United States 34,500,000 35,590,860
Liberty Media Corp.,Senior Bond, 2.25%, 9/30/46 . . . . . . . . . . . . . . . . . . . . . . . . . . . United States 37,000,000 17,438,100Senior Note, 1.375%, 10/15/23 . . . . . . . . . . . . . . . . . . . . . . . . . United States 21,200,000 27,691,178
211,146,668
Metals & Mining 1.4%cIvanhoe Mines Ltd., Senior Note, 144A, 2.5%, 4/15/26 . . . . . . . . . . Canada 60,000,000 71,928,000
Pharmaceuticals 2.3%Jazz Investments I Ltd.,
Senior Note, 1.5%, 8/15/24 . . . . . . . . . . . . . . . . . . . . . . . . . . . . United States 39,750,000 43,188,633c Senior Note, 144A, 2%, 6/15/26 . . . . . . . . . . . . . . . . . . . . . . . . United States 35,000,000 44,931,250Revance Therapeutics, Inc., Senior Note, 1.75%, 2/15/27 . . . . . . . United States 27,000,000 31,134,375
119,254,258
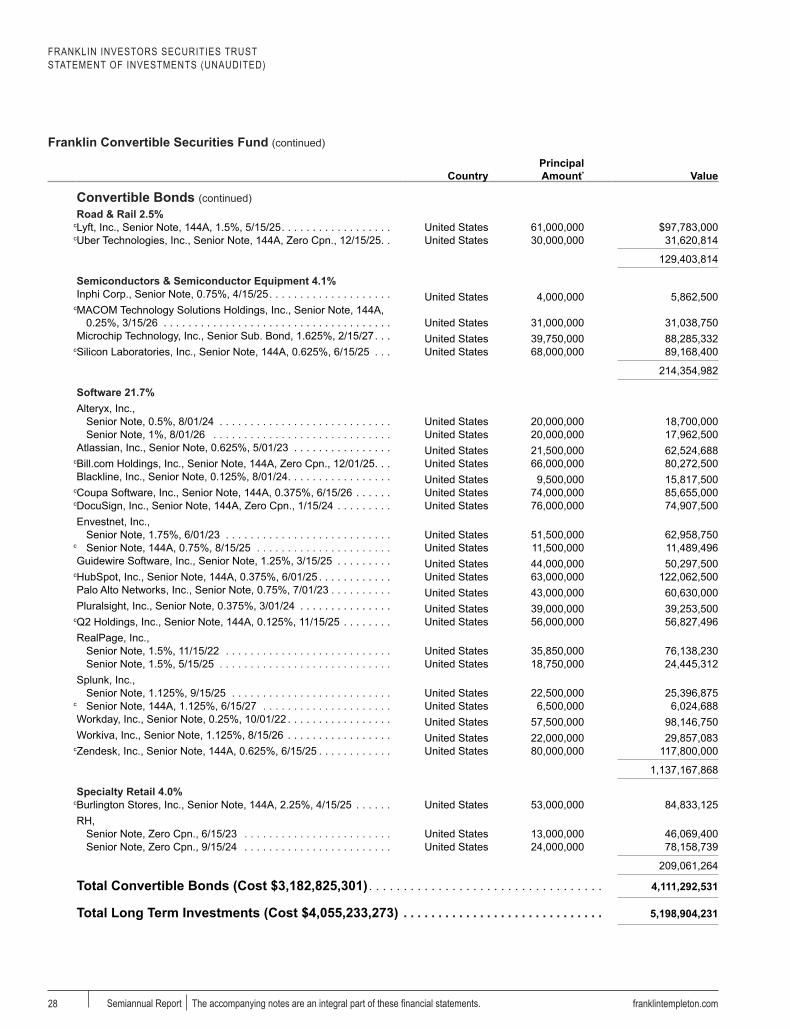
FRANKLIN INVESTORS SECURITIES TRUSTSTATEMENT OF INVESTMENTS (UNAUDITED)
Franklin Convertible Securities Fund (continued)
franklintempleton.comSemiannual Report The accompanying notes are an integral part of these financial statements.28
a a CountryPrincipal Amount*
a Valuea a a a a a
Convertible Bonds (continued) Road & Rail 2.5%
cLyft, Inc., Senior Note, 144A, 1.5%, 5/15/25 . . . . . . . . . . . . . . . . . . United States 61,000,000 $97,783,000cUber Technologies, Inc., Senior Note, 144A, Zero Cpn., 12/15/25. . United States 30,000,000 31,620,814
129,403,814
Semiconductors & Semiconductor Equipment 4.1%Inphi Corp., Senior Note, 0.75%, 4/15/25 . . . . . . . . . . . . . . . . . . . . United States 4,000,000 5,862,500
cMACOM Technology Solutions Holdings, Inc., Senior Note, 144A, 0.25%, 3/15/26 . . . . . . . . . . . . . . . . . . . . . . . . . . . . . . . . . . . . . United States 31,000,000 31,038,750
Microchip Technology, Inc., Senior Sub. Bond, 1.625%, 2/15/27 . . . United States 39,750,000 88,285,332cSilicon Laboratories, Inc., Senior Note, 144A, 0.625%, 6/15/25 . . . United States 68,000,000 89,168,400
214,354,982
Software 21.7%Alteryx, Inc.,
Senior Note, 0.5%, 8/01/24 . . . . . . . . . . . . . . . . . . . . . . . . . . . . United States 20,000,000 18,700,000Senior Note, 1%, 8/01/26 . . . . . . . . . . . . . . . . . . . . . . . . . . . . . United States 20,000,000 17,962,500
Atlassian, Inc., Senior Note, 0.625%, 5/01/23 . . . . . . . . . . . . . . . . United States 21,500,000 62,524,688cBill.com Holdings, Inc., Senior Note, 144A, Zero Cpn., 12/01/25 . . . United States 66,000,000 80,272,500Blackline, Inc., Senior Note, 0.125%, 8/01/24 . . . . . . . . . . . . . . . . . United States 9,500,000 15,817,500
cCoupa Software, Inc., Senior Note, 144A, 0.375%, 6/15/26 . . . . . . United States 74,000,000 85,655,000cDocuSign, Inc., Senior Note, 144A, Zero Cpn., 1/15/24 . . . . . . . . . United States 76,000,000 74,907,500Envestnet, Inc.,
Senior Note, 1.75%, 6/01/23 . . . . . . . . . . . . . . . . . . . . . . . . . . . United States 51,500,000 62,958,750c Senior Note, 144A, 0.75%, 8/15/25 . . . . . . . . . . . . . . . . . . . . . . United States 11,500,000 11,489,496Guidewire Software, Inc., Senior Note, 1.25%, 3/15/25 . . . . . . . . . United States 44,000,000 50,297,500
cHubSpot, Inc., Senior Note, 144A, 0.375%, 6/01/25 . . . . . . . . . . . . United States 63,000,000 122,062,500Palo Alto Networks, Inc., Senior Note, 0.75%, 7/01/23 . . . . . . . . . . United States 43,000,000 60,630,000Pluralsight, Inc., Senior Note, 0.375%, 3/01/24 . . . . . . . . . . . . . . . United States 39,000,000 39,253,500
cQ2 Holdings, Inc., Senior Note, 144A, 0.125%, 11/15/25 . . . . . . . . United States 56,000,000 56,827,496RealPage, Inc.,
Senior Note, 1.5%, 11/15/22 . . . . . . . . . . . . . . . . . . . . . . . . . . . United States 35,850,000 76,138,230Senior Note, 1.5%, 5/15/25 . . . . . . . . . . . . . . . . . . . . . . . . . . . . United States 18,750,000 24,445,312
Splunk, Inc.,Senior Note, 1.125%, 9/15/25 . . . . . . . . . . . . . . . . . . . . . . . . . . United States 22,500,000 25,396,875
c Senior Note, 144A, 1.125%, 6/15/27 . . . . . . . . . . . . . . . . . . . . . United States 6,500,000 6,024,688Workday, Inc., Senior Note, 0.25%, 10/01/22 . . . . . . . . . . . . . . . . . United States 57,500,000 98,146,750Workiva, Inc., Senior Note, 1.125%, 8/15/26 . . . . . . . . . . . . . . . . . United States 22,000,000 29,857,083
cZendesk, Inc., Senior Note, 144A, 0.625%, 6/15/25 . . . . . . . . . . . . United States 80,000,000 117,800,000
1,137,167,868
Specialty Retail 4.0%cBurlington Stores, Inc., Senior Note, 144A, 2.25%, 4/15/25 . . . . . . United States 53,000,000 84,833,125RH,
Senior Note, Zero Cpn., 6/15/23 . . . . . . . . . . . . . . . . . . . . . . . . United States 13,000,000 46,069,400Senior Note, Zero Cpn., 9/15/24 . . . . . . . . . . . . . . . . . . . . . . . . United States 24,000,000 78,158,739
209,061,264
Total Convertible Bonds (Cost $3,182,825,301) . . . . . . . . . . . . . . . . . . . . . . . . . . . . . . . . . . 4,111,292,531
Total Long Term Investments (Cost $4,055,233,273) . . . . . . . . . . . . . . . . . . . . . . . . . . . . . 5,198,904,231 a

FRANKLIN INVESTORS SECURITIES TRUSTSTATEMENT OF INVESTMENTS (UNAUDITED)
Franklin Convertible Securities Fund (continued)
franklintempleton.com The accompanying notes are an integral part of these financial statements. Semiannual Report 29
Short Term Investments 1.3%a a Country Shares a Value a
Money Market Funds 0.6%d,eInstitutional Fiduciary Trust - Money Market Portfolio, 0.01% . . . . . United States 30,360,613 $30,360,613
Total Money Market Funds (Cost $30,360,613) . . . . . . . . . . . . . . . . . . . . . . . . . . . . . . . . . . 30,360,613
fInvestments from Cash Collateral Received for Loaned Securities 0.7%
a a a a a
Money Market Funds 0.6%d,eInstitutional Fiduciary Trust - Money Market Portfolio, 0.01% . . . . . United States 28,711,000 28,711,000
Principal Amount*
Repurchase Agreements 0.1%gJoint Repurchase Agreement, BofA Securities, Inc., 0%, 5/03/21
(Maturity Value $7,178,301) Collateralized by U.S. Treasury Note, 1.5%, 11/30/24 (valued at $7,321,874) . . . . . . . . . . . . . . . . . . . . . . . . . . . . . . . . . . . . . . . . 7,178,301 7,178,301
Total Investments from Cash Collateral Received for Loaned Securities (Cost $35,889,301) . . . . . . . . . . . . . . . . . . . . . . . . . . . . . . . . . . . . . . . . . . . . . . . . . . . . . . . . . . . 35,889,301
Total Short Term Investments (Cost $66,249,914) . . . . . . . . . . . . . . . . . . . . . . . . . . . . . . . . 66,249,914
a
Total Investments (Cost $4,121,483,187) 100.6% . . . . . . . . . . . . . . . . . . . . . . . . . . . . . . . . $5,265,154,145Other Assets, less Liabilities (0.6)% . . . . . . . . . . . . . . . . . . . . . . . . . . . . . . . . . . . . . . . . . . . (30,358,569)
Net Assets 100.0% . . . . . . . . . . . . . . . . . . . . . . . . . . . . . . . . . . . . . . . . . . . . . . . . . . . . . . . . . . . $5,234,795,576
See Abbreviations on page 76.
* The principal amount is stated in U.S. dollars unless otherwise indicated.a A portion or all of the security is on loan at April 30, 2021. See Note 1(f).b Non-income producing.c Security was purchased pursuant to Rule 144A or Regulation S under the Securities Act of 1933. 144A securities may be sold in transactions exempt from registration only to qualified institutional buyers or in a public offering registered under the Securities Act of 1933. Regulation S securities cannot be sold in the United States without either an effective registration statement filed pursuant to the Securities Act of 1933, or pursuant to an exemption from registration. At April 30, 2021, the aggregate value of these securities was $2,222,015,043, representing 42.4% of net assets.d See Note 3(f) regarding investments in affiliated management investment companies.e The rate shown is the annualized seven-day effective yield at period end.f See Note 1(f) regarding securities on loan.g See Note 1(c) regarding joint repurchase agreement.

FRANKLIN INVESTORS SECURITIES TRUST
Financial HighlightsFranklin Equity Income Fund
franklintempleton.comSemiannual Report The accompanying notes are an integral part of these financial statements.30
a
Six Months Ended April
30, 2021 (unaudited)
Year Ended October 31,
2020 2019 2018 2017 2016
Class APer share operating performance(for a share outstanding throughout the
period)Net asset value, beginning of period . . . . . $24.22 $26.23 $24.86 $25.06 $22.50 $22.99Income from investment operationsa:
Net investment incomeb . . . . . . . . . . . . . 0.24 0.49 0.46 0.42 0.48 0.47Net realized and unrealized gains (losses) 6.28 (1.11) 2.49 0.58 3.55 0.24
Total from investment operations . . . . . . . . 6.52 (0.62) 2.95 1.00 4.03 0.71Less distributions from:
Net investment income . . . . . . . . . . . . . . (0.31) (0.63) (0.58) (0.57) (0.58) (0.60)Net realized gains . . . . . . . . . . . . . . . . . (0.22) (0.76) (1.00) (0.63) (0.89) (0.60)
Total distributions . . . . . . . . . . . . . . . . . . . (0.53) (1.39) (1.58) (1.20) (1.47) (1.20)Net asset value, end of period . . . . . . . . . . $30.21 $24.22 $26.23 $24.86 $25.06 $22.50
Total returnc . . . . . . . . . . . . . . . . . . . . . . . 27.13% (2.43)% 12.73% 3.98% 18.55% 3.31%
Ratios to average net assetsd
Expenses before waiver and payments by affiliates . . . . . . . . . . . . . . . . . . . . . . . . . . 0.84% 0.86% 0.86% 0.85% 0.86% 0.87%Expenses net of waiver and payments by affiliatese . . . . . . . . . . . . . . . . . . . . . . . . . . 0.84%f 0.85% 0.85% 0.84% 0.86%f 0.87%f
Net investment income . . . . . . . . . . . . . . . 1.76% 1.98% 1.85% 1.66% 2.02% 2.13%
Supplemental dataNet assets, end of period (000’s) . . . . . . . . $2,562,204 $1,953,985 $2,017,910 $1,752,181 $1,753,135 $1,700,712Portfolio turnover rate . . . . . . . . . . . . . . . . 14.91% 26.90% 23.23% 28.40% 27.18% 50.05%
aThe amount shown for a share outstanding throughout the period may not correlate with the Statement of Operations for the period due to the timing of sales and repurchases of the Fund’s shares in relation to income earned and/or fluctuating fair value of the investments of the Fund.bBased on average daily shares outstanding.cTotal return does not reflect sales commissions or contingent deferred sales charges, if applicable, and is not annualized for periods less than one year.dRatios are annualized for periods less than one year.eBenefit of expense reduction rounds to less than 0.01%.fBenefit of waiver and payments by affiliates rounds to less than 0.01%.

FRANKLIN INVESTORS SECURITIES TRUSTFINANCIAL HIGHLIGHTS
Franklin Equity Income Fund (continued)
franklintempleton.com The accompanying notes are an integral part of these financial statements. Semiannual Report 31
a
Six Months Ended April
30, 2021 (unaudited)
Year Ended October 31,
2020 2019 2018 2017 2016
Class CPer share operating performance(for a share outstanding throughout the
period)Net asset value, beginning of period . . . . . $24.03 $26.01 $24.64 $24.86 $22.32 $22.85Income from investment operationsa:
Net investment incomeb . . . . . . . . . . . . . 0.14 0.30 0.28 0.26 0.30 0.30Net realized and unrealized gains (losses) 6.23 (1.10) 2.47 0.53 3.54 0.23
Total from investment operations . . . . . . . . 6.37 (0.80) 2.75 0.79 3.84 0.53Less distributions from:
Net investment income . . . . . . . . . . . . . . (0.21) (0.42) (0.38) (0.38) (0.41) (0.46)Net realized gains . . . . . . . . . . . . . . . . . (0.22) (0.76) (1.00) (0.63) (0.89) (0.60)
Total distributions . . . . . . . . . . . . . . . . . . . (0.43) (1.18) (1.38) (1.01) (1.30) (1.06)Net asset value, end of period . . . . . . . . . . $29.97 $24.03 $26.01 $24.64 $24.86 $22.32
Total returnc . . . . . . . . . . . . . . . . . . . . . . . 26.67% (3.19)% 11.91% 3.16% 17.73% 2.51%
Ratios to average net assetsd
Expenses before waiver and payments by affiliates . . . . . . . . . . . . . . . . . . . . . . . . . . 1.59% 1.61% 1.61% 1.60% 1.61% 1.62%Expenses net of waiver and payments by affiliatese . . . . . . . . . . . . . . . . . . . . . . . . . . 1.59%f 1.60% 1.60% 1.59% 1.61%f 1.62%f
Net investment income . . . . . . . . . . . . . . . 1.01% 1.23% 1.10% 0.91% 1.27% 1.38%
Supplemental dataNet assets, end of period (000’s) . . . . . . . . $209,686 $161,707 $208,734 $204,402 $267,450 $257,156Portfolio turnover rate . . . . . . . . . . . . . . . . 14.91% 26.90% 23.23% 28.40% 27.18% 50.05%
aThe amount shown for a share outstanding throughout the period may not correlate with the Statement of Operations for the period due to the timing of sales and repurchases of the Fund’s shares in relation to income earned and/or fluctuating fair value of the investments of the Fund.bBased on average daily shares outstanding.cTotal return does not reflect sales commissions or contingent deferred sales charges, if applicable, and is not annualized for periods less than one year.dRatios are annualized for periods less than one year.eBenefit of expense reduction rounds to less than 0.01%.fBenefit of waiver and payments by affiliates rounds to less than 0.01%.

FRANKLIN INVESTORS SECURITIES TRUSTFINANCIAL HIGHLIGHTS
Franklin Equity Income Fund (continued)
franklintempleton.comSemiannual Report The accompanying notes are an integral part of these financial statements.32
a
Six Months Ended April
30, 2021 (unaudited)
Year Ended October 31,
2020 2019 2018 2017 2016
Class RPer share operating performance(for a share outstanding throughout the
period)Net asset value, beginning of period . . . . . $24.24 $26.23 $24.85 $25.05 $22.49 $22.99Income from investment operationsa:
Net investment incomeb . . . . . . . . . . . . . 0.21 0.43 0.41 0.36 0.42 0.41Net realized and unrealized gains (losses) 6.27 (1.10) 2.49 0.58 3.56 0.24
Total from investment operations . . . . . . . . 6.48 (0.67) 2.90 0.94 3.98 0.65Less distributions from:
Net investment income . . . . . . . . . . . . . . (0.27) (0.56) (0.52) (0.51) (0.53) (0.55)Net realized gains . . . . . . . . . . . . . . . . . (0.22) (0.76) (1.00) (0.63) (0.89) (0.60)
Total distributions . . . . . . . . . . . . . . . . . . . (0.49) (1.32) (1.52) (1.14) (1.42) (1.15)Net asset value, end of period . . . . . . . . . . $30.23 $24.24 $26.23 $24.85 $25.05 $22.49
Total returnc . . . . . . . . . . . . . . . . . . . . . . . 26.97% (2.62)% 12.50% 3.75% 18.29% 3.05%
Ratios to average net assetsd
Expenses before waiver and payments by affiliates . . . . . . . . . . . . . . . . . . . . . . . . . . 1.08% 1.08% 1.09% 1.08% 1.09% 1.11%Expenses net of waiver and payments by affiliatese . . . . . . . . . . . . . . . . . . . . . . . . . . 1.08%f 1.08%f 1.08% 1.07% 1.09%f 1.11%f
Net investment income . . . . . . . . . . . . . . . 1.52% 1.75% 1.62% 1.43% 1.79% 1.89%
Supplemental dataNet assets, end of period (000’s) . . . . . . . . $8,372 $5,795 $7,284 $6,750 $7,074 $6,395Portfolio turnover rate . . . . . . . . . . . . . . . . 14.91% 26.90% 23.23% 28.40% 27.18% 50.05%
aThe amount shown for a share outstanding throughout the period may not correlate with the Statement of Operations for the period due to the timing of sales and repurchases of the Fund’s shares in relation to income earned and/or fluctuating fair value of the investments of the Fund.bBased on average daily shares outstanding.cTotal return is not annualized for periods less than one year.dRatios are annualized for periods less than one year.eBenefit of expense reduction rounds to less than 0.01%.fBenefit of waiver and payments by affiliates rounds to less than 0.01%.

FRANKLIN INVESTORS SECURITIES TRUSTFINANCIAL HIGHLIGHTS
Franklin Equity Income Fund (continued)
franklintempleton.com The accompanying notes are an integral part of these financial statements. Semiannual Report 33
a
Six Months Ended April
30, 2021 (unaudited)
Year Ended October 31,
2020 2019 2018 2017 2016
Class R6Per share operating performance(for a share outstanding throughout the
period)Net asset value, beginning of period . . . . . $24.27 $26.29 $24.91 $25.11 $22.54 $23.01Income from investment operationsa:
Net investment incomeb . . . . . . . . . . . . . 0.29 0.57 0.54 0.50 0.56 0.43Net realized and unrealized gains (losses) 6.28 (1.11) 2.50 0.59 3.57 0.37
Total from investment operations . . . . . . . . 6.57 (0.54) 3.04 1.09 4.13 0.80Less distributions from:
Net investment income . . . . . . . . . . . . . . (0.35) (0.72) (0.66) (0.66) (0.67) (0.67)Net realized gains . . . . . . . . . . . . . . . . . (0.22) (0.76) (1.00) (0.63) (0.89) (0.60)
Total distributions . . . . . . . . . . . . . . . . . . . (0.57) (1.48) (1.66) (1.29) (1.56) (1.27)Net asset value, end of period . . . . . . . . . . $30.27 $24.27 $26.29 $24.91 $25.11 $22.54
Total returnc . . . . . . . . . . . . . . . . . . . . . . . 27.31% (2.07)% 13.12% 4.35% 19.00% 3.72%
Ratios to average net assetsd
Expenses before waiver and payments by affiliates . . . . . . . . . . . . . . . . . . . . . . . . . . 0.53% 0.52% 0.53% 0.52% 0.49% 0.49%Expenses net of waiver and payments by affiliatese . . . . . . . . . . . . . . . . . . . . . . . . . . 0.51% 0.51% 0.51% 0.50% 0.49%f 0.49%f
Net investment income . . . . . . . . . . . . . . . 2.09% 2.32% 2.19% 2.00% 2.39% 2.51%
Supplemental dataNet assets, end of period (000’s) . . . . . . . . $132,096 $97,565 $96,406 $81,171 $12,728 $10,537Portfolio turnover rate . . . . . . . . . . . . . . . . 14.91% 26.90% 23.23% 28.40% 27.18% 50.05%
aThe amount shown for a share outstanding throughout the period may not correlate with the Statement of Operations for the period due to the timing of sales and repurchases of the Fund’s shares in relation to income earned and/or fluctuating fair value of the investments of the Fund.bBased on average daily shares outstanding.cTotal return is not annualized for periods less than one year.dRatios are annualized for periods less than one year.eBenefit of expense reduction rounds to less than 0.01%.fBenefit of waiver and payments by affiliates rounds to less than 0.01%.
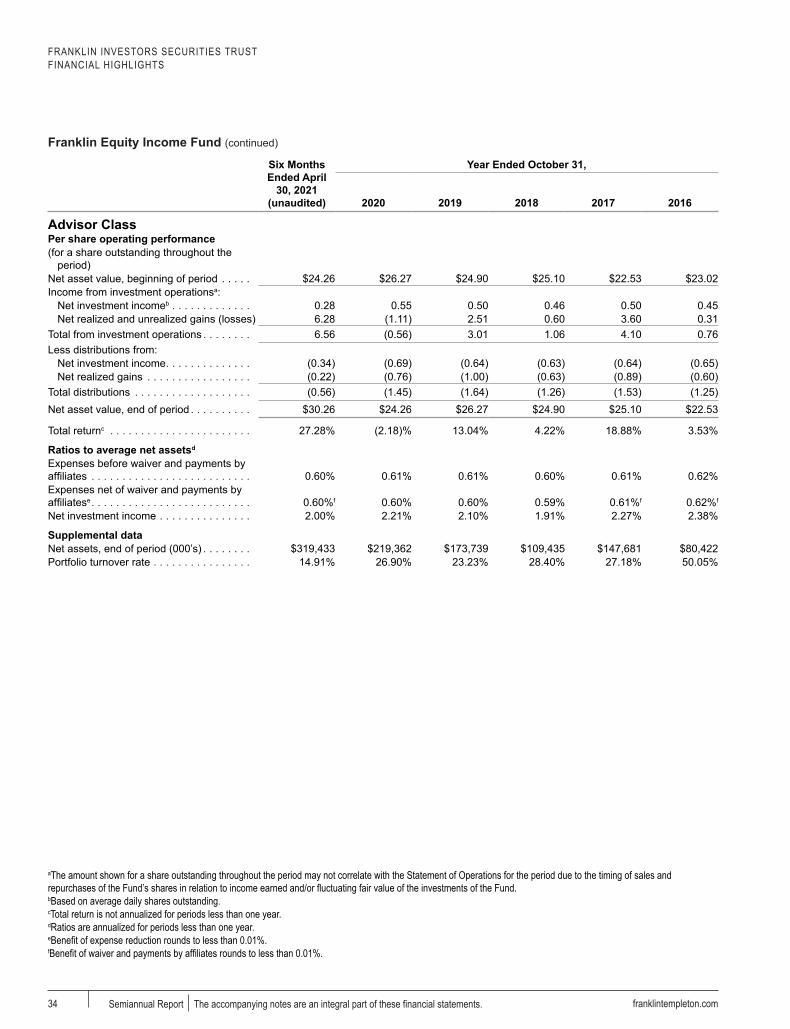
FRANKLIN INVESTORS SECURITIES TRUSTFINANCIAL HIGHLIGHTS
Franklin Equity Income Fund (continued)
franklintempleton.comSemiannual Report The accompanying notes are an integral part of these financial statements.34
a
Six Months Ended April
30, 2021 (unaudited)
Year Ended October 31,
2020 2019 2018 2017 2016
Advisor ClassPer share operating performance(for a share outstanding throughout the
period)Net asset value, beginning of period . . . . . $24.26 $26.27 $24.90 $25.10 $22.53 $23.02Income from investment operationsa:
Net investment incomeb . . . . . . . . . . . . . 0.28 0.55 0.50 0.46 0.50 0.45Net realized and unrealized gains (losses) 6.28 (1.11) 2.51 0.60 3.60 0.31
Total from investment operations . . . . . . . . 6.56 (0.56) 3.01 1.06 4.10 0.76Less distributions from:
Net investment income . . . . . . . . . . . . . . (0.34) (0.69) (0.64) (0.63) (0.64) (0.65)Net realized gains . . . . . . . . . . . . . . . . . (0.22) (0.76) (1.00) (0.63) (0.89) (0.60)
Total distributions . . . . . . . . . . . . . . . . . . . (0.56) (1.45) (1.64) (1.26) (1.53) (1.25)Net asset value, end of period . . . . . . . . . . $30.26 $24.26 $26.27 $24.90 $25.10 $22.53
Total returnc . . . . . . . . . . . . . . . . . . . . . . . 27.28% (2.18)% 13.04% 4.22% 18.88% 3.53%
Ratios to average net assetsd
Expenses before waiver and payments by affiliates . . . . . . . . . . . . . . . . . . . . . . . . . . 0.60% 0.61% 0.61% 0.60% 0.61% 0.62%Expenses net of waiver and payments by affiliatese . . . . . . . . . . . . . . . . . . . . . . . . . . 0.60%f 0.60% 0.60% 0.59% 0.61%f 0.62%f
Net investment income . . . . . . . . . . . . . . . 2.00% 2.21% 2.10% 1.91% 2.27% 2.38%
Supplemental dataNet assets, end of period (000’s) . . . . . . . . $319,433 $219,362 $173,739 $109,435 $147,681 $80,422Portfolio turnover rate . . . . . . . . . . . . . . . . 14.91% 26.90% 23.23% 28.40% 27.18% 50.05%
aThe amount shown for a share outstanding throughout the period may not correlate with the Statement of Operations for the period due to the timing of sales and repurchases of the Fund’s shares in relation to income earned and/or fluctuating fair value of the investments of the Fund.bBased on average daily shares outstanding.cTotal return is not annualized for periods less than one year.dRatios are annualized for periods less than one year.eBenefit of expense reduction rounds to less than 0.01%.fBenefit of waiver and payments by affiliates rounds to less than 0.01%.
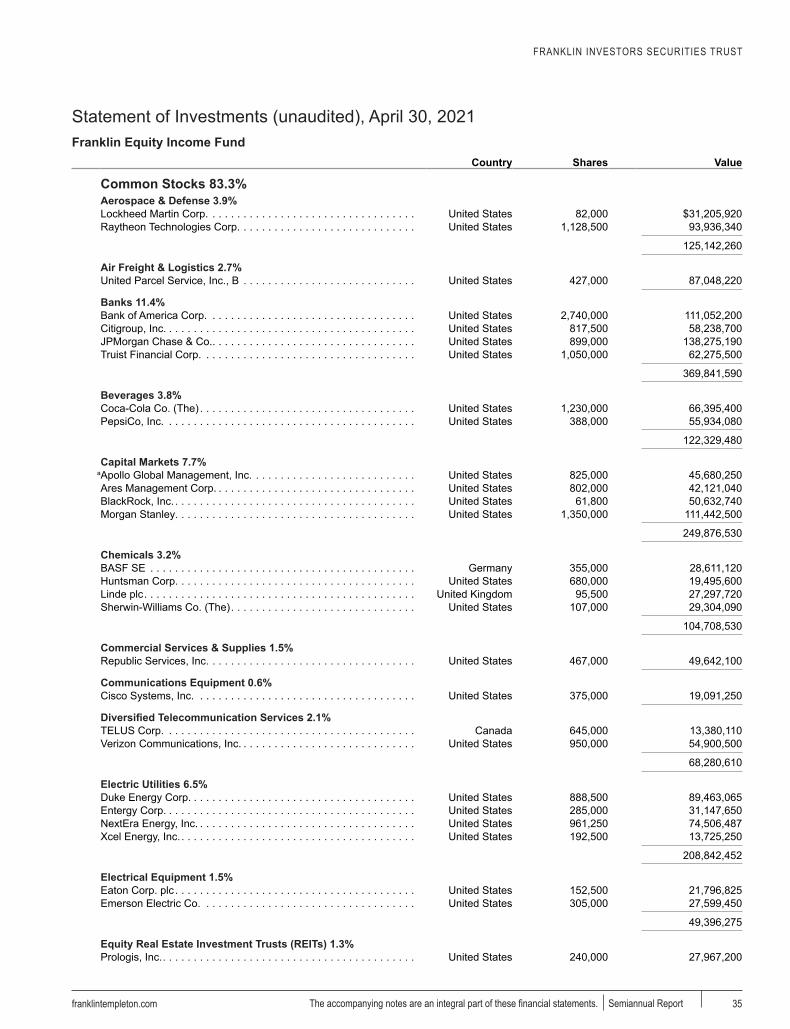
FRANKLIN INVESTORS SECURITIES TRUST
Statement of Investments (unaudited), April 30, 2021Franklin Equity Income Fund
franklintempleton.com The accompanying notes are an integral part of these financial statements. Semiannual Report 35
a a Country Shares a Valuea a a a a a
Common Stocks 83.3%Aerospace & Defense 3.9%Lockheed Martin Corp. . . . . . . . . . . . . . . . . . . . . . . . . . . . . . . . . . United States 82,000 $31,205,920Raytheon Technologies Corp. . . . . . . . . . . . . . . . . . . . . . . . . . . . . United States 1,128,500 93,936,340
125,142,260
Air Freight & Logistics 2.7%United Parcel Service, Inc., B . . . . . . . . . . . . . . . . . . . . . . . . . . . . United States 427,000 87,048,220
Banks 11.4%Bank of America Corp. . . . . . . . . . . . . . . . . . . . . . . . . . . . . . . . . . United States 2,740,000 111,052,200Citigroup, Inc. . . . . . . . . . . . . . . . . . . . . . . . . . . . . . . . . . . . . . . . . United States 817,500 58,238,700JPMorgan Chase & Co. . . . . . . . . . . . . . . . . . . . . . . . . . . . . . . . . . United States 899,000 138,275,190Truist Financial Corp. . . . . . . . . . . . . . . . . . . . . . . . . . . . . . . . . . . United States 1,050,000 62,275,500
369,841,590
Beverages 3.8%Coca-Cola Co. (The) . . . . . . . . . . . . . . . . . . . . . . . . . . . . . . . . . . . United States 1,230,000 66,395,400PepsiCo, Inc. . . . . . . . . . . . . . . . . . . . . . . . . . . . . . . . . . . . . . . . . United States 388,000 55,934,080
122,329,480
Capital Markets 7.7%aApollo Global Management, Inc. . . . . . . . . . . . . . . . . . . . . . . . . . . United States 825,000 45,680,250Ares Management Corp. . . . . . . . . . . . . . . . . . . . . . . . . . . . . . . . . United States 802,000 42,121,040BlackRock, Inc. . . . . . . . . . . . . . . . . . . . . . . . . . . . . . . . . . . . . . . . United States 61,800 50,632,740Morgan Stanley . . . . . . . . . . . . . . . . . . . . . . . . . . . . . . . . . . . . . . . United States 1,350,000 111,442,500
249,876,530
Chemicals 3.2%BASF SE . . . . . . . . . . . . . . . . . . . . . . . . . . . . . . . . . . . . . . . . . . . Germany 355,000 28,611,120Huntsman Corp. . . . . . . . . . . . . . . . . . . . . . . . . . . . . . . . . . . . . . . United States 680,000 19,495,600Linde plc . . . . . . . . . . . . . . . . . . . . . . . . . . . . . . . . . . . . . . . . . . . . United Kingdom 95,500 27,297,720Sherwin-Williams Co. (The) . . . . . . . . . . . . . . . . . . . . . . . . . . . . . . United States 107,000 29,304,090
104,708,530
Commercial Services & Supplies 1.5%Republic Services, Inc. . . . . . . . . . . . . . . . . . . . . . . . . . . . . . . . . . United States 467,000 49,642,100
Communications Equipment 0.6%Cisco Systems, Inc. . . . . . . . . . . . . . . . . . . . . . . . . . . . . . . . . . . . United States 375,000 19,091,250
Diversified Telecommunication Services 2.1%TELUS Corp. . . . . . . . . . . . . . . . . . . . . . . . . . . . . . . . . . . . . . . . . Canada 645,000 13,380,110Verizon Communications, Inc. . . . . . . . . . . . . . . . . . . . . . . . . . . . . United States 950,000 54,900,500
68,280,610
Electric Utilities 6.5%Duke Energy Corp. . . . . . . . . . . . . . . . . . . . . . . . . . . . . . . . . . . . . United States 888,500 89,463,065Entergy Corp. . . . . . . . . . . . . . . . . . . . . . . . . . . . . . . . . . . . . . . . . United States 285,000 31,147,650NextEra Energy, Inc. . . . . . . . . . . . . . . . . . . . . . . . . . . . . . . . . . . . United States 961,250 74,506,487Xcel Energy, Inc. . . . . . . . . . . . . . . . . . . . . . . . . . . . . . . . . . . . . . . United States 192,500 13,725,250
208,842,452
Electrical Equipment 1.5%Eaton Corp. plc . . . . . . . . . . . . . . . . . . . . . . . . . . . . . . . . . . . . . . . United States 152,500 21,796,825Emerson Electric Co. . . . . . . . . . . . . . . . . . . . . . . . . . . . . . . . . . . United States 305,000 27,599,450
49,396,275
Equity Real Estate Investment Trusts (REITs) 1.3%Prologis, Inc. . . . . . . . . . . . . . . . . . . . . . . . . . . . . . . . . . . . . . . . . . United States 240,000 27,967,200
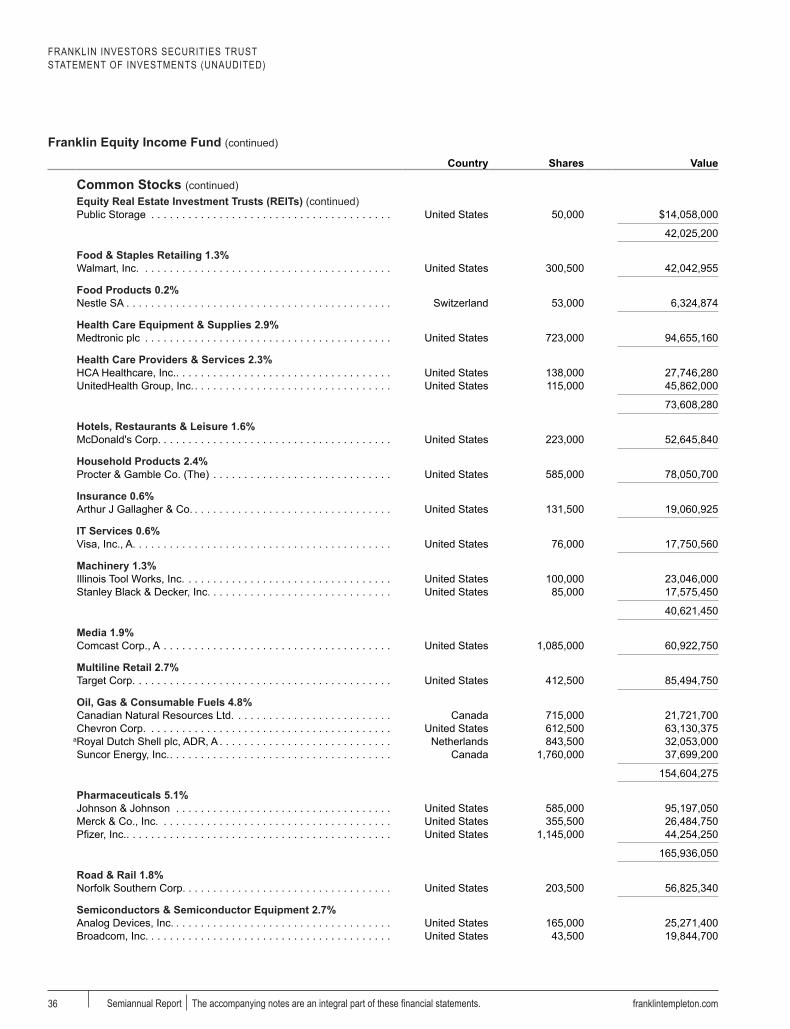
FRANKLIN INVESTORS SECURITIES TRUSTSTATEMENT OF INVESTMENTS (UNAUDITED)
Franklin Equity Income Fund (continued)
franklintempleton.comSemiannual Report The accompanying notes are an integral part of these financial statements.36
a a Country Shares a Valuea a a a a a
Common Stocks (continued) Equity Real Estate Investment Trusts (REITs) (continued)
Public Storage . . . . . . . . . . . . . . . . . . . . . . . . . . . . . . . . . . . . . . . United States 50,000 $14,058,000
42,025,200
Food & Staples Retailing 1.3%Walmart, Inc. . . . . . . . . . . . . . . . . . . . . . . . . . . . . . . . . . . . . . . . . United States 300,500 42,042,955
Food Products 0.2%Nestle SA . . . . . . . . . . . . . . . . . . . . . . . . . . . . . . . . . . . . . . . . . . . Switzerland 53,000 6,324,874
Health Care Equipment & Supplies 2.9%Medtronic plc . . . . . . . . . . . . . . . . . . . . . . . . . . . . . . . . . . . . . . . . United States 723,000 94,655,160
Health Care Providers & Services 2.3%HCA Healthcare, Inc. . . . . . . . . . . . . . . . . . . . . . . . . . . . . . . . . . . . United States 138,000 27,746,280UnitedHealth Group, Inc. . . . . . . . . . . . . . . . . . . . . . . . . . . . . . . . . United States 115,000 45,862,000
73,608,280
Hotels, Restaurants & Leisure 1.6%McDonald's Corp. . . . . . . . . . . . . . . . . . . . . . . . . . . . . . . . . . . . . . United States 223,000 52,645,840
Household Products 2.4%Procter & Gamble Co. (The) . . . . . . . . . . . . . . . . . . . . . . . . . . . . . United States 585,000 78,050,700
Insurance 0.6%Arthur J Gallagher & Co. . . . . . . . . . . . . . . . . . . . . . . . . . . . . . . . . United States 131,500 19,060,925
IT Services 0.6%Visa, Inc., A . . . . . . . . . . . . . . . . . . . . . . . . . . . . . . . . . . . . . . . . . . United States 76,000 17,750,560
Machinery 1.3%Illinois Tool Works, Inc. . . . . . . . . . . . . . . . . . . . . . . . . . . . . . . . . . United States 100,000 23,046,000Stanley Black & Decker, Inc. . . . . . . . . . . . . . . . . . . . . . . . . . . . . . United States 85,000 17,575,450
40,621,450
Media 1.9%Comcast Corp., A . . . . . . . . . . . . . . . . . . . . . . . . . . . . . . . . . . . . . United States 1,085,000 60,922,750
Multiline Retail 2.7%Target Corp. . . . . . . . . . . . . . . . . . . . . . . . . . . . . . . . . . . . . . . . . . United States 412,500 85,494,750
Oil, Gas & Consumable Fuels 4.8%Canadian Natural Resources Ltd. . . . . . . . . . . . . . . . . . . . . . . . . . Canada 715,000 21,721,700Chevron Corp. . . . . . . . . . . . . . . . . . . . . . . . . . . . . . . . . . . . . . . . United States 612,500 63,130,375
aRoyal Dutch Shell plc, ADR, A . . . . . . . . . . . . . . . . . . . . . . . . . . . . Netherlands 843,500 32,053,000Suncor Energy, Inc. . . . . . . . . . . . . . . . . . . . . . . . . . . . . . . . . . . . . Canada 1,760,000 37,699,200
154,604,275
Pharmaceuticals 5.1%Johnson & Johnson . . . . . . . . . . . . . . . . . . . . . . . . . . . . . . . . . . . United States 585,000 95,197,050Merck & Co., Inc. . . . . . . . . . . . . . . . . . . . . . . . . . . . . . . . . . . . . . United States 355,500 26,484,750Pfizer, Inc. . . . . . . . . . . . . . . . . . . . . . . . . . . . . . . . . . . . . . . . . . . . United States 1,145,000 44,254,250
165,936,050
Road & Rail 1.8%Norfolk Southern Corp. . . . . . . . . . . . . . . . . . . . . . . . . . . . . . . . . . United States 203,500 56,825,340
Semiconductors & Semiconductor Equipment 2.7%Analog Devices, Inc. . . . . . . . . . . . . . . . . . . . . . . . . . . . . . . . . . . . United States 165,000 25,271,400Broadcom, Inc. . . . . . . . . . . . . . . . . . . . . . . . . . . . . . . . . . . . . . . . United States 43,500 19,844,700

FRANKLIN INVESTORS SECURITIES TRUSTSTATEMENT OF INVESTMENTS (UNAUDITED)
Franklin Equity Income Fund (continued)
franklintempleton.com The accompanying notes are an integral part of these financial statements. Semiannual Report 37
a a Country Shares a Valuea a a a a a
Common Stocks (continued) Semiconductors & Semiconductor Equipment (continued)
Texas Instruments, Inc. . . . . . . . . . . . . . . . . . . . . . . . . . . . . . . . . . United States 233,000 $42,058,830
87,174,930
Software 1.7%Microsoft Corp. . . . . . . . . . . . . . . . . . . . . . . . . . . . . . . . . . . . . . . . United States 147,000 37,070,460Oracle Corp. . . . . . . . . . . . . . . . . . . . . . . . . . . . . . . . . . . . . . . . . . United States 225,000 17,052,750
54,123,210
Specialty Retail 2.6%Lowe's Cos., Inc. . . . . . . . . . . . . . . . . . . . . . . . . . . . . . . . . . . . . . . United States 240,000 47,100,000TJX Cos., Inc. (The) . . . . . . . . . . . . . . . . . . . . . . . . . . . . . . . . . . . United States 530,000 37,630,000
84,730,000
Technology Hardware, Storage & Peripherals 0.6%Apple, Inc. . . . . . . . . . . . . . . . . . . . . . . . . . . . . . . . . . . . . . . . . . . United States 156,800 20,612,928
Total Common Stocks (Cost $1,693,136,382) . . . . . . . . . . . . . . . . . . . . . . . . . . . . . . . . . . . . 2,691,409,474
bEquity-Linked Securities 9.2%Banks 0.8%
cRoyal Bank of Canada into Bank of America Corp., 144A, 7.75%, 11/01/21 . . . . . . . . . . . . . . . . . . . . . . . . . . . . . . . . . . . . . . . . . . United States 902,000 27,116,779
Chemicals 1.3%cCitigroup Global Markets Holdings, Inc. into Sherwin-Williams Co.
(The), 144A, 6.5%, 7/09/21 . . . . . . . . . . . . . . . . . . . . . . . . . . . . United States 30,200 20,380,898cGoldman Sachs International Bank into Linde plc, 144A, 6.5%,
10/25/21 . . . . . . . . . . . . . . . . . . . . . . . . . . . . . . . . . . . . . . . . . . United Kingdom 80,150 21,319,783
41,700,681
Electrical Equipment 0.5%cRoyal Bank of Canada into Eaton Corp. plc, 144A, 7%, 8/30/21 . . . United States 118,600 16,080,959
Equity Real Estate Investment Trusts (REITs) 0.7%cRoyal Bank of Canada into Healthpeak Properties, Inc., 144A, 9.5%,
12/01/21 . . . . . . . . . . . . . . . . . . . . . . . . . . . . . . . . . . . . . . . . . . United States 660,000 22,469,083
Food & Staples Retailing 0.7%cCitigroup Global Markets Holdings, Inc. into Tesco plc, 144A, 6.5%,
1/10/22 . . . . . . . . . . . . . . . . . . . . . . . . . . . . . . . . . . . . . . . . . . . United Kingdom 149,700 24,039,131
Health Care Providers & Services 0.8%cRoyal Bank of Canada into HCA Healthcare, Inc., 144A, 7%, 6/30/21 United States 128,400 24,310,105
Internet & Direct Marketing Retail 1.0%cCredit Suisse AG into Amazon.com, Inc., 144A, 5%, 4/22/22 . . . . . United States 9,650 32,458,786
IT Services 0.5%cCredit Suisse AG into Visa, Inc., 144A, 5%, 11/30/21 . . . . . . . . . . . United States 70,500 15,961,194
Machinery 0.8%cCredit Suisse AG into Stanley Black & Decker, Inc., 144A, 6.5%,
3/31/22 . . . . . . . . . . . . . . . . . . . . . . . . . . . . . . . . . . . . . . . . . . . United States 133,000 27,308,128
Multiline Retail 0.7%cBarclays Bank plc into Dollar Tree, Inc., 144A, 5.5%, 1/14/22 . . . . . United States 185,800 21,305,165
Software 0.8%cBarclays Bank plc into Oracle Corp., 144A, 7%, 7/30/21 . . . . . . . . United States 354,500 24,333,424
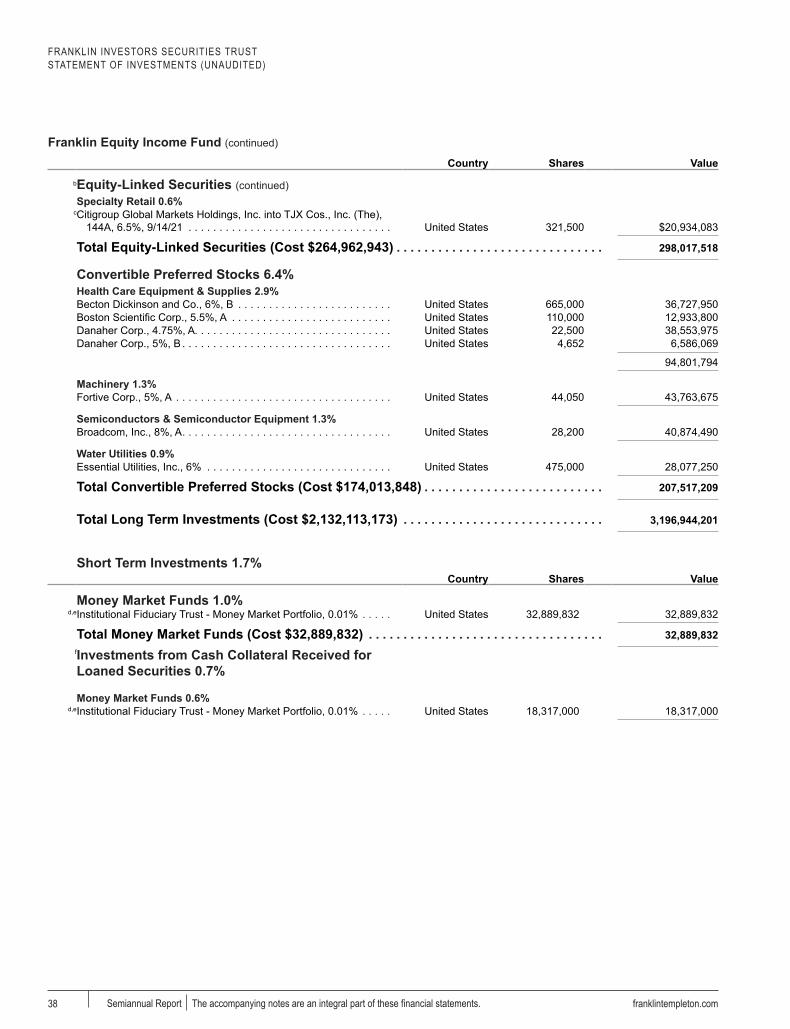
FRANKLIN INVESTORS SECURITIES TRUSTSTATEMENT OF INVESTMENTS (UNAUDITED)
Franklin Equity Income Fund (continued)
franklintempleton.comSemiannual Report The accompanying notes are an integral part of these financial statements.38
a a Country Shares a Valuea a a a a a
bEquity-Linked Securities (continued) Specialty Retail 0.6%
cCitigroup Global Markets Holdings, Inc. into TJX Cos., Inc. (The), 144A, 6.5%, 9/14/21 . . . . . . . . . . . . . . . . . . . . . . . . . . . . . . . . . United States 321,500 $20,934,083
Total Equity-Linked Securities (Cost $264,962,943) . . . . . . . . . . . . . . . . . . . . . . . . . . . . . . 298,017,518
Convertible Preferred Stocks 6.4%Health Care Equipment & Supplies 2.9%Becton Dickinson and Co., 6%, B . . . . . . . . . . . . . . . . . . . . . . . . . United States 665,000 36,727,950Boston Scientific Corp., 5.5%, A . . . . . . . . . . . . . . . . . . . . . . . . . . United States 110,000 12,933,800Danaher Corp., 4.75%, A . . . . . . . . . . . . . . . . . . . . . . . . . . . . . . . . United States 22,500 38,553,975Danaher Corp., 5%, B . . . . . . . . . . . . . . . . . . . . . . . . . . . . . . . . . . United States 4,652 6,586,069
94,801,794
Machinery 1.3%Fortive Corp., 5%, A . . . . . . . . . . . . . . . . . . . . . . . . . . . . . . . . . . . United States 44,050 43,763,675
Semiconductors & Semiconductor Equipment 1.3%Broadcom, Inc., 8%, A . . . . . . . . . . . . . . . . . . . . . . . . . . . . . . . . . . United States 28,200 40,874,490
Water Utilities 0.9%Essential Utilities, Inc., 6% . . . . . . . . . . . . . . . . . . . . . . . . . . . . . . United States 475,000 28,077,250
Total Convertible Preferred Stocks (Cost $174,013,848) . . . . . . . . . . . . . . . . . . . . . . . . . . 207,517,209
Total Long Term Investments (Cost $2,132,113,173) . . . . . . . . . . . . . . . . . . . . . . . . . . . . . 3,196,944,201 a
Short Term Investments 1.7%a a Country Shares a Value a
Money Market Funds 1.0%d,eInstitutional Fiduciary Trust - Money Market Portfolio, 0.01% . . . . . United States 32,889,832 32,889,832
Total Money Market Funds (Cost $32,889,832) . . . . . . . . . . . . . . . . . . . . . . . . . . . . . . . . . . 32,889,832
fInvestments from Cash Collateral Received for Loaned Securities 0.7%
a a a a a
Money Market Funds 0.6%d,eInstitutional Fiduciary Trust - Money Market Portfolio, 0.01% . . . . . United States 18,317,000 18,317,000

FRANKLIN INVESTORS SECURITIES TRUSTSTATEMENT OF INVESTMENTS (UNAUDITED)
Franklin Equity Income Fund (continued)
franklintempleton.com The accompanying notes are an integral part of these financial statements. Semiannual Report 39
Short Term Investments (continued)
a a CountryPrincipal Amount*
a Valuea a a a a a
Repurchase Agreements 0.1%gJoint Repurchase Agreement, BofA Securities, Inc., 0%, 5/03/21
(Maturity Value $4,579,721) Collateralized by U.S. Treasury Note, 1.5%, 11/30/24 (valued at $4,671,320) . . . . . . . . . . . . . . . . . . . . . . . . . . . . . . . . . . . . . . . . 4,579,721 $4,579,721
Total Investments from Cash Collateral Received for Loaned Securities (Cost $22,896,721) . . . . . . . . . . . . . . . . . . . . . . . . . . . . . . . . . . . . . . . . . . . . . . . . . . . . . . . . . . . 22,896,721
Total Short Term Investments (Cost $55,786,553) . . . . . . . . . . . . . . . . . . . . . . . . . . . . . . . . 55,786,553
a
Total Investments (Cost $2,187,899,726) 100.6% . . . . . . . . . . . . . . . . . . . . . . . . . . . . . . . . $3,252,730,754Other Assets, less Liabilities (0.6)% . . . . . . . . . . . . . . . . . . . . . . . . . . . . . . . . . . . . . . . . . . . (20,939,813)
Net Assets 100.0% . . . . . . . . . . . . . . . . . . . . . . . . . . . . . . . . . . . . . . . . . . . . . . . . . . . . . . . . . . . $3,231,790,941
See Abbreviations on page 76.
* The principal amount is stated in U.S. dollars unless otherwise indicated.a A portion or all of the security is on loan at April 30, 2021. See Note 1(f).b See Note 1(e) regarding equity-linked securities.c Security was purchased pursuant to Rule 144A or Regulation S under the Securities Act of 1933. 144A securities may be sold in transactions exempt from registration only to qualified institutional buyers or in a public offering registered under the Securities Act of 1933. Regulation S securities cannot be sold in the United States without either an effective registration statement filed pursuant to the Securities Act of 1933, or pursuant to an exemption from registration. At April 30, 2021, the aggregate value of these securities was $298,017,518, representing 9.2% of net assets.d See Note 3(f) regarding investments in affiliated management investment companies.e The rate shown is the annualized seven-day effective yield at period end.f See Note 1(f) regarding securities on loan.g See Note 1(c) regarding joint repurchase agreement.

FRANKLIN INVESTORS SECURITIES TRUST
Financial HighlightsFranklin Managed Income Fund
franklintempleton.comSemiannual Report The accompanying notes are an integral part of these financial statements.40
a
Six Months Ended April
30, 2021 (unaudited)
Year Ended October 31,
2020 2019 2018 2017 2016
Class APer share operating performance(for a share outstanding throughout the
period)Net asset value, beginning of period . . . . . $11.73 $12.80 $11.89 $12.36 $11.65 $11.40Income from investment operationsa:
Net investment incomeb . . . . . . . . . . . . . 0.16 0.31 0.29 0.27 0.33 0.30Net realized and unrealized gains (losses) 1.93 (0.44) 1.17 (0.16) 0.91 0.31
Total from investment operations . . . . . . . . 2.09 (0.13) 1.46 0.11 1.24 0.61Less distributions from:
Net investment income . . . . . . . . . . . . . . (0.24) (0.46) (0.41) (0.38) (0.36) (0.36)Net realized gains . . . . . . . . . . . . . . . . . (0.09) (0.48) (0.14) (0.20) (0.17) (—)c
Total distributions . . . . . . . . . . . . . . . . . . . (0.33) (0.94) (0.55) (0.58) (0.53) (0.36)Net asset value, end of period . . . . . . . . . . $13.49 $11.73 $12.80 $11.89 $12.36 $11.65
Total returnd . . . . . . . . . . . . . . . . . . . . . . . 17.93% (1.06)% 12.64% 0.89% 10.88% 5.54%
Ratios to average net assetse
Expenses before waiver and payments by affiliates . . . . . . . . . . . . . . . . . . . . . . . . . . 0.91% 0.93% 0.96% 1.02% 1.02% 1.02%Expenses net of waiver and payments by affiliatesf . . . . . . . . . . . . . . . . . . . . . . . . . . 0.91%g 0.91% 0.94% 1.01% 1.00% 1.01%Net investment income . . . . . . . . . . . . . . . 2.46% 2.55% 2.36% 2.22% 2.72% 2.62%
Supplemental dataNet assets, end of period (000’s) . . . . . . . . $3,333,888 $2,860,390 $2,966,899 $2,586,246 $2,646,599 $2,532,459Portfolio turnover rate . . . . . . . . . . . . . . . . 20.30% 64.69% 53.02% 63.64% 34.99% 46.03%
aThe amount shown for a share outstanding throughout the period may not correlate with the Statement of Operations for the period due to the timing of sales and repurchases of the Fund’s shares in relation to income earned and/or fluctuating fair value of the investments of the Fund.bBased on average daily shares outstanding.cAmount rounds to less than $0.01 per share.dTotal return does not reflect sales commissions or contingent deferred sales charges, if applicable, and is not annualized for periods less than one year.eRatios are annualized for periods less than one year.fBenefit of expense reduction rounds to less than 0.01%.gBenefit of waiver and payments by affiliates rounds to less than 0.01%.

FRANKLIN INVESTORS SECURITIES TRUSTFINANCIAL HIGHLIGHTS
Franklin Managed Income Fund (continued)
franklintempleton.com The accompanying notes are an integral part of these financial statements. Semiannual Report 41
a
Six Months Ended April
30, 2021 (unaudited)
Year Ended October 31,
2020 2019 2018 2017 2016
Class CPer share operating performance(for a share outstanding throughout the
period)Net asset value, beginning of period . . . . . $11.61 $12.67 $11.78 $12.25 $11.55 $11.31Income from investment operationsa:
Net investment incomeb . . . . . . . . . . . . . 0.11 0.22 0.20 0.19 0.24 0.21Net realized and unrealized gains (losses) 1.91 (0.43) 1.15 (0.17) 0.90 0.31
Total from investment operations . . . . . . . . 2.02 (0.21) 1.35 0.02 1.14 0.52Less distributions from:
Net investment income . . . . . . . . . . . . . . (0.19) (0.37) (0.32) (0.29) (0.27) (0.28)Net realized gains . . . . . . . . . . . . . . . . . (0.09) (0.48) (0.14) (0.20) (0.17) (—)c
Total distributions . . . . . . . . . . . . . . . . . . . (0.28) (0.85) (0.46) (0.49) (0.44) (0.28)Net asset value, end of period . . . . . . . . . . $13.35 $11.61 $12.67 $11.78 $12.25 $11.55
Total returnd . . . . . . . . . . . . . . . . . . . . . . . 17.49% (1.79)% 11.79% 0.14% 10.06% 4.73%
Ratios to average net assetse
Expenses before waiver and payments by affiliates . . . . . . . . . . . . . . . . . . . . . . . . . . 1.66% 1.68% 1.71% 1.76% 1.77% 1.77%Expenses net of waiver and payments by affiliatesf . . . . . . . . . . . . . . . . . . . . . . . . . . 1.66%g 1.66% 1.69% 1.75% 1.75% 1.76%Net investment income . . . . . . . . . . . . . . . 1.73% 1.84% 1.61% 1.48% 1.97% 1.87%
Supplemental dataNet assets, end of period (000’s) . . . . . . . . $344,602 $341,521 $491,751 $493,762 $633,108 $630,110Portfolio turnover rate . . . . . . . . . . . . . . . . 20.30% 64.69% 53.02% 63.64% 34.99% 46.03%
aThe amount shown for a share outstanding throughout the period may not correlate with the Statement of Operations for the period due to the timing of sales and repurchases of the Fund’s shares in relation to income earned and/or fluctuating fair value of the investments of the Fund.bBased on average daily shares outstanding.cAmount rounds to less than $0.01 per share.dTotal return does not reflect sales commissions or contingent deferred sales charges, if applicable, and is not annualized for periods less than one year.eRatios are annualized for periods less than one year.fBenefit of expense reduction rounds to less than 0.01%.gBenefit of waiver and payments by affiliates rounds to less than 0.01%.

FRANKLIN INVESTORS SECURITIES TRUSTFINANCIAL HIGHLIGHTS
Franklin Managed Income Fund (continued)
franklintempleton.comSemiannual Report The accompanying notes are an integral part of these financial statements.42
a
Six Months Ended April
30, 2021 (unaudited)
Year Ended October 31,
2020 2019 2018 2017 2016
Class RPer share operating performance(for a share outstanding throughout the
period)Net asset value, beginning of period . . . . . $11.76 $12.84 $11.92 $12.39 $11.67 $11.42Income from investment operationsa:
Net investment incomeb . . . . . . . . . . . . . 0.14 0.28 0.26 0.26 0.30 0.27Net realized and unrealized gains (losses) 1.95 (0.45) 1.18 (0.18) 0.92 0.32
Total from investment operations . . . . . . . . 2.09 (0.17) 1.44 0.08 1.22 0.59Less distributions from:
Net investment income . . . . . . . . . . . . . . (0.22) (0.43) (0.38) (0.35) (0.33) (0.34)Net realized gains . . . . . . . . . . . . . . . . . (0.09) (0.48) (0.14) (0.20) (0.17) (—)c
Total distributions . . . . . . . . . . . . . . . . . . . (0.31) (0.91) (0.52) (0.55) (0.50) (0.34)Net asset value, end of period . . . . . . . . . . $13.54 $11.76 $12.84 $11.92 $12.39 $11.67
Total returnd . . . . . . . . . . . . . . . . . . . . . . . 17.92% (1.38)% 12.43% 0.63% 10.66% 5.28%
Ratios to average net assetse
Expenses before waiver and payments by affiliates . . . . . . . . . . . . . . . . . . . . . . . . . . 1.16% 1.18% 1.21% 1.27% 1.27% 1.27%Expenses net of waiver and payments by affiliatesf . . . . . . . . . . . . . . . . . . . . . . . . . . 1.16%g 1.16% 1.19% 1.26% 1.25% 1.26%Net investment income . . . . . . . . . . . . . . . 2.23% 2.33% 2.11% 1.97% 2.47% 2.37%
Supplemental dataNet assets, end of period (000’s) . . . . . . . . $3,341 $3,093 $4,081 $3,371 $4,763 $4,482Portfolio turnover rate . . . . . . . . . . . . . . . . 20.30% 64.69% 53.02% 63.64% 34.99% 46.03%
aThe amount shown for a share outstanding throughout the period may not correlate with the Statement of Operations for the period due to the timing of sales and repurchases of the Fund’s shares in relation to income earned and/or fluctuating fair value of the investments of the Fund.bBased on average daily shares outstanding.cAmount rounds to less than $0.01 per share.dTotal return is not annualized for periods less than one year.eRatios are annualized for periods less than one year.fBenefit of expense reduction rounds to less than 0.01%.gBenefit of waiver and payments by affiliates rounds to less than 0.01%.
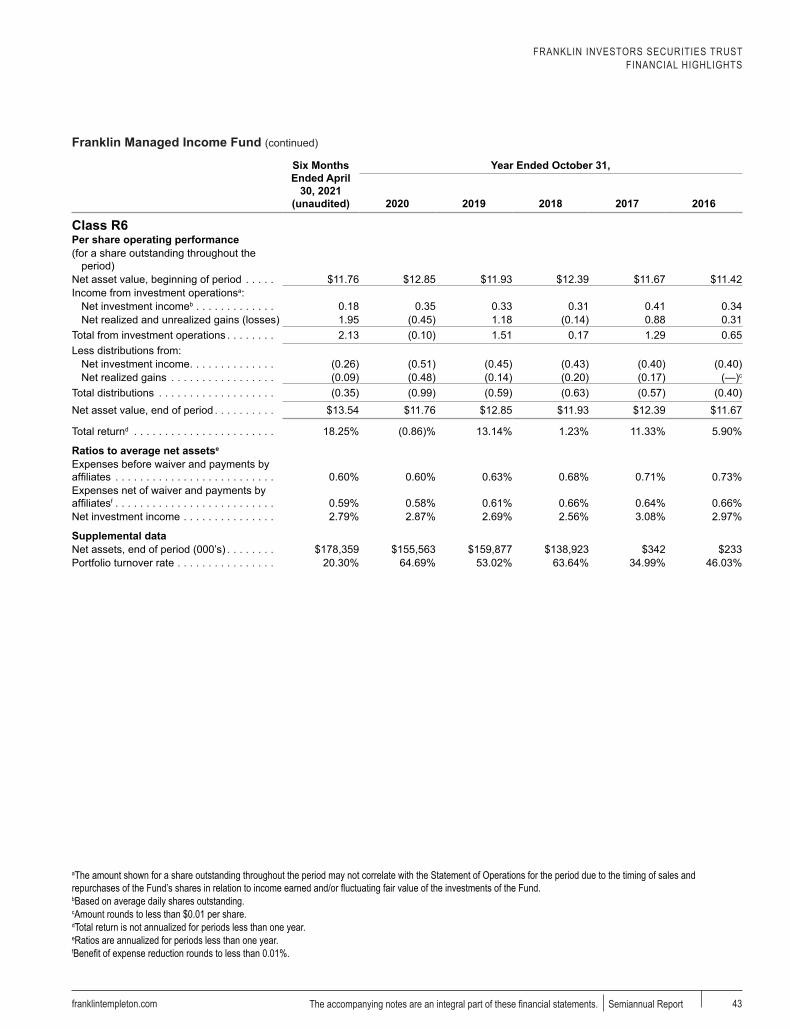
FRANKLIN INVESTORS SECURITIES TRUSTFINANCIAL HIGHLIGHTS
Franklin Managed Income Fund (continued)
franklintempleton.com The accompanying notes are an integral part of these financial statements. Semiannual Report 43
a
Six Months Ended April
30, 2021 (unaudited)
Year Ended October 31,
2020 2019 2018 2017 2016
Class R6Per share operating performance(for a share outstanding throughout the
period)Net asset value, beginning of period . . . . . $11.76 $12.85 $11.93 $12.39 $11.67 $11.42Income from investment operationsa:
Net investment incomeb . . . . . . . . . . . . . 0.18 0.35 0.33 0.31 0.41 0.34Net realized and unrealized gains (losses) 1.95 (0.45) 1.18 (0.14) 0.88 0.31
Total from investment operations . . . . . . . . 2.13 (0.10) 1.51 0.17 1.29 0.65Less distributions from:
Net investment income . . . . . . . . . . . . . . (0.26) (0.51) (0.45) (0.43) (0.40) (0.40)Net realized gains . . . . . . . . . . . . . . . . . (0.09) (0.48) (0.14) (0.20) (0.17) (—)c
Total distributions . . . . . . . . . . . . . . . . . . . (0.35) (0.99) (0.59) (0.63) (0.57) (0.40)Net asset value, end of period . . . . . . . . . . $13.54 $11.76 $12.85 $11.93 $12.39 $11.67
Total returnd . . . . . . . . . . . . . . . . . . . . . . . 18.25% (0.86)% 13.14% 1.23% 11.33% 5.90%
Ratios to average net assetse
Expenses before waiver and payments by affiliates . . . . . . . . . . . . . . . . . . . . . . . . . . 0.60% 0.60% 0.63% 0.68% 0.71% 0.73%Expenses net of waiver and payments by affiliatesf . . . . . . . . . . . . . . . . . . . . . . . . . . 0.59% 0.58% 0.61% 0.66% 0.64% 0.66%Net investment income . . . . . . . . . . . . . . . 2.79% 2.87% 2.69% 2.56% 3.08% 2.97%
Supplemental dataNet assets, end of period (000’s) . . . . . . . . $178,359 $155,563 $159,877 $138,923 $342 $233Portfolio turnover rate . . . . . . . . . . . . . . . . 20.30% 64.69% 53.02% 63.64% 34.99% 46.03%`
aThe amount shown for a share outstanding throughout the period may not correlate with the Statement of Operations for the period due to the timing of sales and repurchases of the Fund’s shares in relation to income earned and/or fluctuating fair value of the investments of the Fund.bBased on average daily shares outstanding.cAmount rounds to less than $0.01 per share.dTotal return is not annualized for periods less than one year.eRatios are annualized for periods less than one year.fBenefit of expense reduction rounds to less than 0.01%.
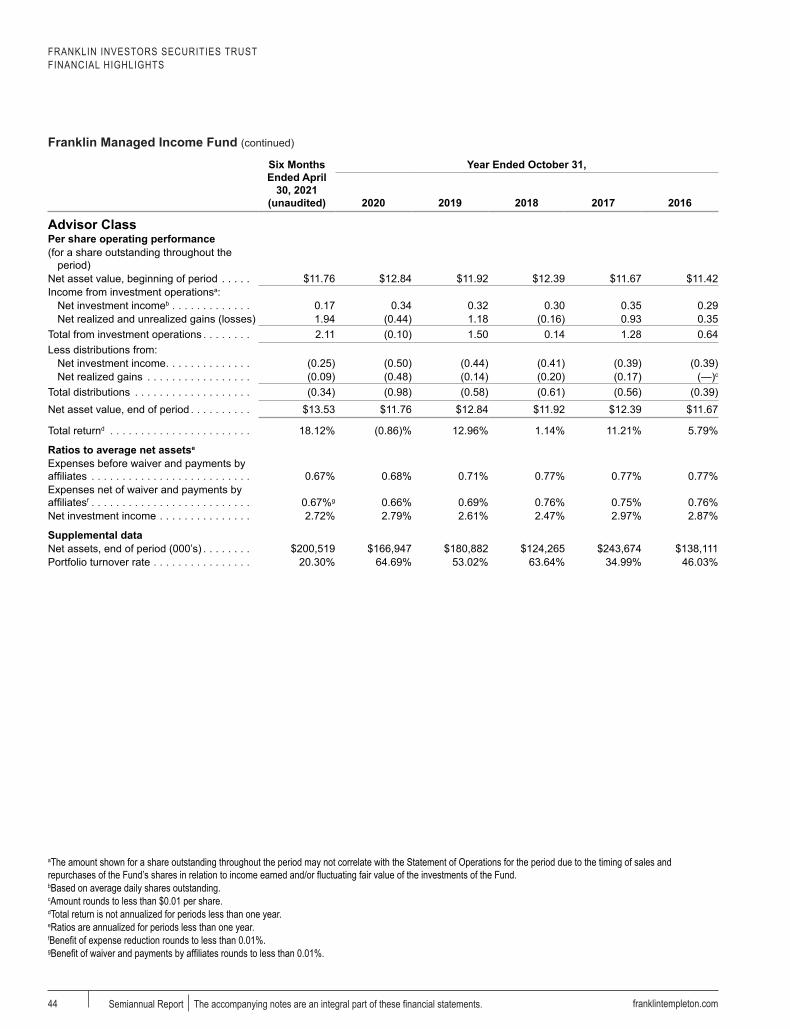
FRANKLIN INVESTORS SECURITIES TRUSTFINANCIAL HIGHLIGHTS
Franklin Managed Income Fund (continued)
franklintempleton.comSemiannual Report The accompanying notes are an integral part of these financial statements.44
a
Six Months Ended April
30, 2021 (unaudited)
Year Ended October 31,
2020 2019 2018 2017 2016
Advisor ClassPer share operating performance(for a share outstanding throughout the
period)Net asset value, beginning of period . . . . . $11.76 $12.84 $11.92 $12.39 $11.67 $11.42Income from investment operationsa:
Net investment incomeb . . . . . . . . . . . . . 0.17 0.34 0.32 0.30 0.35 0.29Net realized and unrealized gains (losses) 1.94 (0.44) 1.18 (0.16) 0.93 0.35
Total from investment operations . . . . . . . . 2.11 (0.10) 1.50 0.14 1.28 0.64Less distributions from:
Net investment income . . . . . . . . . . . . . . (0.25) (0.50) (0.44) (0.41) (0.39) (0.39)Net realized gains . . . . . . . . . . . . . . . . . (0.09) (0.48) (0.14) (0.20) (0.17) (—)c
Total distributions . . . . . . . . . . . . . . . . . . . (0.34) (0.98) (0.58) (0.61) (0.56) (0.39)Net asset value, end of period . . . . . . . . . . $13.53 $11.76 $12.84 $11.92 $12.39 $11.67
Total returnd . . . . . . . . . . . . . . . . . . . . . . . 18.12% (0.86)% 12.96% 1.14% 11.21% 5.79%
Ratios to average net assetse
Expenses before waiver and payments by affiliates . . . . . . . . . . . . . . . . . . . . . . . . . . 0.67% 0.68% 0.71% 0.77% 0.77% 0.77%Expenses net of waiver and payments by affiliatesf . . . . . . . . . . . . . . . . . . . . . . . . . . 0.67%g 0.66% 0.69% 0.76% 0.75% 0.76%Net investment income . . . . . . . . . . . . . . . 2.72% 2.79% 2.61% 2.47% 2.97% 2.87%
Supplemental dataNet assets, end of period (000’s) . . . . . . . . $200,519 $166,947 $180,882 $124,265 $243,674 $138,111Portfolio turnover rate . . . . . . . . . . . . . . . . 20.30% 64.69% 53.02% 63.64% 34.99% 46.03%
aThe amount shown for a share outstanding throughout the period may not correlate with the Statement of Operations for the period due to the timing of sales and repurchases of the Fund’s shares in relation to income earned and/or fluctuating fair value of the investments of the Fund.bBased on average daily shares outstanding.cAmount rounds to less than $0.01 per share.dTotal return is not annualized for periods less than one year.eRatios are annualized for periods less than one year.fBenefit of expense reduction rounds to less than 0.01%.gBenefit of waiver and payments by affiliates rounds to less than 0.01%.

FRANKLIN INVESTORS SECURITIES TRUST
Statement of Investments (unaudited), April 30, 2021Franklin Managed Income Fund
franklintempleton.com The accompanying notes are an integral part of these financial statements. Semiannual Report 45
a a Country Shares a Valuea a a a a a
Common Stocks 41.9%Aerospace & Defense 1.1%Lockheed Martin Corp. . . . . . . . . . . . . . . . . . . . . . . . . . . . . . . . . . United States 75,000 $28,542,000Northrop Grumman Corp. . . . . . . . . . . . . . . . . . . . . . . . . . . . . . . . United States 42,900 15,205,476
43,747,476
Air Freight & Logistics 0.9%United Parcel Service, Inc., B . . . . . . . . . . . . . . . . . . . . . . . . . . . . United States 175,000 35,675,500
Banks 7.4%Bank of America Corp. . . . . . . . . . . . . . . . . . . . . . . . . . . . . . . . . . United States 2,150,000 87,139,500Citigroup, Inc. . . . . . . . . . . . . . . . . . . . . . . . . . . . . . . . . . . . . . . . . United States 350,000 24,934,000JPMorgan Chase & Co. . . . . . . . . . . . . . . . . . . . . . . . . . . . . . . . . . United States 650,000 99,976,500Truist Financial Corp. . . . . . . . . . . . . . . . . . . . . . . . . . . . . . . . . . . United States 700,100 41,522,931US Bancorp . . . . . . . . . . . . . . . . . . . . . . . . . . . . . . . . . . . . . . . . . United States 800,000 47,480,000
301,052,931
Beverages 2.3%Coca-Cola Co. (The) . . . . . . . . . . . . . . . . . . . . . . . . . . . . . . . . . . . United States 785,000 42,374,300PepsiCo, Inc. . . . . . . . . . . . . . . . . . . . . . . . . . . . . . . . . . . . . . . . . United States 350,000 50,456,000
92,830,300
Biotechnology 1.3%AbbVie, Inc. . . . . . . . . . . . . . . . . . . . . . . . . . . . . . . . . . . . . . . . . . United States 475,000 52,962,500
Capital Markets 0.7%Morgan Stanley . . . . . . . . . . . . . . . . . . . . . . . . . . . . . . . . . . . . . . . United States 350,000 28,892,500
Chemicals 0.4%Air Products and Chemicals, Inc. . . . . . . . . . . . . . . . . . . . . . . . . . . United States 50,000 14,424,000
Diversified Telecommunication Services 2.5%BCE, Inc. . . . . . . . . . . . . . . . . . . . . . . . . . . . . . . . . . . . . . . . . . . . Canada 450,000 21,269,066Deutsche Telekom AG . . . . . . . . . . . . . . . . . . . . . . . . . . . . . . . . . . Germany 1,200,000 23,095,025Verizon Communications, Inc. . . . . . . . . . . . . . . . . . . . . . . . . . . . . United States 1,000,000 57,790,000
102,154,091
Electric Utilities 3.1%Duke Energy Corp. . . . . . . . . . . . . . . . . . . . . . . . . . . . . . . . . . . . . United States 450,000 45,310,500Edison International . . . . . . . . . . . . . . . . . . . . . . . . . . . . . . . . . . . United States 500,000 29,725,000FirstEnergy Corp. . . . . . . . . . . . . . . . . . . . . . . . . . . . . . . . . . . . . . United States 1,000,000 37,920,000Southern Co. (The) . . . . . . . . . . . . . . . . . . . . . . . . . . . . . . . . . . . . United States 175,000 11,579,750
124,535,250
Food Products 0.7%Nestle SA . . . . . . . . . . . . . . . . . . . . . . . . . . . . . . . . . . . . . . . . . . . Switzerland 250,000 29,687,500
Health Care Providers & Services 2.3%CVS Health Corp. . . . . . . . . . . . . . . . . . . . . . . . . . . . . . . . . . . . . . United States 520,000 39,728,000Quest Diagnostics, Inc. . . . . . . . . . . . . . . . . . . . . . . . . . . . . . . . . . United States 400,000 52,752,000
92,480,000
Household Products 2.0%Procter & Gamble Co. (The) . . . . . . . . . . . . . . . . . . . . . . . . . . . . . United States 600,000 80,052,000
Industrial Conglomerates 1.6%Honeywell International, Inc. . . . . . . . . . . . . . . . . . . . . . . . . . . . . . United States 300,000 66,912,000
Insurance 0.4%Travelers Cos., Inc. (The) . . . . . . . . . . . . . . . . . . . . . . . . . . . . . . . United States 100,000 15,466,000
IT Services 0.7%International Business Machines Corp. . . . . . . . . . . . . . . . . . . . . . United States 200,000 28,376,000

FRANKLIN INVESTORS SECURITIES TRUSTSTATEMENT OF INVESTMENTS (UNAUDITED)
Franklin Managed Income Fund (continued)
franklintempleton.comSemiannual Report The accompanying notes are an integral part of these financial statements.46
a a Country Shares a Valuea a a a a a
Common Stocks (continued) Multiline Retail 0.5%Target Corp. . . . . . . . . . . . . . . . . . . . . . . . . . . . . . . . . . . . . . . . . . United States 100,000 $20,726,000
Multi-Utilities 2.7%Dominion Energy, Inc. . . . . . . . . . . . . . . . . . . . . . . . . . . . . . . . . . . United States 500,000 39,950,000DTE Energy Co. . . . . . . . . . . . . . . . . . . . . . . . . . . . . . . . . . . . . . . United States 200,000 28,004,000Sempra Energy . . . . . . . . . . . . . . . . . . . . . . . . . . . . . . . . . . . . . . . United States 300,000 41,271,000
109,225,000
Oil, Gas & Consumable Fuels 4.1%BP plc, ADR . . . . . . . . . . . . . . . . . . . . . . . . . . . . . . . . . . . . . . . . . United Kingdom 500,000 12,580,000Chevron Corp. . . . . . . . . . . . . . . . . . . . . . . . . . . . . . . . . . . . . . . . United States 500,000 51,535,000Exxon Mobil Corp. . . . . . . . . . . . . . . . . . . . . . . . . . . . . . . . . . . . . . United States 1,250,000 71,550,000Royal Dutch Shell plc, ADR, A . . . . . . . . . . . . . . . . . . . . . . . . . . . . Netherlands 350,000 13,300,000TOTAL SE, ADR . . . . . . . . . . . . . . . . . . . . . . . . . . . . . . . . . . . . . . France 400,000 17,712,000
166,677,000
Personal Products 0.6%Unilever plc . . . . . . . . . . . . . . . . . . . . . . . . . . . . . . . . . . . . . . . . . . United Kingdom 400,000 23,431,695
Pharmaceuticals 4.3%aAstraZeneca plc, ADR . . . . . . . . . . . . . . . . . . . . . . . . . . . . . . . . . . United Kingdom 550,000 29,188,500Bristol-Myers Squibb Co. . . . . . . . . . . . . . . . . . . . . . . . . . . . . . . . . United States 600,000 37,452,000Eli Lilly & Co. . . . . . . . . . . . . . . . . . . . . . . . . . . . . . . . . . . . . . . . . United States 125,000 22,846,250Johnson & Johnson . . . . . . . . . . . . . . . . . . . . . . . . . . . . . . . . . . . United States 250,000 40,682,500Merck & Co., Inc. . . . . . . . . . . . . . . . . . . . . . . . . . . . . . . . . . . . . . United States 600,000 44,700,000
174,869,250
Road & Rail 1.1%Union Pacific Corp. . . . . . . . . . . . . . . . . . . . . . . . . . . . . . . . . . . . . United States 205,000 45,528,450
Specialty Retail 1.2%Home Depot, Inc. (The) . . . . . . . . . . . . . . . . . . . . . . . . . . . . . . . . . United States 150,000 48,550,500
Total Common Stocks (Cost $1,313,483,917) . . . . . . . . . . . . . . . . . . . . . . . . . . . . . . . . . . . . 1,698,255,943
Management Investment Companies 2.6%Capital Markets 2.6%
bFranklin FTSE United Kingdom ETF . . . . . . . . . . . . . . . . . . . . . . . United States 1,500,000 37,170,000a,bFranklin Liberty Systematic Style Premia ETF . . . . . . . . . . . . . . . . United States 1,175,000 23,312,000
bFranklin Liberty U.S. Low Volatility ETF . . . . . . . . . . . . . . . . . . . . . United States 1,000,000 45,817,800
106,299,800
Total Management Investment Companies (Cost $100,268,313) . . . . . . . . . . . . . . . . . . . 106,299,800
cEquity-Linked Securities 17.1%Aerospace & Defense 1.6%
dSociete Generale SA into Raytheon Technologies Corp., 144A, 8%, 6/01/21 . . . . . . . . . . . . . . . . . . . . . . . . . . . . . . . . . . . . . . . . . . . United States 832,000 66,242,151
Capital Markets 1.7%dCredit Suisse AG into Charles Schwab Corp. (The), 144A, 6.5%,
5/18/21 . . . . . . . . . . . . . . . . . . . . . . . . . . . . . . . . . . . . . . . . . . . United States 1,007,000 51,981,234dUBS AG into Morgan Stanley, 144A, 8.5%, 2/11/22 . . . . . . . . . . . . United States 220,000 17,835,375
69,816,609
Chemicals 0.6%dNational Bank of Canada into Air Products and Chemicals, Inc.,
144A, 8.5%, 4/13/22 . . . . . . . . . . . . . . . . . . . . . . . . . . . . . . . . . United States 86,000 25,185,567
Communications Equipment 1.4%dRoyal Bank of Canada into Cisco Systems, Inc., 144A, 7.5%, 8/04/21 United States 1,077,000 55,006,766

FRANKLIN INVESTORS SECURITIES TRUSTSTATEMENT OF INVESTMENTS (UNAUDITED)
Franklin Managed Income Fund (continued)
franklintempleton.com The accompanying notes are an integral part of these financial statements. Semiannual Report 47
a a Country Shares a Valuea a a a a a
cEquity-Linked Securities (continued) Energy Equipment & Services 0.6%
dRoyal Bank of Canada into Schlumberger NV, 144A, 10%, 3/01/22 United States 850,000 $23,734,652
IT Services 0.8%dBarclays Bank plc into Fidelity National Information Services, Inc.,
144A, 7.5%, 6/02/21 . . . . . . . . . . . . . . . . . . . . . . . . . . . . . . . . . United States 222,000 33,924,863
Media 0.9%dMerrill Lynch International & Co. CV into Comcast Corp., 144A, 7%,
8/09/21 . . . . . . . . . . . . . . . . . . . . . . . . . . . . . . . . . . . . . . . . . . . United States 744,000 36,585,470
Multiline Retail 0.8%dSociete Generale SA into Target Corp., 144A, 8%, 12/20/21. . . . . . United States 168,000 32,615,340
Pharmaceuticals 1.4%dCredit Suisse AG into Pfizer, Inc., 144A, 8%, 8/27/21 . . . . . . . . . . . United States 1,493,000 58,261,649
Semiconductors & Semiconductor Equipment 5.0%dBarclays Bank plc into Intel Corp., 144A, 8%, 8/16/21 . . . . . . . . . . United States 1,054,000 62,101,166dBNP Paribas Issuance BV into Texas Instruments, Inc., 144A, 8.5%,
6/01/21 . . . . . . . . . . . . . . . . . . . . . . . . . . . . . . . . . . . . . . . . . . . United States 715,000 99,311,733dRoyal Bank of Canada into Analog Devices, Inc., 144A, 8%, 2/01/22 United States 246,000 39,441,249
200,854,148
Software 0.8%dMerrill Lynch International & Co. CV into Oracle Corp., 144A, 8%,
11/08/21 . . . . . . . . . . . . . . . . . . . . . . . . . . . . . . . . . . . . . . . . . . United States 470,000 31,396,583
Technology Hardware, Storage & Peripherals 0.5%dBNP Paribas Issuance BV into Apple, Inc., 144A, 10%, 12/22/21 . . United States 164,000 21,582,543
Trading Companies & Distributors 1.0%dJPMorgan Chase Bank NA into Fastenal Co., 144A, 7.5%, 12/03/21 United States 770,000 39,745,050
Total Equity-Linked Securities (Cost $617,476,604) . . . . . . . . . . . . . . . . . . . . . . . . . . . . . . 694,951,391
Convertible Preferred Stocks 10.8%Capital Markets 0.4%
aKKR & Co., Inc., 6%, C . . . . . . . . . . . . . . . . . . . . . . . . . . . . . . . . . United States 200,000 14,996,000
Chemicals 0.6%aInternational Flavors & Fragrances, Inc., 6% . . . . . . . . . . . . . . . . . United States 500,000 24,775,000
Electric Utilities 3.8%American Electric Power Co., Inc., 6.125% . . . . . . . . . . . . . . . . . . United States 700,000 35,133,000NextEra Energy, Inc., 5.279% . . . . . . . . . . . . . . . . . . . . . . . . . . . . United States 1,200,000 60,444,000Southern Co. (The), 6.75%, 2019 . . . . . . . . . . . . . . . . . . . . . . . . . United States 1,150,000 60,260,000
155,837,000
Health Care Equipment & Supplies 1.8%Boston Scientific Corp., 5.5%, A . . . . . . . . . . . . . . . . . . . . . . . . . . United States 250,000 29,395,000
aDanaher Corp., 5%, B . . . . . . . . . . . . . . . . . . . . . . . . . . . . . . . . . . United States 30,000 42,472,500
71,867,500
Health Care Technology 0.5%Change Healthcare, Inc., 6% . . . . . . . . . . . . . . . . . . . . . . . . . . . . . United States 250,000 19,135,000
Multi-Utilities 2.6%Dominion Energy, Inc., 7.25%, A . . . . . . . . . . . . . . . . . . . . . . . . . . United States 450,000 46,417,500DTE Energy Co., 6.25% . . . . . . . . . . . . . . . . . . . . . . . . . . . . . . . . United States 750,000 38,055,000
aSempra Energy, 6.75%, B . . . . . . . . . . . . . . . . . . . . . . . . . . . . . . . United States 200,000 20,988,000
105,460,500
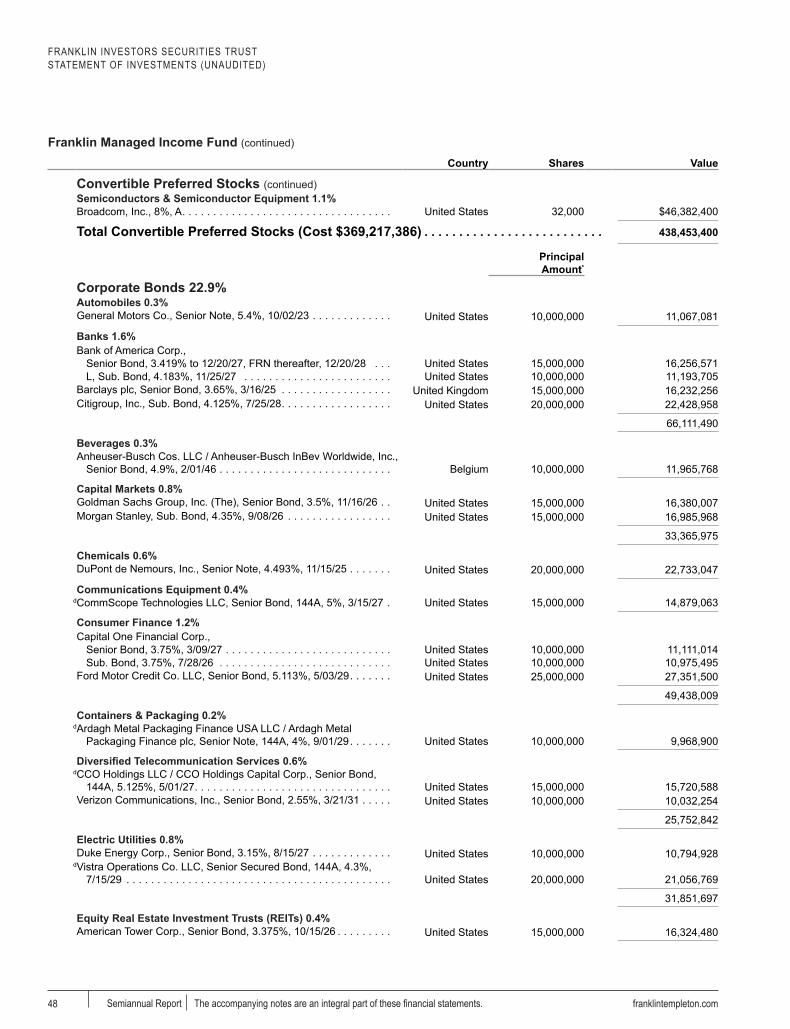
FRANKLIN INVESTORS SECURITIES TRUSTSTATEMENT OF INVESTMENTS (UNAUDITED)
Franklin Managed Income Fund (continued)
franklintempleton.comSemiannual Report The accompanying notes are an integral part of these financial statements.48
a a Country Shares a Valuea a a a a a
Convertible Preferred Stocks (continued) Semiconductors & Semiconductor Equipment 1.1%Broadcom, Inc., 8%, A . . . . . . . . . . . . . . . . . . . . . . . . . . . . . . . . . . United States 32,000 $46,382,400
Total Convertible Preferred Stocks (Cost $369,217,386) . . . . . . . . . . . . . . . . . . . . . . . . . . 438,453,400
Principal Amount*
Corporate Bonds 22.9%Automobiles 0.3%General Motors Co., Senior Note, 5.4%, 10/02/23 . . . . . . . . . . . . . United States 10,000,000 11,067,081
Banks 1.6%Bank of America Corp.,
Senior Bond, 3.419% to 12/20/27, FRN thereafter, 12/20/28 . . . United States 15,000,000 16,256,571L, Sub. Bond, 4.183%, 11/25/27 . . . . . . . . . . . . . . . . . . . . . . . . United States 10,000,000 11,193,705
Barclays plc, Senior Bond, 3.65%, 3/16/25 . . . . . . . . . . . . . . . . . . United Kingdom 15,000,000 16,232,256Citigroup, Inc., Sub. Bond, 4.125%, 7/25/28 . . . . . . . . . . . . . . . . . . United States 20,000,000 22,428,958
66,111,490
Beverages 0.3%Anheuser-Busch Cos. LLC / Anheuser-Busch InBev Worldwide, Inc.,
Senior Bond, 4.9%, 2/01/46 . . . . . . . . . . . . . . . . . . . . . . . . . . . . Belgium 10,000,000 11,965,768
Capital Markets 0.8%Goldman Sachs Group, Inc. (The), Senior Bond, 3.5%, 11/16/26 . . United States 15,000,000 16,380,007Morgan Stanley, Sub. Bond, 4.35%, 9/08/26 . . . . . . . . . . . . . . . . . United States 15,000,000 16,985,968
33,365,975
Chemicals 0.6%DuPont de Nemours, Inc., Senior Note, 4.493%, 11/15/25 . . . . . . . United States 20,000,000 22,733,047
Communications Equipment 0.4%dCommScope Technologies LLC, Senior Bond, 144A, 5%, 3/15/27 . United States 15,000,000 14,879,063
Consumer Finance 1.2%Capital One Financial Corp.,
Senior Bond, 3.75%, 3/09/27 . . . . . . . . . . . . . . . . . . . . . . . . . . . United States 10,000,000 11,111,014Sub. Bond, 3.75%, 7/28/26 . . . . . . . . . . . . . . . . . . . . . . . . . . . . United States 10,000,000 10,975,495
Ford Motor Credit Co. LLC, Senior Bond, 5.113%, 5/03/29 . . . . . . . United States 25,000,000 27,351,500
49,438,009
Containers & Packaging 0.2%dArdagh Metal Packaging Finance USA LLC / Ardagh Metal
Packaging Finance plc, Senior Note, 144A, 4%, 9/01/29 . . . . . . . United States 10,000,000 9,968,900
Diversified Telecommunication Services 0.6%dCCO Holdings LLC / CCO Holdings Capital Corp., Senior Bond,
144A, 5.125%, 5/01/27 . . . . . . . . . . . . . . . . . . . . . . . . . . . . . . . . United States 15,000,000 15,720,588Verizon Communications, Inc., Senior Bond, 2.55%, 3/21/31 . . . . . United States 10,000,000 10,032,254
25,752,842
Electric Utilities 0.8%Duke Energy Corp., Senior Bond, 3.15%, 8/15/27 . . . . . . . . . . . . . United States 10,000,000 10,794,928
dVistra Operations Co. LLC, Senior Secured Bond, 144A, 4.3%, 7/15/29 . . . . . . . . . . . . . . . . . . . . . . . . . . . . . . . . . . . . . . . . . . . United States 20,000,000 21,056,769
31,851,697
Equity Real Estate Investment Trusts (REITs) 0.4%American Tower Corp., Senior Bond, 3.375%, 10/15/26 . . . . . . . . . United States 15,000,000 16,324,480

FRANKLIN INVESTORS SECURITIES TRUSTSTATEMENT OF INVESTMENTS (UNAUDITED)
Franklin Managed Income Fund (continued)
franklintempleton.com The accompanying notes are an integral part of these financial statements. Semiannual Report 49
a a CountryPrincipal Amount*
a Valuea a a a a a
Corporate Bonds (continued) Food & Staples Retailing 0.5%Walmart, Inc., Senior Bond, 3.25%, 7/08/29 . . . . . . . . . . . . . . . . . . United States 20,000,000 $22,191,484
Food Products 0.4%dPost Holdings, Inc., Senior Bond, 144A, 4.5%, 9/15/31 . . . . . . . . . United States 15,000,000 14,910,750
Health Care Equipment & Supplies 0.3%Edwards Lifesciences Corp., Senior Bond, 4.3%, 6/15/28 . . . . . . . United States 9,700,000 11,054,793
Health Care Providers & Services 4.8%Centene Corp.,
Senior Bond, 3%, 10/15/30 . . . . . . . . . . . . . . . . . . . . . . . . . . . . United States 15,000,000 14,906,250Senior Note, 4.625%, 12/15/29 . . . . . . . . . . . . . . . . . . . . . . . . . United States 20,000,000 21,676,900
dCHS/Community Health Systems, Inc.,Secured Note, 144A, 8.125%, 6/30/24 . . . . . . . . . . . . . . . . . . . . United States 6,000,000 6,277,500Secured Note, 144A, 6.875%, 4/15/29 . . . . . . . . . . . . . . . . . . . . United States 20,000,000 20,929,100Senior Secured Note, 144A, 6.625%, 2/15/25 . . . . . . . . . . . . . . United States 25,000,000 26,401,750Senior Secured Note, 144A, 8%, 3/15/26 . . . . . . . . . . . . . . . . . . United States 25,000,000 26,968,750
Cigna Corp.,Senior Note, 3.75%, 7/15/23 . . . . . . . . . . . . . . . . . . . . . . . . . . . United States 7,216,000 7,707,791Senior Note, 3.4%, 3/01/27 . . . . . . . . . . . . . . . . . . . . . . . . . . . . United States 15,000,000 16,400,048
CVS Health Corp.,Senior Bond, 3.875%, 7/20/25 . . . . . . . . . . . . . . . . . . . . . . . . . . United States 15,000,000 16,629,081Senior Bond, 5.05%, 3/25/48 . . . . . . . . . . . . . . . . . . . . . . . . . . . United States 15,000,000 18,474,450
Tenet Healthcare Corp., Senior Secured Note, 4.625%, 7/15/24 . . . United States 17,000,000 17,277,950
193,649,570
Hotels, Restaurants & Leisure 0.8%Las Vegas Sands Corp., Senior Bond, 3.9%, 8/08/29 . . . . . . . . . . . United States 10,000,000 10,440,641
dVail Resorts, Inc., Senior Note, 144A, 6.25%, 5/15/25 . . . . . . . . . . United States 10,000,000 10,625,000dWynn Las Vegas LLC / Wynn Las Vegas Capital Corp., Senior Bond,
144A, 5.5%, 3/01/25 . . . . . . . . . . . . . . . . . . . . . . . . . . . . . . . . . United States 10,000,000 10,691,050
31,756,691
Insurance 0.4%dLiberty Mutual Group, Inc., Senior Note, 144A, 4.95%, 5/01/22 . . . United States 7,100,000 7,408,803Prudential Financial, Inc., Junior Sub. Bond, 3.7% to 10/01/30, FRN
thereafter, 10/01/50 . . . . . . . . . . . . . . . . . . . . . . . . . . . . . . . . . . United States 10,000,000 10,337,500
17,746,303
IT Services 0.6%Fiserv, Inc., Senior Bond, 4.2%, 10/01/28 . . . . . . . . . . . . . . . . . . . United States 20,000,000 22,720,165
Machinery 0.2%CNH Industrial NV, Senior Bond, 3.85%, 11/15/27 . . . . . . . . . . . . . United Kingdom 7,500,000 8,326,285
Media 0.3%DISH DBS Corp., Senior Note, 5.875%, 7/15/22 . . . . . . . . . . . . . . United States 12,000,000 12,579,000
Metals & Mining 0.8%dCleveland-Cliffs, Inc., Senior Secured Note, 144A, 9.875%, 10/17/25 United States 6,620,000 7,778,500dFMG Resources August 2006 Pty. Ltd., Senior Bond, 144A, 4.375%,
4/01/31 . . . . . . . . . . . . . . . . . . . . . . . . . . . . . . . . . . . . . . . . . . . Australia 15,000,000 15,601,650Freeport-McMoRan, Inc., Senior Bond, 5.25%, 9/01/29 . . . . . . . . . United States 10,000,000 11,099,150
34,479,300
Multiline Retail 0.3%Dollar General Corp., Senior Bond, 3.875%, 4/15/27 . . . . . . . . . . . United States 10,000,000 11,216,478

FRANKLIN INVESTORS SECURITIES TRUSTSTATEMENT OF INVESTMENTS (UNAUDITED)
Franklin Managed Income Fund (continued)
franklintempleton.comSemiannual Report The accompanying notes are an integral part of these financial statements.50
a a CountryPrincipal Amount*
a Valuea a a a a a
Corporate Bonds (continued) Oil, Gas & Consumable Fuels 0.7%
dCalumet Specialty Products Partners LP / Calumet Finance Corp., Senior Note, 144A, 11%, 4/15/25 . . . . . . . . . . . . . . . . . . . . . . . . United States 15,000,000 $16,380,600
Occidental Petroleum Corp., Senior Note, 6.375%, 9/01/28 . . . . . . United States 10,000,000 11,212,900
27,593,500
Pharmaceuticals 2.7%dBausch Health Cos., Inc.,
Senior Note, 144A, 5%, 2/15/29 . . . . . . . . . . . . . . . . . . . . . . . . United States 10,000,000 10,027,900Senior Secured Note, 144A, 5.5%, 11/01/25 . . . . . . . . . . . . . . . United States 10,000,000 10,325,000
dBayer US Finance II LLC, Senior Note, 144A, 4.25%, 12/15/25 . . . Germany 15,000,000 16,755,575Bristol-Myers Squibb Co., Senior Note, 3.4%, 7/26/29 . . . . . . . . . . United States 10,000,000 11,039,672
dEndo Luxembourg Finance Co. I SARL / Endo US, Inc., Senior Secured Note, 144A, 6.125%, 4/01/29 . . . . . . . . . . . . . . . . . . . . United States 15,000,000 14,868,750
dJazz Securities DAC, Senior Secured Note, 144A, 4.375%, 1/15/29 United States 25,000,000 25,593,750Mylan, Inc., Senior Note, 4.55%, 4/15/28 . . . . . . . . . . . . . . . . . . . . United States 19,000,000 21,575,859
110,186,506
Road & Rail 0.5%dAshtead Capital, Inc., Senior Note, 144A, 4.125%, 8/15/25 . . . . . . United Kingdom 21,000,000 21,630,000
Semiconductors & Semiconductor Equipment 0.4%Microchip Technology, Inc., Senior Secured Note, 4.333%, 6/01/23 United States 15,000,000 16,091,153
Tobacco 0.8%BAT Capital Corp., Senior Note, 3.557%, 8/15/27 . . . . . . . . . . . . . United Kingdom 15,000,000 15,990,105Reynolds American, Inc., Senior Bond, 4.45%, 6/12/25 . . . . . . . . . United Kingdom 15,000,000 16,706,882
32,696,987
Wireless Telecommunication Services 1.2%Sprint Corp., Senior Note, 7.625%, 2/15/25 . . . . . . . . . . . . . . . . . . United States 10,000,000 11,887,500
dSprint Spectrum Co. LLC / Sprint Spectrum Co. II LLC / Sprint Spectrum Co. III LLC, Senior Secured Note, 144A, 4.738%, 9/20/29 . . . . . . . . . . . . . . . . . . . . . . . . . . . . . . . . . . . . . . . . . . . United States 7,500,000 8,053,125
dT-Mobile USA, Inc., Senior Secured Bond, 144A, 3.875%, 4/15/30 . United States 25,000,000 27,263,750
47,204,375
Total Corporate Bonds (Cost $850,779,152) . . . . . . . . . . . . . . . . . . . . . . . . . . . . . . . . . . . . . 929,491,692
U.S. Government and Agency Securities 1.9%U.S. Treasury Notes,
2.75%, 9/15/21 . . . . . . . . . . . . . . . . . . . . . . . . . . . . . . . . . . . . . United States 25,000,000 25,250,9302.875%, 10/31/23 . . . . . . . . . . . . . . . . . . . . . . . . . . . . . . . . . . . . United States 50,000,000 53,273,437
Total U.S. Government and Agency Securities (Cost $74,939,809) . . . . . . . . . . . . . . . . . 78,524,367
Asset-Backed Securities 0.6%Airlines 0.6%United Airlines Pass-Through Trust,
2020-1, A, 5.875%, 10/15/27 . . . . . . . . . . . . . . . . . . . . . . . . . . . United States 9,516,500 10,548,4102020-1, B, 4.875%, 7/15/27 . . . . . . . . . . . . . . . . . . . . . . . . . . . . United States 11,646,000 12,183,779
22,732,189a a a a a a
Total Asset-Backed Securities (Cost $21,162,500) . . . . . . . . . . . . . . . . . . . . . . . . . . . . . . . 22,732,189
Mortgage-Backed Securities 0.8%Federal National Mortgage Association (FNMA) Fixed Rate 0.0%†
FNMA, 30 Year, 4%, 8/01/49 . . . . . . . . . . . . . . . . . . . . . . . . . . . . . United States 1,979,501 2,161,317

FRANKLIN INVESTORS SECURITIES TRUSTSTATEMENT OF INVESTMENTS (UNAUDITED)
Franklin Managed Income Fund (continued)
franklintempleton.com The accompanying notes are an integral part of these financial statements. Semiannual Report 51
a a CountryPrincipal Amount*
a Valuea a a a a a
Mortgage-Backed Securities (continued) Government National Mortgage Association (GNMA) Fixed Rate 0.8%GNMA II, Single-family, 30 Year, 3%, 1/20/51 . . . . . . . . . . . . . . . . . United States 30,589,346 $32,039,585
Total Mortgage-Backed Securities (Cost $34,727,262) . . . . . . . . . . . . . . . . . . . . . . . . . . . . 34,200,902
Total Long Term Investments (Cost $3,382,054,943) . . . . . . . . . . . . . . . . . . . . . . . . . . . . . 4,002,909,684 a
Short Term Investments 1.5%a a Country Shares a Value a
Money Market Funds 1.2%b,eInstitutional Fiduciary Trust - Money Market Portfolio, 0.01% . . . . . United States 47,004,418 47,004,418
Total Money Market Funds (Cost $47,004,418) . . . . . . . . . . . . . . . . . . . . . . . . . . . . . . . . . . 47,004,418
fInvestments from Cash Collateral Received for Loaned Securities 0.3%
a a a a a
Money Market Funds 0.2%b,eInstitutional Fiduciary Trust - Money Market Portfolio, 0.01% . . . . . United States 8,000,000 8,000,000
Principal Amount*
Repurchase Agreements 0.1%gJoint Repurchase Agreement, BofA Securities, Inc., 0%, 5/03/21
(Maturity Value $4,074,758) Collateralized by U.S. Treasury Note, 1.5%, 11/30/24 (valued at $4,156,257) . . . . . . . . . . . . . . . . . . . . . . . . . . . . . . . . . . . . . . . . 4,074,758 4,074,758
Total Investments from Cash Collateral Received for Loaned Securities (Cost $12,074,758) . . . . . . . . . . . . . . . . . . . . . . . . . . . . . . . . . . . . . . . . . . . . . . . . . . . . . . . . . . . 12,074,758
Total Short Term Investments (Cost $59,079,176) . . . . . . . . . . . . . . . . . . . . . . . . . . . . . . . . 59,079,176
a
Total Investments (Cost $3,441,134,119) 100.1% . . . . . . . . . . . . . . . . . . . . . . . . . . . . . . . . . $4,061,988,860Other Assets, less Liabilities (0.1)% . . . . . . . . . . . . . . . . . . . . . . . . . . . . . . . . . . . . . . . . . . . (1,279,975)
Net Assets 100.0% . . . . . . . . . . . . . . . . . . . . . . . . . . . . . . . . . . . . . . . . . . . . . . . . . . . . . . . . . . . $4,060,708,885
See Abbreviations on page 76.
* The principal amount is stated in U.S. dollars unless otherwise indicated.† Rounds to less than 0.1% of net assets.a A portion or all of the security is on loan at April 30, 2021. See Note 1(f).b See Note 3(f) regarding investments in affiliated management investment companies.c See Note 1(e) regarding equity-linked securities.d Security was purchased pursuant to Rule 144A or Regulation S under the Securities Act of 1933. 144A securities may be sold in transactions exempt from registration only to qualified institutional buyers or in a public offering registered under the Securities Act of 1933. Regulation S securities cannot be sold in the United States without either an effective registration statement filed pursuant to the Securities Act of 1933, or pursuant to an exemption from registration. At April 30, 2021, the aggregate value of these securities was $1,055,068,014, representing 26.0% of net assets.e The rate shown is the annualized seven-day effective yield at period end.f See Note 1(f) regarding securities on loan.g See Note 1(c) regarding joint repurchase agreement.

FRANKLIN INVESTORS SECURITIES TRUSTFINANCIAL STATEMENTS
Statements of Assets and LiabilitiesApril 30, 2021 (unaudited)
franklintempleton.comSemiannual Report The accompanying notes are an integral part of these financial statements.52
Franklin Convertible
Securities FundFranklin Equity
Income Fund
Franklin Managed
Income Fund
Assets:Investments in securities:
Cost - Unaffiliated issuers . . . . . . . . . . . . . . . . . . . . . . . . . . . . . . . . . $4,055,233,273 $2,132,113,173 $3,281,786,630Cost - Controlled affiliates (Note 3f) . . . . . . . . . . . . . . . . . . . . . . . . . . — — 66,567,063Cost - Non-controlled affiliates (Note 3f) . . . . . . . . . . . . . . . . . . . . . . 59,071,613 51,206,832 88,705,668Cost - Unaffiliated repurchase agreements . . . . . . . . . . . . . . . . . . . . 7,178,301 4,579,721 4,074,758
Value - Unaffiliated issuers (Includes securities loaned of $39,260,433, $22,036,934 and $31,847,980 respectively) . . . . . . . . . . . . . . . . . . . $5,198,904,231 $3,196,944,201 $3,896,609,884Value - Controlled affiliates (Note 3f) . . . . . . . . . . . . . . . . . . . . . . . . . — — 69,129,800Value - Non-controlled affiliates (Note 3f) . . . . . . . . . . . . . . . . . . . . . . 59,071,613 51,206,832 92,174,418Value - Unaffiliated repurchase agreements . . . . . . . . . . . . . . . . . . . . 7,178,301 4,579,721 4,074,758
Cash . . . . . . . . . . . . . . . . . . . . . . . . . . . . . . . . . . . . . . . . . . . . . . . . . . — 398,012 —Receivables:
Investment securities sold . . . . . . . . . . . . . . . . . . . . . . . . . . . . . . . . . — 3,306,990 —Capital shares sold . . . . . . . . . . . . . . . . . . . . . . . . . . . . . . . . . . . . . . 5,445,318 4,079,614 3,239,128Dividends and interest . . . . . . . . . . . . . . . . . . . . . . . . . . . . . . . . . . . 11,284,620 3,995,378 14,792,231European Union tax reclaims (Note 1g) . . . . . . . . . . . . . . . . . . . . . . . — 554,592 847,551
Total assets . . . . . . . . . . . . . . . . . . . . . . . . . . . . . . . . . . . . . . . . 5,281,884,083 3,265,065,340 4,080,867,770Liabilities:
Payables:Investment securities purchased . . . . . . . . . . . . . . . . . . . . . . . . . . . . — 4,811,651 —Capital shares redeemed . . . . . . . . . . . . . . . . . . . . . . . . . . . . . . . . . 7,782,599 3,067,850 4,444,554Management fees . . . . . . . . . . . . . . . . . . . . . . . . . . . . . . . . . . . . . . . 1,981,595 1,204,944 1,872,508Distribution fees . . . . . . . . . . . . . . . . . . . . . . . . . . . . . . . . . . . . . . . . 528,082 688,218 964,513Transfer agent fees . . . . . . . . . . . . . . . . . . . . . . . . . . . . . . . . . . . . . . 670,129 445,004 539,099
Payable upon return of securities loaned (Note 1f) . . . . . . . . . . . . . . . . 35,889,301 22,896,721 12,074,758Accrued expenses and other liabilities . . . . . . . . . . . . . . . . . . . . . . . . . 236,801 160,011 263,453
Total liabilities . . . . . . . . . . . . . . . . . . . . . . . . . . . . . . . . . . . . . . . 47,088,507 33,274,399 20,158,885Net assets, at value . . . . . . . . . . . . . . . . . . . . . . . . . . . . . . . $5,234,795,576 $3,231,790,941 $4,060,708,885
Net assets consist of:Paid-in capital . . . . . . . . . . . . . . . . . . . . . . . . . . . . . . . . . . . . . . . . . . . $3,426,023,313 $2,040,054,571 $3,345,605,412Total distributable earnings (losses) . . . . . . . . . . . . . . . . . . . . . . . . . . . 1,808,772,263 1,191,736,370 715,103,473
Net assets, at value . . . . . . . . . . . . . . . . . . . . . . . . . . . . . . . $5,234,795,576 $3,231,790,941 $4,060,708,885

FRANKLIN INVESTORS SECURITIES TRUSTFINANCIAL STATEMENTS
Statements of Assets and Liabilities (continued)
April 30, 2021 (unaudited)
franklintempleton.com The accompanying notes are an integral part of these financial statements. Semiannual Report 53
Franklin Convertible
Securities FundFranklin Equity
Income Fund
Franklin Managed
Income Fund
Class A:Net assets, at value . . . . . . . . . . . . . . . . . . . . . . . . . . . . . . . . . . . . . $1,581,098,247 $2,562,204,074 $3,333,887,594Shares outstanding . . . . . . . . . . . . . . . . . . . . . . . . . . . . . . . . . . . . . . 53,411,569 84,804,292 247,051,663Net asset value per sharea . . . . . . . . . . . . . . . . . . . . . . . . . . . . . . . . $29.60 $30.21 $13.49Maximum offering price per share (net asset value per share ÷ 94.50%, 94.50% and 94.50%, respectively) . . . . . . . . . . . . . . . . . . . . . . . . . . $31.32 $31.97 $14.28
Class C:Net assets, at value . . . . . . . . . . . . . . . . . . . . . . . . . . . . . . . . . . . . . $243,665,746 $209,685,524 $344,602,170Shares outstanding . . . . . . . . . . . . . . . . . . . . . . . . . . . . . . . . . . . . . . 8,386,358 6,997,106 25,804,998Net asset value and maximum offering price per sharea . . . . . . . . . . . $29.06 $29.97 $13.35
Class R:Net assets, at value . . . . . . . . . . . . . . . . . . . . . . . . . . . . . . . . . . . . . $— $8,372,116 $3,340,534Shares outstanding . . . . . . . . . . . . . . . . . . . . . . . . . . . . . . . . . . . . . . — 276,971 246,796Net asset value and maximum offering price per share . . . . . . . . . . . $— $30.23 $13.54
Class R6:Net assets, at value . . . . . . . . . . . . . . . . . . . . . . . . . . . . . . . . . . . . . $128,423,944 $132,096,230 $178,359,397Shares outstanding . . . . . . . . . . . . . . . . . . . . . . . . . . . . . . . . . . . . . . 4,305,582 4,363,447 13,173,936Net asset value and maximum offering price per share . . . . . . . . . . . $29.83 $30.27 $13.54
Advisor Class:Net assets, at value . . . . . . . . . . . . . . . . . . . . . . . . . . . . . . . . . . . . . $3,281,607,639 $319,432,997 $200,519,190Shares outstanding . . . . . . . . . . . . . . . . . . . . . . . . . . . . . . . . . . . . . . 110,836,203 10,555,357 14,820,867Net asset value and maximum offering price per share . . . . . . . . . . . $29.61 $30.26 $13.53
aRedemption price is equal to net asset value less contingent deferred sales charges, if applicable.

FRANKLIN INVESTORS SECURITIES TRUSTFINANCIAL STATEMENTS
Statements of Operationsfor the six months ended April 30, 2021 (unaudited)
franklintempleton.comSemiannual Report The accompanying notes are an integral part of these financial statements.54
Franklin Convertible
Securities FundFranklin Equity
Income Fund
Franklin Managed
Income Fund
Investment income:Dividends: (net of foreign taxes of $–, $508,032 and $249,987, respectively)
Unaffiliated issuers . . . . . . . . . . . . . . . . . . . . . . . . . . . . . . . . . . . . . . $23,773,391 $36,590,827 $38,723,404Controlled affiliates (Note 3f) . . . . . . . . . . . . . . . . . . . . . . . . . . . . . . . — — 347,154Non-controlled affiliates (Note 3f) . . . . . . . . . . . . . . . . . . . . . . . . . . . 1,502 613 416,084
Interest: Unaffiliated issuers . . . . . . . . . . . . . . . . . . . . . . . . . . . . . . . . . . . . . . 15,188,377 685,830 24,865,562
Income from securities loaned:Unaffiliated entities (net of fees and rebates) . . . . . . . . . . . . . . . . . . . 115,140 6,440 23,820Non-controlled affiliates (Note 3f) . . . . . . . . . . . . . . . . . . . . . . . . . . . 411 132 48
Other income (Note 1g) . . . . . . . . . . . . . . . . . . . . . . . . . . . . . . . . . . . . — 4,675 237,945Total investment income . . . . . . . . . . . . . . . . . . . . . . . . . . . . . . . . . 39,078,821 37,288,517 64,614,017
Expenses:Management fees (Note 3a) . . . . . . . . . . . . . . . . . . . . . . . . . . . . . . . . . 11,701,295 6,667,255 10,480,554Distribution fees: (Note 3c) Class A . . . . . . . . . . . . . . . . . . . . . . . . . . . . . . . . . . . . . . . . . . . . . . 1,944,882 2,842,844 3,909,207 Class C . . . . . . . . . . . . . . . . . . . . . . . . . . . . . . . . . . . . . . . . . . . . . . 1,252,218 945,327 1,728,003 Class R . . . . . . . . . . . . . . . . . . . . . . . . . . . . . . . . . . . . . . . . . . . . . . — 17,593 7,866Transfer agent fees: (Note 3e) Class A . . . . . . . . . . . . . . . . . . . . . . . . . . . . . . . . . . . . . . . . . . . . . . 738,490 1,269,235 1,573,138 Class C . . . . . . . . . . . . . . . . . . . . . . . . . . . . . . . . . . . . . . . . . . . . . . 118,893 105,511 174,979 Class R . . . . . . . . . . . . . . . . . . . . . . . . . . . . . . . . . . . . . . . . . . . . . . — 4,031 1,589 Class R6 . . . . . . . . . . . . . . . . . . . . . . . . . . . . . . . . . . . . . . . . . . . . . 33,096 25,928 31,092 Advisor Class . . . . . . . . . . . . . . . . . . . . . . . . . . . . . . . . . . . . . . . . . . 1,495,877 150,531 92,168Custodian fees (Note 4) . . . . . . . . . . . . . . . . . . . . . . . . . . . . . . . . . . . . 12,409 9,329 15,762Reports to shareholders . . . . . . . . . . . . . . . . . . . . . . . . . . . . . . . . . . . . 134,435 96,262 138,060Registration and filing fees . . . . . . . . . . . . . . . . . . . . . . . . . . . . . . . . . . 61,152 71,301 87,928Professional fees . . . . . . . . . . . . . . . . . . . . . . . . . . . . . . . . . . . . . . . . . 38,244 39,286 40,506Trustees' fees and expenses . . . . . . . . . . . . . . . . . . . . . . . . . . . . . . . . 20,445 12,693 19,452Other . . . . . . . . . . . . . . . . . . . . . . . . . . . . . . . . . . . . . . . . . . . . . . . . . . 41,032 26,011 37,726
Total expenses . . . . . . . . . . . . . . . . . . . . . . . . . . . . . . . . . . . . . . . 17,592,468 12,283,137 18,338,030Expense reductions (Note 4) . . . . . . . . . . . . . . . . . . . . . . . . . . . . . (227) (106) (16,254)Expenses waived/paid by affiliates (Note 3f and 3g) . . . . . . . . . . . . (67,982) (23,767) (144,145)
Net expenses . . . . . . . . . . . . . . . . . . . . . . . . . . . . . . . . . . . . . . . 17,524,259 12,259,264 18,177,631Net investment income . . . . . . . . . . . . . . . . . . . . . . . . . . . . . . 21,554,562 25,029,253 46,436,386

FRANKLIN INVESTORS SECURITIES TRUSTFINANCIAL STATEMENTS
Statements of Operations (continued)
for the six months ended April 30, 2021 (unaudited)
franklintempleton.com The accompanying notes are an integral part of these financial statements. Semiannual Report 55
Franklin Convertible
Securities FundFranklin Equity
Income Fund
Franklin Managed
Income Fund
Realized and unrealized gains (losses):Net realized gain (loss) from:
Investments: Unaffiliated issuers . . . . . . . . . . . . . . . . . . . . . . . . . . . . . . . . . . . . 694,684,649 130,103,654 121,327,284
Written options . . . . . . . . . . . . . . . . . . . . . . . . . . . . . . . . . . . . . . . . . — — 4,401,972Foreign currency transactions . . . . . . . . . . . . . . . . . . . . . . . . . . . . . . — (33,280) (66,988)Capital gain distributions from management investment companies:
Non-controlled affiliates (Note 3f) . . . . . . . . . . . . . . . . . . . . . . . . . . — — 1,805,826Net realized gain (loss) . . . . . . . . . . . . . . . . . . . . . . . . . . . . . . . . 694,684,649 130,070,374 127,468,094
Net change in unrealized appreciation (depreciation) on:Investments:
Unaffiliated issuers . . . . . . . . . . . . . . . . . . . . . . . . . . . . . . . . . . . . 238,842,427 515,144,986 438,300,734Controlled affiliates (Note 3f) . . . . . . . . . . . . . . . . . . . . . . . . . . . . . — — 5,711,195Non-controlled affiliates (Note 3f) . . . . . . . . . . . . . . . . . . . . . . . . . . — — 9,500,850
Translation of other assets and liabilities denominated in foreign currencies . . . . . . . . . . . . . . . . . . . . . . . . . . . . . . . . . . . . . . . . . . . — 34,716 36,543
Written options . . . . . . . . . . . . . . . . . . . . . . . . . . . . . . . . . . . . . . . . . — — 37,871Net change in unrealized appreciation (depreciation) . . . . . . . . . . 238,842,427 515,179,702 453,587,193
Net realized and unrealized gain (loss) . . . . . . . . . . . . . . . . . . . . . . . . . . 933,527,076 645,250,076 581,055,287Net increase (decrease) in net assets resulting from operations . . . . . . . . $955,081,638 $670,279,329 $627,491,673

FRANKLIN INVESTORS SECURITIES TRUSTFINANCIAL STATEMENTS
Statements of Changes in Net Assets
franklintempleton.comSemiannual Report The accompanying notes are an integral part of these financial statements.56
Franklin Convertible Securities Fund Franklin Equity Income FundSix Months Ended
April 30, 2021 (unaudited)
Year Ended October 31, 2020
Six Months Ended April 30, 2021
(unaudited)Year Ended
October 31, 2020
Increase (decrease) in net assets:Operations:
Net investment income . . . . . . . . . . . . $21,554,562 $42,939,240 $25,029,253 $47,722,036Net realized gain (loss) . . . . . . . . . . . . 694,684,649 564,693,488 130,070,374 35,390,855Net change in unrealized appreciation
(depreciation) . . . . . . . . . . . . . . . . . 238,842,427 507,214,078 515,179,702 (149,216,848)Net increase (decrease) in net
assets resulting from operations . 955,081,638 1,114,846,806 670,279,329 (66,103,957)Distributions to shareholders: Class A . . . . . . . . . . . . . . . . . . . . . . . . (157,578,834) (100,126,924) (42,933,562) (108,336,733) Class C . . . . . . . . . . . . . . . . . . . . . . . . (25,406,482) (19,635,749) (2,885,956) (9,211,870) Class R . . . . . . . . . . . . . . . . . . . . . . . . — — (125,693) (349,918) Class R6 . . . . . . . . . . . . . . . . . . . . . . . (13,419,797) (8,435,869) (2,341,678) (5,610,985) Advisor Class . . . . . . . . . . . . . . . . . . . (320,636,812) (205,378,395) (5,278,018) (10,606,257)Total distributions to shareholders . . . . . (517,041,925) (333,576,937) (53,564,907) (134,115,763)
Capital share transactions: (Note 2) Class A . . . . . . . . . . . . . . . . . . . . . . . . 60,704,414 (32,527,936) 116,537,296 97,596,429 Class C . . . . . . . . . . . . . . . . . . . . . . . . (11,866,700) (71,327,737) 7,174,371 (30,492,088) Class R . . . . . . . . . . . . . . . . . . . . . . . . — — 1,039,347 (937,037) Class R6 . . . . . . . . . . . . . . . . . . . . . . . 3,305,440 42,503,124 9,612,007 9,077,163 Advisor Class . . . . . . . . . . . . . . . . . . . 238,329,658 (70,863,853) 42,299,908 59,317,042Total capital share transactions . . . . . . . 290,472,812 (132,216,402) 176,662,929 134,561,509
Net increase (decrease) in net assets . . . . . . . . . . . . . . . . . . . . . 728,512,525 649,053,467 793,377,351 (65,658,211)
Net assets:Beginning of period . . . . . . . . . . . . . . . . 4,506,283,051 3,857,229,584 2,438,413,590 2,504,071,801End of period . . . . . . . . . . . . . . . . . . . . . $5,234,795,576 $4,506,283,051 $3,231,790,941 $2,438,413,590

FRANKLIN INVESTORS SECURITIES TRUSTFINANCIAL STATEMENTS
Statements of Changes in Net Assets (continued)
franklintempleton.com The accompanying notes are an integral part of these financial statements. Semiannual Report 57
Franklin Managed Income FundSix Months Ended
April 30, 2021 (unaudited)
Year Ended October 31, 2020
Increase (decrease) in net assets:Operations:
Net investment income . . . . . . . . . . . . . . . . . . . . . . . . . . . . . . . . . . . . . . . . . . . . . . . . . $46,436,386 $91,288,516Net realized gain (loss) . . . . . . . . . . . . . . . . . . . . . . . . . . . . . . . . . . . . . . . . . . . . . . . . . 127,468,094 74,815,248Net change in unrealized appreciation (depreciation) . . . . . . . . . . . . . . . . . . . . . . . . . . . 453,587,193 (218,412,724)
Net increase (decrease) in net assets resulting from operations . . . . . . . . . . . . . . . . 627,491,673 (52,308,960)Distributions to shareholders: Class A . . . . . . . . . . . . . . . . . . . . . . . . . . . . . . . . . . . . . . . . . . . . . . . . . . . . . . . . . . . . . (79,015,835) (224,726,464) Class C . . . . . . . . . . . . . . . . . . . . . . . . . . . . . . . . . . . . . . . . . . . . . . . . . . . . . . . . . . . . . (7,598,603) (31,740,281) Class R . . . . . . . . . . . . . . . . . . . . . . . . . . . . . . . . . . . . . . . . . . . . . . . . . . . . . . . . . . . . . (76,650) (279,688) Class R6 . . . . . . . . . . . . . . . . . . . . . . . . . . . . . . . . . . . . . . . . . . . . . . . . . . . . . . . . . . . . (4,512,297) (12,745,644) Advisor Class . . . . . . . . . . . . . . . . . . . . . . . . . . . . . . . . . . . . . . . . . . . . . . . . . . . . . . . . (4,884,543) (14,013,214)Total distributions to shareholders . . . . . . . . . . . . . . . . . . . . . . . . . . . . . . . . . . . . . . . . . . (96,087,928) (283,505,291)Capital share transactions: (Note 2) Class A . . . . . . . . . . . . . . . . . . . . . . . . . . . . . . . . . . . . . . . . . . . . . . . . . . . . . . . . . . . . . 40,387,892 158,395,068 Class C . . . . . . . . . . . . . . . . . . . . . . . . . . . . . . . . . . . . . . . . . . . . . . . . . . . . . . . . . . . . . (46,086,360) (109,248,688) Class R . . . . . . . . . . . . . . . . . . . . . . . . . . . . . . . . . . . . . . . . . . . . . . . . . . . . . . . . . . . . . (201,587) (658,458) Class R6 . . . . . . . . . . . . . . . . . . . . . . . . . . . . . . . . . . . . . . . . . . . . . . . . . . . . . . . . . . . . (551,306) 10,102,120 Advisor Class . . . . . . . . . . . . . . . . . . . . . . . . . . . . . . . . . . . . . . . . . . . . . . . . . . . . . . . . 8,242,674 1,247,711Total capital share transactions . . . . . . . . . . . . . . . . . . . . . . . . . . . . . . . . . . . . . . . . . . . . 1,791,313 59,837,753
Net increase (decrease) in net assets . . . . . . . . . . . . . . . . . . . . . . . . . . . . . . . . . . . 533,195,058 (275,976,498)Net assets:
Beginning of period . . . . . . . . . . . . . . . . . . . . . . . . . . . . . . . . . . . . . . . . . . . . . . . . . . . . . 3,527,513,827 3,803,490,325End of period . . . . . . . . . . . . . . . . . . . . . . . . . . . . . . . . . . . . . . . . . . . . . . . . . . . . . . . . . . $4,060,708,885 $3,527,513,827

FRANKLIN INVESTORS SECURITIES TRUST
Notes to Financial Statements (unaudited)
58 franklintempleton.comSemiannual Report
1. Organization and Significant Accounting Policies
Franklin Investors Securities Trust (Trust) is registered under the Investment Company Act of 1940 (1940 Act) as an open-end management investment company, consisting of seven separate funds, three of which are included in this report (Funds) and applies the specialized accounting and reporting guidance in U.S. Generally Accepted Accounting Principles (U.S. GAAP). Class C shares automatically convert to Class A shares after they have been held for 10 years. Each class of shares may differ by its initial sales load, contingent deferred sales charges, voting rights on matters affecting a single class, its exchange privilege and fees due to differing arrangements for distribution and transfer agent fees. Franklin Convertible Securities Fund closed to new investors with limited exceptions on August 29, 2018.
Class A, Class C, Class R, Class R6 & Advisor Class
Franklin Managed Income FundFranklin Equity Income Fund
Class A, Class C, Class R6 & Advisor Class
Franklin Convertible Securities Fund
The following summarizes the Funds' significant accounting policies.
a. Financial Instrument Valuation The Funds' investments in financial instruments are carried at fair value daily. Fair value is the price that would be received to sell an asset or paid to transfer a liability in an orderly transaction between market participants on the measurement date. The Funds calculate the net asset value (NAV) per share each business day as of 4 p.m. Eastern time or the regularly scheduled close of the New York Stock Exchange (NYSE) whichever is earlier. Under compliance policies and procedures approved by the Trust's Board of Trustees (the Board), the Funds' administrator has responsibility for oversight of valuation, including leading the cross-functional Valuation Committee (VC). The Funds may utilize independent pricing services, quotations from securities and financial instrument dealers, and other market sources to determine fair value.
Equity securities, exchange traded funds, and derivative financial instruments listed on an exchange or on the NASDAQ National Market System are valued at the last quoted sale price or the official closing price of the day, respectively. Foreign equity securities are valued as of the
close of trading on the foreign stock exchange on which the security is primarily traded, or as of 4 p.m. Eastern time. The value is then converted into its U.S. dollar equivalent at the foreign exchange rate in effect at 4 p.m. Eastern time on the day that the value of the security is determined. Over-the-counter (OTC) securities are valued within the range of the most recent quoted bid and ask prices. Securities that trade in multiple markets or on multiple exchanges are valued according to the broadest and most representative market. Certain equity securities are valued based upon fundamental characteristics or relationships to similar securities.
Debt and certain preferred securities generally trade in the OTC market rather than on a securities exchange. The Funds' pricing services use multiple valuation techniques to determine fair value. In instances where sufficient market activity exists, the pricing services may utilize a market-based approach through which quotes from market makers are used to determine fair value. In instances where sufficient market activity may not exist or is limited, the pricing services also utilize proprietary valuation models which may consider market characteristics such as benchmark yield curves, credit spreads, estimated default rates, anticipated market interest rate volatility, coupon rates, anticipated timing of principal repayments, underlying collateral, and other unique security features in order to estimate the relevant cash flows, which are then discounted to calculate the fair value.
Investments in open-end mutual funds are valued at the closing NAV. Investments in repurchase agreements are valued at cost, which approximates fair value.
The Funds have procedures to determine the fair value of financial instruments for which market prices are not reliable or readily available. Under these procedures, the Funds primarily employ a market-based approach which may use related or comparable assets or liabilities, recent transactions, market multiples, book values, and other relevant information for the investment to determine the fair value of the investment. An income-based valuation approach may also be used in which the anticipated future cash flows of the investment are discounted to calculate fair value. Discounts may also be applied due to the nature or duration of any restrictions on the disposition of the investments. Due to the inherent uncertainty of valuations of such investments, the fair values may differ significantly from the values that would have been used had an active market existed.
FRANKLIN INVESTORS SECURITIES TRUSTNOTES TO FINANCIAL STATEMENTS (UNAUDITED)
59franklintempleton.com Semiannual Report
Trading in securities on foreign securities stock exchanges and OTC markets may be completed before 4 p.m. Eastern time. In addition, trading in certain foreign markets may not take place on every Funds' business day. Events can occur between the time at which trading in a foreign security is completed and 4 p.m. Eastern time that might call into question the reliability of the value of a portfolio security held by the Funds. As a result, differences may arise between the value of the Funds' portfolio securities as determined at the foreign market close and the latest indications of value at 4 p.m. Eastern time. In order to minimize the potential for these differences, an independent pricing service may be used to adjust the value of the Funds' securities to the latest indications of fair value at 4 p.m. Eastern time. At April 30, 2021, certain securities may have been fair valued using these procedures, in which case the securities were categorized as Level 2 inputs within the fair value hierarchy (referred to as “market level fair value”). See the Fair Value Measurements note for more information.
When the last day of the reporting period is a non-business day, certain foreign markets may be open on those days that the Funds' NAV is not calculated, which could result in differences between the value of the Funds' portfolio securities on the last business day and the last calendar day of the reporting period. Any security valuation changes due to an open foreign market are adjusted and reflected by the Funds for financial reporting purposes.
b. Foreign Currency Translation Portfolio securities and other assets and liabilities denominated in foreign currencies are translated into U.S. dollars based on the exchange rate of such currencies against U.S. dollars on the date of valuation. The Funds may enter into foreign currency exchange contracts to facilitate transactions denominated in a foreign currency. Purchases and sales of securities, income and expense items denominated in foreign currencies are translated into U.S. dollars at the exchange rate in effect on the transaction date. Portfolio securities and assets and liabilities denominated in foreign currencies contain risks that those currencies will decline in value relative to the U.S. dollar. Occasionally, events may impact the availability or reliability of foreign exchange rates used to convert the U.S. dollar equivalent
value. If such an event occurs, the foreign exchange rate will be valued at fair value using procedures established and approved by the Board.
The Funds do not separately report the effect of changes in foreign exchange rates from changes in market prices on securities held. Such changes are included in net realized and unrealized gain or loss from investments in the Statements of Operations.
Realized foreign exchange gains or losses arise from sales of foreign currencies, currency gains or losses realized between the trade and settlement dates on securities transactions and the difference between the recorded amounts of dividends, interest, and foreign withholding taxes and the U.S. dollar equivalent of the amounts actually received or paid. Net unrealized foreign exchange gains and losses arise from changes in foreign exchange rates on foreign denominated assets and liabilities other than investments in securities held at the end of the reporting period.
c. Joint Repurchase AgreementCertain or all Funds enter into a joint repurchase agreement whereby their uninvested cash balance is deposited into a joint cash account with other funds managed by the investment manager or an affiliate of the investment manager and is used to invest in one or more repurchase agreements. The value and face amount of the joint repurchase agreement are allocated to the funds based on their pro-rata interest. A repurchase agreement is accounted for as a loan by the Fund to the seller, collateralized by securities which are delivered to the Funds' custodian. The fair value, including accrued interest, of the initial collateralization is required to be at least 102% of the dollar amount invested by the funds, with the value of the underlying securities marked to market daily to maintain coverage of at least 100%. Repurchase agreements are subject to the terms of Master Repurchase Agreements (MRAs) with approved counterparties (sellers). The MRAs contain various provisions, including but not limited to events of default and maintenance of collateral for repurchase agreements. In the event of default by either the seller or the Funds, certain MRAs may permit the non-defaulting party to net and close-out all transactions, if any, traded under such agreements. The Funds may sell securities it holds as collateral and apply the proceeds towards the repurchase price and any other amounts owed by the seller to the Funds in the event of default by the seller. This could involve costs
1. Organization and Significant Accounting Policies (continued)
a. Financial Instrument Valuation (continued)

FRANKLIN INVESTORS SECURITIES TRUSTNOTES TO FINANCIAL STATEMENTS (UNAUDITED)
60 franklintempleton.comSemiannual Report
or delays in addition to a loss on the securities if their value falls below the repurchase price owed by the seller. The joint repurchase agreement held by the Funds at period end, as indicated in the Statements of Investments, had been entered into on April 30, 2021.
d. Derivative Financial InstrumentsCertain or all Funds invested in derivative financial instruments in order to manage risk or gain exposure to various other investments or markets. Derivatives are financial contracts based on an underlying or notional amount, require no initial investment or an initial net investment that is smaller than would normally be required to have a similar response to changes in market factors, and require or permit net settlement. Derivatives contain various risks including the potential inability of the counterparty to fulfill their obligations under the terms of the contract, the potential for an illiquid secondary market, and/or the potential for market movements which expose the Fund to gains or losses in excess of the amounts shown in the Statements of Assets and Liabilities. Realized gain and loss and unrealized appreciation and depreciation on these contracts for the period are included in the Statements of Operations.
Collateral requirements differ by type of derivative. Collateral or initial margin requirements are set by the broker or exchange clearing house for exchange traded and centrally cleared derivatives. Initial margin deposited is held at the exchange and can be in the form of cash and/or securities.
Certain or all Funds purchased or wrote exchange traded option contracts primarily to manage and/or gain exposure to equity volatility risk. An option is a contract entitling the holder to purchase or sell a specific amount of shares or units of an asset or notional amount of a swap (swaption), at a specified price. When an option is purchased or written, an amount equal to the premium paid or received is recorded as an asset or liability, respectively. Upon exercise of an option, the acquisition cost or sales proceeds of the underlying investment is adjusted by any premium received or paid. Upon expiration of an option, any premium received or paid is recorded as a realized gain or loss. Upon closing an option other than through expiration or exercise, the difference between the premium received or paid and the cost to close the position is recorded as a realized gain or loss.
See Note 9 regarding other derivative information.
e. Equity-Linked SecuritiesCertain or all Funds invest in equity-linked securities. Equity-linked securities are hybrid financial instruments that generally combine both debt and equity characteristics into a single note form. Income received from equity-linked securities is recorded as realized gains in the Statements of Operations and may be based on the performance of an underlying equity security, an equity index, or an option position. The risks of investing in equity-linked securities include unfavorable price movements in the underlying security and the credit risk of the issuing financial institution. There may be no guarantee of a return of principal with equity-linked securities and the appreciation potential may be limited. Equity-linked securities may be more volatile and less liquid than other investments held by the Funds.
f. Securities LendingCertain or all Funds participate in an agency based securities lending program to earn additional income. The Fund receives collateral in the form of cash and/or U.S. Government and Agency securities against the loaned securities in an amount equal to at least 102% of the fair value of the loaned securities. Collateral is maintained over the life of the loan in an amount not less than 100% of the fair value of loaned securities, as determined at the close of Fund business each day; any additional collateral required due to changes in security values is delivered to the Fund on the next business day. Any cash collateral received is deposited into a joint cash account with other funds and is used to invest in a money market fund managed by Franklin Advisers, Inc., an affiliate of the Funds, and/or a joint repurchase agreement in the Statements of Assets and Liabilities. Additionally, the Franklin Convertible Securities Fund and Franklin Managed Income received $4,397,254 and $23,684,467 respectively, in U.S. Government and Agency securities as collateral. These securities received as collateral are held in segregated accounts with the Funds’ custodian. The Fund cannot repledge or resell these securities received as collateral. As such, the non-cash collateral is excluded from the Statements of Assets and Liabilities. The Fund may receive income from the investment of cash collateral, in addition to lending fees and rebates paid by the borrower. Income from securities loaned, net of fees paid to the securities lending agent and/or third-party vendor, is reported separately in the Statements of Operations. The Fund bears the market risk with respect
1. Organization and Significant Accounting Policies (continued)
c. Joint Repurchase Agreement (continued)

FRANKLIN INVESTORS SECURITIES TRUSTNOTES TO FINANCIAL STATEMENTS (UNAUDITED)
61franklintempleton.com Semiannual Report
to any cash collateral investment, securities loaned, and the risk that the agent may default on its obligations to the Fund. If the borrower defaults on its obligation to return the securities loaned, the Fund has the right to repurchase the securities in the open market using the collateral received. The securities lending agent has agreed to indemnify the Fund in the event of default by a third party borrower.
g. Income and Deferred Taxes It is each Fund's policy to qualify as a regulated investment company under the Internal Revenue Code. Each Fund intends to distribute to shareholders substantially all of its taxable income and net realized gains to relieve it from federal income and excise taxes. As a result, no provision for U.S. federal income taxes is required.
The Funds may be subject to foreign taxation related to income received, capital gains on the sale of securities and certain foreign currency transactions in the foreign jurisdictions in which the Funds invest. Foreign taxes, if any, are recorded based on the tax regulations and rates that exist in the foreign markets in which the Funds invest. When a capital gain tax is determined to apply, certain or all Funds record an estimated deferred tax liability in an amount that would be payable if the securities were disposed of on the valuation date.
As a result of several court cases, in certain countries across the European Union, certain or all Funds filed additional tax reclaims for previously withheld taxes on dividends earned in those countries (EU reclaims). Income recognized, if any, for EU reclaims is reflected as other income in the Statements of Operations and any related receivable, if any, is reflected as European Union tax reclaims in the Statements of Assets and Liabilities. When uncertainty exists as to the ultimate resolution of these proceedings, the likelihood of receipt of these EU reclaims, and the potential timing of payment, no amounts are reflected in the financial statements. For U.S. income tax purposes, EU reclaims received by the Funds, if any, reduce the amount of foreign taxes Fund shareholders can use as tax deductions or credits on their income tax returns.
Each Fund may recognize an income tax liability related to its uncertain tax positions under U.S. GAAP when the uncertain tax position has a less than 50% probability that it will be sustained upon examination by the tax authorities based on its technical merits. As of April 30, 2021, each Fund has determined that no tax liability is required in its financial statements related to uncertain tax positions for any open tax years (or expected to be taken in future tax years). Open tax years are those that remain subject to examination and are based on the statute of limitations in each jurisdiction in which the Fund invests.
h. Security Transactions, Investment Income, Expenses and DistributionsSecurity transactions are accounted for on trade date. Realized gains and losses on security transactions are determined on a specific identification basis. Interest income and estimated expenses are accrued daily. Amortization of premium and accretion of discount on debt securities are included in interest income. Facility fees are recognized as income over the expected term of the loan. Dividend income and capital gain distributions by Underlying Funds are recorded on the ex-dividend date except for certain dividends from securities where the dividend rate is not available. In such cases, the dividend is recorded as soon as the information is received by the Funds. Distributions to shareholders are recorded on the ex-dividend date. The Franklin Managed Income Fund employs a managed distribution policy. Under this policy, the fund will distribute level monthly distributions in any given year regardless of the performance of the fund; however, the twelfth monthly payment may be greater than the initially anticipated amount if additional income or capital gains are required to be distributed. These distributions may include income and capital gains generated by the Fund, as well as a possible return of capital component, if necessary, to meet the annual distribution rate. The annual payout rate may be adjusted higher or lower from year to year in response to market conditions. Distributable earnings are determined according to income tax regulations (tax basis) and may differ from earnings recorded in accordance with U.S. GAAP. These differences may be permanent or temporary. Permanent differences are reclassified among capital accounts to reflect their tax character. These reclassifications have no impact on net assets or the results of operations. Temporary differences are not reclassified, as they may reverse in subsequent periods.
1. Organization and Significant Accounting Policies (continued)
f. Securities Lending (continued)

FRANKLIN INVESTORS SECURITIES TRUSTNOTES TO FINANCIAL STATEMENTS (UNAUDITED)
62 franklintempleton.comSemiannual Report
Common expenses incurred by the Trust are allocated among the Funds based on the ratio of net assets of each Fund to the combined net assets of the Trust or based on the ratio of number of shareholders of each Fund to the combined number of shareholders of the Trust. Fund specific expenses are charged directly to the Fund that incurred the expense.
Realized and unrealized gains and losses and net investment income, excluding class specific expenses, are allocated daily to each class of shares based upon the relative proportion of net assets of each class. Differences in per share distributions by class are generally due to differences in class specific expenses.
i. Accounting EstimatesThe preparation of financial statements in accordance with U.S. GAAP requires management to make estimates and assumptions that affect the reported amounts of assets and liabilities at the date of the financial statements and the amounts of income and expenses during the reporting period. Actual results could differ from those estimates.
j. Guarantees and IndemnificationsUnder the Trust's organizational documents, its officers and trustees are indemnified by the Trust against certain liabilities arising out of the performance of their duties to the Trust. Additionally, in the normal course of business, the Trust, on behalf of the Funds, enters into contracts with service providers that contain general indemnification clauses. The Trust's maximum exposure under these arrangements is unknown as this would involve future claims that may be made against the Trust that have not yet occurred. Currently, the Trust expects the risk of loss to be remote.
1. Organization and Significant Accounting Policies (continued)
h. Security Transactions, Investment Income, Expenses and Distributions (continued)
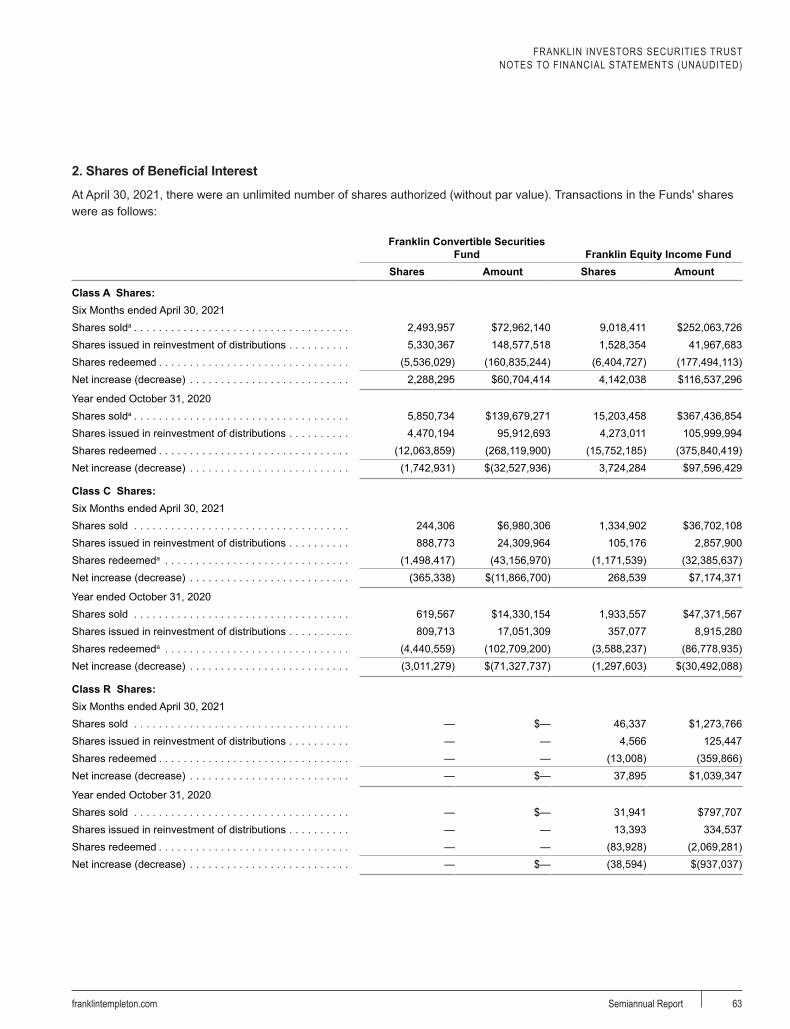
FRANKLIN INVESTORS SECURITIES TRUSTNOTES TO FINANCIAL STATEMENTS (UNAUDITED)
63franklintempleton.com Semiannual Report
2. Shares of Beneficial Interest
At April 30, 2021, there were an unlimited number of shares authorized (without par value). Transactions in the Funds' shares were as follows:
Franklin Convertible Securities Fund Franklin Equity Income Fund
Shares Amount Shares AmountClass A
Class A Shares:Six Months ended April 30, 2021Shares solda . . . . . . . . . . . . . . . . . . . . . . . . . . . . . . . . . . . 2,493,957 $72,962,140 9,018,411 $252,063,726Shares issued in reinvestment of distributions . . . . . . . . . . 5,330,367 148,577,518 1,528,354 41,967,683Shares redeemed . . . . . . . . . . . . . . . . . . . . . . . . . . . . . . . (5,536,029) (160,835,244) (6,404,727) (177,494,113)Net increase (decrease) . . . . . . . . . . . . . . . . . . . . . . . . . . 2,288,295 $60,704,414 4,142,038 $116,537,296
Year ended October 31, 2020Shares solda . . . . . . . . . . . . . . . . . . . . . . . . . . . . . . . . . . . 5,850,734 $139,679,271 15,203,458 $367,436,854Shares issued in reinvestment of distributions . . . . . . . . . . 4,470,194 95,912,693 4,273,011 105,999,994Shares redeemed . . . . . . . . . . . . . . . . . . . . . . . . . . . . . . . (12,063,859) (268,119,900) (15,752,185) (375,840,419)Net increase (decrease) . . . . . . . . . . . . . . . . . . . . . . . . . . (1,742,931) $(32,527,936) 3,724,284 $97,596,429Class C
Class C Shares:Six Months ended April 30, 2021Shares sold . . . . . . . . . . . . . . . . . . . . . . . . . . . . . . . . . . . 244,306 $6,980,306 1,334,902 $36,702,108Shares issued in reinvestment of distributions . . . . . . . . . . 888,773 24,309,964 105,176 2,857,900Shares redeemeda . . . . . . . . . . . . . . . . . . . . . . . . . . . . . . (1,498,417) (43,156,970) (1,171,539) (32,385,637)Net increase (decrease) . . . . . . . . . . . . . . . . . . . . . . . . . . (365,338) $(11,866,700) 268,539 $7,174,371
Year ended October 31, 2020Shares sold . . . . . . . . . . . . . . . . . . . . . . . . . . . . . . . . . . . 619,567 $14,330,154 1,933,557 $47,371,567Shares issued in reinvestment of distributions . . . . . . . . . . 809,713 17,051,309 357,077 8,915,280Shares redeemeda . . . . . . . . . . . . . . . . . . . . . . . . . . . . . . (4,440,559) (102,709,200) (3,588,237) (86,778,935)Net increase (decrease) . . . . . . . . . . . . . . . . . . . . . . . . . . (3,011,279) $(71,327,737) (1,297,603) $(30,492,088)Class R
Class R Shares:Six Months ended April 30, 2021Shares sold . . . . . . . . . . . . . . . . . . . . . . . . . . . . . . . . . . . — $— 46,337 $1,273,766Shares issued in reinvestment of distributions . . . . . . . . . . — — 4,566 125,447Shares redeemed . . . . . . . . . . . . . . . . . . . . . . . . . . . . . . . — — (13,008) (359,866)Net increase (decrease) . . . . . . . . . . . . . . . . . . . . . . . . . . — $— 37,895 $1,039,347
Year ended October 31, 2020Shares sold . . . . . . . . . . . . . . . . . . . . . . . . . . . . . . . . . . . — $— 31,941 $797,707Shares issued in reinvestment of distributions . . . . . . . . . . — — 13,393 334,537Shares redeemed . . . . . . . . . . . . . . . . . . . . . . . . . . . . . . . — — (83,928) (2,069,281)Net increase (decrease) . . . . . . . . . . . . . . . . . . . . . . . . . . — $— (38,594) $(937,037)Class R6

FRANKLIN INVESTORS SECURITIES TRUSTNOTES TO FINANCIAL STATEMENTS (UNAUDITED)
64 franklintempleton.comSemiannual Report
Franklin Convertible Securities Fund Franklin Equity Income Fund
Shares Amount Shares AmountClass R6 Shares:Six Months ended April 30, 2021Shares sold . . . . . . . . . . . . . . . . . . . . . . . . . . . . . . . . . . . 770,212 $22,423,937 831,227 $23,210,467Shares issued in reinvestment of distributions . . . . . . . . . . 472,375 13,265,883 69,022 1,900,738Shares redeemed . . . . . . . . . . . . . . . . . . . . . . . . . . . . . . . (1,100,624) (32,384,380) (556,910) (15,499,198)Net increase (decrease) . . . . . . . . . . . . . . . . . . . . . . . . . . 141,963 $3,305,440 343,339 $9,612,007
Year ended October 31, 2020Shares sold . . . . . . . . . . . . . . . . . . . . . . . . . . . . . . . . . . . 3,267,482 $75,404,210 1,357,448 $33,390,556Shares issued in reinvestment of distributions . . . . . . . . . . 388,985 8,411,655 180,063 4,449,934Shares redeemed . . . . . . . . . . . . . . . . . . . . . . . . . . . . . . . (1,817,799) (41,312,741) (1,184,933) (28,763,327)Net increase (decrease) . . . . . . . . . . . . . . . . . . . . . . . . . . 1,838,668 $42,503,124 352,578 $9,077,163Advisor Class
Advisor Class Shares:Six Months ended April 30, 2021Shares sold . . . . . . . . . . . . . . . . . . . . . . . . . . . . . . . . . . . 13,726,327 $400,611,267 2,614,601 $72,889,023Shares issued in reinvestment of distributions . . . . . . . . . . 9,715,774 270,920,915 182,512 5,029,743Shares redeemed . . . . . . . . . . . . . . . . . . . . . . . . . . . . . . . (14,904,653) (433,202,524) (1,283,054) (35,618,858)Net increase (decrease) . . . . . . . . . . . . . . . . . . . . . . . . . . 8,537,448 $238,329,658 1,514,059 $42,299,908
Year ended October 31, 2020Shares sold . . . . . . . . . . . . . . . . . . . . . . . . . . . . . . . . . . . 29,352,686 $687,281,747 4,631,310 $110,786,281Shares issued in reinvestment of distributions . . . . . . . . . . 8,255,321 177,255,222 398,372 9,845,978Shares redeemed . . . . . . . . . . . . . . . . . . . . . . . . . . . . . . . (42,789,544) (935,400,822) (2,600,761) (61,315,217)Net increase (decrease) . . . . . . . . . . . . . . . . . . . . . . . . . . (5,181,537) $(70,863,853) 2,428,921 $59,317,042
Franklin Managed Income FundShares Amount
Class A
Class A Shares:Six Months ended April 30, 2021Shares solda . . . . . . . . . . . . . . . . . . . . . . . . . . . . . . . . . . . 17,359,035 $223,230,664Shares issued in reinvestment of distributions . . . . . . . . . . 5,990,556 76,802,878Shares redeemed . . . . . . . . . . . . . . . . . . . . . . . . . . . . . . . (20,225,869) (259,645,650)Net increase (decrease) . . . . . . . . . . . . . . . . . . . . . . . . . . 3,123,722 $40,387,892
Year ended October 31, 2020Shares solda . . . . . . . . . . . . . . . . . . . . . . . . . . . . . . . . . . . 46,128,007 $550,402,800Shares issued in reinvestment of distributions . . . . . . . . . . 17,971,520 219,203,827Shares redeemed . . . . . . . . . . . . . . . . . . . . . . . . . . . . . . . (51,901,964) (611,211,559)Net increase (decrease) . . . . . . . . . . . . . . . . . . . . . . . . . . 12,197,563 $158,395,068Class C
2. Shares of Beneficial Interest (continued)

FRANKLIN INVESTORS SECURITIES TRUSTNOTES TO FINANCIAL STATEMENTS (UNAUDITED)
65franklintempleton.com Semiannual Report
Franklin Managed Income Fund Shares AmountClass C Shares:Six Months ended April 30, 2021Shares sold . . . . . . . . . . . . . . . . . . . . . . . . . . . . . . . . . . . 1,452,405 $18,547,047Shares issued in reinvestment of distributions . . . . . . . . . . 591,470 7,489,439Shares redeemeda . . . . . . . . . . . . . . . . . . . . . . . . . . . . . . (5,667,094) (72,122,846)Net increase (decrease) . . . . . . . . . . . . . . . . . . . . . . . . . . (3,623,219) $(46,086,360)
Year ended October 31, 2020Shares sold . . . . . . . . . . . . . . . . . . . . . . . . . . . . . . . . . . . 5,329,297 $62,900,103Shares issued in reinvestment of distributions . . . . . . . . . . 2,513,851 30,475,395Shares redeemeda . . . . . . . . . . . . . . . . . . . . . . . . . . . . . . (17,214,160) (202,624,186)Net increase (decrease) . . . . . . . . . . . . . . . . . . . . . . . . . . (9,371,012) $(109,248,688)Class R
Class R Shares:Six Months ended April 30, 2021Shares sold . . . . . . . . . . . . . . . . . . . . . . . . . . . . . . . . . . . 33,761 $438,874Shares issued in reinvestment of distributions . . . . . . . . . . 5,951 76,455Shares redeemed . . . . . . . . . . . . . . . . . . . . . . . . . . . . . . . (55,913) (716,916)Net increase (decrease) . . . . . . . . . . . . . . . . . . . . . . . . . . (16,201) $(201,587)
Year ended October 31, 2020Shares sold . . . . . . . . . . . . . . . . . . . . . . . . . . . . . . . . . . . 39,218 $475,079Shares issued in reinvestment of distributions . . . . . . . . . . 22,757 278,538Shares redeemed . . . . . . . . . . . . . . . . . . . . . . . . . . . . . . . (116,833) (1,412,075)Net increase (decrease) . . . . . . . . . . . . . . . . . . . . . . . . . . (54,858) $(658,458)Class R6
Class R6 Shares:Six Months ended April 30, 2021Shares sold . . . . . . . . . . . . . . . . . . . . . . . . . . . . . . . . . . . 1,240,704 $16,074,499Shares issued in reinvestment of distributions . . . . . . . . . . 349,662 4,499,347Shares redeemed . . . . . . . . . . . . . . . . . . . . . . . . . . . . . . . (1,639,540) (21,125,152)Net increase (decrease) . . . . . . . . . . . . . . . . . . . . . . . . . . (49,174) $(551,306)
Year ended October 31, 2020Shares sold . . . . . . . . . . . . . . . . . . . . . . . . . . . . . . . . . . . 3,106,638 $37,375,347Shares issued in reinvestment of distributions . . . . . . . . . . 1,041,392 12,723,008Shares redeemed . . . . . . . . . . . . . . . . . . . . . . . . . . . . . . . (3,371,512) (39,996,235)Net increase (decrease) . . . . . . . . . . . . . . . . . . . . . . . . . . 776,518 $10,102,120Advisor Class
2. Shares of Beneficial Interest (continued)

FRANKLIN INVESTORS SECURITIES TRUSTNOTES TO FINANCIAL STATEMENTS (UNAUDITED)
66 franklintempleton.comSemiannual Report
Franklin Managed Income Fund Shares AmountAdvisor Class Shares:Six Months ended April 30, 2021Shares sold . . . . . . . . . . . . . . . . . . . . . . . . . . . . . . . . . . . 2,472,925 $32,000,658Shares issued in reinvestment of distributions . . . . . . . . . . 331,457 4,262,002Shares redeemed . . . . . . . . . . . . . . . . . . . . . . . . . . . . . . . (2,184,306) (28,019,986)Net increase (decrease) . . . . . . . . . . . . . . . . . . . . . . . . . . 620,076 $8,242,674
Year ended October 31, 2020Shares sold . . . . . . . . . . . . . . . . . . . . . . . . . . . . . . . . . . . 5,713,128 $68,045,247Shares issued in reinvestment of distributions . . . . . . . . . . 996,705 12,186,523Shares redeemed . . . . . . . . . . . . . . . . . . . . . . . . . . . . . . . (6,600,817) (78,984,059)Net increase (decrease) . . . . . . . . . . . . . . . . . . . . . . . . . . 109,016 $1,247,711
aMay include a portion of Class C shares that were automatically converted to Class A.
3. Transactions with Affiliates
Franklin Resources, Inc. is the holding company for various subsidiaries that together are referred to as Franklin Templeton. Certain officers and trustees of the Trust are also officers and/or directors of the following subsidiaries:
Subsidiary AffiliationFranklin Advisers, Inc. (Advisers) Investment manager
Franklin Templeton Services, LLC (FT Services) Administrative manager
Franklin Templeton Distributors, Inc. (Distributors) Principal underwriter
Franklin Templeton Investor Services, LLC (Investor Services) Transfer agent
a. Management FeesFranklin Managed Income Fund pays an investment management fee to Advisers based on the average daily net assets of the Fund as follows:
Annualized Fee Rate Net Assets0.620% Up to and including $250 million
0.595% Over $250 million, up to and including $500 million
0.570% Over $500 million, up to and including $1 billion
0.545% Over $1 billion, up to and including $2.5 billion
0.520% Over $2.5 billion, up to and including $5 billion
0.495% Over $5 billion, up to and including $10 billion
0.470% Over $10 billion, up to and including $15 billion
0.445% Over $15 billion, up to and including $20 billion
0.420% In excess of $20 billion
2. Shares of Beneficial Interest (continued)

FRANKLIN INVESTORS SECURITIES TRUSTNOTES TO FINANCIAL STATEMENTS (UNAUDITED)
67franklintempleton.com Semiannual Report
Franklin Convertible Securities Fund and Franklin Equity Income Fund pay an investment management fee to Advisers based on the month-end net assets of each of the Funds as follows:
Annualized Fee Rate Net Assets0.625% Up to and including $100 million
0.500% Over $100 million, up to and including $250 million
0.450% Over $250 million, up to and including $7.5 billion
0.440% Over $7.5 billion, up to and including $10 billion
0.430% Over $10 billion, up to and including $12.5 billion
0.420% Over $12.5 billion, up to and including $15 billion
0.400% Over $15 billion, up to and including $17.5 billion
0.380% Over $17.5 billion, up to and including $20 billion
0.360% Over $20 billion, up to and including $35 billion
0.355% Over $35 billion, up to and including $50 billion
0.350% In excess of $50 billion
For the period ended April 30, 2021, each Fund's annualized gross effective investment management fee rate based on average daily net assets was as follows:
Franklin Convertible
Securities FundFranklin Equity
Income Fund
Franklin Managed
Income Fund
Gross effective investment management fee rate . . . . . . . . 0.459% 0.466% 0.547%
b. Administrative FeesUnder an agreement with Advisers, FT Services provides administrative services to the Funds. The fee is paid by Advisers based on each of the Funds' average daily net assets, and is not an additional expense of the Funds.
c. Distribution FeesThe Board has adopted distribution plans for each share class, with the exception of Class R6 and Advisor Class shares, pursuant to Rule 12b-1 under the 1940 Act. Under the Funds’ Class A reimbursement distribution plans, the Funds reimburse Distributors for costs incurred in connection with the servicing, sale and distribution of each Fund's shares up to the maximum annual plan rate for each class. Under the Class A reimbursement distribution plans, costs exceeding the maximum for the current plan year cannot be reimbursed in subsequent periods. In addition, under the Funds’ Class C and R compensation distribution plans, the Funds pay Distributors for costs incurred in connection with the servicing, sale and distribution of each Fund's shares up to the maximum annual plan rate for each class. The plan year, for purposes of monitoring compliance with the maximum annual plan rates, is February 1 through January 31 for each Fund.
The maximum annual plan rates, based on the average daily net assets, for each class, are as follows:
3. Transactions with Affiliates (continued)
a. Management Fees (continued)

FRANKLIN INVESTORS SECURITIES TRUSTNOTES TO FINANCIAL STATEMENTS (UNAUDITED)
68 franklintempleton.comSemiannual Report
Franklin Convertible
Securities FundFranklin Equity
Income Fund
Franklin Managed
Income Fund
Reimbursement Plans:Class A . . . . . . . . . . . . . . . . . . . . . . . . . . . . . . . 0.25% 0.25% 0.35%
Compensation Plans:Class C . . . . . . . . . . . . . . . . . . . . . . . . . . . . . . . 1.00% 1.00% 1.00%Class R . . . . . . . . . . . . . . . . . . . . . . . . . . . . . . . —% 0.50% 0.50%
For Franklin Managed Income Fund, the Board has set the current rate at 0.25% per year for Class A shares until further notice and approval by the Board.
d. Sales Charges/Underwriting AgreementsFront-end sales charges and contingent deferred sales charges (CDSC) do not represent expenses of the Funds. These charges are deducted from the proceeds of sales of fund shares prior to investment or from redemption proceeds prior to remittance, as applicable. Distributors has advised the Funds of the following commission transactions related to the sales and redemptions of the Funds' shares for the year:
Franklin Convertible
Securities FundFranklin Equity
Income Fund
Franklin Managed
Income Fund
Sales charges retained net of commissions paid to unaffiliated brokers/dealers . . . . . . . . . . . . . . . . . . $20,673 $245,296 $273,258CDSC retained . . . . . . . . . . . . . . . . . . . . . . . . . . . $2,841 $12,169 $17,298
e. Transfer Agent FeesEach class of shares pays transfer agent fees to Investor Services for its performance of shareholder servicing obligations. The fees are based on an annualized asset based fee of 0.02% plus a transaction based fee. In addition, each class reimburses Investor Services for out of pocket expenses incurred and, except for Class R6, reimburses shareholder servicing fees paid to third parties. These fees are allocated daily based upon their relative proportion of such classes' aggregate net assets. Class R6 pays Investor Services transfer agent fees specific to that class.
For the period ended April 30, 2021, the Funds paid transfer agent fees as noted in the Statements of Operations of which the following amounts were retained by Investor Services:
Franklin Convertible
Securities FundFranklin Equity
Income Fund
Franklin Managed
Income Fund
Transfer agent fees . . . . . . . . . . . . . . . . . . . . . . . . $775,887 $639,361 $792,922
f. Investments in Affiliated Management Investment CompaniesCertain or all Funds invest in one or more affiliated management investment companies. As defined in the 1940 Act, an investment is deemed to be a “Controlled Affiliate” of a fund when a fund owns, either directly or indirectly, 25% or more of the affiliated fund’s outstanding shares or has the power to exercise control over management or policies of such fund. The Funds do not invest for purposes of exercising a controlling influence over the management or policies. Management fees paid by
3. Transactions with Affiliates (continued)
c. Distribution Fees (continued)

FRANKLIN INVESTORS SECURITIES TRUSTNOTES TO FINANCIAL STATEMENTS (UNAUDITED)
69franklintempleton.com Semiannual Report
the Funds are waived on assets invested in the affiliated management investment companies, as noted in the Statements of Operations, in an amount not to exceed the management and administrative fees paid directly or indirectly by each affiliate. During the period ended April 30, 2021, investments in affiliated management investment companies were as follows:
aa
Value at Beginning of Period Purchases Sales
Realized Gain (Loss)
Net Change in Unrealized
Appreciation (Depreciation)
Value at End
of Period
Number of Shares Held
at End of Period
Investment Income
a a a a a a a a
Franklin Convertible Securities FundNon-Controlled Affiliates
DividendsInstitutional Fiduciary Trust - Money Market Portfolio, 0.01% . . . . . . . $211,356,904 $401,792,022 $(582,788,313) $— $— $30,360,613 30,360,613 $1,502Non-Controlled Affiliates
Income from securities
loanedInstitutional Fiduciary Trust - Money Market Portfolio, 0.01% . . . . . . . $6,200,000 $115,677,000 $(93,166,000) $— $— $28,711,000 28,711,000 $411Total Affiliated Securities . . . . $217,556,904 $517,469,022 $(675,954,313) $— $— $59,071,613 $1,913
Franklin Equity Income FundNon-Controlled Affiliates
DividendsInstitutional Fiduciary Trust - Money Market Portfolio, 0.01% . . . . . . . $13,813,242 $311,233,866 $(292,157,276) $— $— $32,889,832 32,889,832 $613Non-Controlled Affiliates
Income from securities
loanedInstitutional Fiduciary Trust - Money Market Portfolio, 0.01% . . . . . . . $14,180,000 $57,219,000 $(53,082,000) $— $— $18,317,000 18,317,000 $132Total Affiliated Securities . . . . $27,993,242 $368,452,866 $(345,239,276) $— $— $51,206,832 $745
Franklin Managed Income FundControlled Affiliates
DividendsFranklin Liberty Systematic Style Premia ETF . . . . . . . . . . . . . . $25,719,105 $— $— $— $(2,407,105) $23,312,000 1,175,000 $1,805,826a
Franklin Liberty U.S. Low Volatility ETF . . . . . . . . . . . . . . . . . . . . 37,699,500 — — — 8,118,300 45,817,800 1,000,000 347,154Total Controlled Affiliates . . . . $63,418,605 $— $— $— $5,711,195 $69,129,800 $2,152,980Non-Controlled Affiliates
DividendsFranklin FTSE United Kingdom ETF . . . . . . . . . . . . . . . . . . . . $27,669,150 $— $— $— $9,500,850 $37,170,000 1,500,000 $415,062
3. Transactions with Affiliates (continued)
f. Investments in Affiliated Management Investment Companies (continued)
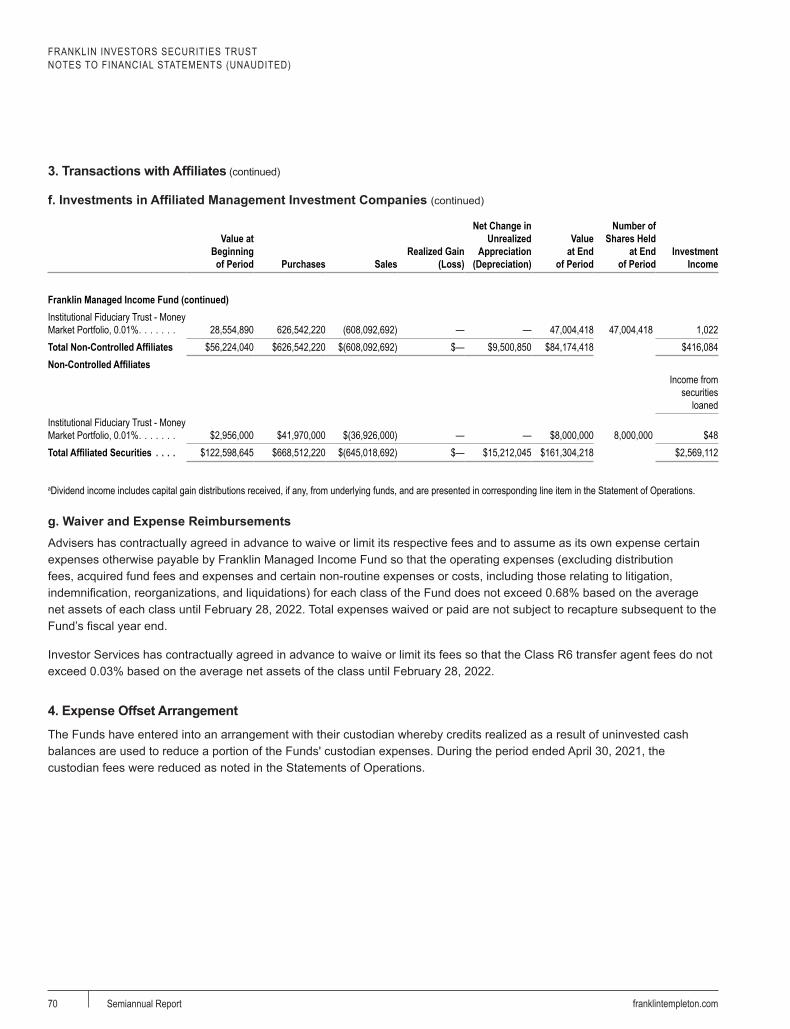
FRANKLIN INVESTORS SECURITIES TRUSTNOTES TO FINANCIAL STATEMENTS (UNAUDITED)
70 franklintempleton.comSemiannual Report
aa
Value at Beginning of Period Purchases Sales
Realized Gain (Loss)
Net Change in Unrealized
Appreciation (Depreciation)
Value at End
of Period
Number of Shares Held
at End of Period
Investment Income
Franklin Managed Income Fund (continued)Institutional Fiduciary Trust - Money Market Portfolio, 0.01% . . . . . . . 28,554,890 626,542,220 (608,092,692) — — 47,004,418 47,004,418 1,022Total Non-Controlled Affiliates $56,224,040 $626,542,220 $(608,092,692) $— $9,500,850 $84,174,418 $416,084Non-Controlled Affiliates
Income from securities
loanedInstitutional Fiduciary Trust - Money Market Portfolio, 0.01% . . . . . . . $2,956,000 $41,970,000 $(36,926,000) — — $8,000,000 8,000,000 $48Total Affiliated Securities . . . . $122,598,645 $668,512,220 $(645,018,692) $— $15,212,045 $161,304,218 $2,569,112
aDividend income includes capital gain distributions received, if any, from underlying funds, and are presented in corresponding line item in the Statement of Operations.
g. Waiver and Expense ReimbursementsAdvisers has contractually agreed in advance to waive or limit its respective fees and to assume as its own expense certain expenses otherwise payable by Franklin Managed Income Fund so that the operating expenses (excluding distribution fees, acquired fund fees and expenses and certain non-routine expenses or costs, including those relating to litigation, indemnification, reorganizations, and liquidations) for each class of the Fund does not exceed 0.68% based on the average net assets of each class until February 28, 2022. Total expenses waived or paid are not subject to recapture subsequent to the Fund’s fiscal year end.
Investor Services has contractually agreed in advance to waive or limit its fees so that the Class R6 transfer agent fees do not exceed 0.03% based on the average net assets of the class until February 28, 2022.
4. Expense Offset Arrangement
The Funds have entered into an arrangement with their custodian whereby credits realized as a result of uninvested cash balances are used to reduce a portion of the Funds' custodian expenses. During the period ended April 30, 2021, the custodian fees were reduced as noted in the Statements of Operations.
3. Transactions with Affiliates (continued)
f. Investments in Affiliated Management Investment Companies (continued)

FRANKLIN INVESTORS SECURITIES TRUSTNOTES TO FINANCIAL STATEMENTS (UNAUDITED)
71franklintempleton.com Semiannual Report
5. Income Taxes
At April 30, 2021, the cost of investments and net unrealized appreciation (depreciation) for income tax purposes were as follows:
Franklin Convertible
Securities FundFranklin Equity
Income Fund
Franklin Managed
Income Funda a a a
Cost of investments . . . . . . . . . . . . . . . . . . . . . . . $4,148,350,972 $2,188,178,576 $3,451,051,741
Unrealized appreciation . . . . . . . . . . . . . . . . . . . . . $1,194,463,553 $1,079,204,453 $639,757,944Unrealized depreciation . . . . . . . . . . . . . . . . . . . . . (77,660,380) (14,652,275) (28,820,825)Net unrealized appreciation (depreciation) . . . . . . . $1,116,803,173 $1,064,552,178 $610,937,119
Differences between income and/or capital gains as determined on a book basis and a tax basis are primarily due to differing treatments of foreign currency transactions, EU Reclaims, bond discounts and premiums, equity-linked securities and wash sales.
6. Investment Transactions
Purchases and sales of investments (excluding short term securities) for the period ended April 30, 2021, were as follows:
Franklin Convertible
Securities FundFranklin Equity
Income Fund
Franklin Managed
Income Fund
Purchases . . . . . . . . . . . . . . . . . . . . . . . . . . . . . . $1,206,706,308 $559,905,788 $781,747,434Sales . . . . . . . . . . . . . . . . . . . . . . . . . . . . . . . . . . $1,226,651,268 $419,668,368 $760,914,350
At April 30, 2021, in connection with securities lending transactions, certain or all Funds loaned investments and received cash collateral as follows:
Franklin Convertible
Securities FundFranklin Equity
Income Fund
Franklin Managed
Income Fund
Securities lending transactionsa:Equity investmentsb . . . . . . . . . . . . . . . . . . . . . . . . $35,889,301 $22,896,721 $12,074,758
aThe agreements can be terminated at any time.bThe gross amount of recognized liability for such transactions is included in payable upon return of securities loaned in the Statements of Assets and Liabilities.
7. Credit Risk
At April 30, 2021, Franklin Convertible Securities Fund and Franklin Managed Income Fund had 84.8% and 9.5%, respectively, of their portfolio invested in high yield securities, senior secured floating rate loans, or other securities rated below investment grade and unrated securities. These securities may be more sensitive to economic conditions causing greater price volatility and are potentially subject to a greater risk of loss due to default than higher rated securities.
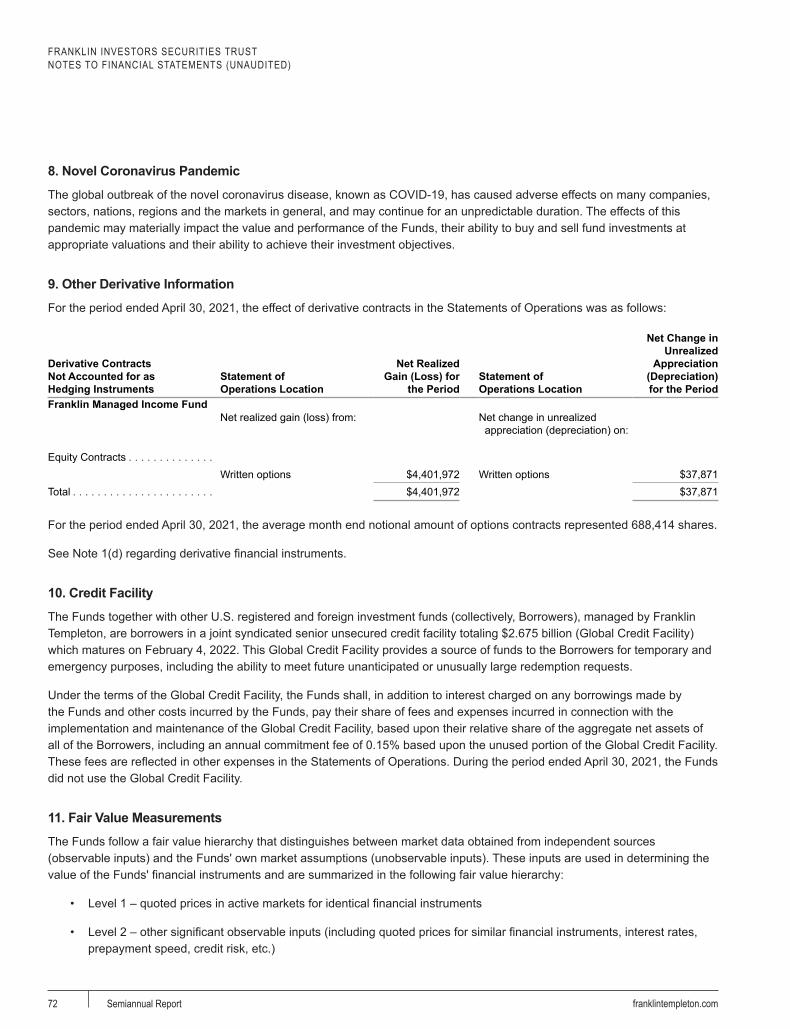
FRANKLIN INVESTORS SECURITIES TRUSTNOTES TO FINANCIAL STATEMENTS (UNAUDITED)
72 franklintempleton.comSemiannual Report
8. Novel Coronavirus Pandemic
The global outbreak of the novel coronavirus disease, known as COVID-19, has caused adverse effects on many companies, sectors, nations, regions and the markets in general, and may continue for an unpredictable duration. The effects of this pandemic may materially impact the value and performance of the Funds, their ability to buy and sell fund investments at appropriate valuations and their ability to achieve their investment objectives.
9. Other Derivative Information
For the period ended April 30, 2021, the effect of derivative contracts in the Statements of Operations was as follows:
Derivative Contracts Not Accounted for as Hedging Instruments
Statement of Operations Location
Net Realized Gain (Loss) for
the PeriodStatement of Operations Location
Net Change in Unrealized
Appreciation (Depreciation) for the Period
Franklin Managed Income FundNet realized gain (loss) from: Net change in unrealized
appreciation (depreciation) on:
Equity Contracts . . . . . . . . . . . . . .Written options $4,401,972 Written options $37,871
Total . . . . . . . . . . . . . . . . . . . . . . . $4,401,972 $37,871
For the period ended April 30, 2021, the average month end notional amount of options contracts represented 688,414 shares.
See Note 1(d) regarding derivative financial instruments.
10. Credit Facility
The Funds together with other U.S. registered and foreign investment funds (collectively, Borrowers), managed by Franklin Templeton, are borrowers in a joint syndicated senior unsecured credit facility totaling $2.675 billion (Global Credit Facility) which matures on February 4, 2022. This Global Credit Facility provides a source of funds to the Borrowers for temporary and emergency purposes, including the ability to meet future unanticipated or unusually large redemption requests.
Under the terms of the Global Credit Facility, the Funds shall, in addition to interest charged on any borrowings made by the Funds and other costs incurred by the Funds, pay their share of fees and expenses incurred in connection with the implementation and maintenance of the Global Credit Facility, based upon their relative share of the aggregate net assets of all of the Borrowers, including an annual commitment fee of 0.15% based upon the unused portion of the Global Credit Facility. These fees are reflected in other expenses in the Statements of Operations. During the period ended April 30, 2021, the Funds did not use the Global Credit Facility.
11. Fair Value Measurements
The Funds follow a fair value hierarchy that distinguishes between market data obtained from independent sources (observable inputs) and the Funds' own market assumptions (unobservable inputs). These inputs are used in determining the value of the Funds' financial instruments and are summarized in the following fair value hierarchy:
• Level 1 – quoted prices in active markets for identical financial instruments
• Level 2 – other significant observable inputs (including quoted prices for similar financial instruments, interest rates, prepayment speed, credit risk, etc.)

FRANKLIN INVESTORS SECURITIES TRUSTNOTES TO FINANCIAL STATEMENTS (UNAUDITED)
73franklintempleton.com Semiannual Report
• Level 3 – significant unobservable inputs (including the Funds' own assumptions in determining the fair value of financial instruments)
The input levels are not necessarily an indication of the risk or liquidity associated with financial instruments at that level.
A summary of inputs used as of April 30, 2021, in valuing the Funds’ assets and liabilities carried at fair value, is as follows:
Level 1 Level 2 Level 3 Total
Franklin Convertible Securities FundAssets:
Investments in Securities:Common Stocks . . . . . . . . . . . . . . . . . . . . . . . . $15,178,160 $— $— $15,178,160Convertible Preferred Stocks:
Auto Components . . . . . . . . . . . . . . . . . . . . . . 86,549,000 — — 86,549,000Capital Markets . . . . . . . . . . . . . . . . . . . . . . . . 101,972,800 — — 101,972,800Chemicals . . . . . . . . . . . . . . . . . . . . . . . . . . . 59,075,591 — — 59,075,591Electric Utilities . . . . . . . . . . . . . . . . . . . . . . . . 184,486,300 — — 184,486,300Food Products . . . . . . . . . . . . . . . . . . . . . . . . 74,340,000 — — 74,340,000Health Care Equipment & Supplies . . . . . . . . . 112,413,749 — — 112,413,749Health Care Technology . . . . . . . . . . . . . . . . . 22,962,000 — — 22,962,000Life Sciences Tools & Services . . . . . . . . . . . . 81,048,800 — — 81,048,800Machinery . . . . . . . . . . . . . . . . . . . . . . . . . . . . 34,126,725 — — 34,126,725Multi-Utilities . . . . . . . . . . . . . . . . . . . . . . . . . . 110,400,140 — — 110,400,140Semiconductors & Semiconductor Equipment . 103,055,895 — — 103,055,895Water Utilities . . . . . . . . . . . . . . . . . . . . . . . . . 45,514,700 — — 45,514,700Wireless Telecommunication Services . . . . . . . — 56,487,840 — 56,487,840
Convertible Bonds . . . . . . . . . . . . . . . . . . . . . . . — 4,111,292,531 — 4,111,292,531Short Term Investments . . . . . . . . . . . . . . . . . . . 59,071,613 7,178,301 — 66,249,914
Total Investments in Securities . . . . . . . . . . . $1,090,195,473 $4,174,958,672 $— $5,265,154,145
Franklin Equity Income FundAssets:
Investments in Securities:Common Stocks:
Aerospace & Defense . . . . . . . . . . . . . . . . . . . 125,142,260 — — 125,142,260Air Freight & Logistics . . . . . . . . . . . . . . . . . . . 87,048,220 — — 87,048,220Banks . . . . . . . . . . . . . . . . . . . . . . . . . . . . . . . 369,841,590 — — 369,841,590Beverages . . . . . . . . . . . . . . . . . . . . . . . . . . . 122,329,480 — — 122,329,480Capital Markets . . . . . . . . . . . . . . . . . . . . . . . . 249,876,530 — — 249,876,530Chemicals . . . . . . . . . . . . . . . . . . . . . . . . . . . 76,097,410 28,611,120 — 104,708,530Commercial Services & Supplies . . . . . . . . . . . 49,642,100 — — 49,642,100Communications Equipment . . . . . . . . . . . . . . 19,091,250 — — 19,091,250Diversified Telecommunication Services . . . . . 68,280,610 — — 68,280,610Electric Utilities . . . . . . . . . . . . . . . . . . . . . . . . 208,842,452 — — 208,842,452Electrical Equipment . . . . . . . . . . . . . . . . . . . . 49,396,275 — — 49,396,275Equity Real Estate Investment Trusts (REITs) . 42,025,200 — — 42,025,200Food & Staples Retailing . . . . . . . . . . . . . . . . . 42,042,955 — — 42,042,955Food Products . . . . . . . . . . . . . . . . . . . . . . . . — 6,324,874 — 6,324,874Health Care Equipment & Supplies . . . . . . . . . 94,655,160 — — 94,655,160Health Care Providers & Services . . . . . . . . . . 73,608,280 — — 73,608,280Hotels, Restaurants & Leisure . . . . . . . . . . . . . 52,645,840 — — 52,645,840Household Products . . . . . . . . . . . . . . . . . . . . 78,050,700 — — 78,050,700Insurance . . . . . . . . . . . . . . . . . . . . . . . . . . . . 19,060,925 — — 19,060,925IT Services . . . . . . . . . . . . . . . . . . . . . . . . . . . 17,750,560 — — 17,750,560Machinery . . . . . . . . . . . . . . . . . . . . . . . . . . . . 40,621,450 — — 40,621,450Media . . . . . . . . . . . . . . . . . . . . . . . . . . . . . . . 60,922,750 — — 60,922,750Multiline Retail . . . . . . . . . . . . . . . . . . . . . . . . 85,494,750 — — 85,494,750Oil, Gas & Consumable Fuels . . . . . . . . . . . . . 154,604,275 — — 154,604,275
11. Fair Value Measurements (continued)
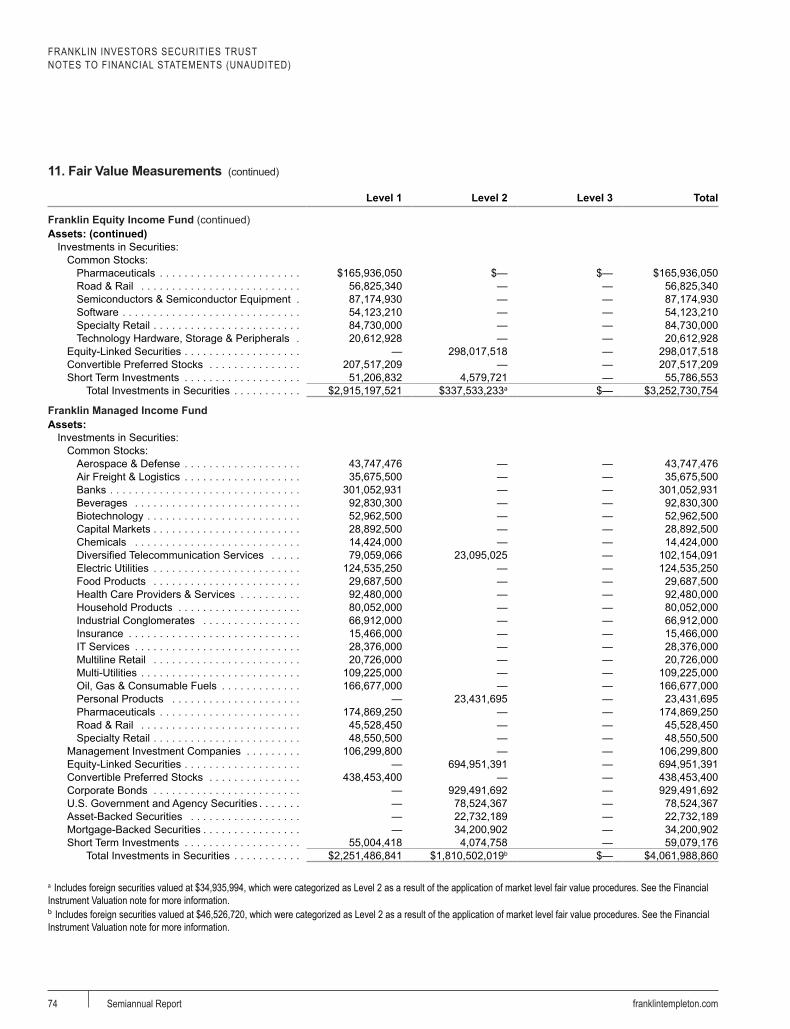
FRANKLIN INVESTORS SECURITIES TRUSTNOTES TO FINANCIAL STATEMENTS (UNAUDITED)
74 franklintempleton.comSemiannual Report
Level 1 Level 2 Level 3 Total
Franklin Equity Income Fund (continued) Assets: (continued)
Investments in Securities:
Common Stocks:
Pharmaceuticals . . . . . . . . . . . . . . . . . . . . . . . $165,936,050 $— $— $165,936,050Road & Rail . . . . . . . . . . . . . . . . . . . . . . . . . . 56,825,340 — — 56,825,340Semiconductors & Semiconductor Equipment . 87,174,930 — — 87,174,930Software . . . . . . . . . . . . . . . . . . . . . . . . . . . . . 54,123,210 — — 54,123,210Specialty Retail . . . . . . . . . . . . . . . . . . . . . . . . 84,730,000 — — 84,730,000Technology Hardware, Storage & Peripherals . 20,612,928 — — 20,612,928
Equity-Linked Securities . . . . . . . . . . . . . . . . . . . — 298,017,518 — 298,017,518Convertible Preferred Stocks . . . . . . . . . . . . . . . 207,517,209 — — 207,517,209Short Term Investments . . . . . . . . . . . . . . . . . . . 51,206,832 4,579,721 — 55,786,553
Total Investments in Securities . . . . . . . . . . . $2,915,197,521 $337,533,233a $— $3,252,730,754
Franklin Managed Income FundAssets:
Investments in Securities:Common Stocks:
Aerospace & Defense . . . . . . . . . . . . . . . . . . . 43,747,476 — — 43,747,476Air Freight & Logistics . . . . . . . . . . . . . . . . . . . 35,675,500 — — 35,675,500Banks . . . . . . . . . . . . . . . . . . . . . . . . . . . . . . . 301,052,931 — — 301,052,931Beverages . . . . . . . . . . . . . . . . . . . . . . . . . . . 92,830,300 — — 92,830,300Biotechnology . . . . . . . . . . . . . . . . . . . . . . . . . 52,962,500 — — 52,962,500Capital Markets . . . . . . . . . . . . . . . . . . . . . . . . 28,892,500 — — 28,892,500Chemicals . . . . . . . . . . . . . . . . . . . . . . . . . . . 14,424,000 — — 14,424,000Diversified Telecommunication Services . . . . . 79,059,066 23,095,025 — 102,154,091Electric Utilities . . . . . . . . . . . . . . . . . . . . . . . . 124,535,250 — — 124,535,250Food Products . . . . . . . . . . . . . . . . . . . . . . . . 29,687,500 — — 29,687,500Health Care Providers & Services . . . . . . . . . . 92,480,000 — — 92,480,000Household Products . . . . . . . . . . . . . . . . . . . . 80,052,000 — — 80,052,000Industrial Conglomerates . . . . . . . . . . . . . . . . 66,912,000 — — 66,912,000Insurance . . . . . . . . . . . . . . . . . . . . . . . . . . . . 15,466,000 — — 15,466,000IT Services . . . . . . . . . . . . . . . . . . . . . . . . . . . 28,376,000 — — 28,376,000Multiline Retail . . . . . . . . . . . . . . . . . . . . . . . . 20,726,000 — — 20,726,000Multi-Utilities . . . . . . . . . . . . . . . . . . . . . . . . . . 109,225,000 — — 109,225,000Oil, Gas & Consumable Fuels . . . . . . . . . . . . . 166,677,000 — — 166,677,000Personal Products . . . . . . . . . . . . . . . . . . . . . — 23,431,695 — 23,431,695Pharmaceuticals . . . . . . . . . . . . . . . . . . . . . . . 174,869,250 — — 174,869,250Road & Rail . . . . . . . . . . . . . . . . . . . . . . . . . . 45,528,450 — — 45,528,450Specialty Retail . . . . . . . . . . . . . . . . . . . . . . . . 48,550,500 — — 48,550,500
Management Investment Companies . . . . . . . . . 106,299,800 — — 106,299,800Equity-Linked Securities . . . . . . . . . . . . . . . . . . . — 694,951,391 — 694,951,391Convertible Preferred Stocks . . . . . . . . . . . . . . . 438,453,400 — — 438,453,400Corporate Bonds . . . . . . . . . . . . . . . . . . . . . . . . — 929,491,692 — 929,491,692U.S. Government and Agency Securities . . . . . . . — 78,524,367 — 78,524,367Asset-Backed Securities . . . . . . . . . . . . . . . . . . — 22,732,189 — 22,732,189Mortgage-Backed Securities . . . . . . . . . . . . . . . . — 34,200,902 — 34,200,902Short Term Investments . . . . . . . . . . . . . . . . . . . 55,004,418 4,074,758 — 59,079,176
Total Investments in Securities . . . . . . . . . . . $2,251,486,841 $1,810,502,019b $— $4,061,988,860
a Includes foreign securities valued at $34,935,994, which were categorized as Level 2 as a result of the application of market level fair value procedures. See the Financial Instrument Valuation note for more information.b Includes foreign securities valued at $46,526,720, which were categorized as Level 2 as a result of the application of market level fair value procedures. See the Financial Instrument Valuation note for more information.
11. Fair Value Measurements (continued)
FRANKLIN INVESTORS SECURITIES TRUSTNOTES TO FINANCIAL STATEMENTS (UNAUDITED)
75franklintempleton.com Semiannual Report
A reconciliation in which Level 3 inputs are used in determining fair value is presented when there are significant Level 3 assets and/or liabilities at the beginning and/or end of the period.
12. New Accounting Pronouncements
In March 2020, the Financial Accounting Standards Board issued Accounting Standards Update (ASU) No. 2020-04, Reference Rate Reform (Topic 848) – Facilitation of the Effects of Reference Rate Reform on Financial Reporting. The amendments in the ASU provides optional temporary financial reporting relief from the effect of certain types of contract modifications due to the planned discontinuation of the London Interbank Offered Rate and other interbank-offered based reference rates as of the end of 2021. The ASU is effective for certain reference rate-related contract modifications that occur during the period March 12, 2020 through December 31, 2022. Management has reviewed the requirements and believes the adoption of this ASU will not have a material impact on the financial statements.
13. Subsequent Events
The Funds have evaluated subsequent events through the issuance of the financial statements and determined that no events have occurred that require disclosure.
11. Fair Value Measurements (continued)

FRANKLIN INVESTORS SECURITIES TRUSTNOTES TO FINANCIAL STATEMENTS (UNAUDITED)
76 franklintempleton.comSemiannual Report
Abbreviations
Selected PortfolioADR American Depositary Receipt
ETF Exchange-Traded Fund
FNMA Federal National Mortgage Association
FRN Floating Rate Note
GNMA Government National Mortgage Association

FRANKLIN INVESTORS SECURITIES TRUST
Shareholder Information
77franklintempleton.com Semiannual Report
Board Approval of Investment Management AgreementsFRANKLIN INVESTORS SECURITIES TRUSTFranklin Convertible Securities FundFranklin Equity Income FundFranklin Managed Income Fund(each a Fund)
At a meeting held on February 23, 2021 (Meeting), the Board of Trustees (Board) of Franklin Investors Securities Trust (Trust), including a majority of the trustees who are not “interested persons” as defined in the Investment Company Act of 1940 (Independent Trustees), reviewed and approved the continuance of the investment management agreement between Franklin Advisers, Inc. (Manager) and the Trust, on behalf of each Fund (each a Management Agreement) for an additional one-year period. The Independent Trustees received advice from and met separately with Independent Trustee counsel in considering whether to approve the continuation of each Management Agreement. Although the Management Agreements for the Funds were considered at the same Board meeting, the Board considered the information provided to it about the Funds together and with respect to each Fund separately as the Board deemed appropriate.
In considering the continuation of each Management Agreement, the Board reviewed and considered information provided by the Manager at the Meeting and throughout the year at meetings of the Board and its committees. The Board also reviewed and considered information provided in response to a detailed set of requests for information submitted to the Manager by Independent Trustee counsel on behalf of the Independent Trustees in connection with the annual contract renewal process. In addition, prior to the Meeting, the Independent Trustees held a telephonic contract renewal meeting at which the Independent Trustees conferred amongst themselves and Independent Trustee counsel about contract renewal matters and, in some cases, requested additional information from the Manager relating to the contract. The Board reviewed and considered all of the factors it deemed relevant in approving the continuance of each Management Agreement, including, but not limited to: (i) the nature, extent and quality of the services provided by the Manager; (ii) the investment performance of each Fund; (iii) the costs of the services provided and profits realized by the Manager and its affiliates from the relationship with
each Fund; (iv) the extent to which economies of scale are realized as each Fund grows; and (v) whether fee levels reflect these economies of scale for the benefit of Fund investors.
In approving the continuance of each Management Agreement, the Board, including a majority of the Independent Trustees, determined that the terms of the Management Agreement are fair and reasonable and that the continuance of such Management Agreement is in the best interests of the applicable Fund and its shareholders. While attention was given to all information furnished, the following discusses some primary factors relevant to the Board’s determination.
Nature, Extent and Quality of ServicesThe Board reviewed and considered information regarding the nature, extent and quality of investment management services provided by the Manager and its affiliates to the Funds and their shareholders. This information included, among other things, the qualifications, background and experience of the senior management and investment personnel of the Manager, as well as information on succession planning where appropriate; the structure of investment personnel compensation; oversight of third-party service providers; investment performance reports and related financial information for each Fund; reports on expenses and shareholder services; legal and compliance matters; risk controls; pricing and other services provided by the Manager and its affiliates; and management fees charged by the Manager and its affiliates to US funds and other accounts, including management’s explanation of differences among accounts where relevant. The Board also reviewed and considered an annual report on payments made by Franklin Templeton (FT) or the Funds to financial intermediaries, as well as a memorandum relating to third-party servicing arrangements, which included discussion of the changing distribution landscape for the Funds. The Board noted management’s continuing efforts and expenditures in establishing effective business continuity plans and developing strategies to address areas of heightened concern in the mutual fund industry, such as cybersecurity in the current work-from-home environment and liquidity risk management.
The Board also reviewed and considered the benefits provided to Fund shareholders of investing in a fund that is part of the FT family of funds. The Board noted the financial position of Franklin Resources, Inc. (FRI), the Manager’s parent, and its commitment to the mutual fund
FRANKLIN INVESTORS SECURITIES TRUSTSHAREHOLDER INFORMATION
78 franklintempleton.comSemiannual Report
business as evidenced by its reassessment of the fund offerings in response to the market environment and project initiatives and capital investments relating to the services provided to the Funds by the FT organization. The Board specifically noted FT’s commitment to enhancing services and controlling costs, as reflected in its outsourcing of certain administrative functions, and growth opportunities, as evidenced by its recent acquisition of the Legg Mason companies. The Board also noted FT’s attention focused on expanding the distribution opportunities for all funds in the FT family of funds.
Following consideration of such information, the Board was satisfied with the nature, extent and quality of services provided by the Manager and its affiliates to the Funds and their shareholders.
Fund PerformanceThe Board reviewed and considered the performance results of each Fund over various time periods ended November 30, 2020. The Board considered the performance returns for each Fund in comparison to the performance returns of mutual funds deemed comparable to the Fund included in a universe (Performance Universe) selected by Broadridge Financial Solutions, Inc. (Broadridge), an independent provider of investment company data. The Board received a description of the methodology used by Broadridge to select the mutual funds included in a Performance Universe. The Board also reviewed and considered Fund performance reports provided and discussions that occurred with portfolio managers at Board meetings throughout the year. A summary of each Fund’s performance results is below.
Franklin Convertible Securities Fund – The Performance Universe for the Fund included the Fund and all retail and institutional convertible securities funds. The Board noted that the Fund’s annualized income return for the one- and five-year periods was below the median of its Performance Universe, but for the three-year period was equal to the median of its Performance Universe and for the 10-year period was above the median of its Performance Universe. The Board also noted that the Fund’s annualized total return for the one-year, three-, five- and 10-year periods was above the median of its Performance Universe. The Board concluded that the Fund’s performance was satisfactory.
Franklin Equity Income Fund – The Performance Universe for the Fund included the Fund and all retail and institutional equity income funds. The Board noted that the Fund’s annualized income return and annualized total return for the one-, three-, five- and 10-year periods were above the medians of its Performance Universe. The Board concluded that the Fund’s performance was satisfactory.
Franklin Managed Income Fund – The Performance Universe for the Fund included the Fund and all retail and institutional mixed-asset target allocation moderate funds. The Board noted that the Fund’s annualized income return for the one-, three-, five- and 10-year periods was above the median and in the first quintile (best) of its Performance Universe. The Board also noted that the Fund’s annualized total return for the one- and three-year periods was below the median of its Performance Universe, but for the five- and 10-year periods was above the median of its Performance Universe. The Board considered that the income-oriented investment objective of the Fund is the primary focus for the Fund’s portfolio management team and that the evaluation of the Fund’s performance relative to the Fund’s peers on an annualized income return basis is consistent with investor expectations and the Fund’s investment goals. Given the Fund’s income-oriented investment objective, the Board concluded that the Fund’s performance was satisfactory.
Comparative Fees and ExpensesThe Board reviewed and considered information regarding each Fund’s actual total expense ratio and its various components, including, as applicable, management fees; transfer agent expenses; underlying fund expenses; Rule 12b-1 and non-Rule 12b-1 service fees; and other non-management fees. The Board also noted the quarterly and annual reports it receives on all marketing support payments made by FT to financial intermediaries. The Board considered the actual total expense ratio and, separately, the contractual management fee rate, without the effect of fee waivers, if any (Management Rate) of each Fund in comparison to the median expense ratio and median Management Rate, respectively, of other mutual funds deemed comparable to and with a similar expense structure to the Fund selected by Broadridge (Expense Group). Broadridge fee and expense data is based upon information taken from each fund’s most recent annual report, which reflects historical asset levels that may be quite different from those currently existing, particularly in a period of market volatility. While recognizing such inherent limitation and the fact that expense ratios and Management Rates generally increase as assets decline and decrease as assets grow, the Board believed the independent analysis conducted by Broadridge to be an appropriate measure of comparative fees and expenses. The Broadridge Management Rate includes administrative charges, and the actual total expense ratio, for comparative consistency, was shown for Class A shares for each Fund and for each of the other funds in each respective Expense Group. The Board received a description of the methodology used by Broadridge to select the mutual funds included in an Expense Group.

FRANKLIN INVESTORS SECURITIES TRUSTSHAREHOLDER INFORMATION
79franklintempleton.com Semiannual Report
Franklin Convertible Securities Fund and Franklin Equity Income Fund – The Expense Group for the Franklin Convertible Securities Fund included the Fund and nine other convertible securities funds. The Expense Group for the Franklin Equity Income Fund included the Fund and 16 other equity income funds. The Board noted that the Management Rates and actual total expense ratios for the Funds were below the medians of their respective Expense Groups. The Board concluded that the Management Rates charged to the Funds are reasonable.
Franklin Managed Income Fund – The Expense Group for the Fund included the Fund and eight other mixed-asset target allocation moderate funds. The Board noted that the Management Rate for the Fund was slightly above the median of its Expense Group. The Board also noted that the actual total expense ratio for the Fund was below the median and in the second quintile of its Expense Group. The Board further noted that the actual total expense ratio for the Fund reflected a fee waiver from management. The Board concluded that the Management Rate charged to the Fund is reasonable.
ProfitabilityThe Board reviewed and considered information regarding the profits realized by the Manager and its affiliates in connection with the operation of each Fund. In this respect, the Board considered the Fund profitability analysis provided by the Manager that addresses the overall profitability of FT’s US fund business, as well as its profits in providing investment management and other services to each of the individual funds during the 12-month period ended September 30, 2020, being the most recent fiscal year-end for FRI. The Board noted that although management continually makes refinements to its methodologies used in calculating profitability in response to organizational and product-related changes, the overall methodology has remained consistent with that used in the Funds’ profitability report presentations from prior years. The Board further noted management’s representation that the profitability analysis excluded the impact of the recent acquisition of the Legg Mason companies and that management expects to incorporate the legacy Legg Mason companies into the profitability analysis beginning next year. The Board also noted that PricewaterhouseCoopers LLP, auditor to FRI and certain FT funds, has been engaged by the Manager to periodically review and assess the allocation methodologies to be used solely by the Funds’ Board with respect to the profitability analysis.
The Board noted management’s belief that costs incurred in establishing the infrastructure necessary for the type of mutual fund operations conducted by the Manager and its affiliates may not be fully reflected in the expenses allocated to each Fund in determining its profitability, as well as the fact that the level of profits, to a certain extent, reflected operational cost savings and efficiencies initiated by management. As part of this evaluation, the Board considered management’s outsourcing of certain operations, which effort has required considerable upfront expenditures by the Manager but, over the long run is expected to result in greater efficiencies. The Board also noted management’s expenditures in improving shareholder services provided to the Funds, as well as the need to implement systems and meet additional regulatory and compliance requirements resulting from recent US Securities and Exchange Commission and other regulatory requirements.
The Board also considered the extent to which the Manager and its affiliates might derive ancillary benefits from fund operations, including revenues generated from transfer agent services, potential benefits resulting from personnel and systems enhancements necessitated by fund growth, as well as increased leverage with service providers and counterparties. Based upon its consideration of all these factors, the Board concluded that the level of profits realized by the Manager and its affiliates from providing services to each Fund was not excessive in view of the nature, extent, and quality of services provided to each Fund.
Economies of ScaleThe Board reviewed and considered the extent to which the Manager may realize economies of scale, if any, as each Fund grows larger and whether each Fund’s management fee structure reflects any economies of scale for the benefit of shareholders. With respect to possible economies of scale, the Board noted the existence of management fee breakpoints, which operate generally to share any economies of scale with a Fund’s shareholders by reducing the Fund’s effective management fees as the Fund grows in size. The Board considered the Manager’s view that any analyses of potential economies of scale in managing a particular fund are inherently limited in light of the joint and common costs and investments the Manager incurs across the FT family of funds as a whole. The Board concluded that to the extent economies of scale may be realized by the Manager and its affiliates, each Fund’s management fee structure provided a sharing of benefits with the Fund and its shareholders as the Fund grows.

FRANKLIN INVESTORS SECURITIES TRUSTSHAREHOLDER INFORMATION
80 franklintempleton.comSemiannual Report
ConclusionBased on its review, consideration and evaluation of all factors it believed relevant, including the above-described factors and conclusions, the Board unanimously approved the continuation of each Management Agreement for an additional one-year period.
Proxy Voting Policies and ProceduresThe Trust’s investment manager has established Proxy Voting Policies and Procedures (Policies) that the Trust uses to determine how to vote proxies relating to portfolio securities. Shareholders may view the Trust’s complete Policies online at franklintempleton.com. Alternatively, shareholders may request copies of the Policies free of charge by calling the Proxy Group collect at (954) 527-7678 or by sending a written request to: Franklin Templeton Companies, LLC, 300 S.E. 2nd Street, Fort Lauderdale, FL 33301, Attention: Proxy Group. Copies of the Trust’s proxy voting records are also made available online at franklintempleton.com and posted on the U.S. Securities and Exchange Commission’s website at sec.gov and reflect the most recent 12-month period ended June 30.
Quarterly Statement of InvestmentsThe Trust files a complete statement of investments with the U.S. Securities and Exchange Commission for the first and third quarters for each fiscal year as an exhibit to its report on Form N-PORT. Shareholders may view the filed Form N-PORT by visiting the Commission’s website at sec.gov. The filed form may also be viewed and copied at the Commission’s Public Reference Room in Washington, DC. Information regarding the operations of the Public Reference Room may be obtained by calling (800) SEC-0330.
Householding of Reports and ProspectusesYou will receive, or receive notice of the availability of, each Fund's financial reports every six months. In addition, you will receive an annual updated summary prospectus (detail prospectus available upon request). To reduce Fund expenses, we try to identify related shareholders in a household and send only one copy of the financial reports (to the extent received by mail) and summary prospectus. This process, called “householding,” will continue indefinitely unless you instruct us otherwise. If you prefer not to have these documents householded, please call us at (800)
632-2301. At any time you may view current prospectuses/summary prospectuses and financial reports on our website. If you choose, you may receive these documents through electronic delivery.

FIST1 S 06/21© 2021 Franklin Templeton Investments. All rights reserved.
Authorized for distribution only when accompanied or preceded by a summary prospectus and/or prospectus. Investors should carefully consider a fund’s investment goals, risks, charges and expenses before investing. A prospectus contains this and other information; please read it carefully before investing.
To help ensure we provide you with quality service, all calls to and from our service areas are monitored and/or recorded.
Semiannual Report and Shareholder LetterFranklin Investors Securities Trust
Investment Manager Distributor Shareholder ServicesFranklin Advisers, Inc. Franklin Templeton Distributors, Inc.
(800) DIAL BEN® / 342-5236franklintempleton.com
(800) 632-2301