Frank Cowell: TU Lisbon – Inequality & Poverty Inequality: Empirical Issues July 2006 Inequality...
43
Frank Cowell: rank Cowell: TU Lisbon – Inequality & Poverty TU Lisbon – Inequality & Poverty Inequality: Empirical Issues July July 2006 2006 Inequality and Poverty Measurement Inequality and Poverty Measurement Technical University of Lisbon Technical University of Lisbon Frank Cowell Frank Cowell http://darp.lse.ac.uk/lisbon2006 http://darp.lse.ac.uk/lisbon2006
-
date post
19-Dec-2015 -
Category
Documents
-
view
221 -
download
0
Transcript of Frank Cowell: TU Lisbon – Inequality & Poverty Inequality: Empirical Issues July 2006 Inequality...
Frank C
owell:
Frank C
owell: T
U L
isbon – Inequality & P
overty T
U L
isbon – Inequality & P
overty
Inequality: Empirical Issues
July 2006 July 2006
Inequality and Poverty Measurement Inequality and Poverty Measurement
Technical University of LisbonTechnical University of Lisbon
Frank CowellFrank Cowellhttp://darp.lse.ac.uk/lisbon2006http://darp.lse.ac.uk/lisbon2006
Frank C
owell:
Frank C
owell: T
U L
isbon – Inequality & P
overty T
U L
isbon – Inequality & P
overty
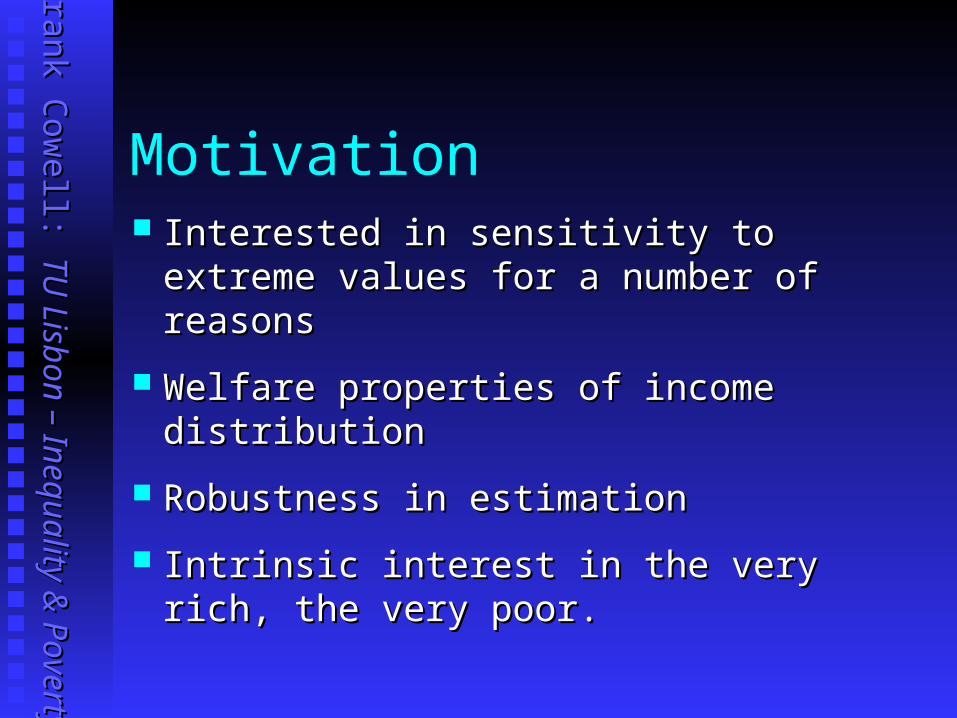
Motivation Interested in sensitivity to extreme values Interested in sensitivity to extreme values
for a number of reasonsfor a number of reasons
Welfare properties of income distributionWelfare properties of income distribution
Robustness in estimationRobustness in estimation
Intrinsic interest in the very rich, the very Intrinsic interest in the very rich, the very poor.poor.

Frank C
owell:
Frank C
owell: T
U L
isbon – Inequality & P
overty T
U L
isbon – Inequality & P
overty
Sensitivity? How to define a “sensitive” inequality measure? How to define a “sensitive” inequality measure? Ad hoc discussion of individual measures Ad hoc discussion of individual measures
empirical performance on actual data (Braulke 83). empirical performance on actual data (Braulke 83). not satisfactory for characterising general propertiesnot satisfactory for characterising general properties
Welfare-theoretical approachesWelfare-theoretical approaches focuses on transfer sensitivity (Shorrocks-Foster focuses on transfer sensitivity (Shorrocks-Foster
1987)1987) But does not provide a guide to the way measures But does not provide a guide to the way measures
may respond to extreme values. may respond to extreme values. Need a general and empirically applicable tool.Need a general and empirically applicable tool.
Frank C
owell:
Frank C
owell: T
U L
isbon – Inequality & P
overty T
U L
isbon – Inequality & P
overty
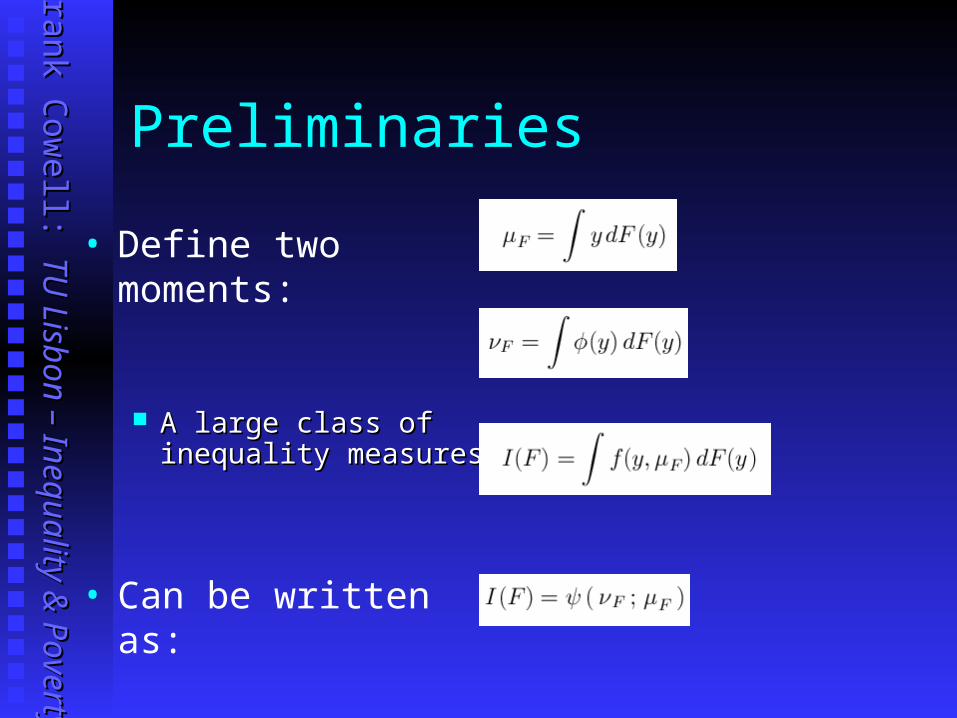
Preliminaries
A large class of inequality A large class of inequality measures:measures:
• Define two moments:
• Can be written as:
Frank C
owell:
Frank C
owell: T
U L
isbon – Inequality & P
overty T
U L
isbon – Inequality & P
overty
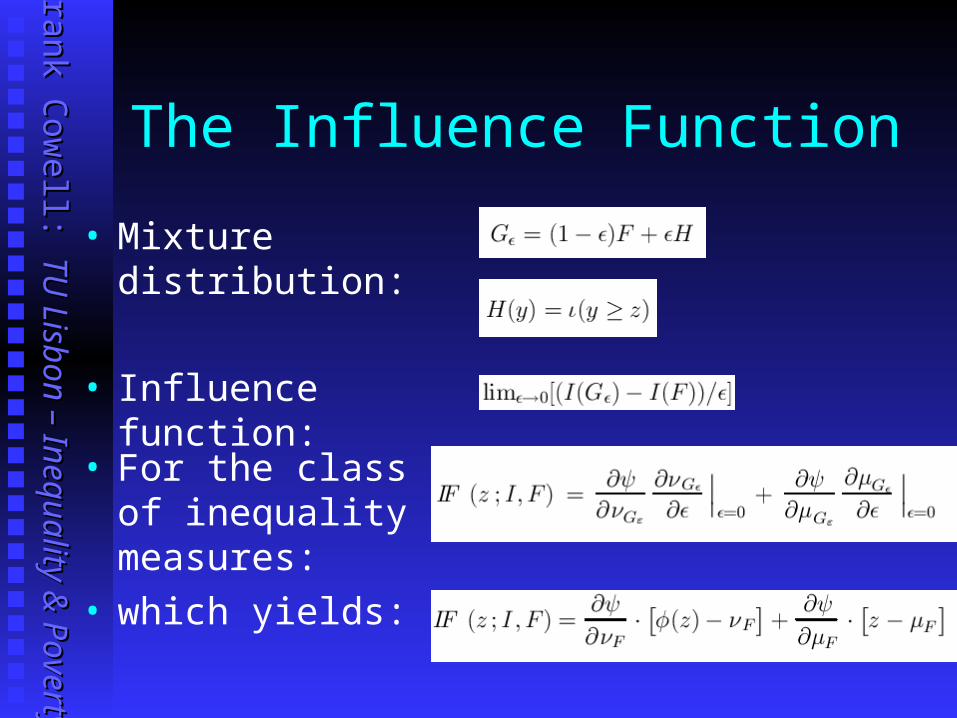
The Influence Function
• Mixture distribution:
• Influence function:
• For the class of inequality measures:
• which yields:

Frank C
owell:
Frank C
owell: T
U L
isbon – Inequality & P
overty T
U L
isbon – Inequality & P
overty
Some Standard Measures
• GE:
• Theil:
• MLD:
• Atkinson:
• Log var:

Frank C
owell:
Frank C
owell: T
U L
isbon – Inequality & P
overty T
U L
isbon – Inequality & P
overty
…and their IFs
• GE:
• Theil:
• MLD:
• Atkinson:
• Log var:

Frank C
owell:
Frank C
owell: T
U L
isbon – Inequality & P
overty T
U L
isbon – Inequality & P
overty
Special case
• The IF:
• The Gini coeff:
• where:

Frank C
owell:
Frank C
owell: T
U L
isbon – Inequality & P
overty T
U L
isbon – Inequality & P
overty
Tail behaviour
z z
zz
zz
zz
zz
zz
zz
z z 0 0
[log [log zz] ] zz
--
log log zz
--
--
< 0< 0
= 0= 0
11
> 1> 1
Log VarLog Var
GiniGini
GEGE
Frank C
owell:
Frank C
owell: T
U L
isbon – Inequality & P
overty T
U L
isbon – Inequality & P
overty
Implications
Generalised Entropy measures with Generalised Entropy measures with > 1 are very > 1 are very sensitive to high incomes in the data.sensitive to high incomes in the data.
GE (GE ( < 0) are very sensitive to low incomes < 0) are very sensitive to low incomes
We can’t compare the speed of increase of the IF We can’t compare the speed of increase of the IF for different values of 0 < for different values of 0 < < 1 < 1
If we don’t know the income distribution, we can’t If we don’t know the income distribution, we can’t compare the IFs of different class of measures.compare the IFs of different class of measures.
So, let’s take a standard model…So, let’s take a standard model…

Frank C
owell:
Frank C
owell: T
U L
isbon – Inequality & P
overty T
U L
isbon – Inequality & P
overty
Singh-Maddala
c = 1.2
c = 0.7
c = 1.7

Frank C
owell:
Frank C
owell: T
U L
isbon – Inequality & P
overty T
U L
isbon – Inequality & P
overty
Using S-M to get the IFs
Use these to get true values of inequality measures.Use these to get true values of inequality measures. Obtained from the moments:Obtained from the moments:
• Take parameter values a=100, b=2.8, c=1.7
• Normalise the IFs • Use relative influence function
Good model of income distribution of German households
Good model of income distribution of German households
Frank C
owell:
Frank C
owell: T
U L
isbon – Inequality & P
overty T
U L
isbon – Inequality & P
overty
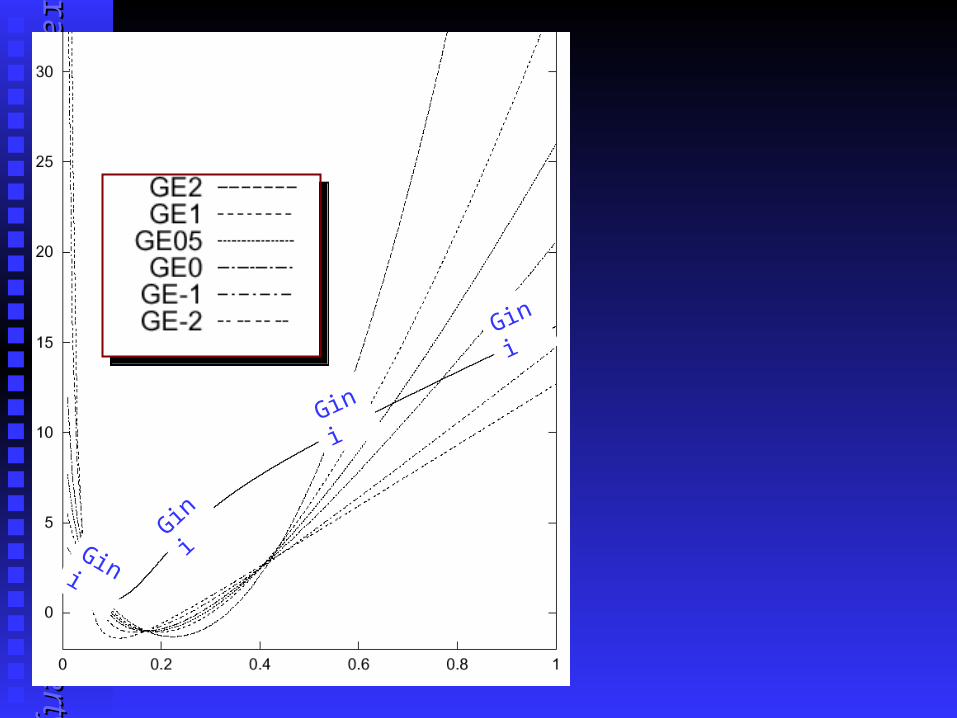
IFs based on S-M
Gini
Gini
Gini
Gini
Frank C
owell:
Frank C
owell: T
U L
isbon – Inequality & P
overty T
U L
isbon – Inequality & P
overty
IF using S-M: conclusions
When When zz increases, IF increases faster with high increases, IF increases faster with high values of values of . .
When When zz tends to 0, IF increases faster with small tends to 0, IF increases faster with small values of values of ..
IF of Gini index increases slower than others but IF of Gini index increases slower than others but is larger for moderate values of is larger for moderate values of zz. .
Comparison of the Gini index with GE or Log Comparison of the Gini index with GE or Log Variance does not lead to clear conclusions.Variance does not lead to clear conclusions.

Frank C
owell:
Frank C
owell: T
U L
isbon – Inequality & P
overty T
U L
isbon – Inequality & P
overty
A simulation approach
Use a simulation study to evaluate the impact of a Use a simulation study to evaluate the impact of a contamination in extreme observations.contamination in extreme observations.
Simulate 100 samples of 200 observations from S-M Simulate 100 samples of 200 observations from S-M distribution. distribution.
Contaminate just one randomly chosen observation by Contaminate just one randomly chosen observation by multiplying it by 10.multiplying it by 10.
Contaminate just one randomly chosen observation by Contaminate just one randomly chosen observation by dividing it by 10.dividing it by 10.
Compute the quantityCompute the quantityEmpirical Distribution
Empirical Distribution
Contaminated Distribution
Contaminated Distribution

Frank C
owell:
Frank C
owell: T
U L
isbon – Inequality & P
overty T
U L
isbon – Inequality & P
overty
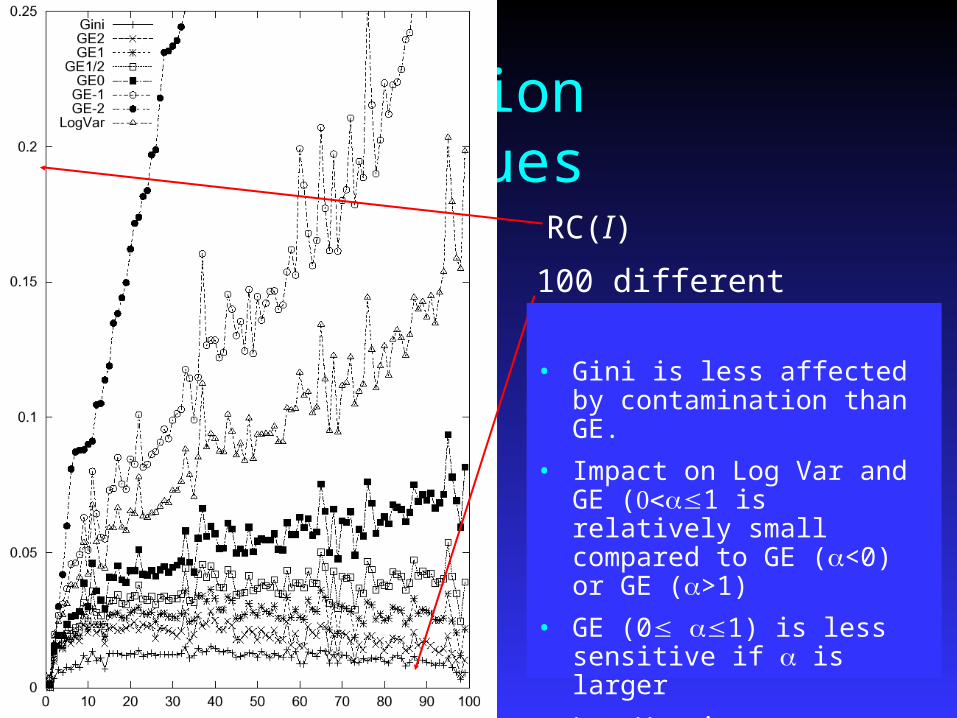
Contamination in high values
100 different samples sorted such that Gini realisations are increasing.
RC(I)
• Gini is less affected by contamination than GE.
• Impact on Log Var and GE (1 is relatively small compared to GE (<0) or GE (>1)
• GE (0 1) is less sensitive if is smaller
• Log Var is slightly more sensitive than Gini
Frank C
owell:
Frank C
owell: T
U L
isbon – Inequality & P
overty T
U L
isbon – Inequality & P
overty
Contamination in low values
100 different samples sorted such that Gini realisations are increasing.
RC(I)
• Gini is less affected by contamination than GE.
• Impact on Log Var and GE (1 is relatively small compared to GE (<0) or GE (>1)
• GE (0 1) is less sensitive if is larger
• Log Var is more sensitive than Gini
Frank C
owell:
Frank C
owell: T
U L
isbon – Inequality & P
overty T
U L
isbon – Inequality & P
overty
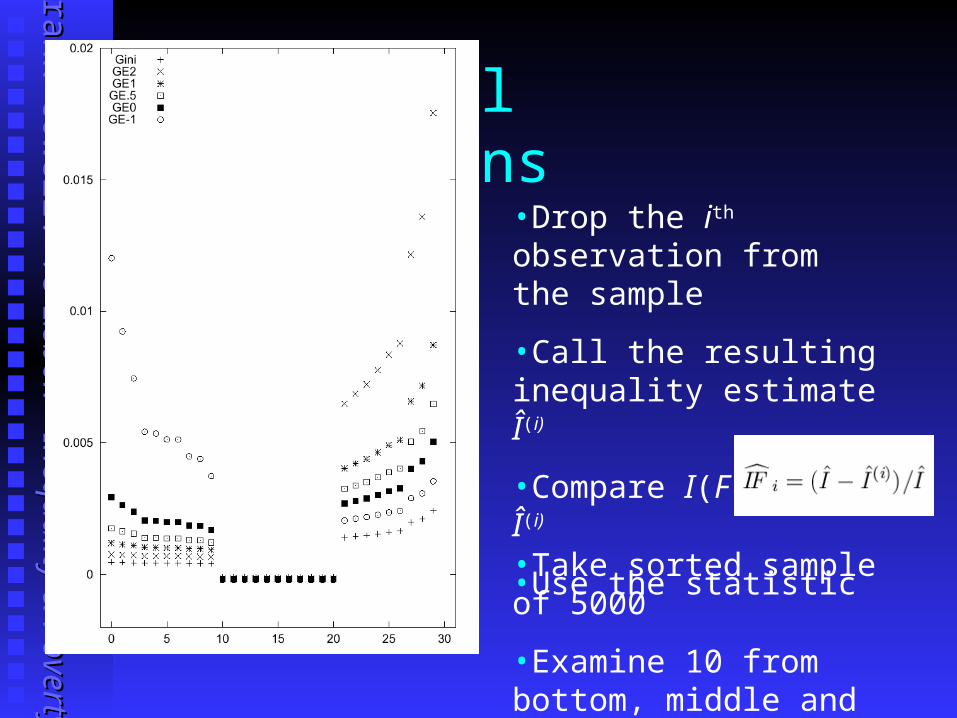
Influential Observations
•Drop the ith observation from the sample
•Call the resulting inequality estimate Î(i)
•Compare I(F) with Î(i)
•Use the statistic
•Take sorted sample of 5000
•Examine 10 from bottom, middle and top

Frank C
owell:
Frank C
owell: T
U L
isbon – Inequality & P
overty T
U L
isbon – Inequality & P
overty
Influential observations: summary
Observations in the middle of the sorted sample don’t affect Observations in the middle of the sorted sample don’t affect estimates compared to smallest or highest observations. estimates compared to smallest or highest observations.
Highest values are more influential than smallest values. Highest values are more influential than smallest values. Highest value is very influential for GE (Highest value is very influential for GE (= 2) = 2) Its estimate should be modified by nearly 0.018 if we remove it. Its estimate should be modified by nearly 0.018 if we remove it. GE (GE (= = ––1) strongly influenced by the smallest observation.1) strongly influenced by the smallest observation.

Frank C
owell:
Frank C
owell: T
U L
isbon – Inequality & P
overty T
U L
isbon – Inequality & P
overty
Extreme values
An extreme value is not necessarily an error or some An extreme value is not necessarily an error or some sort of contaminationsort of contamination
Could be an observation belonging to the true Could be an observation belonging to the true distribution distribution
Could convey important information.Could convey important information. Observation is extreme in the sense that its influence Observation is extreme in the sense that its influence
on the inequality measure estimate is important. on the inequality measure estimate is important. Call this a Call this a high-leveragehigh-leverage observation. observation.
Frank C
owell:
Frank C
owell: T
U L
isbon – Inequality & P
overty T
U L
isbon – Inequality & P
overty
High-leverage observations
The term leaves open the question of whether such The term leaves open the question of whether such observations “belong” to the distributionobservations “belong” to the distribution
But they can have important consequences on the But they can have important consequences on the statistical performance of the measure.statistical performance of the measure.
Can use this performance to characterise the Can use this performance to characterise the properties of inequality measures under certain properties of inequality measures under certain conditions. conditions.
Focus on the Focus on the EError in rror in RRejection ejection PProbability as a robability as a criterion.criterion.

Frank C
owell:
Frank C
owell: T
U L
isbon – Inequality & P
overty T
U L
isbon – Inequality & P
overty
Davidson-Flachaire (1) Even in very large samples the ERP of an Even in very large samples the ERP of an
asymptotic or bootstrap test based on the Theil asymptotic or bootstrap test based on the Theil index, can be significant index, can be significant
Tests are therefore not reliable. Tests are therefore not reliable. Three main possible causes : Three main possible causes :
1.1. NonlinearityNonlinearity
2.2. Noise Noise
3.3. Nature of the tails. Nature of the tails.

Frank C
owell:
Frank C
owell: T
U L
isbon – Inequality & P
overty T
U L
isbon – Inequality & P
overty
Davidson-Flachaire (2) Three main possible causes : Three main possible causes :
1.1. Indices are nonlinear functions of sample moments. Induces Indices are nonlinear functions of sample moments. Induces biases and nonnormality in estimates.biases and nonnormality in estimates.
2.2. Estimates of the covariances of the sample moments used to Estimates of the covariances of the sample moments used to construct indices are often noisy. construct indices are often noisy.
3.3. Indices often sensitive to the exact nature of the tails. A Indices often sensitive to the exact nature of the tails. A bootstrap sample with nothing resampled from the tail can bootstrap sample with nothing resampled from the tail can have properties different from those of the population.have properties different from those of the population.
Simulation experiments show that case 3 is often Simulation experiments show that case 3 is often quantitatively the most important. quantitatively the most important.
Statistical performance should be better with MLD Statistical performance should be better with MLD and GE (0 < and GE (0 < < 1 ), than with Theil.< 1 ), than with Theil.

Frank C
owell:
Frank C
owell: T
U L
isbon – Inequality & P
overty T
U L
isbon – Inequality & P
overty
Empirical methods
• The empirical distribution
• Inequality estimate
• Empirical moments
Empirical Distribution
Empirical Distribution
Indicator function
Indicator function
Frank C
owell:
Frank C
owell: T
U L
isbon – Inequality & P
overty T
U L
isbon – Inequality & P
overty
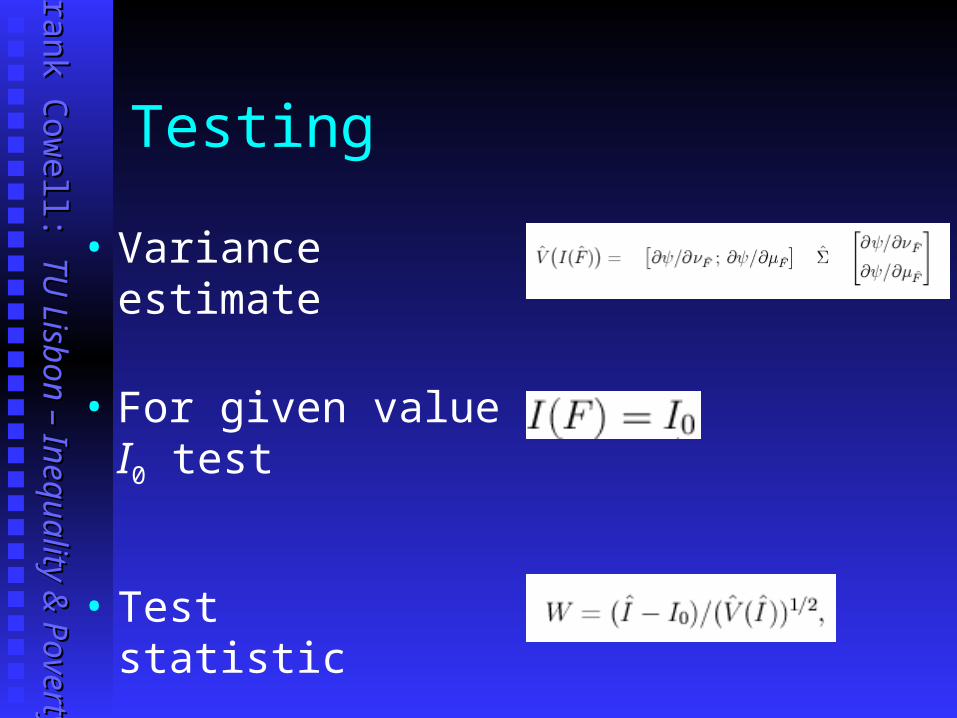
Testing
• Test statistic
• Variance estimate
• For given value I0 test
Frank C
owell:
Frank C
owell: T
U L
isbon – Inequality & P
overty T
U L
isbon – Inequality & P
overty
Bootstrap
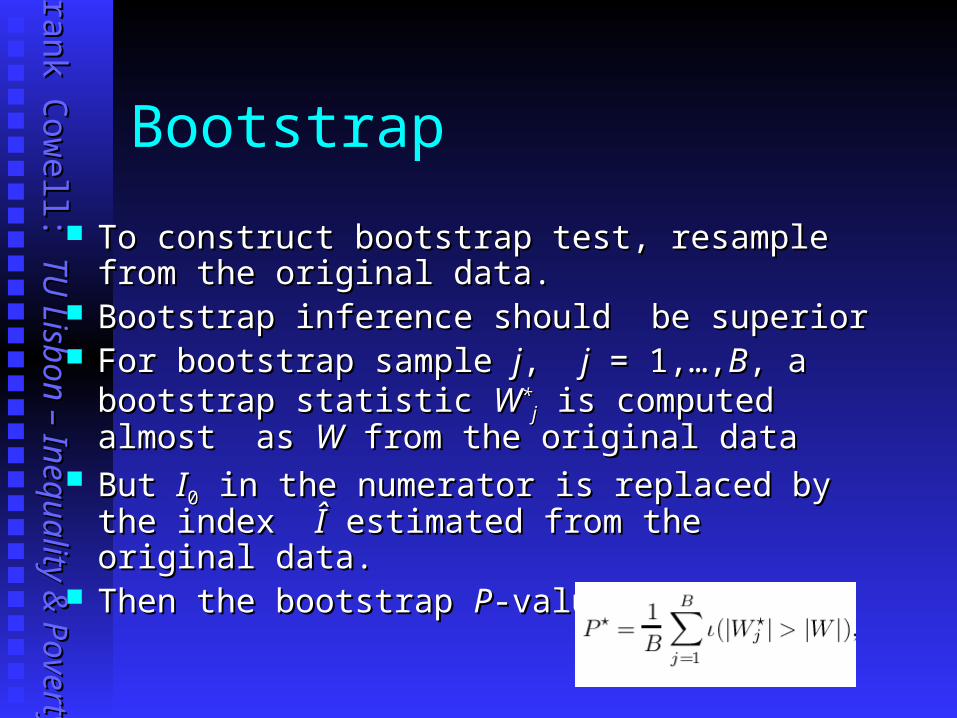
To construct bootstrap test, resample To construct bootstrap test, resample from the original data. from the original data.
Bootstrap inference should be superiorBootstrap inference should be superior For bootstrap sample For bootstrap sample jj, , jj = 1,…, = 1,…,BB, a bootstrap , a bootstrap
statistic statistic WW**jj is computed almost as is computed almost as WW from the from the
original dataoriginal data But But II00 in the numerator is replaced by the index in the numerator is replaced by the index ÎÎ
estimated from the original data.estimated from the original data. Then the bootstrap Then the bootstrap PP-value is-value is

Frank C
owell:
Frank C
owell: T
U L
isbon – Inequality & P
overty T
U L
isbon – Inequality & P
overty
Error in Rejection Probability: A
• ERPs of asymptotic tests at the nominal level 0.05
• Difference between the actual and nominal probabilities of rejection
• Example:o N = 2 000 observations o ERP of GE ( =2) is 0.11o Asymptotic test over-rejects the
null hypothesis o The actual level is 16%, when
the nominal level is 5%.

Frank C
owell:
Frank C
owell: T
U L
isbon – Inequality & P
overty T
U L
isbon – Inequality & P
overty
Error in Rejection Probability: B
• ERPs of bootstrap tests. • Distortions are reduced for
all measures • But ERP of GE ( = 2) is still
very large even in large samples
• ERPs of GE ( = 0.5, –1) is small only for large samples.
• GE (=0) (MLD) performs better than others. ERP is small for 500 or more observations.

Frank C
owell:
Frank C
owell: T
U L
isbon – Inequality & P
overty T
U L
isbon – Inequality & P
overty
More on ERP for GE
What would happen in very large samples?
0.04150.0415
0.01250.0125
0.00430.0043
0.00520.0052
0.00960.0096
0.04920.0492
0.01130.0113
0.00240.0024
0.00540.0054
0.00960.0096
22
––11
00
0.50.5
11
NN=100,000=100,000NN=50,000=50,000

Frank C
owell:
Frank C
owell: T
U L
isbon – Inequality & P
overty T
U L
isbon – Inequality & P
overty
ERP: conclusions
• Rate of convergence to zero of ERP of asymptotic tests is very slow.
• Same applies to bootstrap
• Tests based on GE measures can be unreliable even in large samples.

Frank C
owell:
Frank C
owell: T
U L
isbon – Inequality & P
overty T
U L
isbon – Inequality & P
overty
Sensitivity: a broader perspective
Results so far are for a specific Singh-Maddala Results so far are for a specific Singh-Maddala distribution. distribution.
It is realistic, but – obviously – special.It is realistic, but – obviously – special. Consider alternative parameter valuesConsider alternative parameter values
Particular focus on behaviour in the upper tailParticular focus on behaviour in the upper tail Consider alternative distributionsConsider alternative distributions
Use other familiar and “realistic” functional Use other familiar and “realistic” functional formsforms
Focus on lognormal and ParetoFocus on lognormal and Pareto

Frank C
owell:
Frank C
owell: T
U L
isbon – Inequality & P
overty T
U L
isbon – Inequality & P
overty
Alternative distributions
First consider comparative contamination First consider comparative contamination performance for alternative distributions, performance for alternative distributions, same inequality indexsame inequality index
Use same diagrammatic tool as beforeUse same diagrammatic tool as before
xx-axis is the 100 different samples, sorted -axis is the 100 different samples, sorted such inequality realizations are increasing such inequality realizations are increasing
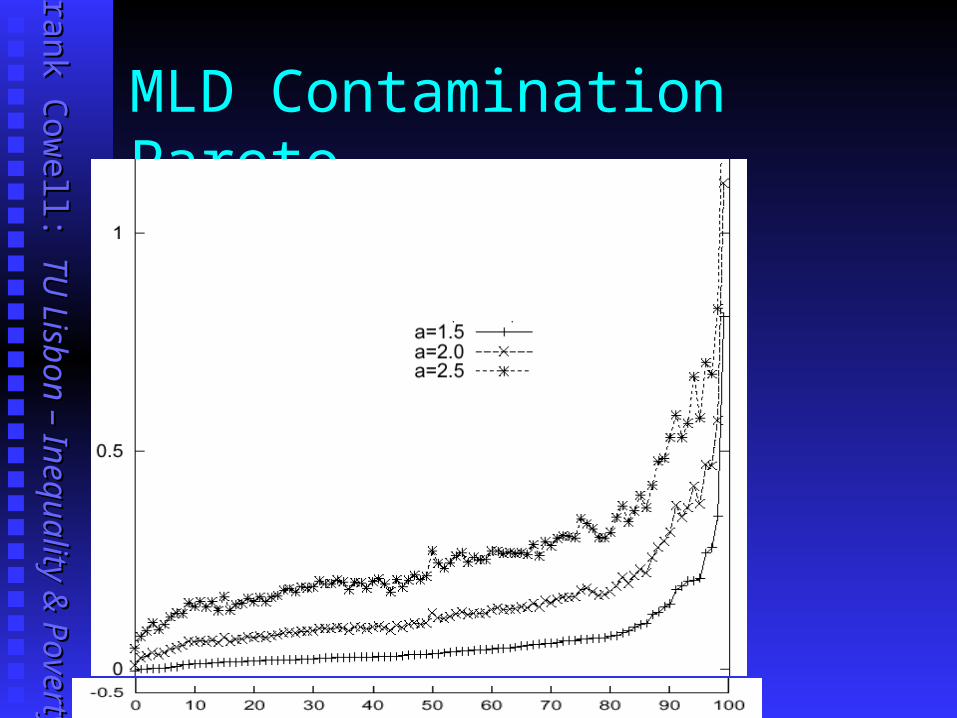
yy-axis is RC(-axis is RC(II) for the MLD index ) for the MLD index

Frank C
owell:
Frank C
owell: T
U L
isbon – Inequality & P
overty T
U L
isbon – Inequality & P
overty
Singh-Maddala
c = 1.2
c = 0.7 (“heavy” upper tail)
c = 1.7
• Inequality found from:
• Distribution function:

Frank C
owell:
Frank C
owell: T
U L
isbon – Inequality & P
overty T
U L
isbon – Inequality & P
overty
Contamination S-M
Frank C
owell:
Frank C
owell: T
U L
isbon – Inequality & P
overty T
U L
isbon – Inequality & P
overty
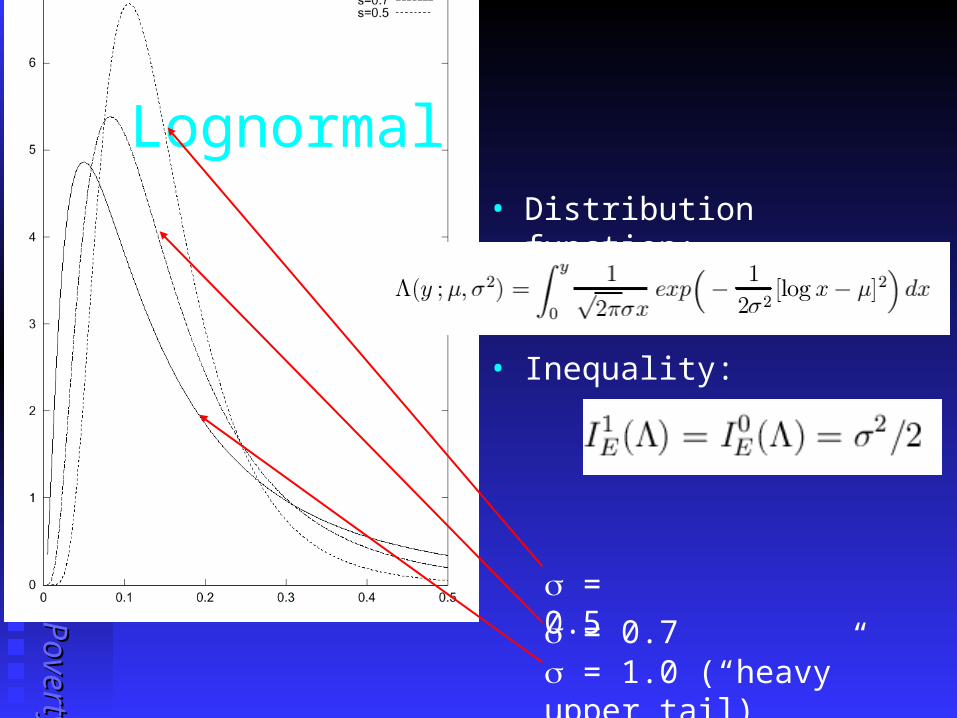
Lognormal
= 0.7 = 1.0 (“heavy” upper tail)
= 0.5
• Inequality:
• Distribution function:

Frank C
owell:
Frank C
owell: T
U L
isbon – Inequality & P
overty T
U L
isbon – Inequality & P
overty
Contamination: Lognormal

Frank C
owell:
Frank C
owell: T
U L
isbon – Inequality & P
overty T
U L
isbon – Inequality & P
overty
Pareto
= 2.0 = 2.5
= 1.5 (“heavy” upper tail)
Frank C
owell:
Frank C
owell: T
U L
isbon – Inequality & P
overty T
U L
isbon – Inequality & P
overty
MLD Contamination Pareto

Frank C
owell:
Frank C
owell: T
U L
isbon – Inequality & P
overty T
U L
isbon – Inequality & P
overty
ERP at nominal 5%: MLD• Asymptotic tests
• Bootstrap tests
Frank C
owell:
Frank C
owell: T
U L
isbon – Inequality & P
overty T
U L
isbon – Inequality & P
overty
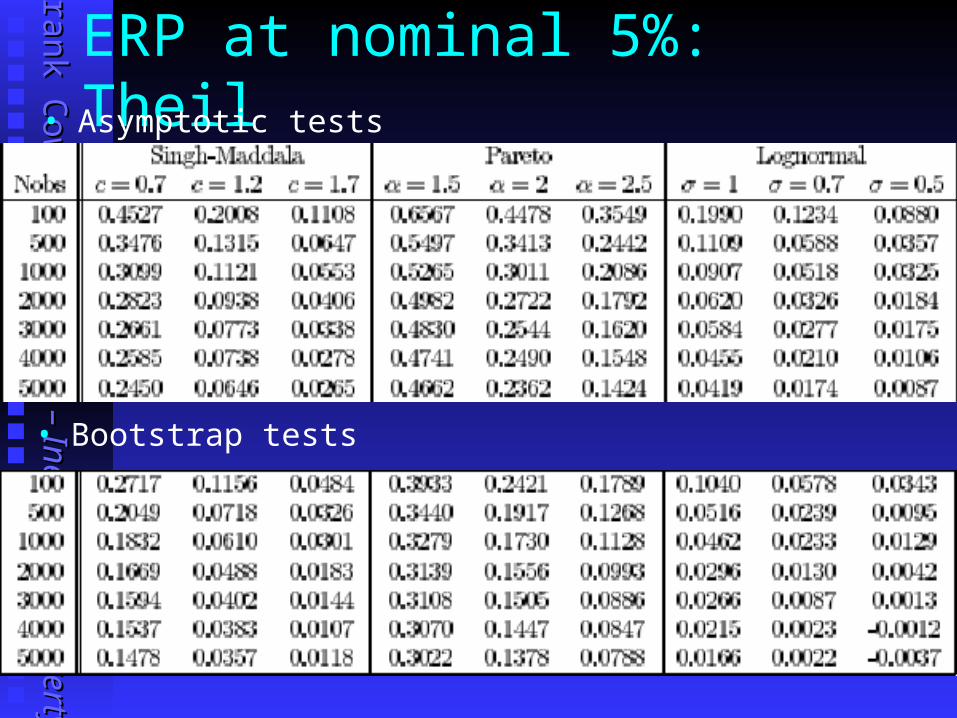
ERP at nominal 5%: Theil• Asymptotic tests
• Bootstrap tests

Frank C
owell:
Frank C
owell: T
U L
isbon – Inequality & P
overty T
U L
isbon – Inequality & P
overty
Comparing Distributions• Bootstrap tests usually improve numerical
performance.
• MLD is more sensitive to contamination in high incomes when the underlying distribution upper tail is heavy.
• ERP of an asymptotic and bootstrap test based on the MLD or Theil index is more significant when the underlying distribution upper tail is heavy.
Frank C
owell:
Frank C
owell: T
U L
isbon – Inequality & P
overty T
U L
isbon – Inequality & P
overty
Why the Gini…? Why use the Gini coefficient? Why use the Gini coefficient?
Obvious intuitive appeal Obvious intuitive appeal
Sometimes suggested that Gini is less prone to the Sometimes suggested that Gini is less prone to the influence of outliers influence of outliers
Less sensitive to contamination in high incomes than Less sensitive to contamination in high incomes than GE indices. GE indices.
But little to choose between…But little to choose between…
the Gini coefficient and MLD the Gini coefficient and MLD
Gini and the logarithmic varianceGini and the logarithmic variance
Frank C
owell:
Frank C
owell: T
U L
isbon – Inequality & P
overty T
U L
isbon – Inequality & P
overty
The Bootstrap…? Does the bootstrap “get you out of trouble”?Does the bootstrap “get you out of trouble”?
bootstrap performs better than asymptotic methods,bootstrap performs better than asymptotic methods,
but does it perform well enough? but does it perform well enough?
In terms of the ERP, the bootstrap does well only In terms of the ERP, the bootstrap does well only for the Gini, MLD and logarithmic variance.for the Gini, MLD and logarithmic variance.
If we use a distribution with a heavy upper tail If we use a distribution with a heavy upper tail bootstrap performs poorly in the case of bootstrap performs poorly in the case of = = 0 0
even in large samples.even in large samples.