
Francis F. Badavi - Workshops on Radiation Monitoring for...
43
Francis F. Badavi (NASA Langley Radiation Team) Old Dominion University, Norfolk, VA 23529 , USA WRMISS18, 3-5 September 2013, Budapest, Hungary Evaluation of the New Trapped Proton Model (AP9) at ISS Attitudes
Transcript of Francis F. Badavi - Workshops on Radiation Monitoring for...
Francis F. Badavi
(NASA Langley Radiation Team)
Old Dominion University, Norfolk, VA 23529 , USA
WRMISS18, 3-5 September 2013, Budapest, Hungary
Evaluation of the New Trapped Proton Model (AP9)
at ISS Attitudes

3-5 September-2013
Background
• I – Traditionally, trapped exposure estimates for the tissue/SSD based components are computed using NASA trapped models AP8/AE8. These trapped models were developed in the 1970s and 1980s. • II – AP8/AE8 are static models. Don’t provide probability distribution or error bars. Don’t include broad energy range (i.e., hot plasma / energetic protons) and don’t include complete spatial coverage for LEO, MEO, GEO, GTO and HEO missions. • III – Aerospace Corporation, Los Alamos National Laboratory (LANL), National Reconnaissance Office (NRO) and Air Force Research Laboratory (AFRL), embarked on producing AP9/AE9. • IV – AP9/AE9 offer improvements in spectral and spatial coverage definition, epoch correlated probability distribution, statistical accuracy and uncertainty quantification.

3-5 September-2013
Outline
• I – Solar indices and the particular epoch I chose for analysis. • II – Show the deficiencies of AP8 and the improvements that AP9 offers. • III – Talk about the specific Liulin data and AP8/AP9 proton boundary conditions that I am using.
• IV – For one day ISS orbit (1440 minutes), I will shows dosemetric correlation among AP8, AP9 environments and Liulin data for 6 SAA passes.
• V – Summary and future work.
*** No further discussion of AE9***
3-5 September-2013
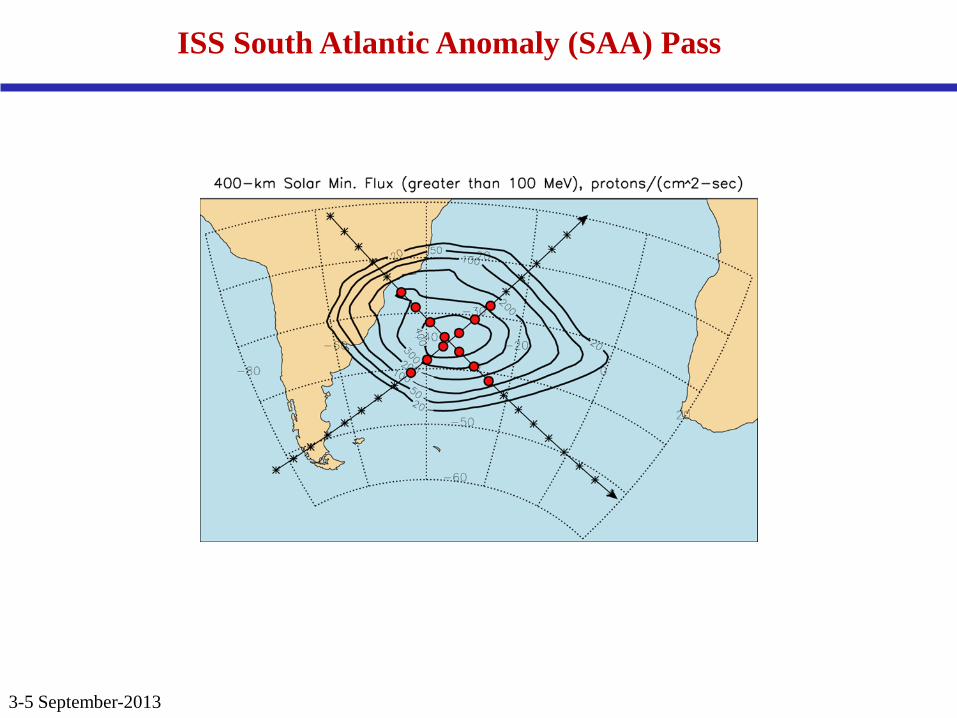
ISS South Atlantic Anomaly (SAA) Pass
3-5 September-2013
1
10
100
1000
10000
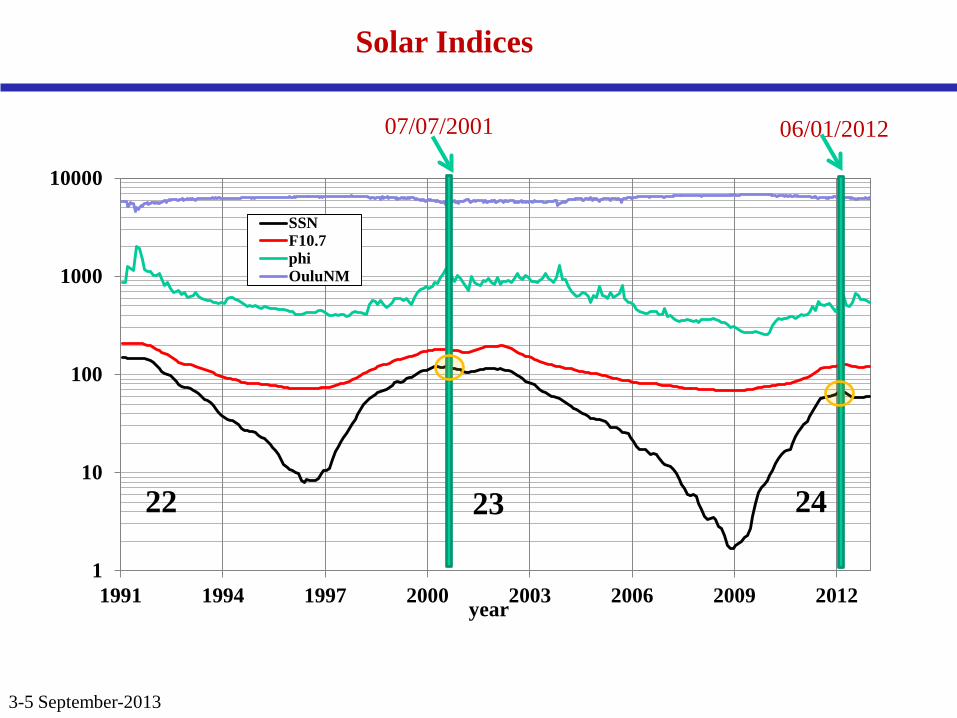
1991 1994 1997 2000 2003 2006 2009 2012year
SSNF10.7phiOuluNM
22
07/07/2001 06/01/2012
Solar Indices
23 24
0
20
40
60
80
100
120
140
160
180
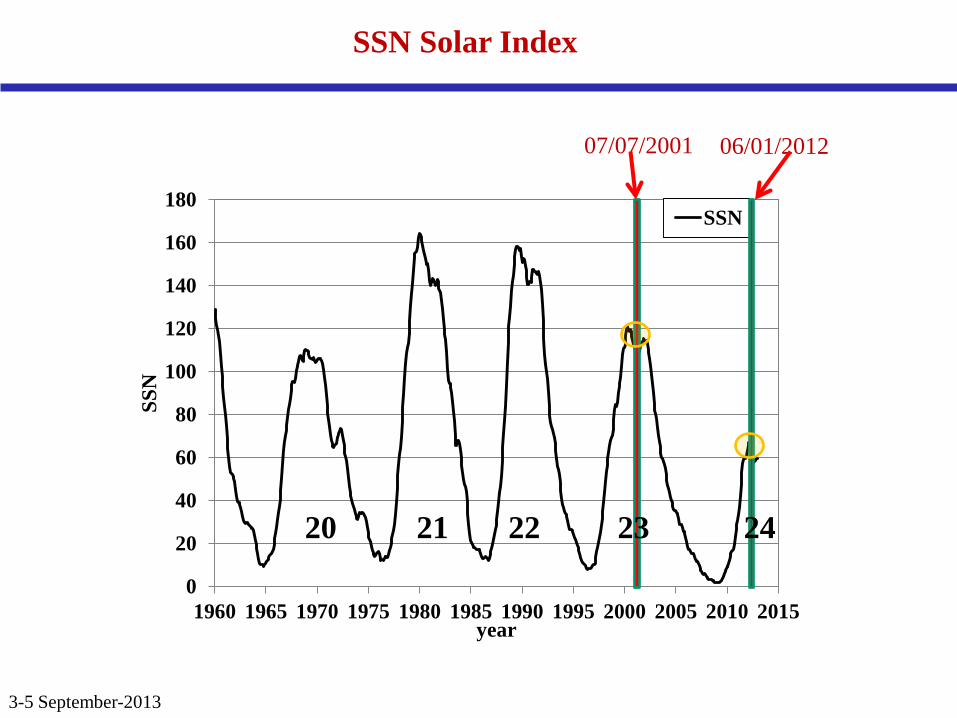
1960 1965 1970 1975 1980 1985 1990 1995 2000 2005 2010 2015
SSN
year
SSN
23
3-5 September-2013
07/07/2001 06/01/2012
SSN Solar Index
22 21 20 24
0
20
40
60
80
100
120
140
160
180
1960 1965 1970 1975 1980 1985 1990 1995 2000 2005 2010 2015
SSN
year
SSN
23
3-5 September-2013
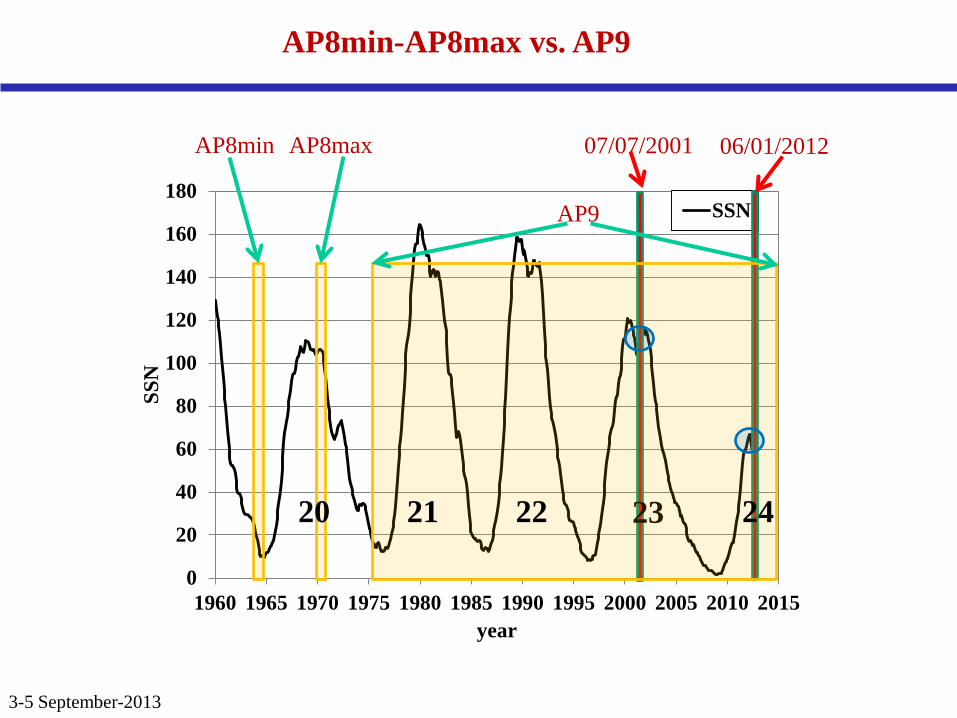
AP8min AP8max 07/07/2001 06/01/2012
AP9
AP8min-AP8max vs. AP9
22 21 20 24
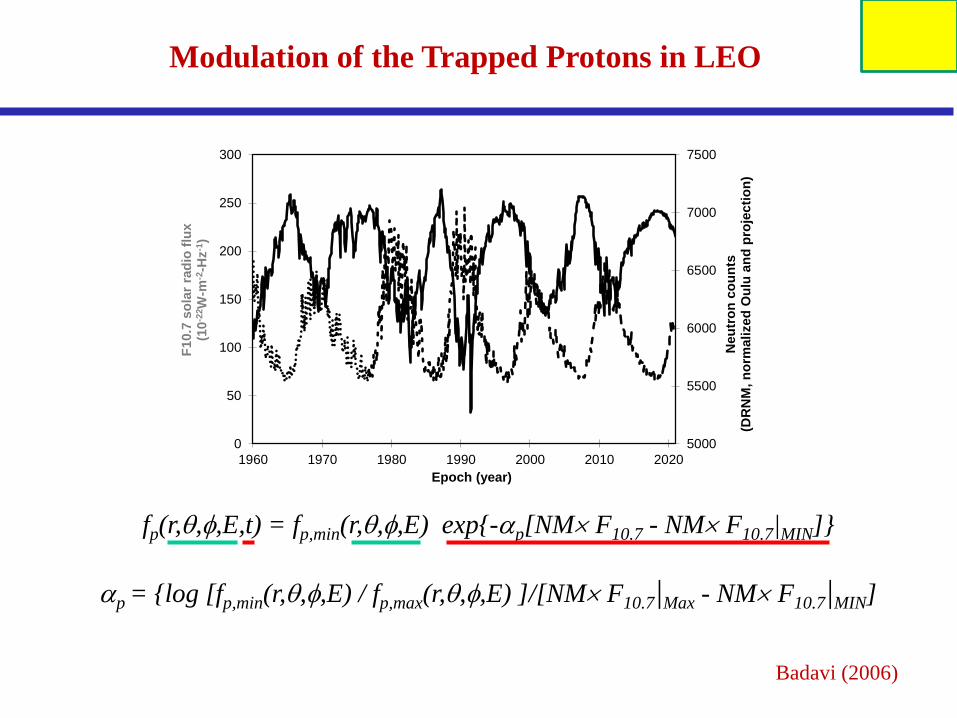
fp(r,θ,φ,E,t) = fp,min(r,θ,φ,E) exp{-αp[NM× F10.7 - NM× F10.7|MIN]}
αp = {log [fp,min(r,θ,φ,E) / fp,max(r,θ,φ,E) ]/[NM× F10.7|Max - NM× F10.7|MIN]
Modulation of the Trapped Protons in LEO
5000
5500
6000
6500
7000
7500
0
50
100
150
200
250
300
1960 1970 1980 1990 2000 2010 2020
Neu
tron
cou
nts
(D
RN
M, n
orm
aliz
ed O
ulu
and
proj
ectio
n)
F10.
7 so
lar r
adio
flux
(1
0-22
W-m
-2-H
z-1 )
Epoch (year)
Badavi (2006)
3-5 September-2013
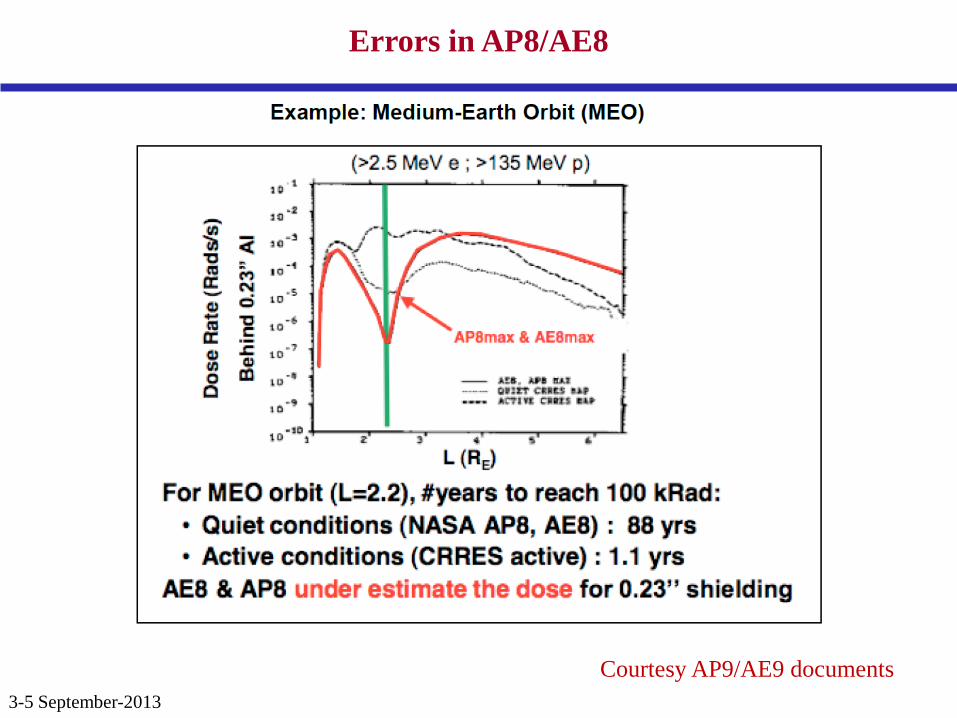
Errors in AP8/AE8
Courtesy AP9/AE9 documents
3-5 September-2013
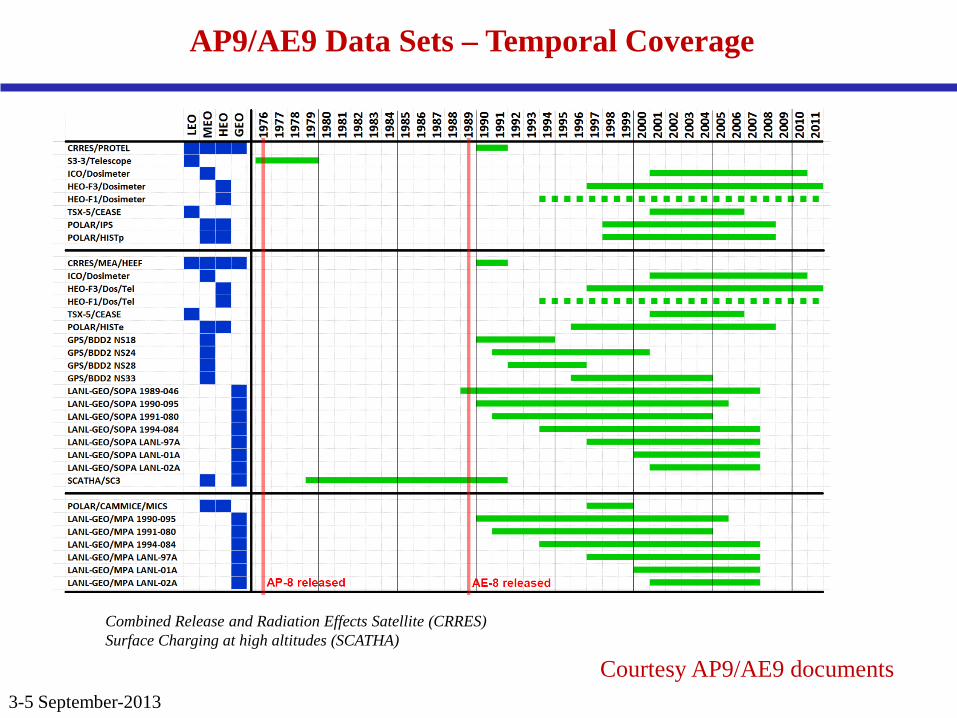
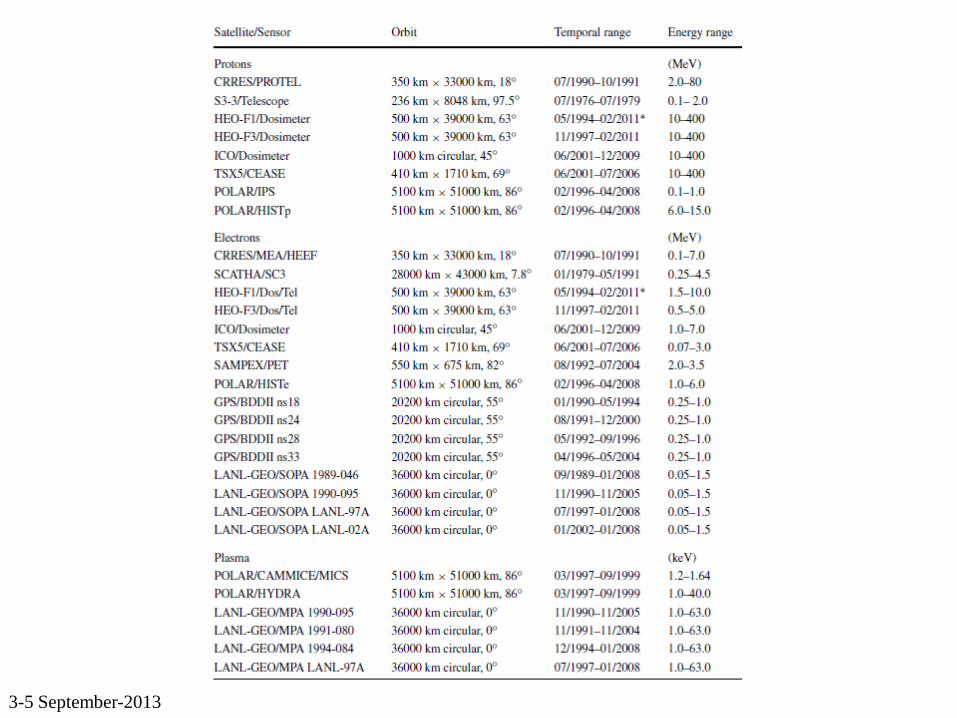
AP9/AE9 Data Sets – Temporal Coverage
Courtesy AP9/AE9 documents
Combined Release and Radiation Effects Satellite (CRRES) Surface Charging at high altitudes (SCATHA)
3-5 September-2013
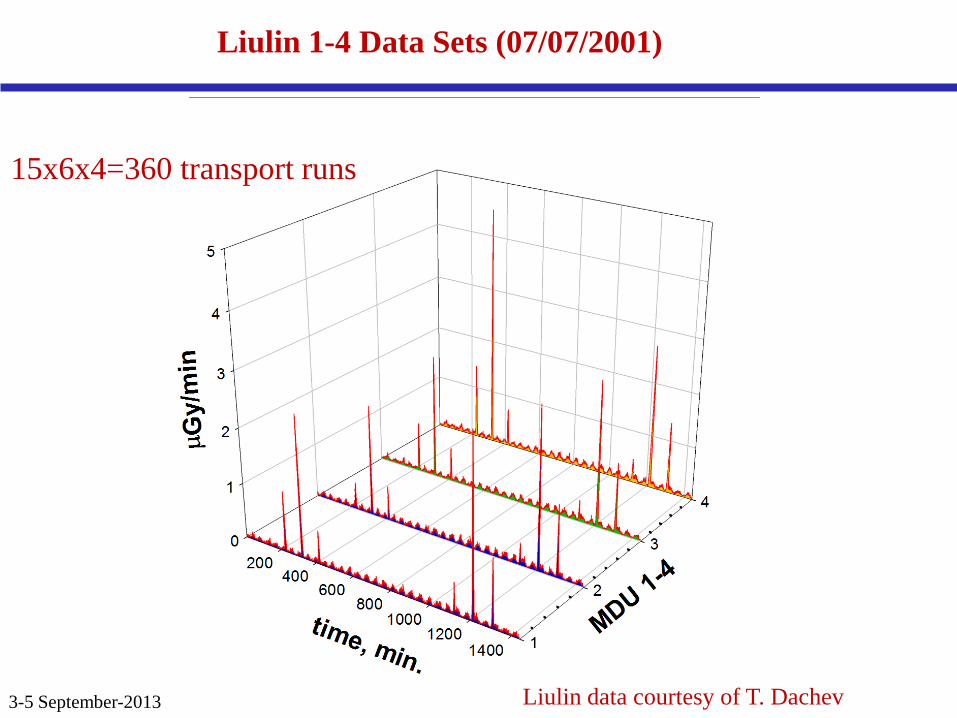
Liulin 1-4 Data Sets (07/07/2001)
Liulin data courtesy of T. Dachev
15x6x4=360 transport runs

AP8/AP9 Comparison (Ascending Nodes, 07/07/2001)
Pass1 Pass2 Pass3
AP8max AP8max AP8max
AP9 AP9 AP9
1 2 3

Pass4 Pass5 Pass6
AP9 AP9 AP9
AP8max AP8max AP8max
AP8/AP9 Comparison (Descending Nodes, 07/07/2001)
4 5 6
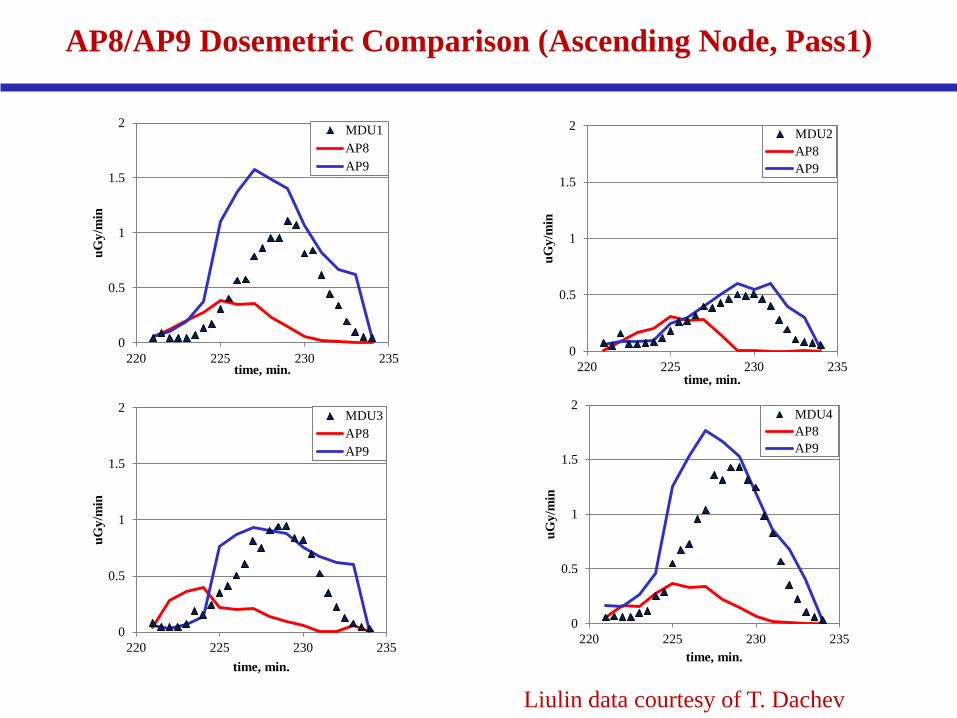
AP8/AP9 Dosemetric Comparison (Ascending Node, Pass1)
Liulin data courtesy of T. Dachev
0
0.5
1
1.5
2
220 225 230 235
uGy/
min
time, min.
MDU1AP8AP9
0
0.5
1
1.5
2
220 225 230 235
uGy/
min
time, min.
MDU2AP8AP9
0
0.5
1
1.5
2
220 225 230 235
uGy/
min
time, min.
MDU3AP8AP9
0
0.5
1
1.5
2
220 225 230 235
uGy/
min
time, min.
MDU4AP8AP9
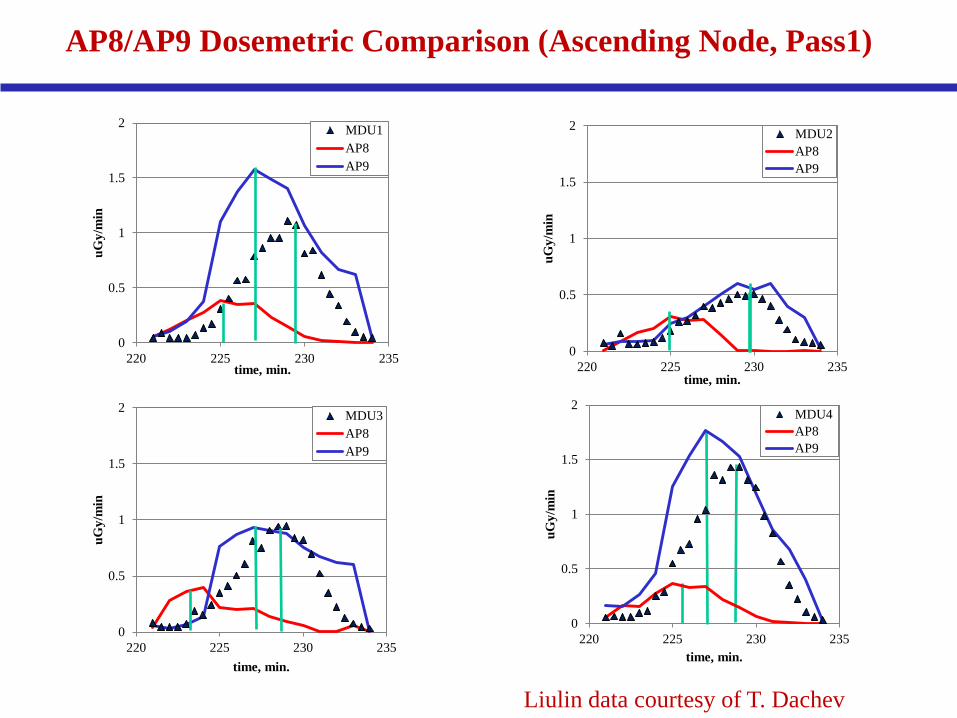
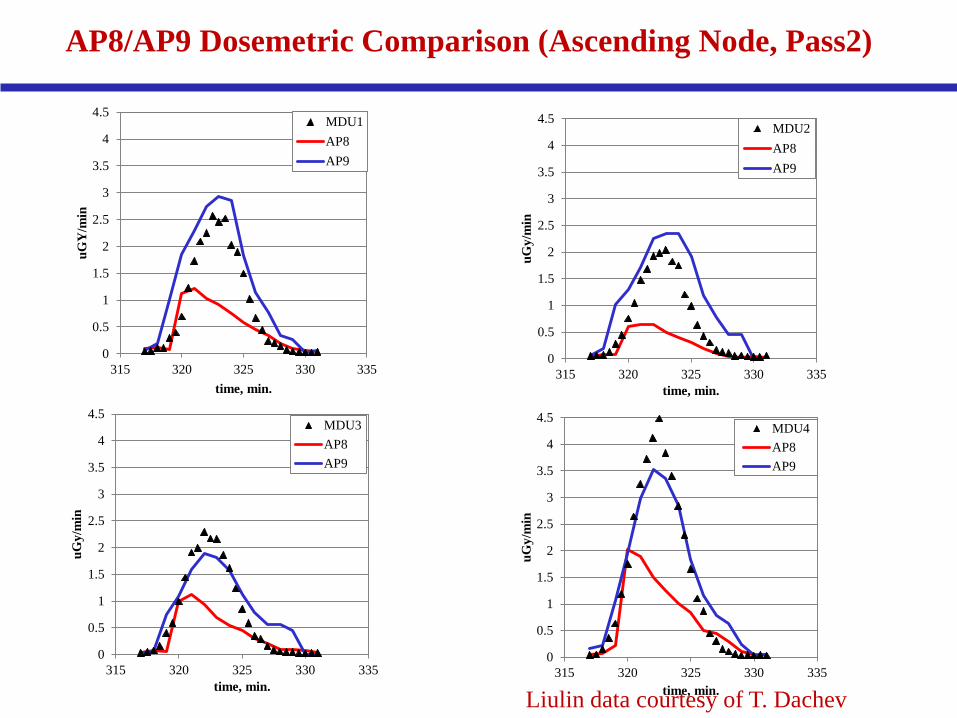
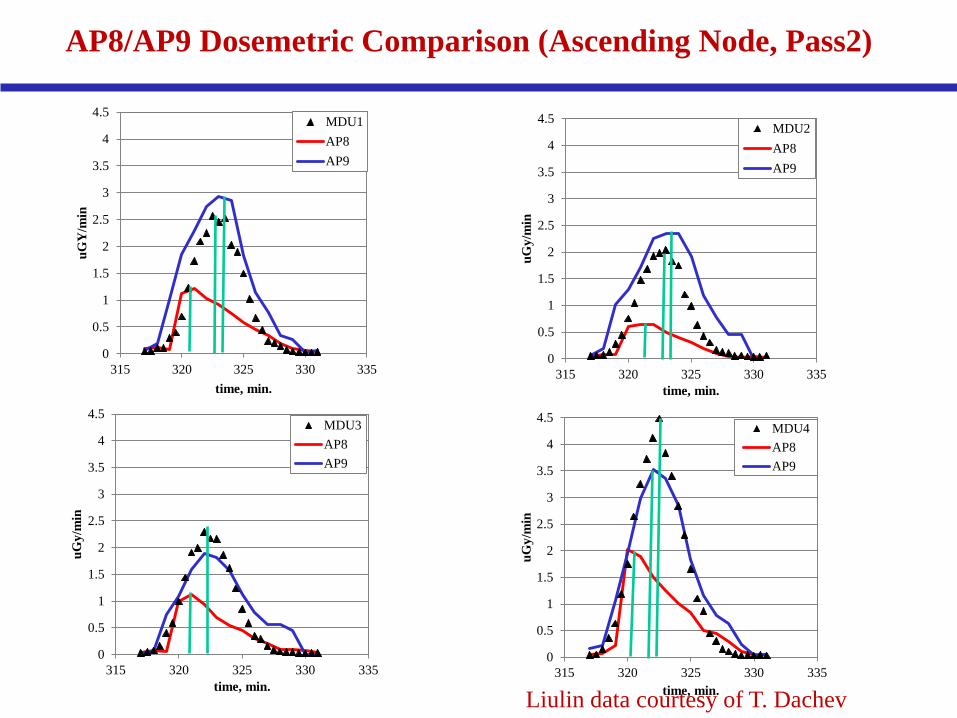
AP8/AP9 Dosemetric Comparison (Ascending Node, Pass2)
Liulin data courtesy of T. Dachev
0
0.5
1
1.5
2
2.5
3
3.5
4
4.5
315 320 325 330 335
uGY
/min
time, min.
MDU1AP8AP9
0
0.5
1
1.5
2
2.5
3
3.5
4
4.5
315 320 325 330 335
uGy/
min
time, min.
MDU2AP8AP9
0
0.5
1
1.5
2
2.5
3
3.5
4
4.5
315 320 325 330 335
uGy/
min
time, min.
MDU3AP8AP9
0
0.5
1
1.5
2
2.5
3
3.5
4
4.5
315 320 325 330 335
uGy/
min
time, min.
MDU4AP8AP9

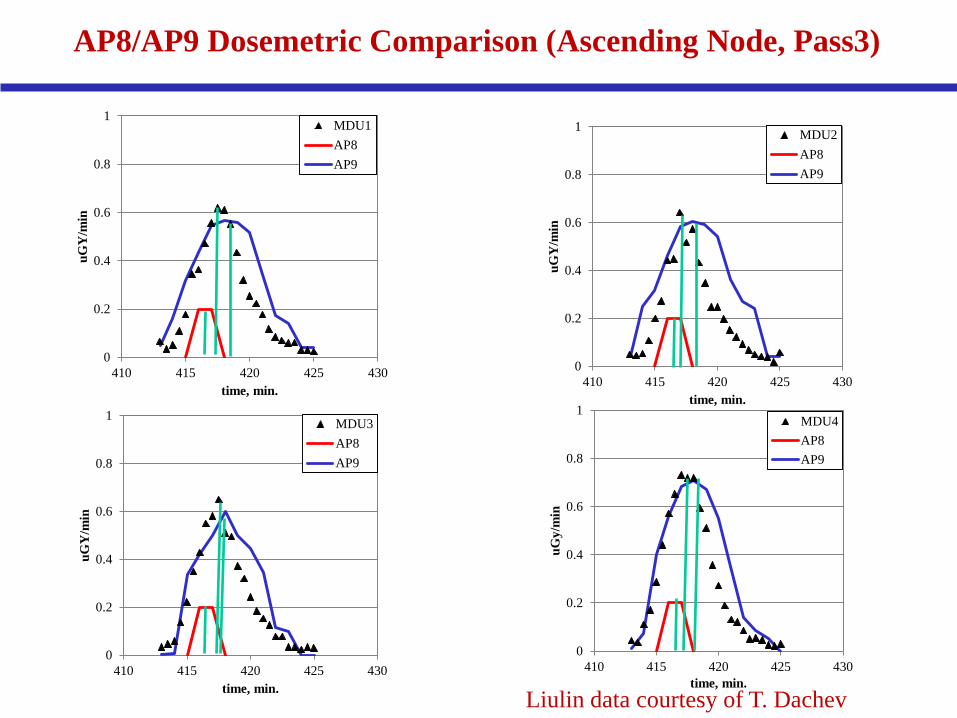
AP8/AP9 Dosemetric Comparison (Ascending Node, Pass3)
Liulin data courtesy of T. Dachev
0
0.2
0.4
0.6
0.8
1
410 415 420 425 430
uGY
/min
time, min.
MDU1AP8AP9
0
0.2
0.4
0.6
0.8
1
410 415 420 425 430
uGY
/min
time, min.
MDU2AP8AP9
0
0.2
0.4
0.6
0.8
1
410 415 420 425 430
uGY
/min
time, min.
MDU3AP8AP9
0
0.2
0.4
0.6
0.8
1
410 415 420 425 430
uGy/
min
time, min.
MDU4AP8AP9
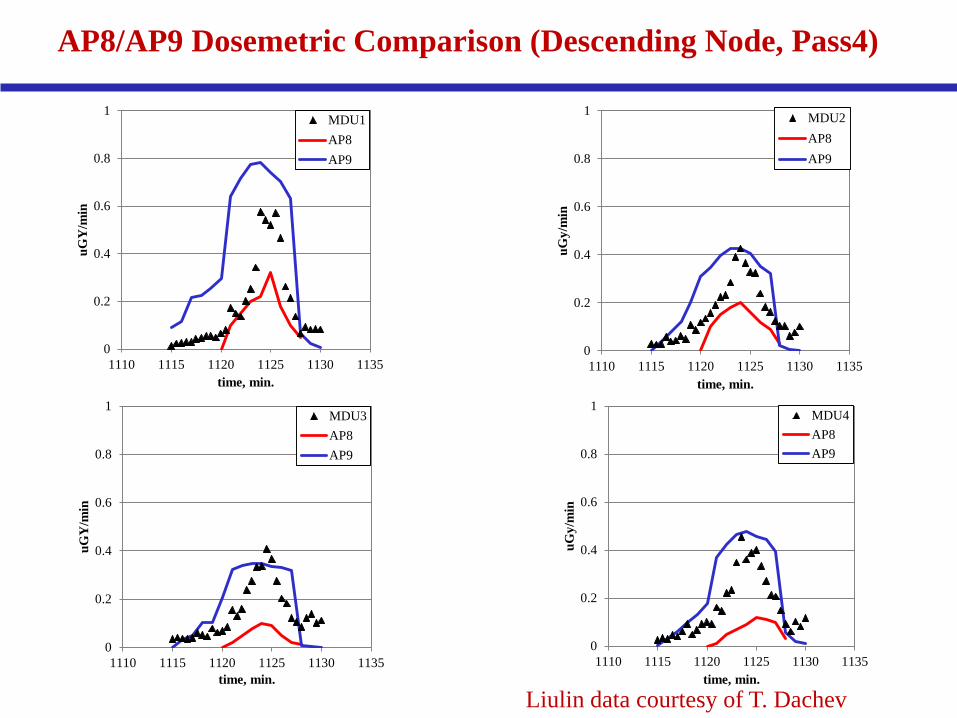
AP8/AP9 Dosemetric Comparison (Descending Node, Pass4)
Liulin data courtesy of T. Dachev
0
0.2
0.4
0.6
0.8
1
1110 1115 1120 1125 1130 1135
uGY
/min
time, min.
MDU1AP8AP9
0
0.2
0.4
0.6
0.8
1
1110 1115 1120 1125 1130 1135
uGy/
min
time, min.
MDU2AP8AP9
0
0.2
0.4
0.6
0.8
1
1110 1115 1120 1125 1130 1135
uGY
/min
time, min.
MDU3AP8AP9
0
0.2
0.4
0.6
0.8
1
1110 1115 1120 1125 1130 1135
uGy/
min
time, min.
MDU4AP8AP9
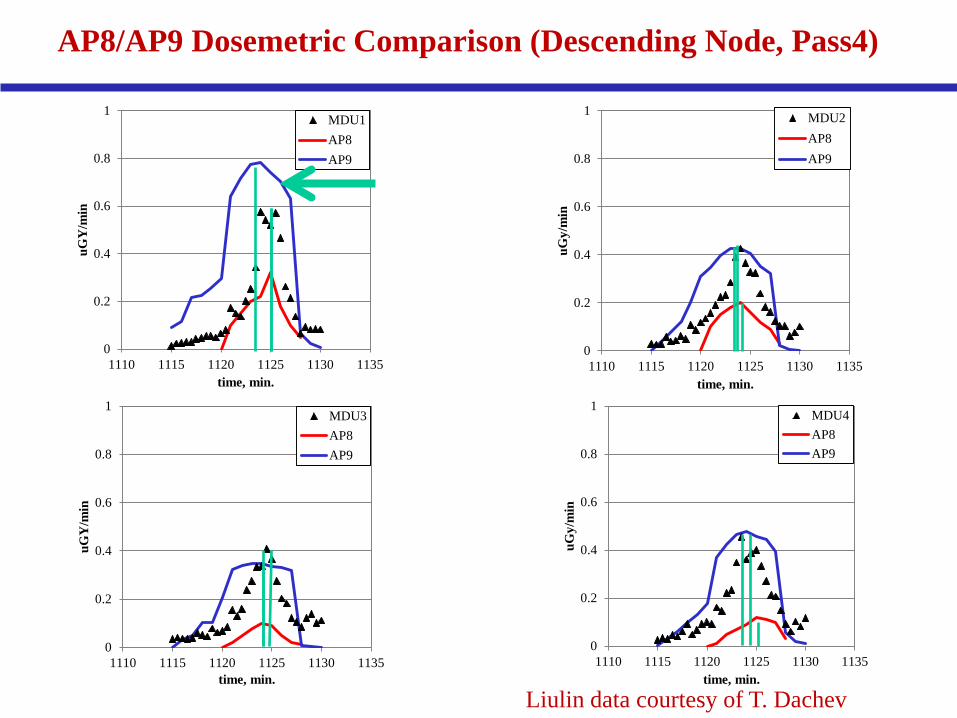
AP8/AP9 Dosemetric Comparison (Descending Node, Pass4)
Liulin data courtesy of T. Dachev
0
0.2
0.4
0.6
0.8
1
1110 1115 1120 1125 1130 1135
uGY
/min
time, min.
MDU1AP8AP9
0
0.2
0.4
0.6
0.8
1
1110 1115 1120 1125 1130 1135
uGy/
min
time, min.
MDU2AP8AP9
0
0.2
0.4
0.6
0.8
1
1110 1115 1120 1125 1130 1135
uGY
/min
time, min.
MDU3AP8AP9
0
0.2
0.4
0.6
0.8
1
1110 1115 1120 1125 1130 1135
uGy/
min
time, min.
MDU4AP8AP9
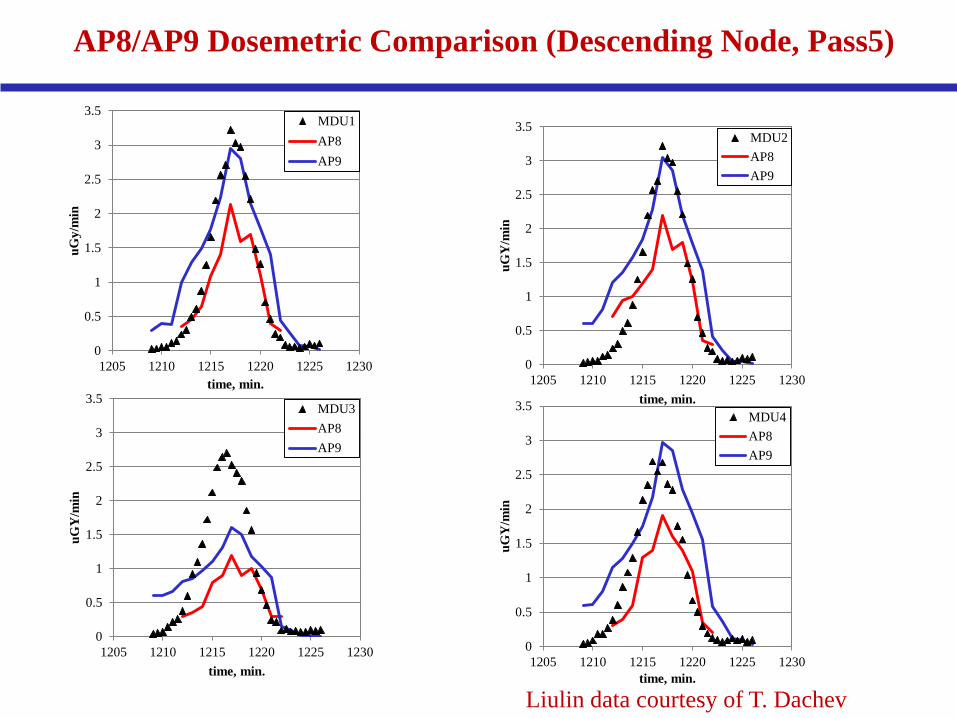
AP8/AP9 Dosemetric Comparison (Descending Node, Pass5)
Liulin data courtesy of T. Dachev
0
0.5
1
1.5
2
2.5
3
3.5
1205 1210 1215 1220 1225 1230
uGy/
min
time, min.
MDU1AP8AP9
0
0.5
1
1.5
2
2.5
3
3.5
1205 1210 1215 1220 1225 1230
uGY
/min
time, min.
MDU2AP8AP9
0
0.5
1
1.5
2
2.5
3
3.5
1205 1210 1215 1220 1225 1230
uGY
/min
time, min.
MDU3AP8AP9
0
0.5
1
1.5
2
2.5
3
3.5
1205 1210 1215 1220 1225 1230
uGY
/min
time, min.
MDU4AP8AP9
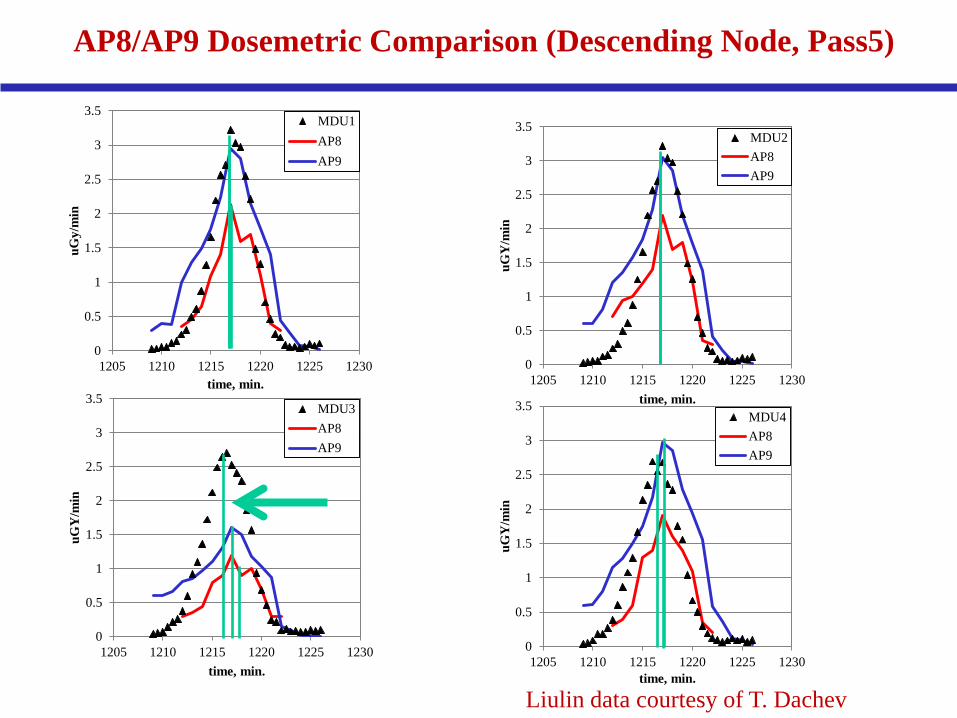
AP8/AP9 Dosemetric Comparison (Descending Node, Pass5)
Liulin data courtesy of T. Dachev
0
0.5
1
1.5
2
2.5
3
3.5
1205 1210 1215 1220 1225 1230
uGy/
min
time, min.
MDU1AP8AP9
0
0.5
1
1.5
2
2.5
3
3.5
1205 1210 1215 1220 1225 1230
uGY
/min
time, min.
MDU2AP8AP9
0
0.5
1
1.5
2
2.5
3
3.5
1205 1210 1215 1220 1225 1230
uGY
/min
time, min.
MDU3AP8AP9
0
0.5
1
1.5
2
2.5
3
3.5
1205 1210 1215 1220 1225 1230
uGY
/min
time, min.
MDU4AP8AP9
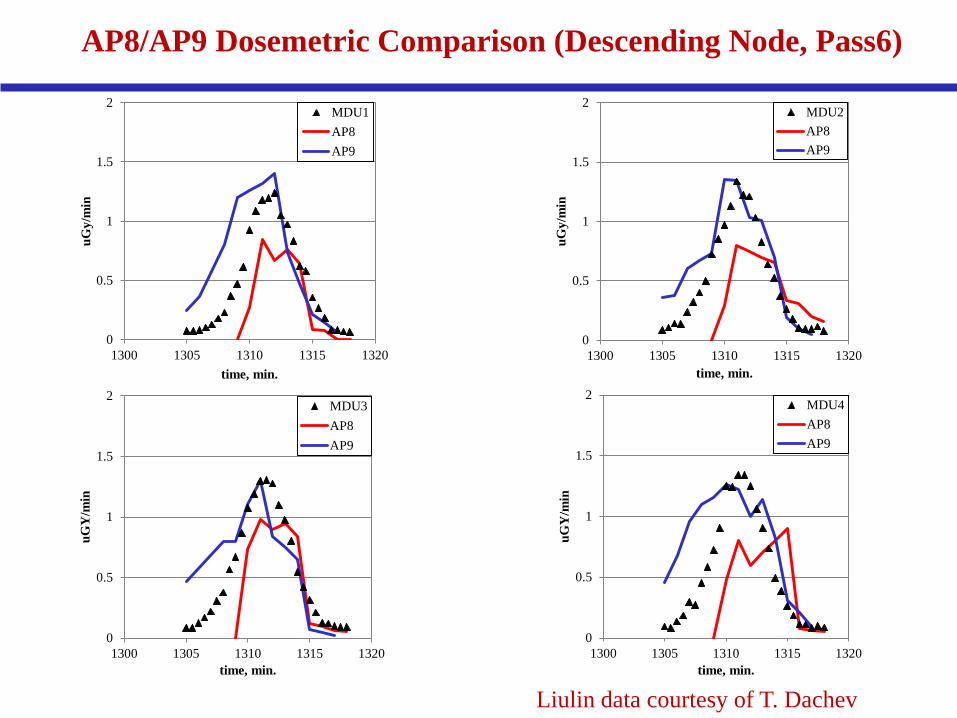
AP8/AP9 Dosemetric Comparison (Descending Node, Pass6)
Liulin data courtesy of T. Dachev
0
0.5
1
1.5
2
1300 1305 1310 1315 1320
uGy/
min
time, min.
MDU1AP8AP9
0
0.5
1
1.5
2
1300 1305 1310 1315 1320
uGy/
min
time, min.
MDU2AP8AP9
0
0.5
1
1.5
2
1300 1305 1310 1315 1320
uGY
/min
time, min.
MDU3AP8AP9
0
0.5
1
1.5
2
1300 1305 1310 1315 1320
uGY
/min
time, min.
MDU4AP8AP9
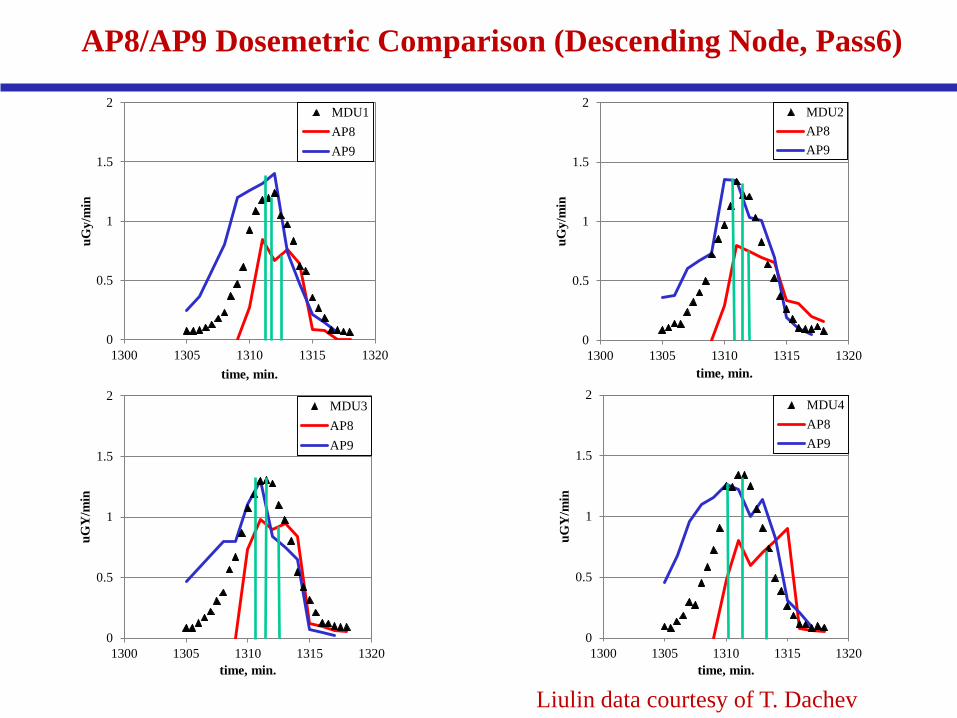
AP8/AP9 Dosemetric Comparison (Descending Node, Pass6)
Liulin data courtesy of T. Dachev
0
0.5
1
1.5
2
1300 1305 1310 1315 1320
uGy/
min
time, min.
MDU1AP8AP9
0
0.5
1
1.5
2
1300 1305 1310 1315 1320
uGy/
min
time, min.
MDU2AP8AP9
0
0.5
1
1.5
2
1300 1305 1310 1315 1320
uGY
/min
time, min.
MDU3AP8AP9
0
0.5
1
1.5
2
1300 1305 1310 1315 1320
uGY
/min
time, min.
MDU4AP8AP9

3-5 September-2013
Summary and Future Work
• I – Deficiencies and limitations of AP8 was discussed and AP9 capabilities was introduced. • II – The differences in proton boundary conditions for 6 SAA was discussed.
• III – Validations results among AP8, AP9 and Liulin data was discussed. In 22/24 validation cases, AP9 correlated fairly well with measurement. In 2/24 cases, AP9 validation was marginal.
• IV – So far, the validation process is strictly manual. Work is underway to automate the validation process.
• V – Next step is to perform validation for the ISS ULF7 configuration. This will depend on the availability of CAD/mass model of ISS for this epoch. (ULF7 3R in 2014) • VI – Limited 3D measurements are currently available. It is very desirable to validate 3D data (TRITEL, etc…) with simulation.
3-5 September-2013
Backups
3-5 September-2013
3-5 September-2013
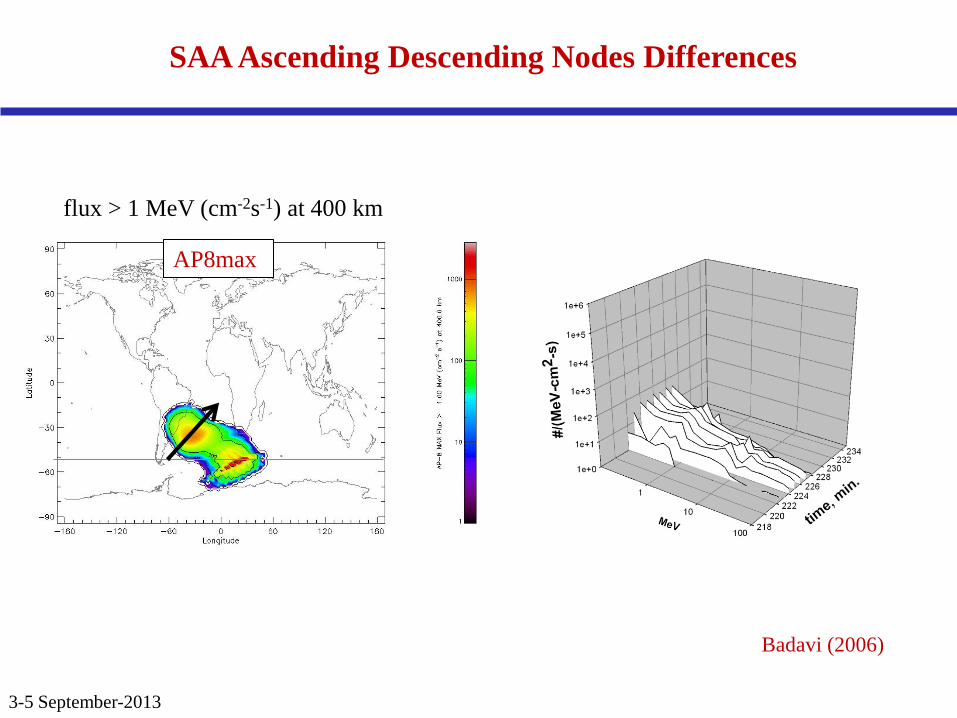
SAA Ascending Descending Nodes Differences
AP8max
Badavi (2006)
flux > 1 MeV (cm-2s-1) at 400 km
3-5 September-2013
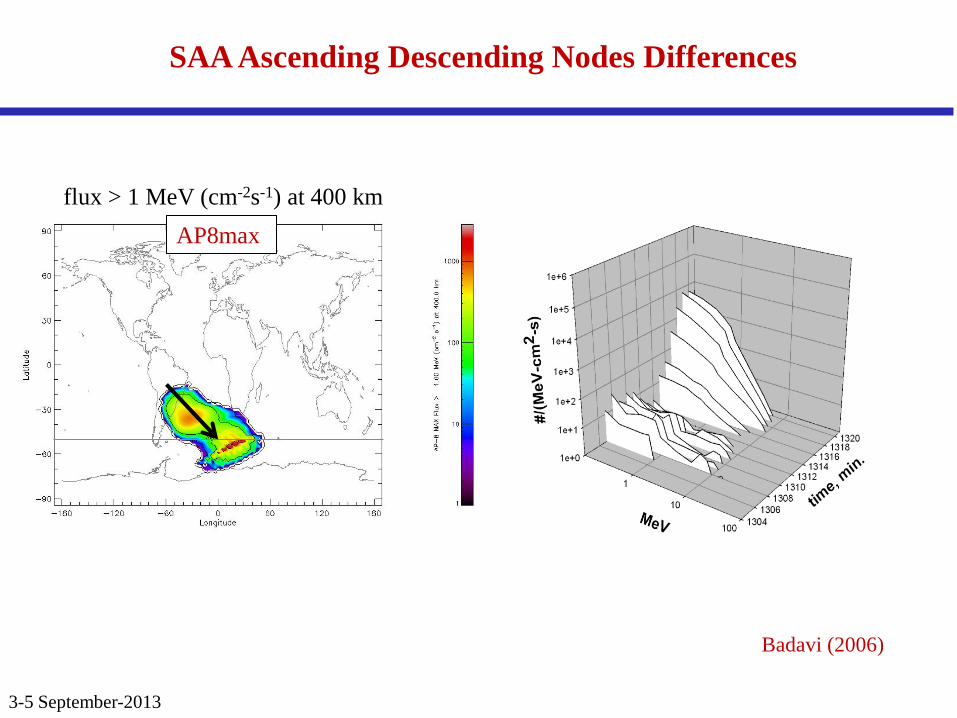
SAA Ascending Descending Nodes Differences
AP8max
Badavi (2006)
flux > 1 MeV (cm-2s-1) at 400 km
3-5 September-2013
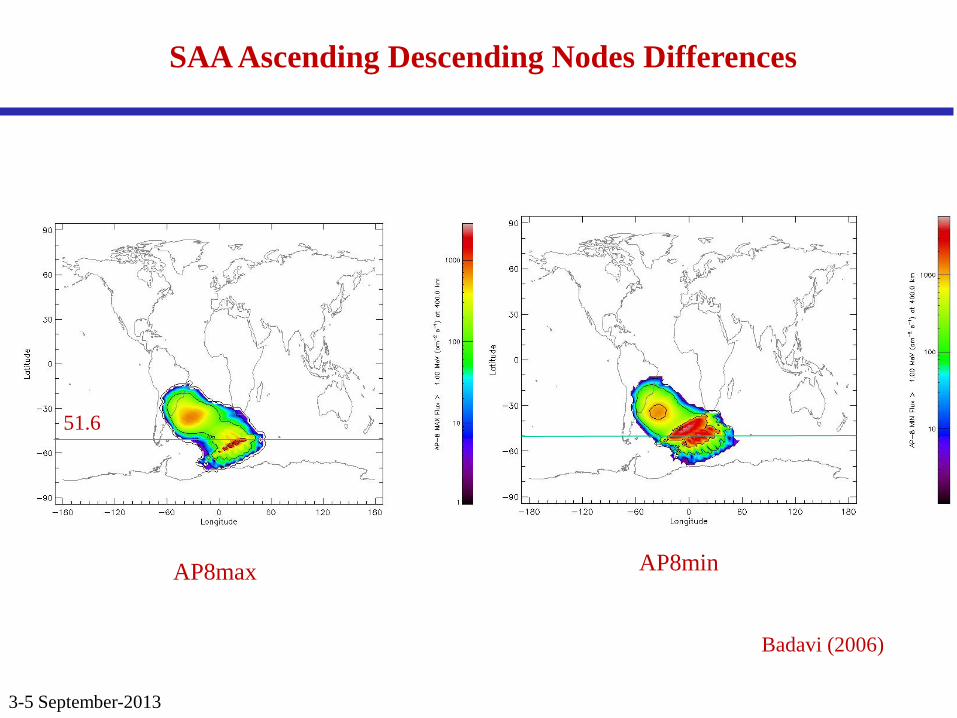
SAA Ascending Descending Nodes Differences
AP8max AP8min
Badavi (2006)
51.6
3-5 September-2013
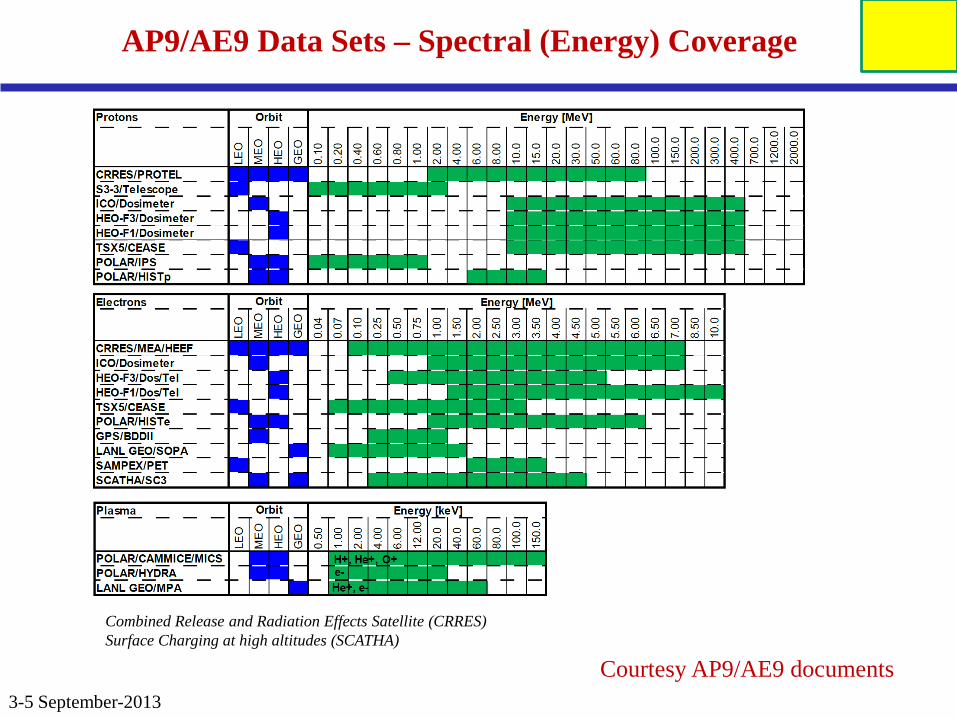
AP9/AE9 Data Sets – Spectral (Energy) Coverage
Courtesy AP9/AE9 documents
Combined Release and Radiation Effects Satellite (CRRES) Surface Charging at high altitudes (SCATHA)

3-5 September-2013
Errors in AP8/AE8
Courtesy AP9/AE9 documents
3-5 September-2013
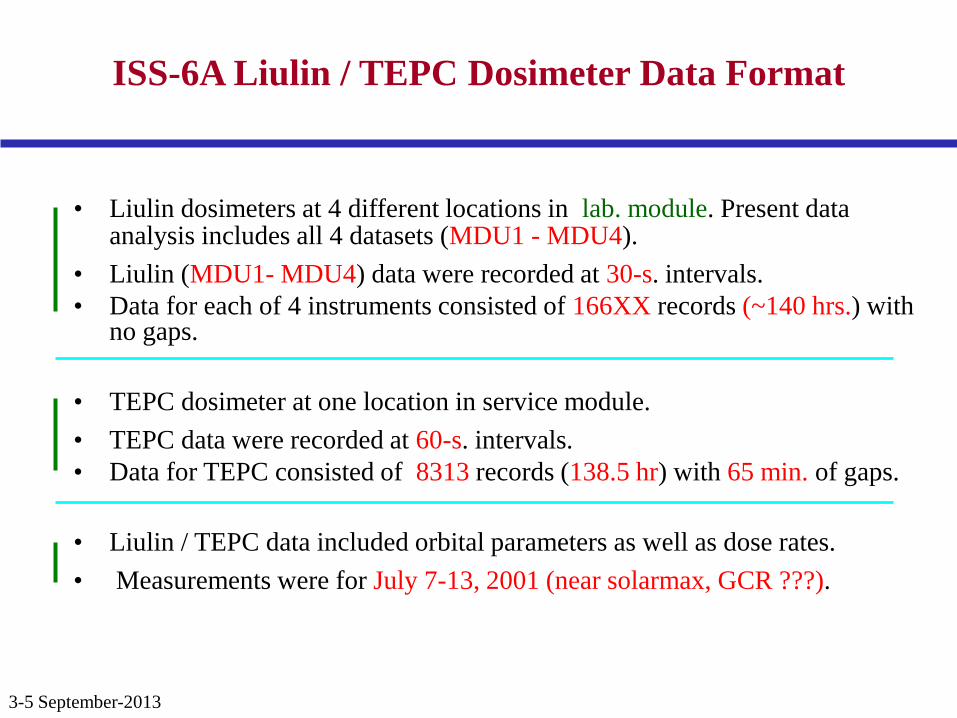
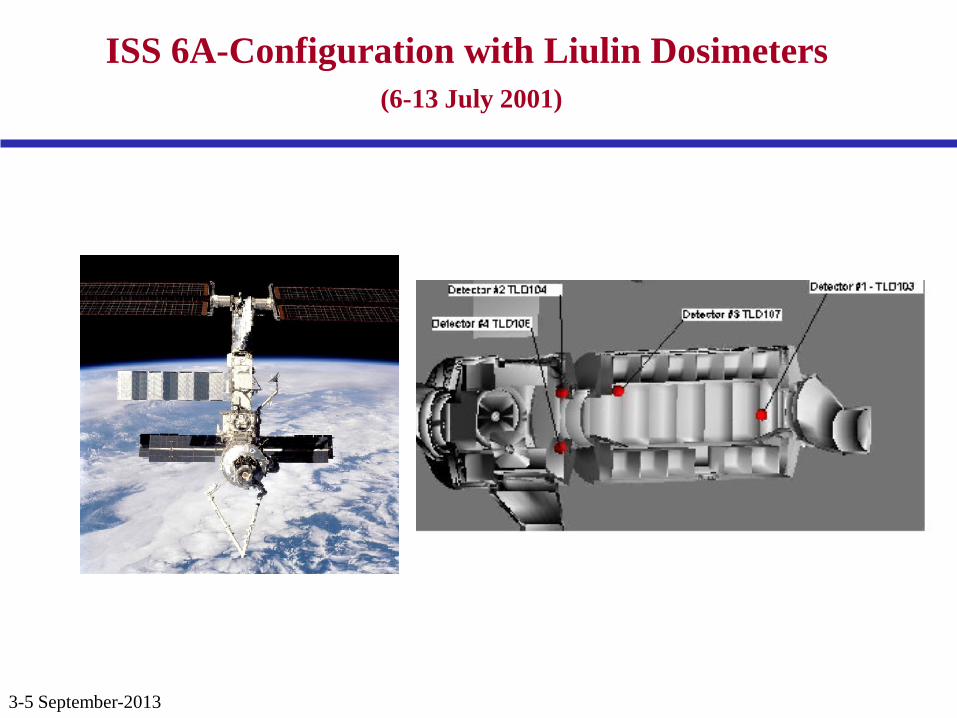
ISS-6A Liulin / TEPC Dosimeter Data Format
• Liulin dosimeters at 4 different locations in lab. module. Present data analysis includes all 4 datasets (MDU1 - MDU4).
• Liulin (MDU1- MDU4) data were recorded at 30-s. intervals. • Data for each of 4 instruments consisted of 166XX records (~140 hrs.) with
no gaps.
• TEPC dosimeter at one location in service module. • TEPC data were recorded at 60-s. intervals. • Data for TEPC consisted of 8313 records (138.5 hr) with 65 min. of gaps. • Liulin / TEPC data included orbital parameters as well as dose rates. • Measurements were for July 7-13, 2001 (near solarmax, GCR ???).
3-5 September-2013
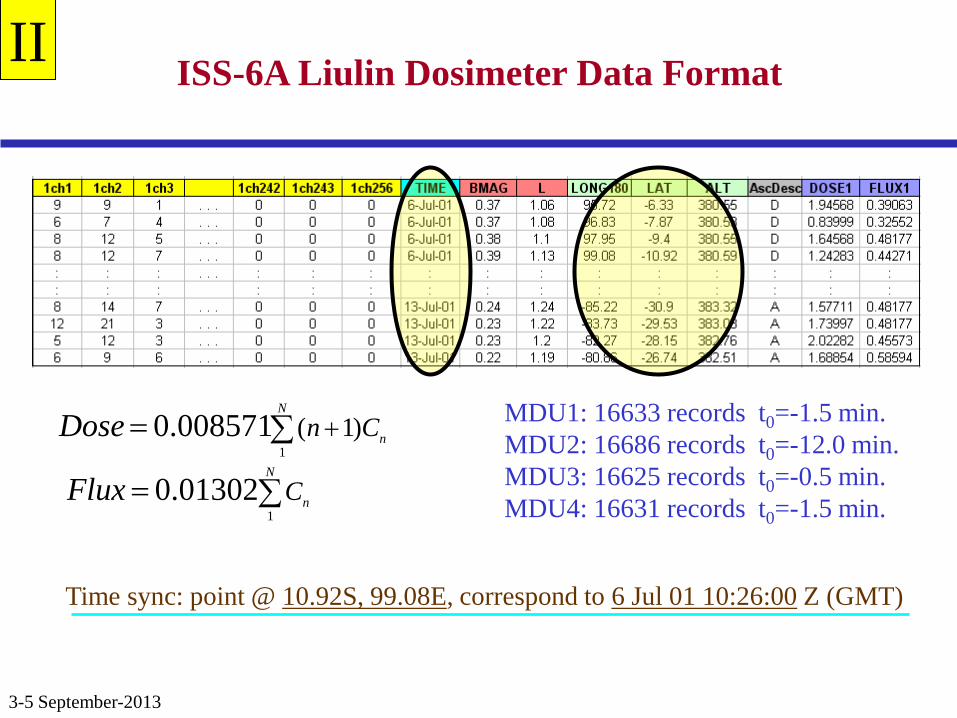
ISS-6A Liulin Dosimeter Data Format
10.01302
N
nCFlux = ∑1
( 1)0.008571N
nn CDose += ∑ MDU1: 16633 records t0=-1.5 min. MDU2: 16686 records t0=-12.0 min. MDU3: 16625 records t0=-0.5 min. MDU4: 16631 records t0=-1.5 min.
Time sync: point @ 10.92S, 99.08E, correspond to 6 Jul 01 10:26:00 Z (GMT)
II
3-5 September-2013
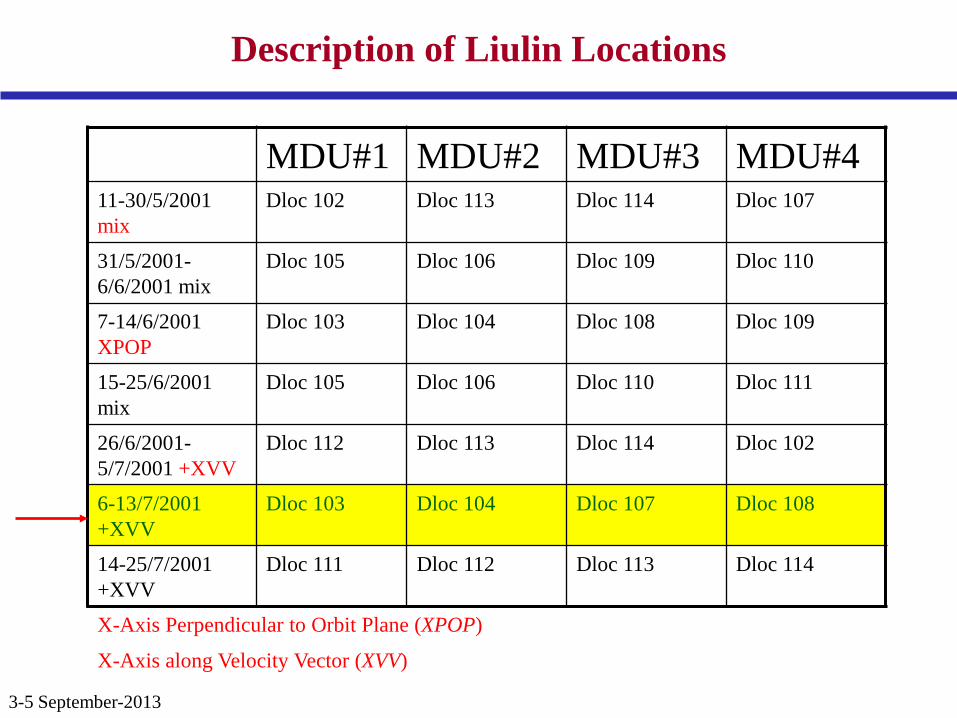
Description of Liulin Locations
MDU#1 MDU#2 MDU#3 MDU#4 11-30/5/2001 mix
Dloc 102 Dloc 113 Dloc 114 Dloc 107
31/5/2001-6/6/2001 mix
Dloc 105 Dloc 106 Dloc 109 Dloc 110
7-14/6/2001 XPOP
Dloc 103 Dloc 104 Dloc 108 Dloc 109
15-25/6/2001 mix
Dloc 105 Dloc 106 Dloc 110 Dloc 111
26/6/2001-5/7/2001 +XVV
Dloc 112 Dloc 113 Dloc 114 Dloc 102
6-13/7/2001 +XVV
Dloc 103 Dloc 104 Dloc 107 Dloc 108
14-25/7/2001 +XVV
Dloc 111 Dloc 112 Dloc 113 Dloc 114
X-Axis Perpendicular to Orbit Plane (XPOP)
X-Axis along Velocity Vector (XVV)
3-5 September-2013
ISS 6A-Configuration with Liulin Dosimeters (6-13 July 2001)
3-5 September-2013
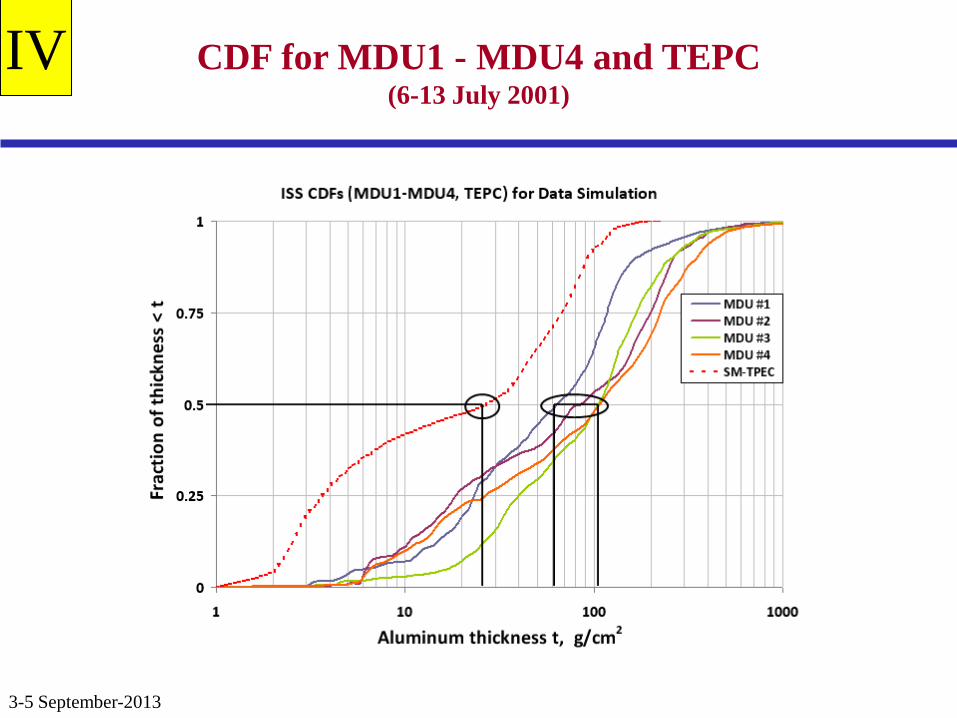
CDF for MDU1 - MDU4 and TEPC (6-13 July 2001)
IV

3-5 September-2013
Solar Indices
1
10
100
1000
10000
1991 1994 1997 2000 2003 2006 2009 2012year
SSNF10.7phiOuluNM
3-5 September-2013
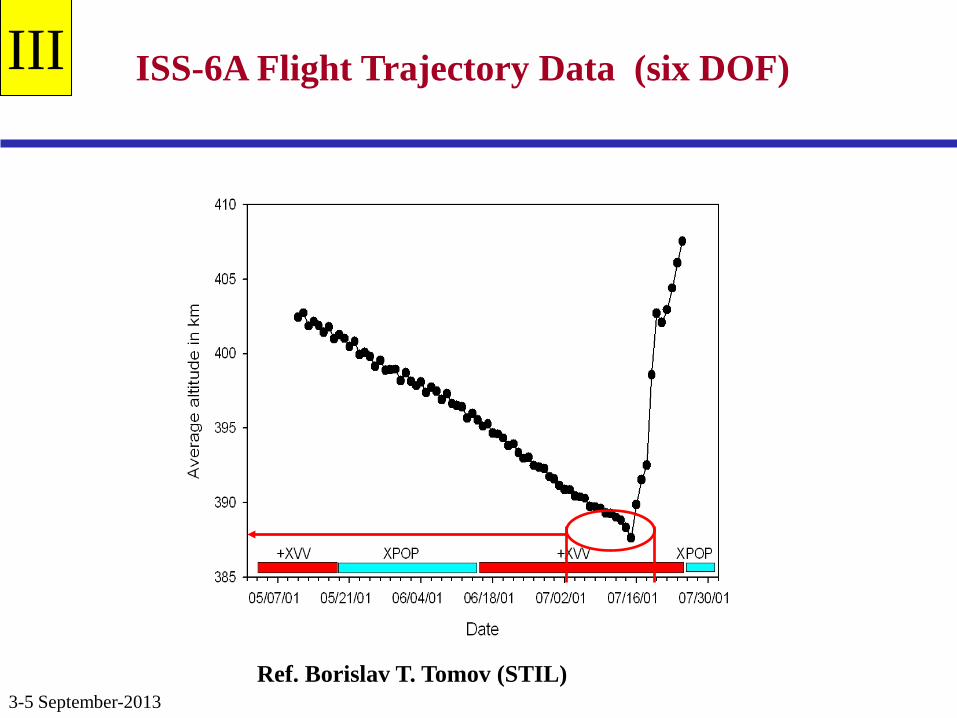
ISS-6A Flight Trajectory Data (six DOF)
Ref. Borislav T. Tomov (STIL)
III

3-5 September-2013
ISS 6A Liulin MDU1-MDU4 Location/Orientation (6-13 July 2001)
Liulin detector CAD model (MDU1 – MDU4)
II
3-5 September-2013
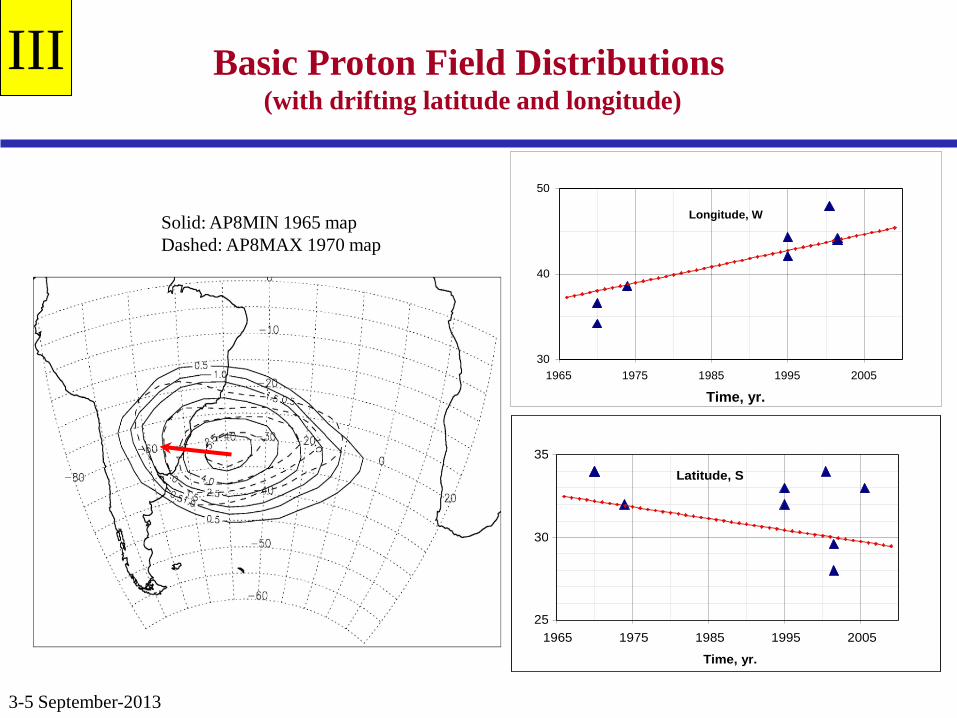
Basic Proton Field Distributions (with drifting latitude and longitude)
30
40
50
1965 1975 1985 1995 2005
Time, yr.
Longitude, W
25
30
35
1965 1975 1985 1995 2005
Time, yr.
Latitude, S
Solid: AP8MIN 1965 map Dashed: AP8MAX 1970 map
III
3-5 September-2013
0
1
2
3
4
5
0 240 480 720 960 1200 1440
uGy/
min
time, min.
MDU1MDU2MDU3MDU4
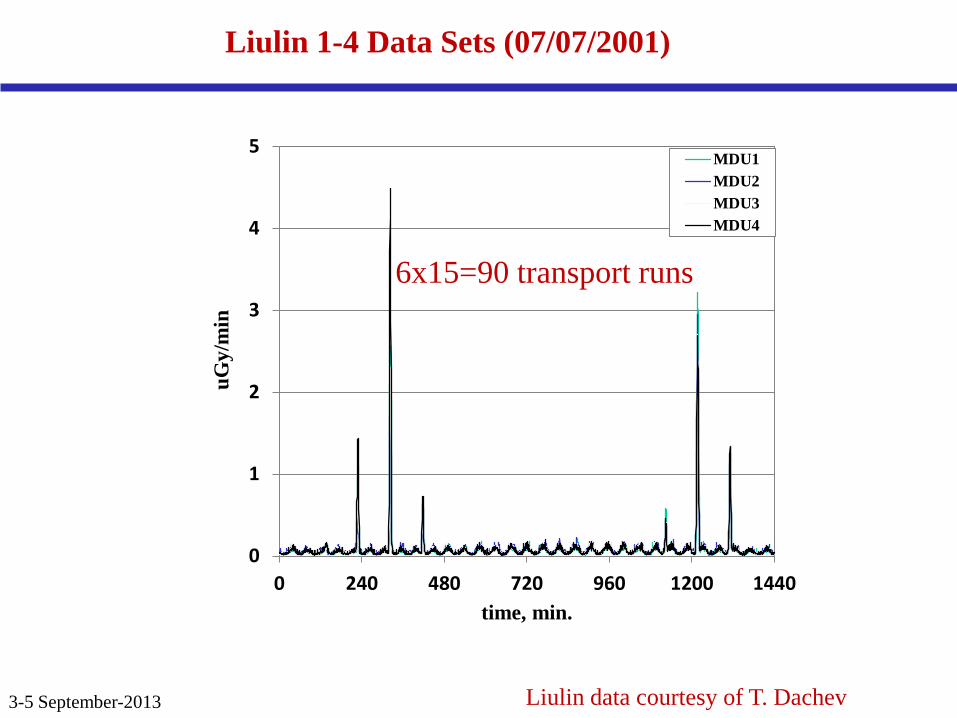
Liulin 1-4 Data Sets (07/07/2001)
Liulin data courtesy of T. Dachev
6x15=90 transport runs


![ALTEA: 2012 radiation measurements in the ISS - …wrmiss.org/workshops/eighteenth/Narici.pdf · ALTEA: 2012 radiation measurements in the ISS L ... (cm^2 sr s )] Shielding (Poles](https://static.fdocuments.in/doc/165x107/5b09cad17f8b9a3d018e3bed/altea-2012-radiation-measurements-in-the-iss-2012-radiation-measurements-in-the.jpg)