France experienced the demographic transition before ...
58
econstor Make Your Publications Visible. A Service of zbw Leibniz-Informationszentrum Wirtschaft Leibniz Information Centre for Economics Daudin, Guillaume; Franck, Raphaël; Rapoport, Hillel Working Paper The Cultural Diffusion of the Fertility Transition: Evidence from Internal Migration in 19th Century France CESifo Working Paper, No. 5866 Provided in Cooperation with: Ifo Institute – Leibniz Institute for Economic Research at the University of Munich Suggested Citation: Daudin, Guillaume; Franck, Raphaël; Rapoport, Hillel (2016) : The Cultural Diffusion of the Fertility Transition: Evidence from Internal Migration in 19th Century France, CESifo Working Paper, No. 5866, Center for Economic Studies and ifo Institute (CESifo), Munich This Version is available at: http://hdl.handle.net/10419/141843 Standard-Nutzungsbedingungen: Die Dokumente auf EconStor dürfen zu eigenen wissenschaftlichen Zwecken und zum Privatgebrauch gespeichert und kopiert werden. Sie dürfen die Dokumente nicht für öffentliche oder kommerzielle Zwecke vervielfältigen, öffentlich ausstellen, öffentlich zugänglich machen, vertreiben oder anderweitig nutzen. Sofern die Verfasser die Dokumente unter Open-Content-Lizenzen (insbesondere CC-Lizenzen) zur Verfügung gestellt haben sollten, gelten abweichend von diesen Nutzungsbedingungen die in der dort genannten Lizenz gewährten Nutzungsrechte. Terms of use: Documents in EconStor may be saved and copied for your personal and scholarly purposes. You are not to copy documents for public or commercial purposes, to exhibit the documents publicly, to make them publicly available on the internet, or to distribute or otherwise use the documents in public. If the documents have been made available under an Open Content Licence (especially Creative Commons Licences), you may exercise further usage rights as specified in the indicated licence. www.econstor.eu
Transcript of France experienced the demographic transition before ...
econstorMake Your Publications Visible.
A Service of
zbwLeibniz-InformationszentrumWirtschaftLeibniz Information Centrefor Economics
Daudin, Guillaume; Franck, Raphaël; Rapoport, Hillel
Working Paper
The Cultural Diffusion of the Fertility Transition:Evidence from Internal Migration in 19th CenturyFrance
CESifo Working Paper, No. 5866
Provided in Cooperation with:Ifo Institute – Leibniz Institute for Economic Research at the University of Munich
Suggested Citation: Daudin, Guillaume; Franck, Raphaël; Rapoport, Hillel (2016) : The CulturalDiffusion of the Fertility Transition: Evidence from Internal Migration in 19th Century France,CESifo Working Paper, No. 5866, Center for Economic Studies and ifo Institute (CESifo),Munich
This Version is available at:http://hdl.handle.net/10419/141843
Standard-Nutzungsbedingungen:
Die Dokumente auf EconStor dürfen zu eigenen wissenschaftlichenZwecken und zum Privatgebrauch gespeichert und kopiert werden.
Sie dürfen die Dokumente nicht für öffentliche oder kommerzielleZwecke vervielfältigen, öffentlich ausstellen, öffentlich zugänglichmachen, vertreiben oder anderweitig nutzen.
Sofern die Verfasser die Dokumente unter Open-Content-Lizenzen(insbesondere CC-Lizenzen) zur Verfügung gestellt haben sollten,gelten abweichend von diesen Nutzungsbedingungen die in der dortgenannten Lizenz gewährten Nutzungsrechte.
Terms of use:
Documents in EconStor may be saved and copied for yourpersonal and scholarly purposes.
You are not to copy documents for public or commercialpurposes, to exhibit the documents publicly, to make thempublicly available on the internet, or to distribute or otherwiseuse the documents in public.
If the documents have been made available under an OpenContent Licence (especially Creative Commons Licences), youmay exercise further usage rights as specified in the indicatedlicence.
www.econstor.eu

The Cultural Diffusion of the Fertility Transition: Evidence from Internal Migration
in 19th Century France
Guillaume Daudin Raphaël Franck Hillel Rapoport
CESIFO WORKING PAPER NO. 5866 CATEGORY 6: FISCAL POLICY, MACROECONOMICS AND GROWTH
APRIL 2016
An electronic version of the paper may be downloaded • from the SSRN website: www.SSRN.com • from the RePEc website: www.RePEc.org
• from the CESifo website: Twww.CESifo-group.org/wp T
ISSN 2364-1428
CESifo Working Paper No. 5866
The Cultural Diffusion of the Fertility Transition: Evidence from Internal Migration
in 19th Century France
Abstract France experienced the demographic transition before richer and more educated countries. This paper offers a novel explanation for this puzzle that emphasizes the diffusion of culture and information through internal migration. It tests how migration affected fertility by building a decennial bilateral migration matrix between French regions for 1861-1911. The identification strategy uses exogenous variation in transportation costs resulting from the construction of railways. The results suggest the convergence towards low birth rates can be explained by the diffusion of low-fertility norms by migrants, especially by migrants to and from Paris.
JEL-Codes: J130, N330, O150.
Keywords: fertility, France, demographic transition, migration.
Guillaume Daudin PSL, LEDa-DIAL UMR IRD 225
University Paris-Dauphine France / Paris
Raphaël Franck Bar Ilan University
Department of Economics Israel – 52900 Ramat Gan [email protected]
Hillel Rapoport
Paris School of Economics University Paris 1 Panthéon-Sorbonne
France – 75013 Paris [email protected]
We thank Ran Abramitzky, Toman Barsbai, Michel Beine, Simone Bertoli, Pedro Dal Bo, Frédéric Docquier, Oded Galor, Dror Goldberg, Philippe Fargues, Mark Klemp, Gustavo De Santis, Massimo Livi-Bacci, Melanie Meng Xue, Stelios Michalopoulos, Isabelle Sin, Andreas Steinmayr, Chinmay Tumbe and David Weil for helpful comments and suggestions. We also thank conference participants at ASREC, EHA, NEUDC and EHS meetings, as well as seminar participants at Brown University, University of Cardiff, University of Kent, Paris-Dauphine, Paris-Créteil, Paris School of Economics, EUI, Sciences Lyon and University of Southern Denmark for their comments. We thank Marie-Noëlle Polino for her help in finding prices for passenger travel in the 19th century, Jérôme Bourdieu for providing us with the TRA dataset as well as Marion Romo and Hadaoui Fatima Zahra for their research assistance. The usual disclaimer applies.
2
1. Introduction
France is usually viewed as an anomaly in studies dealing with the role of fertility
decline in the transition from “Malthusian” to modern economic growth (see, e.g.,
Lee, 2003, Galor and Weil, 2000, Galor, 2005a, Galor, 2005b, Galor, 2012). This is
because French birth rates already declined in the late 18th century, and the
differences in the fertility rates across French regions disappeared in the course of the
19th century to reach a uniformly low level throughout the country before WWI
(Cummins, 2013, Guinnane, 2011, Weir, 1994). Yet, France was a relative economic
laggard vis-à-vis countries like England or the Netherlands in the 18th century and
grew at a slower rate than England or Germany during the 19th century (Maddison
2001).
The factors which drove the rapid convergence towards low fertility rates across
French regions during the 19th century are still debated.1 There were, of course,
changes in economic conditions, e.g., the rise in the demand for human capital which
occurred during the second Industrial Revolution, the decline in child mortality or
increased life expectancy. However studies on the demographic transition in France
(e.g., Weir, 1994, Murphy, 2015) all suggest that such changes were probably not
substantial and rapid enough to explain, on their own, the demographic transition.2
It is however possible that increased social interactions, which spread information
and cultural norms, contributed to the convergence in fertility rates (Gonzalez-
Baillon, 2008, Murphy, 2015, Spolaore and Wacziarg, 2014).3 In this respect, two 1 An unsubstantiated explanation is that lower birth rates might have stemmed from the quick diffusion
of contraceptive techniques which was criticized by the moralists of the day. On this issue, see Bergues
et al. (1960) and Murphy (2015). Relatedly, Boyer and Williamson (1989) suggest that the fertility
transition in England between 1851 and 1911 could be partly attributed to the diffusion of
contraceptive techniques. 2 On infant and child mortality, see e.g., Dupâquier and Poussou (1988), Eckstein et al. (1999) and
Doepke (2005) for a different view. On the demand for human capital, see e.g., Galor and Weil (2000),
Galor and Moav (2002), Becker et al. (2010, 2012) and Klemp and Weisdorf (2012). On increased life
expectancy, see Galor (2012) as well as Hazan (2009) for a different view. See also de la Croix and
Perrin (2016) for a rational choice model of education and fertility in 19th c. France. 3 Cultural norms are defined as preferences and beliefs that impact current economic behavior although
they were developed at a different time and place (Fernandez 2007). Relatedly, Fernandez and Fogli
(2006) and Blau et al. (2011) show that the social norms of the source countries keep affecting the
behaviour of second-generation immigrants, notably in matters of fertility. See also David and
3
observations are noteworthy. First, it was in the course of the 19th century that France
progressively developed a national culture, as reflected by the spread of French at the
expense of regional languages (Weber, 1976).4 Second, the French did not migrate to
the New World during the 19th century but instead moved within France.5 These two
observations suggest that migration may have contributed to cultural harmonization
within France, a conjecture which we directly address in this study by focusing on the
decline in fertility.
Indeed, this paper investigates whether the progressive regional convergence of
fertility rates in France during the second half of the 19th century was fostered by the
rise in internal migration which conveyed economic and cultural information.6 For
this purpose, it focuses on the specific patterns of internal migration between 1861
and 1911 between the French departments, i.e., the administrative divisions of the
French territory which were established in 1790.7
Our study relies on the French Census and on the Enquête des 3000 familles
(Survey of the 3000 Families), which provides information based on parish registers
Sanderson (1987), Fargues (2007), Bertoli and Marchetta (2015), Munshi and Myaux (2006), and
specifically La Ferrara et al. (2012) on the role of norms in the fertility transition currently taking place
in developing countries. See also Beine et al. (2013) who examine a cross-section of developing and
developed countries during the 20th century and suggest that fertility choices in migrant-sending
countries are influenced by diaspora networks that transfer of fertility norms prevailing in the host
countries. 4 Before the 19th century, a substantial share of the population did not speak French in regions like
Brittany (in the West) or Provence (in the South) and this language barrier reflected further cultural and
behavioural differences, including in matters of fertility (see also Braudel, 1986, vol. 1, pp. 88-94). 5 See Hatton (2010), as well as Abramitzky et al. (2013, 2014) and Bandiera et al. (2013) on
international migration. 6 There is a growing literature documenting the role of migrants in the transmission of preferences,
ideas and values. See, for example, Clinginsmith et al. (2009) on religious attitudes and Spilimbergo
(2009), Docquier et al. (2016), Mercier and Chauvet (2014) and Barsbai et al. (2016) on political
preferences. Instead, research on the impact of migration movements in 19th century France focused on
the role of migrant networks on marriages (e.g. Bonneuil et al., 2008) or wealth transmission (e.g.,
Bourdieu et al., 2000) but did not analyze the possibility that internal migration may have contributed
to the convergence in the fertility rates by conveying cultural norms. 7 Departments were designed so that it would take at most one day by horse travel to reach the
administrative center of the department from any location in the department. They were thus organized
independently of fertility patterns and migratory movements in the 18th century.

4
on the places of birth and death of all the individuals whose last name starts by the
three letters "T", "R" and "A". These two datasets enable us to build a bilateral matrix
of inter-regional migrations for the period 1861-1911 (Bourdelais, 2004, Bourdieu et
al., 2004, Dupâquier, 2004) which we combine with the data on departmental fertility
computed by Bonneuil (1997). We then assess the migrants’ contribution to the
demographic transition across France by constructing, for each department, the
fertility norms of immigrants and emigrants as weighted averages of the fertility rates
in the migrants' origin and destination department, in line with the approach of
Spilimbergo (2007, 2009).
Our identification strategy relies on exogenous variations in the bilateral travel
costs between the French departments that entailed a time-varying decrease in travel
costs and had a positive effect on migration.8 The choice of this instrumental variable
is motivated by the historical development of the railroad network which the central
government designed to connect Paris, the capital, to the main economic centers of
France (Caron, 1997). There is indeed substantial anecdotal evidence, which is
confirmed by our falsification tests, that the railroad network was developed
independently from fertility patterns and migration choices.
Our results show that fertility declined more in areas that (i) had more emigration
and (ii) whose migrants migrated towards low-fertility regions, especially Paris. These
results are robust to accounting for the potential confounding effects of factors such as
declining child mortality, increased life expectancy, rising education levels,
industrialization and religiosity. Our interpretation is that emigrants who moved from
high- to low-fertility areas transmitted cultural and economic information about
fertility norms and the cost of raising children in the regions where they had settled to
the inhabitants of the regions where they came from. This information might have
been then taken into account by actual and would-be emigrants, thus explaining why
we find that departments with a larger share of emigrants experienced a larger drop in
fertility. This interpretation is supported by our counterfactual analysis which shows
8 The development of the railroad networks might have fostered long-term and permanent migration,
but also short-term migration. However it is not clear whether patterns of fertility decline can be
attributed to short-term migration which had existed in France since the end of the Middle Ages and
was motivated by the need for a temporary workforce during harvests. In fact, Châtelain (1976)
documents that short-term migration began to decline in the second half of the 19th century, when long-
term and permanent migration became more common.
5
that emigration to Paris, which accounted for 26.33% of the total number of French
internal emigrants between 1861 and 1911, explains half of the national decline in
fertility, in line with the economic, political and cultural importance of Paris within
France. Finally, we note that child mortality is the only socio-economic variable
which has a significant, albeit quantitatively limited, effect on the fertility decline
while our robustness checks establish that other potential factors of information
diffusion and cultural change, such as newspapers, the age at marriage or the number
of children born out of wedlock, do not weaken the impact of migration on the decline
in fertility.
The remainder of this article is as follows. Section 2 presents the data. Section 3
discusses the estimation strategy. Section 4 presents our main results and our
robustness checks. Section 5 analyzes the channels for the informational transmission
of the fertility decline. Section 6 concludes.
2. Data
Table A1 in the Supplementary Appendix provides descriptive statistics for our
variables which are measured at the departmental level and cover the 1861-1911
period. Because of changes in the borders in the wake of the 1870-1871 French-
Prussian war, France had 90 departments in 1861 and 87 after 1871. However, we
restrict, for simplicity, our analysis to the departments which were part of France
throughout the whole period.
2.1 Fertility rates
We measure fertility rates in each French department for every decade between
1861 and 1911. Specifically we use data from Bonneuil (1997) who provides values
of the Coale (1969) Fertility Index in each department from 1806 to 1906 and which
we extend to 1911 using data from the 1911 French census. The Coale Fertility Index
controls for the demographic structure of the female population. It is based on the
fertility levels of the Hutterites, a strict religious group in Northern America with a
very high level of fertility. A childless population would have a Coale Fertility Index
equal to zero and a population with the fertility rate of the Hutterites would have a
Coale Fertility Index equal to one.
The Coale Fertility Index f is defined as:
� = �∑ ���.
�� ��� �∑ ��. ��
��� ⁄ (1)
6
where ��� is the number of women in age group k in year t, ��
� is the rate of
childbearing among women in the kth age interval in year t and Hk represents the
fertility rates observed for the Hutterites. In other words, the Coale Fertility Index f is
the ratio of the number of observed births to the number of births if all women had
Hutterite fertility.9
Bonneuil (1997) shows that, at the start of the 19th century, there were substantial
differences in the fertility rates of the various departments that, presumably, reflected
cultural and linguistic diversity within France (Weber, 1976, Braudel, 1986). In 1806,
some departments already had low fertility rates: the Coale Fertility Index of
Calvados (in the North-West of France) was equal to 0.246 while that of Lot-et-
Garonne (in the South-West) was equal to 0.313. Conversely, the Coale Fertility
Index of Seine (which comprised Paris and its immediate suburbs) was equal to 0.436
in 1806 but had already declined to 0.281 in 1851. In fact, the fertility of the average
department declined from 0.408 in 1806 to 0.310 in 1851 while the standard deviation
went from 0.107 in 1806 (26% of the mean) to 0.074 in 1851 (24% of the mean). This
means that the decline in fertility during that period was relatively uniform in absolute
terms across French departments, without any substantial convergence.10
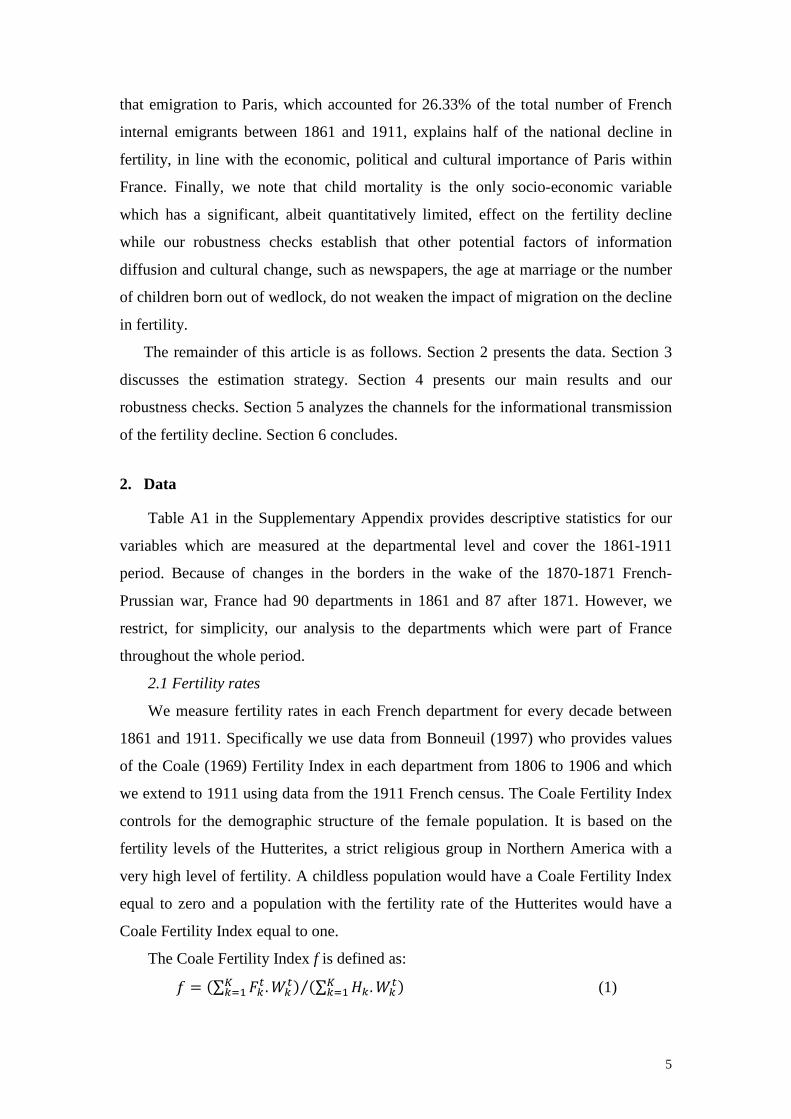
It was only in the second half of the 19th century that regional differences in
fertility disappeared: the average Coale fertility index of the French departments
decreased from 0.310 in 1851 to 0.244 in 1911 while its standard deviation dropped
from 0.074 (24% of the mean) to 0.038 (16% of the mean). There was thus a
convergence in the fertility levels of the French departments between 1861 and 1911,
as can be seen in Figure 1.11 This is in contrast to what happened during the same time
period in other European countries such as England & Wales, Germany, or Italy, as
can be seen in Figures S1 to S4 in the Supplementary Appendix. This convergence in
the regional fertility levels in France, unlike in England and Wales, Germany and
9 The Coale Fertility Index in Bonneuil (1997) is a modified version of the usual Coale Fertility Index
because it includes the fertility of all women and is not restricted to the fertility of married women. 10 It is noteworthy, therefore, that Paris and its surroundings experienced a much more pronounced
fertility decline than the other departments (from slightly above average in 1806 to below average in
1851). 11 This convergence is not explained by a general decline of fertility bounded by zero and can still be
observed when the logarithm of the fertility rate is considered.
7
Italy, is confirmed by the standard unconditional convergence regressions (Barro and
Sala-i-Martin, 1992) which we report in Supplementary Appendix.
Figure 1. Fertility across French departments, 1861-1911
Source: (Bonneuil 1997) and authors' computations for 1911.
2.2 Migration in 19th century France
Our data on emigrants from, and immigrants to each French department between
1861 and 1911 stem from the TRA dataset, also known as the Enquête des 3000
familles (Survey of the 3000 Families) between 1861 and 1881. There may be
concerns with the representativeness of the TRA dataset since it only provides
information on the place of birth and death of all individuals whose surnames start by
the three letters "T", "R" and "A" (Blanchet and Kessler, 1992, Bourdelais, 2004,
Dupâquier, 2004). In Supplementary Appendix C, we show that we can reconstruct
the geography of internal migration in France from the TRA data to the whole French
population at the department level for the 1891-1911 period (for which the two
010
2030
400
1020
3040
0 .2 .4 .6 0 .2 .4 .6 0 .2 .4 .6
1861 1871 1881
1891 1901 1911
Den
sity
Fertility
8
datasets overlap) so as to alleviate concerns regarding the representativeness of the
TRA dataset.12
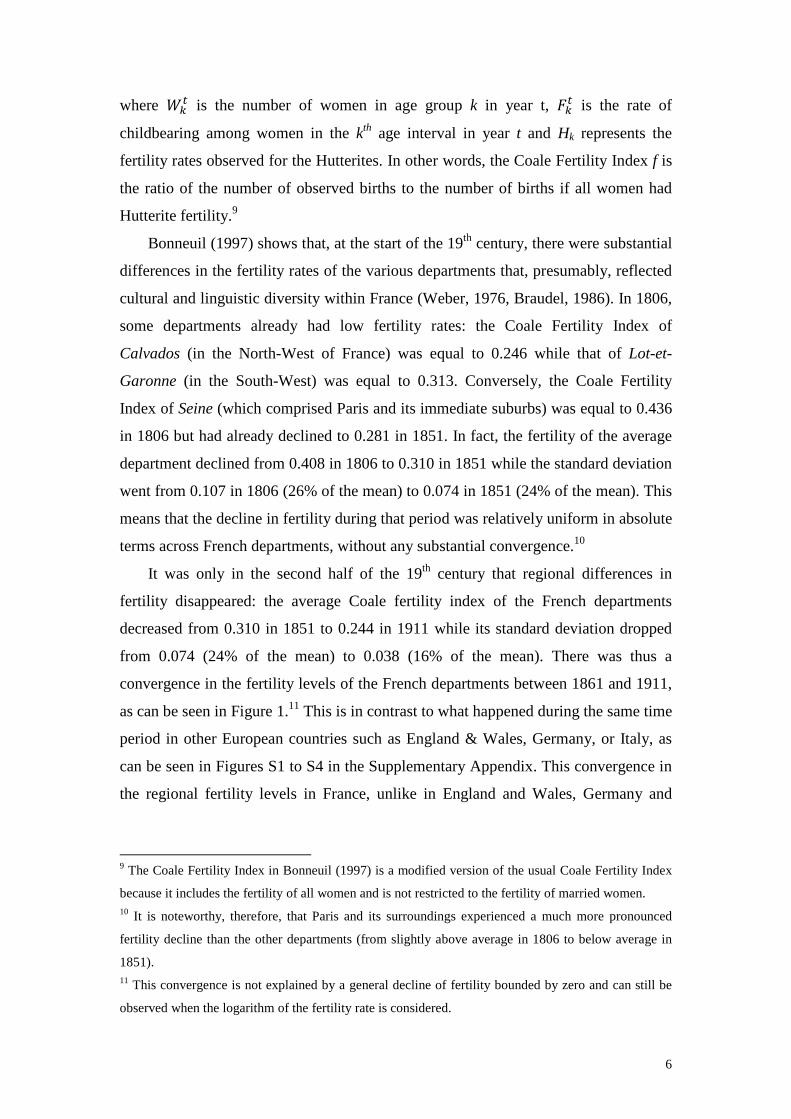
Figure 2: Main bilateral migration corridors - 1891 Census data
Notes:
• For the sake of readability, this map does not report all the 7,832 observations (=89*88, as there are 89 départements) of the migrant stocks but only those which are larger than 10% of the largest stock, i.e., the 128 stocks larger than 9,000 (as the largest stock was formed by the 90,000 inhabitants of the Seine département born in the neighbouring Seine-et-Oise département).
• In the legend, the first two numbers represent the bounds of the bracket for the stock of migrants; N represents the number of links between départements in each bracket.
The data enable us to compute bilateral migration stocks which are defined as the
number of people born in department i and living in department j in year t. They show
that migrants moved from rural to urban areas as can be seen in Figure 2, where we
12Abramitzky et al. (2011) show that the TRA dataset is representative of the whole French population
in their assessment of nuptiality patterns.

9
graph the migration patterns in France in 1891.13 Many migrants moved to the closest
industrial city, e.g., Lille in the North of France or Marseille in the South. However,
Paris attracted migrants from all over the country. Overall, the descriptive statistics
Table A1 indicate that 17.3% of the French population emigrated from their
department of origin over the 1861-1911 period.
It must be noted that our study does not account for international migration for
two reasons. First, as we mentioned above, the French did not migrate to high land to
labor ratio (and therefore high-fertility) destinations such as the USA and other
European offshoots, unlike the inhabitants of other European countries (e.g., Great
Britain, Ireland, Sweden or Norway). The annual mean French gross emigration rate
from 1860 to 1913 was only 0.18 international emigrants per 1000 inhabitants
(including to French colonies and in particular to Algeria), compared to 9.25 for Italy,
4.61 for Great-Britain and 1.5 for Germany (Hatton and Williamson, 1998). Instead,
most French migration during the 19th century took place within France.14 Second,
there was some foreign immigration to France, but it was limited, only amounting to
2.9% of the total population in 1911 (Dupâquier and Poussou, 1988). In any case,
international migration did not prevent the decline and convergence of fertility rates in
France.
Rather, the importance of internal migrations in France and of external migrations
in other European countries may explain the specific effect of migration on fertility in
France for at least two reasons. First, the implied patterns in terms of self-selection on
fertility behavior are different. Second, the potential transmission of fertility norms
from destination-to-origin regions would work in opposite directions, because the
urban and industrial destinations of French internal migrants were predominantly low-
fertility places, in contrast to the countries in the New World where high land-to-
labour ratios favored large families in rural areas. Indeed, as Livi-Bacci 2012, pp 54-
55) writes: "International rural-to-rural migration required stable families with large
numbers of children. Families of that sort were well suited to the destination countries
where land was abundant and so a large family of workers an advantage. Similarly
13 A similar pattern was documented by, e.g., Cairncross (1949) and Baines and Woods (2004), for
Great Britain. 14 Given the low numbers of French emigrants abroad, it does not seem relevant to investigate which
emigrants moved within the country and which emigrants left the country, as might be the case for
emigration studies for countries like Sweden or Great Britain.

10
advantageous were the traditional social and family values of those migrants.
Migration from the countryside to cities and industrial regions, where workers were
employed primarily as wage workers in manufacturing and construction, favored
instead a different profile, namely, individuals whose family ties were looser, nuclear
families able to carefully plan births."
2.3 Economic and social characteristics of the departments
In our empirical analysis, we control for the socio-economic factors which might
have contributed to the convergence in fertility rates in France in the second half of
the 19th century.
2.3.1 Life expectancy and child mortality
We use Bonneuil (1997)'s computations of life expectancy at age 15 for the
individuals living in each department during the 1806-1906 period which we extend
to 1911 by using data from the French census. We also rely on the successive issues
of the French census to compute infant mortality, which we define as the share of
children who died before age one.
2.3.2 Education and religiosity
The regressions account for the confounding effects of education on fertility. For
this purpose, we compute the shares of the male and female population age five to 19
enrolled in primary and secondary schools.15
Moreover, education may be correlated with religiosity. Therefore, to assess the
confounding effects of religious observance on fertility we collect data from the
French census to compute the share of male and female children enrolled in Catholic
(i.e., private) primary and secondary schools, as opposed to those studying in secular
state-funded primary and secondary schools.16
2.3.3 Workforce and urbanization 15 In 1881 and 1882, laws were passed to make primary school attendance until the age of 13
mandatory and to make state-funded schools tuition-free and secular. Therefore, to get a better sense of
educational achievement in France during the period, we also consider secondary school attendance
until age 19. 16 Since data on actual church attendance is unavailable for the 1861-1911 period, we use a measure of
school choice, which is very often motivated by religious observance (e.g., Cohen-Zada, 2006).
However, it is not a priori clear whether the decline in religiosity was connected to the decline in
fertility in France. Departments such as Côtes du Nord and Nord experienced a decline in fertility
during the 19th century but remained staunchly Catholic until WWI and notably elected representatives
who opposed the separation of Church and State in 1905 (Franck, 2010).

11
Our regressions account for the confounding effects of changes in the workforce
in the 19th century, characterized by the decline in the agricultural sector and the
growth of the industry, as well as of urbanization, on fertility. For this purpose, we
compute the shares of the workforce in the industrial and service sectors (the control
group is the workforce in the agricultural sector) as well as the share of the population
living in urban areas (the control group is the population in the rural areas).
3. Empirical methodology
Baseline model 3.1.
To assess the impact of migration on fertility, we estimate the following equation:
log���, � =
��. log������,�� � ��. � !�"#�,�� � �$. � !�"#�,��. log������,�� �
�%. log�&'���,�� � �(. � !��#�,����). � !��#�,��. log�&'���,�� � *. log�,-,. � α- �
α. � 0�,�
(2)
where ��,� is the fertility rate in department i in year t, Xi,t is a vector of socio-
economic variables in department i in year t, αi and αt are department- and year-fixed
effects while the fertility norms of immigrants and emigrants are defined in line with
Spilimbergo (2009) as weighted averages of the fertility rates in the migrants’
origin/destination department such that
�����,� � �∑ 1�2,�. �2,�23� � �∑ 1�2,�23� �4 (3)
where ERFN is the emigrants’ residence fertility norm and 1�2,� is the number of
people born in department i living in department j at time t, �2,� is the fertility rate of
department j at time t, and
&'���,� � �∑ 12�,�. �2,�23� � �∑ 12�,�23� �4 (4)
where IBRN is the immigrants' birthplace fertility norm.
In addition, we define the share of emigrants, "#�,�, in proportion of the
population of department i
"#�,� � �∑ 1�2,�23� � 5�,�4 (5)
and the share of immigrants, �#�,�, among inhabitants of department i as
�#�,� � �∑ 12�,�23� � 5�,�4 (6)

12
where 1�2,� is the number of people born in department i living in department j at time
t and 5�,� is the total population of department i at time t.
To estimate Equation (2), we follow the methodological approach of Brown and
Guinnane (2007) and Guinnane (2011) in their analysis of the European fertility
decline (Coale and Watkins, 1986). We include interaction terms between the fertility
norms and the shares of emigrants/immigrants to check whether the intensity of the
diffusion is larger where there are more migrants. We also include department and
time fixed effects to exploit within-department variations across periods and correct
for unobserved heterogeneity between departments. However, it is a priori unclear
whether we should specify Equation (2) in growth rates or in levels, and whether we
should include a lagged dependent variable and/or lagged explanatory variables to
account for the potential delayed effects of economic changes. Our additional
regressions, which are available upon request, suggest that it is preferable to use a
specification in level without lagged variables.
Identification strategy 3.2.
To estimate Equation (2), we use changes in travel costs via the railroad network
within France as an instrumental variable. This identification strategy is motivated by
the fact that travel costs were time-varying during the 19th century, as the railroad
network was gradually built throughout the country. A decrease in travel costs should
therefore lower the costs of migration and increase the stock of migrants. Indeed,
transport costs were substantial enough to matter. Even in 1901, the cheapest train
ticket (in third class) between Paris and Lyon (approximately 450 km) cost three days
of a Parisian worker’s wages and five days of a provincial one. A coach ticket was
three times as expensive. In 1872, these numbers would have been six and 10.5 days
(France - Statistique des salaires, 1901). 17
Our first stage regression estimates a panel gravity model with the standard
Poisson Pseudo Maximum Likelihood that solves for heteroskedasticity and for the
existence of zero migrant stocks (Silva and Tenreyro, 2006):
log�1�2,�� � � � *. log��6�789 6�: 8�8�;�< � :. log��6�789 6�: 8�8�;$< �
β. � β> � β? � 0 (7)
17 For the sake of comparison, the cheapest ticket was worth five hours of the net minimum wage in
2012.

13
where 1�2,� are the migrant stocks while βt, βo and βd are the year-, origin-department
and destination-department fixed effects. We use 20 and 30-year lagged transport
costs because the mean migrant age was, according to the TRA dataset, 38 years old
in 1861, 40 in 1872, 41 in 1881, 43 in 1891, 45 in 1901 and 50 in 1911, i.e. between
20 and 30 years after migration. These transport costs are computed in a four-step
procedure. First, we use Caron (1997)'s rail network map to determine the available
travel (railroad, road, sea) links between adjacent departments. Second, we compute
the great-circle distance between the administrative centres (chef-lieu) of adjacent
departments. Third, since rail prices were regulated by the State (Toutain, 1967, p.
277), there was a constant road or rail price per kilometer throughout France and this
strategy provides the travel cost between adjacent departments. Fourth, we apply a
short-route finding algorithm taken from the UCINET network analysis program
(Borgatti et al., 2006) to compute the cheapest route and hence the travel costs
between each department.
To be a valid instrument, transport costs must not only correctly predict bilateral
migration but they should also neither entail reverse causality nor violate the
exclusion restriction by affecting the cultural diffusion of fertility norms through other
channels than migration. This will lead us to provide a series of robustness checks in
Section 4.2. At this point, however, it is worth noting that reverse causality may only
be an issue if migrants are self-selected on preferences for fertility and choose their
destination accordingly.18 Individuals living in a low- (respectively, high-) fertility
department who have preferences for large (small) families may have found it
beneficial to migrate to a high- (low-) fertility department where their own
preferences are more in line with the prevailing norms in terms of family size.
However, this would have not contributed to a convergence but to a divergence in the
fertility rate across departments. As such, reverse causality and the self-selection of
emigrants would imply that our OLS coefficients underestimate the actual effect of
migration on the fertility decline.
As for the exclusion restriction, the historical account on the development of the
French railroad network suggests that it took place independently of fertility patterns,
or of the demand and supply for migration (Caron, 1997). Indeed, from the 1840s
18 Home fertility is well recognized as a push factor of international migration but fertility at destination
is not thought to be a significant pull factor (Mayda, 2010).

14
onwards, the French government designed the railroad network to connect Paris to the
main economic centres of the country and by the mid-1880s, the railroad network
connected all the main administrative towns (chef-lieu) of each department.19 To
illustrate our point, we graph in the Supplementary Appendix the Coale fertility index
of each department between 1811 and 1911 and a vertical line that indicates when the
department was linked to Paris via the railroad. These graphs show that the
introduction of the railroad was not linked to the decline in fertility.
Table 1 reports the regression results of the first-stage regression in Equation (7)
where we assess the relationship between our IV transport costs and migrant stocks.
Column 1 considers all migrants while Columns 2 and 3 distinguish between male
and female migrants.20
The first-stage regression results show that migrant stocks decline with increasing
travel costs, as could be expected. In other words, migrations increased as travel costs
decreased. In particular, our results in Column 1 suggest that the elasticity between
20-year lagged transport costs and migrant stocks is -0.9 while that between 30-year
lagged transport costs and migrant stocks is -0.6. Given that the median decrease in
bilateral transports costs until 1891 is equal to 13%, these figures suggest that the
median increase in bilateral migrant stocks every decade after 1861 predicted by
transport costs is 19.5%. Given that the actual figure is 20%, this finding corroborates
the validity of our first-stage results. An intuition for these results is that the decline in
bilateral transport costs at time t predicts more or less accurately the increase in
bilateral migrant costs at time t+30 years. Finally, we note that the first stage
regression results reported in Columns 2 and 3 suggest that there is no specific effect
for men or women, either in terms of size or magnitude.
A potential concern with our identification strategy is that transport costs and
migration may be correlated with other factors which also influence fertility rates. We
discuss this issue in Section 4.2 and provide several robustness checks for the size,
significance and validity of our results.
19 This design, which originally comprised seven lines, was named L'Etoile de Legrand (Legrand's
star), after the then under-secretary of public works. In the supplementary appendix, we show the state
of development of the railroad network in 1856. 20 The results in Columns 2 and 3 of Table 1 should be seen as robustness checks since our
instrumental variable, transport costs, does not vary by gender.
15
4. Results
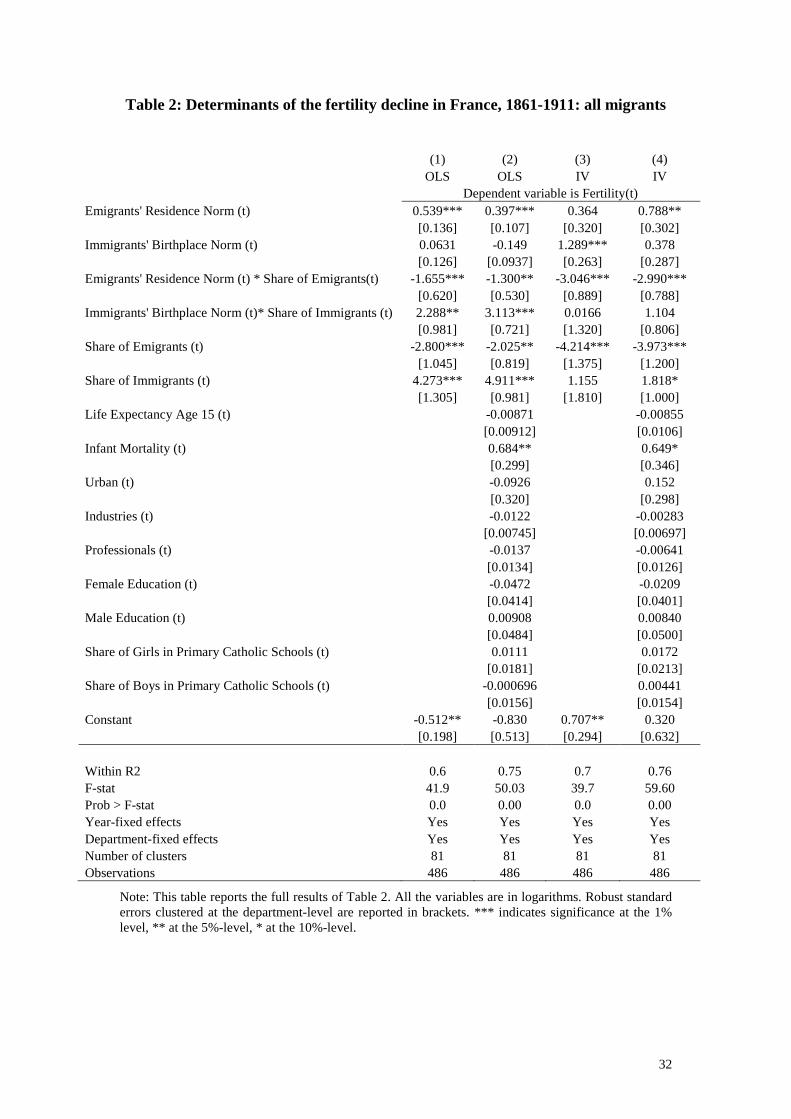
The effect of migration on the decline in fertility 4.1.
Table 2 analyses the impact of migration of men and women on the convergence
in the fertility rates of the French departments. Columns 1 and 2 report OLS estimates
while Column 3 show IV estimates. Column 1 only includes the fertility norms of
emigrants and immigrants, the shares of migrants and the interaction variables while
Columns 2 and 3 also includes our set of control variables. It appears that none of
these controls has a significant effect on fertility, except for infant mortality.
The results in Table 2 suggest that immigrants and emigrants did not have the
same effect on the fertility convergence between 1861 and 1911. At first glance,
immigrants seem to have no systematic effect on fertility while emigrants do. Indeed,
the positive and significant coefficient of Emigrants' Residence Norm suggests that
departments whose emigrants moved to destinations with strongly declining fertility
experienced a larger decline in their own fertility. Moreover, the negative and
significant coefficient of Share of Emigrants suggests that departments with the
largest increase in the share of emigrants experienced the largest drop in fertility.
However, we cannot interpret the coefficients of the interacted variables by
themselves. We note that the interaction variable Emigrants' Residence Norm * Share
of Emigrants has a negative and significant sign.21 This suggests two possible
interpretations. On the one hand, the interaction variable mitigates the effect of the
two variables Emigrants' Residence Norm and Share of Emigrants taken separately
because individuals who remained in departments with an increasing share of
emigrants moving to low-fertility areas were more likely to have a high number of
children. On the other hand, the interaction variable suggests that the effect of the
Emigrants' Residence Norm is lower at high levels of emigration. This is suggestive
of diminishing returns to migration in terms of informational transmission, in line
with the rest of the literature (e.g., Spilimbergo (2008) and Beine et al. (2013)). In any
event, our counterfactual analysis in Section 5.2 provides a quantitative discussion of
how these different effects balance out. However, we first provide a series of
robustness checks in the next subsection.
21 In the studies of Spilimbergo (2008) and Beine et al. (2013) whose specification is very similar to
ours, this interaction term is not significant.
16
Robustness checks 4.2.
Some concerns pertaining to our analysis may be related to the endogenous
relationship between migration and fertility. While reverse causality and the self-
selection of migrants are unlikely to bias our estimates as we discussed in Section 3.2,
our identification strategy is meant to address potential omitted variable bias and
ensure the validity of the exclusion restriction in our regressions. Specifically, it could
be argued that lower transport costs could ease the diffusion of norms of low fertility,
not just through migration, but also through other channels, notably the diffusion of
newspapers and books.22 More generally, one may also be concerned that transport
costs in the second half of the 19th century are associated with other forces that could
have shaped the joint evolution of migration and fertility. However, it is worth noting
that in 19th century France, there were internal tariffs, known as octrois, which
constituted an impediment to the circulation of many goods (Franck et al., 2014).
To mitigate these concerns, we run three series of robustness checks. First, we
test whether there is a relationship between migrant stocks between 1861 and 1911,
whether instrumented by the fall in transport costs or not, and the fertility decline
between 1811 and 1861. It is reassuring to find in Table 3 that there is not such a
relationship.
Second, we include a series of "bad controls" (Angrist and Pischke, 2009) which
are potentially endogenous to migration and fertility in the regressions in Table 2.
These include other potential vectors of cultural diffusion, such as the total number of
periodicals published in each year and each department. These also include
demographic variables that could be correlated with both migration and fertility23,
such as the share of births out of wedlock, the share of illegitimate births as a share of
out-of-wedlock births, as well as the shares of married men and women for the 20-24,
25-29, 30-34 and 35-39 age groups. Except for the total number of periodicals which
we collect from the successive issues of the Bibliographie de la France ou Journal
général de l'imprimerie as well as from Avenel (1895, 1901) and Mermet (1880-
22 Newspapers and books are high value-to-weight whose dissemination across France between 1851
and 1911 was more likely to be influenced by changes in the availability of transport rather than by
changes in transportation costs. On the diffusion of newspapers and, in particular, on the importance of
regional newspapers outside Paris, see, e.g., Manevy (1955), Bellanger (1969) and Albert (1972). 23 Since these variables are likely endogenous, they are not included in our baseline regressions.

17
1901), all these other variables are collected from the successive issues of the French
census. The results are reported in Table 4. We find that none of these "bad controls"
has a consistent effect on the coefficients of our variables of interest, either in terms of
size or significance level.
Third, there might be some concern that our results are driven by spatial
autocorrelation, given the nature of our data and empirical strategy (see also Murphy
(2015)). It is therefore reassuring to find in Table 5 that our main regression results
are robust to accounting for the inclusion of spatial autocorrelation.
5. Channels of the fertility decline: a counterfactual analysis
In this section, we discuss possible channels through which emigration affected
fertility. Specifically we carry out a counterfactual analysis to examine potential
differences between the migration of men and of women, as well as the role of
migration from and to Paris.
Tables 6 and 7 present regression results on a sample that only includes male and
female migrants, respectively. Moreover, the sample in the regressions shown in
Table 8 excludes all migrants, i.e., both men and women, to and from Paris, which
made up most of the Seine department.
In Tables 6 and 7, the significance and the size of the coefficients associated with
Emigrants' Residence Norm, Share of Emigrants and Emigrants' Residence Norm *
Share of Emigrants are roughly similar to those in Table 2. These results suggest that
male and female emigrants contributed equally to the fertility decline. They are thus
in line with the historical evidence that long-term migrations, which our study
analyses to capture the decline in fertility, were often joint migrations of men and
women, unlike short-term migrations which were overwhelmingly undertaken by men
alone (Châtelain, 1976).24
24 We note that in Table 7 the Share of (Female) Immigrants and the interaction variable (Female)
Immigrants' Residence Norm * Share of (Female) Immigrants have positive and significant
coefficients. This effect is however not found for male immigrants. While these results confirm our
remark in Section 4.1 that immigrants had overall no effect on the decline in fertility, it nonetheless
suggests that female immigrants did not immediately adopt the lower norms of their department of
destination. It is likely that they had more children than the women in their destination department but
fewer children than in their origin department. As such their behaviour did not prevent the convergence
in fertility rates.
18
In Table 8, we report regression results on a sample that excludes male and
female migration from and to the Seine department (which comprised Paris). They are
different from those in Table 2 since the coefficients associated with Emigrants'
Residence Norm, Share of Emigrants and Emigrants' Residence Norm * Share of
Emigrants are smaller in Table 8 and not systematically statistically significant across
the OLS and IV regressions. They actually suggest that migration to Paris played a
major role in the decline in fertility in France, even though our data indicate that only
26.33% of migrants lived in Paris throughout the period.25 We develop this intuition
in our counterfactual analysis below.
We then compute the counterfactual values of the fertility rate in each department
under the assumption that the size, bilateral structure, and fertility of emigrants and
immigrants would have remained at their 1861 level. For this purpose, we use the
OLS and IV regression results in Columns 2 and 4 (with the control variables) of
Tables 2, 6, 7 and 8 (i.e., on the samples of all migrants, only male migrants, only
female migrants, as well as of all migrants excluding Seine as destination and origin).
In Table 9, we report these counterfactual values at the national level along with the
actual fertility data between 1861 and 1911. We assess the fit of each model with the
Pearson χ2 statistic as in Buchinsky et al. (2014).26 Overall, the Pearson χ2 statistic
shows that our regressions capture the impact of migration on fertility decline.
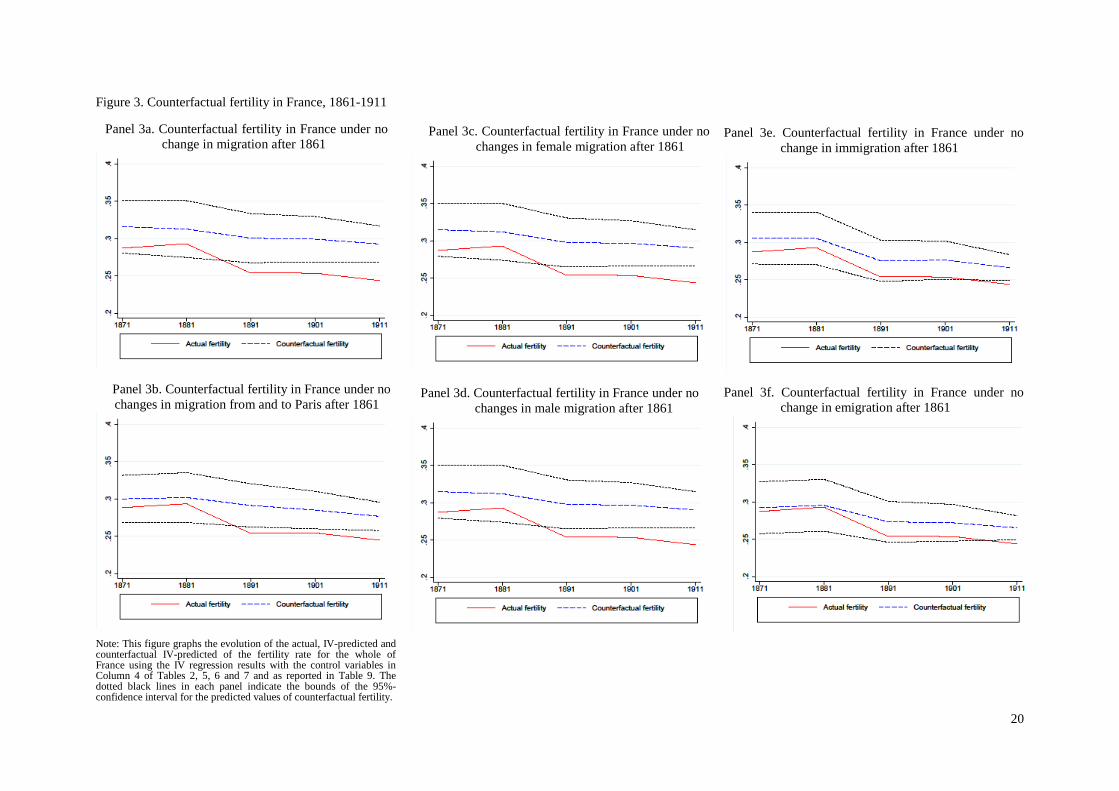
To illustrate our analysis, we report two graphs based on the counterfactual
values obtained with the IV regressions reported in Column 4 of Tables 2, 6, 7 and 8
and reported in Table 9. First, Figure 3 shows the evolution of the actual and
counterfactual values for the IV regressions of the unweighted average fertility rate at
the national level between 1861 and 1911 under the assumption that no changes in
fertility norms and in the shares of migrants had occurred after 1861. Second, Figure 4
shows these same values in the form of histograms, thus highlighting the decline in
the standard error of fertility rates over time, and the progressive convergence of
fertility rates across France.
25 Only 5.25% of the total emigrants were born in the Seine department throughout the period. 26 The Pearson χ2 statistic is computed as χ2� ∑ �56"@�:�"@� − B*8"6C"@� �D�
�� 56"@�:�"@�⁄ . The
critical values at the 10%, 5% and 1% levels of significance are χ.F<� (80)=64.218, χ.F(� (80) =60.391
and χ.FF� (80)=53.540.

19
Three general observations can be drawn from Table 9 as well as from Figures 3
and 4. First, the counterfactual values of the average Coale fertility index are larger
than the actual values. For instance, Table 9 (see Panel A of Figures 3 and 4) indicates
that the average French Coale fertility index would had been 0.293 in 1911 had there
been no change in migration of men and women after 1861, instead of 0.244. Since
the national Coale fertility index in 1861 was equal to 0.310, these findings imply that
the 0.66 point drop in fertility in France between 1861 and 1911 can be broken down
into a 0.49 point drop caused by migration and a 0.17 point drop which can be
attributed to other economic and demographic factors, most likely to infant mortality
since it is the only other significant variable in our regressions. It is also interesting to
note that the counterfactual values for the standard deviation of the Coale Fertility
Index are larger than the predicted values, but still lower than the actual values. In
other words, while our model slightly under-estimates the standard deviation of
fertility, it nonetheless suggests that migration contributed to the convergence of
fertility rates across France. Moreover, the figures in Table 9 (see Panels C and D of
Figures 3 and 4) suggest that the fertility decline can be equally attributed to male and
female migration.
Second, the counterfactual values indicate that the average French Coale Fertility
Index would have been equal to 0.265 (see Panel E of Figures 3 and 4) under the
assumption that no change in fertility norms in origin departments and in the share of
immigrants had occurred after 1861 and equal to 0.266 under the assumption that no
change in fertility norms in destination departments and in the share of emigrants had
occurred after 1861 (see Panel F of Figures 3 and 4). These findings suggest that the
depressing effects on fertility of the changes in Emigrants' Residence Norm and Share
of Emigrants and of the changes in Immigrants' Birthplace Norm and Share of
Immigrants are equally large, at least at the national level.
20
Panel 3e. Counterfactual fertility in France under no
change in immigration after 1861
Panel 3f. Counterfactual fertility in France under no change in emigration after 1861
Panel 3c. Counterfactual fertility in France under no
changes in female migration after 1861
Panel 3d. Counterfactual fertility in France under no changes in male migration after 1861
Figure 3. Counterfactual fertility in France, 1861-1911
Panel 3a. Counterfactual fertility in France under no change in migration after 1861
Panel 3b. Counterfactual fertility in France under no changes in migration from and to Paris after 1861
Note: This figure graphs the evolution of the actual, IV-predicted and counterfactual IV-predicted of the fertility rate for the whole of France using the IV regression results with the control variables in Column 4 of Tables 2, 5, 6 and 7 and as reported in Table 9. The dotted black lines in each panel indicate the bounds of the 95%-confidence interval for the predicted values of counterfactual fertility.

21
Panel 4e. Counterfactual fertility in France under no change in immigration after 1861
Panel 4f. Counterfactual fertility in France under no change
in emigration after 1861
Panel 4c. Counterfactual histogram of French fertility under no change in female migration after 1861
Panel 4d. Counterfactual histogram of French fertility under no change in male migration after 1861
Figure 4. Counterfactual histogram of fertility in France, 1861-1911
Panel 4a. Counterfactual histogram of French fertility under
no change in migration after 1861
Panel 4b. Counterfactual histogram of French fertility under no change in migration from and to Paris after 1861
Note: This figure provides histograms for the counterfactual values of the fertility rate in the French departments using the IV regression results with the control variables in Column 4 of Tables 2, 5, 6 and 7 and as reported in Table 9.

22
Third, Table 9 suggests that Paris played a major role in the decline in fertility
rates throughout the period.27 As can be seen in Panel B of Figures 3 and 4, the
counterfactual average value of the Coale fertility index in the IV regression in the
absence of migration to and from Seine is found to be much higher than its actual
level in 1911 (0.276 vs. 0.244). Given that the national Coale fertility index in 1861
was equal to 0.310, these findings imply that the counterfactual fertility decline
without Paris is only one half of the actual drop (0.34 points instead of 0.66). In other
words, since 26.33% of the total migrants moved to the Seine department between
1861 and 1911, our counterfactual analysis suggests that the information sent back to
their department of origin by one immigrant to Seine had the same depressing effect
on fertility as three immigrants who moved to other departments.
All in all, these observations thus suggest that emigrants to the Seine department
mattered more than other emigrants, and this is in line with the cultural, economic and
political importance of Paris within France. We may think that would-be emigrants
sought to move to Paris, even if they eventually migrated to the closest regional
industrial center, and chose to have few children because they learnt from emigrants
from their regions that individuals who were already living in Paris had few children.
This might have been a cultural element of Parisian life, and there is evidence that the
political and economic elites living in Paris already had few children by the end of the
18th century (Livi-Bacci 1986). But this feature of Parisian life might also have been
grounded in an economic rationale: Parisians had few children because raising many
children in Paris was costly and difficult. In fact, it was customary for Parisians to
send new-borns to foster care in the countryside, even though this was expensive and
infant mortality rates were high (Rollet-Echalier, 1990).28 As such, our analysis of the
results suggests an explanation for the lower fertility rates in France before WWI 27 The Seine department, which includes Paris, along with Seine-et-Oise and Seine-et-Marne, which
comprise the Parisian suburbs, were areas of low fertility by the mid-19th century. In 1901 and 1911,
the fertility of Seine was below the 5th percentile of fertility in France. In addition, the total French
population amounted to 37,386,313 inhabitants in 1861 and to 41,479,006 in 1911, while there were
1,953,660 inhabitants in Seine in 1861 and 4,154,042 in 1911. Hence, Seine accounted for 5.2% of the
French population in 1861 and 10% in 1911 28 The poorer the French couples were, the further away they would have to send their children from
Paris. In the second half of the 19th century, well-to-do families would employ a wet nurse at home to
take care of their children (Faÿ-Sallois, 1980). See also Rapoport and Vidal (2007) for additional
anecdotal evidence and an interpretation in terms of endogenous parental altruism formation.

23
which pertains to the diffusion via migrants of an information which combined a
cultural component and an economic rationale related to the cost of child rearing in
Paris.
6. Conclusion
In this study, we investigate the impact of migration on the fertility transition. We
focus on the convergence in fertility rates within France between 1861 and 1911 by
taking advantage of the fact that internal migration was much more prevalent than
international migration over that period (in contrast to most other European
countries). Using various historical data sources, we build a bilateral migration matrix
between French departments, with observations every ten years. We then assess the
effects of the changing fertility norms of emigrants and immigrants in their birthplace
and residence departments. We address the endogeneity of migration choices by using
time-varying bilateral travel costs resulting from the gradual development of the
railroad network as an instrumental variable.
Our results suggest that the transmission of information via migration explained
most the convergence of fertility rates across France while socio-economic variables
had, at best, a limited impact. In particular, emigrants sent back information to their
region of origin regarding the decreasing fertility norms of their region of destination.
It is therefore plausible that emigrants sent information to those who stayed behind,
but who might have wanted to emigrate in the future. This information regarding
social norms about family size could also have been grounded in an economic
rationale pertaining to the cost of raising children in urban areas, and specifically in
Paris. Our interpretation is consistent with the idea that the lack of external migration
might have been crucial in explaining French exceptionalism in Europe. Internal
migration was, relative to all migrations, an order of magnitude more important in
France than in other European countries. The effect of French cultural unification,
especially the emulation of Paris as the focus point of cultural change, was thus not
counterbalanced by the potential influence of high-fertility New World destinations
on fertility levels, as may have occurred in other European countries. As such, our
results are in line with the notion that France progressively became a fully culturally
integrated country in the course of the 19th century.
24
References
Abramitzky, Ran, Leah Platt Boustan, and Katherine Eriksson. 2013. “Have the
Poor Always Been Less Likely to Migrate? Evidence from Inheritance Practices
during the Age of Mass Migration.” Journal of Development Economics 102 (May):
2–14.
Abramitzky, Ran, Leah Platt Boustan, and Katherine Eriksson. 2014. “A Nation of
Immigrants: Assimilation and Economic Outcomes in the Age of Mass Migration”,
Journal of Political Economy 122 (3), 467-717.
Abramitzky, Ran, Adeline Delavande, and Luis Vasconcelos. 2011. “Marrying Up:
The Role of Sex Ratio in Assortative Matching.” American Economic Journal:
Applied Economics 3 (3): 124–157.
Albert, P. 1972. La Presse Française de 1871 à 1940. PUF, Paris.
Avenel, Henri, 1895, Le monde des journaux en 1895, Paris
Avenel, Henri, 1901, La presse française au vingtième siècle, Flammarion, Paris.
Baines, Dudley, and Robert Woods. 2004. “Population and Regional
Development.” In The Cambridge Economic History of Modern Britain, Economic
Maturity, 1860-1939, edited by Roderick Floud and Paul Johnson, 25–55. Cambridge:
Cambridge University Press.
Bandiera, Oriana, Imran Rasul, and Martina Viarengo. 2013. “The Making of
Modern America: Migratory Flows in the Age of Mass Migration.” Journal of
Development Economics 102 (May): 23–47
Barro, R. J., and X. Sala-i-Martin. 1992. “Convergence.” Journal of Political
Economy: 223–251.
Barsbai, Toman, Hillel Rapoport, Andreas Steinmayr, and Christoph Trebesch.
2016. “The Effect of Labor Migration on the Diffusion of Democracy: Evidence from
a Former Soviet Republic”, Mimeo, Kiel Institute for the World Economy.
Béaur, Gérard, and Béatrice Marin. 2011. “La Statistique Générale de la France –
Présentation.” L’Atelier du Centre de recherches historiques. La Statistique Générale
de la France (March 17). http://acrh.revues.org/index2891.html.
Becker, Sascha O., Francesco Cinnirella, and Ludger Woessmann (2010). “The
Trade-Off nbetween Fertility and Education: Evidence from before the Demographic
Transition,” Journal of Economic Growth, 15 (3), 177-204

25
Becker, Sascha O., Francesco Cinnirella, and Ludger Woessmann (2012). “The
Effect of Investment in Children’s Education on Fertility in 1816 Prussia,”
Cliometrica, 6, 29-44
Beine, M., F. Docquier, and M. Schiff 2013. “International Migration, Transfers of
Norms and Home Country Fertility.” Canadian Journal of Economics.
Bellanger, C. 1969. Histoire Générale de La Presse Française: De 1871 à 1940.
Vol. 3. Presses Universitaires de France.
Belotti, Federico, Gordon Hughes and Andrea Piano Mortari, 2013, XSMLE: Stata
Module for Spatial Panel Data Models Estimation, Statistical Software Components
S457610, Boston College Department of Economics.
Bergues, Hélène, Philippe Aries, Etienne Helin, Louis Henry, Riquet, Alfred
Sauvy, and Jean Sutter. 1960. La Prévention Des Naissances Dans La Famille: Ses
Origines Dans Les Temps Modernes. Presses Universitaires de France.
Bertoli, Simone, and Francesca Marchetta. 2015. “Bringing It All Back Home:
Return Migration and Fertility Choices.” World Development 65, 27-40.
Bibliographie de la France ou Journal général de l'imprimerie (1861-1911)
Blanchet, Didier, and Denis Kessler. 1992. “La Mobilité Géographique, de La
Naissance Au Mariage.” In La Société Française Au XIXe Siècle: Tradition,
Transition, Transformation, edited by Jacques Dupâquier and Denis Kessler, 362–
369. Paris: Fayard.
Blau, Francine D., Lawrence M. Kahn, and Kerry Papps. 2011. “Gender, Source
Country Characteristics and Labor Market Assimilation among Immigrants.” Review
of Economics and Statistics 93 (1): 43–58.
Bonneuil, N. 1997. Transformation of the French Demographic Landscape, 1806-
1906. Clarendon Press England.
Bonneuil, N., A. Bringé, and P.A. Rosental. 2008. Familial Components of First
Migrations after Marriage in Nineteenth-Century France, Social History 33 (1) 36–59.
Borgatti, S. P., M. G. Everett, and L. C. Freeman. 2006. UCINET 6 Social
Network Analysis Software v. 6.125. Harvard, MA: Analytic Technologies.
Bourdelais, P. 2004. “L’enquête Des 3000 Familles: Un Premier Bilan
(introduction).” Annales de Démographie Historique: 5–6.
Bourdieu, J., Gilles Postel-Vinay, and Akiko Suwa-Eisenmann. 2004. “Défense et
Illustration de L’enquête Des 3 000 Familles. L’exemple de Son Volet Patrimonial.”
In Annales de Démographie Historique, 19–52.
26
Bourdieu, Jérôme, Gilles Postel-Vinay, Paul-André Rosental, and Akiko Suwa-
Eisenmann. 2000. “Migrations et Transmissions Inter-Générationnelles Dans La
France Du XIXe et Du Début Du XXe Siècle.” Annales. Histoire, Sciences Sociales
55 (4): 749–789.
Boyer, G. R., Williamson, J. G. (1989): “A Quantitative Assessment of the Fertility
Transition in England, 1851‐1911,” Research in Economic History 12, 93–117.
Braudel, F. 1986. L’identité de La France, Paris. Arthaud.
Brown, John C, and Timothy W Guinnane. 2007. “Regions and Time in the
European Fertility Transition: Problems in the Princeton Project’s Statistical
methodology.” The Economic History Review 60 (3) (August 1): 574–595.
Brown, John C., and Timothy W. Guinnane. 2002. “Fertility Transition in a Rural,
Catholic Population: Bavaria, 1880–1910.” Population Studies 56 (1): 35–49.
Cairncross, A. K. 1949. “Internal Migration in Victorian England.” The
Manchester School 17 (1): 67–87.
Caron, F. 1997. Histoire Des Chemins de Fer En France: 1740-1883. Fayard Paris.
Casterline, J. 2001. Diffusion Processes and Fertility Transition: Selected
Perspectives. National Academies Press.
Châtelain, Abel, 1976, Les migrants temporaires en France de 1800 à 1914,
Villeneuve-d'Ascq: Publications de l'Université de Lille-III.
La Ferrara, Eliana, Alberto Chong and Suzanne Duryea. 2012. “Soap Operas and
Fertility: Evidence from Brazil.” American Economic Journal: Applied Economics, 4
(4), 1-31.
Coale, A.J. 1969. “The Decline of Fertility in Europe from the French Revolution
to World War II.” In: Behrman, S.J., Corsa, L., Jr., and Freedman, R., eds, Fertility
and Family Planning: A World View: 3–24, University of Michigan Press, Ann Arbor
MI.
Coale, A.J., and S.C. Watkins. 1986. The Decline of Fertility in Europe: The
Revised Proceedings of a Conference on the Princeton European Fertility Project.
Princeton University Press Princeton.
Cohen-Zada, D. 2006. “Preserving Religious Identity through Education:
Economic Analysis and Evidence from the US.” Journal of Urban Economics 60 (3):
372–398.
Cox, Nicholas. 2006. MSTDIZE: Stata Module to Produce Marginal
Standardization of Two-Way Tables. STATA.

27
Cummins, Neil (2013). “Marital Fertility and Wealth during the Fertility
Transition: Rural France, 1750-1850,” Economic History Review 66 (2), 449-476.
David, P.A., and W.C. Sanderson. 1987. “The Emergence of a Two-Child Norm
among American Birth-Controllers.” Population and Development Review: 1–41.
de la Croix David and Faustine Perrin. 2016. “French Fertility and Education
Transition: Rational Choice vs Cultural Diffusion” Universite Catholique de Louvain
Working Paper.
Docquier, Frédéric, Elisabetta Lodigiani, Hillel Rapoport, and Maurice Schiff.
2016. “Emigration and Democracy” Journal of Development Economics 120, 209-
223.
Doepke, M. 2005. “Child Mortality and Fertility Decline: Does the Barro-Becker
Model Fit the Facts?” Journal of Population Economics 18 (2): 337–366.
Dribe, M. 2009. “Demand and Supply Factors in the Fertility Transition: A
County-Level Analysis of Age-Specific Marital Fertility in Sweden, 1880–1930.”
European Review of Economic History 13 (1): 65–94.
Dupâquier, J. 1988. Histoire de La Population Française. Vol. 1. Presses
universitaires de France, Paris.
Dupâquier, Jacques. 2004. “L’enquête Des 3000 Familles.” Annales de
Démographie Historique: 7–18.
Dupâquier, Jacques, and Jean-Pierre Poussou. 1988. “Les Étrangers En France.” In
Histoire de La Population Française, T. 3 de 1789 À 1914, Presses Universitaires de
France. Vol. 3. Paris.
Eckstein, Z., P. Mira, and K.I. Wolpin. 1999. “A Quantitative Analysis of Swedish
Fertility Dynamics: 1751-1990.” Review of Economic Dynamics 2 (1): 137–165.
Fargues, Philippe. 2007. “The Demographic Benefit of International Migration: A
Hypothesis and Its Application to Middle Eastern and North African Countries.” In
International Migration, Economic Development and Policy, by C. Ozden and
Maurice Schiff. Washington, DC: World Bank.
Faÿ-Sallois, Fanny, Les nourrices à Paris au XIXe siècle, Payot, Paris.
Fernandez, R., and A. Fogli. 2006. “Fertility: The Role of Culture and Family
Experience.” Journal of the European Economic Association 4 (2-3): 552–561.
Franck, R. 2010. “Economic Growth and the Separation of Church and State: The
French Case.” Economic Inquiry 48 (4): 841–859.
28
Franck, R. N.D. Johnson and J.V.C Nye, 2014. "From internal taxes to national
regulation: evidence from a French wine tax reform at the turn of the twentieth
century", Explorations in Economic History, 51, 77-93.
Galloway, P. R, E. A Hammel, and R. D Lee. 1994. “Fertility Decline in Prussia,
1875–1910: A Pooled Cross-Section Time Series Analysis.” Population Studies 48
(1): 135–158.
Galor, Oded, and Omer Moav. 2002. “Natural Selection and the Origin of
Economic Growth.” Quarterly Journal of Economics 117 (4): 1133.
Galor, Oded. 2005a. “The Demographic Transition and the Emergence of
Sustained Economic Growth.” Journal of the European Economic Association 3 (2-3):
494–504.
Galor, Oded. 2005b. “From Stagnation to Growth: Unified Growth Theory.”
Handbook of Economic Growth 1: 171–293.
Galor, Oded. 2012. “The Demographic Transition: Causes and Consequences.”
Cliometrica: 1–28.
Galor, Oded, and D.N. Weil. 2000. “Population, Technology, and Growth: From
Malthusian Stagnation to the Demographic Transition and beyond.” American
Economic Review: 806–828.
Gonzalez-Bailon, S., and T. Murphy. 2008. “When Smaller Families Look
Contagious: A Spatial Look At The French Fertility Decline Using An Agent-Based
Simulation Model.” Oxford University Economic and Social History Series.
Guinnane, Timothy W. 2011. “The Historical Fertility Transition: A Guide for
Economists.” Journal of Economic Literature 49 (3) (September): 589–614.
Hatton, T. J. 2010. “The Cliometrics of International Migration: A Survey.”
Journal of Economic Surveys 24 (5): 941–969.
Hatton, Timothy J., and Jeffrey G. Williamson. 1998. The Age of Mass Migration:
Causes and Economic Impact. Oxford University Press, USA.
Hazan, M. 2009. “Longevity and Lifetime Labor Supply: Evidence and
Implications.” Econometrica 77 (6): 1829–1863.
Klemp, Marc P. B., and Jacob L. Weisdorf (2012). “Fecundity, Fertility and
Family Reconstitution Data: The Child Quantity-Quality Trade-Off Revisited,” CERP
Working Paper.
Kohler, H. P. 2000. “Fertility Decline as a Coordination Problem.” Journal of
Development Economics 63 (2): 231–263.
29
Kohler, H. P.. 2001. Fertility and Social Interaction: An Economic Perspective.
Oxford University Press, USA.
Livi-Bacci, Massimo, 1986, Social-Group Forerunners of Fertility Control in
Europe”, in A.J. Coale, and S.C. Watkins.(eds), The Decline of Fertility in Europe:
The Revised Proceedings of a Conference on the Princeton European Fertility Project.
Princeton University Press Princeton, 182-200.
Livi-Bacci, Massimo (2012): "A short history of migration", Wiley, New York.
Maddison, A. 2001. The World Economy: A Millennial Perspective. Organization
for Economic Development, Paris.
Manevy, R. 1955. La Presse de La III. République. J. Foret, Paris.
Mayda, Anna Maria, 2010, International migration: a panel data analysis of the
determinants of bilateral flows, Journal of Population Economics, 23(4), 1249-1274.
McKenzie, David, and Hillel Rapoport. 2007. “Network Effects and the Dynamics
of Migration and Inequality: Theory and Evidence from Mexico.” Journal of
Development Economics 84 (1): 1–24.
McKenzie, David, and Hillel Rapoport. 2010. “Self-Selection Patterns in Mexico-
U.S. Migration: The Role of Migration Networks.” Review of Economics and
Statistics 92 (4), 811–821.
Mercier, Marion, and Lisa Chauvet. 2014. “Do return migrants transfer political
norms to their origin country? Evidence from Mali” Journal of Comparative
Economics 42 (3), 630-651.
Munshi, K., and J. Myaux. 2006. “Social Norms and the Fertility Transition.”
Journal of Development Economics 80 (1): 1–38.
Murphy, T. E. 2015. “Old habits die hard (sometimes): Can département
heterogeneity tell us something about the French fertility decline?” Journal of
Economic Growth 20 (2): 177-222.
Rapoport, Hillel and Jean-Pierre Vidal, 2007. Economic growth and endogenous
intergenerational altruism, Journal of Public Economics, 91, 7-8: 1231-46.
Rollet-Echalier, Catherine, 1990, La politique à l'égard de la petite enfance sous la
III e république, Presses Universitaires de France, Paris.
Silva, J.M.C.S., and S. Tenreyro. 2006. “The Log of Gravity.” The Review of
Economics and Statistics 88 (4): 641–658.
Smith, K.W. 1976. “Marginal Standardization and Table Shrinking: Aids in the
Traditional Analysis of Contingency Tables.” Social Forces 54 (3): 669–693.

30
Spilimbergo, Antonio. 2007. “Democracy and Foreign Education.” IMF Working
Paper (07/51).
Spilimbergo, Antonio. 2009. “Democracy and Foreign Education.” American
Economic Review 99 (1) (February): 528–543. doi:10.1257/aer.99.1.528.
Spolaore, Enrico and Romain Wacziarg, 2014, Fertility and Modernity, Tufts
working paper.
Toutain, Jean-Claude. 1967. “Les Transports En France de 1830 à 1965.”
Économies et Sociétés Série AF (9): 1–306.
Weber, E. 1976. Peasants into Frenchmen: The Modernization of Rural France,
1870-1914. Stanford University Press.
Weir, D.R. 1994. “New Estimates of Nuptiality and Marital Fertility in France,
1740–1911.” Population Studies 48 (2): 307–331.

31
Table 1: Travel costs and migration: first stage regressions
The dependent variable is #�2,� the (log of the) stock of migrants born in départment i living in départment j at time t
All migrants Male migrants Female migrants
20-year lagged log(travel costs) -0.9***
(0.06)
-0.8***
(0.08)
-0.9***
(0.07)
30-year lagged log(travel costs) -0.6***
(0.05)
-0.7***
(0.06)
-0.5***
(0.06)
Year fixed effects Yes Yes Yes
Origin-département & destination-département fixed effects Yes Yes Yes
Pseudo R2 0.60 0.53 0.55
Number of clusters 7310 7310 7310
Number of observations 43,690 43,690 43,690
Note: Robust standard errors clustered at the origin-department. & destination-department are reported in brackets. *** indicates significance at the 1%-level, ** indicates significance at the 5%-level, * indicates significance at the 10%-level.
32
Table 2: Determinants of the fertility decline in France, 1861-1911: all migrants
(1) (2) (3) (4) OLS OLS IV IV
Dependent variable is Fertility(t) Emigrants' Residence Norm (t) 0.539*** 0.397*** 0.364 0.788**
[0.136] [0.107] [0.320] [0.302] Immigrants' Birthplace Norm (t) 0.0631 -0.149 1.289*** 0.378
[0.126] [0.0937] [0.263] [0.287] Emigrants' Residence Norm (t) * Share of Emigrants(t) -1.655*** -1.300** -3.046*** -2.990***
[0.620] [0.530] [0.889] [0.788] Immigrants' Birthplace Norm (t)* Share of Immigrants (t) 2.288** 3.113*** 0.0166 1.104
[0.981] [0.721] [1.320] [0.806] Share of Emigrants (t) -2.800*** -2.025** -4.214*** -3.973***
[1.045] [0.819] [1.375] [1.200] Share of Immigrants (t) 4.273*** 4.911*** 1.155 1.818*
[1.305] [0.981] [1.810] [1.000] Life Expectancy Age 15 (t) -0.00871 -0.00855
[0.00912] [0.0106] Infant Mortality (t) 0.684** 0.649*
[0.299] [0.346] Urban (t) -0.0926 0.152
[0.320] [0.298] Industries (t) -0.0122 -0.00283
[0.00745] [0.00697] Professionals (t) -0.0137 -0.00641
[0.0134] [0.0126] Female Education (t) -0.0472 -0.0209
[0.0414] [0.0401] Male Education (t) 0.00908 0.00840
[0.0484] [0.0500] Share of Girls in Primary Catholic Schools (t) 0.0111 0.0172
[0.0181] [0.0213] Share of Boys in Primary Catholic Schools (t) -0.000696 0.00441
[0.0156] [0.0154] Constant -0.512** -0.830 0.707** 0.320 [0.198] [0.513] [0.294] [0.632]
Within R2 0.6 0.75 0.7 0.76 F-stat 41.9 50.03 39.7 59.60 Prob > F-stat 0.0 0.00 0.0 0.00 Year-fixed effects Yes Yes Yes Yes Department-fixed effects Yes Yes Yes Yes Number of clusters 81 81 81 81 Observations 486 486 486 486
Note: This table reports the full results of Table 2. All the variables are in logarithms. Robust standard errors clustered at the department-level are reported in brackets. *** indicates significance at the 1% level, ** at the 5%-level, * at the 10%-level.

33
Table 3. Migration in 1861-1911 and lagged fertility in 1811-1861
(1) (2) (3) (4) OLS OLS IV IV
Dependent variable is Fertility(t-50) Emigrants' Residence Norm (t) 0.00611 -0.164 -0.381 -0.335
[0.147] [0.142] [0.313] [0.304] Immigrants' Birthplace Norm (t) -0.0680 -0.101 0.343 -0.134
[0.146] [0.142] [0.326] [0.352] Emigrants' Residence Norm (t) * Share of Emigrants(t) 0.416 0.827 -0.475 -0.0261
[0.930] [0.865] [1.124] [1.129] Immigrants' Birthplace Norm (t)* Share of Immigrants (t) 0.0496 0.0918 0.231 0.885
[1.100] [1.111] [1.014] [1.009] Share of Emigrants (t) 1.028 1.696 -0.550 -0.0403
[1.514] [1.373] [1.585] [1.590] Share of Immigrants (t) 0.292 0.00920 -0.406 0.159
[1.409] [1.379] [1.395] [1.356] Life Expectancy Age 15 (t) 0.0234 0.0284**
[0.0142] [0.0142] Infant Mortality (t) 0.864* 1.070**
[0.449] [0.442] Urban (t) -0.116 -0.237
[0.212] [0.172] Industries (t) 0.0103 0.00459
[0.00940] [0.0100] Professionals (t) -0.00922 -0.0111
[0.0171] [0.0179] Female Education (t) -0.0960 -0.122**
[0.0673] [0.0576] Male Education (t) -0.00695 -0.0101
[0.0620] [0.0556] Share of Girls in Primary Catholic Schools (t) -0.0405 -0.0343
[0.0281] [0.0305] Share of Boys in Primary Catholic Schools (t) 0.0343* 0.0232
[0.0194] [0.0199] Constant -1.089*** -2.686*** -0.943*** -3.106*** [0.249] [0.808] [0.274] [0.828] Within R2 0.5 0.57 0.6 0.59 F-stat 21.6 23.52 27.1 21.84 Prob > F-stat 0.0 0.00 0.0 0.00 Year-fixed effects Yes Yes Yes Yes Department-fixed effects Yes Yes Yes Yes Number of clusters 81 81 81 81 Observations 486 486 486 486
Note: This table reports the full results of Table 3. All the variables are in logarithms. Robust standard errors clustered at the department-level are reported in brackets. *** indicates significance at the 1% level, ** at the 5%-level, * at the 10%-level.
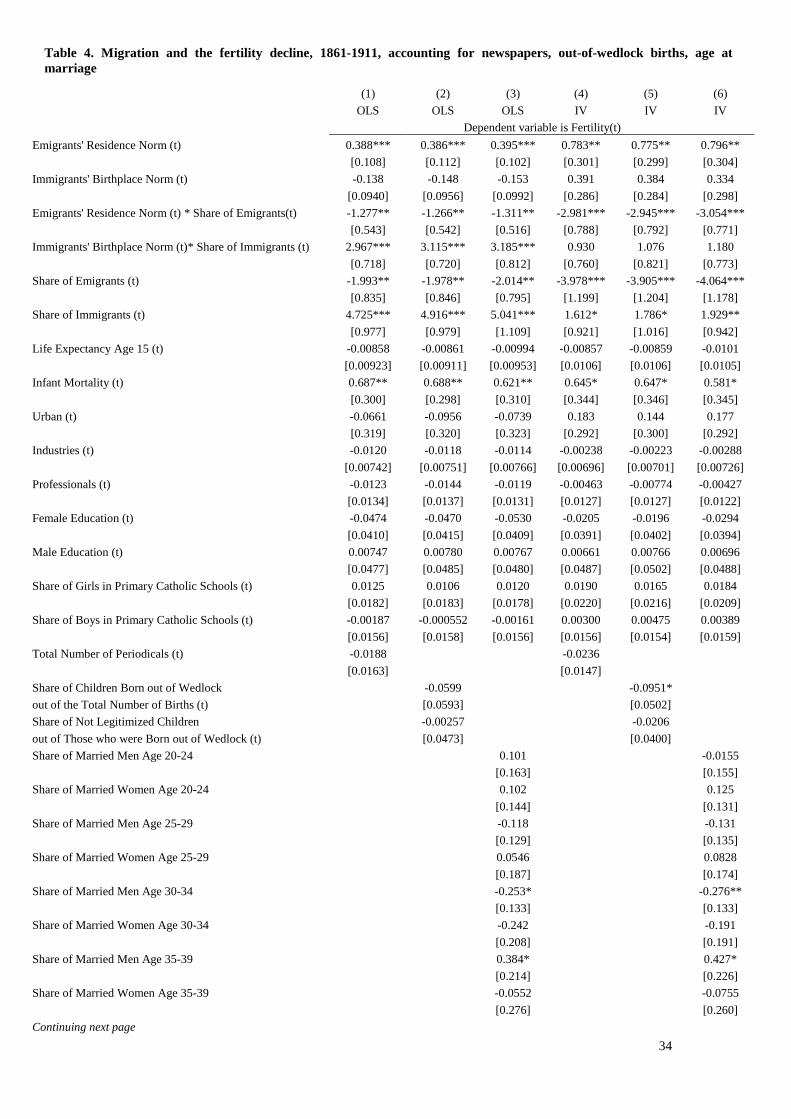
34
Table 4. Migration and the fertility decline, 1861-1911, accounting for newspapers, out-of-wedlock births, age at marriage
(1) (2) (3) (4) (5) (6)
OLS OLS OLS IV IV IV
Dependent variable is Fertility(t)
Emigrants' Residence Norm (t) 0.388*** 0.386*** 0.395*** 0.783** 0.775** 0.796**
[0.108] [0.112] [0.102] [0.301] [0.299] [0.304]
Immigrants' Birthplace Norm (t) -0.138 -0.148 -0.153 0.391 0.384 0.334
[0.0940] [0.0956] [0.0992] [0.286] [0.284] [0.298]
Emigrants' Residence Norm (t) * Share of Emigrants(t) -1.277** -1.266** -1.311** -2.981*** -2.945*** -3.054***
[0.543] [0.542] [0.516] [0.788] [0.792] [0.771]
Immigrants' Birthplace Norm (t)* Share of Immigrants (t) 2.967*** 3.115*** 3.185*** 0.930 1.076 1.180
[0.718] [0.720] [0.812] [0.760] [0.821] [0.773]
Share of Emigrants (t) -1.993** -1.978** -2.014** -3.978*** -3.905*** -4.064***
[0.835] [0.846] [0.795] [1.199] [1.204] [1.178]
Share of Immigrants (t) 4.725*** 4.916*** 5.041*** 1.612* 1.786* 1.929**
[0.977] [0.979] [1.109] [0.921] [1.016] [0.942]
Life Expectancy Age 15 (t) -0.00858 -0.00861 -0.00994 -0.00857 -0.00859 -0.0101
[0.00923] [0.00911] [0.00953] [0.0106] [0.0106] [0.0105]
Infant Mortality (t) 0.687** 0.688** 0.621** 0.645* 0.647* 0.581*
[0.300] [0.298] [0.310] [0.344] [0.346] [0.345]
Urban (t) -0.0661 -0.0956 -0.0739 0.183 0.144 0.177
[0.319] [0.320] [0.323] [0.292] [0.300] [0.292]
Industries (t) -0.0120 -0.0118 -0.0114 -0.00238 -0.00223 -0.00288
[0.00742] [0.00751] [0.00766] [0.00696] [0.00701] [0.00726]
Professionals (t) -0.0123 -0.0144 -0.0119 -0.00463 -0.00774 -0.00427
[0.0134] [0.0137] [0.0131] [0.0127] [0.0127] [0.0122]
Female Education (t) -0.0474 -0.0470 -0.0530 -0.0205 -0.0196 -0.0294
[0.0410] [0.0415] [0.0409] [0.0391] [0.0402] [0.0394]
Male Education (t) 0.00747 0.00780 0.00767 0.00661 0.00766 0.00696
[0.0477] [0.0485] [0.0480] [0.0487] [0.0502] [0.0488]
Share of Girls in Primary Catholic Schools (t) 0.0125 0.0106 0.0120 0.0190 0.0165 0.0184
[0.0182] [0.0183] [0.0178] [0.0220] [0.0216] [0.0209]
Share of Boys in Primary Catholic Schools (t) -0.00187 -0.000552 -0.00161 0.00300 0.00475 0.00389
[0.0156] [0.0158] [0.0156] [0.0156] [0.0154] [0.0159]
Total Number of Periodicals (t) -0.0188 -0.0236
[0.0163] [0.0147]
Share of Children Born out of Wedlock -0.0599 -0.0951*
out of the Total Number of Births (t) [0.0593] [0.0502]
Share of Not Legitimized Children -0.00257 -0.0206
out of Those who were Born out of Wedlock (t) [0.0473] [0.0400]
Share of Married Men Age 20-24 0.101 -0.0155
[0.163] [0.155]
Share of Married Women Age 20-24 0.102 0.125
[0.144] [0.131]
Share of Married Men Age 25-29 -0.118 -0.131
[0.129] [0.135]
Share of Married Women Age 25-29 0.0546 0.0828
[0.187] [0.174]
Share of Married Men Age 30-34 -0.253* -0.276**
[0.133] [0.133]
Share of Married Women Age 30-34 -0.242 -0.191
[0.208] [0.191]
Share of Married Men Age 35-39 0.384* 0.427*
[0.214] [0.226]
Share of Married Women Age 35-39 -0.0552 -0.0755
[0.276] [0.260]
Continuing next page
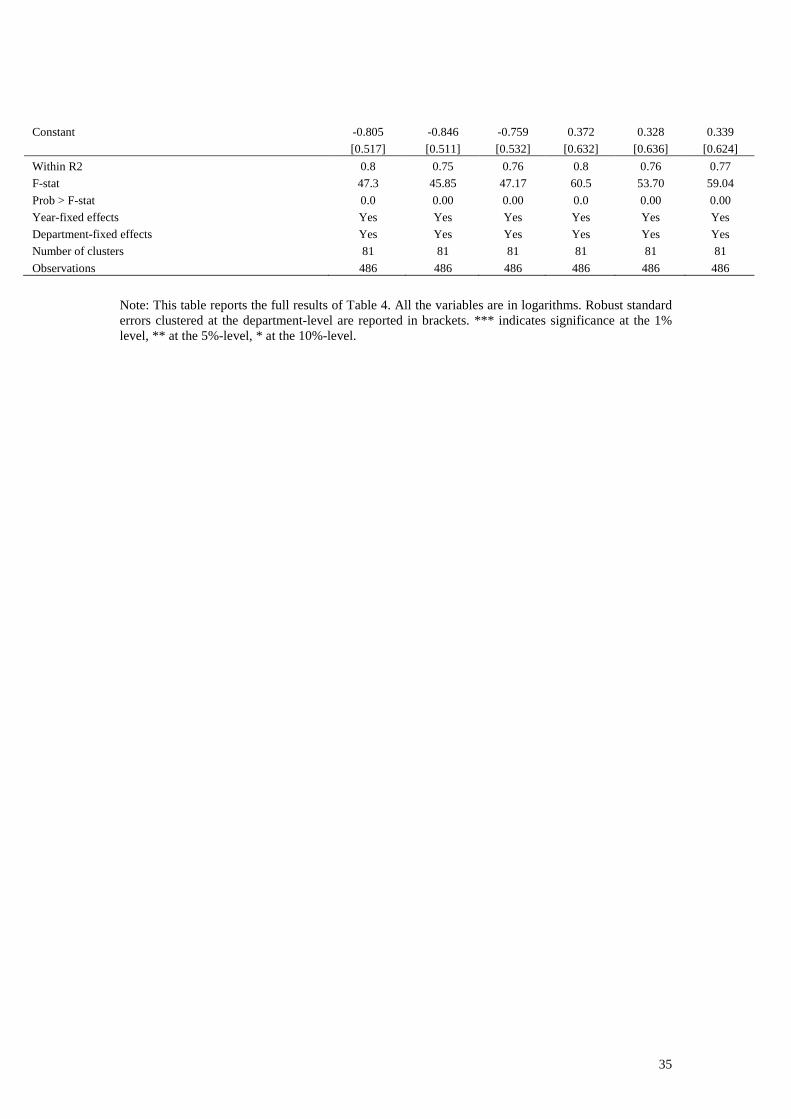
35
Constant -0.805 -0.846 -0.759 0.372 0.328 0.339
[0.517] [0.511] [0.532] [0.632] [0.636] [0.624]
Within R2 0.8 0.75 0.76 0.8 0.76 0.77
F-stat 47.3 45.85 47.17 60.5 53.70 59.04
Prob > F-stat 0.0 0.00 0.00 0.0 0.00 0.00
Year-fixed effects Yes Yes Yes Yes Yes Yes
Department-fixed effects Yes Yes Yes Yes Yes Yes
Number of clusters 81 81 81 81 81 81
Observations 486 486 486 486 486 486
Note: This table reports the full results of Table 4. All the variables are in logarithms. Robust standard errors clustered at the department-level are reported in brackets. *** indicates significance at the 1% level, ** at the 5%-level, * at the 10%-level.

36
Table 5: Determinants of the fertility decline in France – spatial regressions
(1) (2) (3) (4) OLS OLS IV IV
Dependent variable is Fertility(t) Emigrants' Residence Norm (t) 0.468*** 0.358*** 0.395*** 0.646***
[0.0964] [0.0996] [0.121] [0.168] Immigrants' Birthplace Norm (t) 0.0227 -0.134 0.807*** 0.233
[0.115] [0.0960] [0.196] [0.196] Emigrants' Residence Norm (t) * Share of Emigrants(t) -1.892*** -1.376** -1.892*** -2.859***
[0.492] [0.535] [0.616] [0.728] Immigrants' Birthplace Norm (t)* Share of Immigrants (t) 2.110** 2.572*** 0.337 0.850
[0.904] [0.760] [1.280] [0.693] Share of Emigrants (t) -3.098*** -1.826** -2.589*** -3.685***
[0.793] [0.803] [0.944] [1.086] Share of Immigrants (t) 3.993*** 4.482*** 1.272 1.772**
[1.223] [1.019] [1.844] [0.876] Life Expectancy Age 15 (t) 0.0122*** 0.00945***
[0.00205] [0.00230] Infant Mortality (t) 1.294*** 1.166***
[0.162] [0.177] Urban (t) 0.0119 0.307
[0.247] [0.216] Industries (t) -0.00808** -0.00420
[0.00373] [0.00321] Professionals (t) 0.0161** 0.00875
[0.00727] [0.00957] Female Education (t) -0.0353 -0.0125
[0.0336] [0.0346] Male Education (t) 0.0198 0.0412
[0.0395] [0.0439] Share of Girls in Primary Catholic Schools (t) 0.00104 0.0166
[0.0170] [0.0199] Share of Boys in Primary Catholic Schools (t) -0.00271 0.00471 [0.0157] [0.0145] ρ 2.630*** 2.492*** 1.030 1.703***
[0.302] [0.335] [0.629] [0.536] σ
2 0.00474*** 0.00337*** 0.00475*** 0.00330*** [0.000544] [0.000343] [0.000530] [0.000330]
Within R2 0.6 0.7 0.6 0.8 Log-pseudolikelihood 607.6 690.6 610.2 698.0 Year-fixed effects Yes Yes Yes Yes Département-fixed effects Yes Yes Yes Yes Number of clusters 81 81 81 81 Observations 486 486 486 486
Note: This table reports spatial autoregressive regressions with fixed effects using the xsmle Stata command (Belotti et al., 2013) for the regressions in Table 2. All the variables are in logarithms. Robust standard errors clustered at the department-level are reported in brackets. *** indicates significance at the 1% level, ** at the 5%-level, * at the 10%-level.
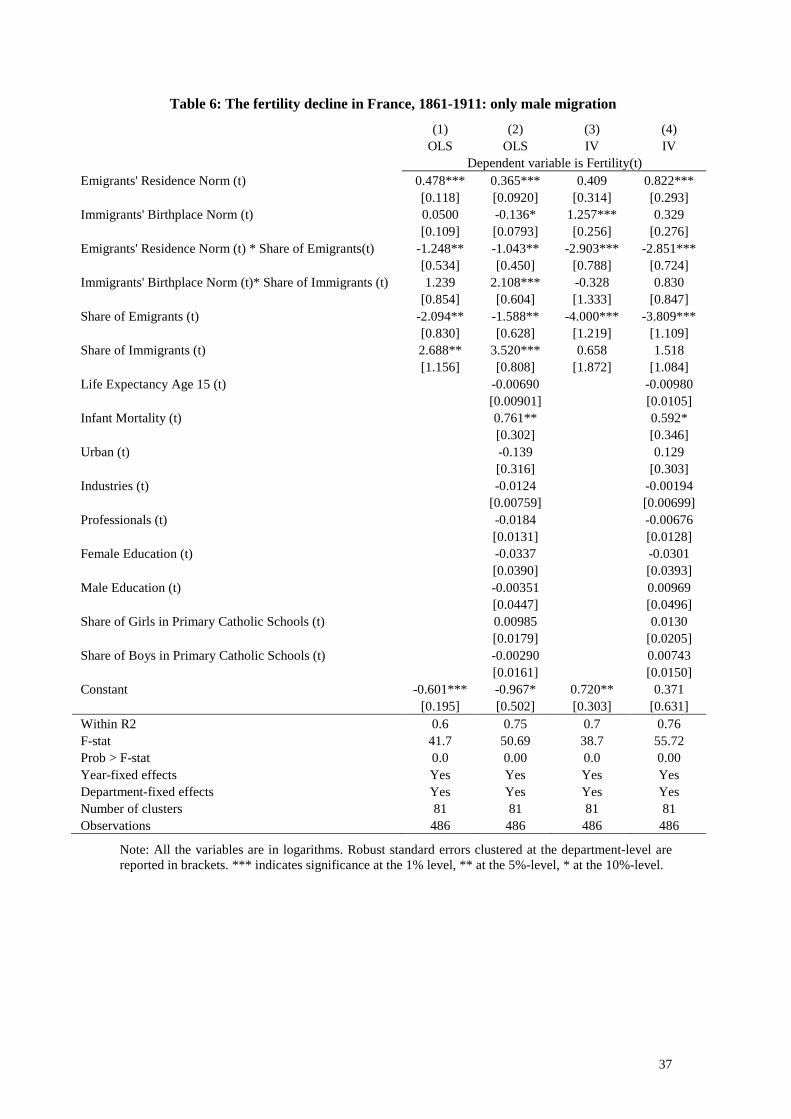
37
Table 6: The fertility decline in France, 1861-1911: only male migration
(1) (2) (3) (4) OLS OLS IV IV
Dependent variable is Fertility(t) Emigrants' Residence Norm (t) 0.478*** 0.365*** 0.409 0.822***
[0.118] [0.0920] [0.314] [0.293] Immigrants' Birthplace Norm (t) 0.0500 -0.136* 1.257*** 0.329
[0.109] [0.0793] [0.256] [0.276] Emigrants' Residence Norm (t) * Share of Emigrants(t) -1.248** -1.043** -2.903*** -2.851***
[0.534] [0.450] [0.788] [0.724] Immigrants' Birthplace Norm (t)* Share of Immigrants (t) 1.239 2.108*** -0.328 0.830
[0.854] [0.604] [1.333] [0.847] Share of Emigrants (t) -2.094** -1.588** -4.000*** -3.809***
[0.830] [0.628] [1.219] [1.109] Share of Immigrants (t) 2.688** 3.520*** 0.658 1.518
[1.156] [0.808] [1.872] [1.084] Life Expectancy Age 15 (t) -0.00690 -0.00980
[0.00901] [0.0105] Infant Mortality (t) 0.761** 0.592*
[0.302] [0.346] Urban (t) -0.139 0.129
[0.316] [0.303] Industries (t) -0.0124 -0.00194
[0.00759] [0.00699] Professionals (t) -0.0184 -0.00676
[0.0131] [0.0128] Female Education (t) -0.0337 -0.0301
[0.0390] [0.0393] Male Education (t) -0.00351 0.00969
[0.0447] [0.0496] Share of Girls in Primary Catholic Schools (t) 0.00985 0.0130
[0.0179] [0.0205] Share of Boys in Primary Catholic Schools (t) -0.00290 0.00743
[0.0161] [0.0150] Constant -0.601*** -0.967* 0.720** 0.371 [0.195] [0.502] [0.303] [0.631] Within R2 0.6 0.75 0.7 0.76 F-stat 41.7 50.69 38.7 55.72 Prob > F-stat 0.0 0.00 0.0 0.00 Year-fixed effects Yes Yes Yes Yes Department-fixed effects Yes Yes Yes Yes Number of clusters 81 81 81 81 Observations 486 486 486 486
Note: All the variables are in logarithms. Robust standard errors clustered at the department-level are reported in brackets. *** indicates significance at the 1% level, ** at the 5%-level, * at the 10%-level.
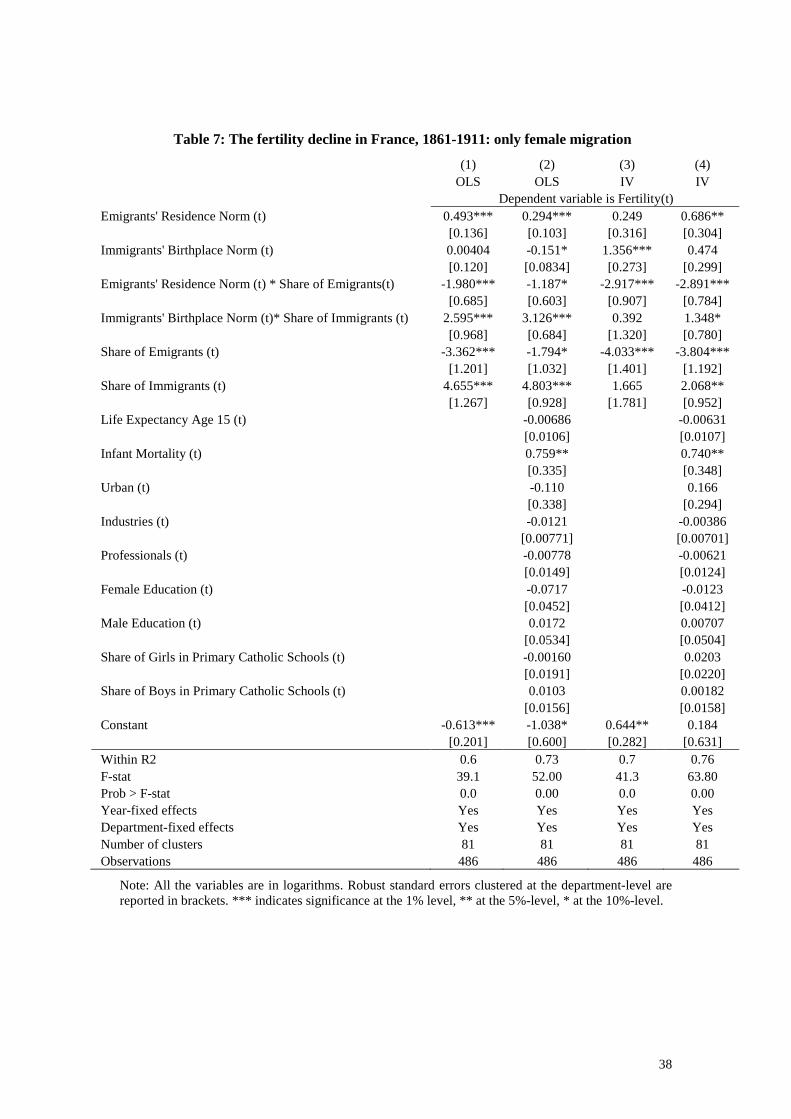
38
Table 7: The fertility decline in France, 1861-1911: only female migration
(1) (2) (3) (4) OLS OLS IV IV
Dependent variable is Fertility(t) Emigrants' Residence Norm (t) 0.493*** 0.294*** 0.249 0.686**
[0.136] [0.103] [0.316] [0.304] Immigrants' Birthplace Norm (t) 0.00404 -0.151* 1.356*** 0.474
[0.120] [0.0834] [0.273] [0.299] Emigrants' Residence Norm (t) * Share of Emigrants(t) -1.980*** -1.187* -2.917*** -2.891***
[0.685] [0.603] [0.907] [0.784] Immigrants' Birthplace Norm (t)* Share of Immigrants (t) 2.595*** 3.126*** 0.392 1.348*
[0.968] [0.684] [1.320] [0.780] Share of Emigrants (t) -3.362*** -1.794* -4.033*** -3.804***
[1.201] [1.032] [1.401] [1.192] Share of Immigrants (t) 4.655*** 4.803*** 1.665 2.068**
[1.267] [0.928] [1.781] [0.952] Life Expectancy Age 15 (t) -0.00686 -0.00631
[0.0106] [0.0107] Infant Mortality (t) 0.759** 0.740**
[0.335] [0.348] Urban (t) -0.110 0.166
[0.338] [0.294] Industries (t) -0.0121 -0.00386
[0.00771] [0.00701] Professionals (t) -0.00778 -0.00621
[0.0149] [0.0124] Female Education (t) -0.0717 -0.0123
[0.0452] [0.0412] Male Education (t) 0.0172 0.00707
[0.0534] [0.0504] Share of Girls in Primary Catholic Schools (t) -0.00160 0.0203
[0.0191] [0.0220] Share of Boys in Primary Catholic Schools (t) 0.0103 0.00182
[0.0156] [0.0158] Constant -0.613*** -1.038* 0.644** 0.184 [0.201] [0.600] [0.282] [0.631] Within R2 0.6 0.73 0.7 0.76 F-stat 39.1 52.00 41.3 63.80 Prob > F-stat 0.0 0.00 0.0 0.00 Year-fixed effects Yes Yes Yes Yes Department-fixed effects Yes Yes Yes Yes Number of clusters 81 81 81 81 Observations 486 486 486 486
Note: All the variables are in logarithms. Robust standard errors clustered at the department-level are reported in brackets. *** indicates significance at the 1% level, ** at the 5%-level, * at the 10%-level.

39
Table 8: The fertility decline in France, 1861-1911, excluding migration to and from Seine (Paris and suburbs)
(1) (2) (3) (4) OLS OLS IV IV
Dependent variable is Fertility(t) Emigrants' Residence Norm (t) 0.399*** 0.293*** 0.916** 0.467
[0.129] [0.105] [0.435] [0.406] Immigrants' Birthplace Norm (t) 0.0850 -0.162 0.545 0.499
[0.158] [0.112] [0.402] [0.371] Emigrants' Residence Norm (t) * Share of Emigrants(t) -0.557 -0.840 -2.521 -2.634*
[0.837] [0.654] [1.713] [1.520] Immigrants' Birthplace Norm (t)* Share of Immigrants (t) 2.337* 3.339*** 1.658 2.055*
[1.283] [0.878] [1.527] [1.156] Share of Emigrants (t) -1.172 -1.390 -3.574 -3.524
[1.321] [0.954] [2.670] [2.332] Share of Immigrants (t) 4.136** 5.102*** 3.875* 3.518**
[1.780] [1.241] [2.274] [1.737] Life Expectancy Age 15 (t) -0.00211 -0.00345
[0.00986] [0.0104] Infant Mortality (t) 0.864*** 0.755**
[0.320] [0.347] Urban (t) -0.146 -0.00232
[0.337] [0.340] Industries (t) -0.0118 -0.00541
[0.00796] [0.00807] Professionals (t) -0.0168 -0.0127
[0.0134] [0.0130] Female Education (t) -0.0489 -0.0184
[0.0423] [0.0420] Male Education (t) -0.00369 -0.000684
[0.0480] [0.0515] Share of Girls in Primary Catholic Schools (t) 0.00122 0.000856
[0.0188] [0.0202] Share of Boys in Primary Catholic Schools (t) 0.00403 0.0112
[0.0160] [0.0148] Constant -0.674*** -1.329** 0.449 -0.214 [0.236] [0.570] [0.407] [0.713] Within R2 0.6 0.74 0.7 0.75 F-stat 39.2 47.41 47.6 50.40 Prob > F-stat 0.0 0.00 0.0 0.00 Year-fixed effects Yes Yes Yes Yes Department-fixed effects Yes Yes Yes Yes Number of clusters 80 80 80 80 Observations 480 480 480 480
Note: All the variables are in logarithms. Robust standard errors clustered at the department-level are reported in brackets. *** indicates significance at the 1% level, ** at the 5%-level, * at the 10%-level.
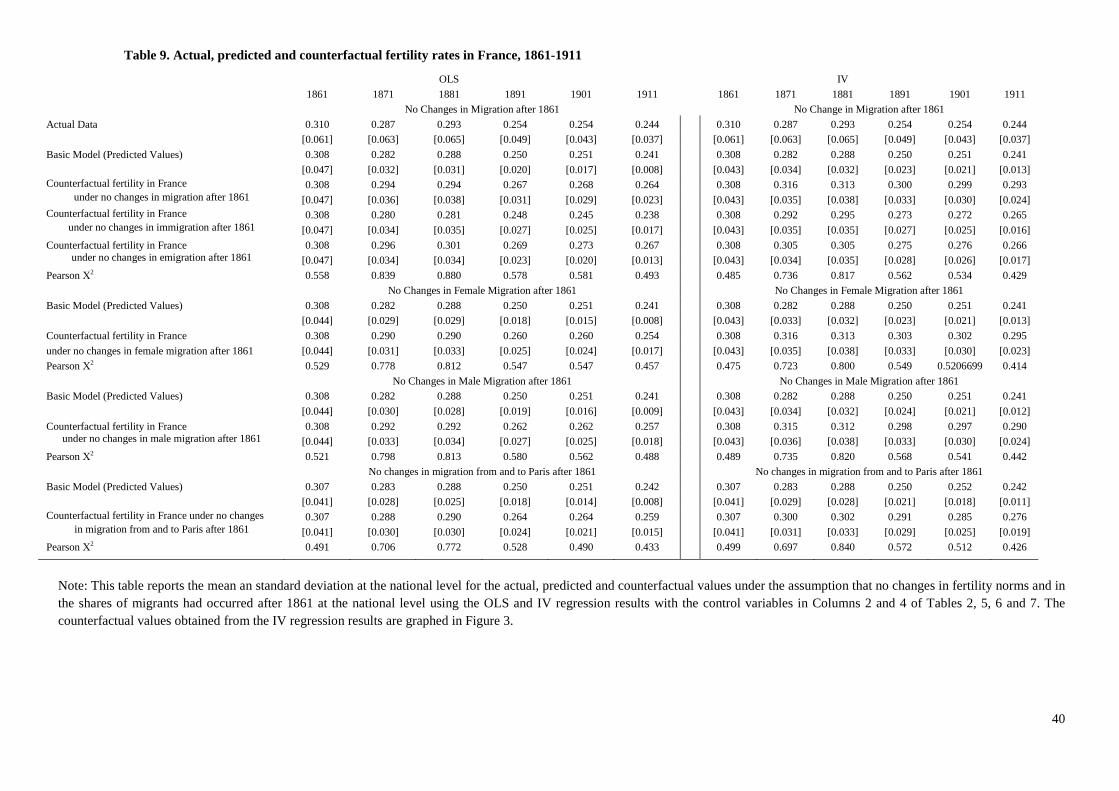
40
Table 9. Actual, predicted and counterfactual fertility rates in France, 1861-1911
OLS IV
1861 1871 1881 1891 1901 1911 1861 1871 1881 1891 1901 1911
No Changes in Migration after 1861 No Change in Migration after 1861
Actual Data 0.310 0.287 0.293 0.254 0.254 0.244 0.310 0.287 0.293 0.254 0.254 0.244
[0.061] [0.063] [0.065] [0.049] [0.043] [0.037] [0.061] [0.063] [0.065] [0.049] [0.043] [0.037]
Basic Model (Predicted Values) 0.308 0.282 0.288 0.250 0.251 0.241 0.308 0.282 0.288 0.250 0.251 0.241
[0.047] [0.032] [0.031] [0.020] [0.017] [0.008] [0.043] [0.034] [0.032] [0.023] [0.021] [0.013] Counterfactual fertility in France 0.308 0.294 0.294 0.267 0.268 0.264 0.308 0.316 0.313 0.300 0.299 0.293
under no changes in migration after 1861 [0.047] [0.036] [0.038] [0.031] [0.029] [0.023] [0.043] [0.035] [0.038] [0.033] [0.030] [0.024] Counterfactual fertility in France 0.308 0.280 0.281 0.248 0.245 0.238 0.308 0.292 0.295 0.273 0.272 0.265
under no changes in immigration after 1861 [0.047] [0.034] [0.035] [0.027] [0.025] [0.017] [0.043] [0.035] [0.035] [0.027] [0.025] [0.016]
Counterfactual fertility in France 0.308 0.296 0.301 0.269 0.273 0.267 0.308 0.305 0.305 0.275 0.276 0.266 under no changes in emigration after 1861 [0.047] [0.034] [0.034] [0.023] [0.020] [0.013] [0.043] [0.034] [0.035] [0.028] [0.026] [0.017]
Pearson Χ2 0.558 0.839 0.880 0.578 0.581 0.493 0.485 0.736 0.817 0.562 0.534 0.429
No Changes in Female Migration after 1861 No Changes in Female Migration after 1861
Basic Model (Predicted Values) 0.308 0.282 0.288 0.250 0.251 0.241 0.308 0.282 0.288 0.250 0.251 0.241
[0.044] [0.029] [0.029] [0.018] [0.015] [0.008] [0.043] [0.033] [0.032] [0.023] [0.021] [0.013]
Counterfactual fertility in France 0.308 0.290 0.290 0.260 0.260 0.254 0.308 0.316 0.313 0.303 0.302 0.295
under no changes in female migration after 1861 [0.044] [0.031] [0.033] [0.025] [0.024] [0.017] [0.043] [0.035] [0.038] [0.033] [0.030] [0.023]
Pearson Χ2 0.529 0.778 0.812 0.547 0.547 0.457 0.475 0.723 0.800 0.549 0.5206699 0.414
No Changes in Male Migration after 1861 No Changes in Male Migration after 1861
Basic Model (Predicted Values) 0.308 0.282 0.288 0.250 0.251 0.241 0.308 0.282 0.288 0.250 0.251 0.241
[0.044] [0.030] [0.028] [0.019] [0.016] [0.009] [0.043] [0.034] [0.032] [0.024] [0.021] [0.012]
Counterfactual fertility in France 0.308 0.292 0.292 0.262 0.262 0.257 0.308 0.315 0.312 0.298 0.297 0.290 under no changes in male migration after 1861 [0.044] [0.033] [0.034] [0.027] [0.025] [0.018] [0.043] [0.036] [0.038] [0.033] [0.030] [0.024]
Pearson Χ2 0.521 0.798 0.813 0.580 0.562 0.488 0.489 0.735 0.820 0.568 0.541 0.442
No changes in migration from and to Paris after 1861 No changes in migration from and to Paris after 1861
Basic Model (Predicted Values) 0.307 0.283 0.288 0.250 0.251 0.242 0.307 0.283 0.288 0.250 0.252 0.242
[0.041] [0.028] [0.025] [0.018] [0.014] [0.008] [0.041] [0.029] [0.028] [0.021] [0.018] [0.011] Counterfactual fertility in France under no changes 0.307 0.288 0.290 0.264 0.264 0.259 0.307 0.300 0.302 0.291 0.285 0.276
in migration from and to Paris after 1861 [0.041] [0.030] [0.030] [0.024] [0.021] [0.015] [0.041] [0.031] [0.033] [0.029] [0.025] [0.019]
Pearson Χ2 0.491 0.706 0.772 0.528 0.490 0.433 0.499 0.697 0.840 0.572 0.512 0.426
Note: This table reports the mean an standard deviation at the national level for the actual, predicted and counterfactual values under the assumption that no changes in fertility norms and in the shares of migrants had occurred after 1861 at the national level using the OLS and IV regression results with the control variables in Columns 2 and 4 of Tables 2, 5, 6 and 7. The counterfactual values obtained from the IV regression results are graphed in Figure 3.
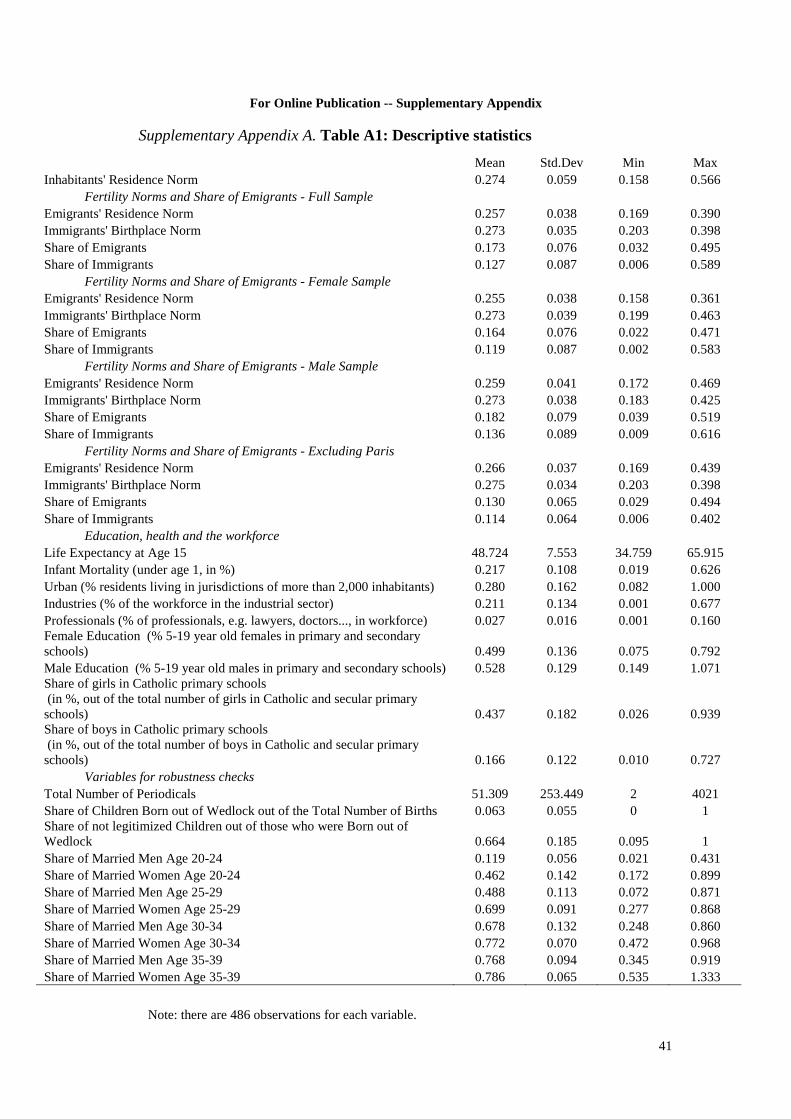
41
For Online Publication -- Supplementary Appendix
Supplementary Appendix A. Table A1: Descriptive statistics
Mean Std.Dev Min Max Inhabitants' Residence Norm 0.274 0.059 0.158 0.566
Fertility Norms and Share of Emigrants - Full Sample Emigrants' Residence Norm 0.257 0.038 0.169 0.390 Immigrants' Birthplace Norm 0.273 0.035 0.203 0.398 Share of Emigrants 0.173 0.076 0.032 0.495 Share of Immigrants 0.127 0.087 0.006 0.589
Fertility Norms and Share of Emigrants - Female Sample Emigrants' Residence Norm 0.255 0.038 0.158 0.361 Immigrants' Birthplace Norm 0.273 0.039 0.199 0.463 Share of Emigrants 0.164 0.076 0.022 0.471 Share of Immigrants 0.119 0.087 0.002 0.583
Fertility Norms and Share of Emigrants - Male Sample Emigrants' Residence Norm 0.259 0.041 0.172 0.469 Immigrants' Birthplace Norm 0.273 0.038 0.183 0.425 Share of Emigrants 0.182 0.079 0.039 0.519 Share of Immigrants 0.136 0.089 0.009 0.616
Fertility Norms and Share of Emigrants - Excluding Paris Emigrants' Residence Norm 0.266 0.037 0.169 0.439 Immigrants' Birthplace Norm 0.275 0.034 0.203 0.398 Share of Emigrants 0.130 0.065 0.029 0.494 Share of Immigrants 0.114 0.064 0.006 0.402
Education, health and the workforce Life Expectancy at Age 15 48.724 7.553 34.759 65.915 Infant Mortality (under age 1, in %) 0.217 0.108 0.019 0.626 Urban (% residents living in jurisdictions of more than 2,000 inhabitants) 0.280 0.162 0.082 1.000 Industries (% of the workforce in the industrial sector) 0.211 0.134 0.001 0.677 Professionals (% of professionals, e.g. lawyers, doctors..., in workforce) 0.027 0.016 0.001 0.160 Female Education (% 5-19 year old females in primary and secondary schools) 0.499 0.136 0.075 0.792 Male Education (% 5-19 year old males in primary and secondary schools) 0.528 0.129 0.149 1.071 Share of girls in Catholic primary schools (in %, out of the total number of girls in Catholic and secular primary schools) 0.437 0.182 0.026 0.939 Share of boys in Catholic primary schools (in %, out of the total number of boys in Catholic and secular primary schools) 0.166 0.122 0.010 0.727
Variables for robustness checks Total Number of Periodicals 51.309 253.449 2 4021 Share of Children Born out of Wedlock out of the Total Number of Births 0.063 0.055 0 1 Share of not legitimized Children out of those who were Born out of Wedlock 0.664 0.185 0.095 1 Share of Married Men Age 20-24 0.119 0.056 0.021 0.431 Share of Married Women Age 20-24 0.462 0.142 0.172 0.899 Share of Married Men Age 25-29 0.488 0.113 0.072 0.871 Share of Married Women Age 25-29 0.699 0.091 0.277 0.868 Share of Married Men Age 30-34 0.678 0.132 0.248 0.860 Share of Married Women Age 30-34 0.772 0.070 0.472 0.968 Share of Married Men Age 35-39 0.768 0.094 0.345 0.919 Share of Married Women Age 35-39 0.786 0.065 0.535 1.333
Note: there are 486 observations for each variable.
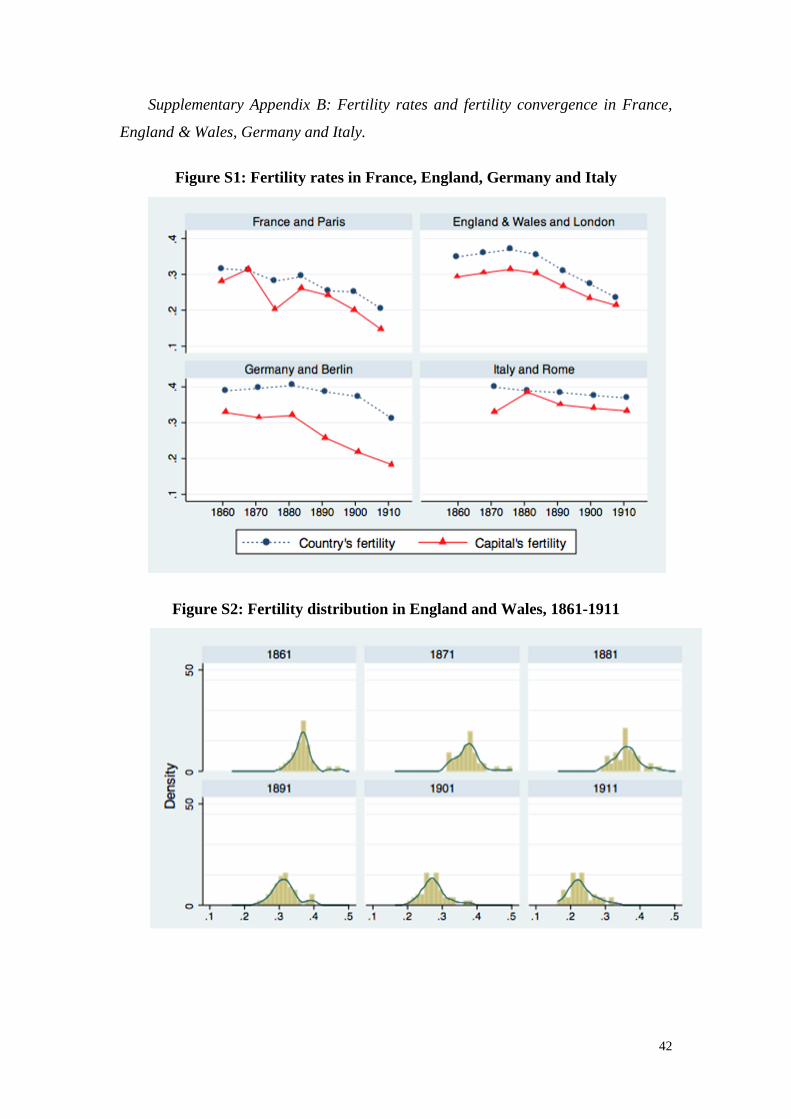
42
Supplementary Appendix B: Fertility rates and fertility convergence in France,
England & Wales, Germany and Italy.
Figure S1: Fertility rates in France, England, Germany and Italy
Figure S2: Fertility distribution in England and Wa les, 1861-1911
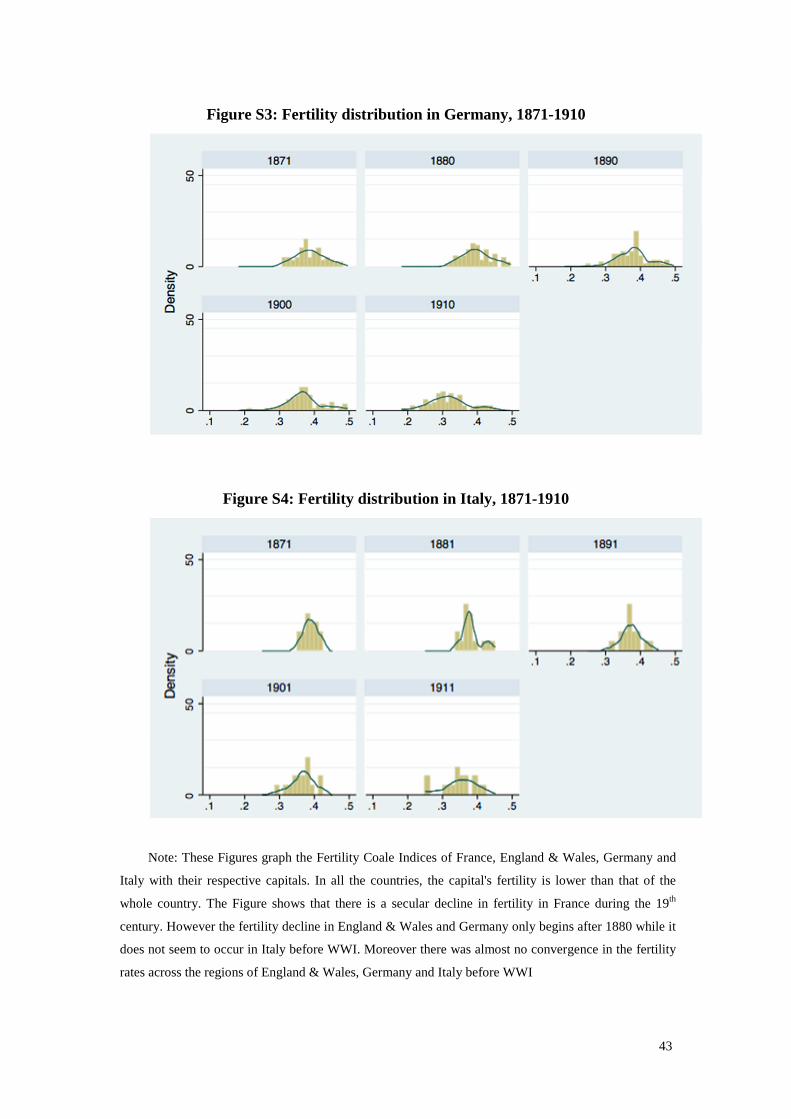
43
Figure S3: Fertility distribution in Germany, 1871-1910
Figure S4: Fertility distribution in Italy, 1871-1910
Note: These Figures graph the Fertility Coale Indices of France, England & Wales, Germany and
Italy with their respective capitals. In all the countries, the capital's fertility is lower than that of the
whole country. The Figure shows that there is a secular decline in fertility in France during the 19th
century. However the fertility decline in England & Wales and Germany only begins after 1880 while it
does not seem to occur in Italy before WWI. Moreover there was almost no convergence in the fertility
rates across the regions of England & Wales, Germany and Italy before WWI
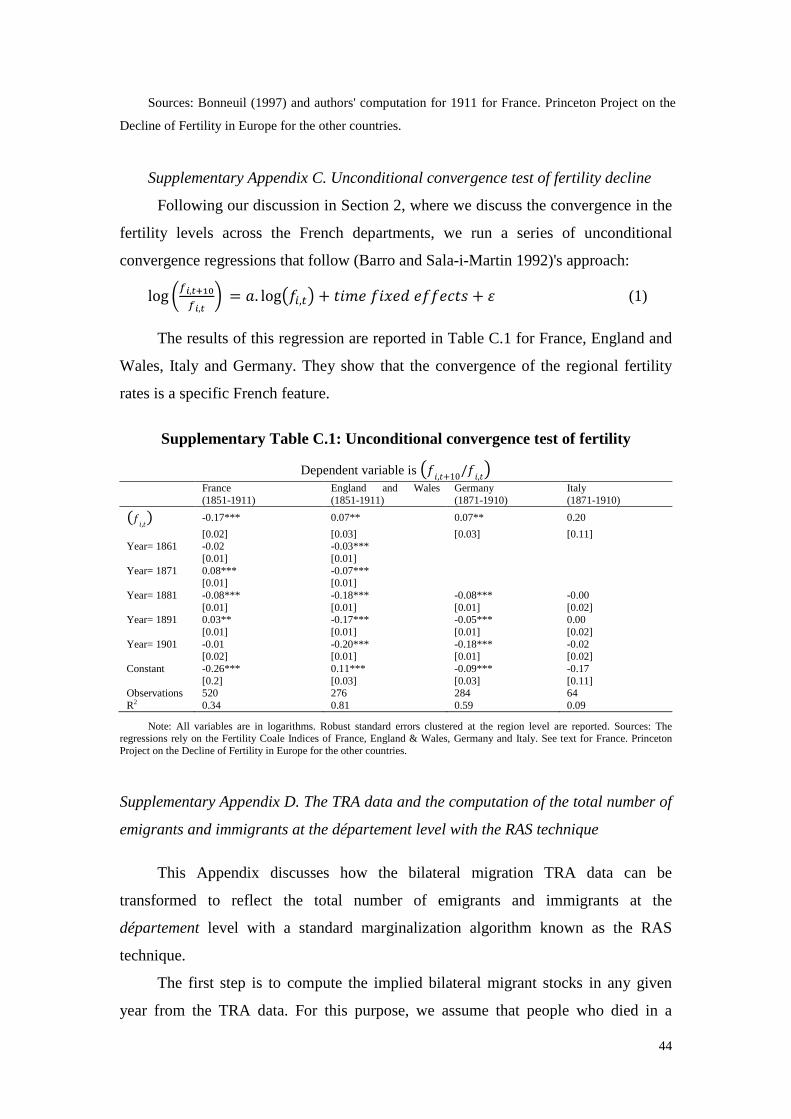
44
Sources: Bonneuil (1997) and authors' computation for 1911 for France. Princeton Project on the
Decline of Fertility in Europe for the other countries.
Supplementary Appendix C. Unconditional convergence test of fertility decline
Following our discussion in Section 2, where we discuss the convergence in the
fertility levels across the French departments, we run a series of unconditional
convergence regressions that follow (Barro and Sala-i-Martin 1992)'s approach:
log KLM,NOPQLM,N R = �. log���,�� + ��#"��S"@"��":�8 + 0 (1)
The results of this regression are reported in Table C.1 for France, England and
Wales, Italy and Germany. They show that the convergence of the regional fertility
rates is a specific French feature.
Supplementary Table C.1: Unconditional convergence test of fertility
Dependent variable is ���,�+10/��,�� France
(1851-1911) England and Wales (1851-1911)
Germany (1871-1910)
Italy (1871-1910)
(��,�) -0.17*** 0.07** 0.07** 0.20
[0.02] [0.03] [0.03] [0.11] Year= 1861 -0.02 -0.03*** [0.01] [0.01] Year= 1871 0.08*** -0.07*** [0.01] [0.01] Year= 1881 -0.08*** -0.18*** -0.08*** -0.00 [0.01] [0.01] [0.01] [0.02] Year= 1891 0.03** -0.17*** -0.05*** 0.00 [0.01] [0.01] [0.01] [0.02] Year= 1901 -0.01 -0.20*** -0.18*** -0.02 [0.02] [0.01] [0.01] [0.02] Constant -0.26*** 0.11*** -0.09*** -0.17 [0.2] [0.03] [0.03] [0.11] Observations 520 276 284 64 R2 0.34 0.81 0.59 0.09
Note: All variables are in logarithms. Robust standard errors clustered at the region level are reported. Sources: The regressions rely on the Fertility Coale Indices of France, England & Wales, Germany and Italy. See text for France. Princeton Project on the Decline of Fertility in Europe for the other countries.
Supplementary Appendix D. The TRA data and the computation of the total number of
emigrants and immigrants at the département level with the RAS technique
This Appendix discusses how the bilateral migration TRA data can be
transformed to reflect the total number of emigrants and immigrants at the
département level with a standard marginalization algorithm known as the RAS
technique.
The first step is to compute the implied bilateral migrant stocks in any given
year from the TRA data. For this purpose, we assume that people who died in a
45
different département from their birth département migrated at age 20.29 This
provides us with #�2,�VWX which is the number of migrants from département i living in
département j in each year t (with t=1861, 1872, 1881, 1891, 1901 and 1911) in the
TRA dataset.
The second step is to gather the number of domestic immigrants and emigrants
from each département from the census. These data are published in the 1891, 1901
and 1911 issues of the French census. In the issues of the census published in 1861,
1872 and 1881, the number of immigrants is given as the number of individuals in
each département who were born in another département. We can then compute the
number of emigrants using information on birth rates, mortality rates, the number of
inhabitants and the number of emigrants published in the next issue of the census.30
This provides us with #�.,�YZ[\]\ and #.2,�YZ[\]\which are respectively the total number
domestic emigrants from each département i and immigrants in each département j
for each year.
Our third stage is to transform the TRA dataset so as to obtain a matrix which is
defined by the margins coming from the census and the odds ratios (the ratio between,
for example, the odds of an immigrant in département A to be an emigrant from
département B instead of being from C and the odds of an immigrant in département
D to be an emigrant from département B instead of being from C) coming from the
TRA (See (Smith 1976), p. 672-3). For this purpose, we apply a marginal
standardization algorithm known as the RAS technique (see (Smith 1976) and (Cox
2006)'s software).31 This is meant to reconcile the bilateral matrix composed of
#�2,�VWXwith its margins composed of #�.,�YZ[\]\ and #.2,�YZ[\]\, or find the #�2,�WX^ such as
∑ #�2,�WX^� = #.2,�YZ[\]\ and ∑ #�2,�WX^2 = #�.,�YZ[\]\ and #�2,�WX^is “close” to #�2,�VWX. The
algorithm works by multiplying by a scalar alternatively the lines and the columns of
the matrix so that ∑ #�2,��N_��Z`a��b[� =#.2,�YZ[\]\ or ∑ #�2,��N_��Z`a��b[2 =#�.,�YZ[\]\. This
goes on till the sums of both the lines and column are nearly equal to the pre-defined
margins.
29 This assumption is based on computations of thecourse an approximation. Using net positive migration rates by age using data from (Bonneuil 1997), we computed that the mean age at migration was 19.4 years in 1861, 18.6 in 1872, 22.5 in 1881 and, 21.4 in 1891. 30 For simplicity we ignore emigration to foreign countries – which was anyway small - and the small number of emigrants from Alsace-Lorraine (which was seized by Germany after 1871) by assuming they were a fixed proportion of emigrants in each département throughout the country. 31 This procedure is also known as biproportional matrices, iterative proportional fitting or raking.
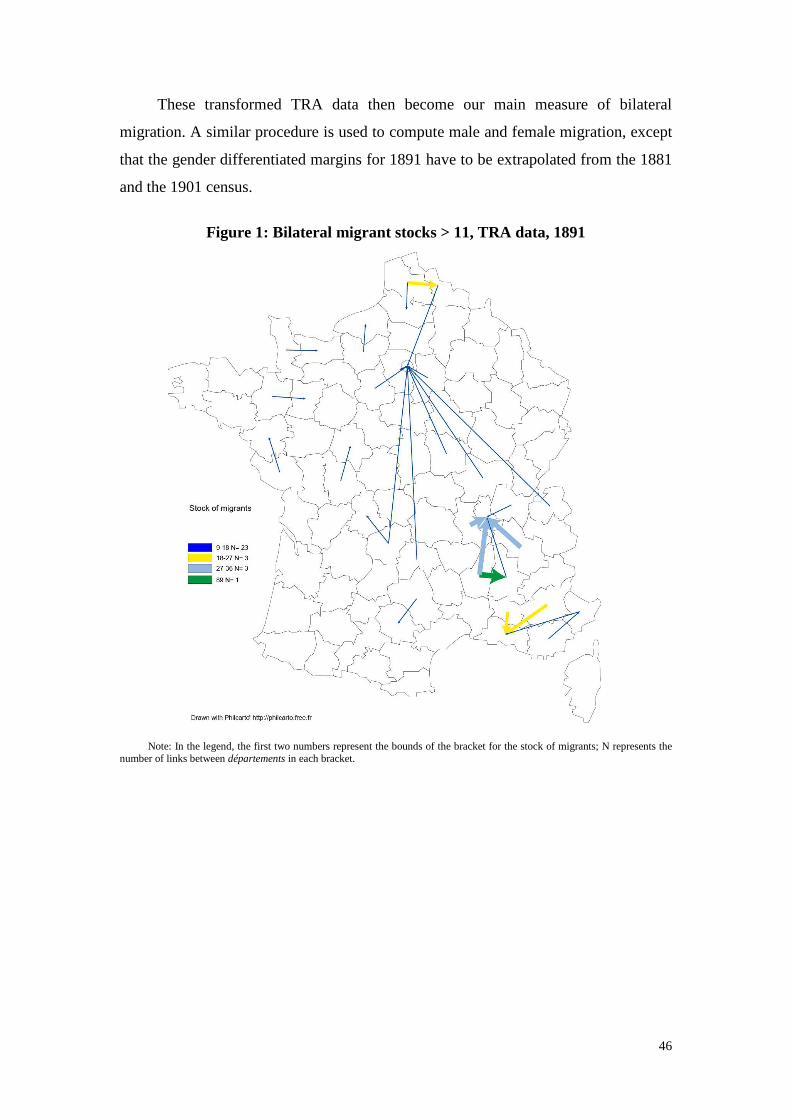
46
These transformed TRA data then become our main measure of bilateral
migration. A similar procedure is used to compute male and female migration, except
that the gender differentiated margins for 1891 have to be extrapolated from the 1881
and the 1901 census.
Figure 1: Bilateral migrant stocks > 11, TRA data, 1891
Note: In the legend, the first two numbers represent the bounds of the bracket for the stock of migrants; N represents the number of links between départements in each bracket.
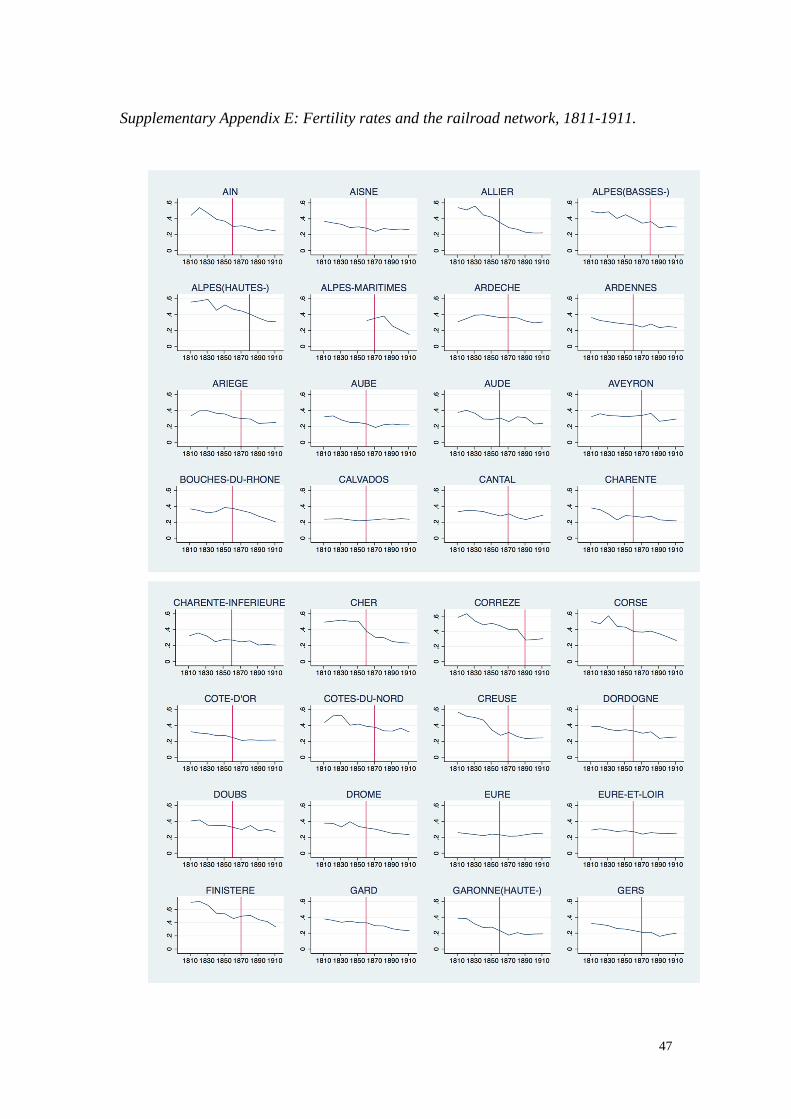
47
Supplementary Appendix E: Fertility rates and the railroad network, 1811-1911.
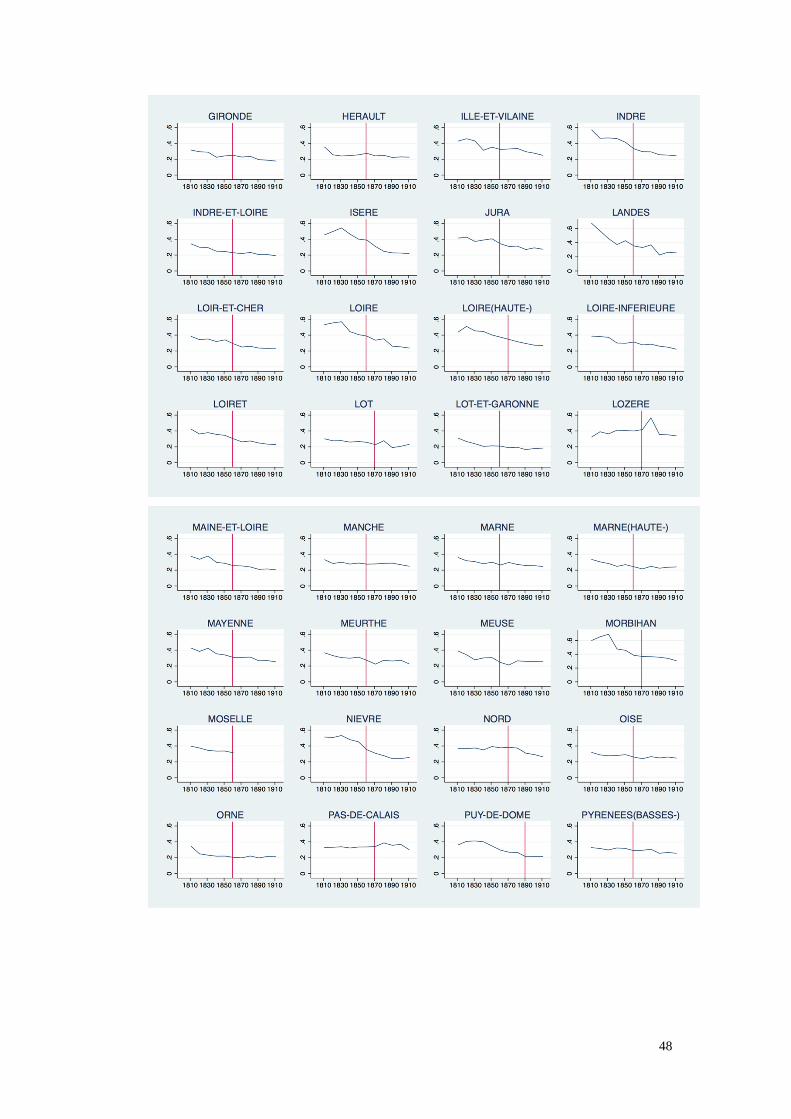
48

49
Note: The line corresponds to the year when the département was linked to Paris via the railroad network.
Source: For the Fertility Coale Index, see the text. See (Caron 1997) for the railroad network.
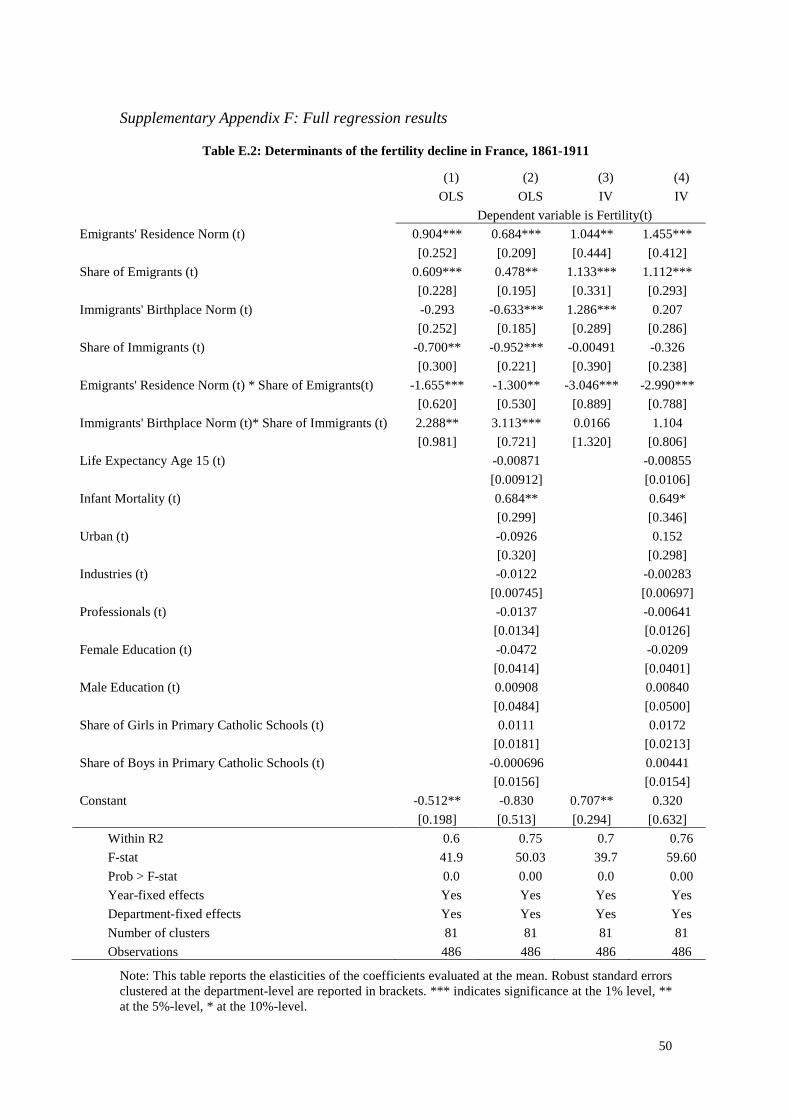
50
Supplementary Appendix F: Full regression results
Table E.2: Determinants of the fertility decline in France, 1861-1911
(1) (2) (3) (4)
OLS OLS IV IV
Dependent variable is Fertility(t)
Emigrants' Residence Norm (t) 0.904*** 0.684*** 1.044** 1.455***
[0.252] [0.209] [0.444] [0.412]
Share of Emigrants (t) 0.609*** 0.478** 1.133*** 1.112***
[0.228] [0.195] [0.331] [0.293]
Immigrants' Birthplace Norm (t) -0.293 -0.633*** 1.286*** 0.207
[0.252] [0.185] [0.289] [0.286]
Share of Immigrants (t) -0.700** -0.952*** -0.00491 -0.326
[0.300] [0.221] [0.390] [0.238]
Emigrants' Residence Norm (t) * Share of Emigrants(t) -1.655*** -1.300** -3.046*** -2.990***
[0.620] [0.530] [0.889] [0.788]
Immigrants' Birthplace Norm (t)* Share of Immigrants (t) 2.288** 3.113*** 0.0166 1.104
[0.981] [0.721] [1.320] [0.806]
Life Expectancy Age 15 (t) -0.00871 -0.00855
[0.00912] [0.0106]
Infant Mortality (t) 0.684** 0.649*
[0.299] [0.346]
Urban (t) -0.0926 0.152
[0.320] [0.298]
Industries (t) -0.0122 -0.00283
[0.00745] [0.00697]
Professionals (t) -0.0137 -0.00641
[0.0134] [0.0126]
Female Education (t) -0.0472 -0.0209
[0.0414] [0.0401]
Male Education (t) 0.00908 0.00840
[0.0484] [0.0500]
Share of Girls in Primary Catholic Schools (t) 0.0111 0.0172
[0.0181] [0.0213]
Share of Boys in Primary Catholic Schools (t) -0.000696 0.00441
[0.0156] [0.0154]
Constant -0.512** -0.830 0.707** 0.320
[0.198] [0.513] [0.294] [0.632]
Within R2 0.6 0.75 0.7 0.76
F-stat 41.9 50.03 39.7 59.60
Prob > F-stat 0.0 0.00 0.0 0.00
Year-fixed effects Yes Yes Yes Yes
Department-fixed effects Yes Yes Yes Yes
Number of clusters 81 81 81 81
Observations 486 486 486 486
Note: This table reports the elasticities of the coefficients evaluated at the mean. Robust standard errors clustered at the department-level are reported in brackets. *** indicates significance at the 1% level, ** at the 5%-level, * at the 10%-level.
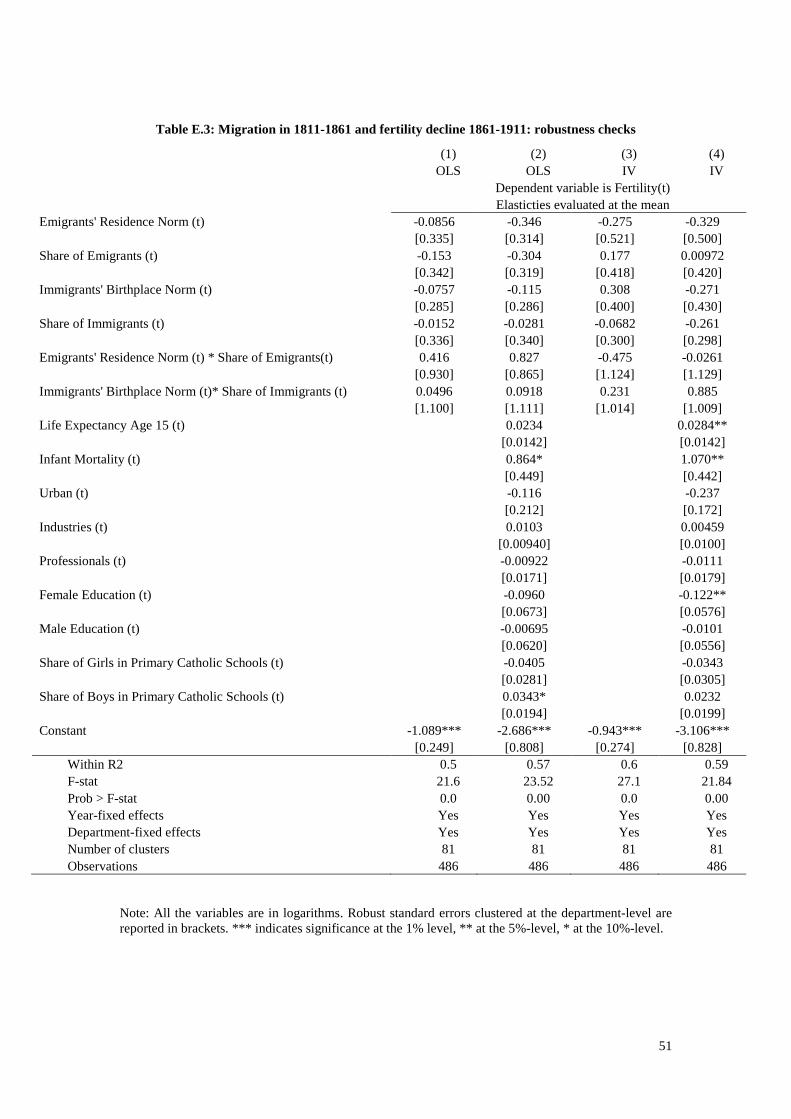
51
Table E.3: Migration in 1811-1861 and fertility decline 1861-1911: robustness checks
(1) (2) (3) (4) OLS OLS IV IV
Dependent variable is Fertility(t) Elasticties evaluated at the mean
Emigrants' Residence Norm (t) -0.0856 -0.346 -0.275 -0.329 [0.335] [0.314] [0.521] [0.500]
Share of Emigrants (t) -0.153 -0.304 0.177 0.00972 [0.342] [0.319] [0.418] [0.420]
Immigrants' Birthplace Norm (t) -0.0757 -0.115 0.308 -0.271 [0.285] [0.286] [0.400] [0.430]
Share of Immigrants (t) -0.0152 -0.0281 -0.0682 -0.261 [0.336] [0.340] [0.300] [0.298]
Emigrants' Residence Norm (t) * Share of Emigrants(t) 0.416 0.827 -0.475 -0.0261 [0.930] [0.865] [1.124] [1.129]
Immigrants' Birthplace Norm (t)* Share of Immigrants (t) 0.0496 0.0918 0.231 0.885 [1.100] [1.111] [1.014] [1.009]
Life Expectancy Age 15 (t) 0.0234 0.0284** [0.0142] [0.0142]
Infant Mortality (t) 0.864* 1.070** [0.449] [0.442]
Urban (t) -0.116 -0.237 [0.212] [0.172]
Industries (t) 0.0103 0.00459 [0.00940] [0.0100]
Professionals (t) -0.00922 -0.0111 [0.0171] [0.0179]
Female Education (t) -0.0960 -0.122** [0.0673] [0.0576]
Male Education (t) -0.00695 -0.0101 [0.0620] [0.0556]
Share of Girls in Primary Catholic Schools (t) -0.0405 -0.0343 [0.0281] [0.0305]
Share of Boys in Primary Catholic Schools (t) 0.0343* 0.0232 [0.0194] [0.0199]
Constant -1.089*** -2.686*** -0.943*** -3.106*** [0.249] [0.808] [0.274] [0.828]
Within R2 0.5 0.57 0.6 0.59 F-stat 21.6 23.52 27.1 21.84 Prob > F-stat 0.0 0.00 0.0 0.00 Year-fixed effects Yes Yes Yes Yes Department-fixed effects Yes Yes Yes Yes Number of clusters 81 81 81 81 Observations 486 486 486 486
Note: All the variables are in logarithms. Robust standard errors clustered at the department-level are reported in brackets. *** indicates significance at the 1% level, ** at the 5%-level, * at the 10%-level.
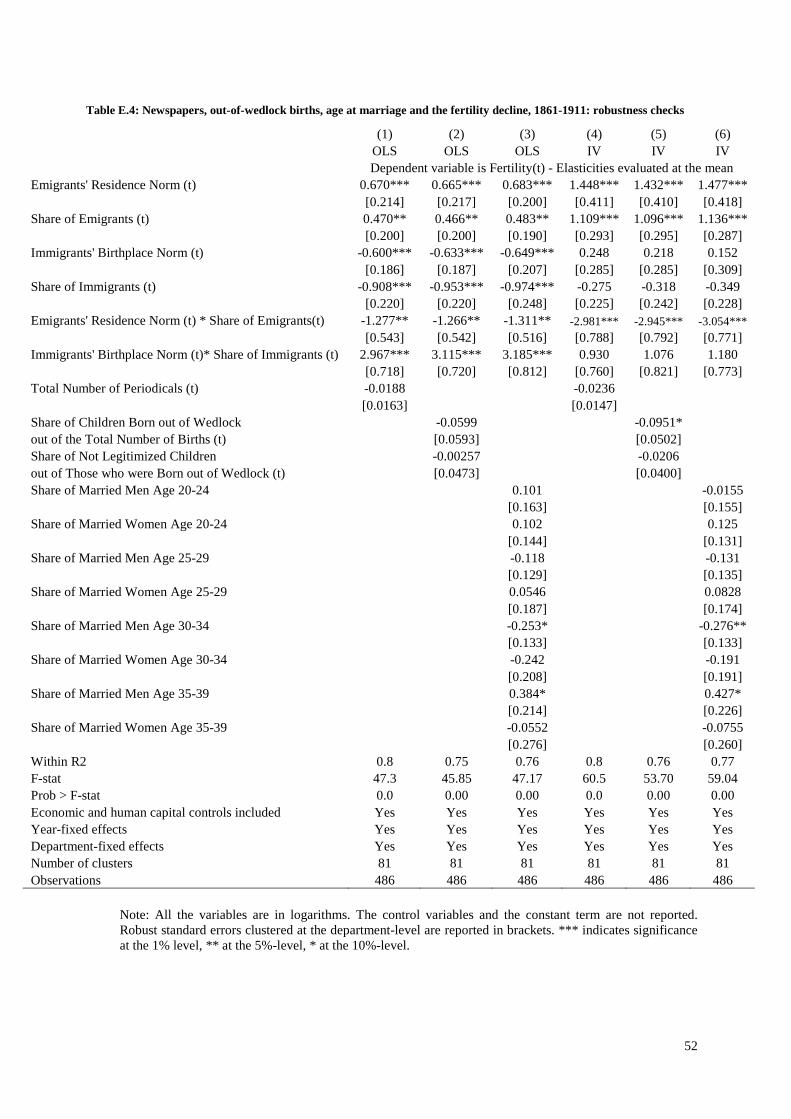
52
Table E.4: Newspapers, out-of-wedlock births, age at marriage and the fertility decline, 1861-1911: robustness checks
(1) (2) (3) (4) (5) (6) OLS OLS OLS IV IV IV Dependent variable is Fertility(t) - Elasticities evaluated at the mean
Emigrants' Residence Norm (t) 0.670*** 0.665*** 0.683*** 1.448*** 1.432*** 1.477*** [0.214] [0.217] [0.200] [0.411] [0.410] [0.418]
Share of Emigrants (t) 0.470** 0.466** 0.483** 1.109*** 1.096*** 1.136*** [0.200] [0.200] [0.190] [0.293] [0.295] [0.287]
Immigrants' Birthplace Norm (t) -0.600*** -0.633*** -0.649*** 0.248 0.218 0.152 [0.186] [0.187] [0.207] [0.285] [0.285] [0.309]
Share of Immigrants (t) -0.908*** -0.953*** -0.974*** -0.275 -0.318 -0.349 [0.220] [0.220] [0.248] [0.225] [0.242] [0.228]
Emigrants' Residence Norm (t) * Share of Emigrants(t) -1.277** -1.266** -1.311** -2.981*** -2.945*** -3.054*** [0.543] [0.542] [0.516] [0.788] [0.792] [0.771]
Immigrants' Birthplace Norm (t)* Share of Immigrants (t) 2.967*** 3.115*** 3.185*** 0.930 1.076 1.180 [0.718] [0.720] [0.812] [0.760] [0.821] [0.773]
Total Number of Periodicals (t) -0.0188 -0.0236 [0.0163] [0.0147]
Share of Children Born out of Wedlock -0.0599 -0.0951* out of the Total Number of Births (t) [0.0593] [0.0502] Share of Not Legitimized Children -0.00257 -0.0206 out of Those who were Born out of Wedlock (t) [0.0473] [0.0400] Share of Married Men Age 20-24 0.101 -0.0155
[0.163] [0.155] Share of Married Women Age 20-24 0.102 0.125
[0.144] [0.131] Share of Married Men Age 25-29 -0.118 -0.131
[0.129] [0.135] Share of Married Women Age 25-29 0.0546 0.0828
[0.187] [0.174] Share of Married Men Age 30-34 -0.253* -0.276**
[0.133] [0.133] Share of Married Women Age 30-34 -0.242 -0.191
[0.208] [0.191] Share of Married Men Age 35-39 0.384* 0.427*
[0.214] [0.226] Share of Married Women Age 35-39 -0.0552 -0.0755
[0.276] [0.260] Within R2 0.8 0.75 0.76 0.8 0.76 0.77 F-stat 47.3 45.85 47.17 60.5 53.70 59.04 Prob > F-stat 0.0 0.00 0.00 0.0 0.00 0.00 Economic and human capital controls included Yes Yes Yes Yes Yes Yes Year-fixed effects Yes Yes Yes Yes Yes Yes Department-fixed effects Yes Yes Yes Yes Yes Yes Number of clusters 81 81 81 81 81 81 Observations 486 486 486 486 486 486
Note: All the variables are in logarithms. The control variables and the constant term are not reported. Robust standard errors clustered at the department-level are reported in brackets. *** indicates significance at the 1% level, ** at the 5%-level, * at the 10%-level.
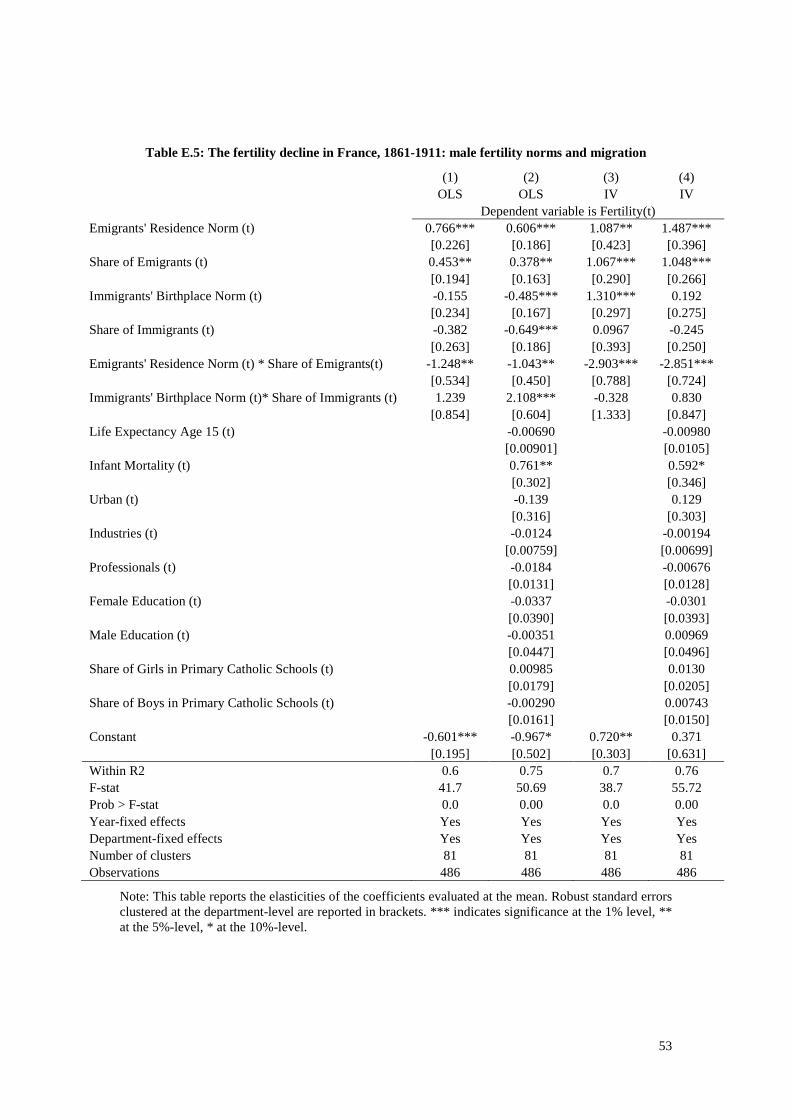
53
Table E.5: The fertility decline in France, 1861-1911: male fertility norms and migration
(1) (2) (3) (4) OLS OLS IV IV
Dependent variable is Fertility(t) Emigrants' Residence Norm (t) 0.766*** 0.606*** 1.087** 1.487***
[0.226] [0.186] [0.423] [0.396] Share of Emigrants (t) 0.453** 0.378** 1.067*** 1.048***
[0.194] [0.163] [0.290] [0.266] Immigrants' Birthplace Norm (t) -0.155 -0.485*** 1.310*** 0.192
[0.234] [0.167] [0.297] [0.275] Share of Immigrants (t) -0.382 -0.649*** 0.0967 -0.245
[0.263] [0.186] [0.393] [0.250] Emigrants' Residence Norm (t) * Share of Emigrants(t) -1.248** -1.043** -2.903*** -2.851***
[0.534] [0.450] [0.788] [0.724] Immigrants' Birthplace Norm (t)* Share of Immigrants (t) 1.239 2.108*** -0.328 0.830
[0.854] [0.604] [1.333] [0.847] Life Expectancy Age 15 (t) -0.00690 -0.00980
[0.00901] [0.0105] Infant Mortality (t) 0.761** 0.592*
[0.302] [0.346] Urban (t) -0.139 0.129
[0.316] [0.303] Industries (t) -0.0124 -0.00194
[0.00759] [0.00699] Professionals (t) -0.0184 -0.00676
[0.0131] [0.0128] Female Education (t) -0.0337 -0.0301
[0.0390] [0.0393] Male Education (t) -0.00351 0.00969
[0.0447] [0.0496] Share of Girls in Primary Catholic Schools (t) 0.00985 0.0130
[0.0179] [0.0205] Share of Boys in Primary Catholic Schools (t) -0.00290 0.00743
[0.0161] [0.0150] Constant -0.601*** -0.967* 0.720** 0.371 [0.195] [0.502] [0.303] [0.631] Within R2 0.6 0.75 0.7 0.76 F-stat 41.7 50.69 38.7 55.72 Prob > F-stat 0.0 0.00 0.0 0.00 Year-fixed effects Yes Yes Yes Yes Department-fixed effects Yes Yes Yes Yes Number of clusters 81 81 81 81 Observations 486 486 486 486
Note: This table reports the elasticities of the coefficients evaluated at the mean. Robust standard errors clustered at the department-level are reported in brackets. *** indicates significance at the 1% level, ** at the 5%-level, * at the 10%-level.
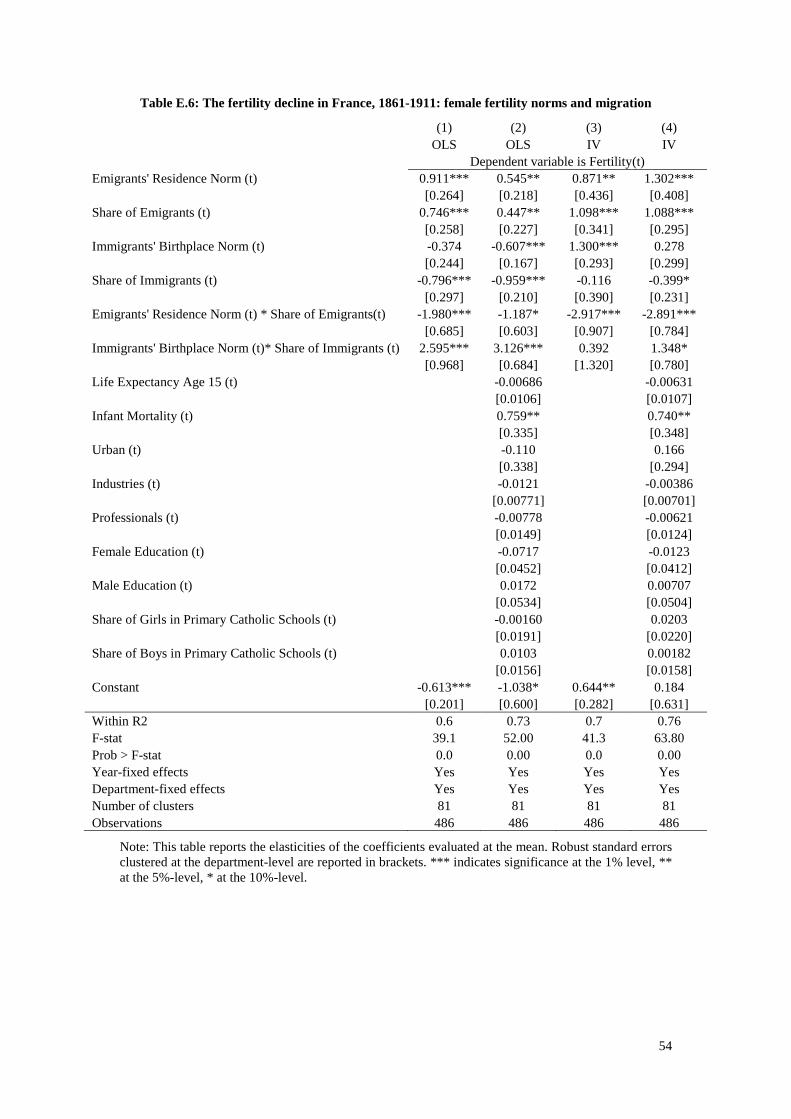
54
Table E.6: The fertility decline in France, 1861-1911: female fertility norms and migration
(1) (2) (3) (4) OLS OLS IV IV
Dependent variable is Fertility(t) Emigrants' Residence Norm (t) 0.911*** 0.545** 0.871** 1.302***
[0.264] [0.218] [0.436] [0.408] Share of Emigrants (t) 0.746*** 0.447** 1.098*** 1.088***
[0.258] [0.227] [0.341] [0.295] Immigrants' Birthplace Norm (t) -0.374 -0.607*** 1.300*** 0.278
[0.244] [0.167] [0.293] [0.299] Share of Immigrants (t) -0.796*** -0.959*** -0.116 -0.399*
[0.297] [0.210] [0.390] [0.231] Emigrants' Residence Norm (t) * Share of Emigrants(t) -1.980*** -1.187* -2.917*** -2.891***
[0.685] [0.603] [0.907] [0.784] Immigrants' Birthplace Norm (t)* Share of Immigrants (t) 2.595*** 3.126*** 0.392 1.348*
[0.968] [0.684] [1.320] [0.780] Life Expectancy Age 15 (t) -0.00686 -0.00631
[0.0106] [0.0107] Infant Mortality (t) 0.759** 0.740**
[0.335] [0.348] Urban (t) -0.110 0.166
[0.338] [0.294] Industries (t) -0.0121 -0.00386
[0.00771] [0.00701] Professionals (t) -0.00778 -0.00621
[0.0149] [0.0124] Female Education (t) -0.0717 -0.0123
[0.0452] [0.0412] Male Education (t) 0.0172 0.00707
[0.0534] [0.0504] Share of Girls in Primary Catholic Schools (t) -0.00160 0.0203
[0.0191] [0.0220] Share of Boys in Primary Catholic Schools (t) 0.0103 0.00182
[0.0156] [0.0158] Constant -0.613*** -1.038* 0.644** 0.184 [0.201] [0.600] [0.282] [0.631] Within R2 0.6 0.73 0.7 0.76 F-stat 39.1 52.00 41.3 63.80 Prob > F-stat 0.0 0.00 0.0 0.00 Year-fixed effects Yes Yes Yes Yes Department-fixed effects Yes Yes Yes Yes Number of clusters 81 81 81 81 Observations 486 486 486 486
Note: This table reports the elasticities of the coefficients evaluated at the mean. Robust standard errors clustered at the department-level are reported in brackets. *** indicates significance at the 1% level, ** at the 5%-level, * at the 10%-level.
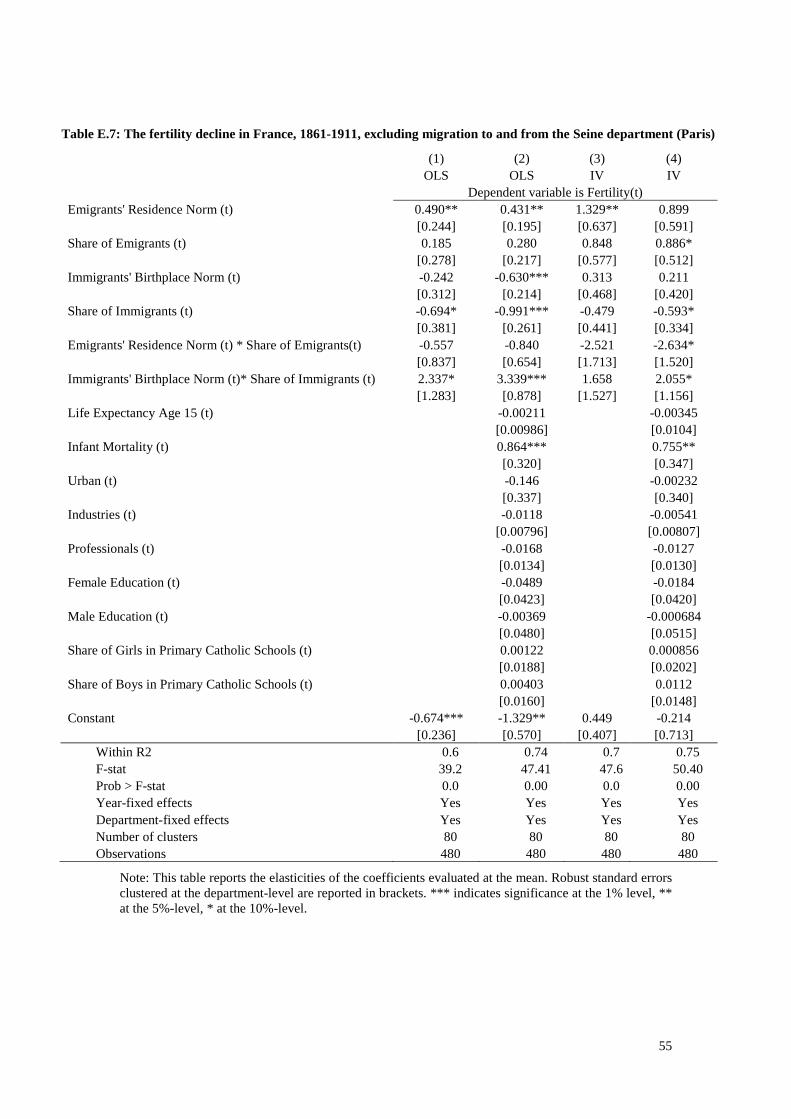
55
Table E.7: The fertility decline in France, 1861-1911, excluding migration to and from the Seine department (Paris)
(1) (2) (3) (4) OLS OLS IV IV
Dependent variable is Fertility(t) Emigrants' Residence Norm (t) 0.490** 0.431** 1.329** 0.899
[0.244] [0.195] [0.637] [0.591] Share of Emigrants (t) 0.185 0.280 0.848 0.886*
[0.278] [0.217] [0.577] [0.512] Immigrants' Birthplace Norm (t) -0.242 -0.630*** 0.313 0.211
[0.312] [0.214] [0.468] [0.420] Share of Immigrants (t) -0.694* -0.991*** -0.479 -0.593*
[0.381] [0.261] [0.441] [0.334] Emigrants' Residence Norm (t) * Share of Emigrants(t) -0.557 -0.840 -2.521 -2.634*
[0.837] [0.654] [1.713] [1.520] Immigrants' Birthplace Norm (t)* Share of Immigrants (t) 2.337* 3.339*** 1.658 2.055*
[1.283] [0.878] [1.527] [1.156] Life Expectancy Age 15 (t) -0.00211 -0.00345
[0.00986] [0.0104] Infant Mortality (t) 0.864*** 0.755**
[0.320] [0.347] Urban (t) -0.146 -0.00232
[0.337] [0.340] Industries (t) -0.0118 -0.00541
[0.00796] [0.00807] Professionals (t) -0.0168 -0.0127
[0.0134] [0.0130] Female Education (t) -0.0489 -0.0184
[0.0423] [0.0420] Male Education (t) -0.00369 -0.000684
[0.0480] [0.0515] Share of Girls in Primary Catholic Schools (t) 0.00122 0.000856
[0.0188] [0.0202] Share of Boys in Primary Catholic Schools (t) 0.00403 0.0112
[0.0160] [0.0148] Constant -0.674*** -1.329** 0.449 -0.214 [0.236] [0.570] [0.407] [0.713]
Within R2 0.6 0.74 0.7 0.75 F-stat 39.2 47.41 47.6 50.40 Prob > F-stat 0.0 0.00 0.0 0.00 Year-fixed effects Yes Yes Yes Yes Department-fixed effects Yes Yes Yes Yes Number of clusters 80 80 80 80 Observations 480 480 480 480
Note: This table reports the elasticities of the coefficients evaluated at the mean. Robust standard errors clustered at the department-level are reported in brackets. *** indicates significance at the 1% level, ** at the 5%-level, * at the 10%-level.

56
Supplementary Appendix G: The state of the development of the railroad network
following the "L'etoile de Legrand" pattern in 1856.