Framework of Inclusive Growth Indicators - UN
63
Framework of Inclusive Growth Indicators Key Indicators for Asia and the Pacific 2011 Special Supplement
Transcript of Framework of Inclusive Growth Indicators - UN

Framework of Inclusive Growth IndicatorsKey Indicators for Asia and the Pacific 2011
Special Supplement

© 2011 Asian Development Bank
All rights reserved. Published in 2011.Printed in the Philippines.
Publication Stock No. RPT113837
Cataloging-In-Publication Data
Asian Development Bank. Key Indicators for Asia and the Pacific 2011: Framework of Inclusive Growth Indicators, special supplement.Mandaluyong City, Philippines: Asian Development Bank, 2011.
1. Inclusive growth. 2. Indicators. I. Asian Development Bank.
The views expressed in this publication do not necessarily reflect the views and policies of the Asian Development Bank (ADB) or its Board of Governors or the governments they represent.
ADB does not guarantee the accuracy of the data included in this publication and accepts no responsibility for any consequence of their use.
By making any designation of or reference to a particular territory or geographic area, or by using the term “country” in this document, ADB does not intend to make any judgments as to the legal or other status of any territory or area.
ADB encourages printing or copying information exclusively for personal and noncommercial use with proper acknowledgment of ADB. Users are restricted from reselling, redistributing, or creating derivative works for commercial purposes without the express, written consent of ADB.
Asian Development Bank6 ADB Avenue, Mandaluyong City1550 Metro Manila, PhilippinesTel +63 2 632 4444Fax +63 2 636 2444www.adb.org

iii
Key Indicators for Asia and the Pacific 2011 Special Supplement
Foreword
The Asia and Pacific region has achieved high economic growth over the past two decades, which has substantially reduced poverty. Despite this growth, many countries in the region experience widening disparities in their income and nonincome outcomes, between the rich and the poor, and the disadvantaged sections of the population. Growing and continued disparities can pose a threat to a high, efficient, and sustained growth. Therefore, inclusive growth is increasingly becoming a development agenda nationally and internationally.
The Asian Development Bank’s (ADB’s) Strategy 2020, which is its long-term strategic framework, has adopted inclusive economic growth as one of the strategic agendas to achieve its vision of an Asia and Pacific region free from poverty. Inclusive growth in ADB’s Strategy 2020 is about economic growth with equality of opportunity. High, efficient, and sustained growth; social inclusion to ensure equal access to opportunities; and social safety nets to protect the most vulnerable and deprived are the three critical policy pillars supported by good governance and institutions for an inclusive growth strategy that aims at high and sustained growth while ensuring that all members of the society benefit from growth.
This report is a special supplement to the Key Indicators for Asia and the Pacific 2011. It presents a framework of inclusive growth indicators (FIGI) and proposes a set of 35 indicators of inclusive growth. The FIGI was conceptualized with the three policy pillars and good governance and institutions as the guiding framework. Development of the framework is part of ADB’s efforts to promote further research and measurement to operationalize inclusive growth.
The special supplement was produced by ADB’s Development Indicators and Policy Research Division, under the overall guidance of Douglas H. Brooks, assistant chief economist. The publication was prepared by Kaushal Joshi, with technical support from Melissa Pascua in the early stages and later from Modesta de Castro. Criselda De Dios and Kristine Faith Agtarap provided research assistance and compiled the data. Derek Blades drafted the commentaries on statistical tables. Juzhong Zhuang provided valuable suggestions in conceptualizing FIGI and in selecting the indicators. Suggestions from Armin Bauer, Indu Bhushan, Shiladitya Chatterjee, Bart Edes, Samantha Hung and Shanti Jagannathan, and from the staff of the Economics and Research Department, during an internal seminar, helped substantially in determining the indicators. Manuscript and copy editing were provided by Wickie Mercado and Cherry Zafaralla and typesetting was carried out by Rhommell Rico. We are thankful to various national and international agencies from where the data has been sourced for the indicators in the tables.
We hope that this publication will become a regular vehicle to promote the research and measurement of inclusive growth, and the use of statistics in developing strategies and policies aimed at inclusive growth.
Changyong Rhee Chief Economist

iv
Framework of Inclusive Growth Indicators
Contents
Foreword ....................................................................................................................................................................iiiKey Symbols, Data Sources, Statistical Tables .........................................................................................................viHighlights of the Framework of Inclusive Growth Indicators ....................................................................................2
SPECIAL SUPPLEMENT Framework of Inclusive Growth Indicators
Introduction .............................................................................................................................................................4 Poverty and Inequality Income Poverty ....................................................................................................................................................10 Nonincome Poverty .............................................................................................................................................14
Policy Pillar 1: High, Efficient and Sustained Growth to Create Productive Jobs and Economic Opportunity Economic Growth and Employment ....................................................................................................................21 Key Infrastructure Endowments ..........................................................................................................................28
Policy Pillar 2: Social Inclusion to Ensure Equal Access to Economic Opportunity Access and Inputs to Education and Health ........................................................................................................31 Access to Basic Infrastructure Utilities and Services ..........................................................................................38 Gender Equality and Opportunity ........................................................................................................................44
Policy Pillar 3: Social Safety Nets .........................................................................................................................50
Good Governance and Institutions .......................................................................................................................53
Tables
Table 1.1 Income Poverty and Inequality ...........................................................................................................12Table 1.2 Nonincome Poverty and Inequality ......................................................................................................16Table 2.1 Economic Growth and Employment ....................................................................................................23Table 2.2 Key Infrastructure Endowments ...........................................................................................................30Table 3.1 Access and Inputs to Education and Health .........................................................................................33Table 3.2 Access to Basic Infrastructure Utilities and Services .........................................................................40Table 3.3 Gender Equality and Opportunity ........................................................................................................46Table 4 Social Safety Nets ................................................................................................................................52Table 5 Good Governance and Institutions .......................................................................................................55
Figures
Figure 1 Policy Pillars of Inclusive Growth .........................................................................................................5Figure 2 Framework of Inclusive Growth Indicators............................................................................................7Figure S1 Proportion of Population Living Below the National Poverty Line,
Total, Rural, Urban, Latest Year ........................................................................................................11Figure S2 Proportion of Population Living Below $2 a day PPP $, Earliest and Latest Years.............................11
v
Key Indicators for Asia and the Pacific 2011 Special Supplement
Figure S3 Ratio of Income/Consumption Share of Top 20% to Bottom 20%, Earliest and Latest Years ............11Figure S4 Average Years of Total Schooling of Youth (Aged 15–24) by Gender, 1990 and 2010 .......................15Figure S5 Prevalence of Underweight Children Under Five Years of Age: Total, Lowest and Highest Quintile, Latest Year ...............................................................................15Figure S6 Under-Five Mortality Rate (per 1,000 live births) by Rural, Urban, Latest Year .................................15Figure S7 Growth Rate in GDP per Capita at PPP (constant 2005 PPP $), 2000–2005 and 2005–2009 ...............................................................................................................22Figure S8 Growth Rate of Average Per Capita Income/Consumption in 2005 PPP $:
Lowest Quintile and Total Population, Latest Period .......................................................................22Figure S9 Number of Own-Account and Contributing Family Workers (per 100 wage and salaried workers)
by Gender, 2007 or Latest Year .......................................................................................................22Figure S10 Electricity Consumption (per capita kWh) 1990 or Earliest Year and 2008 ........................................29Figure S11 Number of Cellular Phone Subscriptions (per 100 people) 2000 or Earliest Year and 2010 ...............29Figure S12 Depositors with Other Depository Corporations (per 1000 adults) 2004 and 2010 or Nearest Year ...29Figure S13 School Life Expectancy, Primary to Tertiary, by Sex, 2009 or Latest Year .........................................32Figure S14 Diptheria, Tetanus Toxoid, and Pertussis (DTP3) Immunization Coverage among 1-Year-Olds by Lowest and Highest Quintile, Latest Year ................................................................32Figure S15 Government Expenditure on Education and Health (percent of total government expenditure), 2010 ...................................................................................................................................................32Figure S16 Percentage of Population With Access to Electricity, Urban and Rural, 2008 .....................................39Figure S17 Share of Population using Solid Fuels for Cooking, by Lowest and Highest Quintile, Latest Year ....39Figure S18 Population Using Improved Sanitation Facilities: Total, Rural, Urban, Latest Year ............................39Figure S19 Gender Parity in Primary, Secondary, and Tertiary Education, 2009 or Latest Year ...........................45Figure S20 Antenatal Care Coverage (At Least One Visit) by Lowest and Highest Quintile, Latest Year ............45Figure S21 Gender Parity in Labor Force Participation, Aged 15 and Over, 1990 and 2009 or Nearest Year .......45Figure S22 Social Security Expenditure on Health (percent of government expenditure on health), 1995 or Earliest Year and 2009 ..........................................................................................................51Figure S23 Government Expenditure on Social Security and Welfare
(percent of total government expenditure), 1995 and 2010 or Nearest Year .....................................51Figure S24 Government Effectiveness, 2009 ..........................................................................................................54Figure S25 Corruption Perceptions Index, 2010.....................................................................................................54
Definitions ...........................................................................................................................................................56

vi
Framework of Inclusive Growth Indicators
Key Symbols
… Data not available – Magnitude equals zero 0 or 0.0 Magnitude is less than half of unit employed na Not applicable
Data Sources
The sources of data in the statistical tables are mainly international statistical agencies that compile internationally comparable data based on official statistics produced by the national statistical agencies. In some cases, the data are directly drawn from national statistical sources. For indicators where official statistics are lacking, data from non-official international sources that provide widely comparable indicators have been used.
Statistical Tables
The data on inclusive growth indicators are presented in 9 statistical tables for 48 economies of Asia and the Pacific that are members of the Asian Development Bank (ADB). The term “country,” used interchangeably with “economy,” is not intended to make any judgment as to the legal or other status of any territory or area. The 48 economies have been broadly grouped into developing and developed members aligned with the operational effectiveness of ADB’s regional departments. The developed members refer exclusively to the three economies of Australia, Japan, and New Zealand. Brunei Darussalam is a regional member of ADB, but is not classified as a developing member; however, the data for Brunei Darussalam are presented under the group of developing member economies. The remaining 44 developing members and Brunei Darussalam are further grouped into five based on ADB’s operational regions, namely, Central and West Asia, East Asia, South Asia, Southeast Asia, and the Pacific. Economies are listed alphabetically per group. The statistics in the tables for each indicator are usually presented for two data points between 1990 and 2010. These have often been referred to as earliest (usually a year between 1990 and 2000) and latest (usually a year between 2000 and 2010) year depending on the available data for different economies. Similarly, the charts often present data with time period specified as “earliest year” and “latest year.” This is because the years for which data are available vary widely across countries. The tables that are the sources for the charts show the actual years to which the data relate.

SPECIAL SUPPLEMENT
Framework of Inclusive Growth Indicators

2
Framework of Inclusive Growth Indicators
HIGHLIGHTS
Highlights of the Framework of Inclusive Growth Indicators
The proposed framework of inclusive growth indicators identifies policy ingredients of inclusive growth—economic growth and employment opportunities, social inclusion, social protection, as well as good governance and institutions, on which it is based.
The inclusive growth indicators is a set of 35 indicators of (i) poverty and inequality (income and nonincome), (ii) economic growth and employment, (iii) key infrastructure endowments, (iv) access to education and health, (v) access to basic infrastructure utilities and services, (vi) gender equality and opportunity, (vii) social safety nets, and (viii) good governance and institutions.
Key points that emerge from available data for the 35 indicators are presented below.
Poverty and Inequality
Income Poverty• Poverty, whether measured by countries’ own
criteria or by a standard definition such as $1.25 or $2 a day, has declined in most countries of the Asia and the Pacific region due to high rates of growth in gross domestic product over the last two decades.
• Poverty is much more widespread in rural than in urban areas. Between the earliest and latest periods for which data are available, the rural–urban disparities as measured by ratio of rural poverty to urban poverty worsened in almost all countries in the region, except for Afghanistan, India, and Sri Lanka.
• Between the earliest and latest periods for which data are available, the ratios of share of income/consumption of the richest 20% to the bottom 20% increased in 12 out of 22 countries, although, overall poverty declined in most of them.
Nonincome Poverty• Wide disparities exist across countries in the
percentage of children under 5 years of age who are judged to be underweight. These range from 40% and more in Bangladesh, India, and Timor-Leste, to under 2% in Georgia, Samoa, and Tuvalu.
• Children in rural households are much more likely to be underweight than those in urban areas, and the children in the poorest households are more likely to be underweight than those from the top quintile.
• As seen with underweight prevalence, overall,
children in the poorest 20% of households are at higher risk of death than those in the richest 20%, with at least three times higher risk in Cambodia, India, the Philippines, Samoa, and Viet Nam.
Policy Pillar 1: High, Efficient, and Sustained Growth to Create Productive Jobs and Economic Opportunity
Economic Growth and Employment• Average per capita incomes grew faster during
2000–2009 compared to incomes during 1990–2000. The growth of employment has, however, not kept pace with economic growth as revealed by the employment elasticity for most countries.
• A large workforce comprises “own-account and contributing family workers,” also termed as vulnerable employment, compared to more stable wage-paid employees. More women are employed in vulnerable jobs compared to men in most countries.
• Growth in mean per capita incomes (or consumption) measured in 2005 purchasing power parity based on household surveys for 19 economies shows that for eight economies, the average annual growth in the mean per capita income (or consumption) was faster for the lowest quintile compared to the total population, while for rest of the economies, the mean incomes of the lowest quintile grew much slower than those of the total populations.
Key Infrastructure Endowments• Availability of per capita electricity, mobile phones,
and paved roads, including access to financial institutions, has been improving, but there are large disparities across countries.
Policy Pillar 2: Social Inclusion to Ensure Equal Access to Economic Opportunity
Access and Inputs to Education and Health • Between 1999 (or nearest year) and 2009, school
life expectancies rose in all countries except for the Marshall Islands and Samoa. The gap between girls and boys in the number of years of schooling has narrowed in most countries.
• In countries with low rates of immunization for children, children in rural areas and those from the poorest 20% of households were clearly at a disadvantage.
• In most economies, governments spend little on health (about 4%–10% of overall government expenditures). In contrast, the advanced economies of Australia, Japan, and New Zealand spend about 15%–22% on health against overall expenditures.

3
Key Indicators for Asia and the Pacific 2011 Special Supplement
SPECIAL SUPPLEMEN
THIGHLIGHTS
Access and Inputs to Basic Infrastructure Utilities and Services• In 2009, less than 45% of the population in
Afghanistan, Bangladesh, Cambodia, Myanmar, Nepal, and Timor-Leste had access to electricity. In countries with low access to electricity, there were wide rural–urban disparities. In Bangladesh, Cambodia, Indonesia, Mongolia, Nepal, and Timor-Leste, access to electricity in urban areas was at least twice as high as that in the rural areas.
• More than 60% of households in Afghanistan, Bangladesh, Cambodia, the Lao People’s Democratic Republic, Mongolia, Myanmar, Nepal, Pakistan, Papua New Guinea, Solomon Islands, Sri Lanka, Vanuatu, and Viet Nam use solid fuels for cooking (a measure of energy poverty).
• There are clear disparities in the use of solid fuels for cooking between rural and urban households—with rural households generally using more solid fuels. This makes rural households more exposed to indoor pollution because of their use of biomass for cooking. As with the rural households, the bottom 20% of households also use more solid fuels for cooking.
• Access to improved drinking water sources has been increasing and has charted good progress. Access to improved sanitation has also increased; however, less than 50% of the population has access to improved sanitation in many countries. Moreover, there are wide rural–urban disparities in the availability of improved sanitation.
Gender Equality and Opportunity• Between 1991 and 2009 (or nearest years in both
cases), the ratios of female to male enrollment improved in all educational levels in almost all economies. Overall, over the last two decades, the Asia and Pacific region has been moving toward gender equality in education.
• The availability of antenatal care for pregnant women was low in South Asia, with Bangladesh,
India, and Pakistan among the countries with less than 80% women accessing antenatal care at least once. Afghanistan, the Lao People’s Democratic Republic, and Nepal had less than 50% coverage ratios.
• Disparities exist in antenatal care coverage between rural and urban areas, and between the poorest and richest 20% of households in countries with low access rates—with those in the rural areas and those in the poorest 20% of households receiving less antenatal care coverage.
• In almost all countries, clear disparities in participation of females in the labor force exist, with the lowest participation rates for females in Afghanistan, India, Pakistan, and Sri Lanka.
Policy Pillar 3: Social Safety Nets
• Government expenditure on social security and welfare as a share of total government expenditure is low in most countries of the region, as social safety nets have been developed only in a few countries. Government expenditure on social security and welfare averaged 8%–10%, compared with that in the developed economies of Australia (32.3%) and Japan (39.5%) in 2010.
Good Governance and Institutions
• Government effectiveness is measured by a rating between –2.5 and +2.5 (with higher values corresponding to better governance outcomes) and includes perceptions of quality of public services and quality of civil services in a country. The ratings were below 0 for 33 out of 45 economies, with the lowest ratings (between –1.4 and –1.9) for Afghanistan, the Marshall Islands, and Myanmar.
• The Corruption Perceptions Index measures perceived corruption in public services, and scores are assigned between 0 (highly corrupt) to 10 (highly clean). The rates were below 5 for 32 out of 41 economies, with the lowest score of 1.4 assigned to Afghanistan, and highest scores of 9.3 assigned to New Zealand and Singapore.

4
Framework of Inclusive Growth Indicators
Introduction
Developing economies in the Asia and Pacific region have made significant strides in reducing extreme poverty in the last 2 decades. While the region has achieved high economic growth rates in recent years and remarkable success in reducing extreme poverty, most economies still face the challenges of hunger, undernourishment, child mortality, low achievements in primary education, and other nonincome dimensions of development. In many economies, inequalities pertaining to income and nonincome outcomes between different groups of populations, especially between the rich, the poor, and the vulnerable sections, have been widening. In addition, the severe economic shock of 2008–2009 and rising food prices in many countries affected the most vulnerable populations in the developing economies.
This has heightened the need for strong and sustainable growth and creation of opportunities leading to inclusive growth so that benefits can be shared by all. Some studies (Ali and Zhuang 2007, ADB 2011, Commission on Growth and Development 2008) advocate growth strategies that favor equality of opportunities so that everyone can participate in and benefit from the growth process. This special supplement to the Key Indicators for Asia and the Pacific 2011 proposes a framework of inclusive growth indicators and presents statistics on the proposed set of indicators for the developing member economies of the Asian Development Bank (ADB). It is a continuation of ADB’s efforts to promote further research and measurement to operationalize inclusive growth.
Why must growth be inclusive?Inclusive growth is important for very salient reasons:
• For ethical considerations of equity and fairness, growth must be shared and should be inclusive across different segments of populations and regions. Economic and other shocks hurt the poor and the vulnerable most, and growth that results in high disparity is unacceptable.
• Growth with persisting inequalities within a country may endanger social peace, force poor and unemployed people into criminal activities, make women more vulnerable to prostitution, force children into undesirable labor, and further weaken other disadvantaged and vulnerable sections of population—resulting in a waste of vast human capital that could otherwise be used productively in creating economic outputs for sustainable growth.
• Continued inequalities in outcomes and access to opportunities in a country may result in civil unrest and violent backlash from people who are continually deprived, derailing a sustainable growth process. This may create political unrest and disrupt the
social fabric and national integration, undermining the potential for long-term, sustained growth.
In the context of the debate on inequalities and strategies for inclusive growth, researchers have made a distinction between two types of inequalities: good inequalities and bad inequalities (Chaudhuri and Ravallion 2007). Good inequalities arise largely from differences in individual efforts, while bad inequalities arise from differences in circumstances beyond the control of individuals and prevent equal access to opportunities. It is the unequal access to opportunity that must form a nonnegotiable target of policy interventions toward inclusive growth. Creating equal access to opportunity should be at the core of inclusive growth as it aims to eliminate circumstance-related bad inequality. Accordingly, inclusive growth can be defined as economic growth with equality of opportunity. Therefore, “Inclusive growth is about raising the pace of growth and enlarging the size of the economy, while leveling the playing field for investment and increasing productive employment opportunities, as well as ensuring fair access to them. It allows every section of the society to participate in and contribute to the growth process equally, irrespective of their circumstances.” (ADB 2011, 47).
Policy Ingredients of an Inclusive Growth Strategy
In 2008, ADB adopted inclusive economic growth as one of its three critical strategic agendas1 in Strategy 2020: The Long-Term Strategic Framework of the Asian Development Bank, which will contribute to achieving ADB’s vision of “an Asia and Pacific region free of poverty” and its mission to “help reduce poverty and improve living conditions and the quality of life” (ADB 2008, 1). Under Strategy 2020, ADB will support inclusive growth in the region through financing, policy advice and knowledge solutions, and technical assistance and capacity building, with particular foci on building infrastructure, providing basic public services such as water and sanitation and education, developing the financial sector and fostering financial inclusion, and enhancing food security.
The concept of inclusive growth in ADB’s Strategy 2020–economic growth with equality of opportunity was developed by ADB staff and documented in detail in Ali and Zhuang (2007) and Zhuang (2010). The following three policy pillars supported by good governance and institutions (Zhuang 2010) are identified as requirements for a strategy anchored on inclusive growth that aims at high and sustained growth while ensuring that all members of the society benefit from growth.
1 The other two are environmentally sustainable growth and regional integration.
5
Key Indicators for Asia and the Pacific 2011 Special Supplement
SPECIAL SUPPLEMEN
TINTRODUCTION
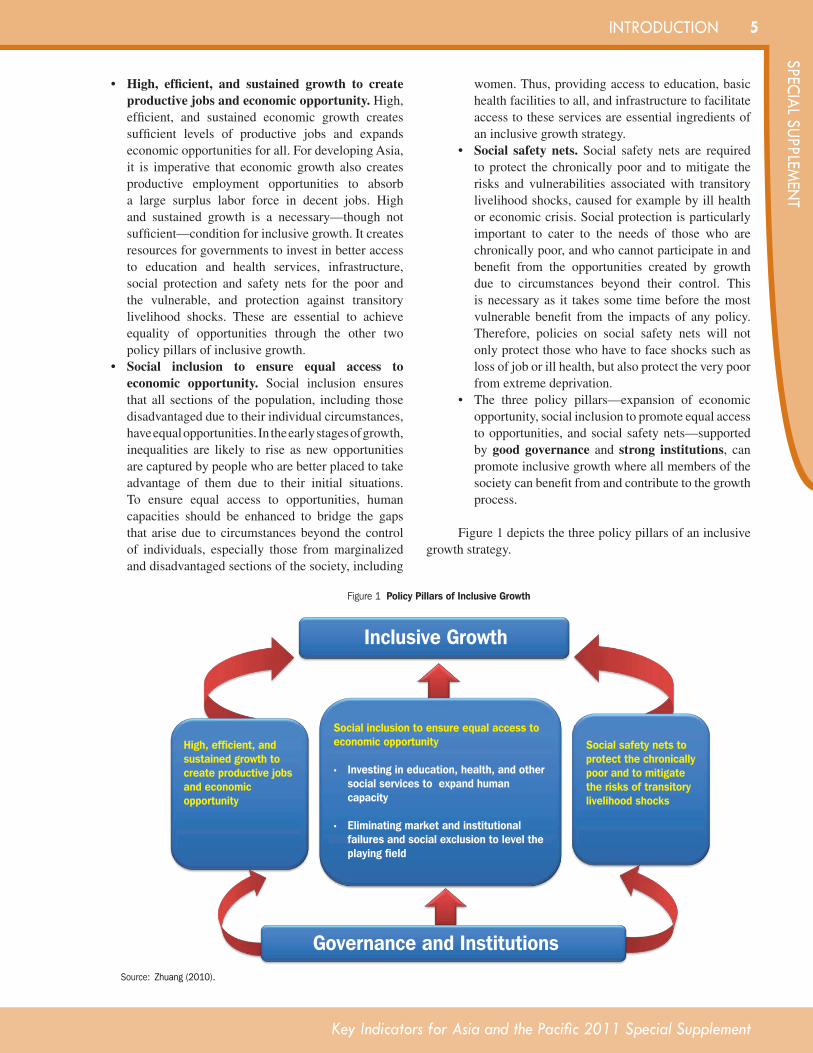
• High, efficient, and sustained growth to create productive jobs and economic opportunity. High, efficient, and sustained economic growth creates sufficient levels of productive jobs and expands economic opportunities for all. For developing Asia, it is imperative that economic growth also creates productive employment opportunities to absorb a large surplus labor force in decent jobs. High and sustained growth is a necessary—though not sufficient—condition for inclusive growth. It creates resources for governments to invest in better access to education and health services, infrastructure, social protection and safety nets for the poor and the vulnerable, and protection against transitory livelihood shocks. These are essential to achieve equality of opportunities through the other two policy pillars of inclusive growth.
• Social inclusion to ensure equal access to economic opportunity. Social inclusion ensures that all sections of the population, including those disadvantaged due to their individual circumstances, have equal opportunities. In the early stages of growth, inequalities are likely to rise as new opportunities are captured by people who are better placed to take advantage of them due to their initial situations. To ensure equal access to opportunities, human capacities should be enhanced to bridge the gaps that arise due to circumstances beyond the control of individuals, especially those from marginalized and disadvantaged sections of the society, including
women. Thus, providing access to education, basic health facilities to all, and infrastructure to facilitate access to these services are essential ingredients of an inclusive growth strategy.
• Social safety nets. Social safety nets are required to protect the chronically poor and to mitigate the risks and vulnerabilities associated with transitory livelihood shocks, caused for example by ill health or economic crisis. Social protection is particularly important to cater to the needs of those who are chronically poor, and who cannot participate in and benefit from the opportunities created by growth due to circumstances beyond their control. This is necessary as it takes some time before the most vulnerable benefit from the impacts of any policy. Therefore, policies on social safety nets will not only protect those who have to face shocks such as loss of job or ill health, but also protect the very poor from extreme deprivation.
• The three policy pillars—expansion of economic opportunity, social inclusion to promote equal access to opportunities, and social safety nets—supported by good governance and strong institutions, can promote inclusive growth where all members of the society can benefit from and contribute to the growth process.
Figure 1 depicts the three policy pillars of an inclusive growth strategy.
Source: Zhuang (2010).
Figure 1 Policy Pillars of Inclusive Growth
Inclusive Growth
Governance and Institutions
High, efficient, and sustained growth to create productive jobs and economic opportunity
Social inclusion to ensure equal access to economic opportunity
• Investing in education, health, and other social services to expand human capacity
• Eliminating market and institutional failures and social exclusion to level the playing field
Social safety nets to protect the chronically poor and to mitigate the risks of transitory livelihood shocks

6
Framework of Inclusive Growth Indicators
INTRODUCTION
Measuring Inclusive Growth: Framework of Inclusive Growth Indicators
Given the policy ingredients of inclusive growth as depicted in Figure 1, the questions that arise are: How should one measure inclusive growth? Are the economic opportunities equally accessible to all sections of the society? Are the public inputs and processes in building human capital and health equally accessible to all and geared to enhance human capacities, particularly the poor, rural populace, and women? Are there sufficient infrastructure endowments to enhance access to opportunities, markets, resources, information, and communications? Is governance responsive? All these considered, do current policies reduce inequalities in income and nonincome outcomes? Is progress being made and is progress becoming more inclusive?
One approach to answer some of these questions is to identify indicators to measure not only the income and nonincome outcomes of inclusive growth, but also indicators of associated inputs, processes, and drivers (social inclusion, social safety nets, and governance). These indicators will help evaluate the effectiveness of policies aimed at promoting inclusive growth.
This special supplement to the Key Indicators for Asia and the Pacific 2011 is a contribution to the ongoing research in ADB to operationalize inclusive growth, and proposes a framework of inclusive growth indicators (FIGI). The proposed FIGI aims to promote the use of statistics in developing inclusive growth policies and to encourage debate on the subject.
In terms of scope, the proposed FIGI identifies indicators in a manner that distinguishes among different policy ingredients of inclusive growth depicted in Figure 1: (i) economic growth and employment opportunities, (ii) social inclusion, (iii) social protection, and (iv) good governance and institutions, with the key income and nonincome outcomes at the top of the framework. The proposed FIGI is presented in Figure 2. The proposed framework is not rigidly prescriptive and is flexible, to take into account gaps in the availability of timely and comparable statistics of good quality for a majority of the developing economies in the region. It ultimately attempts to help achieve the goal of reducing poverty and inequality (income and nonincome) by measuring income and nonincome outcomes and their distribution across population, as allowed by available data. The framework presents 35 quantifiable indicators to measure - outcomes and components of the three policy pillars of inclusive growth, as well as the components of good governance and strong institutions, which form the foundation of any inclusive growth strategy.
How does FIGI Compare with Other Indicator Frameworks?
The United Nations’ (UN) framework of Millennium Development Goals (MDGs) indicators (United Nations 2008) is a framework of indicators currently on the international and national development agenda. The 60 MDG indicators serve as an overarching framework to monitor progress on the 8 goals and 18 targets,2 and include indicators that are a product of a rich debate among the UN agencies and other development partners. Progress toward the MDGs has helped to substantially reduce extreme poverty, improve children’s access to schools, reduce maternal and child deaths, promote gender equality, and empower women. At the same time, the progress on MDG outcomes has been quite uneven within countries (among different sections of the populations), between countries, and across different goals, particularly for the nonincome MDGs. This has been observed even for countries with high economic growth during this decade. An “MDG plus” has been suggested—i.e., additional indicators to see why progress varies between countries and within countries, as the existing set of indicators might overlook key processes to achieve MDGs. Another view is however, to maintain a compact set.
Recognizing the limitations of macroeconomic statistics such as the gross domestic product (GDP) as a measure of well-being, the Organisation for Economic Co-operation and Development (OECD) has been spearheading efforts in measuring well-being and progress in societies under its initiative known as Better Life Initiative: Measuring Well-being and Progress.3 OECD has developed a compendium of OECD well-being indicators, which also includes an indicator of subjective well-being (OECD 2011). The OECD compendium provides a framework that distinguishes between current material living conditions and quality of life on one hand, and the conditions required to ensure their sustainability over time, on the other. It also provides comparative information on a proposed set of indicators on the conditions of people’s lives in developed and emerging market economies.
The FIGI, however, draws its motivation from the policy ingredients of inclusive growth described in Figure 1 and is more focused on the needs of the developing Asian economies. With the focus on inclusive growth, the indicators proposed in FIGI are also influenced by the MDG indicators—nearly one third of the 35 proposed indicators in FIGI are
2 The Millennium Declaration was adopted by world leaders in September 2000. For the full text of the Millennium Declaration, see United Nations (2000).
3 For details of OECD Better Life Initiative, please visit the OECD website. http://www.oecd.org/document/0/0,3746,en_2649_201185_47837376_1_1_1_1,00.html.

7
Key Indicators for Asia and the Pacific 2011 Special Supplement
SPECIAL SUPPLEMEN
TINTRODUCTION
Figure 2 Framework of Inclusive Growth Indicators
Poverty and Inequality
Good Governance and Institutions
Income 1 Proportion of population living below the national poverty line 2 Proportion of population living below $2 a day at 2005 PPP $ 3 Ratio of income/consumption of the top 20% to bottom 20%
Nonincome 4 Average years of total schooling (youth and adults) 5 Prevalence of underweight children under-five years of age 6 Under-five mortality rate
Pillar OneGrowth and Expansion of Economic
Opportunity
Economic Growth and Employment 7 Growth rate of GDP per capita at PPP
(constant 2005 PPP $) 8 Growth rate of average per capita
income/consumption 2005 PPP $ (lowest quintile, highest quintile, and total)
9 Employment rate 10 Elasticity of total employment to total
GDP (employment elasticities) 11 Number of own-account and
contributing family workers per 100 wage and salaried workers
Key Infrastructure Endowments 12 Per capita consumption of electricity 13 Percentage of paved roads 14 Number of cellular phone subscriptions
per 100 people 15 Depositors with other depository
corporations per 1,000 adults
Pillar TwoSocial Inclusion to Ensure Equal Access to Economic Opportunity
Access and Inputs to Education and Health 16 School life expectancy (primary to
tertiary) 17 Pupil-teacher ratio (primary) 18 Diphtheria, tetanous toxoid, and
pertussis (DTP3) immunization coverage among 1-year-olds
19 Physicians, nurses, and midwives per 10,000 population
20 Government expenditure on education as percentage of total government expenditure
21 Government expenditure on health as a percentage of total government expenditure
Access to Basic Infrastructure Utilities and Services 22 Percentage of population with access
to electricity 23 Share of population using solid fuels
for cooking 24 Percentage of population using
improved drinking water sources 25 Percentage of population using
improved sanitation facilitiesGender Equality and Opportunity 26 Gender parity in primary, secondary,
and tertiary education 27 Antenatal care coverage (at least one
visit) 28 Gender parity in labor force
participation 29 Percentage of seats held by women in
national parliament
Pillar ThreeSocial Safety Nets
30 Social protection and labor rating 31 Social security expenditure on health
as a percentage of government expenditure on health
32 Government expenditure on social security and welfare as percentage of total government expenditure
33 Voice and accountability 34 Government effectiveness 35 Corruption perceptions index
GDP = gross domestic product, PPP = purchasing power paritySource: Developed from the Policy Pillars in Figure 1 as adopted from Zhuang, J (2010). Asian Development Bank.

8
Framework of Inclusive Growth Indicators
INTRODUCTION
also part of MDG monitoring. Examples include outcome indicators on poverty, child deaths, and nutrition, and some access indicators for health, gender parity, and mobile phone access. As inclusive growth is economic growth with equality of opportunity, the FIGI emphasizes growth and creation of opportunities along with social inclusion, social safety nets, and good governance, which are recognized as important policy ingredients to mitigate unequal opportunities. For example, indicators of inputs and access to education, health, infrastructure (including financial access and access to clean energy for electricity and cooking—the absence of which is often referred to as energy poverty), are included in FIGI, along with indicators of social safety nets and good governance. Some of the process indicators included in the FIGI, especially social safety nets and good governance, are not part of MDG monitoring. In that context, FIGI has a wider scope.
About the Statistical Tables
Using the proposed framework in Figure 2, a set of nine statistical tables with statistics on 35 indicators has been compiled for ADB’s regional members in the subsequent sections.4 To the extent supported by available data, disaggregated statistics by area (rural or urban), wealth (top and bottom quintiles), and gender (female and male) have been presented. It may be noted that the sources of disaggregated statistics by wealth quintiles and by rural–urban are mainly household surveys such as the Demographic and Health Surveys and the Multiple Indicator Cluster Surveys. In the absence of regular household surveys in most developing economies in the region, these statistics are available only for a few economies. They are therefore, presented only for economies for which these could be accessed from publicly available databases maintained by international organizations such as the United Nations Children’s Fund, the World Health Organization, and other international organizations. Sources for the data are indicated at the end of each table.
4 The sources of data are mainly international statistical agencies that compile internationally comparable data based on official statistics produced by the national statistical agencies. For some indicators however, where official statistics are lacking, data from non-official international sources that provide widely comparable indicators have been used.
The statistics in the tables for each indicator are usually presented for two data points between 1990 and 2010. These have often been referred to as earliest (usually a year between 1990 and 2000) and latest (usually a year between 2000 and 2010) year depending on the available data for different economies. The earliest and latest years for some indicators vary substantially across countries because indicators based on surveys are available for years only when the survey has been conducted.
Each of the nine tables is also preceded by a brief write up on the indicators presented in the tables and some key trends based on data in the tables. The tables that are the sources for the charts presented show the actual years that the data relate to. In presenting the key trends, references have been sometimes made to five largest (or most populous) economies of the region. These refer to the economies of the People’s Republic of China, Bangladesh, India, Indonesia, and Pakistan.
Conclusion
The set of 35 indicators proposed are subject to experiment and research, and the indicators will be improved based on further research, additional inputs, and better data availability. Similar reports will be produced in the coming years with an improved set of indicators as needed.
This publication aims to help strengthen the understanding of inclusive growth and the use of statistics in creating knowledge, as well as provide evidence for developing strategies and policies aimed at promoting inclusive growth. At the same time, this publication hopes to raise awareness of the need to collect timely and reliable disaggregated statistics on subpopulations and regions in a country, and to fill the data gaps to shed light on the inequalities in outcomes and in the equality of opportunities of an inclusive growth process.

9
Key Indicators for Asia and the Pacific 2011 Special Supplement
SPECIAL SUPPLEMEN
TINTRODUCTION
Bibliography and References
Ali, I., and J. Zhuang. 2007. Inclusive Growth toward a Prosperous Asia: Policy Implications. ERD Working Paper Series No. 97. Manila: Asian Development Bank.
Asian Development Bank. 2011. Asia 2050: Realizing the Asian Century. Manila: Asian Development Bank.
Barro, Robert and Jong-Wha Lee, April 2010, A New Data Set of Educational Attainment in the World, 1950–2010, NBER Working Papers No. 15902.
_____. 2008. Strategy 2020: The Long-Term Strategic Framework of the Asian Development Bank 2008–2020. Manila.
Chaudhuri, S., and M. Ravallion. 2007. Partially Awakened Giants: Uncover Growth in China and India. In L. Alan Winters, and S. Yusuf, eds., Dancing With Giants: China, India, and the Global Economy. Washington, D.C.: World Bank.
Commission on Growth and Development. 2008. The Growth Report: Strategies for Sustained Growth and Inclusive Development. Washington, D.C.: International Bank for Reconstruction and Development / The World Bank.
McKinley, T. 2010. Inclusive Growth Criteria and Indicators: An Inclusive Growth Index for Diagnosis of Country Progress. ADB Sustainable Development Working Paper Series No. 14. Manila: Asian Development Bank.
Organisation for Economic Co-operation and Development. 2011. Compendium of OECD Well-Being Indicators. http://www.oecd.org/dataoecd/4/31/47917288.pdf
United Nations. 2011. The Millennium Development Goals Report 2011. http://mdgs.un.org/unsd/mdg/.
_____. 2008. Official list of MDG indicators. http://mdgs.un.org/unsd/mdg/Host.aspx?Content=Indicators/OfficialList.htm
_____. 2000. United Nations Millennium Declaration. http://www.un.org/millennium/declaration/ares552e.pdf
Zhuang, J., ed. 2010. Poverty, Inequality, and Inclusive Growth in Asia: Measurement, Policy Issues, and Country Studies. Manila: Asian Development Bank.
Zhuang, J., and R. Hasan. 2008. Inclusive Growth: Why It is Important. Development Asia. 2 (December). Manila: Asian Development Bank.

10
Framework of Inclusive Growth Indicators
Poverty and Inequality
Income Poverty
The desirable outcome of policies anchored on inclusive growth strategy is not only to bring populations out of poverty but also to reduce the associated income inequalities in society. Reducing income inequality is a major policy concern, demonstrating the need to bring about a more equitable share of economic growth and narrow down the gap between the rich and the poor, rural and urban, across different regions, and among different groups. Inequalities in the distribution of incomes are generally regarded as good—provided that they mostly reflect returns to talent or hard work (or good inequalities). But widespread and persistent inequalities also endanger social cohesion and may lead to unrest and social tension between the haves and the have-nots.
What are the proposed indicators?Three indicators are proposed:
• Proportion of population living below the national poverty line,
• Proportion of population living below $2 a day at 2005 PPP $, and
• Ratio of income/consumption of the top 20% to bottom 20%.
The first indicator measures national poverty based on the poverty lines defined by the national governments. These definitions vary from country to country but are highly relevant as they help the national governments identify policy measures needed to reduce poverty. While poverty as measured by PPP $1.25 a day represents extreme poverty, and has been declining in most countries, the PPP $2 a day poverty is still widespread. The second indicator therefore provides a measure based on the international dollar, to compare the size of populations living below PPP $2 a day across countries. The third indicator, the ratio of income/consumption of top 20% to the bottom 20% measures inequalities in income at the two ends of the income distribution.
Trends in Economies
Poverty, whether measured by countries’ own criteria or by a standard definition such as $1 or $2 a day, has declined in most countries in the Asia and Pacific region due to high rates of growth in gross domestic product (GDP) over the last decade.
Poverty, as measured by each country’s own national definition, fell in 21 countries but increased in 7 during the earliest and latest periods for which data are available. The seven included four Pacific Island economies—Papua New Guinea, Samoa, Timor-Leste and Tuvalu. Of the 21 countries that reduced poverty of their population, gains in excess of 20 percentage points were made by Armenia, Azerbaijan, Georgia, Tajikistan, Thailand and Viet Nam.
Poverty as measured by population living below $2 PPP per day has also declined in most economies, but the percentages were in excess of 40% in 15 out of 26 economies for the latest year for which data are available. The countries with $2 PPP poverty in excess of 70% include Bangladesh and India. The latest data for the two countries pertain to the year 2005.
Inequalities in Income Poverty
Poverty is much more widespread in rural than in urban areas. Based on latest available data, rural poverty was 20 percentage points higher than urban rates in five economies— including Bhutan, Cambodia, Republic of Fiji, the Kyrgyz Republic, and Nepal. In Bhutan, the rural–urban disparities were the widest, with 18 poor persons in rural areas for every 1 poor in urban areas. Differences between rural and urban poverty, of less than 10 percentage points, were reported in India, Indonesia, Malaysia, and Thailand. Between earliest and latest periods for which data are available, the rural–urban disparities as measured by the ratio of rural poverty to urban poverty worsened in almost all countries, except for Afghanistan, India, and Sri Lanka.
For 31 developing economies, ratios of the income shares of the top to bottom quintiles for most recent available data, ranged from a low of 4.3 in Afghanistan and 4.4 in Bangladesh to 11.3 in Malaysia, and 12.5 in Papua New Guinea. However, the data for Papua New Guinea pertain to 1996. In two thirds of the countries—including the five most populous—the quintile ratios were less than 7.0, for the latest years to which the data pertain.
Between the earliest and latest periods for which data are available, ratios of income shares of top and bottom quintiles increased in 12 out of 22 countries although overall poverty declined in most of them. For example, in Nepal, the $2 poverty declined by 10.6 points between 1996 and 2004, and the ratio increased from 6 to 9 during the same period. Thus while many countries have succeeded in bringing down poverty, the ratio of income shares between the top and the bottom groups has increased in favor of the rich. In Georgia, however, poverty rose by 18 points and the ratio of top to bottom quintiles also increased from 7.1 to 8.9.

11
Key Indicators for Asia and the Pacific 2011 Special Supplement
SPECIAL SUPPLEMEN
TPOVERTY AND INEqUALITY
Note: Lao PDR = Lao People's Democratic Republic. Source: Table 1.1.
Figure S1Proportion of Population Living Below the National Poverty Line: Total, Rural, and Urban, Latest Year
Figure S2Proportion of Population Living Below $2 a day PPP $, Earliest and Latest Years
Figure S3Ratio of Income/Consumption Share of Top 20% to Bottom 20%, Earliest and Latest Years
Rural Urban Total
Latest Year Earliest Year
Latest Year Earliest Year
0
20
40
60
Tajik
ista
n
Bang
lade
sh
Mon
golia
Afgh
anis
tan
Kyrg
yz R
epub
lic
Fiji,
Rep
. of
Cam
bodi
a
Lao
PDR
Indi
a
Arm
enia
Uzbe
kist
an
Nep
al
Geor
gia
Bhut
an
Paki
stan
Azer
baija
n
Viet
Nam
Indo
nesi
a
Thai
land
Sri L
anka
Mal
aysi
a
Perc
ent
0
20
40
60
80
100
Bang
lade
sh
Nep
al
Uzbe
kist
an
Indi
a
Tim
or-L
este
Lao
PDR
Paki
stan
Cam
bodi
a
Tajik
ista
n
Indo
nesia
Turk
men
ista
n
Bhut
an
Mon
golia
Phili
ppin
es
Viet
Nam
Chin
a, P
eopl
e's R
ep. o
f
Geo
rgia
Kyrg
yz R
epub
lic
Sri L
anka
Arm
enia
Mal
dive
s
Thai
land
Azer
baija
n
Mal
aysi
a
Kaza
khst
an
Perc
ent
0
5
10
15
20
25
Papu
a N
ew G
uine
a
Mal
aysi
a
Bhut
an
Sing
apor
e
Hong
Kon
g, C
hina
Phili
ppin
es
Nep
al
Geo
rgia
Chin
a, P
eopl
e's R
ep. o
f
Thai
land
Cam
bodi
a
Turk
men
ista
n
Aust
ralia
Sri L
anka
Mal
dive
s
New
Zea
land
Viet
Nam
Uzbe
kist
an
Taip
ei,C
hina
Indo
nesia
Lao
PDR
Mon
golia
Indi
a
Tajik
ista
n
Azer
baija
n
Kyrg
yz R
epub
lic
Kore
a, R
ep. o
f
Paki
stan
Tim
or-L
este
Kaza
khst
an
Arm
enia
Bang
lade
sh
Afgh
anis
tan
Japa
n
Ratio

12
Framework of Inclusive Growth Indicators
POVERTY AND INEqUALITY
Table 1.1 Income Poverty and Inequality
a Figures refer to the same year as indicated in the column for “Total”unless otherwise specified.b Refers to percentage of low-income population to total population.c Brunei Darussalam is a regional member of ADB, but it is not classified as a developing member.d Except for Nauru and Tonga, data refers to percentage of population below the basic needs poverty line.
Sources: Millennium Indicators Database Online (UNSD 2011), economy sources.
1 Proportion of Population below the National Poverty Line (percent)
Earliest Year Latest Year
Total Rural a Urban a Total Rural a Urban a
Developing Member Economies Central and West Asia
Afghanistan 33.0 (2005) 36.2 21.1 36.0 (2008) 37.5 29.0Armenia 54.8 (1999) 46.1 61.4 26.5 (2009) 25.5 26.9Azerbaijan 49.6 (2001) 42.5 55.7 15.8 (2008) 18.5 14.8Georgia 52.1 (2002) ... ... 23.6 (2007) 29.7 18.3Kazakhstan 17.6 (2001) 23.2 13.0 8.2 (2009) … …Kyrgyz Republic 49.9 (2003) 57.5 35.7 31.7 (2008) 50.8 29.8Pakistan 30.6 (1999) 34.7 20.9 22.3 (2006) 27.0 13.1Tajikistan 92.3 (1999) 73.8 68.8 (2003) 46.7 (2009) 49.2 41.8Turkmenistan ... ... ... 29.9 (1998) ... ...Uzbekistan 31.5 (2000) ... ... 25.8 (2005) 30.0 18.3
East AsiaChina, People’s Rep. of 6.0 (1996) 7.9 2.0 … 3.8 (2009) …Hong Kong, China ... ... ... ... ... ...Korea, Rep. of ... ... ... 5.0 (2004) ... ...Mongolia 36.3 (1995) 33.1 38.5 38.7 (2009) 49.6 30.6Taipei,China b 0.6 (1993) ... ... 1.1 (2009) ... ...
South AsiaBangladesh 56.6 (1992) 58.7 42.7 40.0 (2005) 43.8 28.4Bhutan 31.7 (2003) 38.3 4.2 23.2 (2007) 30.9 1.7India 36.0 (1994) 37.3 32.4 27.5 (2005) 28.3 25.7Maldives ... ... ... 21.0 (2004) ... ...Nepal 41.8 (1996) 43.3 21.6 25.4 (2009) 28.5 7.6Sri Lanka 26.1 (1991) 29.5 16.3 7.6 (2009) 7.7 6.5
Southeast AsiaBrunei Darussalam c ... ... ... ... ... ...Cambodia 47.0 (1994) 40.1 21.1 (1997) 30.1 (2007) 34.5 11.8Indonesia 17.6 (1996) 19.8 13.6 13.3 (2010) 16.6 9.9Lao PDR 45.0 (1993) 48.7 33.1 27.6 (2008) 31.7 17.4Malaysia 5.7 (2004) 11.9 2.5 3.8 (2009) 8.2 1.7Myanmar ... ... ... ... ... ...Philippines 40.6 (1994) ... ... 26.5 (2009) ... ...Singapore ... ... ... ... ... ...Thailand 33.7 (1990) 39.2 20.5 8.1 (2009) 10.4 3.0Viet Nam 58.1 (1993) 66.4 25.1 14.5 (2008) 18.7 3.3
The Pacific dCook Islands ... ... ... 28.4 (2006) ... ...Fiji, Rep. of 35.0 (2003) 40.0 28.0 31.0 (2009) 43.3 18.6Kiribati ... ... ... 21.8 (2006) ... ...Marshall Islands ... ... ... 20.0 (1999) ... ...Micronesia, Fed. States of ... ... ... 29.9 (2005) ... ...Nauru ... ... ... ... ... ...Palau ... ... ... 24.9 (2006) ... ...Papua New Guinea 24.0 (1990) ... ... 30.2 (1996) ... ...Samoa 15.0 (1997) ... ... 26.9 (2008) ... ...Solomon Islands ... ... ... 22.7 (2006) ... ...Timor-Leste 39.7 (2001) ... ... 49.9 (2007) ... ...Tonga ... ... ... 22.3 (2002) ... ...Tuvalu 17.2 (1994) ... ... 26.3 (2010) ... ...Vanuatu ... ... ... 15.9 (2006) ... ...
Developed Member EconomiesAustralia ... ... ... ... ... ...Japan ... ... ... ... ... ...New Zealand ... ... ... ... ... ...

13
Key Indicators for Asia and the Pacific 2011 Special Supplement
SPECIAL SUPPLEMEN
TPOVERTY AND INEqUALITY
Table 1.1 Income Poverty and Inequality
a Derived from income and expenditure of the highest 20% and lowest 20% groups.b Values are weighted average of urban and rural.c Defined as disposable income, consumption.d Brunei Darussalam is a regional member of ADB, but it is not classified as a developing member.
Sources: PovcalNet Database Online (World Bank 2011); World Development Indicators Online (World Bank 2011); for Taipei,China: Directorate-General of Budget, Accounting and Statistics; ADB estimates.
2 Proportion of Population Living Below $2 a day at 2005 PPP $ (percent)
3 Income/ Consumption Share
Earliest Year Latest Year
Earliest Year Latest Year Bottom 20%
Top 20%
Ratio of Top 20% to Bottom 20% a
Bottom 20%
Top 20%
Ratio of Top 20% to Bottom 20% a
Developing Member Economies Central and West Asia
Afghanistan … ... ... ... … 9.0 38.7 4.3 (2008)Armenia 38.9 (1996) 12.4 (2008) 5.4 50.4 9.3 (1996) 8.8 39.8 4.5 (2008)Azerbaijan 39.1 (1995) 7.7 (2008) 6.9 42.3 6.1 (1995) 8.0 42.1 5.3 (2008)Georgia 14.0 (1996) 32.2 (2008) 6.1 43.6 7.1 (1996) 5.3 47.2 8.9 (2008)Kazakhstan 17.6 (1993) 1.5 (2007) 7.5 40.4 5.4 (1993) 8.7 39.9 4.6 (2007)Kyrgyz Republic 30.1 (1993) 29.4 (2007) 2.5 57.0 22.7 (1993) 8.8 42.8 4.8 (2007)Pakistan 88.2 (1991) 60.9 (2006) 8.1 41.7 5.2 (1991) 9.0 42.1 4.7 (2006)Tajikistan 78.5 (1999) 50.8 (2004) 8.1 39.3 4.9 (1999) 7.8 41.7 5.4 (2004)Turkmenistan 85.7 (1993) 49.6 (1998) 6.9 42.5 6.2 (1993) 6.0 47.5 7.8 (1998)Uzbekistan 53.6 (1998) 76.7 (2003) 3.9 49.6 12.7 (1998) 7.1 44.2 6.2 (2003)
East AsiaChina, People’s Rep. of b 84.6 (1990) 36.3 (2005) ... ... ... 5.7 47.8 8.3 (2005)Hong Kong, China … … ... ... … 5.3 50.7 9.7 (1996)Korea, Rep. of … ... ... ... … 7.9 37.5 4.7 (1998)Mongolia 43.5 (1995) 49.1 (2005) 7.3 40.4 5.6 (1995) 7.2 40.5 5.6 (2005)Taipei,China c … … 2.6 14.1 5.4 (1993) 3.0 18.3 6.1 (2008)
South AsiaBangladesh 92.5 (1992) 81.3 (2005) 10.0 36.2 3.6 (1992) 9.4 40.8 4.4 (2005)Bhutan … 49.5 (2003) ... ... … 5.4 53.0 9.9 (2003)India b 81.7 (1993) 75.6 (2005) ... ... … 8.1 45.3 5.6 (2005)Maldives 40.6 (1998) 12.2 (2004) ... ... … 6.5 44.2 6.8 (2004)Nepal 88.1 (1996) 77.6 (2004) 7.6 45.7 6.0 (1996) 6.1 54.2 8.9 (2004)Sri Lanka 49.5 (1991) 29.1 (2007) 8.7 41.5 4.8 (1991) 6.9 47.8 6.9 (2007)
Southeast AsiaBrunei Darussalam d … … … … … … … …Cambodia 77.8 (1994) 56.4 (2007) 8.0 46.8 5.9 (1994) 6.6 51.7 7.9 (2007)Indonesia b 84.6 (1990) 50.6 (2009) 7.1 47.3 6.6 (2005) 7.6 44.9 5.9 (2009)Lao PDR 84.8 (1992) 66.0 (2008) 9.3 40.1 4.3 (1992) 7.6 44.8 5.9 (2008)Malaysia 11.2 (1992) 2.3 (2009) 4.7 53.1 11.4 (1992) 4.5 51.5 11.3 (2009)Myanmar … … … … … … … …Philippines 55.4 (1991) 45.0 (2006) 5.9 50.5 8.6 (1991) 5.6 50.4 9.0 (2006)Singapore … … … … … 5.0 49.0 9.7 (1998)Thailand 25.6 (1992) 11.5 (2004) 5.6 52.7 9.4 (1992) 6.1 49.0 8.1 (2004)Viet Nam 85.7 (1993) 38.4 (2008) 7.8 44.0 5.6 (1993) 7.3 45.4 6.2 (2008)
The Pacific Cook Islands … … … … … … … …Fiji, Rep. of … … … … … … … …Kiribati … … … … … … … …Marshall Islands … … … … … … … …Micronesia, Fed. States of … … … … … … … …Nauru … … … … … … … …Palau … … … … … … … …Papua New Guinea … 57.4 (1996) … … … 4.5 56.4 12.5 (1996)Samoa … … … … … … … …Solomon Islands … … … … … … … …Timor-Leste 77.5 (2001) 72.8 (2007) 6.7 46.8 7.0 (2001) 9.0 41.3 4.6 (2007)Tonga … … … … … … … …Tuvalu … … … … … … … …Vanuatu … … … … … … … …
Developed Member EconomiesAustralia … … … … … 5.9 41.3 7.0 (1994)Japan … ... … … … 10.6 35.7 3.4 (1993)New Zealand … … … … … 6.4 43.8 6.8 (1997)

14
Framework of Inclusive Growth Indicators
POVERTY AND INEqUALITY
Nonincome Poverty
While the outcomes of reduced income poverty and associated reductions in income inequalities are important goals of policies anchored on inclusive growth, so are better outcomes in ensuring basic human capacities—education and health. Ensuring a healthy life for children so that they survive beyond 5 years of life, providing adequate nutrition to undernourished populations, and providing reasonable years of schooling continue to be key requirements in developing basic human capacities to mitigate unequal access to opportunities and enable people to participate in and benefit from the growth process. At the same time, reduced disparities in the health and educational outcomes among the rich and the poor, female–male, rural–urban, and different groups of populations are essential for more inclusive outcomes.
What are the proposed indicators?Three indicators are proposed:
• Average years of total schooling, • Prevalence of underweight children under-five years
of age, and• Under-five mortality rate.
A United Nations Educational, Social and Cultural Organization (UNESCO) study1 adopted 4 years of schooling as the minimum number of years required to gain the most basic literacy and numeracy skills. The study indicated that those with less than 4 years of education are in a state of “education poverty” and those with less than 2 years of education are in “extreme education poverty.” Prevalence of underweight children measures malnutrition (assessed by underweight). Growth retardation in children due to poor diet is likely to harm their cognitive skills and learning capabilities as they move up through school, and eventually affect their equality of opportunity when they enter the labor force. The under-five mortality rate, while measuring child survival, is also a reflection of the state of primary health care in a country, apart from the social, economic, and environmental living conditions of children and others.
Trends in Economies
The average years of schooling have been going up for youth and adults since 1990 in all countries except for the youth in Armenia, Kyrgyz Republic, and Tajikistan. For males and females aged 15–24, the average for 29 countries went up from 7.3 years in 1990 to 9.0 years in 2010. The corresponding figures for adults were 5.7 in 1990 and 7.4 in 2010—lower than for youths because the years of schooling have been rising in the last 2 decades.
1 UNESCO. 2010. Reaching the Marginalized. EFA Global Monitoring Report 2010. Paris: UNESCO Publishing and Oxford University Press.
Percentages of children under 5 years of age judged to be underweight range from 40% and more in Bangladesh, India, and Timor-Leste, to under 2% in Georgia, Samoa, and Tuvalu. All countries reduced their percentages except Armenia, Myanmar, Sri Lanka, and Vanuatu between the two earliest and latest years between 1990 and 2010 for which data are available. Between these years, the simple average of percentage of underweight children for 25 countries declined by 7 percentage points. Nevertheless, thirteen countries still had 20% or more children underweight.
Mortality rates per 1,000 live births for children under 5 years of age go from less than 5 in the Republic of Korea and Singapore to 87 in Cambodia and Pakistan and to nearly 200 per 1,000 in Afghanistan. Between 1990 and 2009, all countries reduced child deaths, and the weighted average of child mortality fell from 89 per 1,000 to 51 per 1,000.
Inequalities in Nonincome Poverty
Years of schooling for young females (15–24) averaged 7.2 for all countries in 1990 and 7.5 for young males, but by 2010, young females had overtaken the males with 9.1 years of schooling compared with 9.0 for young men. Female–male disparities also declined for adults.
Boys are much more likely to be underweight than girls, but in Bangladesh, India, and the Philippines, girls were slightly more underweight than boys. In all countries, children in rural households are much more likely to be underweight than those in the urban areas, and in Azerbaijan, by a factor of three. The chance of being underweight is clearly related to household income/wealth and children in the bottom quintile of the income/wealth distribution are more likely to be underweight compared to those at the top quintile. The income/wealth effect on underweight prevalence was particularly marked in Azerbaijan, India, Thailand, and Turkmenistan, with children in the bottom quintile nearly three times or more underweight compared to those in the top bracket.
Child mortality rates per thousand live births show that in almost all countries, boys under 5 years of age are at higher risk of death than girls. The exceptions are the People’s Republic of China, India, Solomon Islands, and Vanuatu. As seen with underweight prevalence, overall, children in the poorest 20% of households are at higher risk of death than those in the richest 20%, and at least three times higher in Cambodia, India, the Philippines, Samoa, and Viet Nam.

15
Key Indicators for Asia and the Pacific 2011 Special Supplement
SPECIAL SUPPLEMEN
TPOVERTY AND INEqUALITY
Figure S4Average Years of Total Schooling of Youth (Aged 15–24) by Gender, 1990 and 2010
Figure S5Prevalence of Underweight Children Under Five Years of Age: Total, Lowest and Highest Quintile, Latest Year
Figure S6 Under-Five Mortality Rate (per 1,000 live births) by Rural and Urban, Latest Year
Note: Lao PDR = Lao People's Democratic Republic. Source: Table 1.2.
0
2
4
6
8
10
12
14
16
Afgh
anis
tan
Papu
a N
ew G
uine
a
Lao
PDR
Paki
stan
Nep
al
Indi
a
Cam
bodi
a
Mya
nmar
Indo
nesi
a
Kyrg
yz R
epub
lic
Mon
golia
Brun
ei D
arus
sala
m
Viet
Nam
Sri L
anka
Bang
lade
sh
Mal
dive
s
Tajik
ista
n
Philip
pine
s
Kaza
khst
an
Tong
a
Chin
a, P
eopl
e's
Rep.
of
Sing
apor
e
Arm
enia
Thai
land
Mal
aysi
a
Japa
n
Fiji,
Rep
. of
Kore
a, R
ep. o
f
Hong
Kon
g, C
hina
Taip
ei,C
hina
Aust
ralia
New
Zea
land
Num
ber o
f Yea
rs
Female 2010 Male 2010 Female 1990 Male 1990
Total Lowest 20% Highest 20%
0.0
1.0
2.0
3.0
4.0
5.0
6.0
0
20
40
60
80
100
120
Sam
oa
Viet
Nam
Mon
golia
Geor
gia
Nep
al
Philip
pine
s
Arm
enia
Indi
a
Cam
bodi
a
Kaza
khst
an
Kyrg
yz R
epub
lic
Tim
or-L
este
Turk
men
ista
n
Paki
stan
Azer
baija
n
Bang
lade
sh
Mal
dive
s
Tajik
ista
n
Vanu
atu
Uzbe
kist
an
Ratio
Perc
ent
Rural Urban Rural to Urban Ratio
0
10
20
30
40
50
60
Indi
a
Bang
lade
sh
Nep
al
Lao
PDR
Cam
bodi
a
Sri L
anka
Tajik
ista
n
Azer
baija
n
Turk
men
ista
n
Thai
land
Mon
golia
Kaza
khst
an
Nau
ru
Uzbe
kist
an
Arm
enia
Kyrg
yz R
epub
lic
Tuva
lu
Perc
ent

16
Framework of Inclusive Growth Indicators
POVERTY AND INEqUALITY
Table 1.2 Nonincome Poverty and Inequality
a Brunei Darussalam is a regional member of ADB, but it is not classified as a developing member.
Source: Barro and Lee (2010), ADB staff estimates.
4 Average Years of Total Schooling of Youth (15–24) and Adults (25 and over)
Total Female Male
Youth Adult Youth Adult Youth Adult
1990 2000 2010 1990 2000 2010 1990 2000 2010 1990 2000 2010 1990 2000 2010 1990 2000 2010Developing Member Economies Central and West Asia
Afghanistan 2.9 4.4 5.9 1.5 2.2 3.3 1.4 2.0 2.3 0.5 0.8 1.3 4.3 6.6 9.2 2.4 3.4 5.2Armenia 11.5 9.3 9.3 10.1 10.8 10.8 11.6 9.5 11.1 9.9 10.7 10.9 11.3 9.1 7.5 10.3 10.9 10.6Azerbaijan … … … … … … … … … … … … … … … … … …Georgia … … … … … … … … … … … … … … … … … …Kazakhstan 7.7 10.0 10.5 7.7 9.9 10.4 7.9 10.1 10.3 7.3 9.7 10.3 7.5 9.9 10.6 8.1 10.1 10.4Kyrgyz Republic 8.1 7.6 7.5 8.1 9.2 9.3 8.2 7.7 7.7 7.7 9.0 9.2 8.1 7.4 7.3 8.6 9.4 9.3Pakistan 4.1 5.1 7.2 2.3 3.3 4.9 2.8 3.8 6.3 1.0 1.9 3.4 5.2 6.2 8.0 3.5 4.6 6.3Tajikistan 9.9 8.9 8.5 9.0 9.9 9.8 9.9 9.8 9.9 8.3 9.5 10.0 9.9 8.0 7.0 9.8 10.4 9.7Turkmenistan … … … … … … … … … … … … … … … … … …Uzbekistan … … … … … … … … … … … … … … … … … …
East AsiaChina, People’s Rep. of 7.6 9.5 10.9 4.9 6.6 7.5 7.6 9.3 10.9 4.4 5.8 6.9 7.5 9.6 11.0 5.3 7.4 8.2Hong Kong, China 12.5 12.0 12.6 8.5 8.7 10.0 12.7 12.2 13.0 7.7 8.3 9.7 12.4 11.7 12.3 9.4 9.2 10.3Korea, Rep. of 11.0 12.7 12.7 8.9 10.6 11.6 11.0 12.9 12.9 7.5 9.6 11.0 11.1 12.6 12.6 10.4 11.6 12.3Mongolia 8.0 7.3 8.6 7.6 8.1 8.3 8.2 7.8 8.6 7.3 8.0 8.4 7.8 6.8 8.5 7.9 8.2 8.2Taipei,China 11.1 11.9 13.0 8.0 9.6 11.0 11.7 12.0 13.1 7.2 8.9 10.5 10.6 11.8 12.9 8.8 10.2 11.6
South AsiaBangladesh 3.7 6.6 8.3 2.9 3.7 4.8 3.3 6.3 9.3 1.9 3.2 4.3 4.1 6.8 7.4 3.7 4.2 5.2Bhutan … … … … … … … … … … … … … … … … … …India 4.6 5.8 7.1 3.0 3.6 4.4 3.5 4.9 6.4 1.7 2.3 3.2 5.5 6.6 7.7 4.1 4.8 5.5Maldives 5.2 6.6 9.0 4.0 3.0 4.7 5.1 6.6 9.4 3.7 2.8 4.4 5.3 6.6 8.6 4.4 3.3 5.0Nepal 3.3 4.0 5.6 2.0 2.4 3.2 2.4 3.8 6.3 0.8 1.3 2.4 4.2 4.2 4.9 3.3 3.6 4.2Sri Lanka 9.0 9.6 9.2 6.9 7.6 8.2 9.0 9.5 9.1 6.4 7.3 8.1 8.9 9.8 9.3 7.3 7.8 8.4
Southeast AsiaBrunei Darussalam a 7.9 7.7 8.3 7.5 8.2 8.6 8.3 8.1 8.9 6.6 8.0 8.5 7.5 7.2 7.7 8.3 8.4 8.6Cambodia 6.0 6.0 6.5 5.3 5.7 5.8 5.5 5.9 6.5 4.9 5.3 5.4 6.4 6.2 6.5 5.8 6.1 6.2Indonesia 6.5 6.5 7.7 3.3 4.8 5.8 5.8 6.1 7.4 2.5 4.0 5.1 7.2 6.9 7.9 4.1 5.5 6.6Lao PDR 4.5 4.9 5.9 3.1 3.9 4.6 3.9 4.4 5.7 1.9 2.9 3.8 5.1 5.3 6.1 4.3 5.0 5.4Malaysia 10.2 11.4 12.0 6.5 8.2 9.5 10.3 11.6 12.2 5.7 7.5 9.2 10.2 11.2 11.7 7.3 8.8 9.9Myanmar 3.6 5.0 7.0 2.4 3.1 4.0 3.6 5.0 6.9 2.4 3.1 3.9 3.5 5.0 7.1 2.4 3.1 4.0Philippines 8.1 8.9 9.7 7.1 8.0 8.7 8.5 9.3 10.0 7.0 8.0 8.8 7.8 8.5 9.4 7.2 7.9 8.5Singapore 8.4 10.6 10.8 5.8 7.6 8.8 8.1 10.8 11.1 5.4 7.1 8.3 8.6 10.4 10.6 6.1 8.1 9.3Thailand 7.2 8.3 10.6 4.6 5.4 6.6 7.5 8.5 11.4 4.1 5.0 6.2 7.0 8.2 9.8 5.0 5.8 6.9Viet Nam 4.5 6.6 8.8 4.0 4.5 5.5 4.5 6.5 8.9 3.5 4.2 5.2 4.5 6.7 8.7 4.5 4.8 5.7
The PacificCook Islands … … … … … … … … … … … … … … … … … …Fiji, Rep. of 10.9 11.9 12.4 8.3 10.3 11.0 11.2 11.9 12.6 8.0 10.1 10.9 10.7 11.8 12.3 8.6 10.5 11.2Kiribati … … … … … … … … … … … … … … … … … …Marshall Islands … … … … … … … … … … … … … … … … … …Micronesia, Fed. States of … … … … … … … … … … … … … … … … … …Nauru … … … … … … … … … … … … … … … … … …Palau … … … … … … … … … … … … … … … … … …Papua New Guinea 5.0 5.7 5.6 2.3 3.4 4.3 4.0 4.9 4.8 1.6 2.3 3.0 6.1 6.5 6.4 3.0 4.5 5.6Samoa … … … … … … … … … … … … … … … … … …Solomon Islands … … … … … … … … … … … … … … … … … …Timor-Leste … … … … … … … … … … … … … … … … … …Tonga 10.0 10.7 10.6 8.5 9.8 10.5 10.0 10.9 10.5 8.2 9.7 10.2 9.9 10.6 10.7 8.8 9.9 10.7Tuvalu … … … … … … … … … … … … … … … … … …Vanuatu … … … … … … … … … … … … … … … … … …
Developed Member EconomiesAustralia 11.0 11.2 12.5 11.7 11.9 12.0 11.6 11.8 13.1 11.7 12.0 12.4 10.5 10.6 11.9 11.8 11.7 11.7Japan 11.0 11.7 12.1 9.9 10.7 11.5 11.1 12.0 12.5 9.4 10.3 11.2 10.9 11.4 11.8 10.4 11.2 11.8New Zealand 12.0 13.0 13.7 11.7 12.0 12.5 12.2 13.2 13.9 11.4 11.8 12.4 11.8 12.7 13.4 12.1 12.2 12.6

17
Key Indicators for Asia and the Pacific 2011 Special Supplement
SPECIAL SUPPLEMEN
TPOVERTY AND INEqUALITY
Table 1.2 Nonincome Poverty and Inequality
a Figures refer to the latest year as indicated in the column for “Total” unless otherwise specified.b Brunei Darussalam is a regional member of ADB, but it is not classified as a developing member.
continued
5 Prevalence of Underweight Children Under-Five Years of Age (percent)
Total Gender a
Earliest Latest Female Male Female to Male RatioDeveloping Member Economies Central and West Asia
Afghanistan 44.9 (1997) 32.9 (2004) 33.0 32.7 1.0Armenia 2.7 (1998) 4.2 (2005) 5.2 3.4 1.5Azerbaijan 8.8 (1996) 8.4 (2006) 8.0 8.7 0.9Georgia 2.7 (1999) 1.1 (2009) 1.0 1.3 0.8Kazakhstan 6.7 (1995) 4.9 (2006) 4.3 5.4 0.8Kyrgyz Republic 8.2 (1997) 2.7 (2005) 2.5 2.9 0.9Pakistan 39.0 (1990) 31.3 (2001) 31.0 31.6 1.0Tajikistan … 14.9 (2005) 13.3 16.4 0.8Turkmenistan 10.5 (2000) 8.2 (2005) 7.1 9.3 0.8Uzbekistan 15.3 (1996) 4.4 (2006) 4.3 4.6 0.9
East AsiaChina, People’s Rep. of 15.3 (1992) 4.5 (2005) 4.2 4.7 0.9Hong Kong, China … … … … ...Korea, Rep. of … … … … ...Mongolia 10.8 (1992) 5.3 (2005) 5.3 5.3 1.0Taipei,China … … … … ...
South AsiaBangladesh 64.1 (1992) 41.3 (2007) 42.4 40.2 1.1Bhutan 14.1 (1999) 12.0 (2008) 7.5 16.0 0.5India 50.7 (1992) 43.5 (2005) 43.9 43.1 1.0Maldives 32.5 (1994) 25.7 (2001) 26.0 25.5 1.0Nepal 44.1 (1995) 38.8 (2006) 39.8 37.7 1.1Sri Lanka 21.1 (2006) 21.6 (2009) 21.6 21.6 1.0
Southeast AsiaBrunei Darussalam b … … … … ...Cambodia 42.6 (1996) 28.8 (2008) 29.2 28.4 1.0Indonesia 29.8 (1992) 19.6 (2007) 18.6 20.7 0.9Lao PDR 39.8 (1993) 31.6 (2006) 30.6 32.5 0.9Malaysia … 16.7 (1999) ... ... ...Myanmar 28.8 (1990) 29.6 (2003) 28.2 31.1 0.9Philippines 29.8 (1992) 20.7 (2003) 21.3 20.3 1.0Singapore … 3.3 (2000) 2.9 3.6 0.8Thailand 16.3 (1993) 7.0 (2005) 7.1 6.9 1.0Viet Nam 36.9 (1992) 20.2 (2006) … … ...
The Pacific Cook Islands … … … … ...Fiji, Rep. of … 6.9 (1993) ... ... ...Kiribati … … ... ... ...Marshall Islands … … … … ...Micronesia, Fed. States of … … … … ...Nauru … 4.8 (2007) 2.9 6.9 0.4Palau … … … … ...Papua New Guinea … 18.1 (2005) 14.6 21.0 0.7Samoa … 1.7 (1999) ... … …Solomon Islands … 11.5 (2006) ... … …Timor-Leste 40.6 (2002) 41.5 (2003) 38.1 43.0 0.9 (2002)Tonga … … ... ... ...Tuvalu … 1.6 (2007) ... ... ...Vanuatu 10.6 (1996) 11.7 (2007) 9.0 14.1 0.6
Developed Member EconomiesAustralia … … ... ... ...Japan … … ... ... ...New Zealand … … … … ...

18
Framework of Inclusive Growth Indicators
POVERTY AND INEqUALITY
Table 1.2 Nonincome Poverty and Inequality (continued)
a Brunei Darussalam is a regional member of ADB, but it is not classified as a developing member.
Sources: Millennium Indicators Database Online (UNSD 2011), World Health Organization (WHO 2011) Global Health Observatory Database, UNICEF Childinfo Website (www.childinfo.org/index.html).
5 Prevalence of Underweight Children Under-Five Years of Age (percent)
Urbanity Wealth Quintile
Rural Urban Rural to Urban Ratio Lowest Highest Lowest to Highest RatioDeveloping Member Economies Central and West Asia
Afghanistan ... ... ... ... ... ...Armenia ... ... ... 4.6 3.2 1.4 (2005)Azerbaijan 11.5 3.7 3.1 (2006) 15.4 2.2 7.0 (2006)Georgia 1.4 0.9 1.6 (2009) ... ... ...Kazakhstan ... ... ... 4.6 1.6 2.8 (2006)Kyrgyz Republic ... ... ... 1.6 2.0 0.8 (2006)Pakistan 32.6 29.1 1.1 (2001) ... ... ...Tajikistan 15.9 12.2 1.3 (2007) 16.6 13.0 1.3 (2007)Turkmenistan 8.7 7.3 1.2 (2005) 7.8 2.4 3.2 (2005)Uzbekistan ... ... ... 4.5 3.1 1.5 (2006)
East AsiaChina, People’s Rep. of 8.0 3.0 2.7 (2005) ... ... ...Hong Kong, China … … ... … … ...Korea, Rep. of ... ... ... ... ... ...Mongolia 5.6 4.5 1.2 (2005) 7.3 2.6 2.8 (2005)Taipei,China … … ... … … ...
South AsiaBangladesh 43.0 33.4 1.3 (2007) 50.5 26.0 1.9 (2007)Bhutan ... ... ... ... ... ...India 45.6 32.7 1.4 (2005) 56.6 19.7 2.9 (2005)Maldives ... ... ... ... ... ...Nepal 40.7 23.1 1.8 (2006) 47.0 18.8 2.5 (2006)Sri Lanka ... ... ... 29.3 11.2 2.6 (2007)
Southeast AsiaBrunei Darussalam a ... ... ... ... ... ...Cambodia 30.4 21.1 1.4 (2008) 34.5 19.3 1.8 (2008)Indonesia ... ... ... ... ... ...Lao PDR 33.8 20.0 1.7 (2006) 38.4 14.3 2.7 (2006)Malaysia ... ... ... ... ... ...Myanmar 31.0 24.7 1.3 (2003) ... ... ...Philippines ... ... ... ... ... ...Singapore ... ... ... ... ... ...Thailand 7.8 4.7 1.7 (2005) 10.7 3.3 3.3 (2005)Viet Nam ... ... ... ... ... ...
The Pacific Cook Islands ... ... ... ... ... ...Fiji, Rep. of ... ... ... ... ... ...Kiribati ... ... ... ... ... ...Marshall Islands ... ... ... ... ... ...Micronesia, Fed. States of ... ... ... ... ... ...Nauru ... ... ... 6.7 2.5 2.7 (2007)Palau ... ... ... ... ... ...Papua New Guinea 19.8 12.4 1.6 (2005) ... ... ...Samoa ... ... ... ... ... ...Solomon Islands … … ... … … ...Timor-Leste ... ... ... ... ... ...Tonga ... ... ... ... ... ...Tuvalu ... ... ... 0.7 0.0 ... (2007)Vanuatu ... ... ... ... ... ...
Developed Member EconomiesAustralia ... ... ... ... ... ...Japan ... ... ... ... ... ...New Zealand ... ... ... ... ... ...

19
Key Indicators for Asia and the Pacific 2011 Special Supplement
SPECIAL SUPPLEMEN
TPOVERTY AND INEqUALITY
Table 1.2 Nonincome Poverty and Inequality
a Brunei Darussalam is a regional member of ADB, but it is not classified as a developing member.
continued
6 Under-Five Mortality Rate (per 1,000 live births)
TotalGender
Female Male Male to Female Ratio Female Male Male to Female Ratio
1990 2009 1990 2009 Developing Member Economies Central and West Asia
Afghanistan 250.0 198.6 237.0 262.0 1.1 189.0 208.0 1.1 Armenia 56.4 21.6 49.0 63.0 1.3 19.0 24.0 1.3 Azerbaijan 97.7 33.5 85.0 109.0 1.3 29.0 37.0 1.3 Georgia 47.0 29.1 42.0 51.0 1.2 26.0 32.0 1.2 Kazakhstan 60.3 28.7 51.0 69.0 1.4 24.0 33.0 1.4 Kyrgyz Republic 74.7 36.6 69.0 80.0 1.2 34.0 39.0 1.1 Pakistan 130.4 87.0 130.0 130.0 1.0 87.0 87.0 1.0 Tajikistan 117.0 61.2 97.0 136.0 1.4 51.0 71.0 1.4 Turkmenistan 98.6 45.3 84.0 112.0 1.3 39.0 52.0 1.3 Uzbekistan 73.7 36.1 70.0 77.0 1.1 35.0 38.0 1.1
East AsiaChina, People’s Rep. of 45.5 19.1 52.0 39.0 0.8 22.0 17.0 0.8 Hong Kong, China ... ... ... ... … ... ... …Korea, Rep. of 8.7 4.9 ... ... … ... ... …Mongolia 101.0 28.8 85.0 117.0 1.4 24.0 33.0 1.4 Taipei,China ... ... ... ... … ... ... …
South AsiaBangladesh 147.5 52.0 144.0 151.0 1.0 51.0 53.0 1.0 Bhutan 147.9 78.6 137.0 158.0 1.2 73.0 84.0 1.2 India 118.2 65.6 126.0 111.0 0.9 70.0 62.0 0.9 Maldives 112.8 12.7 111.0 114.0 1.0 11.0 14.0 1.3 Nepal 142.0 48.2 140.0 144.0 1.0 48.0 49.0 1.0 Sri Lanka 28.4 14.7 24.0 33.0 1.4 13.0 18.0 1.4
Southeast AsiaBrunei Darussalam a 11.3 6.7 11.0 12.0 1.1 6.0 7.0 1.2 Cambodia 116.7 87.5 107.0 126.0 1.2 80.0 95.0 1.2 Indonesia 85.6 38.9 77.0 93.0 1.2 35.0 42.0 1.2 Lao PDR 157.1 58.6 148.0 166.0 1.1 55.0 62.0 1.1 Malaysia 17.8 6.1 16.0 19.0 1.2 5.0 7.0 1.4 Myanmar 117.9 71.2 104.0 131.0 1.3 63.0 79.0 1.3 Philippines 59.1 33.1 53.0 64.0 1.2 30.0 36.0 1.2 Singapore 8.0 2.8 … … … 2.0 3.0 1.5 Thailand 31.6 13.5 27.0 36.0 1.3 12.0 15.0 1.3 Viet Nam 55.3 23.6 53.0 58.0 1.1 23.0 25.0 1.1
The Pacific Cook Islands 18.2 15.2 21.0 15.0 0.7 12.0 18.0 1.5 Fiji Rep. of 22.0 17.6 19.0 25.0 1.3 15.0 20.0 1.3 Kiribati 88.6 46.2 84.0 93.0 1.1 46.0 47.0 1.0 Marshall Islands 48.5 35.4 48.0 49.0 1.0 35.0 36.0 1.0 Micronesia, Fed. States of 57.7 38.5 57.0 58.0 1.0 38.0 39.0 1.0 Nauru 9.0 44.2 6.0 12.0 2.0 30.0 58.0 1.9 Palau 21.0 14.9 17.0 25.0 1.5 11.0 18.0 1.6 Papua New Guinea 91.3 68.3 87.0 95.0 1.1 65.0 71.0 1.1 Samoa 50.0 25.3 49.0 51.0 1.0 14.0 36.0 2.6 Solomon Islands 38.2 35.8 39.0 37.0 0.9 37.0 35.0 0.9 Timor-Leste 183.6 56.4 158.0 207.0 1.3 49.0 64.0 1.3 Tonga 22.5 19.1 20.0 24.0 1.2 18.0 20.0 1.1 Tuvalu 53.1 35.1 52.0 54.0 1.0 35.0 35.0 1.0 Vanuatu 40.1 16.3 42.0 39.0 0.9 17.0 16.0 0.9
Developed Member EconomiesAustralia 9.1 5.1 8.0 10.0 1.3 5.0 6.0 1.2 Japan 6.2 3.3 6.0 7.0 1.2 3.0 4.0 1.3 New Zealand 11.1 6.2 9.0 13.0 1.4 5.0 6.0 1.2

20
Framework of Inclusive Growth Indicators
a Brunei Darussalam is a regional member of ADB, but it is not classified as a developing member.
Sources: Millennium Indicators Database Online (UNSD 2011), Global Health Observatory (World Health Organization 2011), UNICEF Childinfo Website (www.childinfo.org/index.html).
Table 1.2 Nonincome Poverty and Inequality (continued)
POVERTY AND INEqUALITY
6 Under-Five Mortality Rate (per 1,000 live births)
Urbanity Wealth Quintile
Rural Urban Rural to Urban Ratio Lowest Highest Lowest to Highest RatioDeveloping Member Economies Central and West Asia
Afghanistan ... ... … ... ... …Armenia 42 26 1.6 (2005) 52 23 2.3 (2005)Azerbaijan 64 52 1.2 (2006) 63 41 1.5 (2006)Georgia 45 24 1.9 (2005) ... ... ... Kazakhstan 43 30 1.4 (2006) ... ... ... Kyrgyz Republic 50 35 1.4 (2006) ... ... ... Pakistan 100 78 1.3 (2007) 121 60 2.0 (2007)Tajikistan 83 70 1.2 (2005) ... ... ... Turkmenistan 100 73 1.4 (2000) 106 70 1.5 (2000)Uzbekistan 59 51 1.2 (2006) 72 42 1.7 (2006)
East AsiaChina, People’s Rep. of ... ... … ... ... ... Hong Kong, China ... ... … ... ... ... Korea, Rep. of ... ... … ... ... ... Mongolia 69 31 2.2 (2005) ... ... ... Taipei,China ... ... … ... ... ...
South AsiaBangladesh 77 63 1.2 (2007) 86 43 2.0 (2007)Bhutan ... ... … ... ... ... India 94 61 1.5 (2006) 118 39 3.0 (2006)Maldives 28 23 1.2 (2009) 28 21 1.3 (2009)Nepal 84 47 1.8 (2006) 98 47 2.1 (2006)Sri Lanka ... ... ...
Southeast AsiaBrunei Darussalam a ... ... … ... ... ... Cambodia 111 76 1.5 (2005) 127 43 3.0 (2005)Indonesia ... ... … 77 32 2.4 (2007)Lao PDR ... ... … ... ... ... Malaysia ... ... … ... ... ... Myanmar ... ... … ... ... ... Philippines 46 28 1.6 (2008) 59 17 3.5 (2008)Singapore ... ... … ... ... ... Thailand ... ... … ... ... ... Viet Nam 36 16 2.3 (2002) 53 16 3.3 (2002)
The Pacific Cook Islands ... ... … ... ... ... Fiji, Rep. of ... ... … ... ... ... Kiribati ... ... … ... ... ... Marshall Islands ... ... … ... ... ... Micronesia, Fed. States of ... ... … ... ... ... Nauru ... ... … ... ... ... Palau ... ... … ... ... ... Papua New Guinea ... ... … ... ... ... Samoa 17 3 5.7 (2009) 23 7 3.3 (2009)Solomon Islands ... ... … ... ... ... Timor-Leste 87 61 1.4 (2010) 87 52 1.7 (2010)Tonga ... ... … ... ... ... Tuvalu ... ... … ... ... ... Vanuatu 32 27 1.2 (2007) ... ... ...
Developed Member EconomiesAustralia ... ... … ... ... ... Japan ... ... … ... ... ... New Zealand ... ... … ... ... ...

21
Key Indicators for Asia and the Pacific 2011 Special Supplement
SPECIAL SUPPLEMEN
T
Policy Pillar 1: High, Efficient and Sustained Growth to Create Productive Jobs and Economic Opportunity
Economic Growth and Employment
High, efficient, and sustained growth is the key to creating productive and decent job opportunities. It is essential not only to reduce poverty but also to create resources that provide access to education, health, and physical infrastructure, and resources that facilitate equal opportunities. “Growth is a necessary, if not sufficient, condition for broader development, enlarging the scope for individuals to be productive and creative (Commission on Growth and Development 2008, 1).” Accelerating growth and expanding opportunities to provide decent and productive jobs to the increasing labor force in the developing economies of Asia is an integral part of an inclusive growth strategy.
What are the proposed indicators?Five indicators are proposed:
• Growth rate of gross domestic product (GDP) per capita at purchasing power parity (PPP) (constant 2005 PPP $),
• Growth rate of average per capita income/consumption in 2005 PPP $ (lowest quintile, top quintile, and total),
• Employment rate,• Elasticity of total employment to total GDP
(employment elasticities), and• Number of own-account and contributing family
workers per 100 wage and salaried workers.
The first indicator measures growth in the per capita GDP from the national accounts, while the second indicator measures how fast the income (or consumption) of those at the bottom end of the income (or consumption) distribution are growing as compared to the per capita income (or consumption) of the total population based on household income (or consumption) surveys. Employment elasticity measures growth in employment associated with one percentage point of economic growth. Employment rate refers to the proportion of the working-age population that is employed (15 years and above; and for youth, 15–24 years). It is a crucial indicator of the ability of an economy to create jobs. The last indicator is a measure of the extent of “vulnerable employment”—which is more likely in informal jobs without access to social protection measures—to wage and salary employment expected to be more formal in status and provides a measure of decent employment.
Trends in Economies
The average per capita GDP grew much faster during 2000–2009 as compared to that during 1990–2000. The simple unweighted average annual growth of the per capita GDP for 35 economies for which data are available was 4.2% for 2000–2009 as compared to a growth of 1.0% during 1990–2000. For three developed economies–Australia, Japan, and New Zealand, the annual average growth rate of per capita income was 1% during 2000–2009 and 1.6% during 1990–2000. In the current decade, developing economies have grown faster, leading to increases in the per capita incomes in real terms. However, the growth varied substantially. The per capita incomes rose by 5% or more annually in Azerbaijan, Cambodia, the People’s Republic of China, Georgia, India, Kazakhstan, Mongolia, Turkmenistan, and Viet Nam. The per capita incomes in the PRC grew at more than 9% per annum during the entire 1990–2010, substantially cutting down extreme poverty in the country.
In 14 countries, the employment rates for men and women together were higher in the more recent year (usually a year between 2005 and 2009) than in the earlier year (generally a year between 1990 and 1996). The average elasticity of total employment during 2004–2008 when compared to that during 1992–1996 improved for many central and west Asian economies that were affected by the events in the early nineties, but did not improve much for other countries during the same period, and actually were even lower for many. For example, the employment elasticity was actually lower in India during 2004–2008—a period of high growth rate compared to that during 1992–1996, a period of much slower growth. Available data also show that in many developing economies, a large workforce comprises “own-account and contributing family workers,” (vulnerable employment) as compared to more stable wage-paid employees.
Inequalities in per Capita Income/Consumption
Growth in mean per capita income (or consumption) based on household surveys (mostly conducted during 1999 to 2009) for 19 economies show that for 8 economies, the average annual growth in the mean per capita income (or consumption) measured in 2005 PPP, was faster for the lowest quintile compared to the total population and the highest quintile.
In almost all economies, employment rates for males are higher than those for females. Further, females tend to be employed more as “own-account and contributing family workers” (or vulnerable employment), as seen by the number of females in vulnerable employment per 100 female wage employees.

22
Framework of Inclusive Growth Indicators
Figure S7Growth Rate in GDP per Capita at PPP (constant 2005 PPP $), 2000–2005 and 2005–2009
Figure S8Growth Rate of Average Per Capita Income/Consumption in 2005 PPP $: Lowest Quintile and Total Population, Latest Period
Figure S9Number of Own-Account and Contributing Family Workers (per 100 wage and salaried workers) by Gender, 2007 or Latest Year
Note: GDP = gross domestic product, Lao PDR = Lao People's Democratic Republic, PPP = purchasing power parity.Source: Table 2.1.
Note: Lao PDR = Lao People's Democratic Republic, PPP = purchasing power parity.
-10
-5
0
5
10
15
20
Kirib
ati
Mic
rone
sia,
Fed
. Sta
tes
of
Fiji,
Rep
. of
New
Zea
land
Japa
n
Tong
a
Sing
apor
e
Brun
ei D
arus
sala
m
Timor
-Les
te
Sam
oa
Aust
ralia
Thai
land
Mal
aysi
a
Paki
stan
Nep
al
Philip
pine
s
Hong
Kon
g, C
hina
Papu
a N
ew G
uine
a
Kore
a, R
ep. o
f
Solo
mon
Isla
nds
Vanu
atu
Arm
enia
Indo
nesi
a
Cam
bodi
a
Kyrg
yz R
epub
lic
Geor
gia
Kaza
khst
an
Bang
lade
sh
Tajik
ista
n
Sri L
anka
Mon
golia
Mal
dive
s
Lao
PDR
Viet
Nam
Indi
a
Uzbe
kist
an
Bhut
an
Turk
men
ista
n
Afgh
anis
tan
Chin
a, P
eopl
e's
Rep.
of
Azer
baija
n
Perc
ent
2000–2005 2005–2009
-10
-5
0
5
10
15
Mal
aysi
a
Cam
bodi
a
Tajik
ista
n
Viet
Nam
Turk
men
ista
n
Paki
stan
Azer
baija
n
Nep
al
Kaza
khst
an
Arm
enia
Sri L
anka
Lao
PDR
Thai
land
Kyrg
yz R
epub
lic
Bang
lade
sh
Tim
or-L
este
Philip
pine
s
Geor
gia
Mon
golia
Num
ber o
f wor
kers
Lowest Quintile Total Population
0
100
200
300
400
500
600
700
800
Tuva
lu
Hong
Kon
g, C
hina
Aust
ralia
Sing
apor
e
New
Zea
land
Japa
n
Mal
aysi
a
Kore
a, R
ep. o
f
Kaza
khst
an
Sam
oa
Fiji,
Rep
. of
Sri L
anka
Kyrg
yz R
epub
lic
Philip
pine
s
Mal
dive
s
Thai
land
Mon
golia
Geor
gia
Azer
baija
n
Indo
nesi
a
Paki
stan
Viet
Nam
Bhut
an
Cam
bodi
a
Nep
al
Bang
lade
sh
Female Male Total
PolIcy PIllAr 1

23
Key Indicators for Asia and the Pacific 2011 Special Supplement
SPECIAL SUPPLEMEN
T
a Brunei Darussalam is a regional member of ADB, but it is not classified as a developing member.
Source: ADB estimates based on data from World Development Indicators Online (World Bank 2011).
Table 2.1 Economic Growth and Employment
PolIcy PIllAr 1
7 Growth Rate of GDP per Capita at PPP(constant 2005 PPP $)
1990–1995 1995–2000 2000–2005 2005–2009Developing Member Economies Central and West Asia
Afghanistan … … 9.9 (2002–2005) 9.5Armenia -10.3 6.1 12.3 4.0Azerbaijan -17.2 6.1 12.5 18.1Georgia -21.2 7.2 8.0 4.7Kazakhstan -8.7 3.7 10.0 4.7Kyrgyz Republic -13.3 4.2 2.8 4.7Pakistan 2.0 0.8 2.5 2.0Tajikistan -19.0 -1.3 8.1 4.9Turkmenistan -11.4 2.6 15.0 8.9Uzbekistan -6.1 2.2 4.2 6.9
East AsiaChina, People’s Rep. of 10.9 7.6 9.1 10.8Hong Kong, China 3.6 1.0 3.7 2.4Korea, Rep. of 6.7 3.5 4.0 2.8Mongolia -3.3 1.7 5.1 5.2Taipei,China … … … …
South AsiaBangladesh 2.3 3.2 3.7 4.7Bhutan 5.5 4.2 4.8 7.5India 3.1 4.0 5.4 6.8Maldives … 6.2 3.1 5.4Nepal 2.6 2.3 1.1 2.3Sri Lanka 4.2 4.3 2.9 5.1
Southeast AsiaBrunei Darussalam a 0.4 -1.1 0.0 0.5 (2005–2007)Cambodia 4.6 (1993–1995) 4.9 7.5 4.6Indonesia 6.2 -0.7 3.4 4.3Lao PDR 3.4 3.7 4.5 5.5Malaysia 6.7 2.3 2.7 2.0Myanmar … … … …Philippines -0.1 1.8 2.5 2.4Singapore 5.7 3.5 4.3 0.3Thailand 7.3 -0.3 3.9 1.8Viet Nam 6.1 5.6 6.1 5.8
The Pacific Cook Islands … … … …Fiji, Rep. of 1.4 1.2 1.8 -1.1Kiribati -0.5 4.4 -0.1 -1.4Marshall Islands … … … …Micronesia, Fed. States of 2.6 -0.1 0.1 -1.4Nauru … … … …Palau … … … …Papua New Guinea 5.8 -2.9 -0.9 2.7Samoa 0.2 2.9 4.8 0.9Solomon Islands 4.9 -5.4 -1.6 3.0Timor-Leste … 13.1 (1999–2000) -4.0 0.6Tonga 3.2 1.6 1.3 -0.3Tuvalu … … … …Vanuatu 0.4 1.6 -1.6 3.4
Developed Member EconomiesAustralia 1.3 3.1 1.9 1.2Japan 1.1 0.7 1.2 -0.5New Zealand 1.8 1.6 2.5 -0.6

24
Framework of Inclusive Growth Indicators
a Derived from mean per capita income/consumption share of the lowest 20% and highest 20% groups.b Brunei Darussalam is a regional member of ADB, but it is not classified as a developing member.
Sources: PovcalNet Database Online (World Bank 2011), ADB staff estimates.
Table 2.1 Economic Growth and Employment
PolIcy PIllAr 1
8 Growth Rate of Average Per Capita Income/Consumption in 2005 PPP $ a
Earliest Year Latest Year
Total Lowest Quintile Highest Quintile Total Lowest Quintile Highest Quintile Developing Member Economies Central and West Asia
Afghanistan … … … … … …Armenia -2.8 3.6 -5.5 (1996–2001) 4.3 6.3 2.8 (2001–2008)Azerbaijan 4.2 5.4 5.0 (1995–2001) 4.9 5.9 4.1 (2001–2008)Georgia -7.0 -7.8 -6.1 (1996–2000) -1.3 -2.7 -0.7 (2000–2008)Kazakhstan 2.3 3.3 2.1 (1993–2001) 4.4 5.5 4.5 (2001–2007)Kyrgyz Republic -11.8 6.6 -16.7 (1993–1999) 2.5 4.4 2.6 (1999–2007)Pakistan 3.2 4.6 2.9 (1991–2001) 5.2 4.2 6.5 (2001–2005)Tajikistan … … … 8.5 7.8 9.4 (1999–2004)Turkmenistan … … … 15.9 13.6 18.1 (1993–1998)Uzbekistan … … … … … …
East AsiaChina, People’s Rep. of … … … … … …Hong Kong, China … … … … … …Korea, Rep. of … … … … … …Mongolia 0.9 1.1 0.8 (1995–2002) -5.5 -6.6 -5.5 (2002–2005)Taipei,China … … … … … …
South AsiaBangladesh 2.0 1.1 3.3 (1992–2000) 2.2 2.5 2.5 (2000–2005)Bhutan … … … … … …India … … … … … …Maldives … … … … … …Nepal … … … 4.8 1.7 6.9 (1995–2004)Sri Lanka 2.4 0.2 3.7 (1990–2002) 3.9 4.4 3.6 (2002–2006)
Southeast AsiaBrunei Darussalam b … … … … … …Cambodia 1.9 0.3 2.4 (1994–2004) 8.6 7.0 10.2 (2004–2007)Indonesia … … … … … …Lao PDR 1.7 0.9 2.0 (1992–2002) 3.6 1.6 4.9 (2002–2008)Malaysia 5.2 3.9 5.7 (1992–1997) 13.4 6.4 16.2 (2004–2009)Myanmar … … … … … …Philippines 2.7 1.7 3.1 (1991–2000) -0.7 0.0 -1.3 (2000–2006)Singapore … … … … … …Thailand 0.7 1.7 0.1 (1992–1999) 3.3 4.0 2.9 (1999–2004)Viet Nam 4.3 3.8 4.7 (1993–2002) 8.1 7.8 8.1 (2002–2008)
The Pacific Cook Islands … … … … … …Fiji, Rep. of … … … … … …Kiribati … … … … … …Marshall Islands … … … … … …Micronesia, Fed. States of … … … … … …Nauru … … … … … …Palau … … … … … …Papua New Guinea … … … … … …Samoa … … … … … …Solomon Islands … … … … … …Timor-Leste … … … 2.0 6.8 -0.1 (2001–2007)Tonga … … … … … …Tuvalu … … … … … …Vanuatu … … … … … …
Developed Member EconomiesAustralia … … … … … …Japan … … … … … …New Zealand … … … … … …
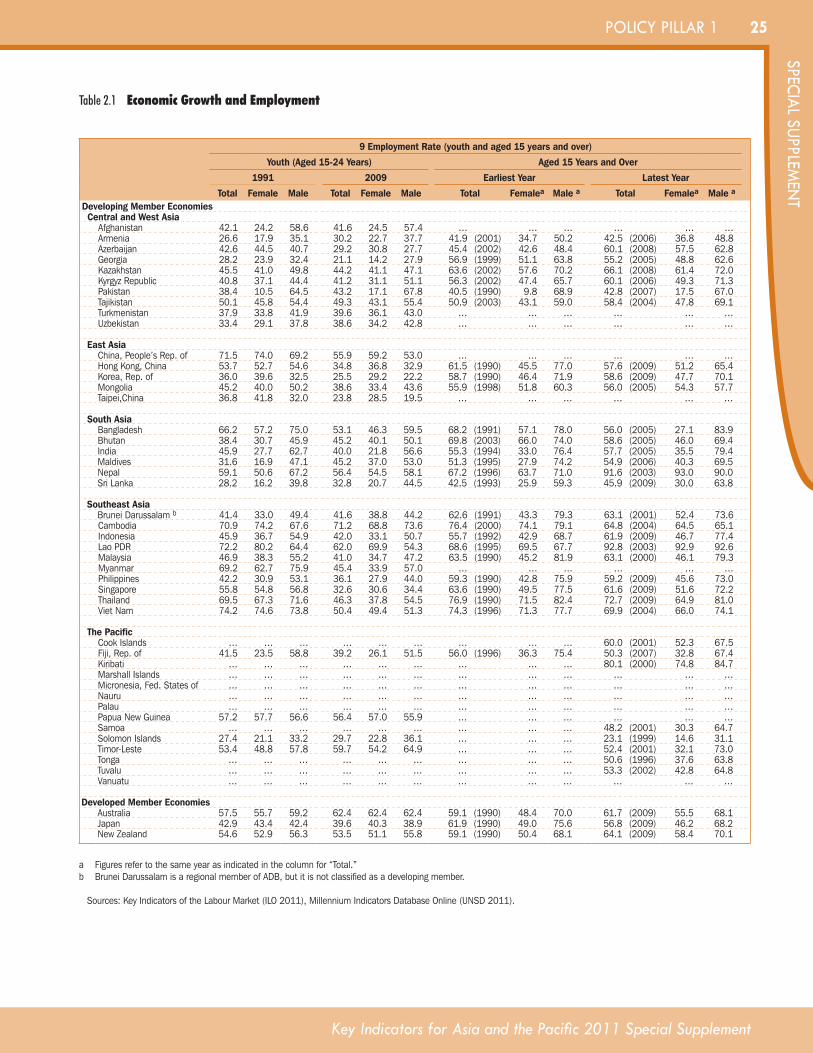
25
Key Indicators for Asia and the Pacific 2011 Special Supplement
SPECIAL SUPPLEMEN
T
a Figures refer to the same year as indicated in the column for “Total.”b Brunei Darussalam is a regional member of ADB, but it is not classified as a developing member.
Sources: Key Indicators of the Labour Market (ILO 2011), Millennium Indicators Database Online (UNSD 2011).
Table 2.1 Economic Growth and Employment
PolIcy PIllAr 1
9 Employment Rate (youth and aged 15 years and over)
Youth (Aged 15-24 Years) Aged 15 Years and Over
1991 2009 Earliest Year Latest Year
Total Female Male Total Female Male Total Femalea Male a Total Femalea Male a
Developing Member Economies Central and West Asia
Afghanistan 42.1 24.2 58.6 41.6 24.5 57.4 … … … … … …Armenia 26.6 17.9 35.1 30.2 22.7 37.7 41.9 (2001) 34.7 50.2 42.5 (2006) 36.8 48.8Azerbaijan 42.6 44.5 40.7 29.2 30.8 27.7 45.4 (2002) 42.6 48.4 60.1 (2008) 57.5 62.8Georgia 28.2 23.9 32.4 21.1 14.2 27.9 56.9 (1999) 51.1 63.8 55.2 (2005) 48.8 62.6Kazakhstan 45.5 41.0 49.8 44.2 41.1 47.1 63.6 (2002) 57.6 70.2 66.1 (2008) 61.4 72.0Kyrgyz Republic 40.8 37.1 44.4 41.2 31.1 51.1 56.3 (2002) 47.4 65.7 60.1 (2006) 49.3 71.3Pakistan 38.4 10.5 64.5 43.2 17.1 67.8 40.5 (1990) 9.8 68.9 42.8 (2007) 17.5 67.0Tajikistan 50.1 45.8 54.4 49.3 43.1 55.4 50.9 (2003) 43.1 59.0 58.4 (2004) 47.8 69.1Turkmenistan 37.9 33.8 41.9 39.6 36.1 43.0 … … … … … …Uzbekistan 33.4 29.1 37.8 38.6 34.2 42.8 … … … … … …
East AsiaChina, People’s Rep. of 71.5 74.0 69.2 55.9 59.2 53.0 … … … … … …Hong Kong, China 53.7 52.7 54.6 34.8 36.8 32.9 61.5 (1990) 45.5 77.0 57.6 (2009) 51.2 65.4Korea, Rep. of 36.0 39.6 32.5 25.5 29.2 22.2 58.7 (1990) 46.4 71.9 58.6 (2009) 47.7 70.1Mongolia 45.2 40.0 50.2 38.6 33.4 43.6 55.9 (1998) 51.8 60.3 56.0 (2005) 54.3 57.7Taipei,China 36.8 41.8 32.0 23.8 28.5 19.5 … … … … … …
South AsiaBangladesh 66.2 57.2 75.0 53.1 46.3 59.5 68.2 (1991) 57.1 78.0 56.0 (2005) 27.1 83.9Bhutan 38.4 30.7 45.9 45.2 40.1 50.1 69.8 (2003) 66.0 74.0 58.6 (2005) 46.0 69.4India 45.9 27.7 62.7 40.0 21.8 56.6 55.3 (1994) 33.0 76.4 57.7 (2005) 35.5 79.4Maldives 31.6 16.9 47.1 45.2 37.0 53.0 51.3 (1995) 27.9 74.2 54.9 (2006) 40.3 69.5Nepal 59.1 50.6 67.2 56.4 54.5 58.1 67.2 (1996) 63.7 71.0 91.6 (2003) 93.0 90.0Sri Lanka 28.2 16.2 39.8 32.8 20.7 44.5 42.5 (1993) 25.9 59.3 45.9 (2009) 30.0 63.8
Southeast AsiaBrunei Darussalam b 41.4 33.0 49.4 41.6 38.8 44.2 62.6 (1991) 43.3 79.3 63.1 (2001) 52.4 73.6Cambodia 70.9 74.2 67.6 71.2 68.8 73.6 76.4 (2000) 74.1 79.1 64.8 (2004) 64.5 65.1Indonesia 45.9 36.7 54.9 42.0 33.1 50.7 55.7 (1992) 42.9 68.7 61.9 (2009) 46.7 77.4Lao PDR 72.2 80.2 64.4 62.0 69.9 54.3 68.6 (1995) 69.5 67.7 92.8 (2003) 92.9 92.6Malaysia 46.9 38.3 55.2 41.0 34.7 47.2 63.5 (1990) 45.2 81.9 63.1 (2000) 46.1 79.3Myanmar 69.2 62.7 75.9 45.4 33.9 57.0 … … … … … …Philippines 42.2 30.9 53.1 36.1 27.9 44.0 59.3 (1990) 42.8 75.9 59.2 (2009) 45.6 73.0Singapore 55.8 54.8 56.8 32.6 30.6 34.4 63.6 (1990) 49.5 77.5 61.6 (2009) 51.6 72.2Thailand 69.5 67.3 71.6 46.3 37.8 54.5 76.9 (1990) 71.5 82.4 72.7 (2009) 64.9 81.0Viet Nam 74.2 74.6 73.8 50.4 49.4 51.3 74.3 (1996) 71.3 77.7 69.9 (2004) 66.0 74.1
The Pacific Cook Islands … … … … … … … … … 60.0 (2001) 52.3 67.5Fiji, Rep. of 41.5 23.5 58.8 39.2 26.1 51.5 56.0 (1996) 36.3 75.4 50.3 (2007) 32.8 67.4Kiribati … … … … … … … … … 80.1 (2000) 74.8 84.7Marshall Islands … … … … … … … … … … … …Micronesia, Fed. States of … … … … … … … … … … … …Nauru … … … … … … … … … … … …Palau … … … … … … … … … … … …Papua New Guinea 57.2 57.7 56.6 56.4 57.0 55.9 … … … … … …Samoa … … … … … … … … … 48.2 (2001) 30.3 64.7Solomon Islands 27.4 21.1 33.2 29.7 22.8 36.1 … … … 23.1 (1999) 14.6 31.1Timor-Leste 53.4 48.8 57.8 59.7 54.2 64.9 … … … 52.4 (2001) 32.1 73.0Tonga … … … … … … … … … 50.6 (1996) 37.6 63.8Tuvalu … … … … … … … … … 53.3 (2002) 42.8 64.8Vanuatu … … … … … … … … … … … …
Developed Member EconomiesAustralia 57.5 55.7 59.2 62.4 62.4 62.4 59.1 (1990) 48.4 70.0 61.7 (2009) 55.5 68.1Japan 42.9 43.4 42.4 39.6 40.3 38.9 61.9 (1990) 49.0 75.6 56.8 (2009) 46.2 68.2New Zealand 54.6 52.9 56.3 53.5 51.1 55.8 59.1 (1990) 50.4 68.1 64.1 (2009) 58.4 70.1

26
Framework of Inclusive Growth Indicators
a Employment elasticity is the average percentage point change in employment for a given employed population group (total, female, male) associated with a 1 percentage point change in output over a selected period.
b Brunei Darussalam is a regional member of ADB, but it is not classified as a developing member.
Source: Key Indicators of the Labour Market (ILO 2011).
Table 2.1 Economic Growth and Employment
PolIcy PIllAr 1
10 Elasticity of Total Employment to Total GDP a
Total Female Male
1992–1996 2004–2008 1992–1996 2004–2008 1992–1996 2004–2008Developing Member Economies Central and West Asia
Afghanistan … … … … … …Armenia 0.10 0.10 0.19 0.09 0.02 0.11Azerbaijan -0.06 0.13 -0.07 0.12 -0.05 0.13Georgia 0.15 -0.08 0.12 -0.10 0.17 -0.06Kazakhstan 0.06 0.20 0.02 0.22 0.10 0.17Kyrgyz Republic -0.09 0.44 -0.07 0.38 -0.10 0.48Pakistan 0.52 0.77 -0.10 1.48 0.60 0.63Tajikistan 0.22 0.76 0.16 0.71 0.28 0.79Turkmenistan -0.26 0.23 -0.27 0.24 -0.26 0.21Uzbekistan -0.68 0.43 -0.74 0.42 -0.63 0.44
East AsiaChina, People’s Rep. of 0.10 0.10 0.12 0.10 0.08 0.09Hong Kong, China 0.33 0.33 0.75 0.52 0.07 0.16Korea, Rep. of 0.29 0.22 0.36 0.24 0.24 0.20Mongolia 0.61 0.22 0.67 0.26 0.55 0.19Taipei,China 0.19 0.45 0.32 0.67 0.10 0.28
South AsiaBangladesh 0.44 0.39 0.18 0.45 0.60 0.35Bhutan -0.46 0.46 -0.87 0.91 -0.36 0.27India 0.28 0.24 0.32 0.28 0.27 0.22Maldives 0.60 0.49 1.39 0.57 0.37 0.45Nepal 0.58 0.95 0.82 1.18 0.43 0.77Sri Lanka 0.32 0.34 0.32 0.55 0.32 0.22
Southeast AsiaBrunei Darussalam b 1.11 1.27 1.76 1.86 0.75 0.86Cambodia 0.44 0.32 0.40 0.28 0.48 0.35Indonesia 0.29 0.43 0.26 0.43 0.31 0.42Lao PDR 0.32 0.37 0.34 0.37 0.30 0.38Malaysia 0.35 0.47 0.33 0.55 0.37 0.43Myanmar 0.35 0.13 0.36 0.15 0.34 0.11Philippines 0.79 0.58 0.92 0.66 0.72 0.54Singapore 0.26 0.58 0.26 0.63 0.26 0.53Thailand 0.11 0.21 0.11 0.19 0.11 0.23Viet Nam 0.30 0.28 0.30 0.27 0.31 0.30
The Pacific Cook Islands … … … … … …Fiji, Rep. of 0.21 -0.33 0.53 -0.29 0.07 -0.34Kiribati … … … … … …Marshall Islands … … … … … …Micronesia, Fed. States of … … … … … …Nauru … … … … … …Palau … … … … … …Papua New Guinea 0.35 0.59 0.42 0.60 0.28 0.58Samoa … … … … … …Solomon Islands 0.53 0.38 0.51 0.36 0.55 0.40Timor-Leste … … … … … …Tonga … … … … … …Tuvalu … … … … … …Vanuatu … … … … … …
Developed Member EconomiesAustralia 0.57 0.66 0.72 0.82 0.47 0.53Japan 0.19 -0.10 0.13 0.09 0.22 -0.24New Zealand 0.79 0.79 0.86 0.94 0.74 0.66

27
Key Indicators for Asia and the Pacific 2011 Special Supplement
SPECIAL SUPPLEMEN
T
a Brunei Darussalam is a regional member of ADB, but it is not classified as a developing member.
Source: Key Indicators of the Labor Market (ILO 2011).
Table 2.1 Economic Growth and Employment
PolIcy PIllAr 1
11 Number of Own-Account and Contributing Family Workers(per 100 wage and salaried workers)
Total Female Male
1990 2007 1990 2007 1990 2007Developing Member Economies Central and West Asia
Afghanistan … … … … … …Armenia 74.2 (1997) 101.2 … … … …Azerbaijan 68.4 (2003) 127.2 75.3 (2003) 201.7 63.8 (2003) 79.9Georgia 124.9 (1998) 169.4 126.8 (1998) 187.7 (2005) 123.1 (1998) 185.8 (2005)Kazakhstan 69.4 (2001) 48.8 82.1 (2001) 53.3 58.8 (2001) 47.6Kyrgyz Republic 120.5 (2002) 93.0 (2006) 115.0 (2002) 90.9 (2006) 125.0 (2002) 94.5 (2006)Pakistan 190.2 (1995) 165.1 302.3 (1995) 305.8 179.3 (1995) 143.7Tajikistan … … … … … …Turkmenistan … … … … … …Uzbekistan … … … … … …
East AsiaChina, People’s Rep. of … … … … … …Hong Kong, China 6.2 (1993) 8.0 3.8 (1993) 4.6 7.7 (1993) 11.4Korea, Rep. of 18.9 36.9 43.1 40.3 3.9 34.5Mongolia 137.1 (2000) 152.1 (2003) 126.1 (2000) 137.3 (2003) 147.5 (2000) 166.6 (2003)Taipei,China … … … … … …
South AsiaBangladesh 558.3 (1996) 612.8 (2005) 977.5 (1996) 740.4 (2005) 405.8 (1996) 580.8 (2005)Bhutan … 132.3 (2005) … 420.9 (2005) … 75.1 (2005)India … … … … … …Maldives 99.5 53.7 (2006) 152.3 104.5 (2006) 89.6 32.0 (2006)Nepal … 290.6 (2001) … 654.7 (2001) … 185.1 (2001)Sri Lanka 64.4 (1997) 72.0 60.3 (1997) 80.2 66.4 (1997) 68.0
Southeast AsiaBrunei Darussalam a 4.3 (1991) … 3.6 (1991) … 4.7 (1991) …Cambodia 555.0 (2000) 514.5 (2001) 727.9 (2000) 634.0 (2001) 434.2 (2000) 423.4 (2001)Indonesia 177.2 (1997) 185.8 243.2 (2002) 221.5 180.3 (2002) 168.0Lao PDR 932.9 (1995) … 1766.5 (1995) … 598.3 (1995) …Malaysia 43.5 (1991) 30.1 35.1 (1991) 27.6 47.8 (1991) 31.5Myanmar … … … … … …Philippines 90.1 (1998) 87.5 97.2 (1998) 91.3 85.9 (1998) 85.2Singapore 9.4 (1991) 12.1 6.0 (1991) 8.1 11.9 (1991) 15.3Thailand 247.2 122.4 289.0 131.7 217.0 114.8Viet Nam 489.4 (1996) 289.1 (2004) 633.4 (1996) 371.3 (2004) 389.1 (1996) 233.4 (2004)
The Pacific
Cook Islands … … … … … …Fiji, Rep. of … 66.6 (2005) … 69.5 (2005) … 65.4 (2005)Kiribati … … … … … …Marshall Islands 37.5 (1999) … 42.9 (1999) … 35.3 (1999) …Micronesia, Fed. States of … … … … … …Nauru … … … … … …Palau … … … … … …Papua New Guinea … … … … … …Samoa … 95.6 (2001) … 60.4 (2001) … 116.0 (2001)Solomon Islands … … … … … …Timor-Leste … … … … … …Tonga 134.9 (1996) … 146.9 (1996) … 128.3 (1996) …Tuvalu … 2.0 (2002) … 1.7 (2002) … 2.2 (2002)Vanuatu … … … … … …
Developed Member EconomiesAustralia 12.2 10.6 9.7 7.6 14.1 13.2Japan 24.9 12.6 36.1 13.9 18.0 11.6New Zealand 1.5 14.4 2.2 10.9 0.9 17.8

28
Framework of Inclusive Growth Indicators
PolIcy PIllAr 1
Key Infrastructure Endowments
Lack of physical and financial infrastructure is a major impediment to inclusive growth in developing countries. It limits opportunities, especially for small firms, the poor, and those at the receiving end of the infrastructure gap—the rural and geographically disadvantaged populations. Basic economic infrastructure such as roads, telecommunications, electricity, and financial institutions are important to distribute the benefits of growth to the far-flung populations and regions, bridging the rural–urban divide and enabling inclusive growth. There is a strong relationship between modern energy access and inclusive development. Access to energy facilitates development by providing efficient energy for agriculture, industries, businesses, and households. Paved roads connect people to markets, education, and health services by transporting passengers and goods. Banks provide access for families and firms to appropriate financial products including savings, credit, insurance, and others, and are important from the financial inclusion perspective. Designing financial products that respond to the needs of the poor and middle class is key to financial inclusion. Mobile phones facilitate communication, bridge information gaps, and integrate markets.
What are the proposed indicators?Four indicators are proposed:
• Per capita consumption of electricity,• Percentage of paved roads,• Number of cellular phone subscriptions per 100
people, and• Depositors with other depository corporations per
1,000 adults.
These four indicators provide good measures of the ability of a country to provide (i) modern energy for industries, businesses, and households; (ii) road infrastructure through paved roads that last longer and are more conducive to faster road transport; (iii) access to modern communication through mobile networks; and (iv) financial access. In the absence of a direct indicator on access to paved roads, the percentage of paved roads has been proposed. The total number of deposit account holders relates to both the nonfinancial corporations and households for many reporting countries, due to lack of information on types of account holders.
Trends in Economies
Per capita consumption of electricity is growing rapidly in the region with increasing industrialization, household electrification, and wider use of electrical appliances for home heating, air conditioning, and cooking since 1990. But wide disparities exist across countries, with consumption ranging from 89 kilowatt-hours (kWh) per capita in Nepal to more than 11,000 kWh in Australia in 2008. Per capita
consumption in Cambodia grew on average by 19% between 2000 and 2008 and high growth was also recorded in Viet Nam (13%), the People’s Republic of China ([PRC] 12%), and Bangladesh (10%). Some of these high growth rates are increases from a very low base in 2000.
The percentage of paved roads fell in several countries, including Azerbaijan, Cambodia, Lao People’s Democratic Republic, Mongolia, the Philippines, and the PRC. This may be because more unpaved than paved roads are being constructed or because paved roads are being abandoned. In most countries, the percentages of paved roads increased. In 11 countries, growth of over 10 percentage points was recorded. High rates in terms of percentage points were reported by Sri Lanka (49.0), Brunei Darussalam (45.8), Thailand (43.2), Kazakhstan (34.8), and Viet Nam (24.1). Increases in the percentages of paved roads may be due to upgrading of dirt roads or because more new paved roads are being built than unpaved roads.
Cellular phone subscriptions have grown rapidly
over the last decade in developing Asian economies. In the five most populous countries, subscriptions grew fastest in Pakistan (79% per year), Bangladesh (73%), and India (71%). Growth rates were relatively lower in Indonesia (51%) and the PRC (26%), where subscription rates were already high in 2000.
The number of account holders has grown since 2004 until 2010 in countries for which data are available. In developing Asia, low-income households and small unorganized sector firms do not have access to many financial services, which is explained by the low number of depositors per 1,000 adults in these countries. The high ratios are observed in the Republic of Korea (4,522); Malaysia (2,276); Singapore (2,134); Thailand (1,802); and Mongolia (1,339).
Inequalities in Infrastructure Endowments
It would be useful to have data on the per capita consumption of electricity by residence (rural and urban). Similarly, data on roads, on percentage of villages that are accessible to paved roads, or percentage of rural roads that are also paved, are not available. For providing communication access to rural areas, it is helpful to know the proportion of rural population with access to a mobile network. The International Telecommunications Union is starting to collect data for this indicator by rural–urban. According to estimates from the International Telecommunications Union, 76% of the rural population in Asia is connected by a mobile network. Similarly, the breakup of depositors—nonfinancial corporations (small and large firms) and individuals (by sex)—is desirable to know the financial access to small firms and for women’s inclusion in control of financial resources.

29
Key Indicators for Asia and the Pacific 2011 Special Supplement
SPECIAL SUPPLEMEN
TPolIcy PIllAr 1
Note: Lao PDR = Lao People's Democratic Republic, kWh = Kilowatt hour.Source: Table 2.2.
Figure S10Electricity Consumption (per capita kWh), 1990 or Earliest Year and 2008
Figure S11Number of Cellular Phone Subscriptions (per 100 people), 2000 or Earliest Year and 2010
Figure S12Depositors with Other Depository Corporations (per 1,000 adults), 2004 and 2010 or Nearest Year
0
2000
4000
6000
8000
10000
12000
Nep
al
Mya
nmar
Cam
bodi
a
Bang
lade
sh
Sri L
anka
Paki
stan
Indi
a
Philip
pine
s
Indo
nesi
a
Viet
Nam
Kyrg
yz R
epub
lic
Mon
golia
Arm
enia
Uzbe
kist
an
Geor
gia
Tajik
ista
n
Thai
land
Turk
men
ista
n
Azer
baija
n
Chin
a, P
eopl
e's
Rep.
of
Mal
aysi
a
Kaza
khst
an
Hong
Kon
g, C
hina
Japa
n
Sing
apor
e
Brun
ei D
arus
sala
m
Kore
a, R
ep. o
f
New
Zea
land
Aust
ralia
Per c
apita
kW
h N
umbe
r of s
ubsc
riptio
nsN
umbe
r of d
epos
itors
0 20 40 60 80
100 120 140 160 180 200
Mya
nmar
So
lom
on Is
land
s M
arsh
all I
slan
ds
Kirib
ati
Mic
rone
sia,
Fed
. Sta
tes
of
Tuva
lu
Papu
a N
ew G
uine
a N
epal
Co
ok Is
land
s Af
ghan
ista
n Ba
ngla
desh
To
nga
Timor
-Les
te
Bhut
an
Cam
bodi
a Pa
kist
an
Nau
ru
Indi
a Tu
rkm
enis
tan
Chin
a, P
eopl
e's
Rep.
of
Lao
PDR
Pala
u Ge
orgi
a Uz
beki
stan
Sr
i Lan
ka
Philip
pine
s Ta
jikis
tan
Mon
golia
Sa
moa
In
done
sia
Kyrg
yz R
epub
lic
Japa
n Az
erba
ijan
Thai
land
Au
stra
lia
Kore
a, R
ep. o
f Br
unei
Dar
ussa
lam
N
ew Z
eala
nd
Fiji,
Rep
. of
Vanu
atu
Taip
ei,C
hina
M
alay
sia
Kaza
khst
an
Arm
enia
Si
ngap
ore
Mal
dive
s Vi
et N
am
Hong
Kon
g, C
hina
2010 2000 or earliest year
2008 1990 or earliest year
0
1,000
2,000
3,000
4,000
5,000
6,000
7,000
8,000
Azer
baija
n
Afgh
anis
tan
Cam
bodi
a
Kyrg
yz R
epub
lic
Paki
stan
Papu
a N
ew G
uine
a
Arm
enia
Philip
pine
s
Geor
gia
Tong
a
Indi
a
Bang
lade
sh
Kaza
khst
an
Uzbe
kist
an
Mal
dive
s
Mon
golia
Thai
land
Sing
apor
e
Mal
aysi
a
Kore
a, R
ep. o
f
Japa
n
2004 or earliest year 2010 or latest year

30
Framework of Inclusive Growth Indicators
PolIcy PIllAr 1
a Comprises of commercial banks and other deposit takers (except the central bank).b Figures refer to commercial banks only.c Brunei Darussalam is a regional member of ADB, but it is not classified as a developing member.
Sources: World Development Indicators Online (World Bank 2011), World Road Statistics (International Road Federation 2011), World Telecommunication Report Database (International Telecommunication Union 2011), Financial Access Survey (International Monetary Fund 2011).
Table 2.2 Key Infrastructure Endowments
12 Electricity Consumption(per capita kWh)
13 Paved Roads(percent of total roads)
14 Number of Cellular Phone Subscriptions
(per 100 people)
15 Depositors with Other Depository Corporations
(per 1,000 adults) a
1990 2000 2008 1990 2008 2000 2010 2004 2010Developing Member Economies Central and West Asia
Afghanistan … … … 13.3 29.3 (2006) 0.10 (2002) 41.39 33.5 (2008) 99.7Armenia 2718 1295 1578 99.2 90.5 0.57 125.01 212.3 588.8Azerbaijan 2584 2041 2317 93.9 (1994) 50.6 (2006) 5.18 99.04 18.1 (2005) 41.2Georgia 2673 1353 1678 93.8 94.1 (2007) 4.10 73.36 242.1 b 696.7Kazakhstan 5905 3170 4689 55.1 89.9 1.32 123.35 722.7 873.8Kyrgyz Republic 2314 1904 1449 90.0 91.1 (2001) 0.18 91.86 144.1 181.8Pakistan 277 374 436 54.0 65.4 (2006) 0.21 59.21 118.7 b 249.5 b
Tajikistan 3346 2177 2072 71.6 82.7 (1995) 0.02 86.37 … …Turkmenistan 2293 1698 2273 73.5 81.2 (2000) 0.17 63.42 … …Uzbekistan 2383 1780 1646 79.0 87.3 (2000) 0.21 76.34 518.8 958.7
East AsiaChina, People’s Rep. of 511 993 2455 72.1 53.5 6.72 64.04 … …Hong Kong, China 4178 5447 5866 100.0 100.0 80.31 190.21 … …Korea, Rep. of 2373 5907 8853 71.5 78.5 58.31 105.36 4279.3 b 4522.2 b
Mongolia 1523 1080 1473 10.2 3.5 (2002) 6.41 91.09 297.3 b 1339.1 b (2009)Taipei,China … … … … … 81.48 119.91 … …
South AsiaBangladesh 44 95 208 7.2 (1991) 9.5 (2003) 0.22 46.17 579.7 845.1Bhutan … … … 77.1 62.0 (2003) 0.36 (2003) 54.32 … …India 276 402 566 47.3 (1991) 49.3 0.34 61.42 636.8 b 747.3 b (2008)Maldives … … … … 100.0 (2005) 2.80 156.50 704.0 b 1200.1 b
Nepal 35 58 89 37.5 55.9 (2006) 0.04 30.69 … …Sri Lanka 153 296 409 32.0 (1991) 81.0 (2003) 2.30 83.22 … …
Southeast AsiaBrunei Darussalam c 4354 7539 8308 31.4 77.2 (2005) 29.05 109.07 … …Cambodia 10 (1995) 29 113 7.5 6.3 (2004) 1.05 57.65 17.7 108.1Indonesia 162 402 591 45.1 59.1 1.72 91.72 … …Lao PDR … … … 24.0 13.5 0.24 64.56 … 44.3 b
Malaysia 1178 2742 3490 70.0 82.8 (2006) 21.87 121.32 1820.7 2275.7Myanmar 45 75 97 10.9 11.9 (2005) 0.03 1.24 … …Philippines 376 501 588 16.6 (1994) 9.9 (2003) 8.35 85.67 513.8 (2005) 643.2Singapore 4983 7575 8185 97.1 100.0 70.10 143.66 2043.7 b 2134.3 b
Thailand 708 1462 2079 55.3 98.5 (2000) 4.84 100.81 1798.5 (2006) 1802.2Viet Nam 98 295 799 23.5 47.6 (2007) 1.00 175.30 … …
The PacificCook Islands … … … … … 3.10 38.46 … …Fiji, Rep. of … … … 44.5 49.2 (2000) 6.78 116.19 … …Kiribati … … … … … 0.36 10.05 … …Marshall Islands … … … … … 0.86 7.03 … …Micronesia, Fed. States of … … … 15.9 17.5 (2000) 0.09 (2002) 24.78 … …Nauru … … … … … 11.95 60.46 … …Palau … … … … … 12.56 (2002) 70.89 … …Papua New Guinea … … … 3.2 3.5 (2000) 0.16 27.84 203.1 (2005) 317.3Samoa … … … 42.0 (1995) 14.2 (2001) 1.42 91.43 … …Solomon Islands … … … 2.1 2.4 (2000) 0.28 5.57 … …Timor-Leste … … … … … 2.15 (2003) 53.42 … …Tonga … … … 27.0 (1995) 27.0 (2000) 0.18 52.18 1178.8 733.2 (2009)Tuvalu … … … … … 5.18 (2004) 25.44 … …Vanuatu … … … 21.6 23.9 (2000) 0.20 119.05 … …
Developed Member EconomiesAustralia 8527 10194 11217 35.0 38.7 (1998) 44.68 101.04 … …Japan 6486 7974 8071 69.2 79.6 (2007) 53.12 95.39 7984.9 b 7169.0 b
New Zealand 8301 9413 9492 57.0 65.9 39.97 114.92 … …

31
Key Indicators for Asia and the Pacific 2011 Special Supplement
SPECIAL SUPPLEMEN
T
Policy Pillar 2: Social Inclusion to Ensure Equal Access to Economic Opportunity
Access and Inputs to Education and Health Services
Basic schooling and good health are considered basic rights and are also considered both ends and means of economic development. Policies aimed at expanding human capacities with specific focus on the poor and marginalized sections, including women, are important to provide equality in accessing economic opportunities. Costs of education and health care for the poor often act as barriers to opportunities. Therefore, governments have a crucial role in investing in education and health services. Access and inputs to education and health services are the best measures of social protection, as lack of education and poor health undermine capabilities and equality of opportunities for better jobs and wages. Better health and nutrition for children improves their cognitive capabilities and has a bearing on their earning capacities and labor productivity.
What are the proposed indicators?Six indicators are proposed:
• School life expectancy (primary to tertiary),• Pupil–teacher ratio (primary);• Diphtheria, tetanus toxoid, and pertussis (DTP3)
immunization coverage among 1-year-olds; • Physicians, nurses, and midwives per 10,000
population;• Government expenditure on education as percentage
of total government expenditure; and• Government expenditure on health as a percentage
of total government expenditure.
The school life expectancy is the number of years that today’s children can expect to spend in school, given current enrollment ratios, and provides a picture of children’s current access to education. In the absence of good indicators on the quality of education, the pupil–teacher ratio is used as a proxy. The higher the pupil–teacher ratio, the lower the relative access of pupils to teachers and the less attention of the teacher per student—especially for children who need it more than others. Such students are likely to lose interest and drop out of school. The immunization indicator measures access to immunization from three diseases in infants, which threaten to impair their health. The density of health workers (physicians, nurses, and midwives) shows access to trained medical personnel.1 The last two indicators measure government spending in education and health, which are critical inputs for making these basic social services accessible to all.
1 The World Health Organization’s (WHO) World Health Report 2006 (WHO. 2006. Working Together for Health. World Health Report 2006. Geneva: WHO) estimated that countries with fewer than 23 physicians, nurses, and midwives per 10,000 population generally fail to achieve adequate coverage rates for selected primary health care interventions as prioritized by the Millennium Development Goals.
Trends in Economies
Between 1999 (or nearest year) and 2009, school life expectancies rose in all countries except in the Marshall Islands and Samoa. The average increase for 39 countries (excluding Australia, Japan, and New Zealand) was 1.3 years.
Pupil–teacher ratios have been generally improving over the years. Twenty economies had ratios 20 or below matching the ratios in the developed economies of Australia, Japan, and New Zealand. On the other end are Afghanistan, Bangladesh, Cambodia, India, and Pakistan with high ratios of 40 or more.
Immunization rates for diphtheria, tetanus toxoid, and pertussis (DTP3) have improved in the last 2 decades. Rates rose in 32 countries so the simple average of immunization coverage for all 43 economies increased from 78% in 1990 to 87% in 2009. By 2009, 18 countries had achieved 95% coverage, but 8 countries still had rates below 80% and these include India and Lao People’s Democratic Republic in addition to 5 Pacific Island countries.
Government expenditures on education are generally higher than expenditures on health in all countries. Exceptions include the developed economies of Australia, Japan, and New Zealand, and the Kyrgyz Republic where health expenditures were in the range of 15%–22% of total government expenditure.
Inequalities in access and Inputs to Education and Health
In 2009 (or nearest year), school life expectancies for girls ranged from 6 years in Pakistan and 8 years in Bangladesh to 16 years in the Republic of Korea and Hong Kong, China. On an average for 39 economies, boys’ school life expectancy went up from 11 years in 1999 to 12 in 2009, while girls started with only 10 years in 1999 but caught up to 12 years by 2009. Economies where females were at least 1 year behind males include Afghanistan, India, Republic of Korea, Nepal, and Pakistan.
Ratios of immunization rates for infants in households in the top quintile to those for infants in households in the bottom quintile available for 11 economies suggest that in most countries immunization rates, were higher for infants in the top quintile. In India, for example, where immunization coverage is only 66%, infants from the top quintile are nearly twice as likely to be immunized as those from the poorest families. The data for immunization coverage is based largely on administrative statistics for 2009, while the distributions across the wealth quintile are based on household surveys conducted between 1997 and 2007. They do not depict the recent picture and these gaps may have narrowed in recent years.

32
Framework of Inclusive Growth Indicators
PolIcy PIllAr 2
Note: Lao PDR = Lao People's Democratic Republic.Source: Table 3.1.
Figure S13School Life Expectancy, Primary to Tertiary, by Sex, 2009 or Latest Year
Figure S14Diptheria, Tetanus Toxoid, and Pertussis (DTP3) Immunization Coverage among 1-Year-Olds by Lowest and Highest Quintile, Latest Year
Figure S15Government Expenditure on Education and Health (percent of total government expenditure), 2010
0
5
10
15
20
25 Pa
kist
an
Afgh
anis
tan
Nep
al
Bang
lade
sh
Lao
PDR
Solo
mon
Isla
nds
Cam
bodi
a
Indi
a
Nau
ru
Viet
Nam
Vanu
atu
Tajik
ista
n
Bhut
an
Mar
shal
l Isl
ands
Uzbe
kist
an
Azer
baija
n
Chin
a, P
eopl
e's
Rep.
of
Philip
pine
s
Mal
dive
s
Kirib
ati
Arm
enia
Sam
oa
Geor
gia
Thai
land
Sri L
anka
Kyrg
yz R
epub
lic
Mal
aysi
a
Indo
nesi
a
Cook
Isla
nds
Fiji,
Rep
. of
Tong
a
Brun
ei D
arus
sala
m
Mon
golia
Japa
n
Kaza
khst
an
Kore
a, R
ep. o
f
Hong
Kon
g, C
hina
Aust
ralia
New
Zea
land
Num
ber o
f Yea
rs
Female Male
0.0 0.2 0.4 0.6 0.8 1.0 1.2 1.4 1.6 1.8 2.0
0
20
40
60
80
100
120
Indi
a
Cam
bodi
a
Paki
stan
Indo
nesi
a
Philip
pine
s
Nep
al
Bang
lade
sh
Viet
Nam
Kyrg
yz R
epub
lic
Uzbe
kist
an
Kaza
khst
an
Ratio
Perc
ent
Lowest 20% Highest 20% Highest 20% to Lowest 20% Ratio
0
5
10
15
20
25
30
Sri L
anka
Geor
gia
Mon
golia
Papu
a N
ew G
uine
a
Azer
baija
n
Kyrg
yz R
epub
lic
Timor
-Les
te
Aust
ralia
Japa
n
Arm
enia
Taip
ei,C
hina
Cook
Isla
nds
Chin
a, P
eopl
e's
Rep.
of
Kore
a, R
ep. o
f
Mal
dive
s
Cam
bodi
a
Philip
pine
s
Bhut
an
Indi
a
Bang
lade
sh
Sam
oa
Tajik
ista
n
New
Zea
land
Brun
ei D
arus
sala
m
Sing
apor
e
Kirib
ati
Hong
Kon
g, C
hina
Nep
al
Thai
land
Mal
aysi
a
Vanu
atu
Fiji,
Rep
. of
Perc
ent
Education Health

33
Key Indicators for Asia and the Pacific 2011 Special Supplement
SPECIAL SUPPLEMEN
TPolIcy PIllAr 2
a Brunei Darussalam is a regional member of ADB, but it is not classified as a developing member.
Source: Institute for Statistics Online (UNESCO 2011).
Table 3.1 Access and Inputs to Education and Health
16 School Life Expectancy (years)
Total Female Male
1999 2009 1999 2009 1999 2009Developing Member Economies Central and West Asia
Afghanistan 2.2 (2001) 9.1 4.8 (2003) 6.8 8.9 (2003) 11.2Armenia 11.3 12.0 11.4 (2001) 12.5 10.5 (2001) 11.6Azerbaijan 11.0 11.8 10.8 11.8 11.2 11.7Georgia 11.4 13.1 11.5 12.6 (2008) 11.4 12.6 (2008)Kazakhstan 12.0 15.1 (2010) 12.2 15.5 (2010) 11.9 14.7 (2010)Kyrgyz Republic 11.5 12.5 11.7 12.9 11.4 12.1Pakistan 5.7 (2003) 6.9 4.9 (2003) 6.2 6.5 (2003) 7.5Tajikistan 9.8 11.4 (2008) 8.9 10.4 (2008) 10.6 12.3 (2008)Turkmenistan … … … … … …Uzbekistan 10.6 11.4 10.5 11.3 10.8 11.6
East AsiaChina, People’s Rep. of 9.9 (2001) 11.6 10.3 (2003) 11.9 10.4 (2003) 11.3Hong Kong, China 13.9 (2003) 15.7 13.6 (2003) 16.1 14.2 (2003) 15.4Korea, Rep. of 15.6 16.9 14.6 15.8 16.5 17.9Mongolia 9.1 14.1 10.0 14.9 8.2 13.3Taipei,China … … … … … …
South AsiaBangladesh 8.0 (2005) 8.1 (2007) 8.1 (2005) 8.3 (2007) 7.9 (2005) 8.0 (2007)Bhutan 7.3 11.0 (2008) 6.6 10.8 (2008) 8.0 11.2 (2008)India 8.1 10.3 (2007) 7.3 (2000) 9.8 (2007) 9.4 (2000) 10.9 (2007)Maldives 11.9 12.4 (2006) 11.9 12.3 (2006) 11.8 12.5 (2006)Nepal 8.4 8.8 (2002) 7.1 7.8 (2002) 9.6 9.8 (2002)Sri Lanka 12.5 (2002) 12.7 (2004) 12.7 (2002) 12.8 (2003) 12.4 (2002) 12.4 (2003)
Southeast AsiaBrunei Darussalam a 13.5 14.1 13.9 14.4 13.2 13.8Cambodia 7.5 (2000) 9.8 (2007) 6.6 (2000) 9.2 (2007) 8.3 (2000) 10.4 (2007)Indonesia 11.2 (2001) 13.2 11.0 (2001) 13.0 11.4 (2001) 13.3Lao PDR 8.2 9.2 (2008) 7.2 8.5 (2008) 9.1 9.9 (2008)Malaysia 11.8 12.6 (2008) 11.9 12.9 (2008) 11.7 12.2 (2008)Myanmar 8.1 (2001) 9.2 (2007) … … … …Philippines 11.4 11.9 (2008) 11.7 12.1 (2008) 11.2 11.6 (2008)Singapore … … … … … …Thailand 11.5 (2001) 12.3 11.5 (2001) 12.6 11.5 (2001) 11.9Viet Nam 10.2 10.4 (2001) 9.7 10.0 (2001) 10.7 10.8 (2001)
The PacificCook Islands 10.6 12.4 (2010) 10.6 12.8 (2010) 10.5 12.1 (2010)Fiji, Rep. of 12.9 (2003) 13.0 (2005) 13.2 (2003) 13.2 (2005) 12.7 (2003) 12.8 (2005)Kiribati 11.8 12.1 (2008) 12.3 12.5 (2008) 11.3 11.7 (2008)Marshall Islands 11.8 (2002) 10.8 (2003) 11.9 (2002) 11.2 (2003) 11.8 (2002) 10.5 (2003)Micronesia, Fed. States of … … … … … …Nauru 8.7 (2000) 9.3 (2008) 9.8 (2000) 9.9 (2008) 7.7 (2000) 8.9 (2008)Palau 14.5 (2000) 14.7 (2001) 15.4 (2000) … 13.7 (2000) …Papua New Guinea 5.8 (1998) … 5.2 (1998) … 6.3 (1998) …Samoa 12.3 12.3 (2005) 12.5 12.5 (2005) 12.1 12.1 (2005)Solomon Islands 7.3 9.1 (2007) 6.8 8.8 (2007) 7.7 9.4 (2007)Timor-Leste 11.1 (2001) 11.2 … … … …Tonga 13.2 13.7 (2006) 13.4 13.8 (2006) 12.9 13.5 (2006)Tuvalu 10.8 (2001) … 11.4 (2001) … 10.3 (2001) …Vanuatu 9.2 10.4 (2004) 9.0 10.0 (2004) 9.4 10.7 (2004)
Developed Member EconomiesAustralia 20.3 20.0 20.6 20.4 20.0 19.6Japan 14.4 15.1 14.2 15.0 14.5 15.3New Zealand 17.1 20.3 17.8 21.1 16.5 19.5

34
Framework of Inclusive Growth Indicators
a Brunei Darussalam is a regional member of ADB, but it is not classified as a developing member.
Sources: Institute for Statistics Online (UNESCO 2011); for Taipei,China: Monthly Bulletin of Statistics Online (Directorate-General of Budget, Accounting and Statistics 2011).
Table 3.1 Access and Inputs to Education and Health
PolIcy PIllAr 2PolIcy PIllAr 2
17 Primary Pupil–Teacher Ratio
1990 2000 2009Developing Member Economies Central and West Asia
Afghanistan 41 32 (1998) 43 (2008)Armenia 21 (1995) 20 (2001) 19 (2007)Azerbaijan 19 (1995) 19 11Georgia 17 (1991) 17 9Kazakhstan 22 19 16Kyrgyz Republic 16 24 24Pakistan 43 33 40Tajikistan 21 (1991) 22 23 (2008)Turkmenistan … … …Uzbekistan 24 21 17
East AsiaChina, People’s Rep. of 22 19 (2001) 18 (2008)Hong Kong, China 27 21 16Korea, Rep. of 36 32 24 (2008)Mongolia 30 33 30Taipei,China 29 19 16
South AsiaBangladesh 63 47 (2005) 44 (2008)Bhutan … 41 28India 46 40 40 (2004)Maldives … 23 13Nepal 39 43 33Sri Lanka 29 26 (2001) 23 (2008)
Southeast AsiaBrunei Darussalam a 15 (1991) 14 12Cambodia 35 50 49Indonesia 23 22 17 (2008)Lao PDR 28 30 29Malaysia 20 20 15 (2007)Myanmar 45 33 29 (2008)Philippines 33 35 (2001) 34 (2007)Singapore 26 25 (1995) 19 (2008)Thailand 20 21 16 (2008)Viet Nam 34 30 20
The PacificCook Islands 17 18 15 (2010)Fiji, Rep. of 34 28 26 (2008)Kiribati 29 32 25 (2008)Marshall Islands … 15 (1999) 14 (2003)Micronesia, Fed. States of … … 17 (2007)Nauru … 21 22 (2008)Palau … 16 13 (2005)Papua New Guinea 32 35 36 (2006)Samoa 24 24 32Solomon Islands 19 19 (1999) …Timor-Leste … 51 (2001) 29Tonga 24 22 22 (2006)Tuvalu … 20 19 (2004)Vanuatu 27 23 24 (2007)
Developed Member EconomiesAustralia 17 (1991) 18 (1999) …Japan 21 21 18 (2008)New Zealand 18 18 15 (2008)
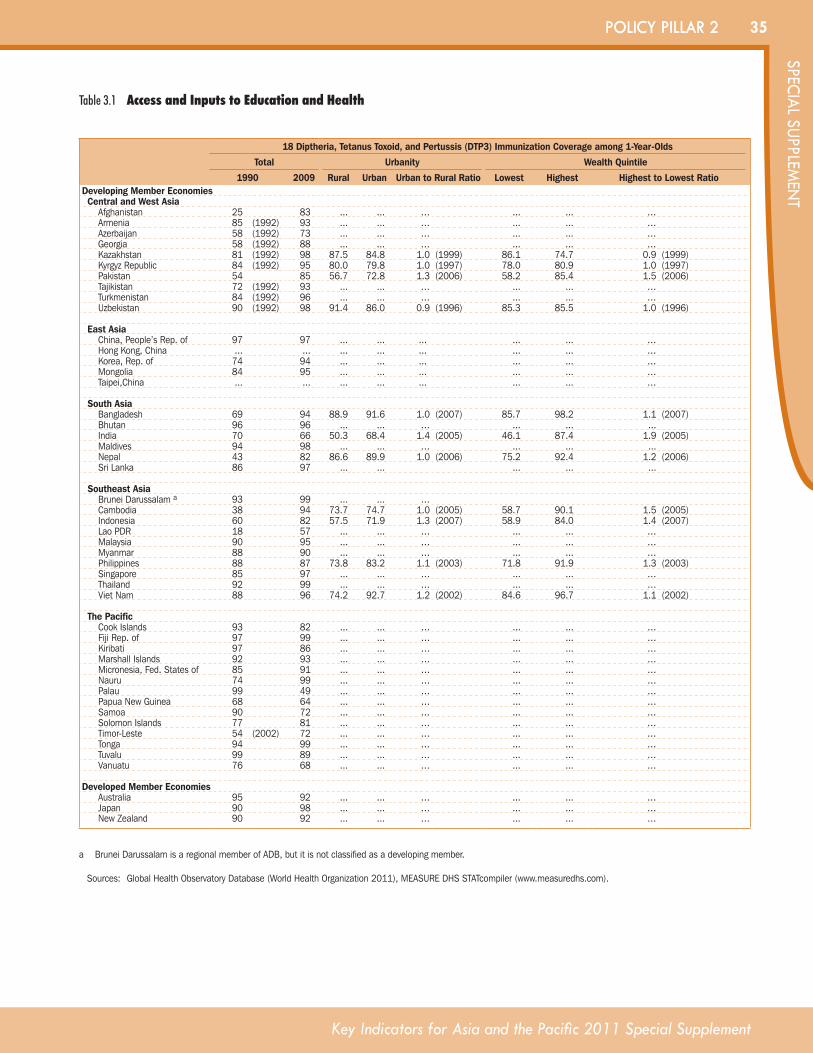
35
Key Indicators for Asia and the Pacific 2011 Special Supplement
SPECIAL SUPPLEMEN
T
a Brunei Darussalam is a regional member of ADB, but it is not classified as a developing member.
Sources: Global Health Observatory Database (World Health Organization 2011), MEASURE DHS STATcompiler (www.measuredhs.com).
Table 3.1 Access and Inputs to Education and Health
PolIcy PIllAr 2PolIcy PIllAr 2
18 Diptheria, Tetanus Toxoid, and Pertussis (DTP3) Immunization Coverage among 1-Year-Olds
Total Urbanity Wealth Quintile
1990 2009 Rural Urban Urban to Rural Ratio Lowest Highest Highest to Lowest Ratio Developing Member Economies Central and West Asia
Afghanistan 25 83 ... ... … ... ... …Armenia 85 (1992) 93 ... ... … ... ... …Azerbaijan 58 (1992) 73 ... ... … ... ... …Georgia 58 (1992) 88 ... ... … ... ... …Kazakhstan 81 (1992) 98 87.5 84.8 1.0 (1999) 86.1 74.7 0.9 (1999)Kyrgyz Republic 84 (1992) 95 80.0 79.8 1.0 (1997) 78.0 80.9 1.0 (1997)Pakistan 54 85 56.7 72.8 1.3 (2006) 58.2 85.4 1.5 (2006)Tajikistan 72 (1992) 93 ... ... … ... ... …Turkmenistan 84 (1992) 96 ... ... … ... ... …Uzbekistan 90 (1992) 98 91.4 86.0 0.9 (1996) 85.3 85.5 1.0 (1996)
East AsiaChina, People’s Rep. of 97 97 ... ... ... ... ... …Hong Kong, China ... ... ... ... ... ... ... …Korea, Rep. of 74 94 ... ... ... ... ... …Mongolia 84 95 ... ... ... ... ... …Taipei,China ... ... ... ... ... ... ... …
South AsiaBangladesh 69 94 88.9 91.6 1.0 (2007) 85.7 98.2 1.1 (2007)Bhutan 96 96 ... ... … ... ... ... India 70 66 50.3 68.4 1.4 (2005) 46.1 87.4 1.9 (2005)Maldives 94 98 ... ... … ... ... ... Nepal 43 82 86.6 89.9 1.0 (2006) 75.2 92.4 1.2 (2006)Sri Lanka 86 97 ... ... ... ... ...
Southeast AsiaBrunei Darussalam a 93 99 ... ... …Cambodia 38 94 73.7 74.7 1.0 (2005) 58.7 90.1 1.5 (2005)Indonesia 60 82 57.5 71.9 1.3 (2007) 58.9 84.0 1.4 (2007)Lao PDR 18 57 ... ... … ... ... …Malaysia 90 95 ... ... … ... ... …Myanmar 88 90 ... ... … ... ... …Philippines 88 87 73.8 83.2 1.1 (2003) 71.8 91.9 1.3 (2003)Singapore 85 97 ... ... … ... ... …Thailand 92 99 ... ... … ... ... …Viet Nam 88 96 74.2 92.7 1.2 (2002) 84.6 96.7 1.1 (2002)
The Pacific Cook Islands 93 82 ... ... … ... ... …Fiji Rep. of 97 99 ... ... … ... ... …Kiribati 97 86 ... ... … ... ... …Marshall Islands 92 93 ... ... … ... ... …Micronesia, Fed. States of 85 91 ... ... … ... ... …Nauru 74 99 ... ... … ... ... …Palau 99 49 ... ... … ... ... …Papua New Guinea 68 64 ... ... … ... ... …Samoa 90 72 ... ... … ... ... …Solomon Islands 77 81 ... ... … ... ... …Timor-Leste 54 (2002) 72 ... ... … ... ... …Tonga 94 99 ... ... … ... ... …Tuvalu 99 89 ... ... … ... ... …Vanuatu 76 68 ... ... … ... ... …
Developed Member EconomiesAustralia 95 92 ... ... … ... ... …Japan 90 98 ... ... … ... ... …New Zealand 90 92 ... ... … ... ... …

36
Framework of Inclusive Growth Indicators
a Figures refer to doctors with full registration on the local and overseas lists.b Figures refer to nurses registered/enrolled with the Nursing Council; midwives also include those registered nurses in the general stream possessing a postbasic qualification on midwifery.c Brunei Darussalam is a regional member of ADB, but it is not classified as a developing member.
Sources: Global Health Observatory Database (World Health Organization 2011); for Hong Kong, China: Department of Health Annual Report 2007 (The Government of Hong Kong Special Administrative Region 2007); for Taipei,China: Directorate-General of Budget, Accounting and Statistics.
Table 3.1 Access and Inputs to Education and Health
PolIcy PIllAr 2
19 Physicians, Nurses and Midwives (per 10,000 population)
Latest Year
Total Physicians Nurses and MidwivesDeveloping Member Economies Central and West Asia
Afghanistan 7.1 (2009) 2.1 5.0Armenia 85.7 (2007) 37.0 48.7Azerbaijan 122.1 (2007) 37.9 84.2Georgia 84.3 (2007) 45.4 38.9Kazakhstan 117.1 (2007) 38.8 78.3Kyrgyz Republic 79.6 (2007) 23.0 56.6Pakistan 13.7 (2009) 8.1 5.6Tajikistan 70.4 (2006) 20.1 50.3Turkmenistan 69.6 (2007) 24.4 45.2Uzbekistan 134.3 (2007) 26.2 108.1
East AsiaChina, People’s Rep. of 28.0 (2009) 14.2 13.8Hong Kong, China 77.1 (2007) 17.2 a 59.9 b
Korea, Rep. of 72.6 (2008) 19.7 52.9Mongolia 62.6 (2008) 27.6 35.0Taipei,China 72.8 (2009) 18.7 54.1
South AsiaBangladesh 5.7 (2007) 3.0 2.7Bhutan 3.4 (2007) 0.2 3.2India 19.0 (2005) 6.0 13.0Maldives 60.5 (2007) 16.0 44.5Nepal 6.7 (2004) 2.1 4.6Sri Lanka … 4.9 (2006) 19.3 (2007)
Southeast AsiaBrunei Darussalam c 63.0 (2008) 14.2 48.8Cambodia 10.2 (2008) 2.3 7.9Indonesia 23.3 (2007) 2.9 20.4Lao PDR 12.4 (2005) 2.7 9.7Malaysia 36.7 (2008) 9.4 27.3Myanmar 12.6 (2008) 4.6 8.0Philippines 71.5 (2004) 11.5 60.0Singapore 77.3 (2009) 18.3 59.0Thailand 18.2 (2004) 3.0 15.2Viet Nam 22.3 (2008) 12.2 10.1
The Pacific Cook Islands 58.9 (2004) 11.8 47.1Fiji, Rep. of 24.3 (2003) 4.5 19.8Kiribati … 3.0 (2006) 30.2 (2004)Marshall Islands 30.9 (2008) 5.6 25.3Micronesia, Fed. States of 28.2 (2005) 5.6 22.6Nauru 56.4 (2008) 7.1 49.3Palau 72.0 (2006) 13.0 59.0Papua New Guinea 5.6 (2008) 0.5 5.1Samoa 12.1 (2005) 2.7 9.4Solomon Islands 16.4 (2005) 1.9 14.5Timor-Leste 22.9 (2004) 1.0 21.9Tonga … 2.9 (2002) 29.3 (2007)Tuvalu 64.6 (2008) 6.4 58.2Vanuatu 18.2 (2008) 1.2 17.0
Developed Member EconomiesAustralia 125.8 (2009) 29.9 95.9Japan 62.0 (2006) 20.6 41.4New Zealand 132.5 (2007) 23.8 108.7

37
Key Indicators for Asia and the Pacific 2011 Special Supplement
SPECIAL SUPPLEMEN
T
a Data refer to central government, except for the People’s Republic of China, Georgia, Japan, the Kyrgyz Republic, and Tajikistan, where data refer to consolidated government or general government.
b From 1990 to 2005, health expenditure is included in education category.c Brunei Darussalam is a regional member of ADB, but it is not classified as a developing member.
Source: Economy sources.
Table 3.1 Access and Inputs to Education and Health
PolIcy PIllAr 2
20 Government Expenditure on Education(percent of total expenditure) a
21 Government Expenditure on Health (percent of total expenditure) a
1995 2000 2010 1995 2000 2010Developing Member Economies Central and West Asia
Afghanistan … … … … … …Armenia 11.9 (1996) 12.8 11.1 7.1 (1996) 4.4 6.1Azerbaijan 17.5 23.8 10.0 6.9 5.4 3.6Georgia 10.7 13.4 8.7 8.7 3.9 6.5Kazakhstan … … … … … …Kyrgyz Republic 23.1 20.7 10.0 13.6 11.7 18.6Pakistan … … … … … …Tajikistan 12.5 15.9 17.8 7.8 6.5 6.0 (2009)Turkmenistan … … … … … …Uzbekistan … … … … … …
East AsiaChina, People’s Rep. of b 17.5 18.0 (2002) 13.9 … 3.3 (2006) 5.3Hong Kong, China 17.7 18.9 19.1 12.7 11.9 12.3Korea, Rep. of 18.9 15.3 15.0 0.8 (1996) 0.7 1.2Mongolia 16.4 19.1 9.4 (2007) 11.1 10.7 5.2 (2007)Taipei,China 10.0 10.2 12.9 (2009) 0.5 1.0 1.4 (2009)
South AsiaBangladesh 16.7 19.7 16.5 (2008) 7.4 9.4 6.6 (2008)Bhutan … 14.0 (2002) 16.2 … 11.2 (2002) 7.2India 18.2 (1999) 17.5 16.5 (2008) 3.9 (1999) 3.9 4.0 (2008)Maldives 13.1 19.9 15.2 9.2 11.0 8.3Nepal 14.0 15.2 19.4 4.1 5.7 7.0Sri Lanka 9.1 9.2 8.1 5.3 6.2 5.7
Southeast AsiaBrunei Darussalam c 13.2 12.3 18.3 (2005) 6.5 6.1 8.3 (2005)Cambodia 10.6 16.2 15.5 3.5 10.7 11.3Indonesia … … … … … …Lao PDR … … … … … …Malaysia 20.9 23.7 24.4 5.5 6.4 8.1Myanmar … … … … … …Philippines 16.6 17.1 15.6 2.3 2.1 2.6Singapore 18.9 21.0 18.3 (2009) 7.6 5.1 7.7 (2009)Thailand 22.4 23.1 20.5 7.5 7.6 9.7Viet Nam … … … … … …
The PacificCook Islands 12.0 10.4 13.4 9.9 9.9 11.2Fiji, Rep. of 27.6 27.1 27.7 14.0 14.7 15.1Kiribati 19.4 19.9 18.6 14.9 13.7 16.3Marshall Islands … … … … … …Micronesia, Fed. States of … … … … … …Nauru … … … … … …Palau … … … … … …Papua New Guinea 17.1 16.4 10.0 (2002) 7.3 5.2 5.7 (2002)Samoa 19.5 20.8 17.7 13.1 16.9 15.2Solomon Islands … … … … … …Timor-Leste … 18.9 (2004) 10.2 (2009) … 11.1 (2004) 4.8 (2009)Tonga 17.8 12.9 … 12.0 13.9 …Tuvalu … … … … … …Vanuatu 23.7 25.7 26.1 (2007) 10.7 12.6 10.8 (2007)
Developed Member EconomiesAustralia 6.8 (1999) 6.7 10.6 14.6 (1999) 16.4 15.3Japan 14.7 13.5 10.7 (2009) 20.9 21.8 22.6 (2009)New Zealand 14.9 16.5 18.1 (2004) 15.1 17.6 19.5 (2004)

38
Framework of Inclusive Growth Indicators
Access to Basic Infrastructure Utilities and Services
Vast populations, especially the poor households in rural areas and in the urban slums lack access to most basic services such as clean and modern energy for lighting and cooking, clean drinking water, and clean sanitation. These basic services also reflect fundamental needs and human rights essential for the dignity and health of all children and adults. The health and economic benefits of electric energy for lighting, clean fuel for cooking, clean water supply, and sanitation to households and individuals are well-known and critical to the social inclusion dimensions of inclusive growth policies. Lack of access to these services leads to frequent diseases—including diseases due to indoor air pollution, and diarrhea in children—causing malnutrition and affecting their personal growth and opportunities. These services have important implications for women and children, who are often responsible for fetching fuel and drinking water, excluding them from economic, educational, and recreational opportunities.
What are the proposed indicators?Four indicators are proposed:
• Percentage of population with access to electricity,• Share of population using solid fuels for cooking,• Percentage of population using improved drinking
water sources, and• Percentage of population using improved sanitation
facilities.
The International Energy Agency (IEA) considers the first two indicators as indicators of energy poverty at the household level.1 The other two indicators are also Millennium Development Goal indicators. Use of an improved drinking water source is a proxy for the use of safe drinking water. An improved sanitation facility is one that likely hygienically separates human excreta from human contact.
Trends in Economies
Percentages of the population with access to electricity are available for only 20 countries, and the access has improved in all these countries since 2000. As of 2009, virtually 100% of households have electricity in six of these economies—Brunei Darussalam; the People’s Republic of China; Malaysia; Singapore; Taipei,China; and Thailand. However, only 13% of the population in Myanmar and 16% of the population in Afghanistan had access as of the same year. Access is also low in South Asian countries, although increases of over 20 percentage points were reported by Bangladesh, India, and Nepal between 2000 and 2009. Access went up from 76% in 2000 in Viet Nam to almost 98% by 2009.
1 IEA, United Nations Development Programme, and United Nations Industrial Development Organization. 2010. Energy Poverty: How to make modern energy access universal? Paris: Organisation for Economic Co-operation and Development/IEA.
Firewood, charcoal, and dried animal dung are the common solid fuels used for cooking. Based on most recent available data—usually 2000 to 2007—the percentage of households using solid fuel was in excess of 60% in Afghanistan, Bangladesh, Cambodia, Lao People’s Democratic Republic, Mongolia, Myanmar, Nepal, Pakistan, Papua New Guinea, Solomon Islands, Sri Lanka, Vanuatu, and Viet Nam. Between an earlier year—usually before 2000—and the most recent year, the percentages of households using solid fuel rose in Bangladesh, Indonesia,—and four Pacific Island countries—Nauru, Marshall Islands, Solomon Islands, and Vanuatu. Percentages fell in 21 countries, with seven recording falls of 30 percentage points or more. These include Azerbaijan, the People’s Republic of China, and Thailand.
While access to improved drinking water sources has been increasing, as of 2008, less than 50% of the population in Afghanistan and Papua New Guinea had access. Compare this to 21 countries with 90% or more of the population with access to safe drinking water during the same period. Percentages for the five largest countries were Pakistan 90%, the People’s Republic of China, 89%, India 88%, and both Bangladesh and Indonesia 80%. Access to improved sanitation has also increased but still less than 50% of populations have access to improved sanitation in Afghanistan, Azerbaijan, Cambodia, India, Nepal, Pakistan, and some Pacific island economies.
Inequalities in Access
Data on percentages of the urban and rural population with access to electricity are available for 20 economies for 2008. In six of these economies, virtually 100% had access to electricity in 2008. Among the remaining economies, rural–urban differences were smaller in Sri Lanka and Viet Nam but in Cambodia and Timor-Leste, the urban population’s access to electricity was more than five times that of the rural population. In Bangladesh, Indonesia, Mongolia, and Nepal, the urban percentages were at least twice as high as the rural percentages. In India, only 53% of the rural population had access to electricity, against 93% in the urban area.
Wide disparities in the use of solid fuels for cooking exist between rural and urban households, with a higher percentage of rural households using solid fuels compared to urban households. In Cambodia, Lao People’s Democratic Republic, and Myanmar, more than 80% of populations in both rural and urban areas use solid fuels. The use of clean fuels for cooking is also related to household wealth, and available data show that substantially more poor households use solid fuels. Thus, improved wealth also leads to improved fuel use. It may, however, be noted that the data here are based on surveys conducted between 2000 to 2007, and the situation may have changed since then.
PolIcy PIllAr 2

39
Key Indicators for Asia and the Pacific 2011 Special Supplement
SPECIAL SUPPLEMEN
T
Note: Lao PDR= Lao People's Democratic Republic.Source: Table 3.2.
Figure S16Percentage of Population With Access to Electricity, Urban and Rural, 2008
Figure S17Share of Population using Solid Fuels for Cooking, by Lowest and Highest Quintile, Latest Year
Figure S18Population Using Improved Sanitation Facilities: Total, Rural, and Urban, Latest Year
0 10 20 30 40 50 60 70 80 90
100 M
yanm
ar
Afgh
anis
tan
Timor
-Les
te
Cam
bodi
a
Bang
lade
sh
Paki
stan
Lao
PDR
Sri L
anka
Nep
al
Mon
golia
Indi
a
Indo
nesi
a
Philip
pine
s
Viet
Nam
Taip
ei,C
hina
Mal
aysi
a
Brun
ei D
arus
sala
m
Chin
a, P
eopl
e's
Rep.
of
Thai
land
Sing
apor
e
Perc
ent
Urban Rural
0
50
100
150
200
250
300
350
0
20
40
60
80
100
120
Uzbe
kist
an
Kyrg
yz R
epub
lic
Thai
land
Indo
nesi
a
Mon
golia
Mal
aysi
a
Tajik
ista
n
Philip
pine
s
Geor
gia
Nau
ru
Viet
Nam
Bhut
an
Indi
a
Sri L
anka
Paki
stan
Nep
al
Vanu
atu
Chin
a, P
eopl
e's
Rep.
of
Bang
lade
sh
Mya
nmar
Lao
PDR
Arm
enia
Azer
baija
n
Kaza
khst
an
Ratio
Perc
ent
Lowest 20% Highest 20% Lowest 20% to Highest 20% Ratio
0
20
40
60
80
100
120
Aust
ralia
Co
ok Is
land
s Ja
pan
Kore
a, R
ep. o
f Sa
moa
Uz
beki
stan
Si
ngap
ore
Mal
dive
s Tu
rkm
enis
tan
Kaza
khst
an
Mal
aysi
a Th
aila
nd
Tong
a Ge
orgi
a Ta
jikis
tan
Kyrg
yz R
epub
lic
Sri L
anka
Ar
men
ia
Tuva
lu
Pala
u M
yanm
ar
Philip
pine
s Vi
et N
am
Mar
shal
l Isl
ands
Bh
utan
Ch
ina,
Peo
ple'
s Re
p. o
f Ba
ngla
desh
La
o PD
R In
done
sia
Vanu
atu
Mon
golia
Tim
or-L
este
Az
erba
ijan
Paki
stan
Pa
pua
New
Gui
nea
Afgh
anis
tan
Kirib
ati
Solo
mon
Isla
nds
Indi
a N
epal
Ca
mbo
dia
Mic
rone
sia,
Fed
. Sta
tes
of
Nau
ru
Perc
ent
Total Urban Rural
PolIcy PIllAr 2

40
Framework of Inclusive Growth Indicators
a Brunei Darussalam is a regional member of ADB, but it is not classified as a developing member.
Source: World Energy Outlook (International Energy Agency 2011, www.iea.org/weo).
Table 3.2 Access to Basic Infrastructure Utilities and Services
PolIcy PIllAr 2
22 Population with Access to Electricity(percent)
Total Urban Rural
2000 2005 2009 2008Developing Member Economies Central and West Asia
Afghanistan 2.0 7.0 15.6 22.0 12.0Armenia … … … … …Azerbaijan … … … … …Georgia … … … … …Kazakhstan … … … … …Kyrgyz Republic … … … … …Pakistan 52.9 54.0 62.4 78.0 46.0Tajikistan … … … … …Turkmenistan … … … … …Uzbekistan … … … … …
East AsiaChina, People’s Rep. of 98.6 99.4 99.4 100.0 99.0Hong Kong, China … … … … …Korea, Rep. of … … … … …Mongolia … 64.6 67.0 90.0 36.0Taipei,China 98.6 99.2 99.0 100.0 98.0
South AsiaBangladesh 20.4 32.0 41.0 76.0 28.0Bhutan … … … … …India 43.0 55.5 66.3 93.1 52.5Maldives … … … … …Nepal 15.4 33.0 43.6 89.7 34.0Sri Lanka 62.0 66.0 76.6 85.8 75.0
Southeast AsiaBrunei Darussalam a 99.2 99.2 99.7 100.0 98.6Cambodia 15.8 20.1 24.0 66.0 12.5Indonesia 53.4 54.0 64.5 94.0 32.0Lao PDR … … 55.0 84.0 42.0Malaysia 96.9 97.8 99.4 100.0 98.0Myanmar 5.0 11.3 13.0 19.0 10.0Philippines 87.4 80.5 89.7 97.0 65.0Singapore 100.0 100.0 100.0 100.0 naThailand 82.1 99.0 99.3 100.0 99.0Viet Nam 75.8 84.2 97.6 99.6 85.0
The PacificCook Islands … … … … …Fiji, Rep. of … … … … …Kiribati … … … … …Marshall Islands … … … … …Micronesia, Fed. States of … … … … …Nauru … … … … …Palau … … … … …Papua New Guinea … … … … …Samoa … … … … …Solomon Islands … … … … …Timor-Leste … … 22.0 52.0 10.5Tonga … … … … …Tuvalu … … … … …Vanuatu … … … … …
Developed Member EconomiesAustralia … … … … …Japan … … … … …New Zealand … … … … …

41
Key Indicators for Asia and the Pacific 2011 Special Supplement
SPECIAL SUPPLEMEN
T
a Figures refer to the same year as indicated in the column for “Total” unless otherwise specified.b Brunei Darussalam is a regional member of ADB, but it is not classified as a developing member.
Sources: Household Energy Database: (World Health Organization 2010), data files received from WHO.
Table 3.2 Access To Basic Infrastructure Utilities and Services
PolIcy PIllAr 2
23 Share of Population using Solid Fuels for Cooking
Earliest Year Latest Year
Total Urban a Rural a Total Urban a Rural a Lowest 20%
Highest 20%
Lowest 20% to Highest 20% Ratio
Developing Member Economies Central and West Asia
Afghanistan 98.0 (1999) ... ... 85.6 (2007) 34.5 95.7 ... ... ... Armenia 26.4 (2000) 8.7 53.9 4.4 (2005) 0.6 11.8 18.8 0.0 0.0 (2005)Azerbaijan 41.6 (1995) ... ... 9.8 (2006) 0.9 22.7 38.6 0.0 0.0 (2006)Georgia … ... ... 42.0 (2003) 8.6 77.2 88.5 3.6 24.7 (2003)Kazakhstan 20.3 (1999) 3.3 41.7 19.0 (2005) 6.9 40.8 69.4 0.0 0.0 (2005)Kyrgyz Republic ... ... ... ... ... ... 76.6 0.3 283.6 (2005)Pakistan 68.8 (1998) 32.0 85.7 66.6 (2006) 22.2 89.6 100.0 31.3 3.2 (2006)Tajikistan 74.5 (1999) 32.7 90.2 35.0 (2005) 7.5 48.4 75.3 2.3 32.2 (2005)Turkmenistan … ... ... 0.2 (2000) 0.0 0.5 ... ... ... Uzbekistan 16.5 (2002) 3.5 27.1 15.7 (2005) 0.7 24.8 54.7 0.2 303.9 (2005)
East AsiaChina, People’s Rep. of 84.8 (1991) 66.4 93.5 49.3 (2006) 32.0 59.6 66.8 33.3 2.0 (2006)Hong Kong, China ... ... ... ... ... ... ... ... ... Korea, Rep. of ... ... ... ... ... ... ... ... ... Mongolia … ... ... 76.5 (2005) 60.9 97.6 99.0 2.0 48.5 (2005)Taipei,China ... ... ... ... ... ... ... ... ...
South AsiaBangladesh 44.3 (1991) 57.6 42.7 91.1 (2007) 61.5 99.4 99.9 55.8 1.8 (2007)Bhutan 66.5 (2003) 4.7 84.8 40.7 (2007) 2.3 57.2 84.3 8.5 9.9 (2007)India 77.7 (1992) 41.3 91.6 56.9 (2006) 26.1 85.3 99.8 10.6 9.4 (2005)Maldives 42.7 (2000) ... ... 13.6 (2006) ... ... ... ... ... Nepal 88.3 (2001) 39.1 94.1 83.3 (2006) 39.1 92.3 98.3 30.9 3.2 (2003)Sri Lanka 89.4 (1994) ... ... 66.1 (2003) 27.2 75.0 92.0 23.0 4.0 (2003)
Southeast AsiaBrunei Darussalam b ... ... ... ... ... ... ... ... ... Cambodia … ... ... 96.2 (2000) 81.9 98.6 ... ... ... Indonesia 44.8 (2002) 16.0 69.0 54.6 (2007) 22.0 77.8 97.0 0.8 115.5 (2007)Lao PDR 97.7 (1995) 85.6 99.4 97.5 (2006) 91.4 99.9 100.0 89.0 1.1 (2006)Malaysia … ... ... 0.8 (2003) 0.1 2.1 3.9 0.1 39.3 (2003)Myanmar … ... ... 92.6 (2003) 84.7 95.8 96.6 81.2 1.2 (2003)Philippines … ... ... 44.5 (2003) 26.5 70.5 91.6 3.4 27.0 (2003)Singapore ... ... ... ... ... ... ... ... ... Thailand 65.5 (1990) ... ... 34.4 (2005) 9.6 45.8 87.8 0.4 214.2 (2005)Viet Nam 87.0 (1997) 53.6 97.6 67.0 (2005) 25.5 77.4 98.2 9.2 10.7 (2005)
The Pacific Cook Islands 19.0 (1991) ... ... 4.8 (2006) ... ... ... ... ... Fiji Rep. of … ... ... 48.0 (1996) ... ... ... ... ... Kiribati ... ... ... ... ... ... ... ... ... Marshall Islands 29.9 (1999) … … 36.2 (2007) 8.8 93.6 ... ... ... Micronesia, Fed. States of 47.4 (1994) ... ... 41.5 (2005) ... ... ... ... ... Nauru 0.8 (1992) ... ... 7.1 (2007) ... ... 18.7 1.5 12.3 (2007)Palau … ... ... ... ... ... ... ... ... Papua New Guinea … ... ... 89.7 (1996) 34.4 98.3 ... ... ... Samoa 72.1 (1990) ... ... 40.7 (2006) ... ... ... ... ... Solomon Islands 90.8 (2005) 62.7 95.5 92.1 (2007) 57.0 96.8 ... ... ... Timor-Leste ... ... ... ... ... ... ... ... ... Tonga 74.3 (1996) ... ... 40.9 (2006) 9.4 50.2 ... ... ... Tuvalu 69.9 (1991) ... ... 31.5 (2002) ... ... ... ... ... Vanuatu 83.3 (1999) ... ... 85.1 (2007) 52.2 95.2 98.3 38.2 2.6 (2007)
Developed Member EconomiesAustralia ... ... ... ... ... ... ... ... ... Japan ... ... ... ... ... ... ... ... ... New Zealand ... ... ... ... ... ... ... ... ...

42
Framework of Inclusive Growth Indicators
a Refers to percent of total population served with tap water.b Brunei Darrussalam is a regional member of ADB, but it is not classified as developing member.
Sources: Millennium Indicators Database Online (UNSD 2011); for Taipei,China: Directorate-General of Budget, Accounting and Statistics.
Table 3.2 Access to Basic Infrastructure Utilities and Services
PolIcy PIllAr 2
24 Population Using Improved Drinking Water Sources(percent)
1990 2008
Total Urban Rural Total Urban RuralDeveloping Member Economies Central and West Asia
Afghanistan 3 (1995) 12 (1995) 1 (1995) 48 78 39Armenia 92 (1995) 99 78 (1995) 96 98 93Azerbaijan 70 88 49 80 88 71Georgia 81 94 66 98 100 96Kazakhstan 96 99 92 95 99 90Kyrgyz Republic 78 (1995) 98 (1995) 66 (1995) 90 99 85Pakistan 86 96 81 90 95 87Tajikistan 58 (1995) 91 (1995) 45 (1995) 70 94 61Turkmenistan 83 (1995) 97 (1995) 72 (1995) 84 (2005) 97 (2005) 72 (2005)Uzbekistan 90 97 85 87 98 81
East AsiaChina, People’s Rep. of 67 97 56 89 98 82Hong Kong, China … … … … … …Korea, Rep. of 90 (1995) 97 (1995) 67 (1995) 98 100 88Mongolia 58 81 27 76 97 49Taipei,China a 84 … … 92 … …
South AsiaBangladesh 78 88 76 80 85 78Bhutan 91 (2000) 99 (2000) 88 (2000) 92 99 88India 72 90 66 88 96 84Maldives 90 100 87 91 99 86Nepal 76 96 74 88 93 87Sri Lanka 67 91 62 90 98 88
Southeast AsiaBrunei Darussalam b … … … … … …Cambodia 35 52 33 61 81 56Indonesia 71 92 62 80 89 71Lao PDR 44 (1995) 78 (1995) 37 (1995) 57 72 51Malaysia 88 94 82 100 100 99Myanmar 57 87 47 71 75 69Philippines 84 93 76 91 93 87Singapore 100 100 na 100 100 naThailand 91 97 89 98 99 98Viet Nam 58 88 51 94 99 92
The Pacific Cook Islands 94 99 87 95 (2005) 98 (2005) 88 (2005)Fiji, Rep. of … 92 ... … 93 (2000) ... Kiribati 48 76 33 64 (2005) 77 (2005) 53 (2005)Marshall Islands 95 94 97 94 92 99Micronesia, Fed. States of 89 93 87 94 (2005) 95 (2005) 94 (2005)Nauru 90 (2005) 90 (2005) na 90 90 na Palau 81 73 98 84 (2005) 80 (2005) 94 (2005)Papua New Guinea 41 89 32 40 87 33Samoa 91 99 89 88 (2005) 90 (2005) 87 (2005)Solomon Islands 69 (1995) 94 (1995) 65 (1995) 70 (2005) 94 (2005) 65 (2005)Timor-Leste 52 (2000) 69 (2000) 47 (2000) 69 86 63Tonga 100 (1995) 100 (1995) 100 (1995) 100 100 100Tuvalu 90 92 89 97 98 97Vanuatu 57 91 49 83 96 79
Developed Member EconomiesAustralia 100 100 100 100 100 100Japan 100 100 100 100 100 100New Zealand 100 100 100 100 100 100

43
Key Indicators for Asia and the Pacific 2011 Special Supplement
SPECIAL SUPPLEMEN
T
a Brunei Darrussalam is a regional member of ADB, but it is not classified as developing member.
Sources: Millennium Indicators Database Online (UNSD 2011).
Table 3.2 Access To Basic Infrastructure Utilities and Services
PolIcy PIllAr 2
25 Population Using Improved Sanitation Facilities(percent)
1990 2008
Total Urban Rural Total Urban RuralDeveloping Member Economies Central and West Asia
Afghanistan 29 (1995) 36 (1995) 27 (1995) 37 60 30Armenia 88 (1995) 95 (1995) 75 (1995) 90 95 80Azerbaijan 57 (1995) 70 (1995) 43 (1995) 45 85 39Georgia 96 97 95 95 96 93Kazakhstan 96 96 97 97 97 98Kyrgyz Republic 93 (1995) 94 (1995) 93 (1995) 93 94 93Pakistan 28 73 8 45 72 29Tajikistan 89 (1995) 93 (1995) 87 (1995) 94 95 94Turkmenistan 98 99 97 98 99 97Uzbekistan 84 95 76 100 100 100
East AsiaChina, People’s Rep. of 41 48 38 55 58 52Hong Kong, China ... ... ... ... ... ... Korea, Rep. of 100 100 100 100 100 100Mongolia 49 (1995) 67 (1995) 25 (1995) 50 64 32Taipei,China ... ... ... ... ... ...
South AsiaBangladesh 34 57 28 53 55 52Bhutan 62 (2000) 87 (2000) 54 (2000) 65 87 54India 18 49 7 31 54 21Maldives 69 100 58 98 100 96Nepal 11 41 8 31 51 27Sri Lanka 70 85 67 91 88 92
Southeast AsiaBrunei Darussalam a ... ... ... ... ... ... Cambodia 9 38 5 29 67 18Indonesia 33 58 22 52 67 36Lao PDR 18 (1995) 56 (1995) 10 (1995) 53 86 38Malaysia 84 88 81 96 96 95Myanmar 49 (1995) 77 (1995) 39 (1995) 81 86 79Philippines 58 70 46 76 80 69Singapore 99 99 na 100 100 naThailand 80 93 74 96 95 96Viet Nam 35 61 29 75 94 67
The Pacific Cook Islands 96 100 91 100 100 100Fiji, Rep. of ... 92 ... ... 96 (2000) ... Kiribati 26 36 21 35 (2005) 49 (2005) 22 (2005)Marshall Islands 64 77 41 73 83 53Micronesia, Fed. States of 29 55 20 25 (2005) 61 (2005) 15 (2005)Nauru 50 (2005) 50 (2005) na 50 50 na Palau 69 76 54 83 (2005) 96 (2005) 52 (2005)Papua New Guinea 47 78 42 45 71 41Samoa 98 100 98 100 100 100Solomon Islands 30 (1995) 98 (1995) 18 (1995) 32 (2005) 98 (2005) 18 (2005)Timor-Leste 32 (2000) 55 (2000) 25 (2000) 50 76 40Tonga 96 98 96 96 98 96Tuvalu 80 86 76 84 88 81Vanuatu 35 (1995) 53 (1995) 30 (1995) 52 66 48
Developed Member EconomiesAustralia 100 100 100 100 100 100Japan 100 100 100 100 100 100New Zealand ... ... 88 ... ... 88 (1995)

44
Framework of Inclusive Growth Indicators
Gender Equality and Opportunity
Educating girls and integrating them into the workforce to contribute as productive economic agents has long-term impact on the inclusion of women in economic growth. Providing basic health care to expectant mothers should be a key constituent of governments’ health policies. Evidence suggests that educated and healthy mothers have fewer and healthier children, who in turn are likely to do better in schools and thus have better economic opportunities. In the long run, this will lead poor households out of poverty. Women’s political empowerment is one way to attain gender-balanced participation in the legislative process. It helps provide the women’s voice in initiating legislations that benefit women’s inclusion in social and economic development.
What are the proposed indicators?Although indicators proposed under other policy pillars of inclusive growth are to be disaggregated by sex (where applicable and data are available), to provide insights into gender issues, the following four indicators are proposed:
• Gender parity in primary, secondary, and tertiary education;
• Antenatal care coverage (at least one visit); • Gender parity in labor force participation; and• Percentage of seats held by women in national
parliament.
Gender parity in education is measured as a ratio of the “gross enrollment ratio of girls to the gross enrollment ratio of boys” in each level of education and provides a measure of equal participation of women in education. Gender parity in labor force participation is the ratio of the labor force participation rate of females to the labor force participation rate of males. It provides an indication of gender equality in opportunities to the working age population’s active engagement in labor markets or in the production of goods and services in a country. The third indicator, antenatal care coverage, is a basic indicator of access and health care delivery for pregnant mothers. At least four antenatal visits are recommended for a mother during pregnancy. The fourth indicator is on women’s participation in the legislative process. Three out of these four indicators (except gender parity in labor force participation) are also indicators under the Millennium Development Goals.
Trends in Economies
Between 1991 and 2009 (or nearest years in both cases), the ratios of female to male enrollment improved at all levels of education in almost all economies. A simple average of ratios increased from 0.94 to 0.97 for primary, from 0.92 to 1.00 for secondary and from 0.96 to 1.06 for tertiary. Overall, the Asia
and Pacific region has been moving toward gender equality in education over the last two decades.
By 2009 (or the nearest year available), in 37 out of 43 economies, the female/male enrollment ratios at the primary level were 0.95 or higher (ratios of 1.00 ± 0.05 are here taken as a sufficient approximation to gender equality.) Of the five most populous countries, only Pakistan had not achieved gender equality in primary schools. There is less gender equality at the secondary level. Of the 42 economies for which data are available, 33 had achieved ratios of 0.95 or more by 2009. Neither India nor Pakistan has achieved gender equality in secondary education. At the tertiary level, fewer countries have achieved gender equality. Out of 35 economies, only 20 had ratios of at least 0.95 in 2009. Fifteen other economies had ratios below 0.95 including Bangladesh, India, and Pakistan. In some countries, women fare comparatively much better, and ratios of 1.5 and above were observed in some including Brunei Darussalam, the Maldives, and Mongolia.
In almost all countries, between an earlier year (usually around 2000) and a more recent year (mostly between 2006 and 2009), more pregnant women had at least one visit with a health worker. Bangladesh, India, and Pakistan were among the countries with less than 80% women accessing antenatal care at least once despite increases of at least 13 percentage points between the two periods. Afghanistan, Lao People’s Democratic Republic, and Nepal had less than 50% coverage ratio.
In almost all the countries, there were clear disparities against women in the labor force participation indicator, with lowest participations rates for females in Afghanistan, India, Pakistan, and Sri Lanka. In general, women’s participation in the labor force has increased in many countries but there is little change in the female–male ratio in India, which continues at a low of 40%.
Inequalities in Access to Antenatal Care
In countries with high percentages of antenatal care visit, the disparities by rural–urban and by wealth quintiles are less pronounced. In other countries, the disparities between the rural–urban and poorest and richest 20% of households were high. For example, in Lao People’s Democratic Republic, the ratio of visits in urban to rural areas was 2.8 and at the same time the ratio of richest 20% to the poorest 20% was 5.4. Others in this category included Bangladesh, Nepal, and Pakistan, where women in richest quintile households were more than twice as likely to receive antenatal care.
PolIcy PIllAr 2

45
Key Indicators for Asia and the Pacific 2011 Special Supplement
SPECIAL SUPPLEMEN
TPolIcy PIllAr 2
0.0
0.5
1.0
1.5
2.0
2.5
Papu
a N
ew G
uine
aSo
lom
on Is
land
sSr
i Lan
kaM
icro
nesi
a, F
ed. S
tate
s of
Cook
Isla
nds
Tuva
luKi
ribat
iN
auru
Afgh
anis
tan
Nep
alTa
jikis
tan
Cam
bodi
aB
angl
ades
hVa
nuat
uB
huta
nIn
dia
Uzb
ekis
tan
Kore
a, R
ep. o
fTi
mor
-Les
teVi
et N
amLa
o PD
RPa
kist
anJa
pan
Sam
oaIn
done
sia
Azer
baija
nH
ong
Kong
, Chi
naCh
ina,
Peo
ple'
s Re
p. o
fTa
ipei
,Chi
naFi
ji, R
ep. o
fG
eorg
iaPh
ilipp
ines
Arm
enia
Mal
aysi
aM
arsh
all I
slan
dsTh
aila
ndKy
rgyz
Rep
ublic
Aust
ralia
Mya
nmar
Kaza
khst
anN
ew Z
eala
ndM
ongo
liaTo
nga
Bru
nei D
arus
sala
mPa
lau
Mal
dive
s
Figure S19Gender Parity in Primary, Secondary, and Tertiary Education, 2009 or Latest Year
Primary Secondary Tertiary
Note: Lao PDR = Lao People's Democratic Republic.Source: Table 3.3.
Figure S20Antenatal Care Coverage (At Least One Visit) by Lowest and Highest Quintile, Latest Year
Figure S21Gender Parity in Labor Force Participation, Aged 15 and Over, 1990 and 2009 or Nearest Year
0
1
2
3
4
5
6
0
20
40
60
80
100
120
Lao
PDR
Nep
al
Bang
lade
sh
Paki
stan
Azer
baija
n
Cam
bodi
a
Mar
shal
l Isl
ands
Viet
Nam
Solo
mon
Isla
nds
Philip
pine
s
Indo
nesi
a
Arm
enia
Vanu
atu
Geor
gia
Kyrg
yz R
epub
lic
Thai
land
Tajik
ista
n
Uzbe
kist
an
Sri L
anka
Kaza
khst
an
Tuva
lu
Turk
men
ista
n
Nau
ru
Ratio
Perc
ent
Lowest 20% Highest 20% Highest 20% to Lowest 20% Ratio
0 10 20 30 40 50 60 70 80 90
100
Paki
stan
Af
ghan
ista
n In
dia
Sri L
anka
So
lom
on Is
land
s Fi
ji, R
ep. o
f Sa
moa
M
arsh
all I
slan
ds
Mal
aysi
a In
done
sia
Philip
pine
s Ja
pan
Kyrg
yz R
epub
lic
Kore
a, R
ep. o
f Si
ngap
ore
Bang
lade
sh
Timor
-Les
te
Tong
a Ta
jikis
tan
Mal
dive
s M
yanm
ar
Geor
gia
Taip
ei,C
hina
Bh
utan
Ho
ng K
ong,
Chi
na
Pala
u N
epal
Br
unei
Dar
ussa
lam
Ar
men
ia
Aust
ralia
Th
aila
nd
New
Zea
land
Uz
beki
stan
Tu
rkm
enis
tan
Cook
Isla
nds
Chin
a, P
eopl
e's
Rep.
of
Cam
bodi
a Ka
zakh
stan
M
ongo
lia
Azer
baija
n Vi
et N
am
Vanu
atu
Papu
a N
ew G
uine
a La
o PD
R
Perc
ent
2009 1990

46
Framework of Inclusive Growth Indicators
a Measured as the ratio of female gross enrollment ratio to male gross enrollment ratio.b There is no tertiary education in Cook Islands, Kiribati, Nauru, Solomon Islands, and Tuvalu. In Maldives, tertiary education became available only recently.c Brunei Darussalam is a regional member of ADB, but it is not classified as a developing member.
Sources: Millennium Indicators Database Online (UNSD 2011); Institute for Statistics Online (UNESCO 2011); for Taipei,China: Educational Statistical Indicators Online (Ministry of Education 2011).
Table 3.3 Gender Equality and Opportunity
PolIcy PIllAr 2
26 Gender Parity in Education a
Primary Secondary Tertiary b
1991 2009 1991 2009 1991 2009Developing Member Economies Central and West Asia
Afghanistan 0.55 0.67 0.51 0.49 0.28 (2003) 0.24Armenia 1.01 (2001) 1.03 1.06 (2001) 1.03 1.11 (1999) 1.29Azerbaijan 0.99 0.99 1.01 1.03 0.67 0.99Georgia 1.00 1.00 0.97 0.96 (2008) 0.91 1.23Kazakhstan 1.01 (1999) 1.01 (2010) 1.00 (1999) 0.98 (2010) 1.15 (1999) 1.45 (2010)Kyrgyz Republic 0.99 (1999) 1.00 1.02 1.01 1.04 (1999) 1.32Pakistan 0.68 (2000) 0.84 0.48 0.79 0.81 (2002) 0.85 (2008)Tajikistan 0.98 0.96 (2008) 0.86 (1999) 0.87 (2008) 0.35 (1999) 0.41Turkmenistan … … … … … …Uzbekistan 0.98 0.98 0.98 (1999) 0.99 0.82 (1999) 0.70
East AsiaChina, People’s Rep. of 0.92 1.04 0.75 1.07 0.83 (2003) 1.07Hong Kong, China 0.96 (1999) 1.02 0.97 (2001) 1.03 0.96 (2003) 1.03Korea, Rep. of 1.01 0.98 0.96 0.96 0.49 0.70Mongolia 1.02 0.99 1.14 1.07 1.86 (1999) 1.55Taipei,China 1.01 1.02 (2010) 1.04 1.01 (2010) 0.96 1.08 (2010)
South AsiaBangladesh 1.04 (2005) 1.04 0.98 (1999) 1.12 (2008) 0.49 (1999) 0.56Bhutan 0.85 (1999) 1.01 0.81 (1999) 0.99 0.58 (1999) 0.59 (2008)India 0.76 0.97 (2007) 0.70 (1999) 0.88 (2008) 0.54 0.70 (2007)Maldives 1.00 (1999) 0.95 1.09 (1999) 1.05 (2006) 2.41 (2003) 2.40 (2004)Nepal 0.63 0.86 (2002) 0.46 0.89 (2006) 0.33 0.40 (2004)Sri Lanka 0.96 1.00 1.09 1.02 (2004) 0.48 …
Southeast AsiaBrunei Darussalam c 0.94 1.01 1.09 1.02 1.98 (1999) 1.76Cambodia 0.87 (1999) 0.94 0.53 (1999) 0.82 (2007) 0.34 (2000) 0.54 (2008)Indonesia 0.98 0.97 0.83 0.99 0.76 (2001) 0.96Lao PDR 0.79 0.91 (2008) 0.69 (1999) 0.81 (2008) 0.49 (1999) 0.78 (2008)Malaysia 0.99 0.99 (2008) 1.05 1.07 (2008) 1.02 (1999) 1.30 (2008)Myanmar 0.95 0.98 0.97 1.02 … 1.37 (2007)Philippines 0.99 0.98 (2008) 1.09 (1999) 1.09 (2008) 1.26 (1999) 1.24 (2008)Singapore … … … … … …Thailand 0.98 0.98 0.99 1.08 (2010) 1.14 (1999) 1.31 (2010)Viet Nam 0.93 (1999) 0.95 (2001) 0.90 (1999) 0.92 (2001) 0.76 (1999) 0.73 (2001)
The PacificCook Islands 0.95 (1999) 1.02 (2010) 1.08 (1999) 1.10 (2010) … …Fiji, Rep. of 1.00 0.99 (2008) 0.97 1.07 (2008) 1.20 (2003) 1.20 (2005)Kiribati 1.01 (1999) 1.04 (2008) 1.19 (1999) 1.11 (2008) … …Marshall Islands 0.98 (1999) 0.99 1.07 (1999) 1.05 1.28 (2001) 1.30 (2003)Micronesia, Fed. States of 0.99 (2004) 1.01 (2007) 1.05 (2004) 1.07 (2005) … …Nauru 1.33 (2000) 1.06 (2008) 1.17 (2000) 1.20 (2008) … …Palau 0.93 (1999) 1.03 (2007) 1.07 (1999) 0.98 (2007) 2.35 (2000) 2.04 (2002)Papua New Guinea 0.85 0.84 (2006) 0.62 … 0.55 (1999) …Samoa 0.98 (1999) 0.98 1.10 (1999) 1.13 1.04 (1999) 0.93 (2001)Solomon Islands 0.87 0.97 (2007) 0.61 0.84 (2007) … …Timor-Leste 0.93 (2004) 0.95 0.99 (2004) 1.00 (2005) 1.27 (2002) 0.71Tonga 0.98 0.97 (2006) 1.03 1.03 (2006) 1.30 (1999) 1.62 (2004)Tuvalu 1.02 (1999) 0.95 (2006) … 1.10 (2001) … …Vanuatu 0.96 0.95 0.80 1.09 0.57 (2002) 0.59 (2004)
Developed Member EconomiesAustralia 1.00 1.00 1.00 (1999) 0.96 1.19 1.32Japan 1.00 1.00 1.02 1.00 0.65 0.89New Zealand 0.99 1.01 1.01 1.04 1.13 1.45

47
Key Indicators for Asia and the Pacific 2011 Special Supplement
SPECIAL SUPPLEMEN
T
a Brunei Darussalam is a regional member of ADB, but it is not classified as a developing member.
Sources: Millennium Indicators Database Online (UNSD 2011), UNICEF Childinfo Website (www.childinfo.org/index.html).
Table 3.3 Gender Equality and Opportunity
PolIcy PIllAr 2
27 Antenatal Care Coverage (at least one visit)
Total Urbanity Wealth Quintile
Earliest Year Latest Year Urban Rural Urban to Rural Ratio Lowest Highest Highest to Lowest Ratio
Developing Member Economies Central and West Asia
Afghanistan 36.9 (2000) 36.0 (2008) 38.3 8.0 4.8 (2003) … … …Armenia 82.0 (1997) 93.0 (2005) 95.6 88.9 1.1 (2005) 84.6 99.2 1.2 (2005)Azerbaijan 98.3 (1997) 76.6 (2006) 89.7 62.7 1.4 (2006) 53.2 95.3 1.8 (2006)Georgia 74.0 (1997) 96.3 (2005) 97.6 95.0 1.0 (2005) 91.9 97.6 1.1 (2005)Kazakhstan 92.5 (1995) 99.9 (2006) 100.0 99.7 1.0 (2006) 99.7 100.0 1.0 (2006)Kyrgyz Republic 97.3 (1997) 96.9 (2006) 99.0 95.4 1.0 (2006) 93.6 99.0 1.1 (2006)Pakistan 25.6 (1991) 60.9 (2007) 78.1 53.5 1.5 (2007) 36.9 91.9 2.5 (2007)Tajikistan 71.3 (2000) 88.8 (2007) 93.5 87.1 1.1 (2007) 90.0 91.8 1.0 (2007)Turkmenistan 98.1 (2000) 99.1 (2006) 98.8 99.3 1.0 (2006) 98.0 97.6 1.0 (2006)Uzbekistan 94.9 (1996) 99.0 (2006) 99.1 99.0 1.0 (2006) 98.0 99.2 1.0 (2006)
East AsiaChina, People’s Rep. of 69.7 (1992) 91.0 (2008) … … … … … …Hong Kong, China … … … … … … … …Korea, Rep. of … … … … … … … …Mongolia 89.8 (1998) 99.5 (2006) 99.6 99.2 1.0 (2008) … … …Taipei,China … … … … … … … …
South AsiaBangladesh 25.7 (1994) 51.2 (2007) 71.1 45.8 1.6 (2007) 30.4 83.2 2.7 (2007)Bhutan 51.0 (2000) 88.0 (2007) 93.4 86.0 1.1 (2007) … … …India 61.9 (1993) 75.2 (2008) 87.1 70.6 1.2 (2008) … … …Maldives 81.0 (2001) 99.1 (2009) … … … … … …Nepal 15.4 (1991) 43.7 (2006) 84.6 37.5 2.3 (2006) 17.7 84.1 4.8 (2006)Sri Lanka 80.2 (1993) 99.4 (2007) 99.5 99.4 1.0 (2007) 99.0 99.6 1.0 (2007)
Southeast AsiaBrunei Darussalam a 100.0 (1994) 99.0 (2009) … … … … … …Cambodia 34.3 (1998) 69.3 (2005) 79.2 67.7 1.2 (2005) 55.2 90.3 1.6 (2005)Indonesia 76.3 (1991) 93.3 (2007) 97.7 90.1 1.1 (2007) 82.2 99.2 1.2 (2007)Lao PDR 26.5 (2001) 35.1 (2006) 76.2 27.1 2.8 (2006) 16.3 87.6 5.4 (2006)Malaysia 73.6 (2003) 78.8 (2005) … … … … … …Myanmar 75.8 (1997) 79.8 (2007) 90.5 76.4 1.2 (2007) … … …Philippines 83.1 (1993) 91.1 (2008) 94.2 88.1 1.1 (2008) 77.1 98.3 1.3 (2008)Singapore … … … … … … … …Thailand 85.9 (1996) 99.1 (2009) 97.8 97.8 1.0 (2006) 96.0 99.5 1.0 (2009)Viet Nam 70.6 (1997) 90.8 (2006) 98.0 88.6 1.1 (2006) 68.5 98.8 1.4 (2006)
The Pacific Cook Islands … 100.0 (2008) … … … … … …Fiji, Rep. of … 100.0 (2008) … … … … … …Kiribati 88.0 (1994) 100.0 (2008) … … … … … …Marshall Islands … 81.2 (2007) 94.4 56.9 1.7 (2007) 59.8 97.8 1.6 (2007)Micronesia, Fed. States of … 80.0 (2008) … … … … … …Nauru … 94.5 (2007) … … … 95.3 93.6 1.0 (2007)Palau 100.0 (2007) 100.0 (2008) … … … … … …Papua New Guinea 77.5 (1996) 78.8 (2006) 93.4 76.4 1.2 (2006) … … …Samoa … 93.0 (2009) … … … … … …Solomon Islands … 73.9 (2007) 84.3 72.4 1.2 (2007) 64.0 81.8 1.3 (2007)Timor-Leste 70.9 (1997) 84.4 (2010) 78.5 55.3 1.4 (2003) … … …Tonga … 99.0 (2008) … … … … … …Tuvalu … 97.4 (2007) … … … 97.9 98.1 1.0 (2007)Vanuatu … 84.3 (2007) 87.4 83.7 1.0 (2007) 77.8 88.5 1.1 (2007)
Developed Member EconomiesAustralia 100.0 (1991) 98.3 (2008) … … … … … …Japan … … … … … … … …New Zealand … 95.0 (1994) … … … … … …

48
Framework of Inclusive Growth Indicators
a Gender parity is measured as the ratio of female labor force participation rate to male labor force participation rate. b Brunei Darussalam is a regional member of ADB, but it is not classified as a developing member.
Sources: ADB estimates based on data from Key Indicators of the Labour Market (ILO 2011); Secretariat of the Pacific Community website (www.spc.int/prism); for Taipei,China: Monthly Bulletin of Statistics Online (Directorate-General of Budget, Accounting and Statistics 2011).
Table 3.3 Gender Equality and Opportunity
PolIcy PIllAr 2
28 Gender Parity in Labor Force Participation,
Aged 15 Years and Over (percentage) a
1990 2000 2009Developing Member Economies Central and West Asia
Afghanistan 38.6 37.1 39.2Armenia 78.2 78.9 79.9Azerbaijan 80.3 80.2 89.1Georgia 76.4 74.0 74.6Kazakhstan 79.9 84.8 86.1Kyrgyz Republic 78.6 75.9 69.2Pakistan 15.9 19.1 25.6Tajikistan 73.2 66.6 73.4Turkmenistan 80.4 82.1 84.4Uzbekistan 79.0 82.3 82.2
East AsiaChina, People’s Rep. of 86.0 84.8 84.5Hong Kong, China 59.3 67.5 75.8Korea, Rep. of 64.2 66.6 69.6Mongolia 81.8 84.6 86.7Taipei,China 60.2 66.3 74.7
South AsiaBangladesh 69.2 63.6 71.1Bhutan 67.2 51.2 75.7India 40.4 40.1 40.4Maldives 40.1 52.5 74.2Nepal 61.9 73.7 78.8Sri Lanka 47.2 47.4 45.6
Southeast AsiaBrunei Darussalam b 54.7 70.0 79.8Cambodia 92.6 89.2 85.9Indonesia 61.8 59.4 60.5Lao PDR 96.8 97.7 98.5Malaysia 53.4 54.8 56.1Myanmar 79.3 76.6 74.2Philippines 57.3 59.5 62.7Singapore 64.0 66.5 71.1Thailand 86.3 81.3 81.1Viet Nam 90.1 89.9 89.4
The PacificCook Islands 66.7 (1996) 80.4 (2001) 84.4 (2006)Fiji, Rep. of 34.8 49.7 49.4Kiribati … 88.4 78.7 (2005)Marshall Islands 53.4 (1999) 51.7 51.6 (2007)Micronesia, Fed. States of 53.0 (1994) 74.6 …Nauru … … …Palau 77.1 (1995) 77.6 77.6 (2005)Papua New Guinea 96.2 96.7 96.5Samoa 52.0 51.4 50.3Solomon Islands 50.7 49.4 48.4Timor-Leste 70.6 69.9 71.2Tonga 55.6 64.2 73.1Tuvalu … … …Vanuatu 89.6 89.8 89.8
Developed Member EconomiesAustralia 68.9 75.4 80.8Japan 64.7 64.5 66.8New Zealand 72.0 77.4 81.7

49
Key Indicators for Asia and the Pacific 2011 Special Supplement
SPECIAL SUPPLEMEN
T
a Brunei Darussalam is a regional member of ADB, but it is not classified as a developing member.
Sources: Millennium Indicators Database Online (UNSD 2011), Women in National Parliament Online (IPU 2011), Pacific Regional Information System (SPC 2010).
Table 3.3 Gender Equality and Opportunity
PolIcy PIllAr 2
29 Percentage of Seats held by Women in National Parliament
1990 2000 2011Developing Member Economies Central and West Asia
Afghanistan 3.7 27.3 (2006) 27.7Armenia 35.6 3.1 9.2Azerbaijan 12.0 (1997) 12.0 16.0Georgia 6.8 (1997) 7.2 6.5Kazakhstan 13.4 (1997) 10.4 17.8Kyrgyz Republic 1.4 (1997) 1.4 23.3Pakistan 10.1 2.3 (1999) 22.2Tajikistan 2.8 (1997) 2.8 19.0Turkmenistan 26.0 26.0 16.8Uzbekistan 6.0 (1997) 6.8 22.0
East AsiaChina, People’s Rep. of 21.3 21.8 21.3Hong Kong, China … … …Korea, Rep. of 2.0 3.7 14.7Mongolia 24.9 7.9 3.9Taipei,China … … …
South AsiaBangladesh 10.3 9.1 18.6Bhutan 2.0 2.0 8.5India 5.0 9.0 10.8Maldives 6.3 6.0 (2001) 6.5Nepal 6.1 5.9 33.2Sri Lanka 4.9 4.9 5.3
Southeast AsiaBrunei Darussalam a … … …Cambodia 5.8 (1997) 8.2 21.1Indonesia 12.4 8.0 (2001) 18.0Lao PDR 6.3 21.2 25.2Malaysia 5.1 10.4 (2001) 9.9Myanmar … ... 4.3Philippines 9.1 12.4 22.1Singapore 4.9 4.3 23.4Thailand 2.8 5.6 13.3Viet Nam 17.7 26.0 25.8
The Pacific Cook Islands 6.0 (1995) 8.0 (2001) 12.5 (2009)Fiji, Rep. of 4.3 (1997) 11.3 8.5 (2006)Kiribati – 4.9 4.3Marshall Islands … 3.0 (2001) 3.0Micronesia, Fed. States of – (1997) – –Nauru 5.6 – –Palau – (1997) – –Papua New Guinea – 1.8 0.9Samoa – 8.2 4.1Solomon Islands – 2.0 –Timor-Leste … 26.1 (2003) 29.2Tonga – – (2001) 3.6Tuvalu 7.7 – –Vanuatu 4.3 – 3.8
Developed Member EconomiesAustralia 6.1 22.4 24.7Japan 1.4 4.6 11.3New Zealand 14.4 29.2 33.6

50
Framework of Inclusive Growth Indicators
Policy Pillar 3: Social Safety Nets
High and sustained economic growth—the first policy pillar of an inclusive growth strategy is important to bring people out of poverty. At the same time, allocating resources for social safety nets are essential to protect the very poor and the vulnerable populations from the various risks and shocks of life such as transitory livelihood and health shocks. Therefore, policies that establish social safety nets are an essential pillar of an inclusive growth strategy. Across developing Asia and the Pacific, social protection coverage is very low. Social safety nets and protection are expected to increase as countries become richer and governments can afford resources for social assistance to protect the poor and the marginalized through programs for labor markets, social insurance (such as for pensioners, health insurance, disability benefits), etc.
What are the proposed indicators?Three indicators are proposed:
• Social protection and labor rating, • Social security expenditure on health as a percentage
of government expenditure on health, and• Government expenditure on social security
and welfare as percentage of total government expenditure.
Quantitative indicators that provide a good measure of social safety nets and social protection from official statistics are usually lacking. The first indicator, social protection and labor rating, is compiled by the Asian Development Bank (ADB) as one of the 17 criteria under its annual Country Performance Assessment (CPA)1 exercise. This criterion assesses government policies in social protection and labor market regulations that reduce the risk of becoming poor, help the poor to better manage further risks, and ensure a minimal level of welfare to all people. Interventions include social safety net programs, pension and old age savings programs, protection of basic labor standards, labor market regulations, etc. The second indicator refers to the government’s health expenditures on social security schemes and other schemes of compulsory health insurance. The data for the indicator are available from national health accounts. The third indicator consists of expenditures by government to provide benefits
1 The CPA assesses policy and institutional framework for promoting poverty reduction, sustainable growth, and effective use of ADB’s concessional assistance. ADB uses the International Development Association (IDA) country policy and institutional assessment guidelines and questionnaire which, provides 16 criteria to assess each country’s performance based on the (i) quality of its macroeconomic management, (ii) coherence of its structural policies, (iii) degree to which its policies and institutions promote equity and inclusion, (iv) quality of its governance and public sector management. One of the criteria under social inclusion and equity is social protection and labor. For details refer ADB website: http://www.adb.org/ADF/cpa.asp. For IDA guidelines and questionnaire used for the country policy and institutional assessment, refer the World Bank website: http://siteresources.worldbank.org/IDA/Resources/73153-1181752621336/CPIA09CriteriaB.pdf
in cash or in kind to persons who are sick, fully or partially disabled, of old age, survivors, families and children, or unemployed, among others. The data for the last indicator are available from official statistics.
Trends in Economies
The social protection and labor ratings range from a rating of “1” corresponding to a very weak performance, to a rating of “6” for a very strong performance. For year 2010, the ratings are available for 28 developing member economies including 12 Pacific island economies. In 2010, these ratings were from a low of 2.0 in Federated States of Micronesia and 2.5 in Afghanistan, Solomon Islands, and Tonga, to a high of 4.5 in Georgia and Viet Nam and 5.0 in Armenia.
The government’s health expenditures on social security schemes and other schemes of compulsory health insurance as a percent to total government expenditure on health
are high in the People’s Republic of China, Georgia, Japan, the Republic of Korea, and Kyrgyz Republic. These ranged from about 64.6% in Georgia to 81.5% in Japan in 2009. In most other countries for which data are available, these percentages were below 20%. Countries with expenditures below 5% included Malaysia, the Maldives, Myanmar, Pakistan, and Samoa.
Government expenditure on social security and welfare is low in most countries of the Asia and Pacific region, as social safety nets have not been developed except in a few countries. These expenditures range from a low of 0.5% in the Republic of Fiji to a high of 32.3% in Australia and 39.5% in Japan, in 2010. Other economies with relatively high expenditures on social security in 2010 include Armenia (36%), the Republic of Korea and Taipei,China (both 22%), and Georgia (20%). Out of 28 countries, 17 had percentages below 10% in 2010. However, social security and welfare expenditures account for a rising share of government expenditure in several countries. Between 2000 and 2010 (or nearest years), the share in Timor-Leste increased by 10 percentage points, in Singapore by 9 percentage points, in the Maldives by 8 percentage points, in the Republic of Korea by 7 percentage points, and in the People’s Republic of China by 5 percentage points. In Armenia, the ratio went up from about 10% in 2000 to 36% in 2010, matching the developed economies of Australia and Japan in the region. Overall, social security and welfare expenditures as shares of government expenditures tended to rise.
The classification of functions of government provides a good framework to provide expenditures on different forms of social protection including cash and benefits in kind for the socially excluded such as the destitute, low-income earners, and indigenous people. Such disaggregated data are usually not available, and collection of these statistics is encouraged.

51
Key Indicators for Asia and the Pacific 2011 Special Supplement
SPECIAL SUPPLEMEN
TPOLICY PILLAR 3
Note: Lao PDR = Lao People’s Democratic Republic.Source: Table 4.
Figure S22Social Security Expenditure on Health (percent of government expenditure on health), 1995 or Earliest Year and 2009
Figure S23Government Expenditure on Social Security and Welfare (percent of total government expenditure), 1995 and 2010 or Nearest Year
0
10
20
30
40
50
60
70
80
90
Mal
aysi
a
Sam
oa
Mya
nmar
Paki
stan
Turk
men
ista
n
Thai
land
Sing
apor
e
Lao
PDR
Mar
shal
l Isl
ands
Indo
nesi
a
Indi
a
Mic
rone
sia,
Fed
. Sta
tes
of
Philip
pine
s
Mon
golia
Viet
Nam
Geor
gia
Chin
a, P
eopl
e's
Rep.
of
Kyrg
yz R
epub
lic
Kore
a, R
ep. o
f
Japa
n
Perc
ent
1995 or earliest year 2009
0
5
10
15
20
25
30
35
40
Fiji,
Rep
. of
Papu
a N
ew G
uine
a
Kirib
ati
Sam
oa
Cam
bodi
a
Bhut
an
Mal
aysi
a
Brun
ei D
arus
sala
m
Nep
al
Indi
a
Kyrg
yz R
epub
lic
Philip
pine
s
Bang
lade
sh
Thai
land
Sri L
anka
Azer
baija
n
Chin
a, P
eopl
e's
Rep.
of
Mal
dive
s
Sing
apor
e
Hong
Kon
g, C
hina
Tajik
ista
n
Mon
golia
Timor
-Les
te
Geor
gia
Taip
ei,C
hina
Kore
a, R
ep. o
f
Aust
ralia
Arm
enia
New
Zea
land
Japa
n
Perc
ent
1995 2010

52
Framework of Inclusive Growth Indicators
POLICY PILLAR 3
a A rating of “1” corresponds to a very weak performance, and a “6” rating to a very strong performance.b Data refer to central government, except for the People’s Republic of China, Georgia, Japan, the Kyrgyz Republic, and Tajikistan, where data refer to consolidated
government or general government.c From 2000 onward, data on social security and welfare include defense.d Brunei Darussalam is a regional member of ADB, but it is not classified as a developing member.
Sources: Country Performance Assessment Annual Report (ADB 2011, www.adb.org/ADF/cpa.asp), Global Health Observatory (World Health Organization 2011), economy sources.
Table 4 Social Safety Nets
30 Social Protection and Labor Rating a
31 Social Security Expenditure on Health (percent of government expenditure on health)
32 Government Expenditure on Social Security and Welfare (percent of total expenditure) b
2005 2010 1995 2000 2009 1995 2000 2010Developing Member Economies Central and West Asia
Afghanistan ... 2.5 … … … … … …Armenia ... 5.0 … … … 6.0 (1996) 9.8 36.1Azerbaijan 3.5 ... … … … 8.5 18.2 9.5Georgia ... 4.5 39.2 44.3 64.6 25.0 26.3 20.2Kazakhstan ... … 13.7 (1996) 19.4 (1998) … … … …Kyrgyz Republic 3.5 4.0 0.6 (1997) 10.0 70.1 19.9 10.1 6.0Pakistan 3.0 3.0 5.2 5.8 3.8 … … …Tajikistan c 3.0 3.5 … … … 0.6 12.3 12.7 (2009)Turkmenistan ... … 6.0 (1996) 6.5 6.5 … … …Uzbekistan 3.5 4.0 … … … … … …
East AsiaChina, People’s Rep. of … … 64.2 57.2 66.3 1.7 4.7 10.1Hong Kong, China … … … … … 7.3 10.1 12.6Korea, Rep. of … … 79.3 77.3 78.8 7.7 15.2 22.4Mongolia 3.5 4.0 39.0 24.5 28.5 16.3 17.7 14.2 (2007)Taipei,China … … … … … 23.7 25.3 21.8 (2009)
South AsiaBangladesh 4.0 4.0 … … … 0.9 1.3 2.9 (2008)Bhutan 3.5 4.0 … … … … 4.7 (2002) 4.3India ... ... 12.1 16.9 15.9 4.5 (1999) 4.2 5.6 (2008)Maldives 3.5 3.5 … … 3.6 (2008) 3.1 2.8 10.9Nepal 3.0 4.0 … … … 3.1 5.4 4.8Sri Lanka 3.5 3.5 … … … 16.3 10.8 8.3
Southeast AsiaBrunei Darussalam d … … … … … 3.7 3.6 4.8 (2004)Cambodia 2.5 3.5 … … … 5.1 2.4 4.0Indonesia 3.5 ... 10.1 6.2 13.7 … … …Lao PDR 3.5 3.5 1.3 1.4 12.1 … … …Malaysia … … 0.8 0.6 0.8 3.5 3.7 4.8Myanmar … … 1.6 3.1 1.6 … … …Philippines … … 11.4 14.7 19.7 1.9 3.9 6.7Singapore … … 4.0 4.8 11.2 5.0 3.5 12.5 (2009)Thailand … … 7.1 9.4 9.1 3.5 5.6 7.4Viet Nam 4.0 4.5 7.0 19.7 31.4 … … …
The PacificCook Islands 4.0 … … … … … … …Fiji, Rep. of … … … … … 0.3 0.4 0.5Kiribati 3.0 3.0 … … … 0.0 1.7 3.1Marshall Islands 3.0 3.0 29.2 35.0 12.9 … … …Micronesia, Fed. States of 2.5 2.0 12.8 21.4 17.6 … … …Nauru … 3.5 … … … … … …Palau … 3.5 … … … … … …Papua New Guinea 3.0 3.0 … … … 0.8 1.7 1.5 (2002)Samoa 4.0 3.5 1.1 1.0 (1999) 0.8 4.0 4.5 4.0Solomon Islands 2.0 2.5 … … … … … …Timor-Leste ... 3.0 … … … … 8.5 (2007) 18.5 (2009)Tonga 2.5 2.5 … … … 2.5 4.6 …Tuvalu 3.5 3.0 … … … … … …Vanuatu 2.5 3.0 … … … … 0.2 0.2 (2004)
Developed Member EconomiesAustralia … … … … … 37.3 (1999) 36.6 32.3Japan … … 81.7 80.9 81.5 36.5 36.8 39.5 (2009)New Zealand … … … 9.7 (2004) 11.2 38.2 39.4 36.1 (2004)

53
Key Indicators for Asia and the Pacific 2011 Special Supplement
SPECIAL SUPPLEMEN
T
Good Governance and Institutions
Evidence of a positive association between governance and institutions on one hand, and income and growth on the other, is growing. A two-way link between the two has also been recognized.1 Good governance traditions and strong institutions establish accountability, rule of law, government effectiveness, and quality of public services, and controls corruption. Good governance will ensure that public funds are used efficiently and with accountability and all people, including the poor and the marginalized, are able to access the opportunities. It also promotes expansion of private sector investments leading to the creation of more jobs and opportunities in the economy.
What are the proposed indicators?Measurable indicators that show the state of governance and institutions from official statistics are not available. The following three indicators are selected.
• Voice and accountability,• Government effectiveness, and• Corruption perceptions index.
The first two indicators (or ratings) are sourced from the World Bank’s World Governance Indicators, while the third indicator is the corruption perceptions index sourced from a private research organization, Transparency International. All the three indicators are based on perception surveys of firms, households, nongovernment organizations, and multilateral organizations. The ratings for the first two in the standard normal units of the World Governance Indicators range from –2.5 to +2.5, with higher values corresponding to better governance outcomes. The corruption perceptions index of Transparency International gives a score from 0 (highly corrupt) to 10 (very clean). It may be noted that these are perceptions-based indexes and caution needs to be exercised in comparing the indicators across time for a country and across countries. Being perceptions-based, there is a subjective element in the perceived assessments and small differences in the point estimates across economies or time should be interpreted with caution. Associated standard error and confidence interval along with sources of data should be considered.2
1 Zhuang, et.al. 2010. Governance and Institutional Quality and the Links with Growth and Inequality. In J. Zhuang, ed. Poverty, Inequality, and Inclusive Growth in Asia: Measurement, Policy Issues, and Country Studies. Manila: Asian Development Bank.
2 For details on methodology, data sources, interpretation, etc. refer to (i) Kaufmann, Daniel, Aart Kraay, and Massimo Mastruzzi. 2010. The Worldwide Governance Indicators: Methodology and Analytical Issues (September 2010). World Bank Policy Research Working Paper No. 5430. Washington, D.C.: World Bank. http://ssrn.com/abstract=1682130; (ii) Worldwide Governance Indicators website at http://info.worldbank.org/governance/wgi/index.asp, and (iii) Transparency International website: http://www.transparency.org/policy_research/surveys_indices/cpi
“Voice and accountability” captures perceptions of the extent to which a country’s citizens are able to participate in selecting their government, as well as freedom of expression. “Government effectiveness” captures perceptions of the quality of public services, the quality of the civil services and the degree of independence from political pressures, the quality of policy formulation and implementation, and the credibility of the government’s commitment to such policies. “Corruption perceptions index” measures the degree to which public sector corruption is perceived to exist in a country on a scale from 10 (very clean) to 0 (highly corrupt).
Governance Rating in Economies
The indicator for “voice and accountability” for 2009 was less than zero for 30 out of 45 countries with the lowest ratings (between –1.9 and –2.2) assigned to Myanmar, Turkmenistan, and Uzbekistan, and the highest (between 1.1 and 1.3) assigned to four Pacific island countries—Marshall Islands, Federated States of Micronesia, Nauru, and Palau. By comparison, Japan’s rating was 1.0, Australia’s 1.4, and New Zealand’s 1.5.
The indicator for “government effectiveness” for 2009 was less than zero for 33 out of 45 economies with the lowest ratings (between –1.4 and –1.9) assigned to Afghanistan, Marshall Islands, and Myanmar and the highest assigned to both Singapore (2.2) and Hong Kong, China (1.8). For comparison, Japan’s rating was 1.3, Australia’s 1.7, and New Zealand’s 1.9.
The “corruption perceptions index” for 2010 was below 5 for 32 out of 41 economies, with the lowest ratings of 1.4 assigned to Afghanistan and Myanmar. Only nine economies (including Australia, Japan, and New Zealand) had scores above 5, with highest score of 9.3 assigned to New Zealand and Singapore. Other economies with ratings of 8.0 or higher were Australia and Hong Kong, China, with Japan close at 7.8.

54
Framework of Inclusive Growth Indicators
GOOD GOVERNANCE AND INSTITUTIONS
Note: Lao PDR = Lao People's Democratic Republic.Source: Table 5.
Figure S24Government Effectiveness, 2009
Figure S25Corruption Perceptions Index, 2010
-2.5
-2.0
-1.5
-1.0
-0.5
0.0
0.5
1.0
1.5
2.0
2.5Si
ngap
ore
New
Zea
land
Hong
Kon
g, C
hina
Aust
ralia
Japa
nKo
rea,
Rep
. of
Taip
ei,C
hina
Mal
aysi
aBr
unei
Dar
ussa
lam
Bhut
anGe
orgi
aTh
aila
ndCh
ina,
Peo
ple'
s Re
p. o
fAr
men
iaSa
moa
Indi
aPh
ilippi
nes
Sri L
anka
Kaza
khst
anIn
done
sia
Viet
Nam
Vanu
atu
Tong
aM
aldi
ves
Nau
ruTu
valu
Pala
uM
icro
nesi
a, F
ed. S
tate
s of
Azer
baija
nKi
ribat
iUz
beki
stan
Cam
bodi
aM
ongo
liaPa
pua
New
Gui
nea
Paki
stan
Nep
alFi
ji, R
ep. o
fKy
rgyz
Rep
ublic
Bang
lade
shSo
lom
on Is
land
sCo
ok Is
land
sLa
o PD
RTa
jikis
tan
Timor
-Les
teTu
rkm
enis
tan
Mar
shal
l Isl
ands
Afgh
anis
tan
Mya
nmar
Scor
e
0.0
1.0
2.0
3.0
4.0
5.0
6.0
7.0
8.0
9.0
10.0
New
Zea
land
Sing
apor
e
Aust
ralia
Hong
Kon
g, C
hina
Japa
n
Taip
ei,C
hina
Bhut
an
Brun
ei D
arus
sala
m
Kore
a, R
ep. o
f
Mal
aysi
a
Sam
oa
Geor
gia
Vanu
atu
Chin
a, P
eopl
e's
Rep.
of
Thai
land
Indi
a
Kirib
ati
Sri L
anka
Tong
a
Kaza
khst
an
Indo
nesi
a
Solo
mon
Isla
nds
Mon
golia
Viet
Nam
Arm
enia
Timor
-Les
te
Azer
baija
n
Bang
lade
sh
Philip
pine
s
Mal
dive
s
Paki
stan
Nep
al
Cam
bodi
a
Lao
PDR
Papu
a N
ew G
uine
a
Tajik
ista
n
Kyrg
yz R
epub
lic
Turk
men
ista
n
Uzbe
kist
an
Afgh
anis
tan
Mya
nmar
Scor
e

55
Key Indicators for Asia and the Pacific 2011 Special Supplement
SPECIAL SUPPLEMEN
TGOOD GOVERNANCE AND INSTITUTIONS
a Figures expressed in standard normal units of the governance indicator, ranging from –2.5 to 2.5 with higher values corresponding to better governance outcomes.b Scores relate to perceptions of the degree of corruption and ranges from 10 (highly clean) to 0 (highly corrupt).c Brunei Darussalam is a regional member of ADB, but it is not classified as a developing member.
Sources: Worldwide Governance Indicators (WGI 1996–2010, info.worldbank.org/governance/wgi/index.asp), Transparency International (2011).
Table 5 Good Governance and Institutions
33 Voice and Accountability a 34 Government Effectiveness a 35 Corruption Perceptions Index b
1996 2009 1996 2009 2009 2010Developing Member Economies Central and West Asia
Afghanistan -1.8 -1.4 -2.3 (1998) -1.6 1.3 1.4Armenia -0.7 -0.8 -0.6 0.1 2.7 2.6Azerbaijan -1.1 -1.2 -0.9 -0.6 2.3 2.4Georgia -0.4 -0.2 -0.4 0.2 4.1 3.8Kazakhstan -0.9 -1.0 -1.1 -0.2 2.7 2.9Kyrgyz Republic -0.7 -1.0 -0.4 -1.0 1.9 2.0Pakistan -0.7 -1.0 -0.6 -0.9 2.4 2.3Tajikistan -1.7 -1.3 -1.5 -1.1 2.0 2.1Turkmenistan -1.8 -2.1 -1.1 -1.3 1.8 1.6Uzbekistan -1.5 -1.9 -1.1 -0.7 1.7 1.6
East AsiaChina, People’s Rep. of -1.7 -1.7 0.0 0.1 3.6 3.5Hong Kong, China 0.2 0.5 1.1 1.8 8.2 8.4Korea, Rep. of 0.5 0.7 0.8 1.1 5.5 5.4Mongolia 0.5 -0.0 -0.2 -0.8 2.7 2.7Taipei,China 0.6 0.9 1.2 1.1 5.6 5.8
South AsiaBangladesh -0.2 -0.4 -0.7 -1.0 2.4 2.4Bhutan -1.4 -0.6 0.6 (1998) 0.4 5.4 5.7India 0.1 0.5 -0.1 -0.0 3.4 3.3Maldives -1.1 -0.1 0.9 (1998) -0.4 2.5 2.3Nepal -0.1 -0.6 -0.5 (1998) -1.0 2.3 2.2Sri Lanka -0.2 -0.5 -0.5 -0.2 3.1 3.2
Southeast AsiaBrunei Darussalam c -1.1 -0.8 1.0 0.9 5.5 5.5Cambodia -1.0 -0.9 -1.3 -0.7 2.0 2.1Indonesia -1.2 -0.1 0.2 -0.2 2.8 2.8Lao PDR -1.1 -1.7 -0.7 (1998) -1.0 2.0 2.1Malaysia -0.3 -0.5 0.9 1.0 4.5 4.4Myanmar -2.1 -2.2 -1.2 -1.9 1.4 1.4Philippines 0.2 -0.1 0.0 -0.1 2.4 2.4Singapore -0.2 -0.4 2.0 2.2 9.2 9.3Thailand 0.3 -0.4 0.4 0.2 3.4 3.5Viet Nam -1.5 -1.5 -0.2 -0.3 2.7 2.7
The Pacific Cook Islands … -0.3 0.1 (2000) -1.0 ... ...Fiji, Rep. of -0.3 -0.7 -0.2 (1998) -1.0 ... ...Kiribati 1.2 0.7 -0.6 (1998) -0.7 2.8 3.2Marshall Islands 1.3 1.1 -0.4 (1998) -1.4 ... ...Micronesia, Fed. States of 1.1 1.1 -0.4 (1998) -0.6 ... ...Nauru 1.1 1.1 -0.6 (2007) -0.4 ... ...Palau 1.2 1.3 -0.6 (2008) -0.5 ... ...Papua New Guinea 0.4 0.1 -0.3 -0.8 2.1 2.1Samoa 0.7 0.5 0.4 (1998) 0.0 4.5 4.1Solomon Islands 1.1 0.2 -0.8 (1998) -1.0 2.8 2.8Timor-Leste 0.1 (2000) 0.1 -0.8 (2002) -1.1 2.2 2.5Tonga -0.1 -0.1 -0.3 (1998) -0.4 3.0 3.0Tuvalu 1.5 0.8 0.5 (2000) -0.4 ... ...Vanuatu 0.5 0.6 -0.4 (1998) -0.3 3.2 3.6
Developed Member EconomiesAustralia 1.3 1.4 1.3 1.7 8.7 8.7Japan 0.9 1.0 1.1 1.3 7.7 7.8New Zealand 1.6 1.5 2.1 1.9 9.4 9.3
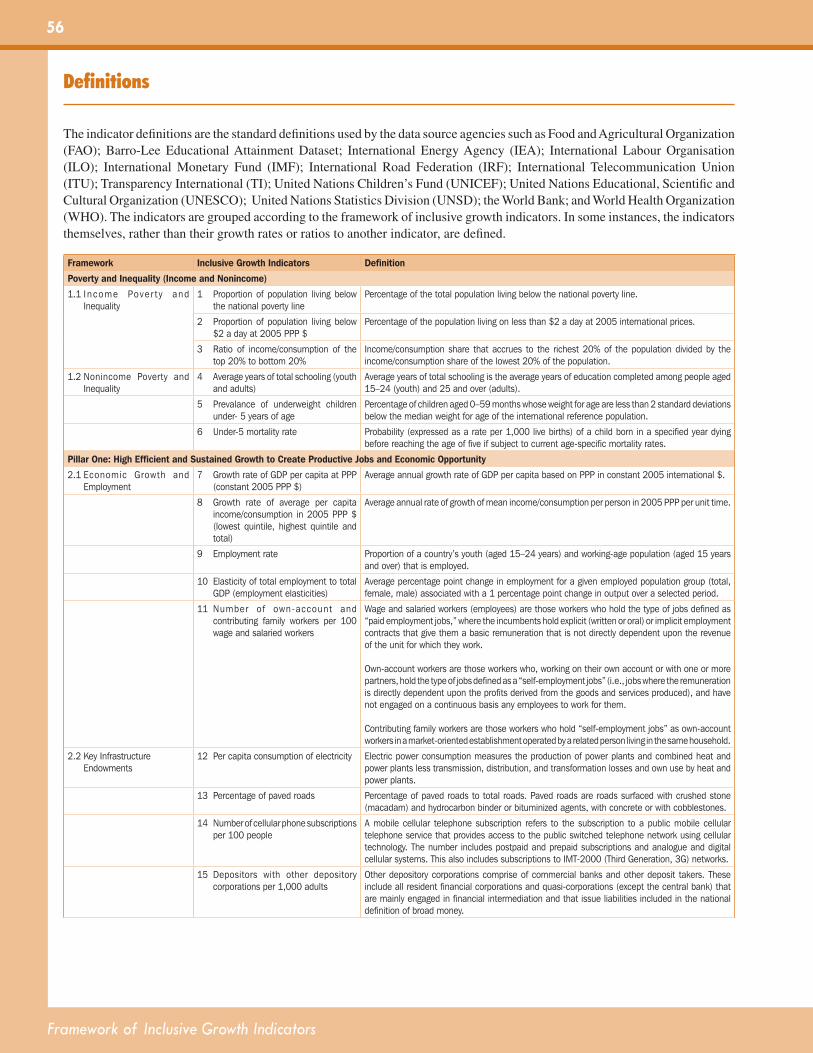
56
Framework of Inclusive Growth Indicators
Framework Inclusive Growth Indicators Definition
Poverty and Inequality (Income and Nonincome)
1.1 I ncome Pove r t y and Inequality
1 Proportion of population living below the national poverty line
Percentage of the total population living below the national poverty line.
2 Proportion of population living below $2 a day at 2005 PPP $
Percentage of the population living on less than $2 a day at 2005 international prices.
3 Ratio of income/consumption of the top 20% to bottom 20%
Income/consumption share that accrues to the richest 20% of the population divided by the income/consumption share of the lowest 20% of the population.
1.2 Nonincome Poverty and Inequality
4 Average years of total schooling (youth and adults)
Average years of total schooling is the average years of education completed among people aged 15–24 (youth) and 25 and over (adults).
5 Prevalance of underweight children under- 5 years of age
Percentage of children aged 0–59 months whose weight for age are less than 2 standard deviations below the median weight for age of the international reference population.
6 Under-5 mortality rate Probability (expressed as a rate per 1,000 live births) of a child born in a specified year dying before reaching the age of five if subject to current age-specific mortality rates.
Pillar One: High Efficient and Sustained Growth to Create Productive Jobs and Economic Opportunity
2.1 Economic Growth and Employment
7 Growth rate of GDP per capita at PPP (constant 2005 PPP $)
Average annual growth rate of GDP per capita based on PPP in constant 2005 international $.
8 Growth rate of average per capita income/consumption in 2005 PPP $ (lowest quintile, highest quintile and total)
Average annual rate of growth of mean income/consumption per person in 2005 PPP per unit time.
9 Employment rate Proportion of a country’s youth (aged 15–24 years) and working-age population (aged 15 years and over) that is employed.
10 Elasticity of total employment to total GDP (employment elasticities)
Average percentage point change in employment for a given employed population group (total, female, male) associated with a 1 percentage point change in output over a selected period.
11 Number of own-account and contributing family workers per 100 wage and salaried workers
Wage and salaried workers (employees) are those workers who hold the type of jobs defined as “paid employment jobs,” where the incumbents hold explicit (written or oral) or implicit employment contracts that give them a basic remuneration that is not directly dependent upon the revenue of the unit for which they work.
Own-account workers are those workers who, working on their own account or with one or more partners, hold the type of jobs defined as a “self-employment jobs” (i.e., jobs where the remuneration is directly dependent upon the profits derived from the goods and services produced), and have not engaged on a continuous basis any employees to work for them.
Contributing family workers are those workers who hold “self-employment jobs” as own-account workers in a market-oriented establishment operated by a related person living in the same household.
2.2 Key Infrastructure Endowments
12 Per capita consumption of electricity Electric power consumption measures the production of power plants and combined heat and power plants less transmission, distribution, and transformation losses and own use by heat and power plants.
13 Percentage of paved roads Percentage of paved roads to total roads. Paved roads are roads surfaced with crushed stone (macadam) and hydrocarbon binder or bituminized agents, with concrete or with cobblestones.
14 Number of cellular phone subscriptions per 100 people
A mobile cellular telephone subscription refers to the subscription to a public mobile cellular telephone service that provides access to the public switched telephone network using cellular technology. The number includes postpaid and prepaid subscriptions and analogue and digital cellular systems. This also includes subscriptions to IMT-2000 (Third Generation, 3G) networks.
15 Depositors with other depository corporations per 1,000 adults
Other depository corporations comprise of commercial banks and other deposit takers. These include all resident financial corporations and quasi-corporations (except the central bank) that are mainly engaged in financial intermediation and that issue liabilities included in the national definition of broad money.
Definitions
The indicator definitions are the standard definitions used by the data source agencies such as Food and Agricultural Organization (FAO); Barro-Lee Educational Attainment Dataset; International Energy Agency (IEA); International Labour Organisation (ILO); International Monetary Fund (IMF); International Road Federation (IRF); International Telecommunication Union (ITU); Transparency International (TI); United Nations Children’s Fund (UNICEF); United Nations Educational, Scientific and Cultural Organization (UNESCO); United Nations Statistics Division (UNSD); the World Bank; and World Health Organization (WHO). The indicators are grouped according to the framework of inclusive growth indicators. In some instances, the indicators themselves, rather than their growth rates or ratios to another indicator, are defined.

57
Key Indicators for Asia and the Pacific 2011 Special Supplement
SPECIAL SUPPLEMEN
TDEFINITIONS
Pillar Two: Social Inclusion to Ensure Equal Access to Economic Opportunity
3.1 Access and Inputs to Education and Health
16 School life expectancy (primary to tertiary)
The total number of years of schooling that a child of a certain age can expect to receive, assuming that the probability of his or her being enrolled in school at any particular age is equal to the current enrollment ratio for that age.
17 Pupil–teacher ratio (primary) Average number of pupils (students) per teacher at the primary level of education in a given school year.
18 Diptheria, tetanous toxoid, and pertussis (DTP3) immunization coverage among 1-year-olds
Child immunization measures the percentage of children aged 12–23 months who received vaccinations before 12 months or at any time before the survey. A child is considered adequately immunized against diphtheria, pertussis (or whooping cough), and tetanus (DTP) after receiving three doses of vaccine.
19 Physicians, nurses, and midwives per 10,000 population
Number of medical doctors (physicians), including generalist and specialist medical practitioners, nursing, and midwifery personnel per 10,000 population
20 Government expenditure on education as percentage of total government expenditure
Government expenditure on education (consists of expenditure by government to provide education services at all levels) expressed as a percentage of total government expenditure.
21 Government expenditure on health as a percentage of total government expenditure
Government expenditure on health (consists of expenditure by government to provide medical products, appliances, and equipment; outpatient services; hospital services; public health services; among others) expressed as a percentage of total government expenditure.
3.2 Access to Basic Infrastructure Utilities and Services
22 Percentage of population with access to electricity
Number of people with access to electricity as a percentage of total population.
23 Share of population using solid fuels for cooking purposes
Percentage of the population that relies on solid fuels as the primary source of domestic energy for cooking purposes only. Solid fuels include biomass fuels, such as wood, charcoal, agricultural residues, dung, and coal.
24 Percentage of population using improved drinking water sources
Percentage of the population using improved drinking water sources (including household water connection, public standpipe, borehole, protected dug well, protected spring, rainwater collection, and bottled water).
25 Percentage of population using improved sanitation facilities
Percentage of the population with access to facilities that hygienically separate human excreta from human contact. Improved facilities include flush/pour flush toilets or latrines connected to a sewer, septic tank, or pit, ventilated improved pit latrines, pit latrines with a slab or platform of any material that covers the pit entirely, except for the drop hole and composting toilets/latrines.
3.3 Gender Equality and Opportunity
26 Gender parity in primary, secondary, and tertiary education
Ratio of girls to boys in primary, secondary, and tertiary education is the ratio of the number of female students enrolled at primary, secondary, and tertiary levels of education to the number of male students in each level. To standardize the effects of the population structure of the appropriate age groups, the gender parity index of the gross enrollment ratio for each level of education is used.
27 Antenatal care coverage (at least one visit)
Refers to the percentage of women aged 15–49 years with a live birth in a given time period that received antenatal care provided by skilled health personnel (doctors, nurses, or midwives) at least once during pregnancy, as a percentage of women aged 15–49 years with a live birth in a given time period.
28 Gender parity in labor force participation Ratio of the labor force participation rate of female to male. Labor force participation rate is the percentage of the labor force to the working-age population. The labor force is the sum of those employed and persons who are seeking employment.
29 Percentage of seats held by women in national parliament
Number of seats held by women members in single or lower chambers of national parliaments, expressed as a percentage of all occupied seats.
Pillar Three: Social Safety Nets
30 Social protection and labor rating Social protection and labor assess government policies in social protection and labor market regulations that reduce the risk of becoming poor, help those who are poor to better manage further risks, and ensure a minimal level of welfare to all people.
31 Social security expenditure on health as a percentage of government expenditure on health
Level of social security funds expressed as a percentage of general government expenditure on health.
32 Government expenditure on social security and welfare as percentage of total government expenditure
Government expenditure on social security and welfare (consists of expenditure by government to provide benefits in cash or in kind to persons who are sick, fully or partially disabled, of old age, survivors, or unemployed, among others) expressed as a percentage of total government expenditure.
Good Governance and Institutions
33 Voice and accountability Perceptions of the extent to which a country’s citizens are able to participate in selecting their government, as well as freedom of expression, freedowm of association, and a free media.
34 Government effectiveness Perceptions of the quality of public services, the quality of the civil service and the degree of its independence from political pressures, the quality of policy formulation and implementation, and the credibility of the government’s commitment to such policies.
35 Corruption perceptions index The Corruption Perceptions Index of Transparency International ranks countries in terms of the degree to which corruption is perceived to exist among public officials and politicians. Corruption is defined as the abuse of public office for private gain. The index is a composite index drawing on corruption-related data from expert and business surveys carried out by a variety of independent and reputable institutions. The index reflects views from around the world, including those of experts who are living in the countries evaluated.
Score relates to perceptions of the degree of corruption as seen by business people and country analysts, and ranges between 10 (highly clean) and 0 (highly corrupt).