Framework for Identifying the User Influentiality in …Akshata B.Angadi Department of Computer...
10
Framework for Identifying the User Influentiality in Online Social Network - Facebook as a case study Shwetha V.Bhat K.L.E.I.T., Hubli, Karnataka, India Department of Computer Science and Engineering Karuna C.Gull K.L.E.I.T., Hubli, Karnataka, India Department of Computer Science and Engineering Akshata B.Angadi Department of Computer Science and Engineering K.L.E.I.T., Hubli, Karnataka, India Abstract— Social Networking site such as Facebook or Twitter are getting more and more popular due to the impressive features they offer. In this regard measuring user influence of social networking sites has become a challenging task these days. In networks, action/activities done by users matters lot. Keeping this as our motto we are taking Facebook as case study & tried to develop a method with an algorithm to detect the users influence. In this paper, a social network is formally represented and taking data mining as a perspective, we have proposed a framework that will predict the Influentiality of individual users & multiple users using an efficient Algorithm. Here, we have analyzed the structure of Facebook and considering the activities of individuals we have assigned the ranks & computed the score of each individual based on which we have plotted the graphs, to show the percentage of Influentiality comparing with other users. Keywords— Access Token, Graph API, Influential user, IQR (Influential Quotient Rating), Online Social Network, Selenium. I. INTRODUCTION The advent of online social networks can be considered as a milestone in the web history. A social network is “a set of people (or organizations or other social entities) connected by a set of social relationships, such as friendship, co-working or information exchange.” Social Networking sites like Facebook (FB) focus on building and reflecting the social networking and relationships among the community sharing similar interests. Facebook became a part of our lives and changed the ways of individual communication. In recent years, there has been tremendous interest in the phenomenon of influence exerted by users of an online social network on other users and how it propagates in the network. The idea is that when a user sees their social contacts performing an action such as joining an online community (say community 1), that user may decide to perform the action themselves. International Journal of Latest Trends in Engineering and Technology (IJLTET) Special Issue - IDEAS-2013 97 ISSN: 2278-621X
Transcript of Framework for Identifying the User Influentiality in …Akshata B.Angadi Department of Computer...
Framework for Identifying the User
Influentiality in Online Social Network -
Facebook as a case study
Shwetha V.Bhat
K.L.E.I.T., Hubli, Karnataka, India
Department of Computer Science and Engineering
Karuna C.Gull
K.L.E.I.T., Hubli, Karnataka, India
Department of Computer Science and Engineering
Akshata B.Angadi
Department of Computer Science and Engineering
K.L.E.I.T., Hubli, Karnataka, India
Abstract— Social Networking site such as Facebook or Twitter are getting more and more popular due to the impressive
features they offer. In this regard measuring user influence of social networking sites has become a challenging task these
days. In networks, action/activities done by users matters lot. Keeping this as our motto we are taking Facebook as case
study & tried to develop a method with an algorithm to detect the users influence.
In this paper, a social network is formally represented and taking data mining as a perspective, we have proposed a
framework that will predict the Influentiality of individual users & multiple users using an efficient Algorithm. Here, we
have analyzed the structure of Facebook and considering the activities of individuals we have assigned the ranks &
computed the score of each individual based on which we have plotted the graphs, to show the percentage of Influentiality
comparing with other users.
Keywords— Access Token, Graph API, Influential user, IQR (Influential Quotient Rating), Online Social Network,
Selenium.
I. INTRODUCTION
The advent of online social networks can be considered as a milestone in the web history. A social network is “a
set of people (or organizations or other social entities) connected by a set of social relationships, such as friendship,
co-working or information exchange.”
Social Networking sites like Facebook (FB) focus on building and reflecting the social networking and
relationships among the community sharing similar interests. Facebook became a part of our lives and changed the
ways of individual communication.
In recent years, there has been tremendous interest in the phenomenon of influence exerted by users of an online
social network on other users and how it propagates in the network. The idea is that when a user sees their social
contacts performing an action such as joining an online community (say community 1), that user may decide to
perform the action themselves.
International Journal of Latest Trends in Engineering and Technology (IJLTET)
Special Issue - IDEAS-2013 97 ISSN: 2278-621X
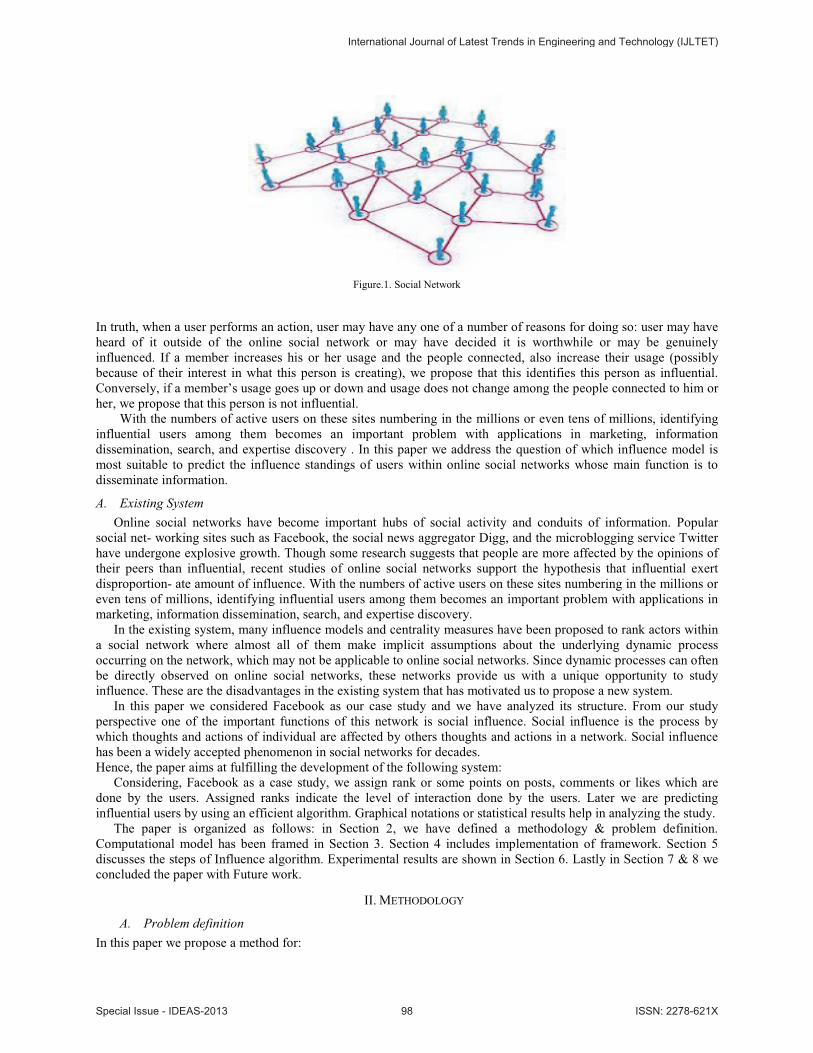
Figure.1. Social Network
In truth, when a user performs an action, user may have any one of a number of reasons for doing so: user may have
heard of it outside of the online social network or may have decided it is worthwhile or may be genuinely
influenced. If a member increases his or her usage and the people connected, also increase their usage (possibly
because of their interest in what this person is creating), we propose that this identifies this person as influential.
Conversely, if a member’s usage goes up or down and usage does not change among the people connected to him or
her, we propose that this person is not influential.
With the numbers of active users on these sites numbering in the millions or even tens of millions, identifying
influential users among them becomes an important problem with applications in marketing, information
dissemination, search, and expertise discovery . In this paper we address the question of which influence model is
most suitable to predict the influence standings of users within online social networks whose main function is to
disseminate information.
A. Existing System
Online social networks have become important hubs of social activity and conduits of information. Popular
social net- working sites such as Facebook, the social news aggregator Digg, and the microblogging service Twitter
have undergone explosive growth. Though some research suggests that people are more affected by the opinions of
their peers than influential, recent studies of online social networks support the hypothesis that influential exert
disproportion- ate amount of influence. With the numbers of active users on these sites numbering in the millions or
even tens of millions, identifying influential users among them becomes an important problem with applications in
marketing, information dissemination, search, and expertise discovery.
In the existing system, many influence models and centrality measures have been proposed to rank actors within
a social network where almost all of them make implicit assumptions about the underlying dynamic process
occurring on the network, which may not be applicable to online social networks. Since dynamic processes can often
be directly observed on online social networks, these networks provide us with a unique opportunity to study
influence. These are the disadvantages in the existing system that has motivated us to propose a new system.
In this paper we considered Facebook as our case study and we have analyzed its structure. From our study
perspective one of the important functions of this network is social influence. Social influence is the process by
which thoughts and actions of individual are affected by others thoughts and actions in a network. Social influence
has been a widely accepted phenomenon in social networks for decades.
Hence, the paper aims at fulfilling the development of the following system:
Considering, Facebook as a case study, we assign rank or some points on posts, comments or likes which are
done by the users. Assigned ranks indicate the level of interaction done by the users. Later we are predicting
influential users by using an efficient algorithm. Graphical notations or statistical results help in analyzing the study.
The paper is organized as follows: in Section 2, we have defined a methodology & problem definition.
Computational model has been framed in Section 3. Section 4 includes implementation of framework. Section 5
discusses the steps of Influence algorithm. Experimental results are shown in Section 6. Lastly in Section 7 & 8 we
concluded the paper with Future work.
II. METHODOLOGY
A. Problem definition
In this paper we propose a method for:
International Journal of Latest Trends in Engineering and Technology (IJLTET)
Special Issue - IDEAS-2013 98 ISSN: 2278-621X
“Finding out the Influential user in social networking site: Facebook as a case i.e., the task of identifying users
capable of stimulating other users to join activities/discussions in their OSN is an important issue in the present era.”
Our framework consists of two main processes:
Development of a web application
Development & Implementation of an Algorithm to detect the influential users (Influence Algorithm).
Let’s take a brief look on what we do in the above stated two processes:
1. Development of web application:This step involves creation of web application on the client side using HTML, JavaScript. For a web application,
we will be providing a URL for the user to search the web page. Later a login page is created through which user logs into our application i.e. influence app. When a user logs into client side web app, it will be automatically directed to Facebook log in. A software automation tool called selenium is used for automatic redirection. The Facebook SDK consists of Graph API tool that provides information about the user activities if user has given permissions to access the basic information. Each time the user logs into our application, an access token is generated by Facebook for that particular user. All the user activity and access token is displayed on our application result page. Then whatever activity he has done from the base login time to the current log-in all the activities is being stored in database of the developed application and that of the further part is used for the implementation section using the data stored in database.
2. Development and implementation of Influence Algorithm: During the web development phase, the user data is recorded into our database. The user activity from the
database is accessed. An algorithm for calculating influential user is developed. For implementation of influence algorithm, we assign some weights to the activities such as likes, comments; posts & so on, then will calculate the score. The graph is plotted based on user activity, score and time. Every time the graph changes as per the user activities. Later slope of the graph is calculated. With the help of slope, tangent inverse of slope is calculated which gives us an angle that defines the influenced quotient rating (IQR) in terms of percentage. Finally, the statistical graph is been put for different users and it is compared with different users to calculate the user influential based on the slope of the graph. With the comparison chart, most influenced user among all is calculated.
In the proposed work, we have focused on four important phases as below (Figure.2):
a. Creating a user interface application for login:
Web applications that require authorization to access certain information. Your login page verifies a user's name
and password, places a cookie on the user's computer so he can return later, and uses database queries to retrieve the
personal information for the user.
b. Extracting user data and storing in database:
We use Graph API tools for extracting data. The advantages of Graph API over previous work are the ability to learn
highly accurate extraction rules, Then we store this user information like ‘average usage time’, ‘average access
frequency’, comments, likes, shares in the database that we have created.
c. Assigning ranks to the users:
Depending on the average usage time and usage frequency, this includes commenting, liking, sharing we assign ranks
to the users. Different weights are given to comments, shares and likes by which the user interacts with the site
through our application.
d. Drawing statistical analysis: We rank Facebook users who login through our application according to the ranking criterions defined. Our
objective is to draw the influence model that best predicts influential users in this network.
Figure .2. General architectural model
III.PROPOSED MODEL
User interface
application for login
Assigning ranks
to the users
Statistical analysis
Extracting user data and
storing in database
International Journal of Latest Trends in Engineering and Technology (IJLTET)
Special Issue - IDEAS-2013 99 ISSN: 2278-621X

In Figure.3. we can see how the app is registerd for first time and how access token is provided for each user who uses the app. So at the time of user login the unique access tokens are provided to the app developer through browser and then the user data is continously posted from facebook to the application.
Figure.3. Creation of Facebook app & its working
Step wise procedure of Figure.3:
STEP 1: The first step is to login into the webpage that is directed by our application.
STEP 2: Then send request to the server to access the information of user.
STEP 3: If user permits then access token is generated for each user for authentication purpose.
STEP 4: User data is returned.
STEP 5: Here, it will post a one time-use token to token URL page.
STEP 6: The user data can be accessed using the access token given to the user.
STEP 7: User data can be served up to registration form or auto login.
STEP 8: User submits page, information is stored in database and flow is complete.
Fig.4. shows the architectural diagram for the proposed problem; here we can see the flow of various actions that has been shown in the block diagram. The first step is log-in to the web page checks for the correct id and password and does verification. Once it is correct it is moved on to the webpage and it collects all the information such as log-in time, log-out Fig.4. shows the architectural diagram for the proposed problem; here we can see the flow of various actions that has been shown in the block diagram. The first step is log-in to the web page checks for the correct id and password and does verification. Once it is correct it is moved on to the webpage and it collects all the information such as log-in time, log-outFig.4. shows the architectural diagram for the proposed problem; here we can see the flow of various actions that has been shown in the block diagram. The first step is log-in to the web page checks for the correct id and password and does verification. Once it is correct it is moved on to the webpage and it collects all the information such as log-in time, log-out
Client
Browser
Our App Facebook
Button
Redirect to FB
FB(Facebook)
Login Page
Authenticate
App(only for first
Redirect to
redirect url
Get access token
access token
Get user data
user data
Login
Page with user
redirect url
International Journal of Latest Trends in Engineering and Technology (IJLTET)
Special Issue - IDEAS-2013 100 ISSN: 2278-621X

Figure.4.Architectural model of proposed system
A. Database Design
There are three main parts in the database design:
1. First we have to store the user email_id ,login time and give unique serial id to users as shown in Table.1.
2. Secondly, we collect all user permissions and group them as different attributes .
3. Next when we collect the entire user permissions those should also be stored in database as integer values
because we are considering the count of user activities.
Table-1 Sample data taken while executing the experiment.
FB-user name abhinay.angadi
@gmail.com
vernekar_suraj2496242
@gmail.com
shwethabhat77
@yahoo.com
roopaneginal
@gmail.com
karunagull74
@gmail.com
akshata_angadi@
yahoo.co.in
Login-date & time 16-06-201321:45
19-06-201323:20
19-04-201323:35
19-04-201317:20
20-04-201311:26
20-06-201312:00
Login id 100000200133445 100000545136960 100002264984054 100000179234927 100001493160701 100001007660248
Likes 17 20 147 49 11 28
Statuses 5 3 15 0 0 0
Games 0 0 0 0 0 0
Music 0 0 1 4 0 4
Activities 1 0 0 0 1 0
Friends 391 391 650 500 0 632
Publish 0 0 0 0 2 0
Movies 0 0 0 1 0 1
Posts1 2 14 5 0 0
Events 0 0 0 0 0 0
Photos 0 0 26 7 0 0
Groups 0 0 0 0 1 0
Login
Valid??
True
False
Web Page
Extracts log-in time,
log-out time, and the activities performed by
the user
Data Warehouse
Final Rank Assign
Enter valid
id & pwd
Statistical
Reports
International Journal of Latest Trends in Engineering and Technology (IJLTET)
Special Issue - IDEAS-2013 101 ISSN: 2278-621X
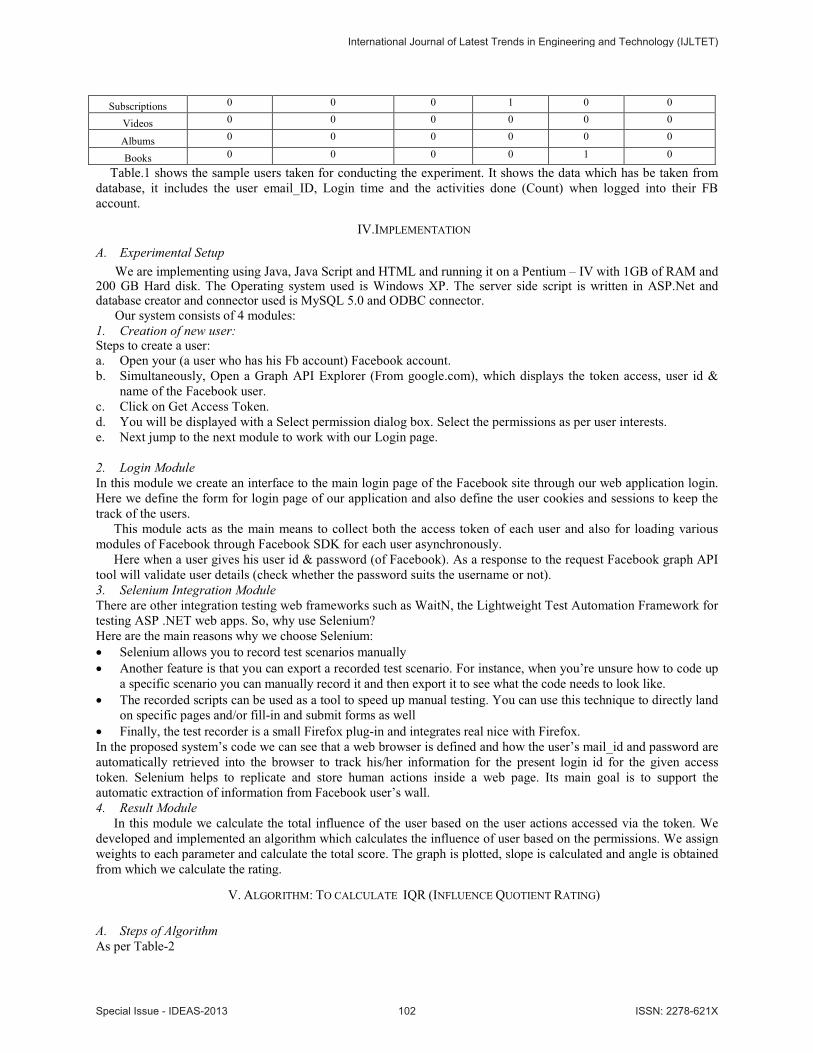
Table.1 shows the sample users taken for conducting the experiment. It shows the data which has be taken from
database, it includes the user email_ID, Login time and the activities done (Count) when logged into their FB
account.
IV.IMPLEMENTATION
A. Experimental Setup
We are implementing using Java, Java Script and HTML and running it on a Pentium – IV with 1GB of RAM and 200 GB Hard disk. The Operating system used is Windows XP. The server side script is written in ASP.Net and database creator and connector used is MySQL 5.0 and ODBC connector.
Our system consists of 4 modules:
1. Creation of new user: Steps to create a user:a. Open your (a user who has his Fb account) Facebook account.
b. Simultaneously, Open a Graph API Explorer (From google.com), which displays the token access, user id &
name of the Facebook user.
c. Click on Get Access Token.
d. You will be displayed with a Select permission dialog box. Select the permissions as per user interests.
e. Next jump to the next module to work with our Login page.
2. Login Module
In this module we create an interface to the main login page of the Facebook site through our web application login.
Here we define the form for login page of our application and also define the user cookies and sessions to keep the
track of the users.
This module acts as the main means to collect both the access token of each user and also for loading various
modules of Facebook through Facebook SDK for each user asynchronously.
Here when a user gives his user id & password (of Facebook). As a response to the request Facebook graph API
tool will validate user details (check whether the password suits the username or not).
3. Selenium Integration Module
There are other integration testing web frameworks such as WaitN, the Lightweight Test Automation Framework for
testing ASP .NET web apps. So, why use Selenium?
Here are the main reasons why we choose Selenium:
Selenium allows you to record test scenarios manually
Another feature is that you can export a recorded test scenario. For instance, when you’re unsure how to code up
a specific scenario you can manually record it and then export it to see what the code needs to look like.
The recorded scripts can be used as a tool to speed up manual testing. You can use this technique to directly land
on specific pages and/or fill-in and submit forms as well
Finally, the test recorder is a small Firefox plug-in and integrates real nice with Firefox.
In the proposed system’s code we can see that a web browser is defined and how the user’s mail_id and password are
automatically retrieved into the browser to track his/her information for the present login id for the given access
token. Selenium helps to replicate and store human actions inside a web page. Its main goal is to support the
automatic extraction of information from Facebook user’s wall.
4. Result Module
In this module we calculate the total influence of the user based on the user actions accessed via the token. We
developed and implemented an algorithm which calculates the influence of user based on the permissions. We assign
weights to each parameter and calculate the total score. The graph is plotted, slope is calculated and angle is obtained
from which we calculate the rating.
V. ALGORITHM: TO CALCULATE IQR (INFLUENCE QUOTIENT RATING)
A. Steps of Algorithm
As per Table-2
Subscriptions 0 0 0 1 0 0
Videos 0 0 0 0 0 0
Albums 0 0 0 0 0 0
Books 0 0 0 0 1 0
International Journal of Latest Trends in Engineering and Technology (IJLTET)
Special Issue - IDEAS-2013 102 ISSN: 2278-621X
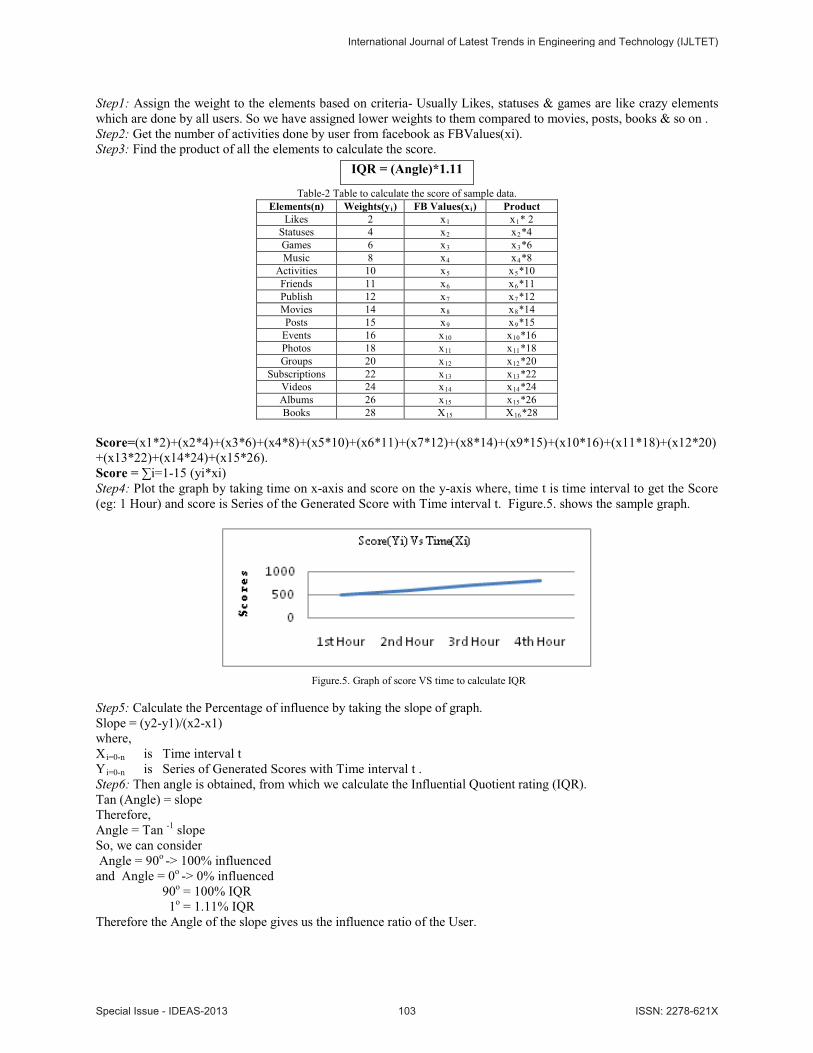
Step1: Assign the weight to the elements based on criteria- Usually Likes, statuses & games are like crazy elements
which are done by all users. So we have assigned lower weights to them compared to movies, posts, books & so on .
Step2: Get the number of activities done by user from facebook as FBValues(xi).
Step3: Find the product of all the elements to calculate the score.
Table-2 Table to calculate the score of sample data.
Elements(n) Weights(y i FB Values(x) i Product)
Likes 2 x x1 1* 2
Statuses 4 x x2 2*4
Games 6 x x3 3*6
Music 8 x x4 4*8
Activities 10 x x5 5*10
Friends 11 x x6 6*11
Publish 12 x x7 7*12
Movies 14 x x8 8*14
Posts 15 x x9 9*15
Events 16 x x10 10*16
Photos 18 x x11 11*18
Groups 20 x x12 12*20
Subscriptions 22 x x13 13*22
Videos 24 x x14 14*24
Albums 26 x x15 15*26
Books 28 X X15 16*28
Score=(x1*2)+(x2*4)+(x3*6)+(x4*8)+(x5*10)+(x6*11)+(x7*12)+(x8*14)+(x9*15)+(x10*16)+(x11*18)+(x12*20)
+(x13*22)+(x14*24)+(x15*26).
Score = !"#-15 (yi*xi)
Step4: Plot the graph by taking time on x-axis and score on the y-axis where, time t is time interval to get the Score
(eg: 1 Hour) and score is Series of the Generated Score with Time interval t. Figure.5. shows the sample graph.
Figure.5. Graph of score VS time to calculate IQR
Step5: Calculate the Percentage of influence by taking the slope of graph.
Slope = (y2-y1)/(x2-x1)
where,
X i=0-n
Y
is Time interval t
i=0-n
Step6: Then angle is obtained, from which we calculate the Influential Quotient rating (IQR).
is Series of Generated Scores with Time interval t .
Tan (Angle) = slope
Therefore,
Angle = Tan -1
So, we can consider
slope
Angle = 90o
and Angle = 0
-> 100% influencedo
90
-> 0% influencedo
1
= 100% IQRo
Therefore the Angle of the slope gives us the influence ratio of the User.
= 1.11% IQR
IQR = (Angle)*1.11
International Journal of Latest Trends in Engineering and Technology (IJLTET)
Special Issue - IDEAS-2013 103 ISSN: 2278-621X

Therefore, (In our experiment we have taken real time user, whose email_id is [email protected],
based on her activities IQR & score is calculated further).
VI.EXPERIMENTAL RESULTS
Figure.6. shows the permissions provided by the Facebook Developers as well as the access permissions given by
the application user. User activities are tracked and are dumped into the database for further calculation. Using an
algorithm different numeric grades are provided for each activity.
Figure.7. shows the calculations for slope and the angle from the values received from user activities. Once the
slope from graph is obtained its angle is calculated in terms of tan.
Figure.6. shows the table containing user permissions, Figure.7. contains scores with interval of 1 hour
facebook values, weights assigned for each element and score
Figure.8 shows the IQR /Percentage of Influence of a single user. We have undergone same steps with few other
users & calculated the scores of each as shown in Table.3.
Figure.8 a): Graph Plotted Score(Y-axis)Vs. Figure.8.b): Calculation of Slope, Angle & IQR
time (X-axis)of a single user
Table.3. shows the scores of sample users based on their activities
SL.No. Email_id Score
1. [email protected] 7054
2. [email protected] 104
[email protected] 4383
International Journal of Latest Trends in Engineering and Technology (IJLTET)
Special Issue - IDEAS-2013 104 ISSN: 2278-621X
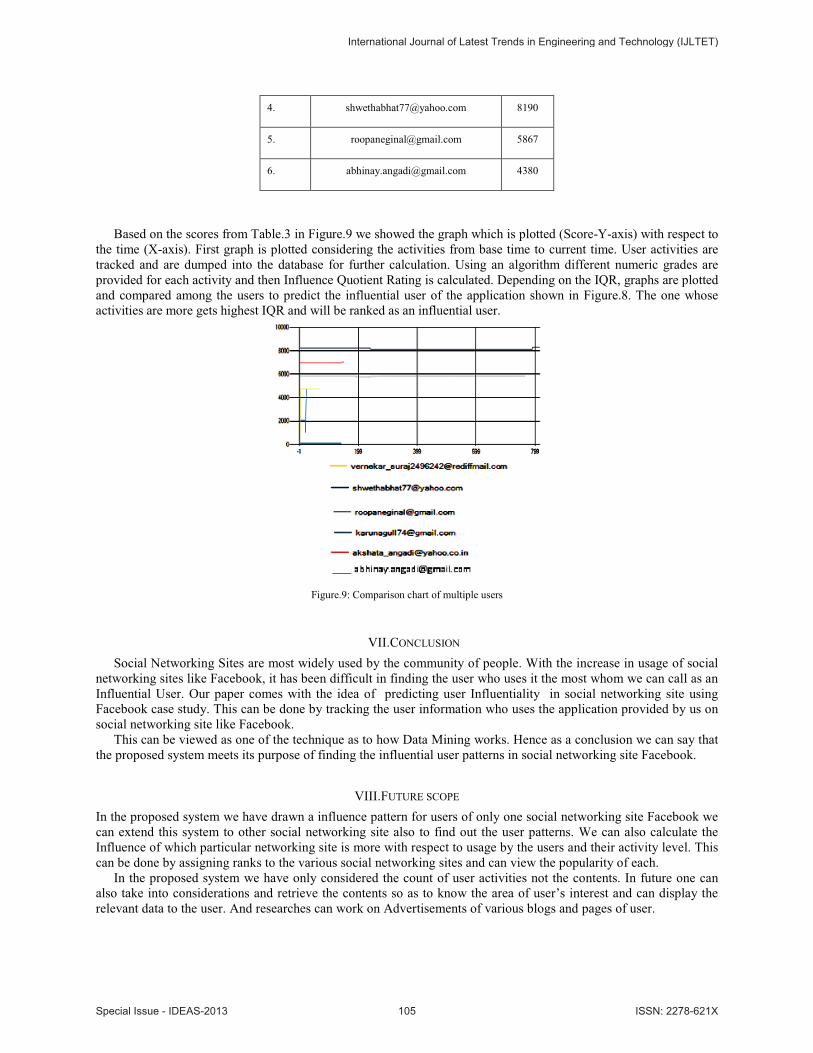
Based on the scores from Table.3 in Figure.9 we showed the graph which is plotted (Score-Y-axis) with respect to
the time (X-axis). First graph is plotted considering the activities from base time to current time. User activities are
tracked and are dumped into the database for further calculation. Using an algorithm different numeric grades are
provided for each activity and then Influence Quotient Rating is calculated. Depending on the IQR, graphs are plotted
and compared among the users to predict the influential user of the application shown in Figure.8. The one whose
activities are more gets highest IQR and will be ranked as an influential user.
Figure.9: Comparison chart of multiple users
VII.CONCLUSION
Social Networking Sites are most widely used by the community of people. With the increase in usage of social
networking sites like Facebook, it has been difficult in finding the user who uses it the most whom we can call as an
Influential User. Our paper comes with the idea of predicting user Influentiality in social networking site using
Facebook case study. This can be done by tracking the user information who uses the application provided by us on
social networking site like Facebook.
This can be viewed as one of the technique as to how Data Mining works. Hence as a conclusion we can say that
the proposed system meets its purpose of finding the influential user patterns in social networking site Facebook.
VIII.FUTURE SCOPE
In the proposed system we have drawn a influence pattern for users of only one social networking site Facebook we
can extend this system to other social networking site also to find out the user patterns. We can also calculate the
Influence of which particular networking site is more with respect to usage by the users and their activity level. This
can be done by assigning ranks to the various social networking sites and can view the popularity of each.
In the proposed system we have only considered the count of user activities not the contents. In future one can
also take into considerations and retrieve the contents so as to know the area of user’s interest and can display the
relevant data to the user. And researches can work on Advertisements of various blogs and pages of user.
4. [email protected] 8190
5. [email protected] 5867
6. [email protected] 4380
International Journal of Latest Trends in Engineering and Technology (IJLTET)
Special Issue - IDEAS-2013 105 ISSN: 2278-621X
ACKNOWLEDGMENT
We are grateful to Namrata, Apurva and Roopa who helped to complete the paper and participated in valuable
discussions while writing the paper.
REFERENCES
[1] M. E. J. Newman and M. Girvan. Finding and evaluating community structure in networks. Physical Review, E69(026113), 2004.
[2] Jiyang Chen, Osmar R. Zaïane, and Randy Goebel. Local community identification in social networks. International Conference on Advances in Social Networks Analysis and Mining (ASONAM), Athens, Greece, 2009.
[3] Jure Leskovec, Jon Kleinberg, and Christos Faloutsos. Graphs over time: densification laws, shrinking diameters and possible explanations. In KDD ’05: Proceedings of the 11th ACM SIGKDD international conference on Knowledge discovery in data mining, pages 177187,2005.
[4] Lars Backstrom, Dan Huttenlocher, Jon Kleinberg, and Xiangyang Lan. Group formation in large social networks: membership, growth, and evolution. In KDD ’06: Proceedings of the 12th ACM SIGKDD International conference on Knowledge discovery and data mining,pages 44-54,2006.
[5] Chayant Tantipathananandh, Tanya Berger-Wolf, and David Kempe. A framework for community identification in dynamic social networks. In KDD ’07: Proceedings of the 13tACM SIGKDD International conference on Knowledge discovery and data mining, pages717–726, 2007.
[6] Sitaram Asur, Srinivasan Parthasarathy, and Duygu Ucar. An event-based framework for characterizing the evolutionary behavior of interaction graphs. In KDD ’07: Proceedings of the 13th ACM SIGKDD international conference on Knowledge discovery and data mining, pages 913–921, 2007.
[7] Tanja Falkowski, Anja Barth, and Myra Spiliopoulou. Studying community dynamics with an incremental graph mining algorithm. In Proceedings of the 14th Americas Conference on Information Systems (AMCIS), 2008.
[8] W.J. Book, Modelling design and control of flexible manipulator arms: A tutorial review, Proc. 29th IEEE Conf. on Decision and Control,San Francisco, CA, 1990, 500-506.
[9] Jiyang Chen, Osmar R. Zaïane, and Randy Goebel. Local community identification in social networks. In International Conference on Advances in Social Networks Analysis and Mining (ASONAM), Athens, Greece, 2009.
[10] M. Cha, H. Haddadi, F. Benevenuto, and K. P. Gummadi. Measuring user in$%&'(&)!')*+!**&,-)./&)0!11!2')32112+&,)34114(56)7')8,2(&&9!':;)of the 4th International Conference on Weblogs and Social Media, 2010.
[11] D. Kempe, J. Kleinberg, and E. Tardos. Maximizing the spread of in$%&'(&)*/,2% gh a social network. In KDD ’03: Proc. of the 9th ACM SIGKDD Int. Conf. on Knowledge discovery and data, pages 137–146. ACM Press, 2003.
[12] Professional ASP.NET 2.0 Special Edition By Bill Evjen, Scott Hanselman, Devin Rader, Farhan Muhammad, Srinivasa Sivakumar, June 2012.
[13] Start Here! Build Windows 8 Apps with HTML5 and JavaScript By Dino Esposito, Francesco Esposito May 2012.
[14] “Data Mining concepts & Technique” by Jiawei Han & Michelini Kamber ,Elsevier Publication,2004.
[15] “Mining the Social Web” by Matthew A. Russell, O’Reilly publication, 2011.
[16] Emilio Ferrara- “Mining and Analysis of Online Social Networks”, February 2012.
[17] Michael Trusov, Anand V. Bodapati, and Randolph E. Bucklin* © 2010, American Marketing Association ISSN: 0022-2437 (print), 1547-7193 (electronic) 643 Journal of Marketing Research Vol. XLVII (August 2010), 643–658.
[18] Manos Papagelis, Vanessa Murdock,Roelof van Zwol “Individual Behavior and Social Influence in Online Social Systems” HT’11, June 6–9, 2011, Eindhoven, The Netherlands. Copyright 2011 ACM 978-1-4503-0256-2/11/06.
International Journal of Latest Trends in Engineering and Technology (IJLTET)
Special Issue - IDEAS-2013 106 ISSN: 2278-621X