CARRIER SELECTION FRAMEWORK 1 · PDF fileCARGO CLAIMS FRAMEWORK Table of Contents Attachments

lable at ScienceDirect
Energy 231 (2021) 120695
Contents lists avai
Energy
journal homepage: www.elsevier .com/locate/energy
Framework for energy storage selection to design the next generationof electrified military vehicles
Edoardo Catenaro a, Denise M. Rizzo b, Simona Onori a, *
a Department of Energy Resource Engineering, Stanford University, 367 Panama St, Stanford, CA, 94305, USAb U.S. Army CCDC Ground Vehicle Systems Center, 6501 E. 11 Mile Road, Warren, MI, 48397, USA
a r t i c l e i n f o
Article history:Received 19 June 2020Received in revised form19 February 2021Accepted 19 April 2021Available online 6 May 2021
Keywords:Lithium-ion batterySupercapacitorEnhanced-ragone plotMilitary ground vehiclesEnergy storage selection
* Corresponding author.E-mail addresses: [email protected] (E. Cat
mail.mil (D.M. Rizzo), [email protected] (S. Onori).
https://doi.org/10.1016/j.energy.2021.1206950360-5442/© 2021 Elsevier Ltd. All rights reserved.
a b s t r a c t
In this paper, a methodology is proposed that aims at selecting the most suitable energy storage system(ESS) for a targeted application. Specifically, the focus is on electrified military vehicles for the wide rangeof load requirements, driving missions and operating conditions call for such a cohesive framework. Themethod uses the Enhanced-Ragone plot (ERp) as a guiding tool to map the performance of differentlithium-ion batteries, as a function of C-rate and temperature, and supercapacitors, on the specific powerand specific energy log-log plane. A frequency-based segmentation strategy is employed to assign therequested power to the powertrain actuators. Both full-electric battery-powered and hybrid electricvehicle (including an internal combustion engine, battery and supercapacitors) configurations areconsidered. Using the ERp, ESSs that are able to match the C-rate corresponding to the power-to-energyratio calculated from the load are selected. Moreover, weight, volume, number of cells and pack energy ofthe selected ESSs are also returned from the design framework. The algorithm is tested over three vehiclepowertrains which strongly differ in load requirements - Tesla Model S, Tesla Semi truck and high-mobility multipurpose wheeled vehicle.
© 2021 Elsevier Ltd. All rights reserved.
1. Introduction
Advancements in energy storage systems (ESSs), such aslithium-ion batteries (LIBs), are enabling the wide spread of elec-trified vehicles on the road [1]. The deployment of electric vehicles(EVs) and hybrid electric vehicles (HEVs) has seen a significant riseover the past decade [2].
In military applications, hybridization and/or electrification ofthe powertrain can provide increased tactical capability of militaryvehicles by increasing the available on-board power, along withreducing the battlefield fuel costs [3]. Past data and future pro-jections point out the constantly increasing battlefield fuel cost thatcan be as high as 100$=L due to higher cost of the power propulsionsystems, new on-board monitoring equipment and large fuel con-voys. The adoption of electrified drivetrains would result in theoptimization of fuel consumption based on the optimal operationof the engine and ESS along with benefits derived from brake en-ergy recovery. Furthermore, during the electric-only mode, noise
enaro), denise.m.rizzo2.civ@
and thermal signatures can be significantly reduced [3]. Finally,reducing reliance on fuel would limit the transport of fuel fromrefinery sites to the locations where troops operate, thus lesseninghazardous exposure to enemy ambushes which could cost humanlives [4].
Electrification of the military vehicle fleet calls for a designstrategy geared towards the optimal sizing of powertrain compo-nents while accounting for diverse load requirements, driving cyclemissions, operating and geographical conditions.
Several works have addressed the optimal design of ESS (i.e.battery) in standalone and hybrid configuration - i.e. combinedwith supercapacitors (SCs)- for vehicle applications ranging fromlight-duty to heavy-duty trucks. Proposed approaches can beclassified into sequential, alternating and simultaneous methods.Sequential strategies are also referred to as a design-first-then-control methodologies [5] where the ESS is designed first and theenergy management problem is solved afterwards. Alternatingstrategies do not consider themutual dependence between ESS andenergy management strategy (EMS) design and they use an itera-tive process that optimizes ESS for a defined EMS, and then opti-mize the EMS for a given ESS [5].
Finally, the simultaneous methods acknowledge the strong

Acronyms and Symbols
ARTS All-purpose remote transport systemBMS Battery management systemCV Conventional vehicleEMS Energy management systemERp Enhanced-Ragone plotESS Energy storage systemEV Electric vehicleFMTV Family medium tactical vehicleHEMTT Heavy expanded mobility tactical truckHESS Hybrid energy storage systemHEV Hybrid-electric vehicleHMMWV High mobility multipurpose wheeled vehicle
ICE Internal combustion engineLFP Iron-phosphateLIB Lithium-ion batteriesM-ATV Mine-resistant ambush protected all-terrain vehicleMV Military vehicleNCA Nickel-cobalt-aluminum-oxideNMC Nickel-manganese-cobalt-oxideP=E Power-to-energyRp Ragone plotSC SupercapacitorTMS Tesla Model STST Tesla Semi truckTUGV Tactical unmanned ground vehicle
E. Catenaro, D.M. Rizzo and S. Onori Energy 231 (2021) 120695
coupling between the ESS design and EMS optimization. Examplesare found in Refs. [6,7] for the military series-hybrid electric truckequipped with battery pack only and battery pack and SCs,respectively.
In [8], the sizing of the powertrain components for a Plug-inSeries-HEV battery-powered vehicle is optimized using convexoptimization along with cost considerations. In Refs. [9,10] a series-parallel vehicle and plug-in series-HEV, respectively, equippedwiththree different storage systems, namely battery pack, SC pack andthe combination of the two, were optimized using convexoptimization.
Ragone plot (Rp) [11] has been exploited as a tool for the optimalselection of storage devices. In Ref. [12], the energy storagecomponent, in the form of standalone battery, SC or combination ofthe two, is optimized for a mid-size fuel cell SUV. In Ref. [13], au-thors outlined an optimization routine, based on Rp, to choosebetween a lead-acid battery and SC. Rp is also used to select the ESSin awind power farm [14]. In Ref. [15], Rp is used for storage systemoptimization based on technical and economic information.
The above studies propose an ad-hoc design solution based onan a-priori ESS or hybrid ESS (HESS) configuration withoutaddressing the scalability aspect of the methodology. When theapplication under study is characterized by a wide range of loadrequirements or diverse missions or operating conditions, such anapproach fails to provide a proper solution. This is the case ofmilitary vehicle (MV) applications. The strong variation in loadrequirements and functions experienced by MVs makes the energystorage selection a challenging task [3]. Moreover, the wide span of
Fig. 1. Spectrum of available vehicle technologies and corresponding P= E ratiorequired to the ESS. The range of values is from battery specifications used in EV (i.e.Tesla Model S, Chevrolet Bolt, BMW i3 [16]), plug-in HEV (i.e. Audi A3, Chevrolet Volt,BMW i8 [16]), full hybrid (i.e. Toyota Prius3, Ford Fusion [17]), mild hybrid (i.e. Audi A8[18], Chevrolet Malibu [19], BMW ED [17]) and micro hybrid (i.e. Citroen C3, Smart[17]).
2
available electrified technologies (Fig. 1) shows that many are theways to electrify the powertrain - frommicro hybrid to full electric -and therefore the ESS. For instance, LIBs are the best storagetechnology for a plug-in hybrid vehicle whereas a lead-acid batteryis the way to go for a micro hybrid [16]. Moreover, not only do MVsvary in weight, ranging from few kilograms up to few tons, asshown in Fig. 2, but they also experience very diverse environ-mental conditions/loads in terms of duty cycles, transient opera-tion, road grade and ground unevenness.
The research presented in this paper aims to develop a scalablemethodology to match vehicle load characteristics/requirementswith the most suitable ESS e either in the form of standalonetechnology or hybrid configuration (for example, using LIBstogether with SCs) - for improved performance across usage.
The Enhanced-Ragone plot (ERp), developed in Ref. [27], displaysthe performance of a set of LIBs in terms of their specific energy andspecific power and as a function of C-rate and temP=Eperature ofoperation, across several cell samples. The time taken by the deviceto be discharged, from a fully charged state, is learned from the ERpand is proportional to the power to energy (P=E) ratio of the ESS (inthe log-log plane this corresponds to diagonal lines).
In [27], the ERp is experimentally populated with data from18650 nickel-cobalt-aluminum-oxide (NCA), 21700 nickel-manganese-cobalt-oxide (NMC) and 26650 iron-phosphate (LFP)LIB tested over a wide range of C-rate and various temperatures.Along with LIBs, the ERp also includes the performance of the
Fig. 2. Different classes of MVs by gross weight. From the left (lighter) to the right(heavier): packbot small-class robotics, tactical unmanned ground vehicle (TUGV) [20],all-purpose remote transport system (ARTS) [21], high mobility multipurpose wheeledvehicle (HMMWV) [22], mine-resistant ambush protected all-terrain vehicle (M-ATV)[23], family medium tactical vehicle (FMTV) [24], heavy expanded mobility tacticaltruck (HEMTT) [25] and line haul tractor M9315A5 [26].

E. Catenaro, D.M. Rizzo and S. Onori Energy 231 (2021) 120695
BCAP0350Mx SC [28].In this work, we propose a design framework that employs the ERp
as a basis to match given vehicle load characteristics with the bestsuitable energy storage solution (either in its standalone or hybridconfiguration). The proposed design framework involves a first partwhere the vehicle is analyzed from a power requirementperspective (from the wheel to each actuator in the powertrain)and a second part related to the ESS selection using the ERp.
We consider a hybrid powertrain equipped with an internalcombustion engine (ICE), a battery pack and SCs.
Using a vehicle backward model and starting from a knowndriving cycle (vehicle trace over time) and road grade profile, thepower at the wheel is first calculated and then subjected to afrequency-based segmentation [29]. Low frequencies - computedby filtering the power at the wheel with a low-pass filter - areassigned to the ICE, whereas the remaining power is supplied bybattery and SC. Medium frequencies are assigned to the batterywhereas the high frequency power is taken up by the SC. The P= Eratio of each storage device is then calculated. To meet the powerand energy requirements of the vehicle, the energy storage devicemust handle the C-rate corresponding to the P=E ratio calculatedfrom the load. The matching operation returns a candidate storagetechnology along with the initial sizing - in terms of weight, vol-ume, number of cells and pack energy. We validate the matchingdesign algorithm on three vehicle powertrains, namely, TeslaModel S (TMS), Tesla Semi truck (TST) and high mobility multi-purpose wheeled vehicle (HMMWV). These vehicles, which differin load requirements, have been tested over energy (constant speedover a fixed range) and power (constant acceleration) tests, US06and UDDS driving cycles [30], and the distance dependent gradeHarford military cycle [7].
Themain contributions of this paper are summarized as follows:
� Use of ERp as a design tool coupled with the frequency seg-mentation strategy;
� Match the P=E ratio of the powertrain components with the C-rate of operation of the storage device(s);
� Agnostic-based selection of the most suitable energy storage,along with its weight, volume, energy and number of cells;
� Test the ERp-basedmethodology over three vehicles - ranging inweight and mission - TMS, TST and HMMWV under differentdriving scenarios.
Moreover, a sensitivity analysis of keymodel parameters used inthe matching design framework is presented.
The paper is organized as follows. A summary of the ERp is re-ported in Section 2. In Section 3, the overall design framework isdescribed step-by-step. Section 4 shows the methodology appliedto multiple simulation scenarios across three vehicle powertrains.Section 5 provides a brief description about safety performance.Finally, Section 6 gathers the conclusions of the proposed study.
2. Enhanced-Ragone plot
The experimental design of the ERp conducted in Ref. [27] isbriefly summarized in this section. The LIBs tested to populate theERp are1: 18650 LiNiCoAlO2/graphite [31], 21700LiNiMnCoO2/graphite [32] and 26650 LiFePO4/graphite [33],referred to as NCA, NMC and LFP, respectively. Measurements weretaken over six cell samples for each chemistry. Galvanostaticdischarge experiments were conducted at controlled temperature
1 The nomenclature Cc=Ca refers to the anode, Cc , and cathode, Ca , composition,respectively.
3
of 5+C, 25+C and 35+C starting from fully charged condition, i.e.100% state-of-charge, until the cut-off voltage was reached atdischarge rate x equal to:
- C=20, 1C, 2C, 3C, 5C for NCA and NMC,- C=20, 1C, 2C, 3C, 5C, 10C, 15C, 20C for LFP.
The experimental dataset is available in Ref. [34]. Gravimetricenergy density (or specific energy) and gravimetric power density(or specific power), wb
s ðx; TambÞ and pbs ðx; TambÞ, respectively, andvolumetric energy density (or energy density) and volumetric po-wer density (or power density), wb
dðx; TambÞ and pbdðx; TambÞ,respectively, were calculated and averaged across six cell samplesfor each battery chemistry b, b ¼ fNCA, NMC, LFPg, undergoing to adischarge rate x, and controlled at temperature Tamb. The grav-imentric ERp is shown in Fig. 3a and the volumetric ERp is shown inFig. 3b. The specific energy (specific power) and the energy density(power density) are related through the following relationship
wbs ðx; TambÞ¼
Vcell;B
Mcell;Bwb
dðx; TambÞ; (1)
pbs ðx; TambÞ¼Vcell;B
Mcell;Bpbdðx; TambÞ; (2)
where Vcell;B and Mcell;B are the battery cell nominal volume andweight, respectively.
The C-rate of operation is shown, on both ERps, by diagonallines. In the rest of the paper, the gravimetric ERp, also inclusive ofthe BCAP0350Mx SC [28], is used to develop the ESS selectionstrategy.
3. Energy storage selection methodology
The proposed design framework, depicted in the flow diagramin Fig. 4, first analyzes the load characteristics from the drivingcycles, and then identifies the ESS device(s) through the ERp thatbest matches the vehicle requirements.
3.1. Step 1 - vehicle requirements
Given a specified vehicle application and desired speed profile,_xðtÞ, and road grade, dðtÞ, a backward simulator based on the vehiclelongitudinal dynamics is used [35] to compute the power deman-ded at the wheel, PW , as
PW ¼ _x�Mveh€xþMvehgsinðdÞþMvehgfrcosðdÞþ
12rairAf Cd _x
2�;
(3)
and, by time integration, the respective energy, EW
EW ¼ðtf0
PW dt: (4)
In Eq. (3), Mveh is the vehicle curb weight,2 g is the gravitationaltime constant (9.81m/s2), fr is the rolling friction coefficient(assumed to be constant), rair is the air density (equal to 1 kg/m3),Af is the vehicle frontal area, Cd is the drag coefficient and in Eq. (4),
2 Whole vehicle weight excluding passengers.

Fig. 3. Specific power versus specific energy ERp (a) and power density versus energy density ERp (b) for NCA, NMC and LFP batteries at various reference temperatures anddischarge rates.
E. Catenaro, D.M. Rizzo and S. Onori Energy 231 (2021) 120695
and tf is the time duration of the driving cycle.3 To improve equa-tions readability, time-dependency is omitted.
A frequency-based segmentation method [29] is applied toallocate power at thewheel power, PW , to the powertrain actuators.In particular, low frequency components are assigned to the ICE,medium frequencies to the battery and high frequencies to the SC,according to the power-split block scheme shown in Fig. 5.
Specifically, the low frequency portion of the power signal, PW;l,is computed by filtering the power at the wheel, PW , with a second-order low-pass filter, F1ðsÞ, with cutoff frequency fcut;1
F1ðsÞ¼1
1þ s2pfcut;1
!2: (5)
The “intermediate” power, PW;int - characterized bymedium andhigh frequencies - is supplied by the battery and SC (i.e., HESS).Here, the medium frequency power component, PW ;m, is obtainedby filtering PW;int with a second-order low-pass filter, F2ðsÞ, withcutoff frequency fcut;2
F2ðsÞ¼1
1þ s2pfcut;2
!2: (6)
The PW ;m is assumed to be provided by the battery, whereas thehigh frequency signal, PW;h, by the SC (see, Fig. 5).
The cutoff frequencies fcut;1 and fcut;2 are tunable parametersthat determine the load on each actuator, hence defining theirsizing. The cutoff frequency fcut;1 affects the degree of vehicleelectrification in that an increase of fcut;1 leads to a larger ICE load,and consequently, a decrease of the degree of vehicle electrification
3 The initial time is always assumed equal to 0.
4
whereas a decrease of fcut;1 imposes a higher load on the HESS (i.e.battery (B) þSC) components. Asymptotically, this is summarizedas follows
�if fcut;1/∞0CV ðonly ICEÞif fcut;1/00EV ðB þ SCÞ (7)
where CV indicates “conventional vehicle”.The cutoff frequency,fcut;2, instead deals with the power split between the battery andSC. An increase of fcut;2 yields to an increase of the battery load, withconsequently reduction of SC load.
Table 1 reports possible vehicle configurations based on theasymptotic values of fcut;1 and fcut;2.
The segmented power profiles are then used to characterize thepower and energy of each actuator. The battery-to-wheel power-train efficiency for both EVs and HEVs (series and parallel config-urations) - taking into account mechanical and electrical lossesoccurring in the battery, DC/DC converter, inverter, electric motor,transmission and differential - is approximated to 80% [36]. SCs areconnected to the battery through a semi-active or fully-activeconfiguration which introduces an electrical conversion efficiencythat can be bounded to sufficiently high values [7]. Hence, we as-sume a fixed HESS-to-wheel powertrain efficiency, h. The power tothe battery and the SC, PB and PSC , respectively, are computed asfollows
PB ¼1hPW;m; (8)
PSC ¼1hPW;h: (9)
where positive power corresponds to discharge. For the purpose ofcalculating the P=E ratio during discharge, the amount of energyrequired to each storage device k is obtained as

Fig. 4. Flow diagram describing the design framework composed of 1) Vehicle re-quirements analysis and 2) energy storage characteristics for matching strategy.
Fig. 5. Frequency-based segmentation scheme. The total power at the wheel, PW , issegmented into low, medium and high frequency components, PW ;l , PW ;m and PW ;h ,respectively.
Table 1Possible vehicle configurations - EV, HEV or CV - according to the choice of cutofffrequencies fcut;1 and fcut;2.
fcut;1
0 (0∞) ∞
fcut;2 0 EV (SC) HEV (ICE þ SC) CV(0∞) EV (BþSC) HEV (ICE þ B þ SC) CV∞ EV (B) HEV (ICE þ B) CV
Fig. 6. (a) Demanded battery power profile and (b) respective time histogram for theTMS vehicle tested over the US06 cycle.
E. Catenaro, D.M. Rizzo and S. Onori Energy 231 (2021) 120695
Ek¼ðtf0
Pk dt if Pk � 0; with k ¼ fB; SCg: (10)
Finally, the P=E ratio associated to each storage device k is givenas
ðP=EÞk ¼aP*kEk
with k¼fB; SCg; (11)
where P*k is the maximum discharge power of the storage device k
5
and a is a weigh coefficient, assumed to be the same for the batteryand SC, ranging between 0.5 and 1.
When a ¼ 1, the power requirements for each device corre-spond to their peak value, whereas, when a is modulated to assumevalues less than one, then the lower P=E ratio will limit the designrequirements on the devices.
The upper plot of Fig. 6 shows the battery power profile for theTMS - in the battery alone configuration - over the US06 drivingcycle. The time histogram of the power profile over the total driving

E. Catenaro, D.M. Rizzo and S. Onori Energy 231 (2021) 120695
cycle duration expressed in percentage, is shown in the bottom plotof the same figure. As one can see, the battery power peak, P*B,whose value is 125.6 kW, only occurs for 0:16% of the total cycleduration. If, on one hand, sizing the battery upon the peak powervalue will satisfy the power demand throughout the entire cycleduration, on the other hand, it would lead to an oversized system.
By reducing a by half, the corresponding power requirement is62.8 kW, which covers almost 95% of the total power request overthe cycle duration.
The parameter a and the cutoff frequencies, fcut;1 and fcut;2 arebeing assessed through a sensitivity analysis for different drivingcycles. It is worth to remark that the variation of these three pa-rameters yields to a different sizing of the storage units, yet alwayssatisfying the performance expected by the vehicle, both in termsof delivered power and stored energy.
The P=E ratio, computedwith Eq. (11), has the unit of [1/h] and isexpressed in the ERp log-log plane via the specific energy, ek, andspecific power, pk as
pk ¼ðP=EÞk ek; k¼fB; SCg: (12)
Taking the logarithm of both sides of Eq. (12) and using Eq. (11)one gets
logðpkÞ¼ logðaÞþ log�P*kEk
�þ logðekÞ; k¼fB; SCg: (13)
Thus, the P=E ratio is represented in the ERp diagram with aseries of diagonal lines, whose position in the log-log plane isshifted upward or downward according to the value assigned to a,and the ratio between power and energy requirements.
3.2. Step 2 - energy storage system characteristics
The ERp diagram is used as a tool to match the vehicle re-quirements with the most suitable energy storage device(s). In theERp, the ESS performance is parametrized as a function of C-rate ofdischarge which is the P=E ratio of the storage device. Thus, vehiclerequirements are being translated into required P= E ratios, whichin turn are equivalent to the C-rates at which the device shouldoperate to satisfy such requirements.The matching operation thenconsists in intersecting the characteristic curves of the devices(mapped on the ERp) and the P=E ratio lines from the vehicle andgenerate the point of coordinates (ekpk).
The coordinates of the selected ESS candidates are used tocalculate the required mass4 of the k device as
Mpack;k ¼max
8><>:aP*kpk
;Ekek
9>=>;; k¼fB; SCg: (14)
From the calculated mass of the ESSs, one can also compute thecorresponding occupied volume, Vpack;k, number of cells Npack;k andthe overall energy of the pack, Epack;k.
Specifically,
Vpack;k ¼Mpack;kVcell;k
Mcell;k; k¼fB; SCg; (15)
where Vcell;k is the cell nominal volume and Mcell;k is the cellnominal weight (as given by the manufacturer). From the cell
4 The computed ESS masses and volumes only consider the weight and volume ofthe storage devices and do not include the pack housing and other components ofthe pack.
6
nominal mass, the corresponding number of cells needed in a packis calculated as
Npack;k ¼Mpack;k
Mcell;k; k¼fB; SCg; (16)
where Npack;k is the number of cells for device k.Furthermore, fromthe required mass and given the cell nominal specific energy fromthe manufacturer specifications, ecell;k, the overall energy of devicek, Epack;k, is calculated as
Epack;k ¼Mpack;k ecell;k; k¼fB; SCg: (17)
4. Case studies and simulation results
In this paper, three vehicles are considered (Fig. 7). The first two,manufactured by Tesla, are the TMS and the TST. The TMS has beenon the market since 2012 [37], while the starting of TST productionis planned by the end of 2021 [38]. These two full-electric battery-powered vehicles - whose energy storage size is known (TMS) orclaimed (TST) - are used to test the proposed design framework. Acomparison between the actual TMS battery pack sizing and theone returned by our framework is conducted. The analysis is thenextended to the TST. Lastly, the HMMWV is considered as a test caseto provide ESS design specifications.
Table 2 reports the values used for the vehicle parameters foreach application. The Mveh, Af and Cd for TMS are taken fromRef. [39], and for HMMWV from Ref. [22]. The TST is not on themarket yet and accurate parameter values are not known. Yet, Teslahas claimed the excellent TST aerodynamic feature, in terms of dragcoefficient, compared to other trucks [40] and provides a value of0.36 for Cd. As for the vehicle mass, Mveh, in this paper, we considerthe worst case scenario where the vehicle is in fully loaded con-dition [41]. Finally, for Af we use the same value used for a set ofcommercialized trucks (e.g., Mercedes Actros Air, Volvo FH) [42].Parameters fr and h are assumed to be the same for all vehicles,whose values are taken from Refs. [35,43].
The driving profiles used in this study consist of constant speedtests over a fixed mile range (referred to as Range tests), constantacceleration tests (referred to as Acc test) and realistic driving cycletests. For the Range tests, three constant speeds are used, 20, 45 and70mph, referred to as Range1, Range2 and Range3, respectively, overa fixed mile range of 370 miles for the TMS and HMMWV, and 500miles for the TST. The Acc test is a constant acceleration from sta-tionary condition to 60 mph over 3.7s for TMS and HMMWV, and20s for TST. The range and acceleration performance specificationsused for the TMS and TST are the ones claimed by Tesla [40,44],whereas for the HMMWV we assume the same values as for theTMS.
The US06 and UDDS (Fig. 8) are the realistic driving cycles usedfor the evaluation of the TMS and TST. As suggested in Ref. [16], thestrict energy and power requirements derived from the US06 driveprofile can be used to obtain an upper bound for battery size.Conversely, urban drive cycle - such as UDDS - can be used as alower bound for vehicle requirements and battery sizing [45]. Toprovide an appropriate estimation of the size of the energy storagedevice for the HMMWV used in military application, the Harfordcycle with distance dependent grade characteristics is used in thiswork (Fig. 9), [46]. The driving tests are summarized in Table 3 andthe characteristics, in terms their average speed, maximum speed,average acceleration, and maximum acceleration, average roadgrade and maximum road grade are described in Table 4.
In the following, the case of full-electric battery-powered

Fig. 7. Vehicle considered in this work: (a) Tesla model S long range plus (TMS), (b) Tesla Semi truck (TST) and (c) military high mobility multipurpose wheeled vehicle (HMMWV).
Table 2Vehicle parameter values for each application.
TMS HMMWV TST
Mveh½kg� 2087 5112 36287.39
Af ½m2� 2.34 3.58 9.7
Cd [�] 0.24 0.7 0.36fr [�] 0.012 0.012 0.012h [�] 0.8 0.8 0.8
Fig. 8. US06 (red) and UDDS (blue) driving cycles. (For interpretation of the referencesto colour in this figure legend, the reader is referred to the Web version of this article.)
Fig. 9. Speed and road grade profile of the military Harford driving cycle.
E. Catenaro, D.M. Rizzo and S. Onori Energy 231 (2021) 120695
configuration for the three vehicle applications is discussed. Thehybrid configuration case follows after that.
4.1. Full-electric battery-powered configuration
In the full-electric battery-powered configuration the overalltraction power comes from the battery.5We refer to the required
5 Such a configuration is obtained by properly set the frequency-segmentationalgorithm, as indicated in Table 1.
7
P=E ratio through the notation ðP=EÞB(d,v), where d indicates thedriving profile and v the type of vehicle application. Fig. 10 showsthe ERp diagram with the ðP=EÞBð , ; TMSÞ ratios computed for theTMS vehicle and for all driving scenarios.
The diagonal lines on the ERp provide information on the C-raterequested to the battery, i.e. ðP=EÞB. As shown in Fig. 10, the lessdemanding cycles are, in order, Range1, Range2, and Range3, whosedischarge rates can be handled by the three LIB chemistry. It is easyto show that, in the case of constant speed, the ðP=EÞB only dependson a and the duration of the cycle and not on other vehicle pa-rameters. As the severity of the driving scenarios increases, theðP=EÞB diagonal lines move upwards. All chemistry can still satisfythe specific energy and power requirements imposed by the cycles.In particular, the rates of discharge for UDDS and US06 are of60min and 36min, respectively.
Driving scenarios such as the Harford driving cycle and Acc testshow the limitations of NMC battery to operate at such high C-rates,given the more demanding ðP=EÞB requirements. The rate ofdischarge for the Harford and Acc test is in the order of 4 and 3min,respectively. NCA can handle these rates of discharge at the price ofa significant decrease of specific energy. From Fig. 3a one cancalculate that the specific energy of NCA cells decreases has the C-rate goes from C/20 to 5C. In particular, there is a drop in specificenergy from C/20 (256.6 ½Wh=kg�) to 5C (18.2 ½Wh=kg�) of about 90%at 25 �C. Conversely, LFP can be discharged under these high C-rateswithout showing a significant reduction in the retained specificenergy. Under Acc test, NCA cells can only provide two-thirds ofspecific energy and specific power when compared to the LFPcells.A significant cell surface temperature increase occurs whenthe cells sustain higher C-rate cycles. As observed in Ref. [27], LFPcells have higher temperature robustness across all C-rates, asopposed to NCA and NMC, which, on the other hand, have an in-crease of internal heat loss proportional to the C-rate at which theyare operated. A possible way to alleviate the electrical and thethermal stresses on the batteries when operated at high C-rate is toresort to HESS, where the SCs can handle the high peaks of current.
In the analysis that follows, we compute the overall mass,Fig. 11a, and energy, Fig. 11b, of the battery pack required to satisfydifferent load requirements. We compare the NCA and LFP batteriesover Range2, UDDS, US06, Harford and Acc tests for a ¼ 1. As avaries between 0.5 and 1, variations in the calculated mass andenergy are also provided. Strong dependency of battery sizing withrespect to vehicle application clearly emerges. The increase invehicle weight - from TMS to TST - is reflected on greater mass andenergy requirements to the battery pack, independently of theselected driving scenario and energy storage type. Moreover, as theP=E ratio increases - going from Range2 to Acc test - battery sizingturns out to be more sensitive to variation of a.
Fig. 11a shows that to minimize the required pack weight
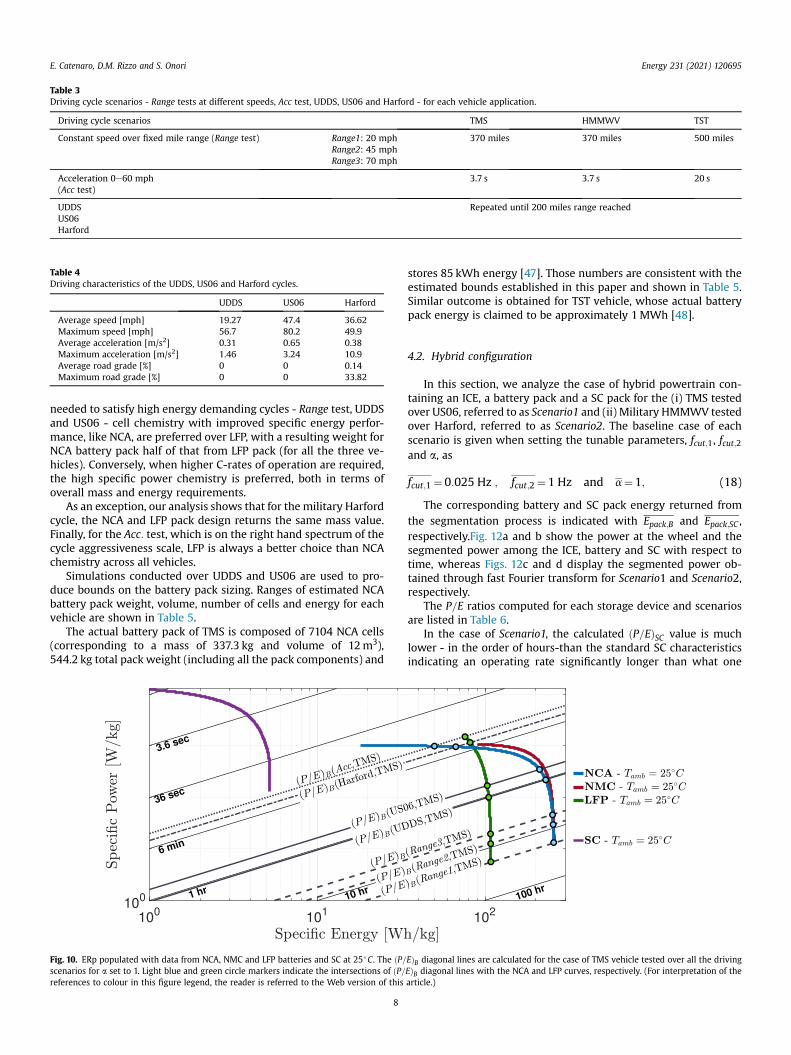
Table 3Driving cycle scenarios - Range tests at different speeds, Acc test, UDDS, US06 and Harford - for each vehicle application.
Driving cycle scenarios TMS HMMWV TST
Constant speed over fixed mile range (Range test) Range1: 20 mphRange2: 45 mphRange3: 70 mph
370 miles 370 miles 500 miles
Acceleration 0e60 mph(Acc test)
3.7 s 3.7 s 20 s
UDDSUS06Harford
Repeated until 200 miles range reached
Table 4Driving characteristics of the UDDS, US06 and Harford cycles.
UDDS US06 Harford
Average speed [mph] 19.27 47.4 36.62Maximum speed [mph] 56.7 80.2 49.9Average acceleration [m/s2] 0.31 0.65 0.38Maximum acceleration [m/s2] 1.46 3.24 10.9Average road grade [%] 0 0 0.14Maximum road grade [%] 0 0 33.82
E. Catenaro, D.M. Rizzo and S. Onori Energy 231 (2021) 120695
needed to satisfy high energy demanding cycles - Range test, UDDSand US06 - cell chemistry with improved specific energy perfor-mance, like NCA, are preferred over LFP, with a resulting weight forNCA battery pack half of that from LFP pack (for all the three ve-hicles). Conversely, when higher C-rates of operation are required,the high specific power chemistry is preferred, both in terms ofoverall mass and energy requirements.
As an exception, our analysis shows that for the military Harfordcycle, the NCA and LFP pack design returns the same mass value.Finally, for the Acc: test, which is on the right hand spectrum of thecycle aggressiveness scale, LFP is always a better choice than NCAchemistry across all vehicles.
Simulations conducted over UDDS and US06 are used to pro-duce bounds on the battery pack sizing. Ranges of estimated NCAbattery pack weight, volume, number of cells and energy for eachvehicle are shown in Table 5.
The actual battery pack of TMS is composed of 7104 NCA cells(corresponding to a mass of 337.3 kg and volume of 12m3),544.2 kg total pack weight (including all the pack components) and
Fig. 10. ERp populated with data from NCA, NMC and LFP batteries and SC at 25+C. The ðP=scenarios for a set to 1. Light blue and green circle markers indicate the intersections of ðP=references to colour in this figure legend, the reader is referred to the Web version of this
8
stores 85 kWh energy [47]. Those numbers are consistent with theestimated bounds established in this paper and shown in Table 5.Similar outcome is obtained for TST vehicle, whose actual batterypack energy is claimed to be approximately 1MWh [48].
4.2. Hybrid configuration
In this section, we analyze the case of hybrid powertrain con-taining an ICE, a battery pack and a SC pack for the (i) TMS testedover US06, referred to as Scenario1 and (ii) Military HMMWV testedover Harford, referred to as Scenario2. The baseline case of eachscenario is given when setting the tunable parameters, fcut;1, fcut;2and a, as
fcut;1 ¼0:025 Hz ; fcut;2 ¼1 Hz and a¼1; (18)
The corresponding battery and SC pack energy returned fromthe segmentation process is indicated with Epack;B and Epack;SC ,respectively.Fig. 12a and b show the power at the wheel and thesegmented power among the ICE, battery and SC with respect totime, whereas Figs. 12c and d display the segmented power ob-tained through fast Fourier transform for Scenario1 and Scenario2,respectively.
The P=E ratios computed for each storage device and scenariosare listed in Table 6.
In the case of Scenario1, the calculated ðP=EÞSC value is muchlower - in the order of hours-than the standard SC characteristicsindicating an operating rate significantly longer than what one
EÞB diagonal lines are calculated for the case of TMS vehicle tested over all the drivingEÞB diagonal lines with the NCA and LFP curves, respectively. (For interpretation of thearticle.)

Fig. 11. Comparison between NCA and LFP battery pack sizing - in terms of (a) overall weight and (b) energy - for all vehicle applications tested over Range2, UDDS, US06, Harfordand Acc driving scenarios. Each bar is obtained for a ¼ 1 and the variation of mass and energy as a varies from 0.5 to 1 is described by the black error bar. For ease of graphicalrepresentation, the results related to the Harford driving scenario performed with TST are not shown but only summarized here for a ¼ 1: 13:32,103 kg, 3:39, 103 kWh when usingNCA, and 12:89,103 kg and 2:24,103 kWh when using LFP chemistry instead.
Table 5Range of estimated battery pack weight and volume (when no wiring, sensors and external case are considered), number of cells and energy for each vehicle application usingNCA. The lower bounds are computed by running the UDDS cycle for a ¼ 0:5 and the upper bounds are calculated from the US06 for a ¼ 1.
Vehicle Weight [kg] Volume [m3] Number of cells [�] Energy [kWh]
TMS 273.4e406.4 9.7 , 10�3 - 14.5 , 10�3 5756e8554 69.3e103.2HMMWV 703.6e1122 24.9 , 10�3 - 39.9 , 10�3 14812e23615 178.6e284.8TST 4014e5596 155.2 , 10�3 - 211.6 , 10�3 84505e117810 1019e1421
E. Catenaro, D.M. Rizzo and S. Onori Energy 231 (2021) 120695
would typically expect from a SC (in the order of seconds to mi-nutes). Such a low ðP=EÞSC ratio value is related to the simulationscenario. In facts, the peaks of power required at the wheel alwaysoccur at low or medium frequencies (up to 0.08 Hz).
On the other hand, under Scenario2 there is a noticeable dif-ference between ðP=EÞB and ðP=EÞSC . The high frequency contentfound in Scenario2 is due to the heavy vehicle weight (almost twoand a half times heavier than TMS) and the aggressive accelerationson a non-negligible road grade cycle. The high harmonics found inthe power spectrummake the SC the perfect device tomatch such aðP=EÞSC . In the ERp of Fig.13a and b, we include a sensitivity analysisof the P=E ratio for the battery and SC with respect to the cutofffrequencies, fcut;1 and fcut;2, under Scenario1 and Scenario2. TheðP=EÞB and ðP=EÞSC are varied from their baseline values - the yellowand light blue solid diagonal lines, respectively - upon changes tothe segmentation cutoff frequencies between the values of 5, 10�7
Hz and 5,10�1 Hz for fcut;1, and 5,10�3 and 5 Hz for fcut;2.
9
As shown in Fig. 13a, the variation in the cutoff frequencies stillshow that the ðP=EÞSC from Scenario1 is inconsistent with SCcharacteristics. For Scenario2, the values of ðP=EÞB and ðP=EÞSC ob-tained from the sensitivities analysis (Fig. 13b) show that NCA andSC characteristics can always match such requirements.
For Scenario1, the low demanded ðP=EÞB ratio calls for a LIBsystemwith high specific energy, such as NMC, Fig. 13awhich holdsa minimum weight battery pack. However, to compare the designresults between the hybrid and the full-electric configuration pre-sented in the previous section, we consider a battery pack made ofNCA cells. Fig. 14a shows the NCA battery pack energy as a functionof the cutoff frequency fcut;1, for values of a ranging between 0.5 and1. As described in Table 1, the variation of fcut;1 has an impact on thedegree of vehicle electrification. Reducing fcut;1 yields to a largerenergy pack, whereas for larger fcut;1 the vehicle “approaches” to aCV configuration. Moreover, a low a corresponds to small packenergy, resulting in up to 13.5% reduction of the pack energy with

Fig. 12. Power load profile, PW , and its segmentation in low, PW;l , medium, PW;m , and high, PW ;h , frequency components corresponding to ICE, battery and SC, for Scenario1 (a) andScenario2 (b), and the corresponding frequency-domain components (c) and (d), respectively.
Table 6ðP=EÞB and ðP=EÞSC computed for the battery and SC in each scenarios in the hybridpowertrain case.
Scenario1 Scenario2
US06 TMS Harford, HMMWV
ðP=EÞB [1/h] 2.86 17.43ðP=EÞSC [1/h] 2.63 54.21
Fig. 13. ERp showing the variation of ðP=EÞB as function of fcut;1 and fcut;2, indicated with a reto depict the variation of ðP=EÞSC as function of fcut;1 and fcut;2, respectively, for Scenario2. (Fothe Web version of this article.)
E. Catenaro, D.M. Rizzo and S. Onori Energy 231 (2021) 120695
10
respect to the baseline case when a ¼ 0:5. For Scenario 2, the sizingof both battery and SC is addressed. Fig. 14b shows the requiredbattery and SC pack energy as a function of the cutoff frequencyfcut;1, for a between 0.5 and 1 while fcut;2 is set to its baseline value.Differently from Scenario1, the P=E ratio is much higher making theEpack;B strongly dependent on a at low frequencies (up to 35.6%reduction compared to the baseline value). However, such a
d and orange error bars, respectively, for Scenario1. Blue and purple error bars are usedr interpretation of the references to colour in this figure legend, the reader is referred to

Fig. 14. (a) Scenario1: battery pack energy, Epack;B , as a function of the cutoff frequencyfcut;1. The square gray marker - at fcut;1 ¼ 0 - corresponds to the battery size in the EVconfiguration. Scenario2: battery and SC pack energy, Epack;B and Epack;SC , as a functionof the cutoff frequency fcut;1 (b) and fcut;2 (c). Results are showed for a ranging from 0.5to 1. The battery and SC pack sizes, Epack;B and Epack;SC highlighted with circle yellowmarkers.are given for the baseline conditions - fcut;1 ¼ fcut;1, fcut;2 ¼ fcut;2 and a ¼ a.(For interpretation of the references to colour in this figure legend, the reader isreferred to the Web version of this article.)
6 When fcut;2 tends to zero the storage system is composed by the SC pack in
E. Catenaro, D.M. Rizzo and S. Onori Energy 231 (2021) 120695
dependency is attenuated at higher fcut;1 values. The size of SC isfound to be weakly dependent on fcut;1 (Epack;SC stays boundedbetween 9.01 and 9.57 kWh) and a (the variation of Epack;SC withrespect to a never exceeds 6.1%, for all fcut;1 values).
Fig. 14b shows the required battery and SC pack energy as afunction of fcut;2 and a ranging from 0.5 to 1, while fcut;1 is set to itsbaseline value. The larger fcut;2, the larger is the battery. The Epack;Bis more sensitive to a for higher fcut;2 (up to 47.2% variation),conversely, Epack;SC is not sensitive to a as fcut;2 varies (its variation islimited to 6.25%).
One of the main disadvantages of SCs, besides the high cost, is
11
their low volumetric energy. These are the two main factors thatmake them a not-market ready solution at large [49]. In thefollowing analysis, we assess the volume occupied by each devicefor the case of Scenario2. We define the percentage relative volume,h, as the volume of the SC relative to the volume occupied by theHESS
h¼
Vpack;SC
Vpack;B þ Vpack;SC
!,100: (19)
For the baseline case, SCs account for 17.52% of the overall HESSvolume.
We analyze the volume to each device and the relative volume,h, as a function of the cutoff frequency fcut;1, Fig. 15a and c, and fcut;2,Fig. 15b and d. The volume required to each device shows the samedependence on a that was previously established for the pack en-ergy, for both cutoff frequencies. Consequently, the relative percentratio h decreases as a increases (throughout the whole cutoff fre-quency range). From Fig. 15c one can see that the SC volume isincreasing for higher values of fcut;1, making up to 60% of the overallHESS volume for the lowest value of a. From Fig. 15d, strong de-pendency between the SC volume requirement and fcut;2 is found atlow frequency. Low values of fcut;2 lead to an HESS mostly madewith SCs.6 Conversely, by increasing fcut;2 the value of h decreasesup to 10%.
5. Safety considerations
Battery packs are required to meet several automotive technicalrequirements, in addition to satisfy the vehicle power and energydemand [16]. The battery management system (BMS) controls andmonitors the performance (temperature, current, voltage, isolation,etc.) of the battery cells during use to guarantee that the battery isworking within its predetermined safety operating region. Thehousing of the battery pack is properly designed to be robust tomechanical stress. The thermal cooling is specifically designed witha great deal of attention to allow the battery to never experiencehigh temperature of operation which could lead to thermalrunaway. The battery pack geometry, structural design and positionwithin the vehicle are all relevant design parameters when inte-grating the battery pack in the vehicle to ensure safety. Thosedesign and control decisions that will result in a given battery to-pology and a properly crafted BMS are taken and developed oncethe cell chemistry is chosen [16], as done, for example in Ref. [50]for an eBus application. Once the chemistry is selected, the pack isdesign to meet packaging space constraints, and operating andsafety requirements. For the three LIBs employed in this work,classification in terms of their specific energy, specific power,safety, life span and performance, can be provided [51]. Forexample, NCA battery is the less safe among the three. Thus, if onewants to use this chemistry - owing its higher specific energy-particular attention and care needs to be paid to design a robustthermal control management unit around it. This is the case of TeslaModel S, for instance. In our paper, we are proposing a method toassess what chemistry or device (among LIB and SC) is most suit-able for a given applications in terms of energy and power char-acteristics. Then, guaranteeing safety performance as well asensuring longer life span of the selected device need to beaccounted for in a later design stage [52e54].
standalone configuration, as previously indicated in Table 1.

Fig. 15. The required volume of each device and the percent relative volume h are represented as a function of the cutoff frequency fcut;1, (a) and (c) and fcut;2, (b) and (d),respectively, as a ranges from 0.5 to 1. The yellow circle markers indicate the points related to the baseline condition. (For interpretation of the references to colour in this figurelegend, the reader is referred to the Web version of this article.)
E. Catenaro, D.M. Rizzo and S. Onori Energy 231 (2021) 120695
6. Conclusions
The paper presented an integrated design framework intendedfor the selection of the most suitable ESS for a targeted vehicleapplication, which relies upon the ERp to match vehicle re-quirements - based on vehicle characteristics and known drivingcycle - with the best suitable storage technology (either in its batterystandalone configuration or HESS). The framework elaboratesvehicle requirements according to the P=E ratio of each powertrainactuator found using a frequency-based segmentation strategy. Thematching procedure returns not only the chemistry but also theweight, volume, number of cells and energy of the device. We testedthe proposed framework for full-electric battery-powered andhybrid vehicle configurations.We found that to minimize the energystorage sizing requirements needed to satisfy high energy cycles -Range test, UDDS and US06 - cell with higher specific energy, likeNCA, are preferred over LFP. Simulation results show a pack weightreduction of 50% when NCA is used as opposed to LFP, irrespective ofthe vehicle type. Future investigations aim at expanding the ERp toaccount degradation-dependent performance to be used in thestorage design and energy management studies [55,56].
Credit_author_statement
The authors contribute to the work equally.
Declaration of competing interest
The authors declare that they have no known competingfinancial interests or personal relationships that could haveappeared to influence the work reported in this paper.
Acknowledgments
Unclassified. DISTRIBUTION STATEMENT A. Approved for public
12
release; distribution is unlimited.This research was supported bythe Automotive Research Center (ARC) at the University of Michi-gan, under Cooperative Agreement W56HZV-14-2-0001 with theU.S. Army Tank Automotive Research, Development, and Engi-neering Center (TARDEC) in Warren, MI. Disclaimer: Referenceherein to any specific commercial company,product, process, orservice by trade name, trademark, manufacturer, or otherwise doesnot necessarily constitute or imply its endorsement, recommen-dation, or favoring by the United States Government or the Dept. ofthe Army (DoA). The opinions of the authors expressed herein donot necessarily state or reflect those of the United States Govern-ment or the DoD, and shall not be used for advertising or productendorsement purposes.
References
[1] The safer affordable fuel efficient (safe) vehicles final rule for model years2021-2026. United States Environmental Protection Agency; 2020. https://www.epa.gov/newsreleases/us-dot-and-epa-put-safety-and-american-families-first-final-rule-fuel-economy-standards.
[2] Global ev outlook 2019. IEA; 2019. https://www.iea.org/reports/global-ev-outlook-2019.
[3] Khalil G. Challenges of hybrid electric vehicles for military applications. In: 5thIEEE vehicle power and propulsion conference. VPPC ’09; 2009. p. 1e3.
[4] Hodges S. Fire protection in military ground vehicles. SAE InternationalJournal of Transportation Safety 2016;4(2):229e35.
[5] Silvas E, Hofman T, Murgovski N, Etman L, Steinbuch M, Member S. Review ofoptimization strategies for system-level design in hybrid electric vehicles.IEEE Trans Veh Technol 2017;66(1):57e70.
[6] Liu Z, Mamum A, Rizzo D, Onori S. Combined battery design optimization andenergy management of a series hybrid military truck. SAE InternationalJournal of Alternative Powertrains 2019;7(2):155e67.
[7] Mamun A, Liu Z, Rizzo D, Onori S. An integrated design and control optimi-zation framework for hybrid military vehicle using lithium-ion battery andsupercapacitor as energy storage devices. IEEE Transactions on TransportationElectrification 2019;5(1):239e51.
[8] Pourabdollah M, Silvas E, Murgovski N, Steinbuch M, Egardt B. “Optimal sizingof a series PHEV: comparison between convex optimization and particleswarm optimization,” 4th IFAC Workshop on Engine and Powertrain Control.Simulation and Modeling E-COSM 2015 2015;48(15):16e22.
[9] Murgovski N, Hu X, Johannesson L, Egardt B. Combined design and control

E. Catenaro, D.M. Rizzo and S. Onori Energy 231 (2021) 120695
optimization of hybrid vehicles. American Cancer Society; 2015. p. 1e14.[10] Hu X, Murgovski N, Johannesson LM, Egardt B. Comparison of three electro-
chemical energy buffers applied to a hybrid bus powertrain with simulta-neous optimal sizing and energy management. IEEE Trans Intell TransportSyst 2014;15(3):1193e205.
[11] Ragone D. Review of battery systems for electrically powered vehicles, vol. 1.SAE Technical Paper Series; 1968. p. 1e8.
[12] Schupbach R, Balda J, Zolot M, Kramer B. Design methodology of a combinedbattery-ultracapacitor energy storage unit for vehicle power management. In:IEEE 34th annual conference on power electronics specialist, vol. 2003. PESC’03.; 2003. p. 88e93.
[13] Lopes J, Pomilio J, Ferreira P. Optimal sizing of batteries and ultracapacitors forfuel cell electric vehicles. In: IECON proceedings (industrial electronics con-ference), vol. 1; 2011. p. 4603e8.
[14] Zhang Y, Tang X, Qi Z, Liu Z. The Ragone plots guided sizing of hybrid storagesystem for taming the wind power. Int J Electr Power Energy Syst 2015;65:246e53.
[15] Christen T, Ohler C. Optimizing energy storage devices using Ragone plots.J Power Sources 2002;110(1):107e16.
[16] Pistoia G, Liaw B. Behaviour of lithium-ion batteries in electric vehicles: bat-tery Health, performance, safety, and cost, ser. Green energy and technology.Springer International Publishing; 2018.
[17] Peseran A. Choices and requirements of batteries for EVs, HEVs, PHEVs: aCALSTART Webinar. National Renewable Energy Laboratory; 2011. https://www.nrel.gov/docs/fy11osti/51474.pdf.
[18] Hammerschmidt C. “Audi's flagship sedan a8 comes with 48v primary powersystem. eeNews Automotive; 2017. https://www.eenewsautomotive.com/news/audis-flagship-sedan-a8-comes-48v-primary-power-system.
[19] Hev battery testing results 2013 chevrolet malibu eco - vin 7249. Idaho Na-tional Laboratory (INL); 2014. https://www.energy.gov/sites/prod/files/2015/02/f19/batteryMalibu7249.pdf.
[20] Gladiator tactical unmanned ground vehicle. Military Wiki 2020. https://military.wikia.org/wiki/Gladiator_Tactical_Unmanned_Ground_Vehicle.
[21] E. Grabianowski, “How military robots work.” Howstuffworks, https://science.howstuffworks.com/military-robot6.htm.
[22] Filipi Z, Fathy H, Hagena J, Knafl A, Ahlawat R, Liu J, Jung D, Assanis D, Peng H,Stein J. “Engine-in-the-loop testing for evaluating hybrid propulsion conceptsand transient emissions - hmmwv case study. In: SAE 2006 world congressand exhibition. SAE International; 2006.
[23] M-atv. American special ops. https://www.americanspecialops.com/vehicles/m-atv/; 2020.
[24] Oshkosh family of medium tactical vehicles (fmtv). Army Technology; 2010.https://www.army-technology.com/projects/oshkosh-family-of-medium-tactical-vehicles-fmtv/.
[25] Oshkosh hemtt heavy expanded mobility tactical truck.” Army Technology,https://www.army-technology.com/projects/oshkosh-hemtt/.
[26] Line haul tractor. https://asc.army.mil/web/portfolio-item/cs-css-line-haul-tractor/; 2020.
[27] Catenaro E, Rizzo M, Onori S. Experimental analysis and analytical modeling ofenhanced-ragone plot. Appl Energy 2021;291:116473.
[28] “Datasheet - BC Series Ultracapacitors.” Maxwell Technologies, pp. 1e5,https://www.maxwell.com/images/documents/bcseries_ds_1017105.pdf.
[29] Zolot M. Dual-source energy storage-control and performance advantages inadvanced vehicles. In: Proceedings of the 20th electric vehicle symposium;2003. https://www.semanticscholar.org/paper/Dual-Source-Energy-Storage-%E2%80%93-Control-and-Advantages/1dd28a06f37012e29dbcda21b890fad5a73e128e.
[30] Vehicle and Fuel Emissions Testing.” United States Environmental ProtectionAgency, https://www.epa.gov/vehicle-and-fuel-emissions-testing/dynamometer-drive-schedules.
[31] Datasheet - ncr-18650b.” Panasonic, https://www.imrbatteries.com/content/panasonic_ncr18650b-2.pdf.
[32] Product specification rechargeable lithium ion battery model inr21700 m5018.20wh.” LG Chem, https://dnkpower.com/wp-content/uploads/2019/02/LG-INR21700-M50-Datasheet.pdf.
[33] Nanophosphate high power lithium ion cell anr26650m1-b. A123 Systems;
13
2012. https://www.batteryspace.com/prod-specs/6610.pdf.[34] Catenaro E, Onori S. Experimental data of lithium-ion batteries under galva-
nostatic discharge tests at different rates and temperatures of operation. Datain Brief 2021;35:106894.
[35] Onori S, Serrao L, Rizzoni G. Hybrid electric vehicles: energy managementstrategies. Springer; 2016.
[36] Hayes J, Goodarzi G. Electric powertrain: energy systems, power Electronicsand drives for hybrid, electric and fuel cell vehicles. Wiley; 2018.
[37] Lambert F. Tesla Semi to enter first production in second half of 2020. https://electrek.co/2019/12/28/5-things-tesla-bring-market-2020/; 2019.
[38] Lambert F. Tesla Semi: elon Musk says time to bring electric trucks to volumeproduction. https://electrek.co/2020/06/10/elon-musk-tesla-semi-electric-truck-volume-production/; 2020.
[39] Sherman D. Drag Queens: Aerodynamics Compared. Five slippery cars enter awind tunnel; one slinks out a winner. Car and Driver; 2014. https://www.caranddriver.com/features/a15108689/drag-queens-aerodynamics-compared-comparison-test/.
[40] Tesla semi. Tesla; 2020. https://www.tesla.com/semi.[41] Kane M. Tesla semi test Hints at towing Capacity: Video. InsideEVs; 2019.
https://www.insideevs.com/news/356428/tesla-semi-tests-hints-towing-capacity/.
[42] Stenvall H. Driving resistance analysis of long haulage trucks at volvo-testmethods evaluation. Ph.D. dissertation. 2010.
[43] “National research council (u.s. Transportation research board, tires andpassenger vehicle fuel economy. Washington, DC: The National AcademiesPress; 2006.
[44] “Tesla Model S. Tesla. https://www.tesla.com/models; 2020.[45] Tate E, Harpster M, Savagian P. The electrification of the automobile: from
conventional hybrid, to plug-in hybrids, to extended-range electric vehicles.in SAE International Journal of Passenger Cars: Electronic and Electrical Systems2009;1(1):156e66.
[46] Han D, Choi N, Cho S, Yang J, Kim K, Yoo W, Jeon C. Characterization of drivingpatterns and development of a driving cycle in a military area. Transport ResTransport Environ 2012;17(7):519e24.
[47] Pressman M. Understanding tesla's lithium-ion batteries. https://evannex.com/blogs/news/understanding-teslas-lithium-ion-batteries; 2017.
[48] Deveza C. Tesla semi's <2kWh/mile consumption hints at serious batteryimprovements and cost reduction. Tesmanian 2020. https://www.tesmanian.com/blogs/tesmanian-blog/tesla-semi-page-update-hints-at-massive-battery-improvements-and-cost-reduction.
[49] Le F�evre P. The silent power of supercapacitors. Electronica-Azi International2018. https://www.powersystemsdesign.com/articles/the-silent-power-of-supercapacitors/135/13510.
[50] S. Arora and A. Kapoor, Behaviour of lithium-ion batteries in electric vehicles:battery health, performance, safety, and cost. Green energy and technology,02 2018, ch. Mechanical design and packaging of battery packs for electricvehicles, pp. 175e200.
[51] Rudisuela K. Competitive technologies to high nickel li-ion batteries e thepros and cons. Nickel Institute; 2020.
[52] Yw J, GunGoo L, TaeYong K, SangWon B, Cypress L, KyeongBeom C, Hanyong L,Sang C, Kiho K, Jun S. Development of battery pack design for high power li-ion battery pack of hev. World Electric Vehicle Journal 2007;1(94e99):12.
[53] Bhattacharjee A, Mohanty R, Ghosh A. Design of an optimized thermal man-agement system for li-ion batteries under different discharging conditions.Energies 2020;13(21).
[54] Lyu Y, Siddique A, Majid S, Biglarbegian M, Gadsden S, Mahmud S. Electricvehicle battery thermal management system with thermoelectric cooling.Energy Rep 2019;5:822e7.
[55] Todeschini F, Onori S, Rizzoni G. An experimentally validated capacitydegradation model for li-ion batteries in phevs applications. In: 8th IFACsymposium on fault detection, supervision and safety of technical processes2012; 2012.
[56] Di Filippi A, Stockar S, Onori S, Canova M, Guezennec Y. Model-based lifeestimation of li-ion batteries in phevs using large scale vehicle simulations: anintroductory study. In: IEEE vehicle power and propulsion conference; 2010.