FraMCos-9 Workshop in Honor of Titolo presentazione Zdeňek...
51
Titolo presentazione sottotitolo Milano, XX mese 20XX FraMCos-9 Workshop in Honor of Zdeňek P Bažant Cohesive crack analysis of concrete fracture Luigi Cedolin Department of Civil and Environmental Engineering Politecnico di Milano – Milan Italy
Transcript of FraMCos-9 Workshop in Honor of Titolo presentazione Zdeňek...

Titolo presentazione
sottotitolo
Milano, XX mese 20XX
FraMCos-9 Workshop in Honor of Zdeňek P Bažant
Cohesive crack analysis of concrete fracture
Luigi Cedolin
Department of Civil and Environmental Engineering
Politecnico di Milano – Milan Italy

Luigi Cedolin, prof. Civil and Environmental Engineering Dept.
Outline
- Experimental investigations on tensile behavior of
concrete
- Hilerborg’s Fictitious Crack Model
- Bažant’s Crack Band Model
- Identification of the Cohesive Crack softening law from
wide field measurements of tensile deformations
- Relation between Hillerborg’s Cohesive Crack Model and
Bažant’s Size Effect Law

Luigi Cedolin, prof. Civil and Environmental Engineering Dept.
Tensile Tests on Unotched Specimens
The tensile failure of concrete (which initially was interpreted as a sudden rupture of the material) was explained in the sixties, when researchers becameaware of the existence of a softening branch of the load-displacement curve if tests were performed under displacement control.
In the next slides, some meaningful contributions of those years are presented in the format of σ–w relations, proposed by D.A. Hordijk (1989, TU Delft) in his Survey of Deformation-Controlled Tests.

Luigi Cedolin, prof. Civil and Environmental Engineering Dept.
Rusch and Hildorf (1963)
Crack opening displacement w , calculated by subtracting from ∆ the elastic displacement
Total relative displacement ∆ across gage length

Luigi Cedolin, prof. Civil and Environmental Engineering Dept.
Hughes and Chapman (1966)

Luigi Cedolin, prof. Civil and Environmental Engineering Dept.
Evans and Marathe (1968)
Hordijck notes that probably Evans and Marathe were first in recognizingthat: «The large strain values observed in these tests are primarily due to the initiation of a microcrack between the gage length (25-60mm)»

Luigi Cedolin, prof. Civil and Environmental Engineering Dept.
Heilmann Hilsdorf Rusch (1969)
Along the central part of the specimen, a series of electricalextensometers of 60 mm length were attached to the specimen in order to capture the strain localization
In the next slide we will see an example in which the strain localized in Section 1
1 2 3 4Section No

Luigi Cedolin, prof. Civil and Environmental Engineering Dept.
Heilmann Hilsdorf Rusch (1969)
The strain localizes non-uniformly in the 60 mm lengthrepresented by Section 1
Steps of the loadinghystory
Strain distribution in the four Sections during loading historyup to total crack propagation

Luigi Cedolin, prof. Civil and Environmental Engineering Dept.
Tests on Notched Specimens
Tests conducted in the same period on notched specimens wereshowing contradictory results regarding the application of LEFM .
The first results were published by Kaplan (1961), who foundthat the values of Gf for the same concrete were not constant for different types and sizes of specimens.
Walsh (1972) recognized that one cause of this variabilty was the size of the specimens, and showed that for larger specimensthe predictions of linear fracture mechanics were valid, whilesmaller specimens appeared to be notch-insensitive.
Kesler, Naus and Lott (1972), recognized the existence, in the proximity of the notch, of very high local strains attributable to microcracked material, and concluded that linear fracturemechanics was not applicale to concrete.
Numerous other investigations detected a stable crack growth, which indicates the need of nonlinear fracture mechanics.

Luigi Cedolin, prof. Civil and Environmental Engineering Dept.
Hillerborg’s Fictitious Crack Model
The so far elusive experimentalfindings of tensile tests on bothnotched and unnotched specimenswere modeled by Hillerborg, Modeerand Petersson (1976) through the use of a softening relation between the
stress σ transmitted across the crackand the crack opening displacement w. This softening relation represents the progressive rupture of bonds acrossthe crack surfaces, so that the area under the softening curve representsthe fracture enegy Gf .
Three parameters:- Peak stress ft- Critical crack opening wc
- Form of the softeningcurve
σ
wcw
ft

Luigi Cedolin, prof. Civil and Environmental Engineering Dept.
Fracture simulations
Hillerborg, Modeer and Petersson characterized the
energy consumption capacity of the material in the
fracture process zone through the characteristic
length lch = GfE/ft2 .
With reference to a linear-type softening law and
using an inter-element discrete crack representation,
they proved that the model would give appropriate
predictions of the flexural strength of un-notched
concrete beams. The model, denominated «Fictitious
Crack Model» (Modeer, 1979), was also applied to the
simulation of fracture of several types of notched
specimens (Peterson, 1981), showing its predictive
capabilities.

Luigi Cedolin, prof. Civil and Environmental Engineering Dept.
Bažant’s Crack Band Model
In the meantime it had become possible to perform numerical analysis of reinforced concrete members with the Finite Element Method, usingRashid’s (1972) smeared crack concept and a strength criterion for crack propagation. Bažant and Cedolin (1976) proved that this criterion wouldlead to results which depended heavily on the size of the elements in the adopted mesh. They also proved that an energy criterion for smearedcrack propagation was capable of simulating fracture problems with no need for singularity elements. For plain concrete, however, the smeared crack simulation of the resultsof fracture tests was not successful until Bažant (1981) introduced the concept of a crack band of distributed microcracks, characterized by a softening stress-strain relation and by an effective value hc = 2αEGf/ft
2
(α = (1 – E/Et)2) of its width. This model satisfies the theoretical
requirement (Bažant and Belytschko, 1985) that a softening continuum must be accompanied by a localization limiter.

Luigi Cedolin, prof. Civil and Environmental Engineering Dept.
Crack Band Simulations
Bažant and Ho (1983) used the crack band model (which has a much greater flexibilty than the discrete crack approach) to simulate the fracture tests reported in the literature. They fittedthe peak load data assuming Gf, ft and hc as independentmaterial parameters for each concrete, and found that the assumption of a constant value for the ratio crack band width/ aggregate size = 3 would not change the accuracy of the predictions. They also performed a very rigorous statistical analysis of the results, showing that the material model would fit very wellvarious geometries, sizes and loading conditions, and thisfurnished a definitive proof of the predictive capability of the softening relation for the fracture process zone .

Luigi Cedolin, prof. Civil and Environmental Engineering Dept.
Experimental Determination of Deformation Field
The success of a softening relation in explaining the peak-load test results on notched specimens was a further stimulus to find an alternative method for its experimental determination, being the direct tensile test undermined by the non-uniform distribution of strains (and stresses) in the cross-section.
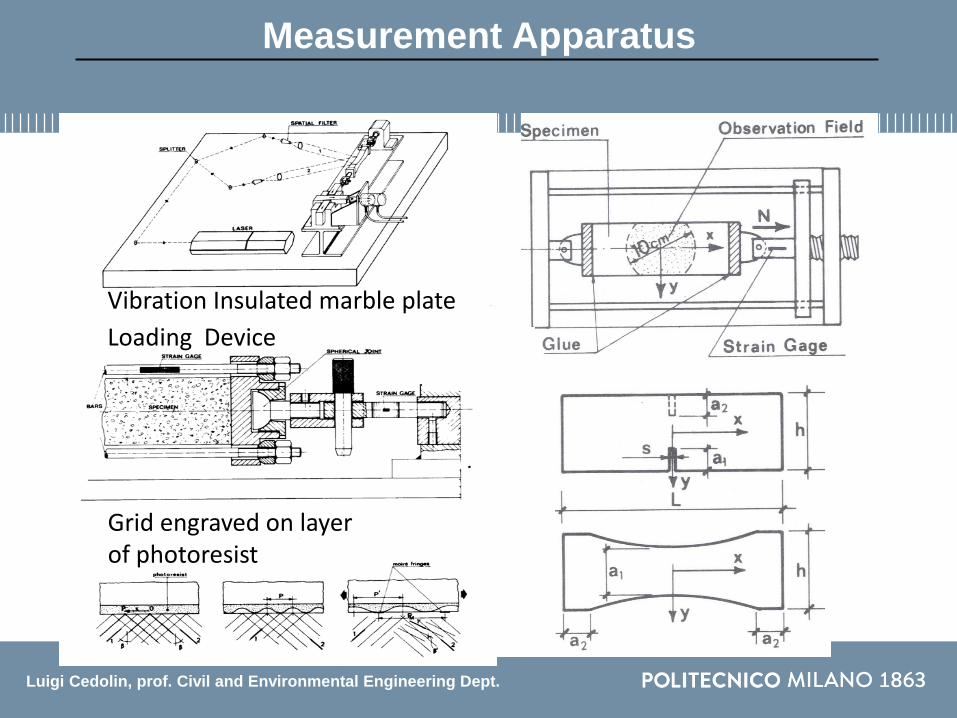
This problem could be overcome (as proposed by Cedolin, Dei Poliand Iori,1981) by measuring the deformation field in the entire region affected by the crack propagation, using laser moiré interferometry. With this technique, a laser beam is split into two rays which by interference generate a virtual reference grid (oriented transversally) of 1000 lines/mm. This grid is also engraved on the specimen’s surface and deforms with it. The interference of the two grids (virtual and real) generates a pattern of moiré fringes, from which it is possible to determine both the longitudinal strain in the microcracked zone and the crack opening profile.
Luigi Cedolin, prof. Civil and Environmental Engineering Dept.
Measurement Apparatus
Insulated marble plate
Loading device
Reference grid recorded onlayer of photoresist
Vibration Insulated marble plate
Loading Device
Grid engraved on layerof photoresist

Luigi Cedolin, prof. Civil and Environmental Engineering Dept.
Tensile Test on Un-notched Specimen
Fringe pattern
Contour of micro-cracked zone
Longitudinal straindistributionsDiscrete crack
Specimen D0-1

Luigi Cedolin, prof. Civil and Environmental Engineering Dept.
Subsequent crack propagation stages
Specimen D0-3
Contour of micro-cracked zone
Discrete crack

Luigi Cedolin, prof. Civil and Environmental Engineering Dept.
Virtual extensometers strain measures
Specimen D0-7
Extensometersdifferentlylocated
Extensometersof differentlength
Luigi Cedolin, prof. Civil and Environmental Engineering Dept.
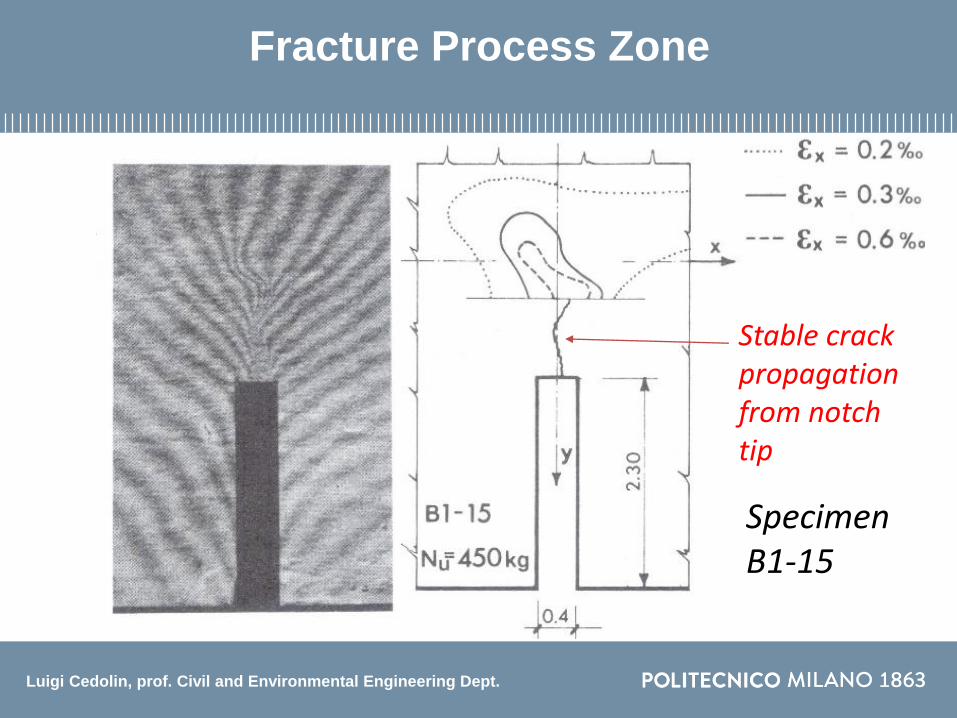
Fracture Process Zone
SpecimenB1-15
Stable crack propagationfrom notchtip

Luigi Cedolin, prof. Civil and Environmental Engineering Dept.
FPZ Propagation
SpecimenB1-14
Crack propagationbefore failure
Image of actualcrack

Luigi Cedolin, prof. Civil and Environmental Engineering Dept.
Deformation Field
Intermediate loading step
Loading step closeto failure
SpecimenD1-20
Straindistribution
Crack opening profile

Luigi Cedolin, prof. Civil and Environmental Engineering Dept.
Measured Deformation History
Specimen D1-20
1 2 3
4 5 6
The unknown stress distributions correponding to the various measuredstrain and crack opening distributions may be identified by imposing the equilibrium with a centered known axial force (rotating loading platens).

Luigi Cedolin, prof. Civil and Environmental Engineering Dept.
Identification of Material Laws
Considering 7 loading steps there were then 14 conditions of equilibrium that were used to identify the 2 unknown parameters( 𝛔 and 𝛈 or η*) of the expressions shown below for the stress-strainand stress-opening displacement relations ( 𝛆 is an empirical constant). An optimization algorithm selected the solid line curves with respect
to the other possible choices.

Luigi Cedolin, prof. Civil and Environmental Engineering Dept.
Stress History
Specimen D1-20
1 2 3
4 5 6
Distribution of stresses corresponding to the identified cohesivecrack material laws.

Luigi Cedolin, prof. Civil and Environmental Engineering Dept.
Fracture Process Zone Analysis
Optimized curves forspecimen D1-20
Strain histories
Displacement history
σ > ft
Dissipated by microcracking
Residualstrain
Irreversiblemicrocrackingdeformation

Luigi Cedolin, prof. Civil and Environmental Engineering Dept.
Components of Dissipated Energy
The energy dissipated along the line a-a during the entire loadinghistory can be separated in two contributions: Gf’ diffused in the microcracked bulk material (for example point B); Gf’’ concentrated on the discrete crack (point A) and real fracture energy.
ε=1.5x10⁻³
Gf’= 3.9 N/m ; Gf’’= 70.4 N/m
Specimen D1-20

Luigi Cedolin, prof. Civil and Environmental Engineering Dept.
Bažant’s Size Effect Law
A way to take into account the presence of a Fracture Process Zone (FPZ) of not negligible size ahead of the crack tip was proposed by Bažant in 1984 by applying LEFM to an “effective”critical crack length a0+cf , being cf a crack extension. Expressing the energy release rate as
00
2
( )1 f
N f f
g' a cg aD
E G E G
The fitting through linear regression of the experimental max
nominal stresses σN of specimens of the same geometry but different sizes leads to the identification of Gf and cf .
he obtained the Size Effect Law (SEL)

Luigi Cedolin, prof. Civil and Environmental Engineering Dept.
Bažant’s Size Effect Law (SEL)
Test results
Gf = Fracture energycf = Crack extension
1
EGf
EGf
00
2
( )1 f
N f f
g' a cg aD
E G E G
0( ) f
f
g' a c
E G

Luigi Cedolin, prof. Civil and Environmental Engineering Dept.
Cohesive Crack Simulations
The softening curve may be well represented by a bilinear law with an initial steep slope followed by a tail with mild inclination.
For specimens of not large size, only the initial part of the softening curve, characterized by the tensile strength ft and the initialfracture energy Gf (area under the initial tangent), determines (Planas, 1992) themaximum nominal stress σN . In this case by considering specimens of the same geometry but different sizesit is possible (Planas, 1997) to interpolate the results of FE simulations through an approximate relation which defines a Cohesive Size Effect Curve (CSEC)
Nt
ch
Df
l
(lch = E Gf / ft2)
2
t
N ch
f D
l

Luigi Cedolin, prof. Civil and Environmental Engineering Dept.
Relation with Bažant’s Size Effect Law
κ0
1
κ1
CSEC
SEL ?
(D/lch)
constant
• Recast SEL utilizing characteristic length
• CSEC asymptote equivalent to SEL?
• κ0 = g0
• κ1 = g’0 (cF/lch );
• If cF is a material property:

Luigi Cedolin, prof. Civil and Environmental Engineering Dept.
The numerical simulations through FE were performed (Cedolin and
Cusatis, 2008) with reference to 3 different specimen geometries, using
zero-thickness interface elements with a linear cohesive crack law.
Geometry : D = 60 to 3840 mm ;
S/D = 4 ; a0 = α0D ; α0 = 0.3
notch width = 3 mm (constant)
Mechanical properties: ν = 0.2
E = 30000 N/mm2 ; ft = 3 N/mm2
Gf = 0.030 N/mm (linear softening)
lch= E Gf / ft2 = 100 mm
Numerical Calculation of Cohesive Size Effect Curve
F.E. Meshes: they were designed with
the aim of giving an accurate
representation of the stress profile in
the FPZ

Luigi Cedolin, prof. Civil and Environmental Engineering Dept.
Nominal stress
σN = 3PmaxS/(2BD2)
Asymptote
Y = AX+C
A = 1.021 ; C = 2.036g(α0) = 1.025 (Tada)
Three Point Bending Specimens
lch
0' f
ch
g cC
l
2
0
38.8mm'
f
f
t
CEGc
g f
Y
X

Luigi Cedolin, prof. Civil and Environmental Engineering Dept.
1
l1 = 100 mm
lFPZ,∞ = 68 mm
ft = 3 N/mm2
l1 = 100 mm
Fracture Process Zone
lch
lch
lch lch
Numerical resultsfor TPB Specimens

Luigi Cedolin, prof. Civil and Environmental Engineering Dept.
The numerical calculations were repeated for single and double-
notched traction specimens of the same dimensions
Results for Different Geometries
(Gf, ft from CSEC)
, 0.70FPZ chl l 0.39f chc l,0.55f FPZc l
For different geometrical
configurations, the values
of cf and lFPZ,∞ are
approximately equal.
lch lch

Luigi Cedolin, prof. Civil and Environmental Engineering Dept.
Experimental investigation
A series of experimental investigations on TPB specimens (Cedolin
and Cusatis, 2008) have been conducted at the Politecnico di
Milano with the purpose of identifying the initial portion of the σ-w
curve, with four different concrete compositions.

Luigi Cedolin, prof. Civil and Environmental Engineering Dept.
Concrete “N”
S
a0
D
B
S/D = 8/3
a0 = 0.3
notch width = 3 mm
D = 120, 180, 240 mm
B = 80 mm12 secmmN012.0 N
For each size, a series of 3 specimens was tested.

Luigi Cedolin, prof. Civil and Environmental Engineering Dept.
SEL and CCL Identification
CSEC CSEC

Luigi Cedolin, prof. Civil and Environmental Engineering Dept.
Comparison SEL vs CCL
2CCLCCL
SELSEL
/39.0(**)
/39.0(*)
tff
fft
fGEc
cGEf
The difference between the identified values of the initial fractureenergy and tensile strength with the two laws (about 6% and 13%) appear to be acceptable. Not so, however, for similar specimenshaving a different concrete composition (Concrete C, next slide).
CSEC

Luigi Cedolin, prof. Civil and Environmental Engineering Dept.
D = 120, 200, and 320 mm
Concrete “C”
The specimen sizes give rise to values of D/lch and of X = (g0D)/(g0’ lch) which are
outside the ranges indicated asvalid for the application of the linear softening law by Cedolinand Cusatis (2008) and Cusatisand Schauffert (2009)
CSEC
CSEC

Luigi Cedolin, prof. Civil and Environmental Engineering Dept.
Typical FEM Mesh
D
a0 = D/8
4 mm
Cohesive interface elements, with size ≤1.0 mm along fracture process zone (FPZ).
More refined F.E. meshes and muchlarger values of D/lch
were used by Cusatisand Schauffert(2009)

Luigi Cedolin, prof. Civil and Environmental Engineering Dept.
Structural Configurations
Center Crack Panel (CCP) Double Edge Notch Panel (DEN)
Three Point Bending (TPB3 and TPB8)Single Edge Notch Panel (SEN)

Luigi Cedolin, prof. Civil and Environmental Engineering Dept.
CSEC: All Configurations, Linear CCL
Small size range: Large size range:
linear correlation coefficients ≈ 1.0;
all κ0 ≈ g0
Plastic limits at D = 0
distinct size effect behavior

Luigi Cedolin, prof. Civil and Environmental Engineering Dept.
Relation with SEL
Divide SEL by g’0 :
Plot data as:
Bažant's SEL, linear softeningcF = 0.44lCH

Luigi Cedolin, prof. Civil and Environmental Engineering Dept.
Relation with SEL
• Additional evidence that the common CSEC asymptote represents SEL:
• length of the FPZ at peak load asymptotically tends to a constant value for all five configurations;
• cohesive stress at the notch tip tends to zero as size increases.
• Vanishing tip stress and constant FPZ length characterize the analytical derivation of Bažant's SEL.

Luigi Cedolin, prof. Civil and Environmental Engineering Dept.
Effective Fracture Process Zone Length
Conclusion: The effective fracture process zone length (EFPZL) relevant to linear softening is independent of structural configuration and has a value of 0.44 ± 0.03.
κ1 g0’ cF / lCH CV
CCP 1.500 3.288 0.46 ±5.64%
DEN 1.725 3.871 0.45 ±6.96%
SEN 2.410 5.603 0.43 ±6.17%
TPB8 1.445 3.046 0.47 ±6.78%
TPB3 1.147 2.735 0.42 ±6.29%

Luigi Cedolin, prof. Civil and Environmental Engineering Dept.
Bilinear Softening
Bilinear CCL often assumed for concrete.
Features chosen to best represent typical concrete:
γ = GF / Gf is typically in the range of 1.5 to
2.5. A value of 2.0 was arbitrarily chosen.
Reasonable value of σint = (f’t / 4) was chosen.
Initial fracture energy, Gf , of the bilinear simulations identical to total fracture energy of the linear softening simulations.
0.25ft’
Cusatis and Schauffert(2009) also analyzed the predictions of bilinear softening

Luigi Cedolin, prof. Civil and Environmental Engineering Dept.
Bilinear Softening
Bažant's SEL for this particular bilinear CCL: Y = X + 2.31
cF = 2.31lch
0.2 0.7
Difference between SEL-Gf and bilinear CSEC for TPB3 is 20% or less.

Luigi Cedolin, prof. Civil and Environmental Engineering Dept.
Softening for Small Specimens
Characterization of this type
of data with a linear
softening law can lead to
overestimation of initial
fracture energy, and possible
underestimation of the
tensile strength.
True softening of concrete
is likely nonlinear, and
may feature a region of
low slope near the peak. ft*, Gf
* : estimates
from data fit
ft’, Gf : true values

Luigi Cedolin, prof. Civil and Environmental Engineering Dept.
Conclusions
The validity of Hillerborg’s Cohesive Crack Model for modeling concrete fracture is well-established from all points of view, experimental, theoretical and numerical. This presentation analyzes the results of previous investigations, providing further confirmation. In particular:- The experimental determination through laser interferometry of the
entire deformation field (crack opening included) along the path of stable crack propagation in tensile test specimens furnishes the capability of identifying both the stress-strain and the strain-opening displacement relations of the Cohesive Crack Model independently of Size Effect Curves.
- The numerical proof that the asymptotes of the CSEC Curves are defined by parameters which can be considered material properties indicates that they must coincide with Bazant’s SEL, removing in this way any possible conflict and, on the contrary, introducing a relationship
between the parameter cf of SEL and the parameter ft of CSEC.

Luigi Cedolin, prof. Civil and Environmental Engineering Dept.
References
The principal references from which many of the figures of this
presentation have been taken are:
D.A. Hordijck, Deformation-controlled uniaxial tensile tests on
concrete, Report 25.5-89-15/VFA, TUDelft, Faculty of Civil
Engineering
L. Cedolin, S. Dei Poli, I. Iori, Tensile behavior of concrete,
ASCE EMJ, Vol. 113, No. 3, March 1987
L. Cedolin, G. Cusatis, Identification of concrete fracture
parameters through size effect experiments, Cement & Concrete
Composites, 2008
G. Cusatis, E.A. Schauffert, Cohesive crack analysis of size
effect, Engineering Fracture Mechanics 76 (2009) 2163-2173

Luigi Cedolin, prof. Civil and Environmental Engineering Dept.
Personal Remark
In following the developments which led to the
understanding of the basic mechanisms involved in
concrete fracture, I had the privilege, working on this topic
with Zdeňek, of sharing the depth of his thoughts and his
passion for scientific truth.
Joining the Framcos Community celebration of his
contributions to the establishment of an entirely new
theoretical field of nonlinear fracture mechanics, I express
my certainty that he will carry on indefinitely on his
endevours. Best wishes, Zdeňek!