Fragmentation, - Loughborough University · Fragmentation, auto-modification ... differential...
31
•
-
Upload
phungthien -
Category
Documents
-
view
238 -
download
0
Transcript of Fragmentation, - Loughborough University · Fragmentation, auto-modification ... differential...

Loughborough UniversityInstitutional Repository
Fragmentation,auto-modification and postionisation proton bounddimer ion formation: the
differential mobilityspectrometry of low
molecular weight alcohols.
This item was submitted to Loughborough University's Institutional Repositoryby the/an author.
Citation: RUSZKIEWICZ, D., THOMAS, C.L.P. and EICEMAN, G.A., 2016.Fragmentation, auto-modification and post ionisation proton bound dimer ionformation: the differential mobility spectrometry of low molecular weight alco-hols. Analyst, 141 (15), pp. 4587-4598.
Additional Information:
• This paper was accepted for publication in the journal An-alyst and the definitive published version is available athttp://dx.doi.org/10.1039/C6AN00435K
Metadata Record: https://dspace.lboro.ac.uk/2134/21600
Version: Accepted for publication
Publisher: c© Royal Society of Chemistry
Rights: This work is made available according to the conditions of the Cre-ative Commons Attribution-NonCommercial-NoDerivatives 4.0 International(CC BY-NC-ND 4.0) licence. Full details of this licence are available at:https://creativecommons.org/licenses/by-nc-nd/4.0/
Please cite the published version.

This is an Accepted Manuscript, which has been through the Royal Society of Chemistry peer review process and has been accepted for publication.
Accepted Manuscripts are published online shortly after acceptance, before technical editing, formatting and proof reading. Using this free service, authors can make their results available to the community, in citable form, before we publish the edited article. We will replace this Accepted Manuscript with the edited and formatted Advance Article as soon as it is available.
You can find more information about Accepted Manuscripts in the Information for Authors.
Please note that technical editing may introduce minor changes to the text and/or graphics, which may alter content. The journal’s standard Terms & Conditions and the Ethical guidelines still apply. In no event shall the Royal Society of Chemistry be held responsible for any errors or omissions in this Accepted Manuscript or any consequences arising from the use of any information it contains.
Accepted Manuscript
Analyst
www.rsc.org/analyst
View Article OnlineView Journal
This article can be cited before page numbers have been issued, to do this please use: D. Ruszkiewicz, C.
L. P. Thomas and G. A. Eiceman, Analyst, 2016, DOI: 10.1039/C6AN00435K.

FRAGMENTATION, AUTO-MODIFICATION AND POST IONISATION PROTON BOUND
DIMER ION FORMATION: THE DIFFERENTIAL MOBILITY SPECTROMETRY OF LOW
MOLECULAR WEIGHT ALCOHOLS
by Ruszkiewicz D.M., Thomas C.L.P. and Eiceman G.A.
Graphical Abstract
Protonated gas-phase alcohols undergo auto-modification, post-ionisation clustering
accompanied by dissociation, fragmentation and dehydration reactions yielding
complicated responses in differential mobility spectrometry. Once characterised such
behaviours enable enhanced selectivity and confidence in alcohol measurement by
differential mobility spectrometry.
Page 1 of 29 Analyst
123456789101112131415161718192021222324252627282930313233343536373839404142434445464748495051525354555657585960
Ana
lyst
Acc
epte
dM
anus
crip
t
Publ
ishe
d on
19
May
201
6. D
ownl
oade
d by
Lou
ghbo
roug
h U
nive
rsity
on
19/0
5/20
16 1
4:56
:31.
View Article OnlineDOI: 10.1039/C6AN00435K

1
FRAGMENTATION, AUTO-MODIFICATION AND POST IONISATION PROTON
BOUND DIMER ION FORMATION: THE DIFFERENTIAL MOBILITY
SPECTROMETRY OF LOW MOLECULAR WEIGHT ALCOHOLS
D.M. Ruszkiewicz, C.L.P. Thomas*, G.A. Eiceman
Centre for Analytical Science, Department of Chemistry
Loughborough University
UK
Wednesday, 18 May 2016
ABSTRACT
The toxicology and societal impacts associated with low molecular weight alcohols frame the requirement for fast diagnostic screens in a wide variety of circumstances. Differential mobility spectrometry (DMS) is currently being used for environmental monitoring of space craft atmospheres and has been proposed for the rapid assessment of patients at accident and emergency receptions.
Three studies investigated hitherto undescribed complexity in the DMS spectra of methanol, ethanol, propan-1-ol and butan-1-ol product ions formed from a 63Ni ionisation source. 54,000 DMS spectra obtained over a concentration range of 0.01 mg.m-3(g) to 1.80 g.m-3(g) revealed the phenomenon of auto-modification of the product ions. This occurred when the neutral vapour concentration exceeded the level required to induce a neutral-ion collision during the low field portion of the dispersion field waveform. Further, post-ionisation cluster-ion formation or protonated monomer/proton bound dimer inter-conversion within the ion-filter was indicated by apparent shifts in the values of the protonated monomer compensation field maximum; indicative of post-ionisation conversion of the protonated monomer to a proton-bound dimer.
APCI-DMS-quadrupole mass spectrometry studies enabled the ion dissociation products from dispersion-field heating to be monitored and product ion fragmentation relationships to be proposed. Methanol was not observed to dissociate, while propan-1-ol and butan-1-ol underwent dissociation reactions consistent with dehydration processes that led ultimately to the generation of what is tentatively assigned as a cyclo-C3H3+ ion (m/z 39) and hydrated protons.
Studies of the interaction of ion filter temperature with dispersion-field heating of product ions isolated dissociation/fragmentation product ions that have not been previously described in DMS. The implications of these combined findings with regard to data sharing and data interpretation were highlighted.
Page 2 of 29Analyst
123456789101112131415161718192021222324252627282930313233343536373839404142434445464748495051525354555657585960
Ana
lyst
Acc
epte
dM
anus
crip
t
Publ
ishe
d on
19
May
201
6. D
ownl
oade
d by
Lou
ghbo
roug
h U
nive
rsity
on
19/0
5/20
16 1
4:56
:31.
View Article OnlineDOI: 10.1039/C6AN00435K

2
INTRODUCTION
Alcohols’ toxicity is a significant problem. Yearly deaths related to alcohols are reported as
15,500 in the UK and 88,000 in the USA [1] with ~2.5% due to acute poisoning [ 2]. The
toxicological thresholds in blood have been reported as 200 mg.dm-3 for methanol, 800
mg.dm-3 for ethanol, and 400 mg.dm-3 for isopropanol. High toxicity, with a risk-of-death,
occurs at blood concentrations of approximately 890 mg.dm-3 for methanol, 3,500 mg. dm-3
for ethanol and 1,500 mg. dm-3 for isopropanol [3].
Methanol is associated with episodic poisoning outbreaks occurring worldwide [4,5,6] from
poorly purified or adulterated ethanol based products. It is the subsequent metabolism to
formic acid which is responsible for most of methanol’s toxic effects in humans, including
acidosis, blindness, damage to the central nervous system and death [4, 7].
The estimated cost in the United Kingdom for the National Health Service from ethanol
misuse is £3.5.109 yr-1 [8]. Such a figure does not account for the wider societal effects
associated with ethanol-dependency [9,10, 11].
Accidental ingestion of isopropanol has been reported for children [12] and deliberate
ingestion by adults, and young-adults in their teenage years, produces intoxication similar to
ethanol [13,14]. The toxicity of isopropanol is lower than methanol, similar to that of
propan-1-ol and higher than that of the ethanol (due to the higher toxicity of the metabolic
product acetone) [15]. Some concern has been expressed for the welfare of personnel in
closed living quarters, such as spacecraft or submarines, from prolonged and continuous
exposure to low concentrations.
Fuel-cell based sensors are commonly associated with the determination of the level of
ethanol in breath for law enforcement. Other approaches have been described for the
analysis of alcohols in air, breath, and include: gas chromatography (GC) [16,17,18]; mass
spectrometry (MS) [19, 20, 21]; ion mobility spectrometry [22]; and, differential ion mobility
spectrometry (DMS) [23]. Of particular interest to this study is the determination of alcohols
by the Air Quality Monitor, a hyphenated and thoroughly integrated GC-DMS instrument,
used on-board the International Space Station [24].
The formation of product ions within a DMS has been described elsewhere [25]. At ambient
temperatures alcohols (R-OH) react through atmospheric pressure chemical ionisation (APCI)
Page 3 of 29 Analyst
123456789101112131415161718192021222324252627282930313233343536373839404142434445464748495051525354555657585960
Ana
lyst
Acc
epte
dM
anus
crip
t
Publ
ishe
d on
19
May
201
6. D
ownl
oade
d by
Lou
ghbo
roug
h U
nive
rsity
on
19/0
5/20
16 1
4:56
:31.
View Article OnlineDOI: 10.1039/C6AN00435K
3
reactions with a hydrated proton reactant ions (H+(H2O)n) to form protonated monomers
clustered with water through a displacement reaction, (1):
(1).
As concentrations of the alcohol (R-OH) increase, additional ion clusters, such as a proton-
bound dimer, are formed per (2):
(2).
Increasing the alcohol concentration to ever higher levels can promote the formation of
alcohol clusters (R-OH)n including proton bound trimers (n=3), tetramers (n=4), and higher,
reaching n=8 in highly enriched atmospheres. Note though that n depends on temperature
[25].
As ion energy, expressed as effective ion temperature (𝑇𝑇𝑒𝑒𝑒𝑒𝑒𝑒), is increased alcohol product
ions decompose, and findings from proton transfer reaction mass spectrometry [26,27]
describe the dehydration of protonated monomers with increasing electric field (𝐸𝐸/𝑁𝑁 )
strength; 𝑇𝑇𝑒𝑒𝑒𝑒𝑒𝑒 was increased, see (3) and (4).
(3).
+ H+(H2O)n (H2O)n-1OHR H+ H2O+OHR
(H2O)n-1OHR H+ H2O+ (H2O)n-2OHR 2H+ +OHR
H
HO
+
HC C
H
H H
H
+C C
H
HH H
H
O+ H
H
+ OHH
C C
H
HH H
H
O+ H
HOHH
(H2O)n-1
C C
H
H H
H
+H
HO
+
HC C
H
H H
H
H+ H2O+
Page 4 of 29Analyst
123456789101112131415161718192021222324252627282930313233343536373839404142434445464748495051525354555657585960
Ana
lyst
Acc
epte
dM
anus
crip
t
Publ
ishe
d on
19
May
201
6. D
ownl
oade
d by
Lou
ghbo
roug
h U
nive
rsity
on
19/0
5/20
16 1
4:56
:31.
View Article OnlineDOI: 10.1039/C6AN00435K

4
As energies are increased (𝑇𝑇𝑒𝑒𝑒𝑒𝑒𝑒), the protonated alkene can fragment further, (4). These
reactions have been observed at sub-ambient pressures with electric-fields of 100 Td; not
unlike the field-strengths encountered with DMS.
In DMS, ions are passed by a transport gas through a channel formed from two parallel
plates, the ion filter. A transverse alternating asymmetric electric field is applied across the
filter and the resultant ion oscillations cause a net displacement in the ion’s trajectory from
the central-axis of the ion filter. This happens when ion mobility coefficients are field
dependent, 𝐾𝐾(𝐸𝐸/𝑁𝑁), as shown in Equation 1 [25]:
𝐾𝐾(𝐸𝐸/𝑁𝑁) = 𝐾𝐾(0)(1 + 𝛼𝛼(𝐸𝐸/𝑁𝑁)). Eqn. 1
Here 𝛼𝛼(𝐸𝐸/𝑁𝑁) is a function with a polynomial fit of even powers which describes the change of
the ion mobility coefficient (𝐾𝐾) with electric field strength (𝐸𝐸) normalized to the number
density (𝑁𝑁) as shown in Equation 2:
𝛼𝛼(𝐸𝐸/𝑁𝑁) = 𝛼𝛼1(𝐸𝐸/𝑁𝑁)2 + 𝛼𝛼2(𝐸𝐸/𝑁𝑁)
4 + 𝛼𝛼3(𝐸𝐸/𝑁𝑁)6 + … Eqn. 2
When the mobility coefficient (𝐾𝐾(𝐸𝐸/𝑁𝑁)) increases disproportionately with increased 𝐸𝐸/𝑁𝑁 or
increased dispersion field (𝐸𝐸𝑑𝑑), the alpha-function is termed positive and this behaviour may
be attributed to several processes, the most significant of which is a cluster-decluster
mechanism induced by the alternating asymmetric dispersion-field. A negative alpha-
function may also be observed when the mobility coefficient decreases disproportionately
with increasing dispersion-field as a result of ion heating through increased collision
frequency and drag forces. The displaced ion trajectories may be restored to a stable path
(4).
(H2O)n-1C5H11O+H2 C5H11
+-H2O
(H2O)n-1
C2H4 + C3H7+ (H2O)n-1
E/N
∆TEff
C2H4 + C3H7+ (H2O)n-1
E/N
∆TEff
C5H11+ (H2O)n-1
Page 5 of 29 Analyst
123456789101112131415161718192021222324252627282930313233343536373839404142434445464748495051525354555657585960
Ana
lyst
Acc
epte
dM
anus
crip
t
Publ
ishe
d on
19
May
201
6. D
ownl
oade
d by
Lou
ghbo
roug
h U
nive
rsity
on
19/0
5/20
16 1
4:56
:31.
View Article OnlineDOI: 10.1039/C6AN00435K

5
at the centre of the ion-filter and passed to a detector by applying a continuous weak dc
electric field; termed the compensation-field.
Alpha-functions can be changed by modifying the transport gas with low molecular weight
polar molecules (modifiers) at concentrations between 0.1% (v/v) to 3% (v/v). Modification
of the transport gas with alcohols and other small polar molecules, including water,
significantly changes the cluster-decluster phenomenon for positive alpha-function species
and results in a displacement of the ion peak on the compensation-field scale. Such
changes in compensation field can lead to improved separation of ion peaks [25, 28].
The DMS spectral responses observed from the wide range of alcohol concentrations that
may be encountered in direct breath monitoring for toxicity may be subject to combination of
“auto-modification” of the transport gas by the alcohol analytes and post-ionisation
dissociation of the protonated molecular ions. In parallel to this interest is the influence of
GC-DMS instrument parameters on the resultant signals observed from samples taken on-
board spacecraft. Consequently, the objective of the current study was to elucidate DMS
responses to alcohols over a range of instrument parameters, with a particular interest in
the influence of the dispersion-field (𝐸𝐸/𝑁𝑁 ) and transport gas temperature at ambient
pressure.
EXPERIMENTAL
Instrumentation
A differential mobility spectrometer (model SVAC-V, Sionex; MA, USA) with a 5.0 MBq foil
of 63Ni ionisation source was operated with 1.18 MHz asymmetric waveform over a
dispersion field (𝐸𝐸𝐶𝐶) range 40 Td to 120 Td; the instrument setting was 10 kV.cm-1 to 30
kV.cm-1. The compensation field could be scanned from -3 Td to 1 Td; - 860 V.cm-1 to + 300
V.cm-1. The electrode-gap in the ion filter was 0.5 mm and the analyser region was 20 mm
long. The instrument was operated using Sionex Expert software, Version 2.01. The
transport-gas (300 cm3.min-1 to 320 cm3.min-1) was purified nitrogen and water
concentration was routinely monitored with a moisture monitor (Series 35 from
Panametrics, UK) and maintained at 25 mg.m-3(g) ± 5 mg.m-3
(g) (34 ppm(v/v) ± 8 ppm
(v/v)). The transport gas was mixed with the eluent from a heated 500 cm3 round bottom
Page 6 of 29Analyst
123456789101112131415161718192021222324252627282930313233343536373839404142434445464748495051525354555657585960
Ana
lyst
Acc
epte
dM
anus
crip
t
Publ
ishe
d on
19
May
201
6. D
ownl
oade
d by
Lou
ghbo
roug
h U
nive
rsity
on
19/0
5/20
16 1
4:56
:31.
View Article OnlineDOI: 10.1039/C6AN00435K

6
exponential flask (7 cm3.min-1 to 19 cm3.min-1), or a permeation source based test
atmosphere generator.
A Shimadzu model 2020 mass spectrometer (Columbia, MD) was interfaced to a DMS
constructed in-house using materials, dimensions, electronic control, and an ion source
similar to the SVAC-V. The inlet for the DMS/MS instrument was comparable to the SVAC-V
DMS. Note that in this experiment the dispersion field was used to induce ion heating and
not separate the ions, and had a sinusoidal waveform. The DMS assembly included two
ceramic plates with thickness of 1 mm, length of 30 mm, and width of 25 mm separated
by a Teflon gasket (0.5 mm x 30 mm x 25 mm) with a 3 mm wide centre channel for gas
and ion flow. These were held between two Teflon plates (4 mm x 30 mm x 25 mm)
and secured under compression by two aluminium plates (5 mm x 30 mm x 25 mm) with
six screws. At each end of this assembly were aluminium end caps (20.5.5 mm x 5 mm
x 25 mm) attached to the aluminium plates with four screws. An 1/8” stainless steel
union (Swagelok Corp., El Paso Valve and Fitting, El Paso, TX) was threaded into one
cap, for inlet flow. A 111 MBq 63Ni foil was fitted into the interior volume of this fitting. In
the other cap, for connection to the mass spectrometer, a stainless 1/8” to 1/16”
reducing union (Swagelok) was threaded and the capillary line from the mass
spectrometer was held by compression in the 1/16” end of the union. This assembly
was insulated using glass fibre insulating sheeting and the temperature was controlled
by conduction from the transfer line, heated using resistive wire.
Chemicals and Reagents
Methanol, ethanol, propan-1-ol, and butan-1-ol were obtained from Fisher Chemicals,
Loughborough, UK; GC and HPLC purity ≥ 99.5%. The alcohols were purified further by
purging with high-purity nitrogen and then analysed by GC-MS, The results of which indicated
a purity ≥ 99.9% with an additional peak identified as chloroform, which was used for
cleaning the syringe, at an abundance of < 0.02% of the respective alcohol peaks. Figure S1
shows an example GC-MS of the purity analysis, and the properties of each alcohol are given
in Supplemental Table S1.
Page 7 of 29 Analyst
123456789101112131415161718192021222324252627282930313233343536373839404142434445464748495051525354555657585960
Ana
lyst
Acc
epte
dM
anus
crip
t
Publ
ishe
d on
19
May
201
6. D
ownl
oade
d by
Lou
ghbo
roug
h U
nive
rsity
on
19/0
5/20
16 1
4:56
:31.
View Article OnlineDOI: 10.1039/C6AN00435K

7
Methods
Effect of Vapour Concentration.
Alcohol test-atmospheres were delivered to the DMS at fixed dispersion-fields over six orders
of magnitude concentration range by injecting 75 μl to 200 µl of a pure alcohol standard
into a heated inlet, with a flow of between 6 cm3.min-1 to 19 cm3.min-1 of purified air passing
into the exponential dilution flask [29, 30, 31]. The exhaust from the exponential dilution
flask was subsequently mixed into the transport gas of the DMS analyser; see above. A
schematic of the experimental arrangement is shown in Supplemental Figure S2.
Differential mobility spectra were continuously recorded by scanning the compensation field
(ca. 1 Hz, see above) for between 12 hr to 15 hr, generating up to 54,000 spectra per
experiment. The experimental conditions were selected to inhibit ion fragmentation while
operating at the highest ion-filter temperature (𝑇𝑇) possible (to reduce adsorption and
hysteresis effects) and the lowest dispersion field (𝐸𝐸𝐷𝐷 ) required to ensure resolution
between the reactant and product ion species. The values chosen were: methanol 𝑇𝑇 = 60°C
and 𝐸𝐸𝐷𝐷= 117.6 Td (29.4 kV.cm-1); ethanol, 𝑇𝑇 = 35°C and 𝐸𝐸𝐷𝐷 = 72 Td (18 kV.cm-1) and, for
propan-1-ol 𝑇𝑇 = 60°C and 𝐸𝐸𝐷𝐷= 88 Td (22 kV.cm-1). Other parameters for the operation of the
DMS analyser are given in Supplemental Table S2. The effective temperature of an ion
(𝑇𝑇𝑒𝑒𝑒𝑒𝑒𝑒) was calculated for each dispersion-field investigated in the study by applying 1.5°C
Td-1 to the ion-filter temperature [32].
Mass Analysis of Ions
The identity of fragment ions produced by dispersion field heating was studied by a DMS/MS
connected to dynamic test atmosphere generator where test-atmospheres were delivered to
the DMS/MS from a 3 dm3 exponential dilution flask at a flow rate of 1 dm3.min-1 following
the injection and mixing of 0.4 µl of a pure alcohol standard into the exponential dilution
flask. The mass spectrometer was scanned continuously from m/z 20 to m/z 400 at 0.5 Hz
over the analytes’ concentration ranges of 0.02 mg.m-3(g) to 100 mg m-3(g).
Studies of Effective Temperature of Ions (𝑻𝑻𝒆𝒆𝒆𝒆𝒆𝒆)
Studies of the influence of ion temperature, (𝑇𝑇𝑒𝑒𝑒𝑒𝑒𝑒) at a constant analyte concentration used
permeation sources to generate test atmospheres. Pure alcohol standards were dispensed
Page 8 of 29Analyst
123456789101112131415161718192021222324252627282930313233343536373839404142434445464748495051525354555657585960
Ana
lyst
Acc
epte
dM
anus
crip
t
Publ
ishe
d on
19
May
201
6. D
ownl
oade
d by
Lou
ghbo
roug
h U
nive
rsity
on
19/0
5/20
16 1
4:56
:31.
View Article OnlineDOI: 10.1039/C6AN00435K
8
into 2.9 cm3 chromatography vials and sealed with either a 0.5 mm or 0.1 mm thick PTFE
membrane. The permeation sources were maintained at 40°C for a period of five weeks and
calibrated gravimetrically. A test atmosphere generator (TAG), using filtered compressed air
as a diluent gas, was constructed to mix constant concentration test atmospheres into the
DMS transport-gas, and replaced the exponential dilution flask in the inlet to the experiment.
A schematic of the experimental arrangement is shown in Supplemental Figure S2. The
concentrations of the analytes ranged from 25 μg.m-3(g) to 1 μg.m-3(g). Data were recorded in
the form of dispersion plots with compensation-field scans (see above) run against a
programmed increase in the dispersion field-strength; across the range 40 Td to 120 Td (10
kV.cm-1 to 30 kV.cm-1), at ion-filter temperatures across the range 45°C to 130˚C.
Further details of data acquisition, experimental parameters, and the permeation sources
are given in the Supplemental Tables S2 and S3.
RESULTS AND DISCUSSION
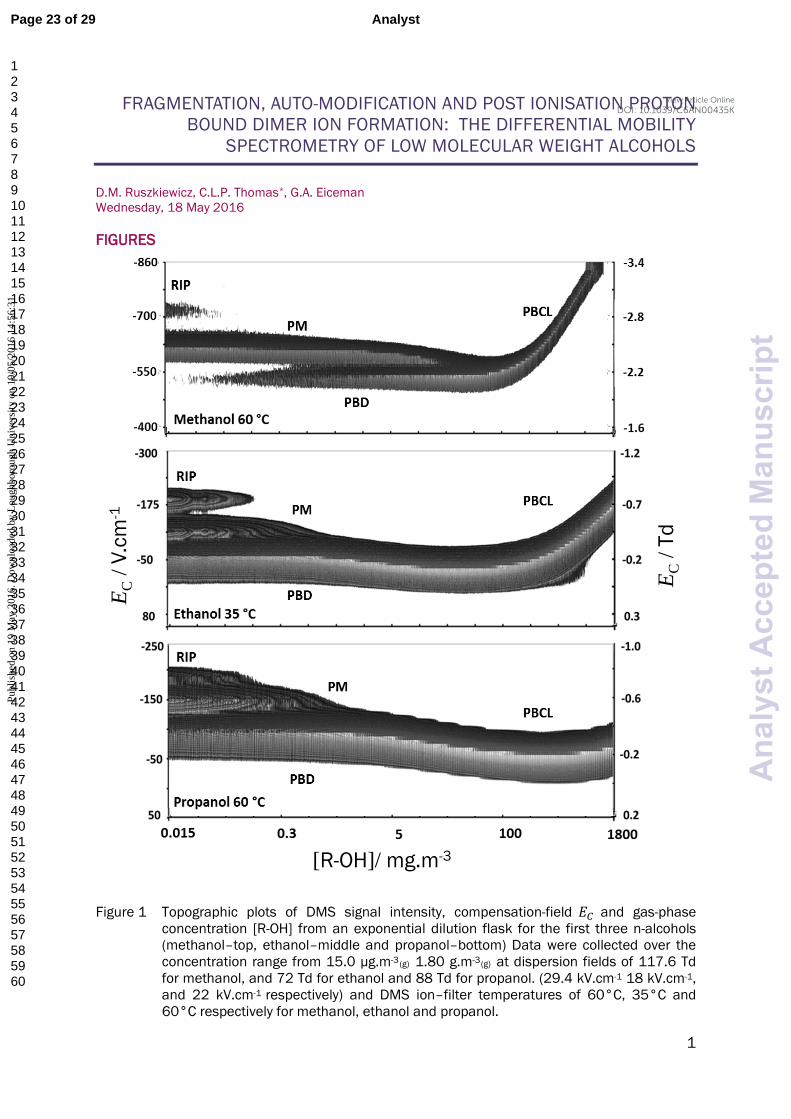
Concentration Dependence of Differential Mobility Spectra of Alcohols
The objective of this experiment was to reveal auto-modification phenomena, and possible
ion clustering artefacts in the DMS ion filter, see below. To do this the potential formation of
ion fragments that would obscure the experimental observations needed to be prevented.
This required balancing three experimental parameters: the ion temperature 𝑇𝑇𝑒𝑒𝑒𝑒𝑒𝑒 was to be
kept below the threshold at which fragment ions would be generated; the ion-filter
temperature was to be set at a temperature high enough to limit adsorption and hysteresis
within the instruments that would confound the measurements; and, the dispersion field
was selected at the lowest value required to provide resolution between the reactant and
product ions without causing enough ion heating to induce ion fragmentation. Differential
mobility spectra for methanol, ethanol, and propan-1-ol at gas temperatures of 30°C and
60°C are shown in Figure 1 as contour plots of ion intensity, compensation field strength
(𝐸𝐸𝐶𝐶 /V.cm-1 and Td), and ln(concentration) from 0.01 mg.m-3(g) to 1.80 g.m-3(g). At low
concentrations ion peaks for protonated monomer, proton-bound dimer and residual levels
for the hydrated proton reactant ion peak (RIP) were discerned. The responses for all three
Page 9 of 29 Analyst
123456789101112131415161718192021222324252627282930313233343536373839404142434445464748495051525354555657585960
Ana
lyst
Acc
epte
dM
anus
crip
t
Publ
ishe
d on
19
May
201
6. D
ownl
oade
d by
Lou
ghbo
roug
h U
nive
rsity
on
19/0
5/20
16 1
4:56
:31.
View Article OnlineDOI: 10.1039/C6AN00435K

9
compounds followed similar trends; exemplified by the ethanol responses; middle trace
Figure 1.
At concentrations below 0.2 mg.m-3(g) and at a temperature of 35°C the ethanol responses
show a residual RIP, a protonated monomer and a proton bound dimer at compensation
fields (𝐸𝐸𝑐𝑐 ) of -0.72 Td (-180 V.cm-1) , -0.63 Td (158 V.cm-1) and -0.2 Td ( 50 V.cm-1)
respectively. The peaks are not fully resolved. As the concentration increases to 0.4 mg.m-3
(g) the RIP and protonated monomer are depleted and the proton bound dimer becomes the
dominant ion species, consistent with (1) and (2). Calculations of distributions of ions at
these concentrations are generally consistent with relative peak abundances seen in Figure
1 (Supplemental Figure S3 shows an example calculation). These patterns were observed
for all alcohols with appropriate 𝐸𝐸𝑐𝑐 values for field dependent mobility. Peak widths at half
height were ca. 0.5 Td (126 V.cm-1).
Above concentrations of 0.2 mg.m-3(g), the 𝐸𝐸𝑐𝑐 values of the protonated and proton bound
dimer merged with a continuous shift in 𝐸𝐸𝑐𝑐 for the proton bound dimer peak from -2.0 Td to
+0.32 Td at a concentration of approximately 100 mg.m-3(g). Calculations of ion
distributions show that at 50 mg.m-3(g) the fractional value for proton-bound trimer is 0.75
and trends toward a maximum at 200 mg.m-3(g) (the fractional value of proton-bound
tetramer increases over 0.001 only at 400 mg.m-3(g)). Since ions and unreacted sample
vapour flow together through the ion filter, the shift in the peaks’ compensation-field values
over the range 0.01 mg.mg-3(g) to 100 mg.m-3(g) may be attributed to the sequential
formation of the proton bound dimer, from the protonated monomer, and then, as the
concentration increases still further, the formation of proton bound trimer; denoted as a
proton-bound cluster ion “PBCL” in Figure 1.
At concentrations above 100 mg.m-3(g) the trend in the PBCL peak 𝐸𝐸𝑐𝑐 shift reversed, so that
at a concentration of 1800 mg.m-3 the PBCL peak had an apparent 𝐸𝐸𝑐𝑐 of -0.7 Td. Such
modification of the alpha-function by high concentrations of ethanol has been described
extensively in the DMS literature, and the phenomenon of an analyte modifying its DMS
response may be termed auto-modification.
This interpretation of the observed responses implies that ion lifetimes exceed their
residence time in the ion-filter and that ion temperatures are slightly higher than the gas
Page 10 of 29Analyst
123456789101112131415161718192021222324252627282930313233343536373839404142434445464748495051525354555657585960
Ana
lyst
Acc
epte
dM
anus
crip
t
Publ
ishe
d on
19
May
201
6. D
ownl
oade
d by
Lou
ghbo
roug
h U
nive
rsity
on
19/0
5/20
16 1
4:56
:31.
View Article OnlineDOI: 10.1039/C6AN00435K

10
temperature since the effective temperature of the ion (𝑇𝑇𝑒𝑒𝑒𝑒𝑒𝑒) is increased by absorbing field
energy according to Equation 3:
32
𝑘𝑘𝑏𝑏𝑇𝑇𝑒𝑒𝑒𝑒𝑒𝑒 = 32
𝑘𝑘𝑏𝑏𝑇𝑇 +12𝜁𝜁𝜁𝜁𝑣𝑣𝑑𝑑2
Eqn. 3
where: 𝑘𝑘𝑏𝑏, Boltzmann constant; 𝑇𝑇, gas temperature; 𝜁𝜁, ion mass; and 𝑣𝑣𝑑𝑑, drift velocity of
the ion swarm given by,
𝑣𝑣𝑑𝑑2 = 𝐾𝐾02𝑁𝑁02 �𝐸𝐸𝑁𝑁�2
Eqn. 4
The term 𝜁𝜁 is a correction for inefficient transfer of field energy to the ion for fragmentation.
A correction from thermal to field supplemented 𝑇𝑇𝑒𝑒𝑒𝑒𝑒𝑒 is 1.5°C per Td has been reported
previously in two studies [31,33].
Spectra obtained with the DMS analyser at 100°C (Figure 2), a typical temperature for
analytical applications with GC/DMS instrumentation, exhibited significant differences from
those described in Figure 1. A prominent difference was observed in the case of propan-1-
ol, with ion peaks for protonated monomer and proton bound dimer being absent over the
concentration range 0.02 mg.m-3 (g) to ca. 3 mg.m-3 (g) with a resolved RIP below
concentrations of ca. 0.2 mg m-3 (g). Another significant difference was the appearance of
additional ion peak at an 𝐸𝐸𝑐𝑐 of -1.10 Td, indicative of a smaller ion than the protonated
monomer ion over a concentration range from 0.02 mg.m-3 to 3 mg.m-3. Similar behaviour
was also observed for ethanol, but not methanol, and these observations are indicative of
fragmentation reactions.
Previous studies with proton transfer reaction mass spectrometry described the dehydration
of protonated alcohols above electric-field strength of 92 Td, followed by dehydrogenation
when the electric-field strength was increased above 138 Td [27]. The combined effect of
temperature and electric-field was not described. Direct extrapolation of such mass
spectrometric findings to DMS with a polarizable atmosphere with increased N was not
considered trivial and consequently, studies of 𝑇𝑇 and dispersion-field (E/N) interactions
were undertaken and are described below.
Page 11 of 29 Analyst
123456789101112131415161718192021222324252627282930313233343536373839404142434445464748495051525354555657585960
Ana
lyst
Acc
epte
dM
anus
crip
t
Publ
ishe
d on
19
May
201
6. D
ownl
oade
d by
Lou
ghbo
roug
h U
nive
rsity
on
19/0
5/20
16 1
4:56
:31.
View Article OnlineDOI: 10.1039/C6AN00435K
11
APCI Mass Spectrometry of Alcohols with Electric Field Induced Decomposition of Ions
Ions formed in a 63Ni ion source and heated with electric fields were mass-analysed and
Figure 3 describes the data obtained from propan-1-ol and butan-1-ol challenges showing
how ion abundance changed as the electric-field amplitude was increased.
Propan-1-ol
At the lowest electric field strengths, below an applied voltage amplitude of 1.7 kV the
proton bound dimer m/z 121 was most prominent (375 counts) with two dissociation
products at m/z 61 (75 counts) and m/z 43 (250 counts) also present. Increasing the
voltage amplitude to ca. 2.2 kV resulted in the depletion of the proton bound dimer with the
abundance of the m/z 61 and m/z 43 reaching maximum intensities of ca 370 counts and
340 counts respectively. Note however that another dissociation product, m/z 59, was
created in parallel with the m/z 61 and m/z 43 entities, increasing in-line with increasing
voltage amplitude. Above a voltage of 2.2 kV the m/z 59 dissociation product ion became
the dominant species, reaching a maximum intensity at 2.5 kV, as the abundance of m/z 61
and m/z 43 ions reduced to near zero. Finally, at an applied voltage above 2.5 kV the
abundance of m/z 59 fragment ion reduced to near zero accompanied by the emergence of
m/z 39 dissociation product ion reaching a maximum intensity estimated to fall in the range
180 counts to 300 counts at an applied voltage of 2.9 kV.
Butan-1-ol
The electric field induced fragmentation of butan-1-ol revealed similar, albeit more
complicated, behaviours to those observed for propan-1-ol. Below an applied voltage
amplitude of 1.7 kV the proton bound dimer (m/z = 149) was most prominent. Above this
value the proton bound dimer depleted rapidly with an approximate 10 % yield of a
dissociation product ion (m/z = 57) and an approximately 1% yield of hydrated protonated
monomer (m/z = 93), Figure 3. Increasing the voltage amplitude to 3kV resulted in the
formation of another dissociation product ion (m/z = 39). The relationship of the yield of the
m/z 93 product ion (hydrated protonated monomer) to the voltage amplitude was not as
well defined as the other species; perhaps indicating the possibility of two overlapping and
unresolved profiles. The most abundant dissociation product ion appeared to be related to
the formation of m/z = 57 species. However the formation of a m/z = 39 dissociation
Page 12 of 29Analyst
123456789101112131415161718192021222324252627282930313233343536373839404142434445464748495051525354555657585960
Ana
lyst
Acc
epte
dM
anus
crip
t
Publ
ishe
d on
19
May
201
6. D
ownl
oade
d by
Lou
ghbo
roug
h U
nive
rsity
on
19/0
5/20
16 1
4:56
:31.
View Article OnlineDOI: 10.1039/C6AN00435K

12
product ion, at low yields (ca. 0.3% of the proton bound dimer intensity), starting at a
dispersion voltage amplitude of about 2.5 kV indicates a carbon-carbon bond cleavage
accompanied by the formation of a smaller single carbon atom entity (possibly protonated
formaldehyde) that was not observed in this experiment. The appearance of the m/z = 39
species coincides with the maximum yield of the m/z = 93 and m/z = 57 dissociation
product ions.
Influence of Temperature and Dispersion Field
Dispersion plots for methanol, propan-1-ol, and butan-1-ol obtained at temperatures over
the range 40°C to 120°C at constant concentrations are shown in Figures 4 to 6.
Methanol
Methanol (Figure 4) may be regarded as a reference experiment where the effect of
increasing the cell-temperature on differential mobility may be discerned. The alpha-function
for the protonated methanol monomer was little affected by cell-temperature, with the
cluster ion CH3OH2+(H2O)n being principally a mono-hydrate. (Fractional values for n= 2 were
calculated to be 0.14 at 80°C, 0.05 at 100°C, and 0.01 at 120°C). Nonetheless, changes
in the alpha function for these ions were measurable and separation of the reactant ion and
product ion peaks occurred at dispersion fields that decreased with increased temperature:
98 Td (24.5 kV.cm-1) at 80°C, 89 Td (22.25 kV.cm-1) at 100°C and 78 Td (19.5 kV.cm-1) at
120°C. Increasing cell-temperature also boosts the 𝑇𝑇𝑒𝑒𝑒𝑒𝑒𝑒 of the product ion while changing
the nature of the low-field cluster ion at higher dispersion fields. It is helpful to note that
differential mobilities are determined by difference between the low-field, and high-field
mobilities that product ions experience throughout the asymmetric waveform of the
dispersion field. (Increasing cell temperature results in the mobilities of the low field ion
clusters tending towards their high-field forms so reducing their differential mobility).
A minor presence of a feature attributed to an ammonium ion was observed in all methanol
dispersion plots. The source of this impurity was not identified and it was not detected in the
GC-MS purity assays. Note that no proton-bound methanol dimer or fragment ions were
observed throughout this range of cell-temperatures and dispersion field strengths.
Page 13 of 29 Analyst
123456789101112131415161718192021222324252627282930313233343536373839404142434445464748495051525354555657585960
Ana
lyst
Acc
epte
dM
anus
crip
t
Publ
ishe
d on
19
May
201
6. D
ownl
oade
d by
Lou
ghbo
roug
h U
nive
rsity
on
19/0
5/20
16 1
4:56
:31.
View Article OnlineDOI: 10.1039/C6AN00435K

13
Propan-1-ol
Dispersion plots in Figure 5 for propan-1-ol from 70 to 130°C indicated complicated
behaviours, with a feature possibly attributable to a protonated monomer discernible only at
70°C and then only at 𝐸𝐸𝐷𝐷 values between 60 Td (15 kV.cm-1) to 75 Td (18.75 kV.cm-1). A
cluster ion was observed at 𝐸𝐸𝐷𝐷 values from 40 Td (10 kV.cm-1) to 100 Td (25 kV.cm-1). This
feature depleted rapidly with increasing 𝐸𝐸𝐷𝐷 value and as the ion-filter temperature was
increased the 𝐸𝐸𝐷𝐷 value at which this feature ended appeared to reduce significantly. An
unexpected and previously unreported phenomenon was the apparent regeneration of the
RIP signal that accompanied disappearance of the cluster ion signal, indicating the creation
of hydrated protons. Figure 6, taken from propan-1-ol dispersion data at a cell-temperature
of 70°C shows the extracted ((H3O)+(H2O)n) maximum dispersion plot signal. As 𝐸𝐸𝐷𝐷
increased the intensity of the ((H3O)+(H2O)n) signal increased from an almost zero level
starting at 65 Td (17.25 kV.cm-1) and reaching a maximum at 84 Td (21 kV.cm-1), followed
by a decline. In contrast the blank dispersion plot shows peak intensity decreasing smoothly
with increasing 𝐸𝐸𝐷𝐷 due to wall-losses associated with the reduction in the acceptance
aperture that occurs with increasing 𝐸𝐸𝐷𝐷 ; observed for all ions in planar embodiments of
DMS. Any rise in ion intensity with increasing 𝐸𝐸𝐷𝐷, as shown for propan-1-ol, originates from
a chemical reaction and suggests formation of (H+(H2O)n).
Accompanying the depletion of the cluster ion signal was an appearance of another ion (𝐸𝐸𝐶𝐶
= -1.5 Td (-473 V.cm-1); 𝐸𝐸𝐷𝐷 = 117 Td (29.25 kV.cm-1). The appearance of this ion at
increasingly lower 𝐸𝐸𝐷𝐷 values with increased temperature was consistent with the pattern of
ion dissociation/fragmentation seen in the DMS-MS experiment used to study electric field
induced decomposition, Figure 3.
The instruments used in this study were not able to isolate and characterise fully the ion
clusters observed; this will require the design and construction of a new DMS-MS instrument
that isolates the product ions from neutral species before the ion filter. The underlying
processes that generated the observed responses may be described in similar terms to the
chemistry of alcohol product ions observed with PTRMS [27]. At low 𝐸𝐸𝐷𝐷 and ion filter
temperature the predominant propan-1-ol species appears to be a proton bound dimer (m/z
Page 14 of 29Analyst
123456789101112131415161718192021222324252627282930313233343536373839404142434445464748495051525354555657585960
Ana
lyst
Acc
epte
dM
anus
crip
t
Publ
ishe
d on
19
May
201
6. D
ownl
oade
d by
Lou
ghbo
roug
h U
nive
rsity
on
19/0
5/20
16 1
4:56
:31.
View Article OnlineDOI: 10.1039/C6AN00435K

14
121), increasing the energy of the ion cluster causes dissociation generating a product (m/z
61) thought to be a protonated monomer (5)
(5).
The protonated monomer may undergo a dehydration reaction (6) resulting in a fragment ion
(m/z 43), reported previously in PTRMS studies at electric fields of 138 Td [27].
(6).
The creation of an m/z 59 entity from propan-1-ol has not been reported, although it was
observed at trace levels with propan-2-ol. Proton bound dimers were also not reported within
PTRMS studies, and the difference in pressure and chemical speciation indicates that
different fragmentation mechanisms may exist. The creation of m/z 59 species along with
the production of m/z 43 and m/z 19 may be invoked through the dissociation of a proton
bound dimer (7).
(7).
2H+C3H7OH H+C3H7OH + C3H7OH
∆
k1
H+C3H7OH +C3H7 + H2O∆
k2
+(H3O)+2H
+C3H7OH H+C3H6O +∆
+C3H7
∆
k3
C C CH
H
H H
H H
H
C
C
H
C C C
H
H
H H
H
C
H
H
H
O
OH
+
Page 15 of 29 Analyst
123456789101112131415161718192021222324252627282930313233343536373839404142434445464748495051525354555657585960
Ana
lyst
Acc
epte
dM
anus
crip
t
Publ
ishe
d on
19
May
201
6. D
ownl
oade
d by
Lou
ghbo
roug
h U
nive
rsity
on
19/0
5/20
16 1
4:56
:31.
View Article OnlineDOI: 10.1039/C6AN00435K

15
The m/z 39 fragment (C3H3+) was observed with PTRMS studies at electric fields of 138 Td
[27], and is thought to result from the sequential loss of H2 (8) and at this stage the
tentative assignment for C3H3+ is a cyclic entity [34, 35].
+C3H7+C3H5
+C3H3 (8).
The absence of a distinctive protonated monomer signal may be explained if the
dissociation of the proton bound dimer was rate limiting, and followed by subsequent fast
dissociation/fragmentation (k1 < k2 ). This has been observed with butyl acetates in a
conventional IMS drift tube [36], and with esters in other DMS studies [32]. This behaviour
has been attributed to the energy partition and the heat capacity of the larger proton bound
dimer compared to the protonated monomer. The onset of ion decomposition is remarkably
sensitive to ion mass and in the instance of ethanol, the difference in mass between
protonated monomer and proton bound dimer is only 46 Da. Nonetheless, the protonated
ethanol monomer at 70°C was decomposed completely at 𝐸𝐸𝐷𝐷 = 78 Td (19.5 kV.cm-1) while
the proton bound dimer persists until 𝐸𝐸𝐷𝐷 = 103 Td (25.75 kV.cm-1).
The dispersion plots acquired at 115 °C and 130°C (Figure 5), show two further
dissociation/decomposition processes, albeit at lower yields. The feature observed at 𝐸𝐸𝐷𝐷 =
110 Td (27.5 kV.cm-1) at 130°C is consistent with the formation of C3H3+ (8). The feature
branching from the hydrated proton reaction ion peak at 𝐸𝐸𝐷𝐷 = 72 Td (18 kV.cm-1) and 𝐸𝐸𝐶𝐶 = -
0.75 Td (-118 V.cm-1) is perhaps consistent with the formation (C3H7)+ from the
decomposition of a proton bound dimer (7). In PTR-MS studies at intermediate (115 Td) to
high field strengths (138 Td) the fragment ion observed for propan-1-ol was C3H5+ [27]; the
possible generation of such a fragment cannot be excluded in this study.
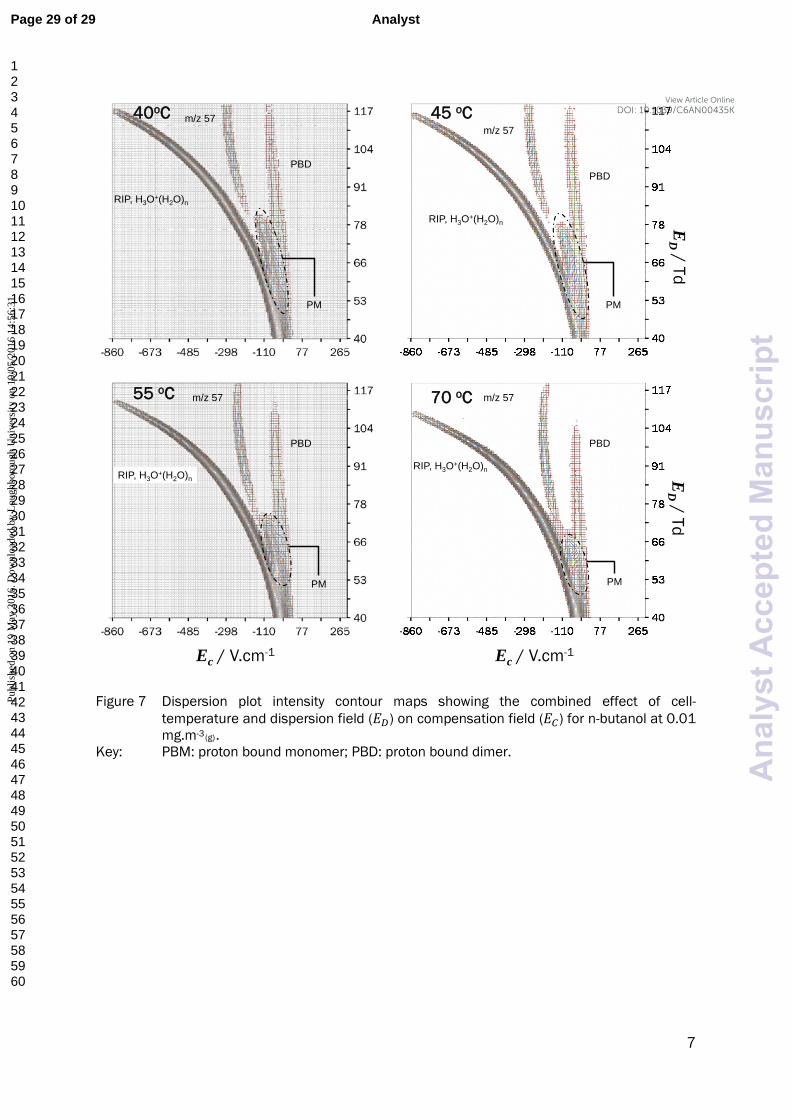
Butan-1-ol
In Figure 6 the dispersion plots for butan-1-ol obtained at 40°C, 45°C, 50°C and 70°C show
the fragmentation of protonated monomer with little or no proton bound dimer present. The
formation of a dissociation/fragmentation product ion at 40°C and 𝐸𝐸𝐷𝐷 = 90 Td (22.5 kV.cm-
1) is clearly evident with 𝐸𝐸𝐷𝐷 decreasing to 𝐸𝐸𝐷𝐷 = 59 Td (17.5 kV.cm-1) as the cell-temperature
Page 16 of 29Analyst
123456789101112131415161718192021222324252627282930313233343536373839404142434445464748495051525354555657585960
Ana
lyst
Acc
epte
dM
anus
crip
t
Publ
ishe
d on
19
May
201
6. D
ownl
oade
d by
Lou
ghbo
roug
h U
nive
rsity
on
19/0
5/20
16 1
4:56
:31.
View Article OnlineDOI: 10.1039/C6AN00435K

16
increases to 70°C. This observation is consistent with the formation of the m/z = 57
dissociation/fragmentation ion observed in the mass spec study.
Dehydration of protonated monomers with the formation of hydrated protons
Reaction (7) postulates that (H+(H2O)n) may be generated during dissociation and this was
noted above and in Figure 6; and was evident in the 3D plots of Figures 5 and 7. This
phenomenon was observed for propan-1-ol and butan-1-ol. Of further interest was the
butan-1-ol response indicated the possibility that two distinct dehydration reactions were
occurring with two phases of (H+(H2O)n) generation.
Clustering in DMS drift tube.
The apparent shift of the 𝐸𝐸𝐶𝐶 maximum for the protonated monomer towards that for the
proton bound dimer occurred over a relatively narrow range of experimental conditions of
temperatures and vapour concentrations. This observation was unmistakable and
repeatable and is apparent in Figures 1 and 2. The number of ion-neutral collisions during
the low-field segment of the waveform was well below 1, and the observed behaviour
consequently cannot be described as a cluster-decluster mechanism with modification of
the alpha-function. Modification of the alpha function was observed at higher vapour levels
as seen in Figures 1 and 2, where a cool ion can be solvated through 2 or more collisions
[37, 38,39,40]. It is helpful to emphasise the convergence of the protonated monomer 𝐸𝐸𝐶𝐶
maximum to the proton bound dimer compensation field maximum must be due to ion
molecule collisions over time periods greater than 600 ns (the duration of the low field
segment of the dispersion waveform) and is consistent with residence time of ions in the
drift tube (1 to 2 ms). Two possible interpretations may be considered.
The ion may be envisaged as entering the drift tube as a protonated monomer (Dotted line
in Figure S4). A residence time of 2 ms in the DMS ion filter gives enough time for the ion to
collide with a neutral alcohol molecule (ROH), creating a proton bound dimer with a different
trajectory (Dashed line in Figure S4). The result will be a shift in the ion’s position on the 𝐸𝐸𝐶𝐶
scale such that it falls between the monomer and proton bound dimer positions. This
phenomenon is concentration dependent, the higher the concentration, the earlier the
collision takes place, and the closer the modified trajectory will be to that of a proton bound
Page 17 of 29 Analyst
123456789101112131415161718192021222324252627282930313233343536373839404142434445464748495051525354555657585960
Ana
lyst
Acc
epte
dM
anus
crip
t
Publ
ishe
d on
19
May
201
6. D
ownl
oade
d by
Lou
ghbo
roug
h U
nive
rsity
on
19/0
5/20
16 1
4:56
:31.
View Article OnlineDOI: 10.1039/C6AN00435K

17
dimer generated in the reaction region. The two distinct signals are seen to converge with
the protonated monomer signal appearing to shift and merge with the proton bound dimer
signal as the concentration increases. The ion entered the drift tube as a protonated
monomer and was converted to proton bound dimer emerging at a CV which was a measure
of where the conversion occurred in the ion-filter.
The alternative explanation invokes exchange between the protonated monomer and proton
bound dimer during transit through the ion-filter. Collision numbers at this concentration and
residence time are 20 to 50. While such interactions may be expected to cause band
broadening it has been shown that exchange of neutral adducts on an ion core can be
located over a range of drift times without band broadening or resolution of the two ion
clusters providing the exchange is rapid in comparison to residence time in the drift tube
[41].
Increasing the cell-temperature inhibited this phenomenon which was eliminated at cell-
temperatures above 130°C. While the two mechanisms cannot be unpacked from the
experiments here, these observations add an additional layer of complexity onto the
fragmentation behaviour.
CONCLUSIONS
The experiments in this study isolated dissociation/fragmentation product ions that have not
been previously described. The ion chemistries appear to be similar to those reported in
PTRMS studies [27]. The formation of the fragment ion at m/z 39 from propan-1-ol and
butan-1-ol raises the possibility of multistep reactions and the possibility of further ion-
neutral reactions. Follow-on experiments with deuterated standards at higher mass accuracy
will be a logical continuation from this preliminary study to better establish the reactions and
mechanisms observed here.
Whenever a DMS measurement with alcohols is above 80°C, dehydration reactions are
possible and will be controlled by 𝑇𝑇(𝑒𝑒𝑒𝑒𝑒𝑒) which is determined by the combination of the
experimental parameters of cell-temperature and 𝐸𝐸𝐷𝐷. The onset of changes in the spectral
patterns at characteristic T and E/N values varies with C-number for all alcohols except
methanol, which undergoes no fragmentation. The selection of these experimental
parameters determines in large measure the resultant characteristics of the observed
Page 18 of 29Analyst
123456789101112131415161718192021222324252627282930313233343536373839404142434445464748495051525354555657585960
Ana
lyst
Acc
epte
dM
anus
crip
t
Publ
ishe
d on
19
May
201
6. D
ownl
oade
d by
Lou
ghbo
roug
h U
nive
rsity
on
19/0
5/20
16 1
4:56
:31.
View Article OnlineDOI: 10.1039/C6AN00435K
18
spectra, and the subsequent possible analytical utility of comparison of spectra between
DMS platforms and laboratories.
Over a relatively narrow range of temperature and vapour concentration, ion peaks undergo
a slide in 𝐸𝐸𝐶𝐶 maxima values, and this cannot be attributed to alpha function modification.
Rather, the ion is being transformed during residence in the DMS analyser. Applications for
measuring alcohols should account for these behaviours [42]. Future developments of DMS,
should address these factors by designing the ionisation inlet to ensure ions pass into the
DMS in filter in purified gases and unreacted sample or matrix neutrals are vented.
ACKNOWLEDGEMENTS
The authors wish to thank: the Engineering and Physical Science Research Council
alongside John Hoggs Technical Solutions for the support of D.M. Ruszkiewicz through an
Industrial Case Studentship Award; the researchers at NMSU for their help with the APCI MS
studies, and Dr Matthew Turner at Loughborough University for his support of the laboratory
experiments.
Page 19 of 29 Analyst
123456789101112131415161718192021222324252627282930313233343536373839404142434445464748495051525354555657585960
Ana
lyst
Acc
epte
dM
anus
crip
t
Publ
ishe
d on
19
May
201
6. D
ownl
oade
d by
Lou
ghbo
roug
h U
nive
rsity
on
19/0
5/20
16 1
4:56
:31.
View Article OnlineDOI: 10.1039/C6AN00435K

19
REFERENCES
1 National Institute on Alcohol Abuse and Alcoholism URL:
http://www.niaaa.nih.gov/alcohol-health/overview-alcohol-consumption/alcohol-facts-and-statistics , visited 23 August 2015
2 Office for National Statistics; Defining alcohol-related deaths; discussion released 18 July 2006, URL: http://www.ons.gov.uk/ons/index.html , visited 24 August 2015
3 Winek C.L, Wahba W.W, Wienek Jr W.W and Balzer T.W.; Forensic Science International (2001) 122; pp 107-123
4 Brahmi N, Blel Y, Abidi N, Kouraichi N, Thabet H, Hedhili A, and Amamou M. Methanol poisoning in Tunisia: report of 16 cases. Clin. Toxicol. (Phila). 2007;45(6) pp717-20
5 Williams GF, Hatch FJ, Bradley MCand case study of four patienl. Aust. Crit. Care (1997); 10; pp 113-18
6 The Wall Street Jurnal; After Poisonings, Czech Republic Bans Hard Liquor, URL: http://www.wsj.com/articles/SB10000872396390443995604578000421386428846 , visited 24 August 2015
7 EPA No CASR. ( AEGLs ) METHANOL report 2005 (67), URL: www.epa.gov visited 13 July 2015
8 The NHS Information Centre; Statistics on Alcohol; England, 2013, p.53 URL: www.hscic.gov.uk/catalogue/PUB10932/alc-eng-2013-rep.pdf , visited 23 August 2015
9 U.S Department of Health and Human Services NIAAA; Alcohol and the brain neuroscience and neurobehavioral; In: Tenth Special Report to the US Congress on Alcohol and Healt; Rockville, MD. National Institute on Alcohol Abuse and Alcoholism (2000) pp 67-157
10 Stewart S, Jones D, Day CP. Alcoholic liver disease: new insights into mechanisms and preventative strategies. Trends Mol. Med. (2001) 9; pp 408-413
11 Rydberg U. andSkerfving S.; The toxicity of ethanol. The tantative risk evaluation; Alcohol Intoxication and Withdrawal; Plenium Press, New York pp 403-419
12 Stremski E and Hennes H.; Pediatr Emerg Care (2000) 4; pp 238-40 13 BBC News; Prisoner drunk on swine flu gel; URL
http://news.bbc.co.uk/1/hi/england/dorset/8272799.stm, visited 29 September 2015
14 CBSNews; Hand sanitizers linked to alcohol poisoning in kids, URL: http://www.cbsnews.com/news/hand-sanitizers-linked-to-alcohol-poisoning-in-kids/, visited 29 September 2015
15 National library of medicine; Toxicology data network – isopropanol, URL:http://toxnet.nlm.nih.gov/, visited 13 July 2015
Page 20 of 29Analyst
123456789101112131415161718192021222324252627282930313233343536373839404142434445464748495051525354555657585960
Ana
lyst
Acc
epte
dM
anus
crip
t
Publ
ishe
d on
19
May
201
6. D
ownl
oade
d by
Lou
ghbo
roug
h U
nive
rsity
on
19/0
5/20
16 1
4:56
:31.
View Article OnlineDOI: 10.1039/C6AN00435K
20
16 Pereira P., Santos E., Ferreira T., Andrade J.; Talanta (1999) 49; pp 245-252 17 Giang Y, Wang S., Tsai C., Lee M. and Ng C.; Forensic Science Journal (2007)
6; pp 1-19 18 Macchia T., Mancinelli R., Gentili S, Lugaresi E., Raponi A., Taggi F.; Journal of
Analytical Toxicology (1995) 19; pp 241-246 19 Gallego E., Roca X., Perales J., Guardino X.; Journal of Environmental Sciences
(2008) 21; pp 333-339 20 Ghimenti S., Tabucchi S., Bellagambi F., Lomonaco T, Onor M., Trivella M.,
Fuoco R., Di Francesco F.; Journal of Pharmaceutical and Biomedical Analysis (2015) 106; pp 218-223
21 Jones A., Mardh G., Anggard E., Pharmacology Biochemistry and Behaviour (1983) 18; pp 267-272
22 Sielemann S, Baumbach J., Schmidt H., Pilzecker P.; Analytica Chimica Acta (2001) 431; pp 293-301
23 Bocos-Bintintan V., Moll V., Flanagan R., Thomas P.; International Journal for Ion Mobility Spectrometry (2010) 13; 55-63
24 Limero T., Reese E., Wallace W., Cheng P. and Trowbridge J.; International Journal for Ion Mobility Spectrometry (2012) 15; pp 189-198
25 Eiceman G. and Karpas Z.; Ion Mobility Spectrometry; 2005, Taylor and Francis Group
26 Inomata S., Tanimoto H.; Int. J. Mass Spec. (2009) 285; pp 95-99 27 Brown P., Watts P., Märk T., Mayhew C.; Int. J. Mass Spec. (2010) 294; pp 103-
111 28 Purves R. W., Ozog, A. R., Ambrose, S. J., Prasad, S., Belford, M., and Dunyach
J. J., J. Am. Soc. Mass Spectrom. (2014) 25 pp 1274-1284 29 Dillon L., Stone V., Croasdell L., Fielden P., Goddard N. and Thomas P. The
Analyst (2010) 135; pp 306–14 30 Khayamian T., Tabrizchi M., Taj N.; Anal. Chem. (2001) 370, pp 1114-1116 31 30 Nelson G.,Gas Mixtures: Preparation and Control, Lewis Publishers Inc., 1992 32 An X., Eiceman G., Rodriguez J. Stone J. A., Int. J. Mass Spec. (2011) 303; pp
181-190 33 An X., Eiceman G., Räsänen R., Rodriguez J., Stone J., J. Phys. Chem. A (2013)
117; pp 6389-6401 34 Gui-xia Liu, Ze-sheng Li,* Yi-hong Ding, Qiang Fu, Xu-ri Huang, Chia-chung Sun,
and Au-chin Tan, J. Phys. Chem. A (2002) 106, pp 10415–10422 35 Mabrouki R., Ibrahim Y., Enli Xie, Meot-Ner (Mautner) M., and El-Shall M.S., J.
Phys Chem. A (2006) 110, pp 7334-7344 36 Eiceman G. A., Shoff D. B, Harden C. S., and Snyder A.P., Int. J. Mass Spec. Ion
Proc. (1988) 85, pp 265-275.
Page 21 of 29 Analyst
123456789101112131415161718192021222324252627282930313233343536373839404142434445464748495051525354555657585960
Ana
lyst
Acc
epte
dM
anus
crip
t
Publ
ishe
d on
19
May
201
6. D
ownl
oade
d by
Lou
ghbo
roug
h U
nive
rsity
on
19/0
5/20
16 1
4:56
:31.
View Article OnlineDOI: 10.1039/C6AN00435K
21
37 Eiceman G., Krylova N., Krylov E., J. Stone; Int J Ion Mobil Spectrom (2003) 107;
pp 3648-3652 38 Eiceman G., Krylov E., Krylova N., Nazarov E., Miller R.; Analytical Chemistry
(2004) 76; pp 4937–4944 39 Rorrer L., Yost R.; International Journal of Mass Spectrometry (2011) 300; pp
173–181 40 Schneider B., Covey T., Nazarov E.; International Journal for Ion Mobility
Spectrometry (2013) 16; pp 207-216 41 Preston J., Rajadhyax L.; Anal. Chemistry (1988) 34; pp 31-34 42 Criado-García L., Ruszkiewicz D. M., Eiceman G. A., and Thomas C. L. P.; J.
Breath Res. (2016) 10; 017101
Page 22 of 29Analyst
123456789101112131415161718192021222324252627282930313233343536373839404142434445464748495051525354555657585960
Ana
lyst
Acc
epte
dM
anus
crip
t
Publ
ishe
d on
19
May
201
6. D
ownl
oade
d by
Lou
ghbo
roug
h U
nive
rsity
on
19/0
5/20
16 1
4:56
:31.
View Article OnlineDOI: 10.1039/C6AN00435K
1
FRAGMENTATION, AUTO-MODIFICATION AND POST IONISATION PROTON BOUND DIMER ION FORMATION: THE DIFFERENTIAL MOBILITY
SPECTROMETRY OF LOW MOLECULAR WEIGHT ALCOHOLS
D.M. Ruszkiewicz, C.L.P. Thomas*, G.A. Eiceman Wednesday, 18 May 2016
FIGURES
Figure 1 Topographic plots of DMS signal intensity, compensation-field 𝐸𝐸𝐶𝐶 and gas-phase concentration [R-OH] from an exponential dilution flask for the first three n-alcohols (methanol–top, ethanol–middle and propanol–bottom) Data were collected over the concentration range from 15.0 μg.m-3(g) 1.80 g.m-3(g) at dispersion fields of 117.6 Td for methanol, and 72 Td for ethanol and 88 Td for propanol. (29.4 kV.cm-1 18 kV.cm-1, and 22 kV.cm-1 respectively) and DMS ion–filter temperatures of 60°C, 35°C and 60°C respectively for methanol, ethanol and propanol.
E C/ V
.cm
-1
E C/ T
d
[R-OH]/ mg.m-3
Page 23 of 29 Analyst
123456789101112131415161718192021222324252627282930313233343536373839404142434445464748495051525354555657585960
Ana
lyst
Acc
epte
dM
anus
crip
t
Publ
ishe
d on
19
May
201
6. D
ownl
oade
d by
Lou
ghbo
roug
h U
nive
rsity
on
19/0
5/20
16 1
4:56
:31.
View Article OnlineDOI: 10.1039/C6AN00435K

2
Figure 2. Topographic plots of intensity, compensation field and vapour concentration from
measurements by a DMS analyser equipped with exponential dilution flask for first three n-alcohols (methanol–top, ethanol–middle and propanol–bottom). Data were collected over the concentration range from 1.80 g.m-3(g) to 15.0 μg.m-3(g) at dispersion fields of 117.6 Td for methanol, and 72 Td for ethanol and 88 Td propanol (29.4 kV.cm-1 18 kV.cm-1 and 22 kV.cm-1 respectively), with the DMS ion–filter temperature maintained at 100°C.
E C/ V
.cm
-1
E C/ T
d
[R-OH]/ mg.m-3
Page 24 of 29Analyst
123456789101112131415161718192021222324252627282930313233343536373839404142434445464748495051525354555657585960
Ana
lyst
Acc
epte
dM
anus
crip
t
Publ
ishe
d on
19
May
201
6. D
ownl
oade
d by
Lou
ghbo
roug
h U
nive
rsity
on
19/0
5/20
16 1
4:56
:31.
View Article OnlineDOI: 10.1039/C6AN00435K

3
Figure 3. Ion intensity 𝐼𝐼 vs. applied ion heating voltage 𝑉𝑉𝐷𝐷, showing the effect of dispersion field
amplitude (𝑉𝑉𝐷𝐷) on ion dissociation at a DMS temperature of ca. 80°C. Top: Ions associated with propanol showing the dissociation of a proton bound dimer (m/z = 121) to yield a protonated monomer (m/z = 61) and a dehydration fragment ion (m/z = 43). Increasing 𝑉𝑉𝐷𝐷 resulted in further ion dissociation with the products at m/z = 59 and finally m/z = 39. Bottom: ions associated with butanol (scaled to enable straightforward comparison). Here the proton bound dimer dissociates to a dehydration dissociation product ion (m/z = 57 at ca. 10% yield) and a hydrated protonated monomer (m/z = 93 at ca. 1 % yield). Above 𝑉𝑉𝐷𝐷= 2.5kV the m/z = 39 dissociation product was observed once more [27].
0
100
200
300
400
1 1.5 2 2.5 3 3.5 4
I(Co
unts
)
VD / kV
m/z 121
m/z 61 m/z 59
m/z 39
m/z 43
0
100
200
300
400
1 1.5 2 2.5 3 3.5 4
m/z 149 x 0.01
m/z 93
m/z 57 x 0.1
m/z 39 x 3
VD / kV
I (co
unts
)
Page 25 of 29 Analyst
123456789101112131415161718192021222324252627282930313233343536373839404142434445464748495051525354555657585960
Ana
lyst
Acc
epte
dM
anus
crip
t
Publ
ishe
d on
19
May
201
6. D
ownl
oade
d by
Lou
ghbo
roug
h U
nive
rsity
on
19/0
5/20
16 1
4:56
:31.
View Article OnlineDOI: 10.1039/C6AN00435K

4
Figure 4. Dispersion plot intensity contour maps showing the combined effect of cell-temperature and dispersion field (𝐸𝐸𝐷𝐷) on compensation field
(𝐸𝐸𝐶𝐶). Top: dispersion plots of methanol at ≈ 0.01 mg.m-3(g). Bottom: blank dispersion plots. While the effect of temperature on the reactant ion hydrate proton clusters is evident, the methanol protonated monomer does not form dissociation ions and its dispersion behaviour is not affected significantly by increases in temperature over the range 80°C to 120°C.
Page 26 of 29Analyst
123456789101112131415161718192021222324252627282930313233343536373839404142434445464748495051525354555657585960
Ana
lyst
Acc
epte
dM
anus
crip
t
Publ
ishe
d on
19
May
201
6. D
ownl
oade
d by
Lou
ghbo
roug
h U
nive
rsity
on
19/0
5/20
16 1
4:56
:31.
View Article OnlineDOI: 10.1039/C6AN00435K

5
Figure 5. Dispersion plot intensity contour maps showing the combined effect of cell-temperature and dispersion field (𝐸𝐸𝐷𝐷) on compensation field (𝐸𝐸𝐶𝐶) for n-propanol at 0.02 mg.m-3(g). The mass assignments are tentative and inferred from the DMS-MS data.
Key: PBD: proton bound dimer, perhaps accompanied by mixed cluster ions; and, C: trace contamination attributed to siloxanes.
C
m/z 61PBD
m/z 39
H3O+(H2O)n
m/z 59
m/z 43C
m/z 61 PBD
m/z 59
H3O+(H2O)n
m/z 43
m/z 43, 61
PBD
m/z 59
H3O+(H2O)nm/z 43, 61
PBD
m/z 59
H3O+(H2O)n
70 oC 100 oC
130 oC
Ec / V.cm-1Ec / V.cm-1
115 oC
ED
/ TdE
D/ Td
Page 27 of 29 Analyst
123456789101112131415161718192021222324252627282930313233343536373839404142434445464748495051525354555657585960
Ana
lyst
Acc
epte
dM
anus
crip
t
Publ
ishe
d on
19
May
201
6. D
ownl
oade
d by
Lou
ghbo
roug
h U
nive
rsity
on
19/0
5/20
16 1
4:56
:31.
View Article OnlineDOI: 10.1039/C6AN00435K

6
Figure 6. Evidence of (H+(H2O)n) formation with increasing 𝐸𝐸𝐷𝐷. The top trace shows the effect of
increasing 𝐸𝐸𝐷𝐷 on intensity of the (H+(H2O)n) signal at an ion-filter temperature of 70°C. The signal intensity decays with the reducing acceptance aperture of the DMS. The bottom trace shows the (H+(H2O)n) signal intensity observed under the same dispersion fields in the presence of 0.02 mg.m-3(g) propanol. At the start of the dispersion field programme the (H+(H2O)n) signal reflects the depletion of the reactant ion peak to form PBD and PM. Increasing 𝐸𝐸𝐷𝐷 resulted in a signal profile indicative of the regeneration of (H+(H2O)n) in line with the dissociation and fragmentation processes postulated in Eq. 9, 10 and 11.
0
0.06
0.12
0.18
0.24
0.3
60 70 80 90 100 110 120
Blank RIP
0.02 mg.m-3(g) n-propanol RIP trace
Blank RIP
/ Td
I/ V
10 14 18 22 26 30/ kV.cm-1
Page 28 of 29Analyst
123456789101112131415161718192021222324252627282930313233343536373839404142434445464748495051525354555657585960
Ana
lyst
Acc
epte
dM
anus
crip
t
Publ
ishe
d on
19
May
201
6. D
ownl
oade
d by
Lou
ghbo
roug
h U
nive
rsity
on
19/0
5/20
16 1
4:56
:31.
View Article OnlineDOI: 10.1039/C6AN00435K
7
Figure 7 Dispersion plot intensity contour maps showing the combined effect of cell-temperature and dispersion field (𝐸𝐸𝐷𝐷) on compensation field (𝐸𝐸𝐶𝐶) for n-butanol at 0.01 mg.m-3(g).
Key: PBM: proton bound monomer; PBD: proton bound dimer.
PM
RIP, H3O+(H2O)n
m/z 57
PBD
PM
RIP, H3O+(H2O)n
m/z 57
PBD
PM
RIP, H3O+(H2O)n
m/z 57
PBD
PM
RIP, H3O+(H2O)n
m/z 57
PBD
45 oC
55 oC
Ec / V.cm-1Ec / V.cm-1
70 oC
ED
/ TdE
D/ Td
40oC
Page 29 of 29 Analyst
123456789101112131415161718192021222324252627282930313233343536373839404142434445464748495051525354555657585960
Ana
lyst
Acc
epte
dM
anus
crip
t
Publ
ishe
d on
19
May
201
6. D
ownl
oade
d by
Lou
ghbo
roug
h U
nive
rsity
on
19/0
5/20
16 1
4:56
:31.
View Article OnlineDOI: 10.1039/C6AN00435K