Fragment library screening and characterization with … · Fragment library screening and...
8
Application note 28-9796-95 AA Biacore TM label-free interaction analysis Fragment library screening and characterization with Biacore ™ 4000 Fragment-based drug design is increasingly used to identify suitable structure scaffolds in drug discovery. Label-free technologies such as x-ray crystallography and NMR have proved useful for identification of low-affinity fragment compounds to drug targets. Surface plasmon resonance (SPR) biosensor is an attractive technique in this area due to low target consumption, high-information content and high-quality data. Biacore 4000 equipped with Biacore 4000 LMW Extension Package was used to meet the challenges posed by the low-millimolar affinity levels and low molecular weights that are typical for fragments. Recently developed methodologies and evaluation tools were used for identification of super- stoichiometric sticky binders, and automatic detection of atypical binding behavior to rapidly focus the studies on well behaving candidates. These analyses were applied to screens that used either single concentrations or a concentration series of each sample. Specificity of fragment hits was confirmed using competition experiments. The dedicated Affinity Screen evaluation tool facilitated the evaluation of affinities in the millimolar range. With throughput sufficient for most fragment libraries, novel methodology, data evaluation features, and enhanced sample data import and export functionality, Biacore 4000 is a potentially important tool in fragment-based drug design. Examples are shown on the use of the screening and affinity evaluation tools to improve selection of fragments in a way that can significantly elevate the success rates of subsequent co-crystallizations. Introduction Fragment-based lead design approaches the challenge of developing new drugs in shorter time and when high throughput screening fails by identifying small molecule fragments as starting points for chemical development programs. This approach increases the possibility to cover a relatively large proportion of chemical space by screening a smaller number of compounds/fragments (thousands instead of hundred of thousands). A combination of structural and functional binding information is used to identify promising fragments. Accurate and rapid prioritization of these fragments for further analysis and development is crucial. Despite its advantages, fragment screening presents several technical challenges. Many structural binding methods, such as NMR and X-ray crystallography, consume large amounts of target protein. In addition, the low affinities commonly exhibited by fragments (0.1 to 10 mM) require high sample concentrations to obtain high binding site occupancy. In practice, this means that solubility limitations might force the use of suboptimal concentrations for affinity analysis in relation to the affinity. Biacore systems have the advantage of consuming small amounts of both target protein and fragments at the same time as providing sufficient throughput. SPR technology is, however, mass dependent and the low molecular weights of fragments (M r 80 to 300) give low signals. Generally, fragments have very fast on- and off-rates, resulting in square-shaped Fig 1. Fragment screening with Biacore 4000 provides three main tools to enhance screening quality (shaded boxes) and simplify analysis. Competition assays, which dramatically reduce the frequency of false positives, are easy to run utilizing the general functionality in the software. Clean Screen • Rapid screen of entire library against each target • Goal: Removal of fragments that could potentially disturb subsequent assays Binding Level Screen • Single concentration screen • Goal: Rapid prioritization of fragments Affinity Screen • Steady state analysis based on concentration series • Goal: Affinity ranking and verification Competition assay • Usage of inhibitor in sample and buffer • Goal: Validation and binding site mapping GE Healthcare Life Sciences
Transcript of Fragment library screening and characterization with … · Fragment library screening and...

imagination at work
Application note 28-9796-95 AA BiacoreTM label-free interaction analysis
Fragment library screening and characterization with Biacore™ 4000Fragment-based drug design is increasingly used to identify suitable structure scaffolds in drug discovery. Label-free technologies such as x-ray crystallography and NMR have proved useful for identification of low-affinity fragment compounds to drug targets. Surface plasmon resonance (SPR) biosensor is an attractive technique in this area due to low target consumption, high-information content and high-quality data.Biacore 4000 equipped with Biacore 4000 LMW Extension Package was used to meet the challenges posed by the low-millimolar affinity levels and low molecular weights that are typical for fragments. Recently developed methodologies and evaluation tools were used for identification of super-stoichiometric sticky binders, and automatic detection of atypical binding behavior to rapidly focus the studies on well behaving candidates. These analyses were applied to screens that used either single concentrations or a concentration series of each sample. Specificity of fragment hits was confirmed using competition experiments. The dedicated Affinity Screen evaluation tool facilitated the evaluation of affinities in the millimolar range.With throughput sufficient for most fragment libraries, novel methodology, data evaluation features, and enhanced sample data import and export functionality, Biacore 4000 is a potentially important tool in fragment-based drug design. Examples are shown on the use of the screening and affinity evaluation tools to improve selection of fragments in a way that can significantly elevate the success rates of subsequent co-crystallizations.
IntroductionFragment-based lead design approaches the challenge of developing new drugs in shorter time and when high throughput screening fails by identifying small molecule fragments as starting points for chemical development programs. This approach increases the possibility to cover a
relatively large proportion of chemical space by screening a smaller number of compounds/fragments (thousands instead of hundred of thousands). A combination of structural and functional binding information is used to identify promising fragments. Accurate and rapid prioritization of these fragments for further analysis and development is crucial.
Despite its advantages, fragment screening presents several technical challenges. Many structural binding methods, such as NMR and X-ray crystallography, consume large amounts of target protein. In addition, the low affinities commonly exhibited by fragments (0.1 to 10 mM) require high sample concentrations to obtain high binding site occupancy. In practice, this means that solubility limitations might force the use of suboptimal concentrations for affinity analysis in relation to the affinity.
Biacore systems have the advantage of consuming small amounts of both target protein and fragments at the same time as providing sufficient throughput. SPR technology is, however, mass dependent and the low molecular weights of fragments (Mr 80 to 300) give low signals. Generally, fragments have very fast on- and off-rates, resulting in square-shaped
Fig 1. Fragment screening with Biacore 4000 provides three main tools to enhance screening quality (shaded boxes) and simplify analysis. Competition assays, which dramatically reduce the frequency of false positives, are easy to run utilizing the general functionality in the software.
Clean Screen• Rapid screen of entire library against each target• Goal: Removal of fragments that could potentially disturb subsequent assays
Binding Level Screen• Single concentration screen
• Goal: Rapid prioritization of fragments
Affinity Screen• Steady state analysis based
on concentration series
• Goal: Affinity ranking and verification
Competition assay• Usage of inhibitor in sample and buffer• Goal: Validation and binding site mapping
GE HealthcareLife Sciences

2 28-9796-95 AA
sensorgrams. This means that steady-state affinity analysis should be used to reveal the affinity as the kinetic rate constants normally cannot be resolved.
In order to address these experimental challenges, Biacore 4000 LMW Extension Package provides three dedicated software tools for screening fragments and other LMW compounds (Fig 1). The Clean Screen tool is used to identify troublesome fragments that show a persistent binding which may lower the data quality for the following samples. After this clean-up step, fragments can be prioritized for further analysis using Binding Level Screen. A single concentration of fragments can be run against multiple immobilized proteins: targets, blank reference, and additional protein control targets. Promising binders can be selected with respect to the binding strength as well as their binding behavior through analysis of the sensorgram shape which reveals, for example, secondary interactions. The prioritized fragments (or the entire library) are run in concentration series and characterized by affinity steady-state analysis to verify binding and determine the dissociation equilibrium constants for ranking based on affinity and ligand efficiency. Application-tailored fitting algorithms allow evaluation both when suboptimal concentrations have to be used, and in situations where secondary binding, unrelated to the target site of interest, occurs.
Materials and methodsScreening against a tyrosine kinase, K1 (Mr 31 900), was performed using an unbiased in-house fragment library composed of 1920 fragments. These fragments were selected by criteria like the rule-of-three with a particular emphasis on chemical diversity and solubility of the molecules. Molecular weights were between 100 Da and 260 Da with an average of 220 Da. To maximize sample throughput, all assays were run in a sample-focused arrangement, where the same panel of ligands is immobilized in each of the four flow cells (see Fig 2). The targets were immobilized to Sensor Chip CM5 using amine coupling. K1 was immobilized at a high and low level on spots 1 and 2, respectively, and carbonic anhydrase (CA) was immobilized as a control target on spot 5. One spot with unmodified CM-dextran and one activated/deactivated spot were used as references (Fig 2). Four different samples were injected in each analysis cycle, one over each flow cell. The generally weak binding of fragments to target molecules meant that complete dissociation from the surface was rapid and regeneration was not necessary. For all screens, the evaluation tools in Biacore 4000 LMW Extension Package were used.
Fig 2. Target configuration for screening of the fragment library.
Clean ScreenAll fragments were screened at the highest concentration that was planned to be used in subsequent analyses (2 mM), using the same injection time. Assay buffer: 10 mM HEPES/NaOH pH 7.40, 150 mM NaCl, 0.05% Surfactant P20, 5 mM MgCl2, 1 mM DTT, and 2% DMSO. Fragments were screened simultaneously for binding to the target kinase and carbonic anhydrase (control protein), immobilized as shown in Figure 2.
Binding Level ScreenSince the Clean Screen run was designed to include a well-characterized active site inhibitor, Inh 1, as positive control and buffer served as negative control, it could also be used for Binding Level Screen evaluation. Evaluation included reference subtraction, solvent correction, and molecular weight adjustment.
Competition assayThe Binding Level Screen was repeated in the presence of a very potent site-specific competitor, Inh 2, in all samples and buffers at a concentration high enough to ensure complete blockage of the active site throughout the run.
Affinity ScreenThe same spot configuration was used as in Binding Level Screen. In the Affinity Screen, Inh 1 was used as both positive control and as Rmax control. Rmax was determined using a saturating concentration, 2 µM (KD 20 nM), of Inh 1. Each sample was diluted two-fold from 2000 µM in ten steps, giving eleven concentrations (2000, 1000, 500, 250, 125, 63, 31, 16, 8, 4, and 2 µM). A blank for each sample was included.
Results and discussionClean ScreenClean Screen aims at identifying troublesome fragments, in particular “sticky” compounds. Fragments that exhibit significant levels of persistant binding may lower data quality in subsequent cycles. No control samples, reference subtraction, or solvent correction is needed for the Clean Screen evaluation and the simplest possible assay set up can be used. In this study, however, Clean Screen evaluations were done on runs also set up for Binding Level Screen evaluations, an approach which was facilitated by the high library quality. Out of 1920 fragments, twelve were identified as sticky binders (0.6%) at a concentration of 2 mM. Among these twelve compounds, both general and target-related persistent binders were found (Fig 3). About half of the persistant binders were target-dependent, while the others could be classified as general binders or dextran binders.
For each target, the result of the automated software evaluation can be visualized in a scatter plot, as the shift in baseline response between each cycle (n) and the baseline response in the following cycle (n+1). In this way, binding of the sample injected in cycle n that persists in cycle (n+1) can be quantitated. This value is then plotted against cycle number.
1Spot 2 3 4 5
Control CAK1 high level
K1low level
Reference(unmodifiedCM dextran)
Reference(blank surface,activated/deactivated)

28-9796-95 AA 3
The software automatically assigns different symbols to the samples (Fig 3): Red squares indicate general residual binding to all spots included in the evaluation, blue squares represent compounds with selective residual binding (i.e., K1 or CA), and green squares are for fragments with no residual binding. The cut-off for residual binding was set to 10 RU.
Even though persistent binders do not block the site of interest, as often shown by unaffected binding of a positive control, they may still cause drifts in the assay leading to underestimation of fragment binding levels and reduced data quality. This may lead to lower prioritization of fragments that follow a persistent binder in the experimental order. It is therefore desirable to remove these sticky fragments from further analyses.
Binding Level ScreenAt early stages in fragment-based drug discovery, candidate fragments seldom can be identified reliably from single binding measurements alone. Therefore, Binding Level Screen is designed to select a number of fragments for further work rather than to provide a secure identification of binders.
Binding Level Screen supports prioritization between fragments showing the strongest binding, based on response levels measured shortly after the start of the sample injection. An early report point provides an adequate measure of binding levels, while at the same time reducing the risk of unintentionally prioritizing fragments due to nonspecific binding taking place during the injection. Such compounds are frequently promiscuous binders and are efficiently
identified by the software and tagged with binding behavior markers. The different behaviors are color-coded in the plot (Fig 4) as follows: Samples with slow dissociation are shown in yellow, samples with R > Rmax in turquoise blue, samples with slope during binding in blue, and samples showing multiple binding behaviors are shown in red. A sample with no binding behavior markers is depicted with green spots. Ranking fragments according to binding level reveals potentially strong binders, and the binding behavior marker functionality facilitates identification of the well-behaved fragments. A Binding Level Screen thus gives adequate help in prioritizing the most promising fragments on which further efforts can be spent.
A cutoff is automatically set to pick out 10% of the samples, and these fragments are indicated as prioritized. However, in order to obtain 10% fragments with normal behavior or to select another level, the cutoff can be adjusted accordingly.
In order to obtain additional information about site specificity, a competition assay was run in the presence of a site-specific competitor in all samples and buffers to ensure a complete blockage of the active site throughout the run. The results from this run were compared to the data from the run without competitor. Two selection criteria were set for primary hits: the difference in binding level should be between 20 and 50 RU, and the binding level in the presence of competitor around 10 RU or less (Fig 5). This assay setup was very efficient since all binding of the fragment in the presence of the competitor is related to other sites on the target than the site of interest and is regarded as secondary in this study.
Fig 3. Clean Screen result from one of the plates (384 samples) in the study: Panel A shows the difference in baseline response between each cycle (n) and the baseline response in the following cycle (n + 1). In this way, binding of the sample injected in cycle (n) that persists in cycle (n+1) can be quantitated. This value is then plotted against cycle number. In the Clean Screen result, blue data points reveal selective sticking (persistant binding) to K1 and not to CA (carbonic anhydrase). Red data points indicate a generally sticky fragment with persistent signal elevation after injection to all included targets. The sensorgram in panel B corresponds to the blue sample data points in panel A (encircled), and the sensorgram in panel C corresponds to the red data points in panel A (enclosed in a rectangle).
-100
0
300
100
200
400
500
600
700
900
800
5 25 45 65 85 105 125
Bas
elin
e ed
iffer
ence
s ([c
ycle
num
ber+
1] –
[cyc
le n
umbe
r])
Response(RU)
Cycle number
-200
0
1000
400
200
600
800
1200
1400
-20 60 80 1000 20 40 120 140 160
Response(RU)
Time
-50
50
250
150
350
450
-20 60 80 1000 20 40 120 140 160
Response(RU)
Time
K1 High
K1 Low
CAReference
Baseline
Baseline
No residual bindingGeneral residual bindingSelective residual binding
K1 High
K1 Low
B)
C)
A)
CAReference

4 28-9796-95 AA
-5
55
15
35
75
95
115
0 10 20 30 40 50 60 70 80 90 100
Response(RU)
Cycle number
-5
20
5
0
10
15
25
30
-10 30 40 500 10 20 60 70 80
NoneMultipleR > RmaxSlow dissSlope
Adjusted relative response - binding early
-10
40
10
0
20
30
50
60
70
80
-10 30 40 500 10 20 60
Slope
Slow diss
A) B)
C)
Example of slope (blue marker)
Example of Slow dissociation marker (yellow marker)
Fig 4. Binding Level Screen of 384 fragments for K1 target at 2 mM concentration. (A) A plot of the molecular weight-adjusted binding responses against cycle number. (B) An illustration of a sensorgram that triggers a binding behavior marker for slope (i.e., increasing signal during sample injection; blue color). (C) An illustration of a sensorgram with the binding behavior marker (yellow color) for slow dissociation (i.e., a delay in the signal return to baseline).
Fig 5. Comparison of binding levels in the presence (grey) or absence (blue) of competitor, for a selection of samples.
0
10
20
30
40
50
60
70
80
1 2 3 4 5 6 7 8 9 10 11 12 13 14 15 16 17 18 19 20 21 22 23 24
Example Samples
Response(RU/Da × 100) Binding without a competitor Binding with a competitor
From these data, 192 compounds, 180 hits, and 12 fragments used as negative controls were chosen as primary hits and were subjected to Affinity Screen. The major benefit of the competition run was a significant decrease in the number of false positives taken for further analysis.
Affinity ScreenWhile Clean Screen and Binding Level Screen are based on analysis of a single sample concentration, Affinity Screen requires a concentration series for each sample. In a classical steady-state affinity analysis, the concentration range should ideally extend to at least twice the KD value for the interaction. This is seldom feasible in practice with low affinity fragments.

28-9796-95 AA 5
Fig 6. Principles of predetermined Rmax. The upper panel (A) shows a fit to an example data set (simulated with Rmax = 60 RU and KD = 0.5 mM) with concentrations well above KD, resulting in a good determination of KD. (B) A fit to the first five points, representing a typical situation for fragments. Here, the KD cannot be properly determined due to the lack of information about Rmax in the data points. (C) A fit with constant predetermined Rmax (60 RU), resulting in a good determination of KD, close to the simulated value. In this case, the information about Rmax, lacking in the datapoints, could be provided from another source. In a real experiment, this information can be obtained with a positive control.
Predeterminated Rmax enables analysis at suboptimal concentrations The practice of fitting with predetermined Rmax provided by Affinity Screen enhances the analysis quality and meets the challenge of working with concentration series suboptimal in relation to KD. In this study, the agreement between free fitting and fitting with predetermined Rmax increases the confidence in the results and confirms the high data quality, provided through a careful selection by using Clean Screen, Binding Level Screen, and the competition assay.
To ensure a robust evaluation, a positive control that is known to bind well to the site of interest on the target is used. The binding capacity for the control binder is used to calculate a molecular weight-adjusted predetermined Rmax for each fragment automatically. This value is used as a base for the affinity estimation and an example is shown in Figure 6.
Evaluation of affinity in the presence of secondary interactionsAffinity Screen evaluation estimates the binding strength by fitting binding data to a model for either single or multisite interaction. A multisite model is suggested automatically by the software when R > Rmax or if the sensorgram displays a slope during binding and a slow dissociation, both of which indicate secondary binding. An example of this is shown in Figure 7. A high-fitted Rmax/constant Rmax ratio combined
-10
60
20
40
30
50
10
0
0 1 2 3 4 5 6 7 8 9
Response(RU)
Concentration (mM)
-5
20
10
15
5
0
0 0.05 0.10 0.15 0.20 0.25 0.30
Response(RU)
Concentration (mM)
A)
B)
Fitted with free Rmax
Analyte concentrations 0.03KD - 16KD
Rmax = 57 RUKD = 0.51 mM
Fitted with free Rmax
Analyte concentrations 0.03KD - 0.5KD Rmax = 31 RU KD = 0.11 mM
-5
20
10
15
5
0
0 0.05 0.10 0.15 0.20 0.25 0.30
Response(RU)
Concentration (mM)
C)
Fitted with constant Rmax
Analyte concentrations 0.03KD - 0.5KD
Rmax = 60 RUKD = 0.52 mM
with responses above Rmax indicates secondary binding causing superstoichiomeric responses (Fig 7C). On the other hand, when responses are below Rmax, a high Rmax/constant Rmax-ratio rather indicates a lack of information about Rmax leading to a high degree of dependence on evaluation with predetermined Rmax (Fig 7B).
Despite its name, the multisite model only determines a single affinity related to the predetermined Rmax; however, it does this in the presence of secondary interactions.
Since fragment binding is expected to occur with rapid on-and off-rates, equilibrium can be assumed to be reached almost immediately after start of sample injection, and at this point the data are minimally affected by secondary binding events. Therefore, this early data point is preferred in Affinity Screen plots rather than the point close to the end of the injection that is commonly used in steady-state affinity determination.
Selection of candidates for successful X-ray crystallography screenThe 192 fragments selected with Binding Level Screen and competition assays were run in dilution series of 11 concentrations in the range between 2 µM and 2 mM. The same flow cell setup as in Binding Level Screen was used. The predetermined Rmax was established, and the surface activity was monitored by checking the binding levels for single injections of inhibitor (Inh 1) at a saturating concentration of 2 µM.
6 28-9796-95 AA
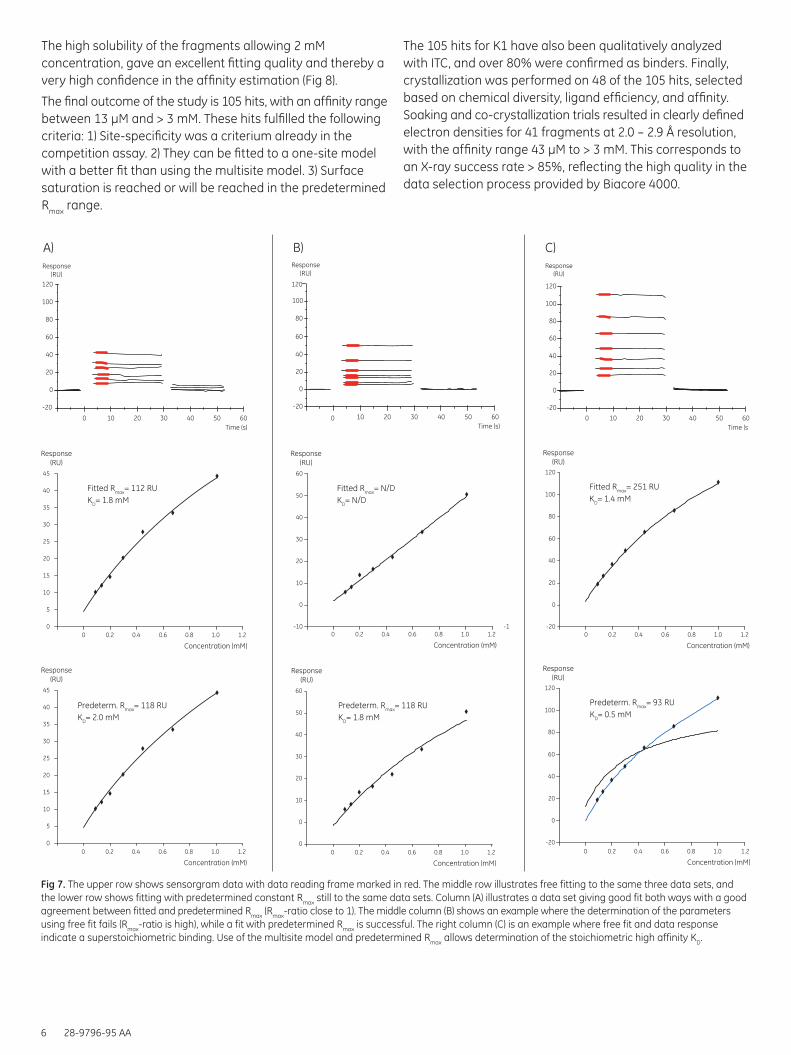
Fig 7. The upper row shows sensorgram data with data reading frame marked in red. The middle row illustrates free fitting to the same three data sets, and the lower row shows fitting with predetermined constant Rmax still to the same data sets. Column (A) illustrates a data set giving good fit both ways with a good agreement between fitted and predetermined Rmax (Rmax-ratio close to 1). The middle column (B) shows an example where the determination of the parameters using free fit fails (Rmax-ratio is high), while a fit with predetermined Rmax is successful. The right column (C) is an example where free fit and data response indicate a superstoichiometric binding. Use of the multisite model and predetermined Rmax allows determination of the stoichiometric high affinity KD.
-10
0
10
20
30
40
50
60
-20
0
20
40
60
80
100
10 20 30 40 50 60Time (s)
-1
0
0
10
20
30
40
50
60
Response(RU)
Response(RU)
Response(RU)
Response(RU)
Fitted Rmax= N/DKD= N/D
Predeterm. Rmax= 118 RUKD= 1.8 mM
Predeterm. Rmax= 118 RUKD= 2.0 mM
-20
-20
0
20
40
60
80
100
120
-20
0
20
40
60
80
100
120120
10 20 30 40 50 60Time (s
0
20
40
60
80
100
120
Response(RU)
Response(RU)
Response(RU)
Fitted Rmax= 251 RUKD= 1.4 mM
Predeterm. Rmax= 93 RUKD= 0.5 mM
0 0.2 0.4 0.6 0.8 1.0 1.2
5
0
10
15
20
25
30
40
35
45
Response(RU)
Concentration (mM)
Fitted Rmax= 112 RUKD= 1.8 mM
5
0
10
15
20
25
30
40
35
45
Response(RU)
A) B) C)
0 0.2 0.4 0.6 0.8 1.0 1.2
Concentration (mM)
0 0.2 0.4 0.6 0.8 1.0 1.2
Concentration (mM)
0 0.2 0.4 0.6 0.8 1.0 1.2
Concentration (mM)0 0.2 0.4 0.6 0.8 1.0 1.2
Concentration (mM)
0 0.2 0.4 0.6 0.8 1.0 1.2
Concentration (mM)
-20
0
20
40
60
80
120
100
0 0 010 20 30 40 50 60Time (s)
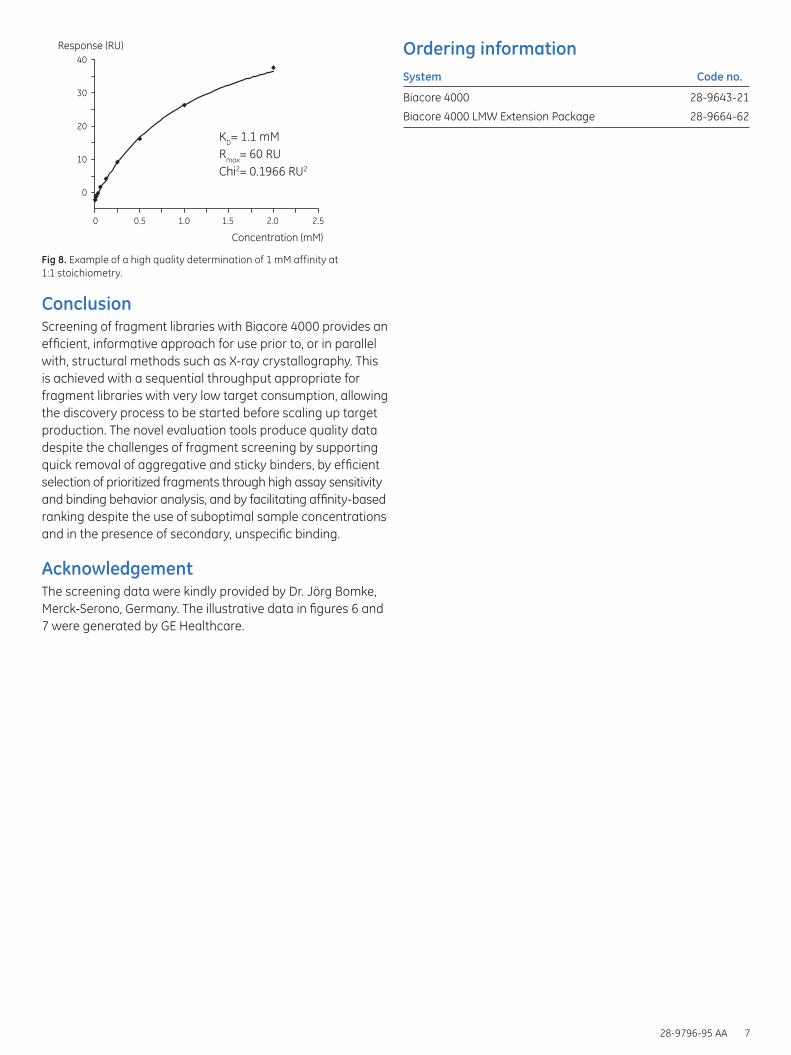
The high solubility of the fragments allowing 2 mM concentration, gave an excellent fitting quality and thereby a very high confidence in the affinity estimation (Fig 8).
The final outcome of the study is 105 hits, with an affinity range between 13 µM and > 3 mM. These hits fulfilled the following criteria: 1) Site-specificity was a criterium already in the competition assay. 2) They can be fitted to a one-site model with a better fit than using the multisite model. 3) Surface saturation is reached or will be reached in the predetermined Rmax range.
The 105 hits for K1 have also been qualitatively analyzed with ITC, and over 80% were confirmed as binders. Finally, crystallization was performed on 48 of the 105 hits, selected based on chemical diversity, ligand efficiency, and affinity. Soaking and co-crystallization trials resulted in clearly defined electron densities for 41 fragments at 2.0 – 2.9 Å resolution, with the affinity range 43 µM to > 3 mM. This corresponds to an X-ray success rate > 85%, reflecting the high quality in the data selection process provided by Biacore 4000.
28-9796-95 AA 7
ConclusionScreening of fragment libraries with Biacore 4000 provides an efficient, informative approach for use prior to, or in parallel with, structural methods such as X-ray crystallography. This is achieved with a sequential throughput appropriate for fragment libraries with very low target consumption, allowing the discovery process to be started before scaling up target production. The novel evaluation tools produce quality data despite the challenges of fragment screening by supporting quick removal of aggregative and sticky binders, by efficient selection of prioritized fragments through high assay sensitivity and binding behavior analysis, and by facilitating affinity-based ranking despite the use of suboptimal sample concentrations and in the presence of secondary, unspecific binding.
AcknowledgementThe screening data were kindly provided by Dr. Jörg Bomke, Merck-Serono, Germany. The illustrative data in figures 6 and 7 were generated by GE Healthcare.
Ordering informationSystem Code no.
Biacore 4000 28-9643-21
Biacore 4000 LMW Extension Package 28-9664-62
Fig 8. Example of a high quality determination of 1 mM affinity at 1:1 stoichiometry.
0
10
20
30
40
0 0.5 1.0 1.5 2.0 2.5
Response (RU)
Concentration (mM)
KD= 1.1 mMRmax= 60 RUChi2= 0.1966 RU2

8 28-9796-95 AA
imagination at work
GE, imagination at work, and GE monogram are trademarks of General Electric Company.
Biacore is a trademark of GE Healthcare companies.
All third party trademarks are the property of their respective owners.
© 2011 General Electric Company—All rights reserved. First published Jan. 2011
All goods and services are sold subject to the terms and conditions of sale of the company within GE Healthcare which supplies them. A copy of these terms and conditions is available on request. Contact your local GE Healthcare representative for the most current information.
GE Healthcare UK Limited Amersham Place Little Chalfont Buckinghamshire, HP7 9NA UK
GE Healthcare Europe, GmbH Munzinger Strasse 5 D-79111 Freiburg Germany
GE Healthcare Bio-Sciences Corp. 800 Centennial Avenue, P.O. Box 1327 Piscataway, NJ 08855-1327 USA
GE Healthcare Japan Corporation Sanken Bldg., 3-25-1, Hyakunincho Shinjuku-ku, Tokyo 169-0073 Japan
For local office contact information, visit www.gelifesciences.com/contact
www.gelifesciences.com/biacore
GE Healthcare Bio-Sciences ABBjörkgatan 30751 84 UppsalaSweden
28-9796-95 AA 01/2011