Fragility Analysis of Reinforced Concrete Building by ... stress strain model is demonstrated in the...
7
International Research Journal of Engineering and Technology (IRJET) e-ISSN: 2395 -0056 Volume: 04 Issue: 06 | June -2017 www.irjet.net p-ISSN: 2395-0072 © 2017, IRJET | Impact Factor value: 5.181 | ISO 9001:2008 Certified Journal | Page 950 Fragility Analysis of Reinforced Concrete Building by Various Modeling Approaches using SAP 2000- A Parametric Study Vinay T V 1 , Sowjanya G V 2 , Gokul R 3 1 PG Student, Dept. of Civil Engineering, Sri Siddhartha Institute of Technology, Tumakuru, Karnataka, India 2 Asst Professor, Dept. of Civil Engineering, Sri Siddhartha Institute of Technology, Tumakuru, Karnataka, India 3 Structural Design Engineer, Bengaluru, Karnataka, India ---------------------------------------------------------------------***--------------------------------------------------------------------- Abstract – Earthquakes are the most destructive and devasting calamities among all the natural disasters since they cause injuries and as well as economic losses. In the present study highlights a very simplified procedure of Non Linear Static Analysis which is nothing but Non Linear Static Pushover Analysis of RC frame structures. In this study by treating uncertainty in strength as a parameter the seismic risk evaluation of RC building has been carried using SAP 2000 version 18 and for the modeling Manders model and Kent and Park model are considered. From the obtained pushover curve the comparison of results of analytical and experimental are carried. The performance level of the structure has been defined. The seismic fragility curves and damage state thresholds are established. Also the comparison of results of Mander model and Kent and Park model is done. Key Words: Pushover analysis, Mander model, Kent and Park model, Capacity curve, Fragility curve, Damage state threshold 1. INTRODUCTION Of all the natural disasters, earthquakes are one of the most devastating and unpredictable phenomena that have influenced on mankind from the immemorial time. In 2001, after the Bhuj earthquake a significant involvement in this country has been focused towards the destructive impact of earthquakes and has enhanced the awareness of the hazard regarding seismic risk events. To withstand the effects of earthquakes requires special considerations in structural design and evaluation of buildings regarding to their ability. Mainly two random variables are involved in seismic risk assessment namely vulnerability of the structure and the intensity of seismic action. the evaluation of uncertainty plays a vital role in computing the structural response of the structures. This is done by using non-linear static analysis (pushover analysis) by using the finite element program SAP2000. To model the non-linear behaviour of components it provides default or user defined hinge properties options. Non linear static analysis is an approximate method in which the structure is subjected to monotonically increasing lateral forces with an invariant height wise distribution is done until target displacement is reached. 1.1 SCOPE OF PRESENT WORK An attempt is done to study the effect of variation in strength in the structures. For this, 70 models were generated and considered the uncertainty in characteristic strength of concrete (fck) and tensile strength of steel (fy). Using SAP 2000 version 18, for all these models the modelling and analysis of has been done. In this work main focus is done on the performance evaluation of the building for designed earthquake along with the aid of capacity and demand of the building by non linear static analysis. On the basis of obtained performance level, determine the need of structure whether to repair or retrofit or to reconstruct the entire building. From the results obtained by non linear static analysis, based on the performance point different damage state thresholds and fragility curves have been generated. 1.2 OBJECTIVES The main objectives of present study are, to conduct vulnerability derivation process for an RC building assumed to be located in Zone-IV of IS: 1893(Part1)-2002 treating mechanical properties as variation of strength. To conduct non-linear static analysis for RC building by adopting different modelling approaches. To establish capacity curves, demand curves, fragility curves and damage thresholds for RC building treating concrete as confined. 1.3 METHODOLOGY An analytical four storey building model is developed using SAP 2000 version 18 software. Then the non-linear static analysis is conducted by assigning hinge properties by adopting Mander model and Kent and Park model. Then the damage state indicator levels are defined to evaluate the performance level of the building. An analytical fragility estimates are developed to quantify the seismic vulnerability of RC frame buildings. 1.4 FRAGILITY ANALYSIS The analysis of seismic loss estimation in built environment is termed as fragility analysis. There are four damage states namely slight, moderate, extensive and complete structural damage. The probability that the expected global damage (d) of a structure exceeds a given damage state as a function of
Transcript of Fragility Analysis of Reinforced Concrete Building by ... stress strain model is demonstrated in the...

International Research Journal of Engineering and Technology (IRJET) e-ISSN: 2395 -0056
Volume: 04 Issue: 06 | June -2017 www.irjet.net p-ISSN: 2395-0072
© 2017, IRJET | Impact Factor value: 5.181 | ISO 9001:2008 Certified Journal | Page 950
Fragility Analysis of Reinforced Concrete Building by Various Modeling
Approaches using SAP 2000- A Parametric Study
Vinay T V1, Sowjanya G V2, Gokul R3
1 PG Student, Dept. of Civil Engineering, Sri Siddhartha Institute of Technology, Tumakuru, Karnataka, India 2Asst Professor, Dept. of Civil Engineering, Sri Siddhartha Institute of Technology, Tumakuru, Karnataka, India
3Structural Design Engineer, Bengaluru, Karnataka, India ---------------------------------------------------------------------***---------------------------------------------------------------------
Abstract – Earthquakes are the most destructive and devasting calamities among all the natural disasters since they cause injuries and as well as economic losses. In the present study highlights a very simplified procedure of Non Linear Static Analysis which is nothing but Non Linear Static Pushover Analysis of RC frame structures. In this study by treating uncertainty in strength as a parameter the seismic risk evaluation of RC building has been carried using SAP 2000 version 18 and for the modeling Manders model and Kent and Park model are considered. From the obtained pushover curve the comparison of results of analytical and experimental are carried. The performance level of the structure has been defined. The seismic fragility curves and damage state thresholds are established. Also the comparison of results of Mander model and Kent and Park model is done.
Key Words: Pushover analysis, Mander model, Kent and Park model, Capacity curve, Fragility curve, Damage state threshold
1. INTRODUCTION
Of all the natural disasters, earthquakes are one of the most devastating and unpredictable phenomena that have influenced on mankind from the immemorial time. In 2001, after the Bhuj earthquake a significant involvement in this country has been focused towards the destructive impact of earthquakes and has enhanced the awareness of the hazard regarding seismic risk events. To withstand the effects of earthquakes requires special considerations in structural design and evaluation of buildings regarding to their ability. Mainly two random variables are involved in seismic risk assessment namely vulnerability of the structure and the intensity of seismic action. the evaluation of uncertainty plays a vital role in computing the structural response of the structures. This is done by using non-linear static analysis (pushover analysis) by using the finite element program SAP2000. To model the non-linear behaviour of components it provides default or user defined hinge properties options.
Non linear static analysis is an approximate method in which the structure is subjected to monotonically increasing lateral forces with an invariant height wise distribution is done until target displacement is reached.
1.1 SCOPE OF PRESENT WORK An attempt is done to study the effect of variation in strength in the structures. For this, 70 models were generated and considered the uncertainty in characteristic strength of concrete (fck) and tensile strength of steel (fy). Using SAP 2000 version 18, for all these models the modelling and analysis of has been done. In this work main focus is done on the performance evaluation of the building for designed earthquake along with the aid of capacity and demand of the building by non linear static analysis. On the basis of obtained performance level, determine the need of structure whether to repair or retrofit or to reconstruct the entire building. From the results obtained by non linear static analysis, based on the performance point different damage state thresholds and fragility curves have been generated.
1.2 OBJECTIVES
The main objectives of present study are, to conduct vulnerability derivation process for an RC building assumed to be located in Zone-IV of IS: 1893(Part1)-2002 treating mechanical properties as variation of strength. To conduct non-linear static analysis for RC building by adopting different modelling approaches. To establish capacity curves, demand curves, fragility curves and damage thresholds for RC building treating concrete as confined.
1.3 METHODOLOGY An analytical four storey building model is developed using SAP 2000 version 18 software. Then the non-linear static analysis is conducted by assigning hinge properties by adopting Mander model and Kent and Park model. Then the damage state indicator levels are defined to evaluate the performance level of the building. An analytical fragility estimates are developed to quantify the seismic vulnerability of RC frame buildings.
1.4 FRAGILITY ANALYSIS The analysis of seismic loss estimation in built environment is termed as fragility analysis. There are four damage states namely slight, moderate, extensive and complete structural damage. The probability that the expected global damage (d) of a structure exceeds a given damage state as a function of
International Research Journal of Engineering and Technology (IRJET) e-ISSN: 2395 -0056
Volume: 04 Issue: 06 | June -2017 www.irjet.net p-ISSN: 2395-0072
© 2017, IRJET | Impact Factor value: 5.181 | ISO 9001:2008 Certified Journal | Page 951
parameter computing the severity of seismic action. By plotting probability of exceedance in the ordinate and Sd in abscissa the fragility curve is defined and it is described by the following lognormal probability density function.
1.5 DAMAGE STATE THRESHOLDS The simplified methods are used to obtain the damage state thresholds in order to analyze the expected damage. The mathematical expression is given below.
DI = i i
2. MODELLING AND ANALYSIS 2.1 PROBABILITY OF VARIATION IN STRENGTH By considering the uncertainty in strength, an attempt has been made to study the behavior of the structure. Here, two main random variables such as fck and fy are considered in this study and the partial safety factor as 1.5 and 1.15 are taken respectively. A wide range of values are taken between 20MPa and 30MPa for concrete and series between 520MPa and 600MPa for steel is considered by taking material uncertainty into account and the specification of IS 456:2000 about the target strength of M20 grade concrete. Thus, 70 models have been developed for the underneath combination of strength of fck and fy and the analysis is carried out employing SAP2000 package.
2.2 EXPERIMENTAL REVIEW OF THE BUILDING
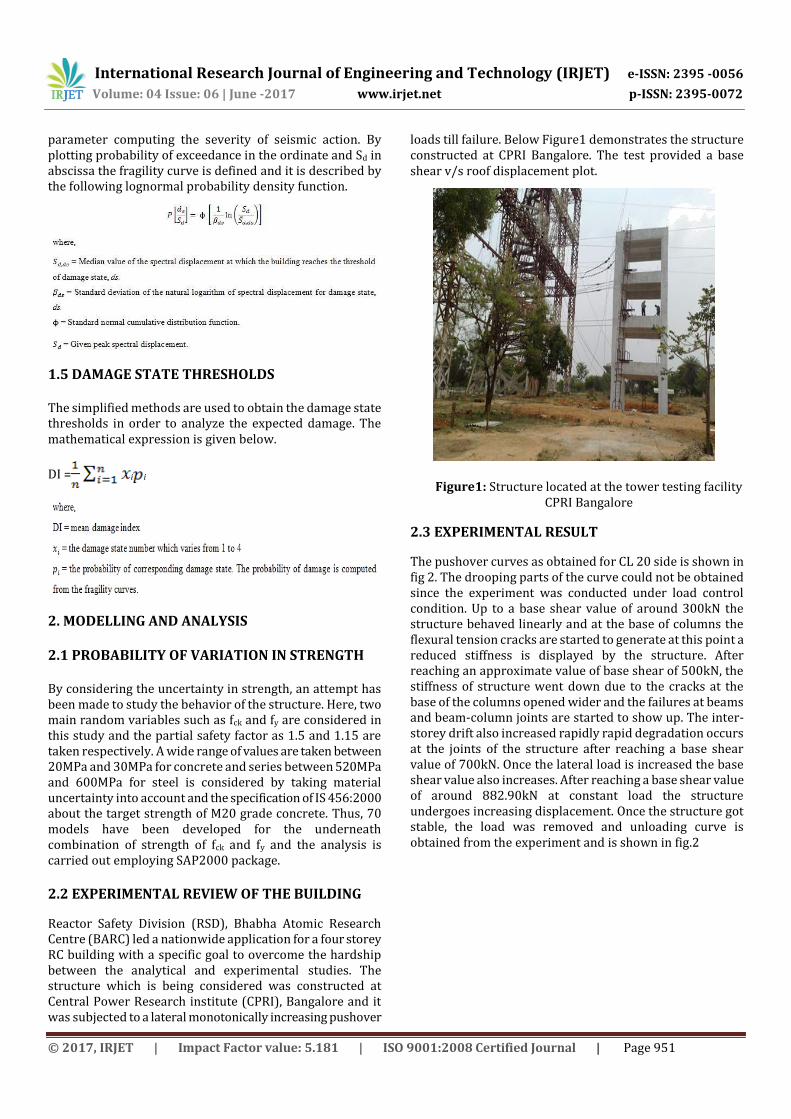
Reactor Safety Division (RSD), Bhabha Atomic Research Centre (BARC) led a nationwide application for a four storey RC building with a specific goal to overcome the hardship between the analytical and experimental studies. The structure which is being considered was constructed at Central Power Research institute (CPRI), Bangalore and it was subjected to a lateral monotonically increasing pushover
loads till failure. Below Figure1 demonstrates the structure constructed at CPRI Bangalore. The test provided a base shear v/s roof displacement plot.
Figure1: Structure located at the tower testing facility CPRI Bangalore
2.3 EXPERIMENTAL RESULT
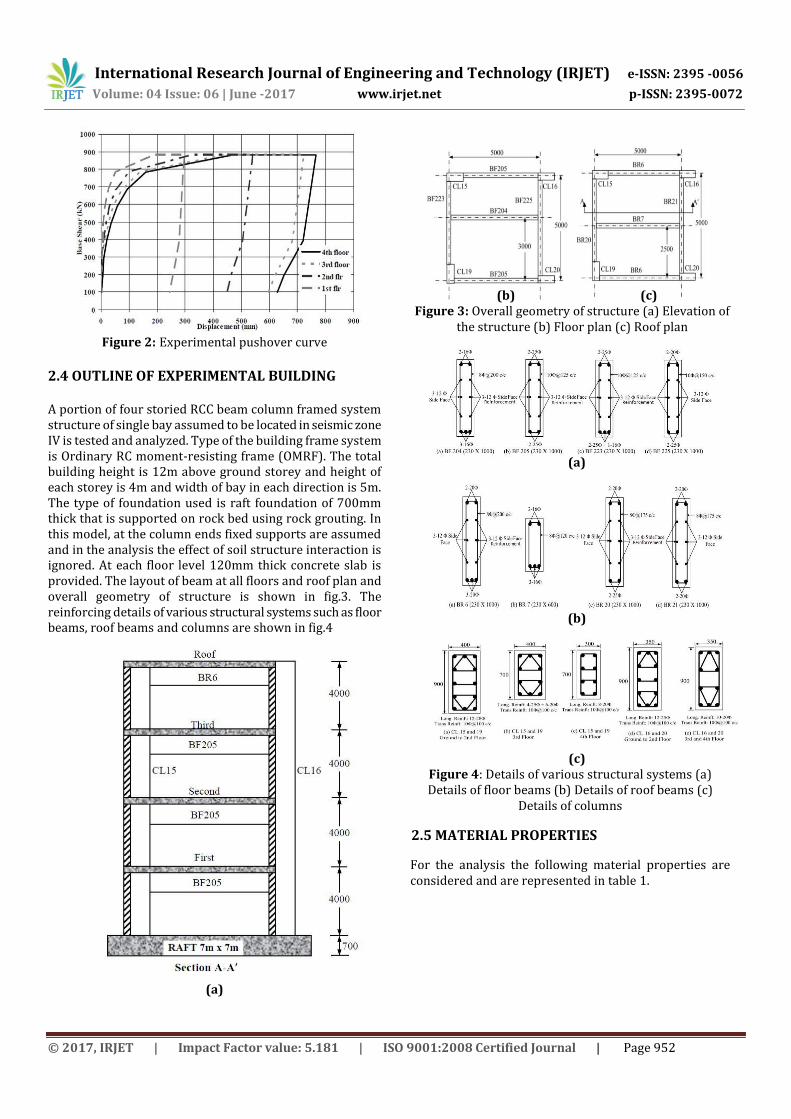
The pushover curves as obtained for CL 20 side is shown in fig 2. The drooping parts of the curve could not be obtained since the experiment was conducted under load control condition. Up to a base shear value of around 300kN the structure behaved linearly and at the base of columns the flexural tension cracks are started to generate at this point a reduced stiffness is displayed by the structure. After reaching an approximate value of base shear of 500kN, the stiffness of structure went down due to the cracks at the base of the columns opened wider and the failures at beams and beam-column joints are started to show up. The inter-storey drift also increased rapidly rapid degradation occurs at the joints of the structure after reaching a base shear value of 700kN. Once the lateral load is increased the base shear value also increases. After reaching a base shear value of around 882.90kN at constant load the structure undergoes increasing displacement. Once the structure got stable, the load was removed and unloading curve is obtained from the experiment and is shown in fig.2
International Research Journal of Engineering and Technology (IRJET) e-ISSN: 2395 -0056
Volume: 04 Issue: 06 | June -2017 www.irjet.net p-ISSN: 2395-0072
© 2017, IRJET | Impact Factor value: 5.181 | ISO 9001:2008 Certified Journal | Page 952
Figure 2: Experimental pushover curve
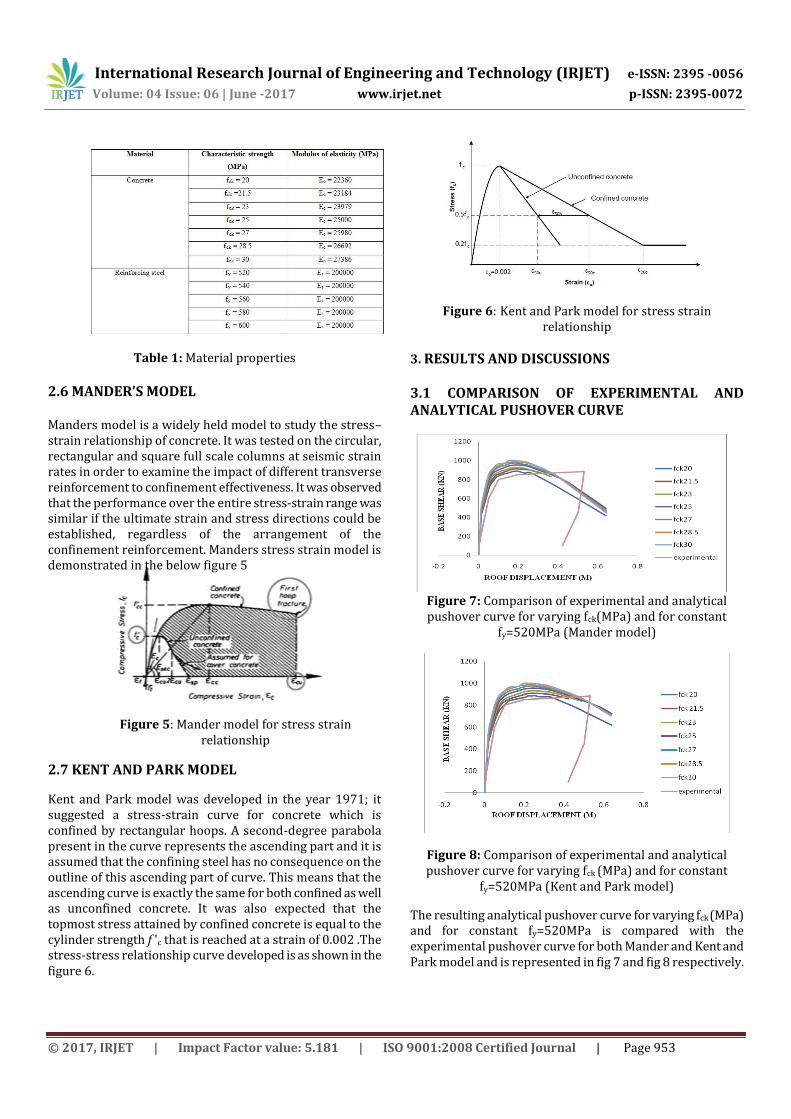
2.4 OUTLINE OF EXPERIMENTAL BUILDING A portion of four storied RCC beam column framed system structure of single bay assumed to be located in seismic zone IV is tested and analyzed. Type of the building frame system is Ordinary RC moment-resisting frame (OMRF). The total building height is 12m above ground storey and height of each storey is 4m and width of bay in each direction is 5m. The type of foundation used is raft foundation of 700mm thick that is supported on rock bed using rock grouting. In this model, at the column ends fixed supports are assumed and in the analysis the effect of soil structure interaction is ignored. At each floor level 120mm thick concrete slab is provided. The layout of beam at all floors and roof plan and overall geometry of structure is shown in fig.3. The reinforcing details of various structural systems such as floor beams, roof beams and columns are shown in fig.4
(a)
(b) (c) Figure 3: Overall geometry of structure (a) Elevation of
the structure (b) Floor plan (c) Roof plan
(a)
(b)
(c) Figure 4: Details of various structural systems (a) Details of floor beams (b) Details of roof beams (c)
Details of columns
2.5 MATERIAL PROPERTIES
For the analysis the following material properties are considered and are represented in table 1.
International Research Journal of Engineering and Technology (IRJET) e-ISSN: 2395 -0056
Volume: 04 Issue: 06 | June -2017 www.irjet.net p-ISSN: 2395-0072
© 2017, IRJET | Impact Factor value: 5.181 | ISO 9001:2008 Certified Journal | Page 953
Table 1: Material properties
2.6 MANDER’S MODEL Manders model is a widely held model to study the stress–strain relationship of concrete. It was tested on the circular, rectangular and square full scale columns at seismic strain rates in order to examine the impact of different transverse reinforcement to confinement effectiveness. It was observed that the performance over the entire stress-strain range was similar if the ultimate strain and stress directions could be established, regardless of the arrangement of the confinement reinforcement. Manders stress strain model is demonstrated in the below figure 5
Figure 5: Mander model for stress strain relationship
2.7 KENT AND PARK MODEL
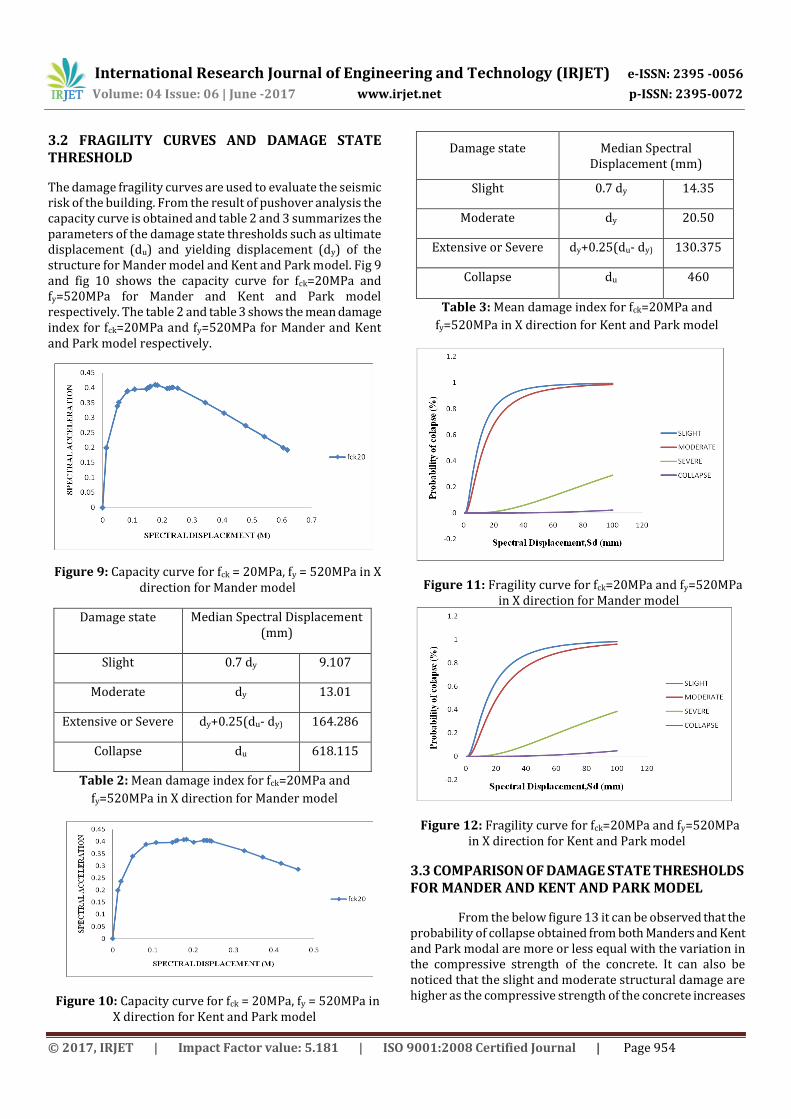
Kent and Park model was developed in the year 1971; it suggested a stress-strain curve for concrete which is confined by rectangular hoops. A second-degree parabola present in the curve represents the ascending part and it is assumed that the confining steel has no consequence on the outline of this ascending part of curve. This means that the ascending curve is exactly the same for both confined as well as unconfined concrete. It was also expected that the topmost stress attained by confined concrete is equal to the cylinder strength f 'c that is reached at a strain of 0.002 .The stress-stress relationship curve developed is as shown in the figure 6.
Figure 6: Kent and Park model for stress strain relationship
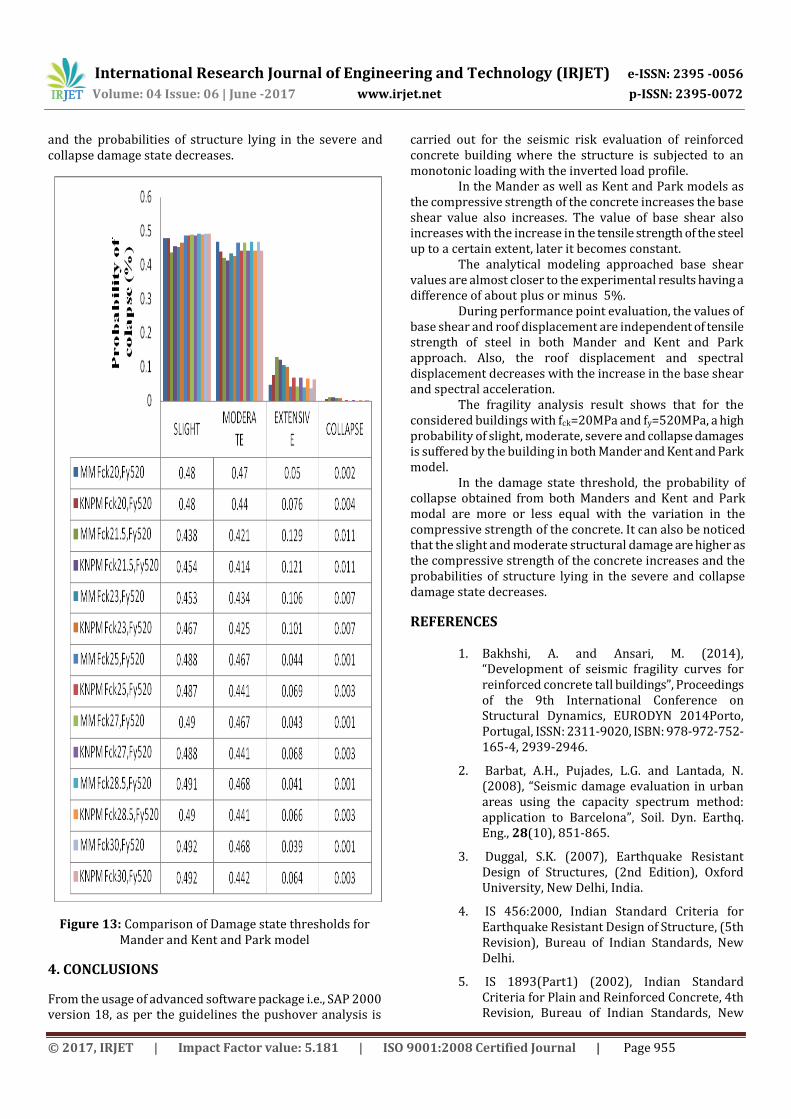
3. RESULTS AND DISCUSSIONS 3.1 COMPARISON OF EXPERIMENTAL AND ANALYTICAL PUSHOVER CURVE
Figure 7: Comparison of experimental and analytical pushover curve for varying fck(MPa) and for constant
fy=520MPa (Mander model)
Figure 8: Comparison of experimental and analytical pushover curve for varying fck (MPa) and for constant
fy=520MPa (Kent and Park model)
The resulting analytical pushover curve for varying fck (MPa) and for constant fy=520MPa is compared with the experimental pushover curve for both Mander and Kent and Park model and is represented in fig 7 and fig 8 respectively.
International Research Journal of Engineering and Technology (IRJET) e-ISSN: 2395 -0056
Volume: 04 Issue: 06 | June -2017 www.irjet.net p-ISSN: 2395-0072
© 2017, IRJET | Impact Factor value: 5.181 | ISO 9001:2008 Certified Journal | Page 954
3.2 FRAGILITY CURVES AND DAMAGE STATE THRESHOLD
The damage fragility curves are used to evaluate the seismic risk of the building. From the result of pushover analysis the capacity curve is obtained and table 2 and 3 summarizes the parameters of the damage state thresholds such as ultimate displacement (du) and yielding displacement (dy) of the structure for Mander model and Kent and Park model. Fig 9 and fig 10 shows the capacity curve for fck=20MPa and fy=520MPa for Mander and Kent and Park model respectively. The table 2 and table 3 shows the mean damage index for fck=20MPa and fy=520MPa for Mander and Kent and Park model respectively.
Figure 9: Capacity curve for fck = 20MPa, fy = 520MPa in X direction for Mander model
Damage state Median Spectral Displacement (mm)
Slight 0.7 dy 9.107
Moderate dy 13.01
Extensive or Severe dy+0.25(du- dy) 164.286
Collapse du 618.115
Table 2: Mean damage index for fck=20MPa and
fy=520MPa in X direction for Mander model
Figure 10: Capacity curve for fck = 20MPa, fy = 520MPa in X direction for Kent and Park model
Damage state Median Spectral Displacement (mm)
Slight 0.7 dy 14.35
Moderate dy 20.50
Extensive or Severe dy+0.25(du- dy) 130.375
Collapse du 460
Table 3: Mean damage index for fck=20MPa and
fy=520MPa in X direction for Kent and Park model
Figure 11: Fragility curve for fck=20MPa and fy=520MPa in X direction for Mander model
Figure 12: Fragility curve for fck=20MPa and fy=520MPa in X direction for Kent and Park model
3.3 COMPARISON OF DAMAGE STATE THRESHOLDS FOR MANDER AND KENT AND PARK MODEL
From the below figure 13 it can be observed that the probability of collapse obtained from both Manders and Kent and Park modal are more or less equal with the variation in the compressive strength of the concrete. It can also be noticed that the slight and moderate structural damage are higher as the compressive strength of the concrete increases
International Research Journal of Engineering and Technology (IRJET) e-ISSN: 2395 -0056
Volume: 04 Issue: 06 | June -2017 www.irjet.net p-ISSN: 2395-0072
© 2017, IRJET | Impact Factor value: 5.181 | ISO 9001:2008 Certified Journal | Page 955
and the probabilities of structure lying in the severe and collapse damage state decreases.
Figure 13: Comparison of Damage state thresholds for Mander and Kent and Park model
4. CONCLUSIONS
From the usage of advanced software package i.e., SAP 2000 version 18, as per the guidelines the pushover analysis is
carried out for the seismic risk evaluation of reinforced concrete building where the structure is subjected to an monotonic loading with the inverted load profile. In the Mander as well as Kent and Park models as the compressive strength of the concrete increases the base shear value also increases. The value of base shear also increases with the increase in the tensile strength of the steel up to a certain extent, later it becomes constant. The analytical modeling approached base shear values are almost closer to the experimental results having a difference of about plus or minus 5%. During performance point evaluation, the values of base shear and roof displacement are independent of tensile strength of steel in both Mander and Kent and Park approach. Also, the roof displacement and spectral displacement decreases with the increase in the base shear and spectral acceleration. The fragility analysis result shows that for the considered buildings with fck=20MPa and fy=520MPa, a high probability of slight, moderate, severe and collapse damages is suffered by the building in both Mander and Kent and Park model.
In the damage state threshold, the probability of collapse obtained from both Manders and Kent and Park modal are more or less equal with the variation in the compressive strength of the concrete. It can also be noticed that the slight and moderate structural damage are higher as the compressive strength of the concrete increases and the probabilities of structure lying in the severe and collapse damage state decreases.
REFERENCES
1. Bakhshi, A. and Ansari, M. (2014), “Development of seismic fragility curves for reinforced concrete tall buildings”, Proceedings of the 9th International Conference on Structural Dynamics, EURODYN 2014Porto, Portugal, ISSN: 2311-9020, ISBN: 978-972-752-165-4, 2939-2946.
2. Barbat, A.H., Pujades, L.G. and Lantada, N. (2008), “Seismic damage evaluation in urban areas using the capacity spectrum method: application to Barcelona”, Soil. Dyn. Earthq. Eng., 28(10), 851-865.
3. Duggal, S.K. (2007), Earthquake Resistant Design of Structures, (2nd Edition), Oxford University, New Delhi, India.
4. IS 456:2000, Indian Standard Criteria for Earthquake Resistant Design of Structure, (5th Revision), Bureau of Indian Standards, New Delhi.
5. IS 1893(Part1) (2002), Indian Standard Criteria for Plain and Reinforced Concrete, 4th Revision, Bureau of Indian Standards, New

International Research Journal of Engineering and Technology (IRJET) e-ISSN: 2395 -0056
Volume: 04 Issue: 06 | June -2017 www.irjet.net p-ISSN: 2395-0072
© 2017, IRJET | Impact Factor value: 5.181 | ISO 9001:2008 Certified Journal | Page 956
Delhi.
6. Khoshnoud, H.R. and Marsono, K. (2012), “Assessment of FEMA 356 nonlinear static procedure and modal pushover analysis for seismic evaluation of buildings”, Struct. Eng. Mech., 41(2), 243-262.
7. Krawinkler, H. and Seneviratna, G.D.P.K. (1998), “Pros and cons of a pushover analysis of seismic performance evaluation”, Eng. Struct., 20(4), 452-464.
8. Kumar, B.N., Gornale, A. and Mubashir, A. (2012), “Seismic performance evaluation of R c-Framed buildings-An approach to torsionally asymmetric buildings”, IOSR J. Eng., 2(7), 1-12.
9. Lee, Y.-J. and Moon, D.-S. (2014), “A new methodology of the development of seismic fragility curves”,Smart Struct. Syst., 14(5), 847-867.
10. Lu, D.G., Yu, X.H. and Jia, M.M. (2012), “Analytical formulations of fragility functions with applications to probabilistic seismic risk analysis”, Proceedings of the 15th World conference on Earthquake Engineering, Harbin, China.
11. Mander, J.B., Priestley, M.J. and Park, R. (1988), “Theoretical stress-strain model for confined concrete”, J. Struct. Eng., 114(8), 1804-1826.
12. Mehani, Y., Bechtoula, H., Kibboua, A. and Naili, M. (2013), “Assessment of seismic fragility curves for existing RC buildings in Algiers after the 2003 Boumerdes earthquake”, Struct. Eng. Mech., 46(6), 791-808.
13. Nasserasadi, K., Ghafory-Ashtiany, M., Eshghi, S. and Zolfaghari, M.R. (2009), “Developing seismic fragility function of structures by stochastic approach”, Asian J. Civ. Eng. (building and housing), 10(2), 183-200.
14. Pragalath D.C., H., Davis P., R., Sarkar, P. and Priyadharshini, M. (2014), “Seismic Reliability Assessment of RC Frame in a High Seismic Zone of India”, International Conference on Advances in Civil Engineering and Chemistry of Innovative Materials, Chennai, India
15. Ravi Kumar, C.M., Babu Narayan, K.S. and Venkat Reddy, D. (2014), “Probabilistic seismic risk evaluation of RC buildings”, Int. J. Res. Eng. Technol., 3(1), 484-495.
16. Reddiar, M.K.M. (2009), “Stress-strain model of unconfined and confined concrete and stress-block parameters”, Doctoral dissertation, Texas A&M University.
17. Robin Exercise For Analysis And Experiment On Full-scale Four-storied RCC Structure Under Monotonically Increasing Lateral (Pushover) Loads, Reactor Safety Division, BARC, Trombay, Mumbai and CPRI, New BEL Road, Bangalore.
18. Rohit, Bansal (2011), “Pushover Analysis of Reinforced Concrete Frame”, M.Tech thesis, Thappar University, Punjab, India.
19. SAP 2000 version 18 user manual
20. Unnithan, U.V., Prasad, A.M. and Rao, B.N. (2008), “Development of fragility curves using high dimensional model representation”, 14th World Conference on Earthquake Engineering, Beijing, China.
21. Vargas, Y.F., Barbat, A.H., Pujades, L.G. and Hurtado, J.E. (2013), “Probabilistic seismic risk evaluation of reinforced concrete buildings. structures and buildings”, Proceedings of the institution of civil engineering.
22. Vona, M. (2014), “Fragility curves of existing RC buildings based on specific structural performance levels”, Open J. Civ. Eng., 4, 120-134.CC
BIOGRAPHIES
Vinay T V is presently studying M.Tech (Computer Aided Design of Structures) in Sri Siddhartha Institute of Technology, Tumakuru, Karnataka. He received his B.E Degree in Civil Engineering from VTU during 2011-2015. His area of research includes Earthquake Resistant Design of Buildings.
Sowjanya G V is presently working as Assistant professor, Dept. of Civil Engineering at Sri Siddhartha Institute of Technology, Tumakuru, Karnataka. She obtained her M.Tech degree in CADS from VTU. Her area of research includes Earthquake Resistant Design of Buildings.
Gokul R is presently working as Structural Design Engineer, Bengaluru, Karnataka. He received his M.Tech degree in Computer Aided Design of structures from VTU during 2013-2015. His area of research interest includes Earthquake Resistant Design of Buildings.