Fracture Toughness Measurements on Igneous Rocks...
20
1 Fracture Toughness Measurements on Igneous Rocks Using a High Pressure, High Temperature Rock Fracture Mechanics Cell. M. R. Balme a * V. Rocchi b C. Jones c P. R. Sammonds b P. G. Meredith b S. Boon b a Mineral, Ice & Rock Physics Laboratory & Regional Planetary Image Facility, Department of Geological Sciences, University College London, Gower Street, London, WC1E 6BT, UK. Now at Planetary Geology Group, Department of Geological Sciences, Arizona State University, PO Box 871404, Tempe, AZ 85287-1404, USA b Mineral, Ice & Rock Physics Laboratory, Department of Geological Sciences, University College London, Gower Street, London, WC1E 6BT, UK. c Department of Petroleum Engineering, Herriot-Watt University, Edinburgh, EH14 4AS, UK *Corresponding Author. Tel.: +01 480 965 7029 fax: +01 480 965 8102 Email [email protected]. ABSTRACT A sound knowledge of mechanical properties of rocks at high temperatures and pressures is essential for modelling volcanological problems such as fracture of lava flows and dike emplacement. In particular, fracture toughness is a scale invariant material property of a rock that describes its resistance to tensile failure. A new fracture mechanics apparatus has been constructed enabling fracture toughness measurements on large (60mm diameter) rock core samples at temperatures up to 750°C and pressures up to 50 MPa. We present a full description of this apparatus and, by plotting fracture resistance as a function of crack length, show that the size of the samples is sufficient for reliable fracture toughness measurements. A series of tests on Icelandic, Vesuvian and Etnean basalts at temperatures from 30-600 o C and confining pressures up to 30 MPa gave fracture toughness values between 1.4 and 3.8 MPam 1/2 . The Icelandic basalt is the strongest material and the Etnean material sampled from the surface crust of a lava flow the weakest. Increasing temperature does not greatly affect the fracture toughness of the Etnean or Vesuvian material but the Icelandic samples showed a marked increase in toughness at around 150 o C, followed by a return to ambient toughness levels. This material also became tougher under moderate confining pressure but the other two materials showed little change in toughness. We describe in terms of fracture mechanics probable causes for the changes in fracture toughness and compare our experimental results with values obtained from dike propagation modelling found in the literature.
Transcript of Fracture Toughness Measurements on Igneous Rocks...
1
Fracture Toughness Measurements on Igneous Rocks Using a High Pressure, High Temperature Rock Fracture Mechanics Cell. M. R. Balmea* V. Rocchib C. Jonesc P. R. Sammondsb P. G. Meredithb S. Boonb
a Mineral, Ice & Rock Physics Laboratory & Regional Planetary Image Facility, Department of Geological Sciences, University College London, Gower Street, London, WC1E 6BT, UK. Now at Planetary Geology Group, Department of Geological Sciences, Arizona State University, PO Box 871404, Tempe, AZ 85287-1404, USA
b Mineral, Ice & Rock Physics Laboratory, Department of Geological Sciences, University College London, Gower Street, London, WC1E 6BT, UK.
c Department of Petroleum Engineering, Herriot-Watt University, Edinburgh, EH14 4AS, UK
*Corresponding Author. Tel.: +01 480 965 7029 fax: +01 480 965 8102 Email [email protected]. ABSTRACT A sound knowledge of mechanical properties of rocks at high temperatures and pressures is essential for modelling volcanological problems such as fracture of lava flows and dike emplacement. In particular, fracture toughness is a scale invariant material property of a rock that describes its resistance to tensile failure. A new fracture mechanics apparatus has been constructed enabling fracture toughness measurements on large (60mm diameter) rock core samples at temperatures up to 750°C and pressures up to 50 MPa. We present a full description of this apparatus and, by plotting fracture resistance as a function of crack length, show that the size of the samples is sufficient for reliable fracture toughness measurements. A series of tests on Icelandic, Vesuvian and Etnean basalts at temperatures from 30-600oC and confining pressures up to 30 MPa gave fracture toughness values between 1.4 and 3.8 MPam1/2. The Icelandic basalt is the strongest material and the Etnean material sampled from the surface crust of a lava flow the weakest. Increasing temperature does not greatly affect the fracture toughness of the Etnean or Vesuvian material but the Icelandic samples showed a marked increase in toughness at around 150oC, followed by a return to ambient toughness levels. This material also became tougher under moderate confining pressure but the other two materials showed little change in toughness. We describe in terms of fracture mechanics probable causes for the changes in fracture toughness and compare our experimental results with values obtained from dike propagation modelling found in the literature.
2
1). INTRODUCTION A secure knowledge of the geophysical properties of rocks under crustal
temperatures and pressures is vital to the understanding of fracture processes at all scales: from the failure of the crust of a moving lava flow to deep fractures in the crust of a terrestrial planet. The mechanical properties of crystal-glass silicates of volcanic origin under high temperature and low-pressure conditions have not been sufficiently investigated (Ryan & Sammis, 1981) for modelling of volcanological processes. The need for such data remains and is becoming essential as the importance of brittle failure of volcanic rocks at high temperatures both at surface levels (fracturing of lava flows) and at magmatic levels (fracturing of the country rock surrounding the magma chamber) becomes widely recognised (Blake and Bruno, 2000; Kilburn, 1993; 1996, Shaw, 1980).
Although rock mechanics tests have been carried out for many years, they have focused mainly on the compressive strengths of rocks under different conditions. The tensile behaviour of rock is more difficult to constrain because specimen size influences the measurements obtained; larger samples are weaker because they contain larger flaws. The intrinsic resistance to fracture of a rock (fracture toughness), however, is a material property that is independent of scale, at least for macroscopic specimens and whilst it is difficult to measure accurately, can be reliably applied to a problem of any size given that the same material is present.
The experimental study of fracture toughness has been extensive in materials science, for the study of stress response in metals, ceramics or concrete. Measurements of fracture toughness on volcanic rocks remain relatively unexplored especially under simulated volcanic conditions. The last significant contribution to the experimental study of fracture toughness at high temperatures and low-pressure conditions has been that of Meredith and Atkinson (1985) who measured the fracture toughness of quartz, black gabbro and Westerly granite over the temperature range 20-400oC. There exist more data on fracture toughness of rocks at pressures up to 100 MPa than at high temperatures. Limestone, sandstone and granite have all been investigated in the last 30 years (see table 11.5, Atkinson and Meredith, 1987) although few of these experiments were performed using the sample configurations recommended by the International Society for Rock Mechanics (ISRM, 1988). The need for data pertaining to extrusive igneous rocks at high pressure and temperature is still present.
In an attempt to advance analysis of geophysical problems, we have constructed a deformation apparatus that can accurately measure fracture toughness at temperatures and pressures that simulate a wide variety of terrestrial and planetary conditions. Specifically, this apparatus is an important advance in experimental rock physics due to its flexible design: not only can it measure fracture toughness, tensile strength and Young’s Modulus of rocks at high temperatures and pressure but has been modified to determine compressive strength and Young’s Modulus (Rocchi et al. this issue). This flexibility is further demonstrated by the fact that this apparatus can utilise either gas or liquid as confining medium in order to simulate undersea conditions, fluid saturated rock, dense gaseous atmospheres (e.g. Venus) or to investigate the effects of active and inert chemical species on fracture.
The method and results presented here are from the first two investigations to use this apparatus. The first was a study on the fracture toughness of Icelandic basalt,

3
the second a study of the fracture mechanics of igneous rocks from Etnean and Vesuvian lava flows. Results from compression testing are given in the companion paper, Rocchi et al. (this issue). 2). FRACTURE TOUGHNESS MEASUREMENT OF ROCKS
The fracture resistance properties of rock are generally described by the critical values of parameters such as potential energy release rate, G, contour integral, J, and fracture energy, Gf. The experimental material property most commonly used is KIc, the critical value of the mode one stress intensity factor or ‘plane strain fracture toughness’ (Atkinson, 1987). The subscript ‘c’ for KIc denotes ‘corrected’ for specimen size (sometimes called ‘Level II’ testing). It was observed in early core-based experiments (Barker, 1977) that fracture toughness depended upon specimen size. Barker (1977, 1979) suggested that this effect is caused by a non-negligible zone of microcracking at the crack tip and developed a correction procedure in terms of a calculated ‘plasticity’ in the sample. This method allows the fracture toughness of the material, rather than the specimen to be measured and is used in the International Society of Rock Mechanics (ISRM, 1988) suggested methods for measuring fracture toughness of rocks.
The use of core-based samples with standard sample configurations for fracture toughness testing simplifies preparation procedure and allows previously calculated stress intensity factors to be applied (Ouchterlony, 1990, Matsuki et al., 1991a). The apparatus described here makes use of the short-rod (SR) specimen, one of the standard rock fracture toughness testing geometries (Ouchterlony, 1989) put forward by the ISRM, (1988). Because the studies for which this apparatus is intended require a variety of confining mediums at high temperatures and pressures, existing fracture toughness testing equipment such as those of Meredith and Atkinson (1985), Hashida et al. (1993), Duclos and Paquet, (1991) etc. are unsuitable because they cannot accommodate changes in both temperature and pressure, employ non-ISRM standard geometries or are restricted to one type of confining medium. 3). THE FRACTURE MECHANICS CELL 3.1. Design parameters
As the apparatus was constructed with the aim of performing rock mechanics tests under a variety of challenging planetary conditions, ambitious operating parameters were enforced early in the design process. The final criteria set for the apparatus were that the fracture toughness measurements should be made using rock core samples of a standard ISRM geometry at pressures up to 50 MPa and temperatures to 750oC, with the possibility of extending to higher temperature. The confining medium would be water, gas or brine so complete corrosion resistant was needed. Furthermore, the fracture toughness testing methodology had to include plasticity corrected or ‘level II’ (ISRM, 1988) tests for accuracy, requiring that crack mouth opening displacement (CMOD) be monitored to micron resolution. Because gas was to be used as confining medium, difficult design problems involving pumping, sealing, convection and, above all, safety had to be overcome. Many of the details of design described below apply to both the tension and compression testing versions of the apparatus. Specific details for the fracture mechanics tests are described here whilst details for the compression testing configuration are given in Rocchi et al. (this issue).

4
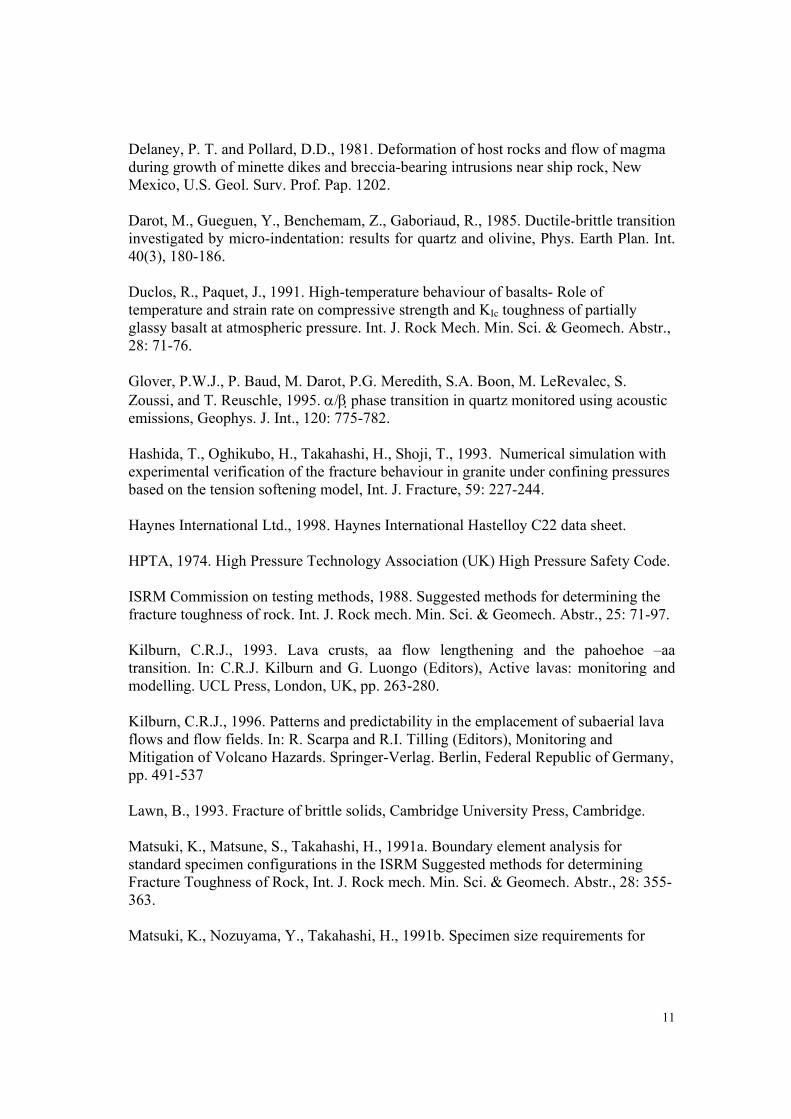
3.2. Apparatus overview The key element of the apparatus is an environmental cell (Fig. 1a) designed to
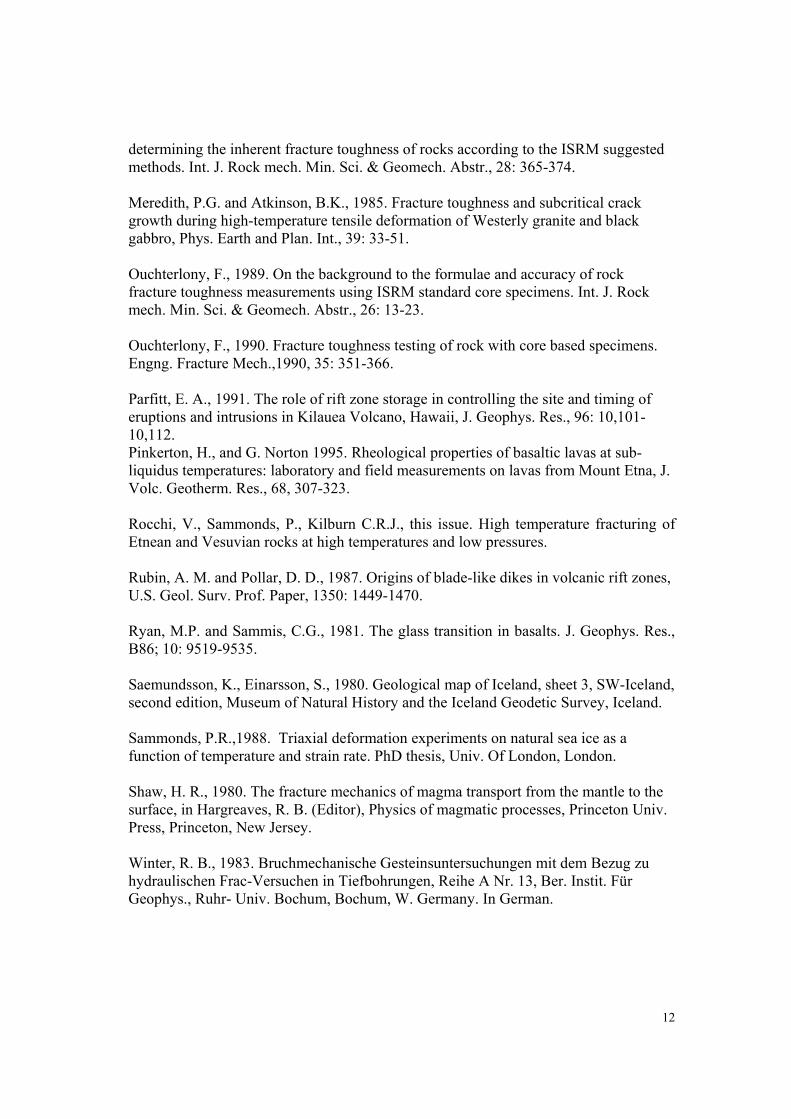
use 60 mm diameter ISRM standard short-rod samples, although, if sample material is limited, the sample size can be reduced to 40 mm diameter. The specimen is located over two machined knife edges at the top of a split cylindrical housing, which is forced apart by a small internal hydraulic actuator (Fig. 1b). A displacement transducer measures the transverse movement of the knife-edges. This sensor is resistant to corrosion and can operate at sample temperatures up to 750oC and pressure up to 70 MPa. Fig. 2 is a photograph of the actuator housing and the raised environmental cell.
A gas booster-pump or direct bottle pressure provides the gas confining pressure whilst a simple pneumatically powered liquid pump provides liquid (oil, water or brine) confining pressure. For safety reasons, the pressure vessel is shielded within a thick aluminium alloy cubicle whilst the rest of the system is boxed in with steel plate. The pressure in the actuator is controlled using a servo-controlled intensifier, which can be operated under either displacement or pressure control. All the various sensor outputs are logged using LabView software running on a PC. 3.3. Pressure vessel specifications
The pressure vessel has an internal diameter of 96 mm and an external diameter of 160mm and therefore easily contains a 60 mm sample together with the required heating elements. It is constructed from Hastelloy C22 alloy (supplied by Haynes International, Manchester, England), a nickel alloy developed by the US Navy with excellent corrosion resistance and which retains high mechanical strength at high temperatures (Haynes International Ltd., 1998).
As gas was to be used as confining medium, safety was of prime importance in the design of this apparatus. Using the High Pressure Technology Association (HPTA) High Pressure Safety Code (HPTA, 1974) the ductile working limit of the vessel was deemed to be greater than 50 MPa for temperatures up to 1000oC. Calculations using the method of Sammonds (1988) showed the vessel to also be resistant to catastrophic brittle failure when using gas as confining medium.
To assess the level of protection required for non-catastrophic failure when using high-pressure gas, HPTA guidelines for barricade thickness were applied. The barricade constructed would resist penetration by both a slower, massive object such as an end-closure and a faster, smaller projectile such as a length of tubing or a valve. 3.4. Force transfer system For short rod fracture toughness measurements, the sample must be stressed perpendicular to the core axis (ISRM, 1988). In the experiments described here the sample is held under pressure and thus a load cell such as that described in ISRM (1988) cannot be used. The force transfer system has to operate ‘in-situ’ somehow without recourse to an external load that must penetrate the pressure vessel. The opening tensile force is therefore built-up using an internal actuator inside a split housing which forces apart the sample. The force is transferred to the sample by precision-machined knife-edges at the top of each half of the housing which seat in a groove in the sample. A sketch of the force transfer system is shown in the Fig. 1b. As pressure builds up in the actuator the top knife-edges are forced apart loading the

5
sample in tension. Simultaneously, the bottom knife-edges are forced into the sharp corners of the saddle, causing the apparatus to seat in a repeatable fashion. Also situated in this part of the apparatus are the inductive displacement transducer (IDT) used to measure the crack-mouth opening displacement and several thermocouples. Fig. 2 is a photograph of the force transfer system with the pressure vessel raised. Note the Linear Variable Displacement Transducers (LVDTs) and the aluminium sample of known stiffness used for calibration.
The pressure in the actuator is controlled using a servo-controlled intensifier. This adjusts the pressure in the actuator by constantly monitoring the feedback from the displacement pressure transducer and moving a piston until the set pressure is matched. The set point is controlled using a simple ramp-generator or directly by the operator using a dial on the front panel of the servo-controller, the loading rate used being calculated from the ISRM suggested methods (Equation 18, ISRM, 1988). The control for level II tests on brittle materials (such as basalt) is greatest when the pressure is controlled directly by the operator. 3.5. Heating system
The heating system comprises a stand-alone heater consisting of two coiled heating elements wrapped in insulation attached to the upper closure of the cell and can be replaced entirely when the apparatus is being used for compressive rock strength tests. The use of upper and lower coils allows control of thermal gradients in the vessel.
The temperature of the sample is controlled using Eurotherm 2408 and 2208 proportional power controllers. The operation of each channel is independent although the controllers can be linked such that one is slaved to the other. When no confining pressure is applied, this system can heat a sample to over 750oC with less than 15oC temperature difference across the height of the specimen and hold the temperature stable to within 1-2oC. If high-pressure gas is used as confining medium, larger thermal gradients can occur although with equilibration time of a few tens of minutes to a few hours they can be reduced to around 30oC across the sample.
4). SAMPLE DESCRIPTION The three basaltic samples used in these experiments were collected from: 1) an unweathered lava flow less than 0.7 Ma old (Saedmundsson and Einarsson, 1980) in Iceland, 2) the 1834 Vesuvian flow and, 3) the 1983 Etnean flow. The Icelandic samples are from a jointed flow 5-10 m thick in a large quarry in an area called Seljaldur, 20-30 km East of Reykjavik. The Vesuvian samples are from the Terzigno quarry 6 km SE of Mt. Vesuvius crater and the Etnean samples are from the 1983 eruption flow, 4 km SSW of the south-east crater. A summary of the mineralogy, grain size and glass/crystal ratio is given in table 1 and the bulk chemistry in table 2, although all of the samples are essentially basaltic. All samples were extracted as cores from large blocks collected in the field and show almost no inter-sample variability in texture or mineralogy.
The Icelandic samples are exceptionally homogenous without any large (> 0.5 mm) phenocrysts and the texture is essentially microcrystalline with very small grains (most grains < 100 µm). The samples have ~2 % porosity and a density of 2.95 +/- 0.02 gcm-3. The silicate content, determined using electron backscatter, was 46.8% +/- 0.7%.

6
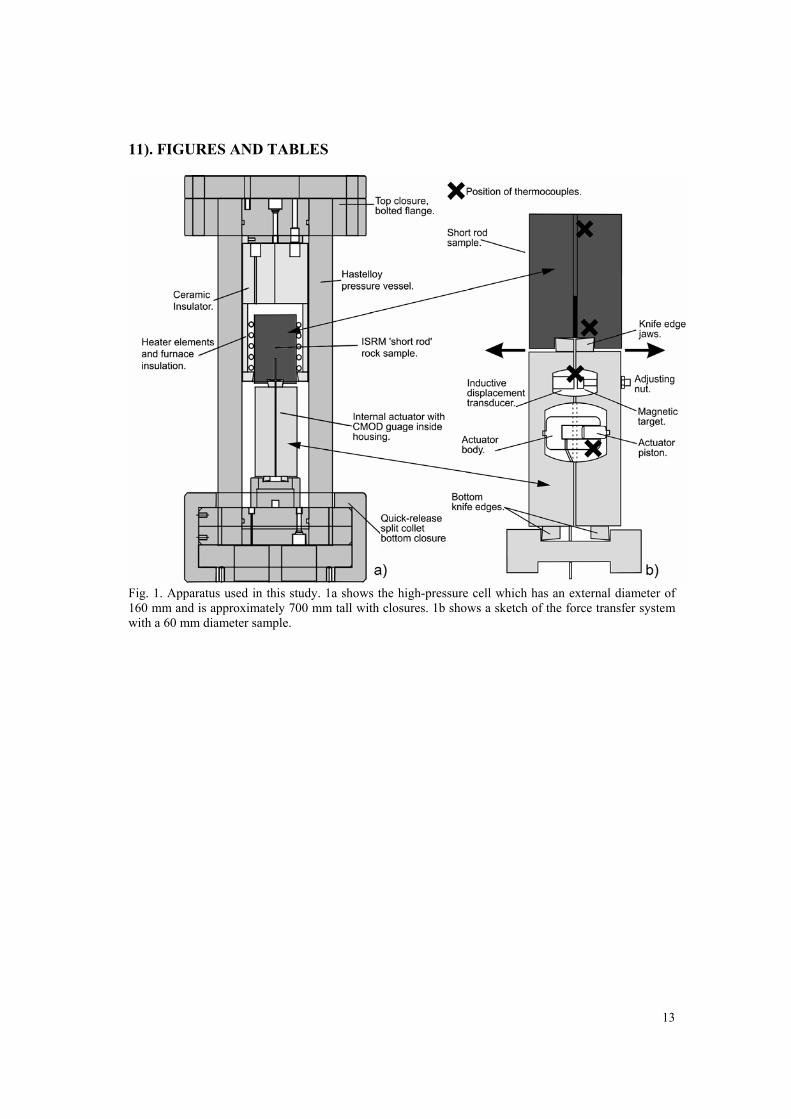
The Vesuvian samples are porphyritic with 20% phenocrysts between 0.1-3 mm in size, and 80% glassy/cryptocrystalline groundmass. These samples have approximately 48% SiO2 content and ~8% porosity with a density of ~ 2.70gcm-3. In the case of the Etnean rocks, both the core and the crust of the flow were collected in order to test the mechanical differences between the more porous, glass-rich crust and the denser, more crystallised core. Both the crustal and core samples from Etna contain large phenocrysts within a glassy matrix. However, the Etna core samples contain 40% glass and had ~9% porosity, compared to the 60% glass content and ~10% porosity of the crustal samples. The Etnean crust samples have a density of ~ 2.40gcm-3 and the Etnean core samples a density of ~ 2.70gcm-3. Both show higher glass content than the Vesuvian samples. The Vesuvian and Etnean samples are described in more depth in Rocchi et al. (this issue). 5). EXPERIMENTAL METHOD As heating of rocks induces differential and anisotropic expansion of minerals within the matrix, high temperature tests can induce a population of microcracks in a sample that effect the measurement of physical properties. Material with a temperature of 600oC in the crust of a cooling lava flow, for example, would have different mechanical properties than a laboratory sample with the same composition that had cooled to room temperature and been reheated to 600oC, due to the excess microcracking caused by the additional cool-reheat cycle. Thus if we make a series of toughness tests at different temperatures we cannot be sure whether we are measuring the effects of temperature per se or the effects of additional microcracks caused by heating. Therefore, some of the samples were heat treated prior to testing to differentiate between the effects of high temperature (as may be found in nature) and thermal cracking induced by heating (as would occur in an artificial test). Heat-treating was performed at 600oC for the Icelandic samples and 750oC for the Etnean and Vesuvian samples, the temperature depending on the range at which maximum damage was introduced (as there is little further damage induced by continued heating of a sample past a certain temperature). Heating and cooling rate were limited to 1oC/minute and the samples were dried at 90oC for 24 hours prior to testing to eliminate moisture. The samples were carefully loaded onto the metal knife edges of the actuator housing and a small bias load applied to hold them in place. The pressure vessel was then lowered over the sample set-up and sealed. Heating of the samples was limited to 10oC/min to avoid differential stresses in the apparatus. The actual testing was performed in accordance with the ISRM testing guidelines (ISRM, 1988) and, after failure, the apparatus was allowed to cool before the samples were recovered. An example of a typical force/CMOD curve is shown in fig. 3. 6). RESULTS
Two types of fracture toughness measurement can be made with this apparatus: level I (simple and fast tests used for screening) and level II (corrected for specimen size ‘plasticity’ variations). Level I tests only require the applied force at failure to be measured, whilst CMOD must be monitored (at least in the differential sense) for level II tests (ISRM, 1988). Results quoted here are all from level II tests.

7
In order to assess the validity of the level II results, and to check that the sample diameter was sufficient for scale invariant measurements, repeated loading/unloading cycles before and after the evaluation point were used so that the method of Matsuki et al (1991b) could be applied to investigate the specimen size dependence of the material. This was achieved by plotting ‘fracture resistance’(Ouchterlony, 1989, Matsuki et al, 1991b) as a function of crack length (fracture resistance is essentially the ‘plasticity’ corrected fracture toughness calculated as a function of crack length). The fracture resistance can be said to be equivalent to the material fracture toughness only when (and if) it reaches a plateau. This was shown to be the case for the fracture resistance of example Icelandic basalt samples (Fig. 4), which reaches a clear plateau value. If no plateau value were reached this would imply the sample was too small and that the level II tests would have been specimen size dependent. The data from Fig. 4 are consistent with a plateau value of approximately 2.0 MPam1/2, which is similar to the values obtained using the standard level II ISRM methods and show that the level II tests are not limited by specimen size.
Table 3 shows all results for fracture toughness from these first experimental programs. The data are plotted with respect to temperature (at one atmosphere pressure) and pressure (at room temperature) in Figs. 5 and 6 respectively. Table 4 shows only those results from tests performed at nominal Earth ambient conditions. 7). DISCUSSION 7.1. Overview The fracture toughness of the Icelandic basalt is greatest (~2.4 MPam1/2 at standard temperature and pressure; STP) and is similar to the Etnean core material (~ 2.2 MPam1/2 at STP). The Vesuvian material has a fracture toughness of 1.5-1.8 MPam1/2 at STP and the Etnean crust material is weakest at 1.3-1.45 MPam1/2 at STP. It is unsurprising that the Etnean crust material is weakest as it would have experienced the greatest cooling rate and contains many pre-existing cooling microcracks and other small-scale deleterious flaws. It also has the highest porosity of the samples tested. The results of this study agree with those of Brown and Reddish (1997) who suggest that for a population of different homogenous, isotropic rocks, those with the greatest density also have the greatest values of fracture toughness. However, whether this is due to the increased presence of voids and microcracks or the presence of denser mineral phases is unknown.
The effect of grain size in our results is also difficult to assess due to the differing mineralogy and porosity in our samples. The microcrystalline Icelandic sample appears most resistant to fracture, possibly because grain size is so small. However, the Etnean core samples are almost as tough and yet the grain size of these samples is almost an order of magnitude higher. Grain size appears not to have a dominant effect on fracture toughness although, as described in 7.3 and 7.4, it may play a key role in the pressure and temperature dependence.
The difference in fracture toughness between the rock samples may more likely be a function of the mineralogy. The Etnean and Icelandic basalt samples contain >60% plagioclase feldspar and <15% olivine. The Vesuvian material consists of ~40% olivine and ~5% plagioclase feldspar. Although data on thermodynamic surface energy is sparse, there are more data pertaining to fracture surface energy. Feldspar minerals

8
appear to have of the order of 3-5 times the fracture surface energy of olivine (Table 11.1 of Atkinson and Meredith, 1987) which may explain the greater strength of the more feldspar rich Etnean (core) and Icelandic samples.
Whether this is due to a higher plasticity in feldspar fracture mechanisms or intrinsically higher surface energy is difficult to ascertain but this simple comparison shows that the mineralogy provides a starting point for comparing fracture toughness data of rocks. 7.2. Temperature dependence of fracture toughness The untreated materials were expected to be initially tough and to strengthen further as temperature increase led to thermally induced microcracks ‘blunting’ the crack tip and increasing “plastic” energy dissipation in the propagation zone. This behaviour is shown schematically in Fig. 7, in Region 1, curve A. Further heating was expected to cause more microcracking and a marked decrease in toughness due to crack linkage (Region 2) until the elastic/plastic transition was approached and the crack propagation mechanism changed to ‘tearing’ (Region 3). We did not expect to approach this temperature in our tests.
The treated materials were expected to be initially weaker and to decrease steadily in toughness with temperature throughout Region 1 and 2 (because the surface energy of a material decreases with temperature, Darot et al, 1985) until plasticity effects changed the nature of the failure as the elastic/plastic transition was approached (Fig. 7, curve C). In effect the heat treatment ‘chops off’ the top of curve A and replaces it with a straight line, allowing the temperature effects to be measured independent of the thermal cracking effects.
Surprisingly, the heat-treated Vesuvian material had a higher fracture toughness than the untreated material for all temperatures. This suggests that the population of microcracks induced by heating acts to arrest crack advance but was insufficiently deleterious to allow crack linkage to weaken the material. In essence, the heat treatment temperature was insufficient to cross the peak of curve A in Fig. 7. That the toughness of the untreated material was lower than the treated even when tested at high temperatures suggests that repeated heating cycles (e.g. at the beginning of the high temperature tests) further strengthened the sample, effectively shifting curve A upwards. This hypothesis is reinforced by the observation that the weakest of all the Vesuvian samples was the unheated specimen tested at room temperature. Further experiments should use material treated at higher temperatures to remove this effect.
The simple observation that there is little change in fracture toughness with temperature for the Etnean or Vesuvian samples over the 100-600oC range implies that the toughening effect of heat treatment occurs at low (30-100oC) temperature and further temperature increases do not significantly reduce toughness. This can be interpreted in Fig.7, curve A as a very steep initial rise and a long broad peak.
The Icelandic material (all of which was heat treated), however, shows an interesting increase in fracture toughness at 150oC but little change from the ambient value for higher temperatures. The toughness jump at 150oC has also been observed in gabbro (Meredith and Atkinson, 1985) and has been attributed to microcrack closure due to thermal expansion. This would tend to suppress linkage of existing microcracks thus toughening the material. At higher temperatures, differential expansion between
9
the minerals reopens the cracks and reduces the toughness once again. This effect has also been observed in the permeability of granite at increasing temperatures (Glover et al.1995). For this mechanism to operate, the heat treatment must have created sufficient cracks in the material for subsequent heating to have no effect on the crack population. This behaviour is shown schematically in Fig. 7, curve B. That this ‘crack closure toughening’ is not observed in the other two samples is probably due to the larger grain size and again implies that further heat treatment was required to obtain a steady microcrack population.
Future testing should address the behaviour of these materials at the highest temperatures at which they display brittle behaviour. Theoretically, the toughness should decrease until plasticity occurs because the surface energy of the constituent minerals will decrease with temperature (Darot et al., 1985), allowing fracture at lower stress intensities. This behaviour was observed in gabbro after the 150oC peak by Meredith and Atkinson (1985) but no such decrease has been observed in either the Icelandic or Vesuvian samples tested here. 7.4 Pressure dependence of fracture toughness
The toughness of the Vesuvian and Etnean material are essentially independent of confining pressures, unlike that of the Icelandic basalt which jumps ~40% when even a moderate 5MPa pressure is used. Further pressure increases do not substantially change the toughness. Other authors have discovered similar increases in fracture toughness with pressure (see Table 11.4 of Atkinson and Meredith, 1987) but most find a more linear increase with pressure rather than a plateau (although the sandstone tests of Winter (1983) also show a plateau for fracture toughness when confining pressure reaches 60-100 MPa). The pressure strengthening of rock may be due to crack closure of naturally occurring or thermally induced microcracks which suppresses crack linkage. Even though this mechanism can only be valid for Icelandic basalt at such low pressures if the crack aspect ratio of the microcracks is very small (see equation 1 of Rocchi et al., this issue), the small particle size and close packing of the crystals in the matrix does tend to support this hypothesis. The pressure invariance of the more coarsely grained samples is consistent with the theory. 8). CONCLUSIONS
The apparatus described in this paper is consistent with the standard short-rod sample geometry as defined by ISRM (1988) yet can measure fracture toughness at pressures up to 50 MPa and temperatures up to 750oC. Both gases and liquids can be used, thus giving the apparatus the ability to simulate a variety of planetary environments. The apparatus is of safe design and capable of operating beyond the initial design parameters.
Over 50 fracture toughness tests using four different test materials at a variety of temperatures and pressures have been performed. We conclude from these experiments that the dense and more finely textured, less porous materials such as Icelandic basalt are more resistant to fracture and exhibit more complex variations of fracture toughness with temperature and pressure. The Vesuvian and Etnean materials change little in fracture toughness with temperature and pressure and thus simple ambient conditions tests can be applied to more extreme conditions for the purpose of

10
modelling failure in flow fronts, lava crusts, dike propagation etc. It is important to note that the pressure strengthening of fine-grained samples occurs at lower pressures than coarse material. This may be an important empirical relationship of use in field evaluation of stresses required to propagate dikes or sills. It is also worth noting that, at pressures consistent with depth up to a few kilometres, there is no evidence to suggest that fracture toughness will reach 100 MPam1/2 or even 30 MPam1/2, values of fracture toughness more commonly associated with steel (Lawn, 1993), as suggested by some models for dike emplacement (Rubin and Pollard, 1987; Parfitt, 1991; Delaney and Pollard, 1981). It also seems likely that the effects of heating by magma will weaken the rocks by thermal cracking over the competing action of pressure strengthening. Further experiments at the highest extents of temperature at which brittle failure occurs are necessary to constrain this behaviour. 9). ACKNOWLEDGMENTS
The apparatus was funded through a UK NERC BRIDGE project led by Professor Stan Murrell and the EU Flow project. Technical support was provided by John Bowles and Neil Hughes. M. Balme was funded by a NERC research studentship, V. Rocchi was funded by the UCL graduate school and P. Sammonds by the Royal Society as a University Research Fellow. We would also like to thank Prof. Claudio Vita-Finzi for helpful discussion. 10). REFERENCES Atkinson, B.K., 1987. Introduction to fracture mechanics and its geophysical implications, In Atkinson, B. K., (Editor.) Fracture Mechanics of Rock, Academic Press, London: pp 1-26. Barker, L.M., 1977. Measurements using short rod specimens- the elastic plastic case, Terra Tek Report 77-91R, Salt Lake City, Utah. Barker, L.M., 1979.Theory for determining KIc from small, non-LEFM specimens, supported by experiments on aluminum, Int. J. Fracture, 15: 515. Belkin, H.E., C.R.J. Kilburn, and B. de Vivo, 1993. Sampling and major element chemistry of the recent (A.D. 1631–1944) Vesuvius activity, J. Volc. Geotherm. Res., 58, 273-290. Brown, G. J. and Reddish, D. J., 1997. Experimental relations between rock fracture toughness and density, Int J. Rock Mech. Min. Sci., 34: 153-155. Atkinson, B.K. and Meredith, P. G., 1987. Experimental fracture mechanics data for rocks and minerals, In Atkinson, B. K., (Editor.) Fracture Mechanics of Rock, Academic Press, London: pp 477-525. Blake, S and Bruno, B.C., 2000. Modelling the emplacement of compound lava flows. Earth Planet. Sci. Lett., 184: 181-197.
11
Delaney, P. T. and Pollard, D.D., 1981. Deformation of host rocks and flow of magma during growth of minette dikes and breccia-bearing intrusions near ship rock, New Mexico, U.S. Geol. Surv. Prof. Pap. 1202. Darot, M., Gueguen, Y., Benchemam, Z., Gaboriaud, R., 1985. Ductile-brittle transition investigated by micro-indentation: results for quartz and olivine, Phys. Earth Plan. Int. 40(3), 180-186. Duclos, R., Paquet, J., 1991. High-temperature behaviour of basalts- Role of temperature and strain rate on compressive strength and KIc toughness of partially glassy basalt at atmospheric pressure. Int. J. Rock Mech. Min. Sci. & Geomech. Abstr., 28: 71-76. Glover, P.W.J., P. Baud, M. Darot, P.G. Meredith, S.A. Boon, M. LeRevalec, S. Zoussi, and T. Reuschle, 1995. α/β phase transition in quartz monitored using acoustic emissions, Geophys. J. Int., 120: 775-782. Hashida, T., Oghikubo, H., Takahashi, H., Shoji, T., 1993. Numerical simulation with experimental verification of the fracture behaviour in granite under confining pressures based on the tension softening model, Int. J. Fracture, 59: 227-244. Haynes International Ltd., 1998. Haynes International Hastelloy C22 data sheet. HPTA, 1974. High Pressure Technology Association (UK) High Pressure Safety Code. ISRM Commission on testing methods, 1988. Suggested methods for determining the fracture toughness of rock. Int. J. Rock mech. Min. Sci. & Geomech. Abstr., 25: 71-97. Kilburn, C.R.J., 1993. Lava crusts, aa flow lengthening and the pahoehoe –aa transition. In: C.R.J. Kilburn and G. Luongo (Editors), Active lavas: monitoring and modelling. UCL Press, London, UK, pp. 263-280. Kilburn, C.R.J., 1996. Patterns and predictability in the emplacement of subaerial lava flows and flow fields. In: R. Scarpa and R.I. Tilling (Editors), Monitoring and Mitigation of Volcano Hazards. Springer-Verlag. Berlin, Federal Republic of Germany, pp. 491-537 Lawn, B., 1993. Fracture of brittle solids, Cambridge University Press, Cambridge. Matsuki, K., Matsune, S., Takahashi, H., 1991a. Boundary element analysis for standard specimen configurations in the ISRM Suggested methods for determining Fracture Toughness of Rock, Int. J. Rock mech. Min. Sci. & Geomech. Abstr., 28: 355-363. Matsuki, K., Nozuyama, Y., Takahashi, H., 1991b. Specimen size requirements for
12
determining the inherent fracture toughness of rocks according to the ISRM suggested methods. Int. J. Rock mech. Min. Sci. & Geomech. Abstr., 28: 365-374. Meredith, P.G. and Atkinson, B.K., 1985. Fracture toughness and subcritical crack growth during high-temperature tensile deformation of Westerly granite and black gabbro, Phys. Earth and Plan. Int., 39: 33-51. Ouchterlony, F., 1989. On the background to the formulae and accuracy of rock fracture toughness measurements using ISRM standard core specimens. Int. J. Rock mech. Min. Sci. & Geomech. Abstr., 26: 13-23. Ouchterlony, F., 1990. Fracture toughness testing of rock with core based specimens. Engng. Fracture Mech.,1990, 35: 351-366. Parfitt, E. A., 1991. The role of rift zone storage in controlling the site and timing of eruptions and intrusions in Kilauea Volcano, Hawaii, J. Geophys. Res., 96: 10,101-10,112. Pinkerton, H., and G. Norton 1995. Rheological properties of basaltic lavas at sub-liquidus temperatures: laboratory and field measurements on lavas from Mount Etna, J. Volc. Geotherm. Res., 68, 307-323. Rocchi, V., Sammonds, P., Kilburn C.R.J., this issue. High temperature fracturing of Etnean and Vesuvian rocks at high temperatures and low pressures. Rubin, A. M. and Pollar, D. D., 1987. Origins of blade-like dikes in volcanic rift zones, U.S. Geol. Surv. Prof. Paper, 1350: 1449-1470. Ryan, M.P. and Sammis, C.G., 1981. The glass transition in basalts. J. Geophys. Res., B86; 10: 9519-9535. Saemundsson, K., Einarsson, S., 1980. Geological map of Iceland, sheet 3, SW-Iceland, second edition, Museum of Natural History and the Iceland Geodetic Survey, Iceland. Sammonds, P.R.,1988. Triaxial deformation experiments on natural sea ice as a function of temperature and strain rate. PhD thesis, Univ. Of London, London. Shaw, H. R., 1980. The fracture mechanics of magma transport from the mantle to the surface, in Hargreaves, R. B. (Editor), Physics of magmatic processes, Princeton Univ. Press, Princeton, New Jersey. Winter, R. B., 1983. Bruchmechanische Gesteinsuntersuchungen mit dem Bezug zu hydraulischen Frac-Versuchen in Tiefbohrungen, Reihe A Nr. 13, Ber. Instit. Für Geophys., Ruhr- Univ. Bochum, Bochum, W. Germany. In German.
13
11). FIGURES AND TABLES
Fig. 1. Apparatus used in this study. 1a shows the high-pressure cell which has an external diameter of 160 mm and is approximately 700 mm tall with closures. 1b shows a sketch of the force transfer system with a 60 mm diameter sample.
14
Fig. 2. Photograph of apparatus with pressure vessel raised. Note Aluminium sample and twin LVDTs used for calibration.
Fig. 3. Typical force/crack mouth opening displacement (CMOD) plot obtained from tests using basalt samples. Change in slope over repeated cycles is due to crack advance.

15
Fig. 4. Plot of crack resistance against crack extension for two short rod specimens of Icelandic basalt tested at standard temperature and pressure (STP). Note plateau region where crack resistance becomes identical to fracture toughness.
Fig. 5. Fracture toughness as function of temperature for heat-treated Icelandic basalt (IB (HT) ), heat-treated Vesuvian flow material (VF (HT) ) and untreated Vesuvian flow material (VF). All tests performed at ambient pressure. Icelandic basalt data are weighted means from 2-4 experiments at each temperature. Vesuvian data are from single experiments or weighted means from two experiments. See table 3 for details.

16
Fig. 6. Fracture toughness as function of confining pressure for heat-treated Icelandic basalt (IB (HT) ) and heat-treated Vesuvian flow material (VF (HT) ). All tests performed at room temperature. Icelandic basalt data are weighted means from 2-3 separate experiments at each pressure. Vesuvian data are from single experiments or weighted means from two experiments. See table 3 for details.
Fig. 7. Schematic of how fracture toughness is expected to be influenced by temperature. Curve A shows the response of non heat-treated material wherein the heating process generates thermal microcracks. In Region 1, strengthening by crack tip blunting occurs but is soon overcome by increased crack linkage in Region 2 which weakens the rock significantly. Region 3 represents a change in failure mode from brittle to plastic. Curve C shows the expected response of a heat-treated sample in which no additional thermal microcracking occurs. Curve B shows a heat-treated rock in which the extensive thermal cracking is slightly ‘healed’ by differential expansion at mid-low temperatures before further heating reopens the cracks and the curve approaches that of C. The general downward trend of Kc with temperature is due to the decrease in surface energy of a material as it is heated (Darot et al., 1985).

17
Rock Mineral % Content Size Icelandic Basalt- 100% aphanitic; ~ 2% porosity Plagioclase feldspar 59-61 <100µm Clinopyroxene 26-30 <100µm Olivine 6-8 <100µm Magnetite 3-4 <100µm Total ~ 99 Groundmass - glass 0 Groundmass crystal 100 <100µm Total 100 Vesuvius - ~ 20% phenocrysts; ~ 80% groundmass; ~ 8% porosity Clinopyroxene 40 0.1-3mm Olivine 40 0.1-3mm Plagioclase feldspar 5 0.1-0.8mm Magnetite 5 0.1-0.8mm Leucite 5 0.1-0.8mm Biotite & Iron oxides 5 0.1-0.8mm Total 100 Groundmass - glass 20 Groundmass crystal 80 15-100µm Total 100 Etna Core - ~ 30% phenocrysts; ~ 70% groundmass; ~ 9% porosity Plagioclase feldspar 65 0.1-3mm Clinopyroxene 15 0.1-3mm Olivine 15 0.1-3mm
Magnetite & iron oxides 5 0.1-0.8mm
Groundmass - glass 40 Groundmass crystal 60 15-100µm Total 100 Etna Crust - ~ 20% phenocrysts; ~ 80% groundmass; ~ 10% porosity Plagioclase feldspar 65 0.1-3mm Clinopyroxene 15 0.1-3mm Olivine 15 0.1-3mm
Magnetite & iron oxides 5 0.1-0.8mm
Groundmass - glass 60 Groundmass crystal 40 15-100µm Total 100 Table 1. Mineralogy and porosity of samples used in this study.

18
Oxide
Iceland Basalt
% Comp.
Iceland Basalt
% Stan. Dev.
Etna 1983 flow % Comp.
Etna 1983 flow
% Stan. Dev.
Vesuvius 1834 flow % Comp.
Vesuvius 1884 flow
% Stan. Dev. SiO2 46.6 0.7 47.32 NA 47.8 NA TiO2 2.31 0.2 1.7 NA 1.02 NA Al2O2 16.8 0.6 16.73 NA 17.6 NA FeO* 13.4 0.8 11.24 NA 8.20 NA Na2O 2.66 0.08 3.8 NA 2.58 NA MnO 0.22 0.1 0.18 NA 0.15 NA MgO 4.27 0.4 5.78 NA 4.14 NA CaO 13.4 0.6 10.32 NA 9.32 NA K2O 0.26 0.05 1.87 NA 7.22 NA
Table 2. Major-element geochemistry of samples used in this study. Composition and standard deviation of Icelandic basalt samples obtained by averaging 10 analyses performed at University College London, Department of Earth Sciences. Composition of Vesuvian material from Belkin et al., (1993); composition of Etnean material from Pinkerton and Norton (1995). FeO* refers to total iron oxide (FeO + Fe2O3). The analyses quoted for the Etnean and Vesuvian material were chosen to match the locations where the samples were collected.
19
Confining Heat treatment
Test Confining Temperature Pressure Number of temperature Mean Kc * Error on Kc *
material medium (oC) (MPa) samples (oC) (MPam1/2) (MPam1/2) Iceland basalt air 30 1 4 600 2.37 0.06 Iceland basalt air 150 1 3 600 3.78 0.15 Iceland basalt air 300 1 3 600 2.17 0.08 Iceland basalt air 450 1 3 600 2.20 0.08 Iceland basalt air 600 1 2 600 2.55 0.15 Iceland basalt co2 30 5 3 600 3.14 0.11 Iceland basalt co2 35 10 3 600 3.08 0.18 Iceland basalt co2 30 15 2 600 3.52 0.24 Iceland basalt co2 30 20 3 600 3.36 0.19 Iceland basalt co2 150 10 1 600 2.86 0.29 Iceland basalt co2 100 10 1 600 3.78 0.42 Vesuvius flow air 25 1 1 750 1.83 0.09 Vesuvius flow co2 25 5 2 750 2.00 0.10 Vesuvius flow co2 25 10 1 750 1.87 0.09 Vesuvius flow co2 25 20 1 750 2.06 0.10 Vesuvius flow co2 25 30 1 750 2.05 0.10 Vesuvius flow air 25 1 1 no 1.50 0.08 Vesuvius flow air 100 1 2 no 1.68 0.08 Vesuvius flow air 250 1 2 no 1.60 0.08 Vesuvius flow air 500 1 1 no 1.65 0.10 Vesuvius flow air 630 1 1 no 1.81 0.09 Vesuvius flow air 25 1 1 750 1.83 0.09 Vesuvius flow air 100 1 1 750 1.98 0.10 Vesuvius flow air 250 1 1 750 1.85 0.10 Vesuvius flow air 500 1 1 750 2.03 0.10 Vesuvius flow air 650 1 1 750 1.96 0.10
Etna Crust air 25 1 1 750 1.44 0.07 Etna Crust air 25 1 2 no 1.29 0.06
Etna Core air 25 1 2 750 2.18 0.11 Etna Core air 25 1 2 no 2.24 0.11
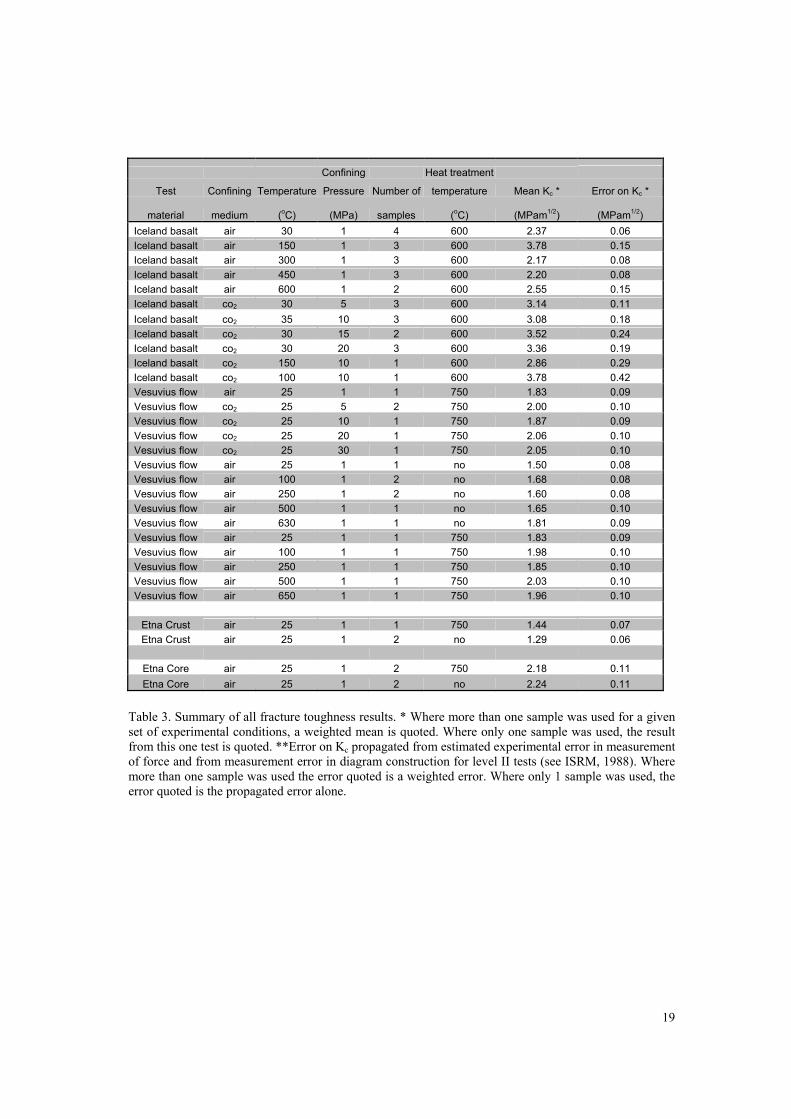
Table 3. Summary of all fracture toughness results. * Where more than one sample was used for a given set of experimental conditions, a weighted mean is quoted. Where only one sample was used, the result from this one test is quoted. **Error on Kc propagated from estimated experimental error in measurement of force and from measurement error in diagram construction for level II tests (see ISRM, 1988). Where more than one sample was used the error quoted is a weighted error. Where only 1 sample was used, the error quoted is the propagated error alone.

20
Heat treatment
Test Number of temperature Mean Kc * Error on Kc **
material samples (oC) (MPam1/2) (MPam1/2) Iceland basalt 4 600 2.37 0.06 Vesuvius flow 1 750 1.83 0.09 Vesuvius flow 1 no 1.50 0.08
Etna Crust 1 750 1.44 0.07 Etna Crust 2 no 1.29 0.06 Etna Core 2 750 2.18 0.11 Etna Core 2 no 2.24 0.11
Table 4. All fracture toughness measurements performed at STP for purpose of comparing different rock types and effects of heat treatment. * Where more than one sample was used for a given set of experimental conditions, a weighted mean is quoted. Where only one sample was used, the result from this one test is quoted. **Error on Kc propagated from estimated experimental error in measurement of force and from measurement error in diagram construction for level II tests (see ISRM, 1988). Where more than one sample was used the error quoted is a weighted error. Where only 1 sample was used, the error quoted is the propagated error alone.