Fracture surface energy determinations of high density ...
96
Scholars' Mine Scholars' Mine Masters Theses Student Theses and Dissertations 1970 Fracture surface energy determinations of high density Fracture surface energy determinations of high density polycrystalline ceramics polycrystalline ceramics Gene Arthur Pahlmann Follow this and additional works at: https://scholarsmine.mst.edu/masters_theses Part of the Ceramic Materials Commons Department: Department: Recommended Citation Recommended Citation Pahlmann, Gene Arthur, "Fracture surface energy determinations of high density polycrystalline ceramics" (1970). Masters Theses. 5496. https://scholarsmine.mst.edu/masters_theses/5496 This thesis is brought to you by Scholars' Mine, a service of the Missouri S&T Library and Learning Resources. This work is protected by U. S. Copyright Law. Unauthorized use including reproduction for redistribution requires the permission of the copyright holder. For more information, please contact [email protected].
Transcript of Fracture surface energy determinations of high density ...

Scholars' Mine Scholars' Mine
Masters Theses Student Theses and Dissertations
1970
Fracture surface energy determinations of high density Fracture surface energy determinations of high density
polycrystalline ceramics polycrystalline ceramics
Gene Arthur Pahlmann
Follow this and additional works at: https://scholarsmine.mst.edu/masters_theses
Part of the Ceramic Materials Commons
Department: Department:
Recommended Citation Recommended Citation Pahlmann, Gene Arthur, "Fracture surface energy determinations of high density polycrystalline ceramics" (1970). Masters Theses. 5496. https://scholarsmine.mst.edu/masters_theses/5496
This thesis is brought to you by Scholars' Mine, a service of the Missouri S&T Library and Learning Resources. This work is protected by U. S. Copyright Law. Unauthorized use including reproduction for redistribution requires the permission of the copyright holder. For more information, please contact [email protected].

I '

FRACTURE SURFACE ENERGY DETERMINATIONS OF HIGH
DENSITY POLYCRYSTALLINE CERAMICS
BY
GENE ARTHUR PAHLMANN 1946 -
A
THESIS
submitted to the faculty of
UNIVERSITY OF MISSOURI-ROLLA
in partial fulfillment of the requirements for the
Degree of
MASTER OF SCIENCE IN CERAMIC ENGINEERING
Rolla, Missouri
1970
Approved by
T2519 93 pages c.l

ii
ABSTRACT
Values of fracture surface energy were measured
for steatite, zircon, mullite and four densities of
alumina.
Rods of these high density materials were cut into
thin rectangular specimens which were notched and broken
in three-point loading. The resulting load necessary
for fracture of the specimens was used to calculate
the fracture surface energy of the materials.
2 The value for the steatite was around 20,000 ergs/em .
The values for the zircon and mullite were on the order
of 13,000 ergs/cm2 , and the values for the aluminas
ranged from 17,000 to 24,000 ergs/cm2 .

ACKNOWLEDGMENTS
The author wishes to thank the following people for
their assistance with his research:
First of all his advisor, Dr. Robert E. Moore, whose
encouragement played a great role in his research and the
writing of his thesis.
The unending and untiring advice and assistance from
Dr. David A. Summers was tremendously helpful. Not only
did Dr. Summers help him by his previous knowledge of the
subject of fracture surface energy and its measurement; but
without the use of Dr. Summers' equipment, the entire
project might have ended in disaster.
iii
The help of Mr. Richard Turner for the 6T determinations,
and the help of Mr. Richard Moore with the sonic apparatus
for the Young's modulus determination are also appreciated.
The financial assistance of the Refractories Institute
is acknowledged and appreciated.

TABLE OF CONTENTS
Page
ABSTRACT . . . . . . . . . . . • . . . . . . . . . . . . . . . . . . . . . . . . . • . . . . . . . ii
AKCNOWLEDGMENT S . . . . . . . . . . . . . . . . . . . . . . . . . . . . . . . . . . . . . . iii
TABLE OF CONTENTS . . . . . . . . . . . . . . . . . . . . . . . . . . . . . . . . . . . . i v
LIST OF FIGURES .......... ...... ...................... vi
LIST OF TABLES ....................................... viii
SYMBOLS USED THROUGHOUT THESIS .............. ......... ix
I . INTRODUCTION . . . . . . . . . . . . . . . . . . . . . . . . . . . . . . . . . . 1
I I. REVIEW OF LITERATURE . . . . . . . . . . . . . . . . . . . . . . . . . . 3 A. Surfaces in General ....................... 3
B. Bonding and Strengths of Materials ........ 4
C. Flaw Theory of Fracture................... 5 D. Methods of Surface Energy Measurement ..... 7
E. Evaluation of Methods of Fracture Surface Energy Determination ........ .............. 8
I I I . EXPERIMENTAL PROCEDURE . . . . . . . . . . . . . . . . . . . . . . . . 11
A . Materia 1 s Used . . . . . . . . . . . . . . . . . . . . . . . . . . . . 11 B. Procedure for Testing Specimens ........... 11
C. Measurements and Calculations ............. 14
IV. RESULTS . . . . . . . . . . . . . . . . . . . . . . . . . . . . . . . . . . . . . . . 18
V. DISCUSSION OF RESULTS ......................... 29
VI. CONCLUSIONS . . . . . . . . . . . . . . . . . . . . . . . . . . . . . . . . . . . 35
VII. APPENDICES . . . . . . . . . . . . . . . . . . . . . . . . . . . . . . . . . . . . 38
A. Surface Energy Specimen Preparation ....... 39
A-1. Cutting of rectangular specimen
A-2.
A-3.
from rods . . . . . . . . . . . . . . . . . . . . . . . . . . . 40
Notching specimen
(1) The
(2) The Breaking
the surface energy ............................ wire saw .................. .
diamond saw ............... .
44
44 49
specimens .................. 53
B. Fracture Edge of Specimens .........•...... 56 B-1. Profile of fracture edge ..•..•...... 57
C. Data From Surface Energy Specimens ........ 62
iv

v
Page
D. Materials and Their Suppliers ............. 77
D-1. Donated Materials ................... 78
D-2. Other Materials Used in Work ........ 78
VIII. BIBLIOGRAPHY • . . . . . • . . • • • . . . . . • • . . . . . . . . . . . . . . . 80
IX. VITA ..........•...•.•.••.••..........•••....•. 82

vi
LIST OF FIGURES
Figures Page
1. The Loading Jig . . . . . . . . . . . . . . . . . . . . . . . . . . . . . . . 12
2. Specimen Dimensions 15
3. The LVDT Attachment . . . . . . . . . . . . . . . . . . . . . . . . . . . 16
4. Alumina (99% dense) . . . . . . . . . . . . . . . . . . . . . . . . . . . 20
a) Cut Surface - 3000X b) Fractured Surface - SOOOX
5. Notch-Fracture Interface (300X, 99.5% Alumina) (Top half- cut portion) ...................... 21
6. Zircon Fracture Surface ....................... 22
a) SOOX b) 1400X
7. Steatite Fracture Surface ..................... 23
a) SOOX b) sooox
8. Mullite Fracture Surface ...................... 24
a) SOOX b) sooox
9. Alumina (99.5% dense) Fracture Surface ........ 25
a) lOOOX b) sooox
10. Alumina (99% dense) Fracture Surface .......... 26
a) SOOX b) 5000X
11. Alumina (96% dense) Fracture Surface .......... 27
a) lOOOX b) sooox
12. Alumina (94% dense) Fracture Surface .......... 28
a) SOOX b) 3000X
13. The Diamond Saw . . . . . . . . . . . . . . . . . . . . . . . . . . . . . . . 41
14. The Specimen Holder ........................... 42
15. Finished Specimens ............................ 43
16. Notched Specimens: (top) wire saw cut, (bottom) diamond blade cut .................... 45
17. The Wire Saw .•................................ 47
18. Embedding Specimens: Step I .•..............•. 51

vii
Figures Page
19. Embedding Specimens: Step II ................. 52 20. The Experimental Set-Up ....................... 54
21. Load Cell Calibration ......................... 55 22. Zircon Fracture Edge .. ~ ....................... 58 23. Steatite Fracture Edge ........................ 58 24. Alumina (99.5% dense) Fracture Edge ........... 59 25. Alumina (99% dense) Fracture Edge ............. 59 26. Alumina (96% dense) Fracture Edge ............. 60 27. Alumina (94% dense) Fracture Edge ............. 60 28. Mullite Fracture Edge ......................... 61

viii
LIST OF TABLES
Table Page
1 Average Values from Experimental Findings ....... 19

SYMBOLS USED THROUGHOUT THESIS
I. For Surface Energy Determination:
2 y = Fracture surface energy (ergs/em )
a = Stress in specimen
L = Length between loading supports (inches)
d = Width of specimen (inches)
x = The ratio (L/d)
b = Thickness of specimen (inches)
M = Bending moment in the specimen
c = Initial notch depth (inches)
y = Distance from neutral axis
c a = Notch depth to width ratio
p = Load required for fracture of specimen (psi)
E = Young's modulus (lbs/in2)
L* = Length of sample
II. For Young's Modulus Determination:
C' = Shape factor term (sec 2/in)
2 = Length of sample (inches)
d = Diameter of specimen
f = Resonant frequency of specimen (cps) '
T1 = Correction factor
w = Weight of specimen (lbs-or~grams/454)
ix

III. Additional Symbols:
~T = The amount of cooling shock (C 0 ) necessary to
create surface cracking of the material
p = Density of material
X

I. INTRODUCTION
A recent specialized study of thermal shock in high
density alumina by Ainsworth 1 prompted this extended study
of thermal shock in other high density ceramic materials.
Ainsworth's work dealt with the possibility of being able
to predict the extent of thermal shock damage (the depth
of cracks produced) in rods of the material as a result of
exposure to a cooling shock of 6T. In order to be able to
use Ainsworth's equations it is necessary to obtain a valid,
reproducible value for the fracture surface energy of the
materials under examination. The determination of these
surface energy values will be the main content of this
thesis.
Fracture surface energy is the work required per unit
area to create new surface. The density of the materials,
type of bonding between particles, particle size and other
material properties are responsible for the magnitude of
this value.
The method used to determine these surface energy
values was one similar to that described by Davidge and
Tappin 2 and identical with that used by Summers. 3
Since ~" x 6" rods of the materials were to be used
for the thermal shock study, it was felt that it would be
1

advantageous to use similar rods for the surface energy
determinations. These rods were sliced with a diamond saw
and specimens of approximately 3/8" x .045" x 2" were made.
These specimens were then notched with wire or diamond saw
with notches ranging from 0.01" to 0.03" in width. They
were then broken in 3-point bending; the center load being
applied directly over the inverted notch. The applied load
necessary for the fracture of the specimen was measured by
a quartz load cell that was located directly in line and
above the knife edge. The surface energy was then calcu
lated by an equation given by Srawley. 4 The method of
evaluation chosen made use of Griffith's crack theory. The
final choice of an equation to be used for calculation of
the fracture surface energy value was the result of the
extensive experimentation of Summers 3 and Chen. 5
2

II. REVIEW OF LITERATURE
A. Surfaces in General:
Boundary areas between phases are sometimes referred
to as surfaces and are often the location of abrupt changes
in composition, e.g. liquid-vapor interface, etc. For this
reason atoms on or near these surfaces are not usually in
equilibrium, since they are often not totally in either
phase. This frequency results in many distorted oonds
which in turn cause an excess of energy due to atoms which
do not have all their bonds in equilibrium positions.
Since the atomic surface structure is the cause of this
population of unsatisfied bonds, this excess energy is
proportional to the surface area. For this reason a drop
of liquid will tend to form a spherical shape whenever
possible, to minimize its surface area. (Producers of lead
shot take advantage of this phenomenon by dropping molten
lead through cool air. By the time the lead lands, it has
hardened and will be quite spherical.)
Fracture surface energy is the energy required to
produce a new surface. 6 Surface energy and surface tension
tend to decrease with increasing temperature. The
decrease in surface energy is ~he driving force for grain
growth and sintering. 7
3

B. Bonding and Strengths of Materials:
Weiderhorn 8 speaks of "theoretical cohesive strength"
which could be used almost synonymously with fracture
surface energy, (in idealized circumstances). In his
study of glass and sapphire, he found their theoretical
strengths to vary up to lOOX greater than actual or normal
engineering strength. In glass the theoretical strengths
may be so much as three orders of magnitude greater than
design strengths.
The maximum cohesive strength can be spoken of in
terms of the binding energy between the atoms or molecules
making up the structure. At a given interatomic distance,
r 0 , the binding potential of the material is at a maximum.
When this distance is increased (or decreased), the binding
potential decreases exponentially.
Binding
Potential
= u
Binding Force
au =rx
r-+
4

U equals the potential energy per unit area of fracture
surface. Born's fraction describing U is:
X (1)
The cohesive strength is calculated from the fact that
a2u ~ = 0, when the stress is maximum. At equilibrium ax~
x = x 0 (i.e. r 0 ). By definition:
2y = I; cau;ax)dx = (2) 0
C. Flaw Theory of Fracture:
Since there is little or no mechanism in ceramic
materials to allow plastic flow, the concentration of
stresses at the tips of flaws cannot be relieved by plastic
flow. For this reason the flaws act as stress concen-
trators, and, therefore, each flaw is a possible nucleation
site for fracture. Most failure in ceramic materials is
of a brittle nature and occurs with little or no warning.
In 1920 Griffith developed a theory that the main
cause of fracture in brittle materials relates to a
population of very small cracks (10-100 microns) within
the body or on the surface especially, and these act as
stress concentrators.
5

By using Ingles' analysis of stress, Griffith showed
that the stress at the crack tip was:
!.:: cr = (2S7TL/p) 2
Here L = ~ the length of the crack; p = the radius of
curvature of the crack tip and S = the applied stress.
Griffith's famous equation for the stress (S) which
is necessary for crack growth was that:
S must equal or exceed: !.::
(ZEy /L1r) 2
(3)
(4)
By assuming a crack length in a material on the order
of the interatomic spacing, one can calculate the rupture
stress of Eq. (3) and obtain a magnitude compatible with
that used for theoretical strength values. If the size of
the flaw is on the order of 10-100 microns (Griffith type
flaws), the strength values resulting are similar to those
observed in actual applications. This would tend to
strengthen Griffith's theory, if nothing else.
By examining the Griffith balance criteria (~iU = y)
where U = the stored elastic energy and A = the fracture
surface area, we see that when the requirements for this
equation are fulfilled, crack. growth is energetically
possible. Once growth has begun, its behavior is dependent -au on how ax- changes with growth. A positive value for
6

2 -a 2U will result in crack acceleration since the energy a A
released is greater than that required for growth. If
2 -a 2U is negative, this may mean there will be a point during a A
-au crack propagation at which ax- < y . If this occurs, crack
growth will terminate and more work must be done to keep
the crack moving. 9
D. Methods of Surface Energy Measurement:
The most direct surface energy measurement is by
determining the heat of solution or heat of reaction of
very fine particles of known size. By dissolving or
reacting this finely powdered material and measuring the
change in temperature of the original bulk material, it is
possible to make a direct calculation of the surface
energy. 6
Methods of crushing the sample and then measuring
and/or calculating the resulting surface area have been
studied by Kenny 11 and others. There is one very great
difficulty that is always present in these crushing
techniques viz., the powders must be strain free and free
from surface contamination. 6 'It is almost impossible to
meet these two conditions simultaneously.'
7

E. Evaluation of Methods of Fracture Surface Energy Determination:
In Summers' 3 recent work, he compared and evaluated
various methods for determination of fracture surface
energy values. He explains that in a number of methods
where the material is ground or crushed, many cracks may
be formed within the resulting granules which are not
readily visible or detectable. Since the number of these
nondetected cracks will vary, crushing techniques will give
not only high values of fracture surface energy but also
inconsistent values. For his experimental material he
chose plexiglas. Besides being quite homogeneous and
readily available, it was a material that gave a smooth
fracture plane that allowed accurate surface area measure-
ments. Although the possibility of having some plastic
behavior in this material is most apparent, the results
should only deviate from a true fracture surface energy
value by a constant term, so no real harm was done in using
the plastic specimens to study "a brittle phenomenon."
(His work was intended to evaluate methods rather than
obtain standard values.)
Summers felt that usi~g thin specimen sections and
3-point loadi~g would help to reduce the level of stored
8

energy. His experiments were set up in four parts:
(1) The size of the specimens were varied but their
dimensions were kept in constant proportion and sharpened
notches were cut into the material to half the depth of
the specimen.
(2) The specimens' dimensions were kept in constant
proportion but three different notch shapes were used:
(a) a vee notch, (b) a square ended notch, and (c) a
round wire saw cut.
(3) The thickness and length being held constant, the
crack to height ratio was varied at a constant total height.
(4) The crack to height ratio varied but the uncracked
height remained constant.
The assumption upon which all work was based was that
Griffith's theory of crack propagation holds true. For it
to hold, Rose and English 5 have shown that for geometrically
similar beams the relationship below must hold true:
2 ~ = (k) (constant)
Here p = the applied load, D = a specimen dimension, and
k has been related to the surface energy of the material.
This implies that in order for fracture surface energy
equation to be valid, the values calculated from it must
(5)
9

be constant over a wide range of sizes of materials tested
and not for just one "special case."
By using the four sets of experimental variables
already mentioned, Summers set out to examine the constancy
of the values resulting from eight different fracture
surface energy equations. Of the equations examined were
those put forth by Liebowitz, Winne and Wundt, Paris and
Sih, Buekner, Griffith, Davidge and Tappin, Srawley and
Brown and Srawley. 3
Three equations proved to be invalid when experimental
changes in the initial crack length were made. Another
gave way because its "qualifying assumptions" did not
account for stored residual energy. Three others gave a
wide range of values when the uncracked height was varied.
This left only one of the original eight equations which
gave quite constant values throughout the entire
examination. This was the equation given by Srawley, 4
(which is discussed in detail in section five of this
paper.) 5
10

III. EXPERIMENTAL PROCEDURE
A. Materials Used:
The test specimens for this work were in the form of
6-inch rods, ~ inch in diameter. The materials examined
were 99.5%, 96% and 94% dense alumina, steatite (ALSIMAG
#460) and zircon (ALSIMAG #475) all donated by the American
Lava Corporation; mullite (MV-30) donated by McDanel
Refractories and 99% dense alumina (AD-99) which was
purchased from Coors Porcelain. (A complete listing of
addresses for materials and equipment used is included in
the appendices.)
For the fracture surface energy specimens, the rods
mentioned above were cut in half and then sliced into
rectangular specimens of approximately 3/8" x .045" x 2"
in dimensions. The specimens used in the ~T determinations
were round cylinders cut from the ~" rods and were slightly
over an inch in length. For subsequent thermal shock
studies, rods of 3 or 6 inch lengths will be used.
B. Procedure for Testing Specimens:
The rectangular specim~ns were placed in the loading
jig (Fig. 1), and the knife. e~ge of the jig was carefully
lowered until it was centered above the inverted crack and
11

12
t.:) 1
-i .....,
t.:)
z 1-i ~
<
0 ...:l
~
:I: E-<
I I ...... Q
) J-4
I I ==' bO
•1"'4 J:,l.,
I I I

just barely in contact with the specimen. By o~serving the
movement of the recorder, it was possible to determine when
the knife edge no longer exerted pressure on the specimen.
The load was applied slowly and at a constant rate by
use of the gears atop the loading jig. A double set tif
bearings allowid the shaft to rotate and descend while the
knife edge remained stationary. When fracture occurred,
in most cases, the specimens remained in one piece thus
giving the assurance that very little of the input energy
was elastic. Failure was considered to be of a completely
brittle nature.
The recording of the load was accomplished by posi
tioning a quartz load cell between the knife edge and
the descending shaft. This load cell's range extended
from 0.01 to 5,000 pounds of applied pressure. The output
from this calibrated load cell was run through a charge
amplifier which produced a signal that activated the
recorder (one volt output per pound of applied pressure.)
The load taken from the recorder was used as the 'p'
value in the following equation:
= 1.9 + .00~5x, 'Ai = -3.39. +: .08x, A2 = -26 .• -24 + .2815x, A4 = 26 .• 38 - .145x
(Equation by Srawley'+)
,. 15 . 4 - • 217 Sx,
(6)
13

C. Measurements and Calculations:
The values of: L, c, d and b were measured with a
dial type micrometer. All the 'c' values were measured
under a 16 power microscope. The accuracy of the micro
meter was to the nearest thousandth of an inch.
The values for Young's modulus were measured by
using the sonic techniques described by Pickett, 12 using
the formula: E = c'wf2 , for calculations.
For an explanation of the terms used in this paper,
one may refer to the listing at the beginning of the
paper and also to the diagram on the following page.
The deflection of some of the specimens was measured
using the LVDT attachment (Fig. 3). For most of the thin
specimens, their deflection before fracture was only about
0.002 to 0.004" and this small flexure was felt to be so
close to the limits of accuracy of the device that the
values were not recorded.
After all the specimens were broken, the values were
read off the chart paper under a magnifying lens to help
insure that the readings would be accurate and consistent.
The full scale readings on the recorder paper for all but
a few very thick specimens were set from 5 to 20 pounds.
14

15
r-.. p
. 'o
._J
"'d til 0
r-t
"'d
tl)
z a>
0 •r-i
H
r-t tl)
p
. z
p.
>.a ~
til ::8 H
"'d
Q
~
til z >.a
~
Cf)
::8 tl
.j...) H
1-<
u 0
,:.Ll p
. p.,
p.
tl)
;:::! C
f)
_J
"'d N
til
l_ 0
a> r-t
1-<
II ;:::! 0
1)
=> ·r-i l:..t.

16
Figure . 3: THE LVDT ATTACHMENT

These settings allowed a minimum accuracy in reading of
±0.01 pounds.
17
IV. RESULTS
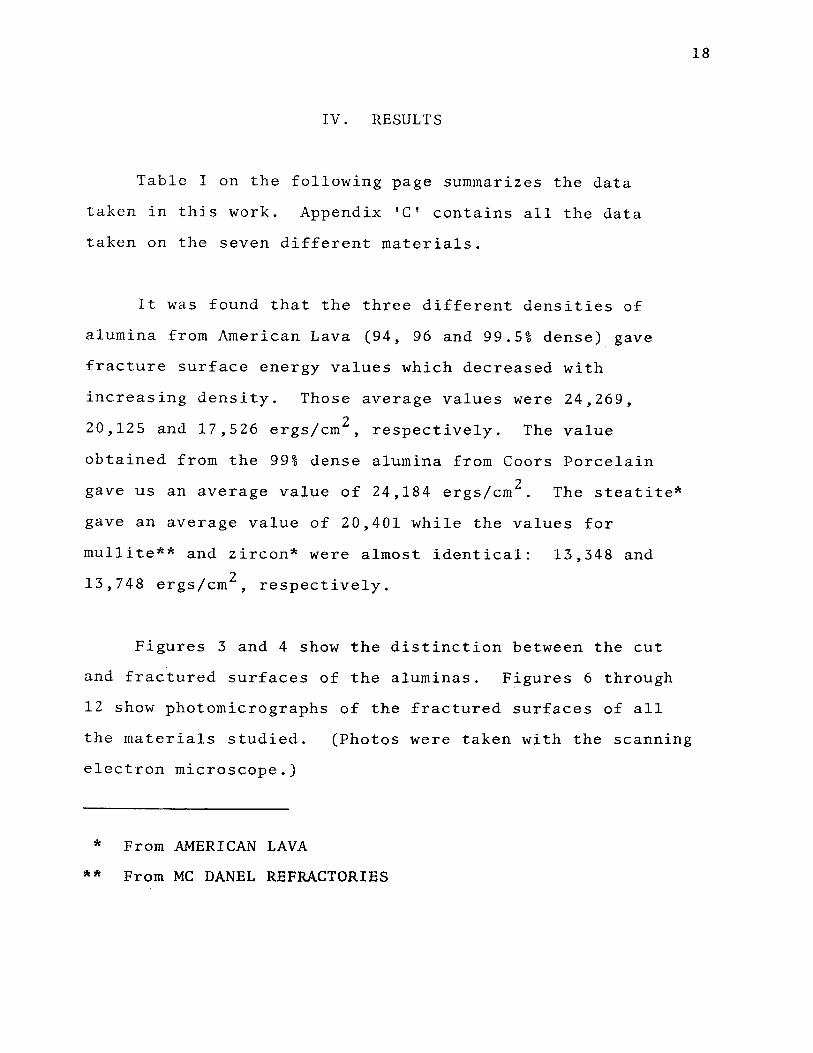
Table I on the following page summarizes the data
taken in this work. Appendix 'C' contains all the data
taken on the seven different materials.
It was found that the three different densities of
alumina from American Lava (94~ 96 and 99.5% dense) gave
fracture surface energy values which decreased with
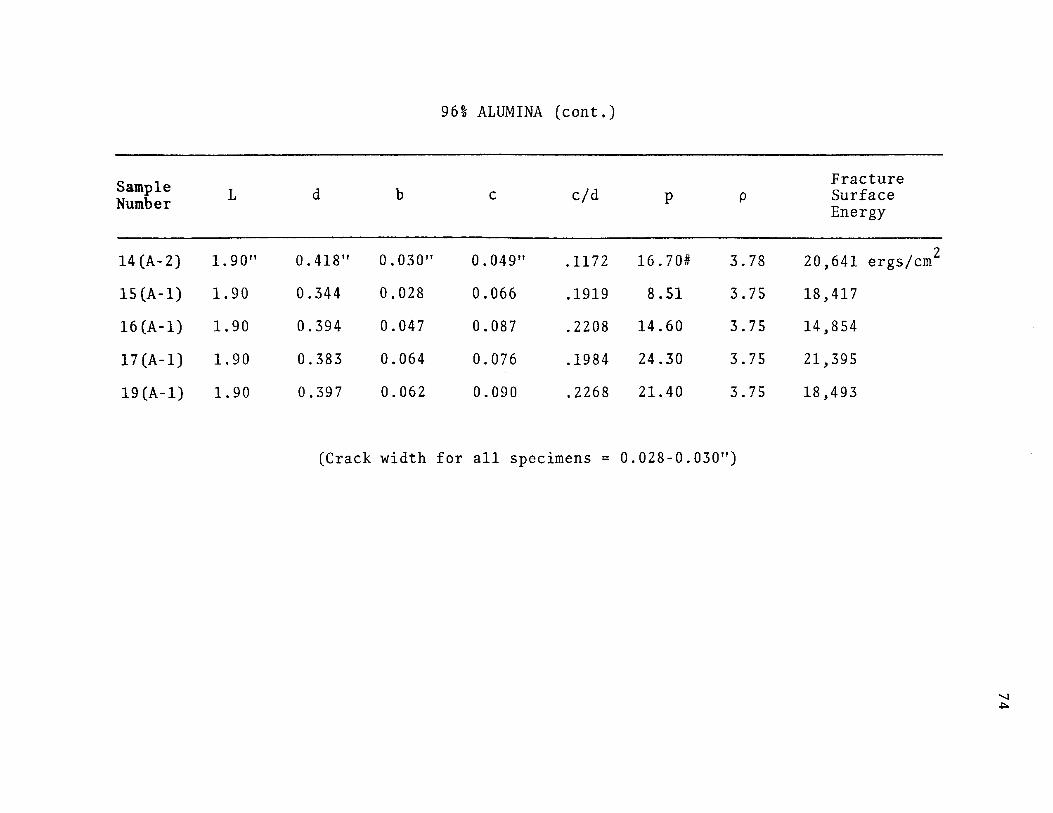
increasing density. Those average values were 24~269, 2 20,125 and 17,526 ergs/em , respectively. The value
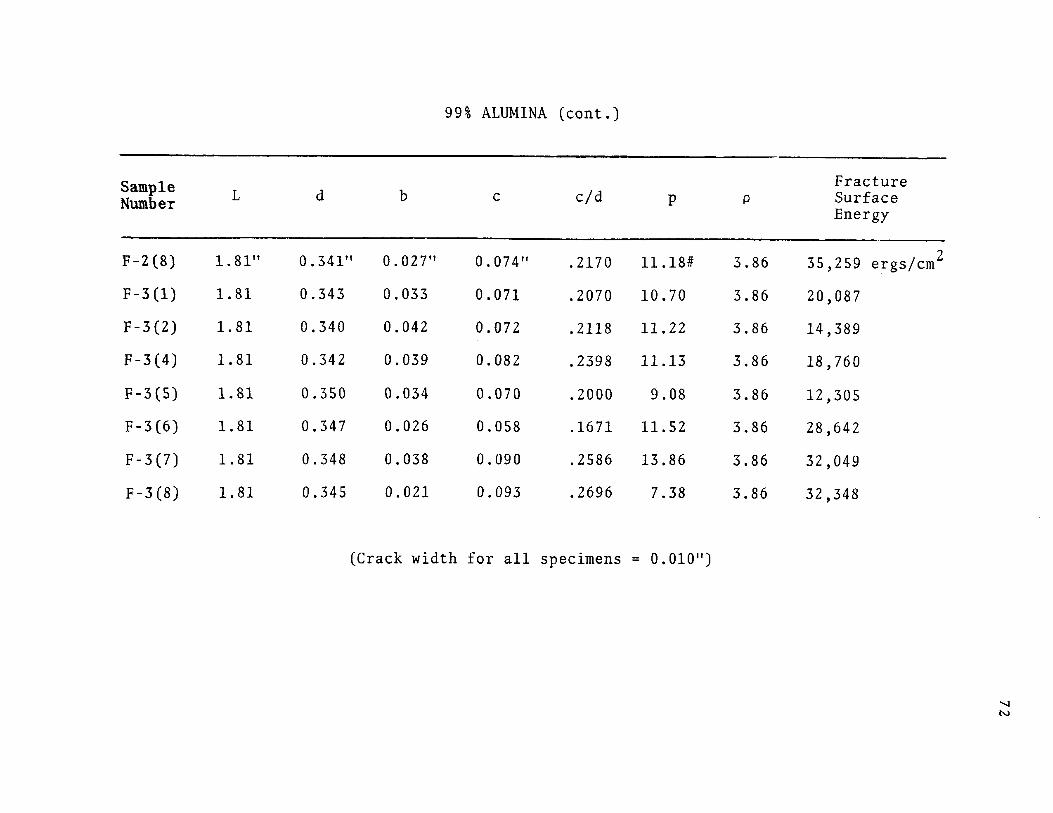
obtained from the 99% dense alumina from Coors Porcelain
gave us an average value of 24,184 ergs/cm2 . The steatite*
gave an average value of 20,401 while the values for
mullite** and zircon* were almost identical: 13,348 and
13~748 ergs/cm2 ~ respectively.
Figures 3 and 4 show the distinction between the cut
and fractured surfaces of the aluminas. Figures 6 through
12 show photomicrographs of the fractured surfaces of all
18
the materials studied. (Photos were taken with the scanning
electron microscope.)
* From AMERICAN LAVA
** From MC DANEL REFRACTORIES

TABLE I
AVERAGE VALUES FROM EXPERIMENTAL FINDINGS
Fracture Material l\T
Surface Energy
99.5% Al 2o3 17,526 ergs/cm2 175C0
99% Al 2o3 24,184 215°
96% A1 2o3 20,125 215°
94% AI 2o3 24,269 215°
Steatite 20,401 125°
Mullite 13,748 275°
Zircon 13,348 225°
* **
Value from American Lava Corporation
(B-5), E = 53.4 X 10⁶
Young's Modulus
55 x 106psi*
58.8 X 106
51.8 X 10⁶
45.6 X 10⁶**
16.1 X 10⁶
23.6 X 10⁶
26.5 X 10⁶
19

20
a) CUT SURFACE - 3000X
FJ,gute 4: ·ALUMINA (9~l4 dense)
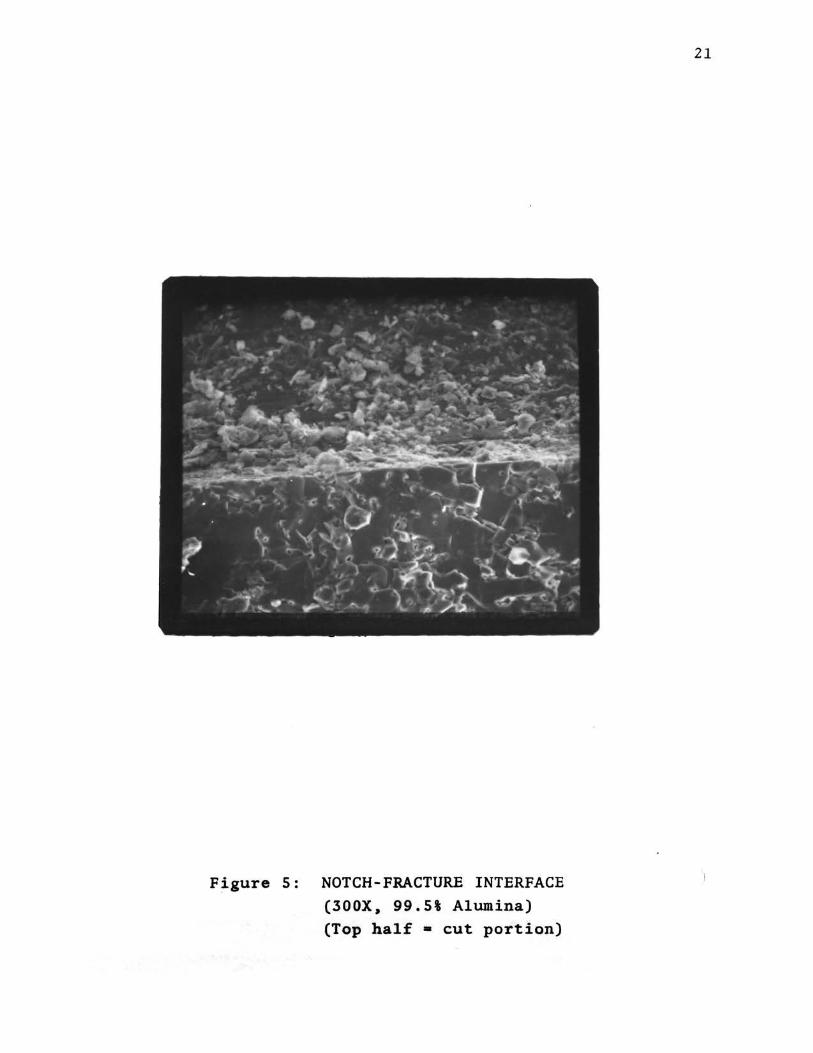
Figure 5: NOTCH-FRACTURE INTERFACE
(300X. 99.5% Alumina) (Top half • cut portion)
21

22
a) SOOX
b) 1400X
Figure 6: ZIRCON FRACTURE SURFACE

23
a) SOOX
b) sooox
Figure 7: STEATITE FRACTURE SURFACE

24
a) SOOX
b) sooox
25
a) lOOOX
b) sooox
Figure 9: ALUMINA (99.5% dense) FRACTURE SURFACE
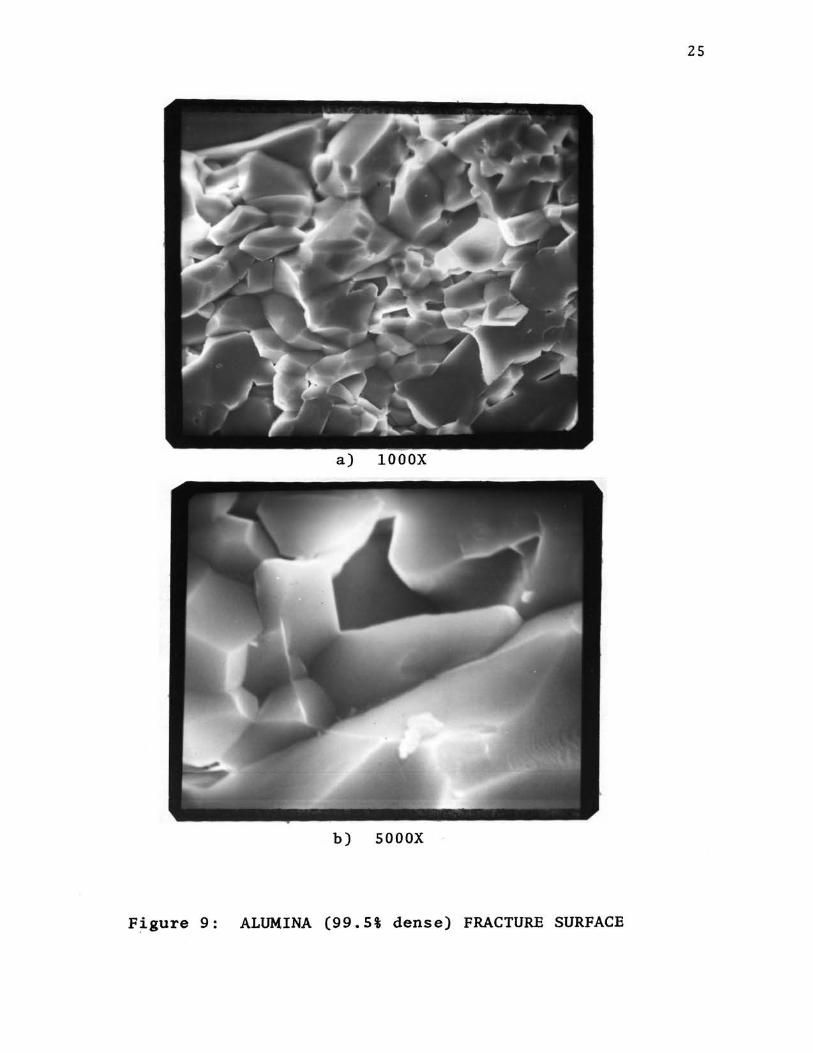
26
Figure 10: ,Al.tUM'lNA (99\ dense) FRACTURE SURFACE

27
a) 1000X
b) sooox
Figure 11: ALUMINA (96% dense) FRACTURE SURFACE

28
a) SOOX
b) 3000X
Figure 12: ALUMINA (94% dense) FRACTURE SURFACE
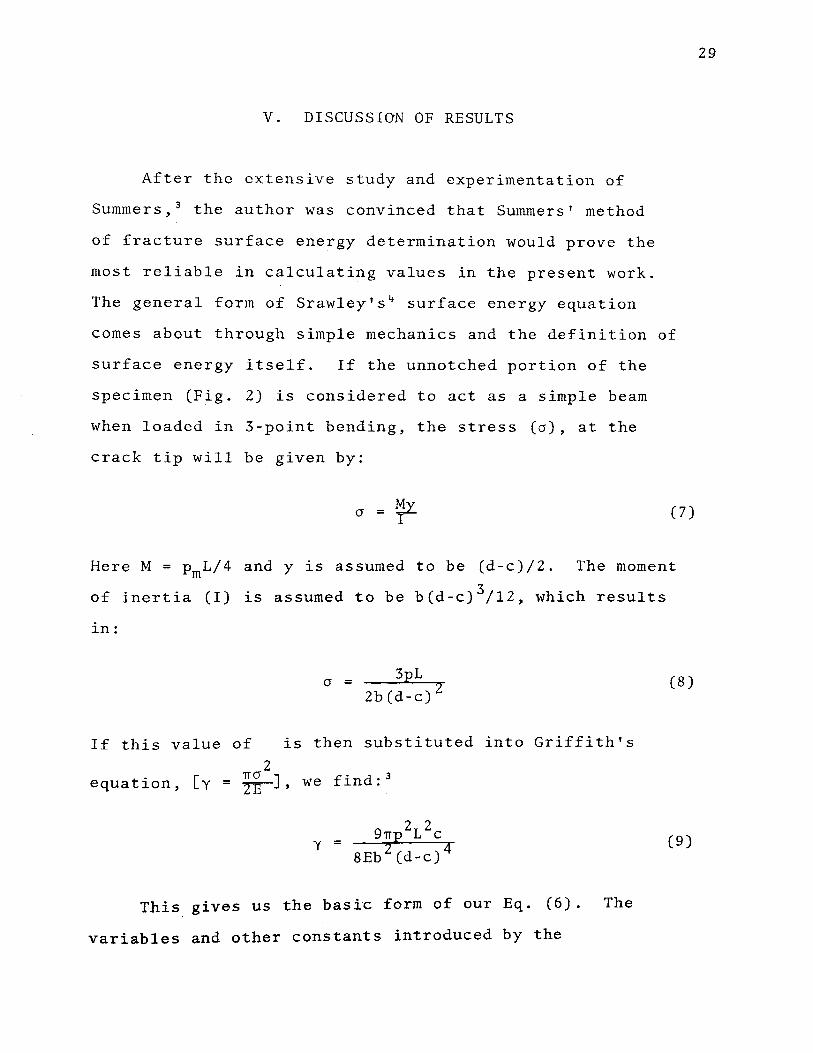
V. DISCUSSION OF RESULTS
After the extensive study and experimentation of
Summers, 3 the author was convinced that Summers' method
of fracture surface energy determination would prove the
most reliable in calculating values in the present work.
The general form of Srawley's~ surface energy equation
comes about through simple mechanics and the definition of
surface energy itself. If the unnotched portion of the
specimen (Fig. 2) is considered to act as a simple beam
when loaded in 3-point bending, the stress (o), at the
crack tip will be given by:
0 = !il. I (7)
Here M = pmL/4 and y is assumed to be (d-c)/2. The moment
of inertia (I) is assumed to be b(d-c) 3/12, which results
in:
0 = 3pL 2b(d-c) 2
(8)
If this value of is then substituted into Griffith's
2 equation, [y = z~ ] , we find: 3
2 2 = 97Tp L c (9)
Y 8Eb 2 Cd-c) 4
This gives us the basic form of our Eq. (6). The
variables and other constants introduced by the
29
experimentation of Srawley are quite involved and are
dealt with quite thoroughly in Ref. 4.
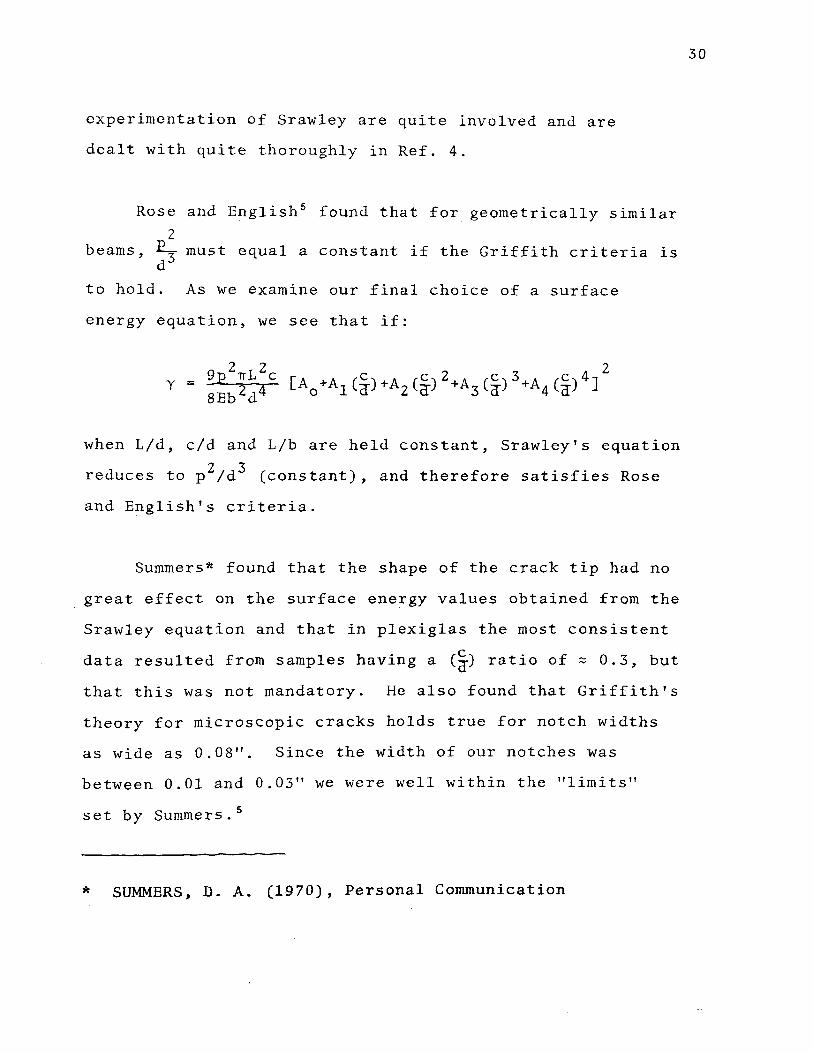
Rose and English 5 found that for geometrically similar 2
beams, ~must equal a constant if the Griffith criteria is d
to hold. As we examine our final choice of a surface
energy equation, we see that if:
when 1/d, c/d and 1/b are held constant, Srawley's equation
reduces to p 2;d3 (constant), and therefore satisfies Rose
and English's criteria.
Summers* found that the shape of the crack tip had no
great effect on the surface energy values obtained from the
Srawley equation and that in plexiglas the most consistent
data resulted from samples having a (~) ratio of ~ 0.3, but
that this was not mandatory. He also found that Griffith's
theory for microscopic cracks holds true for notch widths
as wide as 0.08". Since the width of our notches was
between 0.01 and 0.03" we were well within the "limits"
set by Summers. 5
* SUMMERS, D. A. (1970), Personal Communication
30

The deviation of the surface energy values of all the
aluminas, the steatite and the mullite specimens was on
the order of 10%, while the deviation of the individual
values for the zircon was almost 30%. One reason offered
for the increased variation with the zircon is that it was
impossible to apply the load to the zircon specimens at a
slow enough rate to cause complete fracture of the specimen
without breaking it in two. With the other materials,
several specimens were broken that remained stationary
and did not fall from their loading supports when fracture
occurred. When the knife edge was lowered further on a
specimen that broke but did not fall into two halves, no
load whatsoever was indicated by the recorder to cause the
halves to separate. Since the recorder-load cell combi
nation was accurate to 0.01 pounds, it was felt that very
little excess energy was used in the fracture of those
specimens that broke but did not fall from the loading
supports.
One reason that the low value of fracture surface
energy for the zircon was not too surprising was that all
21 specimens were notched with the same wire blade, while
some of the other materials (i.e. alumina) required 2 to
3 blades to notch just one specimen. The_ great irregu
larity in particle size (Fig. 6) helps account for the
large variance in the value of y. Since in some instances
la!ge crystals were fractured rather than the fracture
31

path following the grain boundaries, this could also cause
a variance of the y values, depending upon the size of
grains present on each fracture surface. This reasoning
is partially based on the facts given by Swanson,** who
stated:
"Thermodynamic free surface energy, as measured by liquid drop methods, is lower than the cleavage surface energy along a specific crystalline plane in an actual single crystal. The single crystal cleavage surface energy is again lower than that for fracturing a polycrystalline ceramic piece. And for polycr~stalline ceramics, the fracture surfaCe energy de in1tely has different numerical values for different grain sizes."
From viewing the photomicrographs of the aluminas,
one sees that as the densities increase the particle size
increases and the grains appear to become more distinct.
(See Figs. 9-12. The 94 and 96% aluminas contain several
regions where the grain structure is not as clearly
defined as in the 99 and 99.5% aluminas.) Since there is
such a difference in the fracture surface energy values
for the 99 and 99.5% aluminas, it would be interesting to
measure the y values for Coors 94 and 96% aluminas to see
if there is a definite trend in the surface energy of
these materials in comparison with the data already
collected.
SWANSON, G. (1970), Personal Communication
32

The fracture in the aluminas seems to have been almost
entirely along the grain boundaries. The interwoven
crystalline network of the mullite caused fracture to occur
through many of the grains, rather than along a grain
boundary. This intergranular fracture may be one reason
for the low value of y for mullite. Because of the
intergranular fracture, a clear view of the crystalline
network of the mullite was possible only by looking into
a pore which was not directly on the fracture surface.
(See Fig. 8)
The steatite, although somewhat more porous than any
33
of the other materials, still had a much higher y value than
the mullite and zircon. Figure 23 shows that the steatite's
fracture surface was slightly more irregular than the other
materials and this could mean that much more new surface
was created than accounted for. This would help justify
that our value may be somewhat high.
Noting paired values for ~T and the fracture surface
energy values, (Table I), one can readily see that there is
no direct relationship between the maximum thermal shock
(~T) the material can withstand before cracking begins and
the fracture surface energy. This is not surprising and
would almost be expected since thermal shock or the
resistance to thermal shock is not solely a function of
surface energy. Once a crack has been ·initiated in a

material from thermal shock the fracture surface energy
value becomes much more important and surely has much to
do with the depth of penetration of the crack. There are
at least three other material properties which are quite
important when discussing thermal shock. These are:
Young's modulus, thermal conductivity and the thermal
expansion coefficient. One might speculate that one reason
the mullite showed such a good thermal shock resistince
was that it combines a low E modulus with a high tensile
strength and a low coefficient of thermal expansion. The
interwoven crystal structure may also help by strengthening
the network and possibly allowing a slight internal move
ment to help relieve some of the stresses and thus postpone
failure.
34

VI. CONCLUSIONS
In order to be more confident in the fracture surface
energy values obtained in this work, an effort should be
made to determine the error involved when it was assumed
that the newly created surface was a perfectly smooth
plane. The existing values for y could then be divided by
this "factor" and one would have a more accurate value.
The main purpose of the measurements of y in this
work was to obtain a fairly valid fracture surface energy
value to use in the thermal shock investigation mentioned
in the introduction. At present it is not known if the
fracture surface energy values measured on these materials
are a representative for all similar materials. Since
density and grain size are so important, these would have
to be specified with the y value. What is important here
is that the y values are representative of the materials
used in the thermal shock study. Since the y measurements
were made on a random selection of the thermal shock
specimens, one should be quite confident in their accuracy.
In his discussion of polycrystalline ceramics,
Weiderhorn 13 explains that the fracture surface energy
values for polycrystalline ceramics are an order of
magnitude higher than t.he fracture surface ene!gY values
for sing.le crystals of .the same material. This is because
35

36
in polycrystalline materials, cracks must extend through
and around several grains and that while traveling along
grain boundaries many "high energy obstacles" may be
encountered. From his work he concluded that (in agreement
with Swanson, and others) there definitely is a relation
between the fracture surface energy values for the same
material with different grain sizes; Weiderhorn's conclusion
being that the fracture surface energy increased with
increasing grain size. The writer has no definite data which
would prove or disprove this statement, but feels that the
trend should be toward higher values with decreasing grain
size. The reasoning for this is merely the fact that
since smaller particles have much more grain boundary area,
upon fracture one is bound to encounter more "high energy
obstacles 13 " with smaller-grained materials than in
polycrystalline materials with larger grains. It must be
remembered too, that sintering and grain growth take place
in order to lower the internal energy of the system. 6 This
should all then imply that it should require less energy
to fracture a material with larger grains.
The value of fracture surface energy for a material
should be important in the prediction of fracture
resistance of solids. However, before these values can be
of any great help to people, it will be necessary to
develop a standard formula for the y calculations. This
formula must be valid for a w~de range of variations of
the specimens being tested. Summers 3 has shown the
37
possibility of getting a broad spread of values for exactly
the same material when some of the "accepted" surface energy
equations were used. For this reason one should thoroughly
examine not only the method used for the breaking of the
specimens, but also note the range of validity of the
equation used in the final calculations. If this is not
done, some very false conclusions may result from data that
is not really "legitimate."
Although Summers' work also showed that there was no
great variation in results by using different crack shapes
and widths (within limits), it is felt that increasing the
sharpness or at least reducing the width of the crack as
much as possible might help to reduce any stored or "extra"
energy input while loading the specimen.
One final suggestion or word of caution: one must
always be aware of the loading rate at which the specimens
are broken. Faster loading rates result in fracture at
reduced loads. To obtain more consistent data, it would be
advisable to have a loading set-up that would insure a
constant loading rate for all specimens.

38
VII. APPENDICES

APPENDIX A
SURFACE ENERGY SPECIMEN
PREPARATION
39
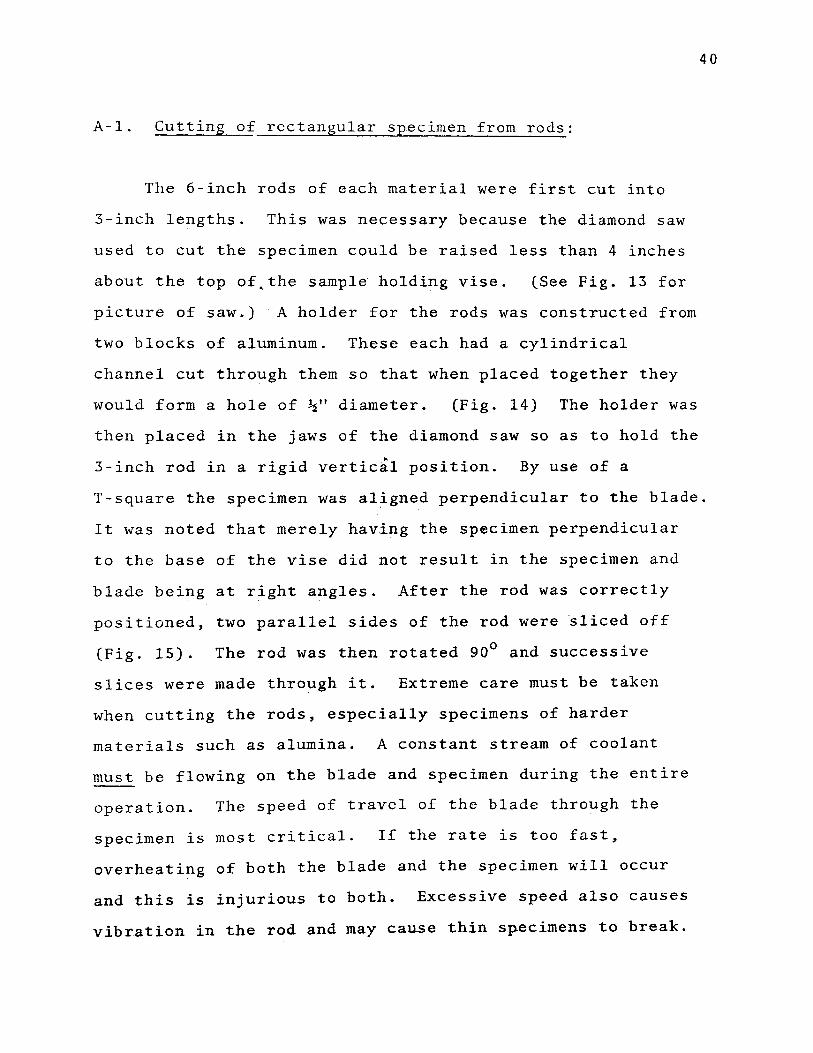
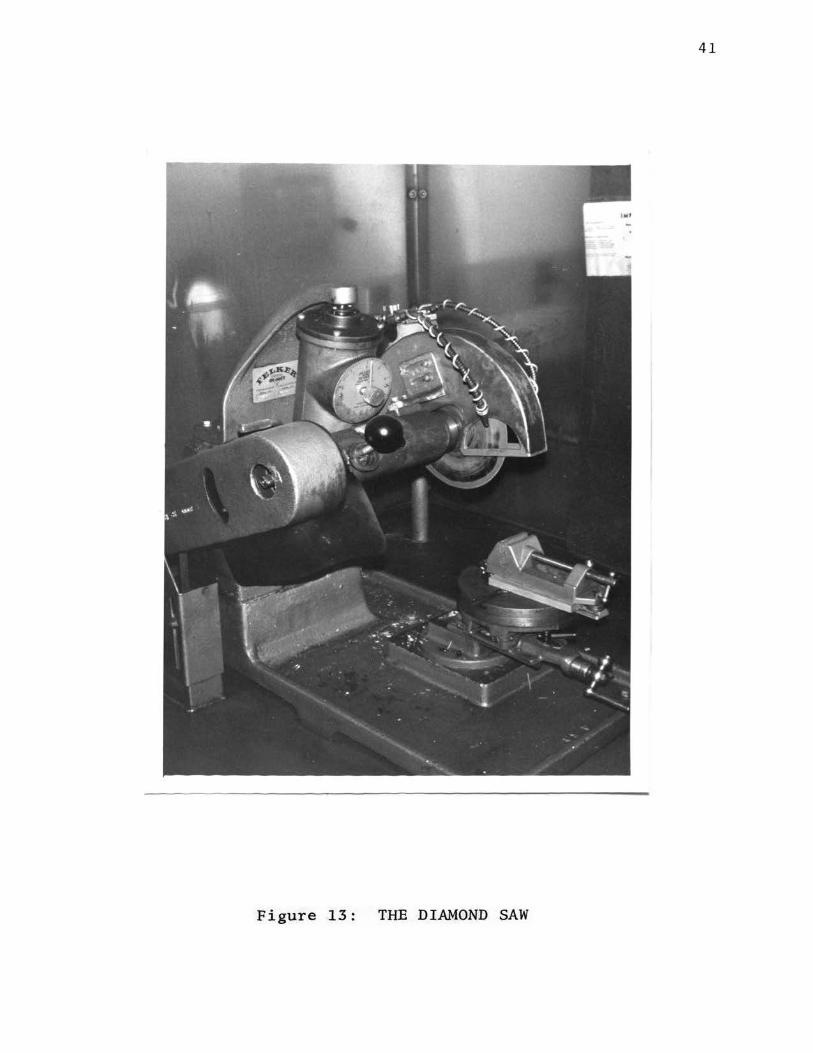
A-1. Cutting of rectangular specimen from rods:
The 6-inch rods of each material were first cut into
3-inch lengths. This was necessary because the diamond saw
used to cut the specimen could be raised less than 4 inches
about the top of~the sample holding vise. (See Fig. 13 for
picture of saw.) A holder for the rods was constructed from
two blocks of aluminum. These each had a cylindrical
channel cut through them so that when placed together they
would form a hole of ~" diameter. (Fig. 14) The holder was
40
then placed in the jaws of the diamond saw so as to hold the
3-inch rod in a rigid vertic~l position. By use of a
T-square the specimen was aligned perpendicular to the blade.
It was noted that merely having the specimen perpendicular
to the base of the vise did not result in the specimen and
blade being at right angles. After the rod was correctly
positioned, two parallel sides of the rod were ~liced off
(Fig. 15). The rod was then rotated 90° and successive
slices were made through it. Extreme care must be taken
when cutting the rods, especially specimens of harder
materials such as alumina. A constant stream of coolant
must be flowing on the blade and specimen during the entire
operation. The speed of travel of the blade through the
specimen is most critical. If the rate is too fast,
overheating of both the blade and the specimen will occur
and this is injurious to both. Excessive speed also causes
vibration in the rod and may cause thin s.pecimens to break.
41
Figure 13: THE DIAMOND SAW

42
~----
1
Figure 14: THE SPECIMEN HOLDER

43
j
Figure 15: FINISHED SPECIMENS

The thickness of the specimen may be determined by
noticing the travel on the vernier scale of the diamond
saw base or merely by eye. The minimum thickness that can
be cut is dependent not only on the operator of the saw but
also on the material being cut. In any case, a thinner
specimen may always be cut at lower speeds, (speed here
implying the rate of drop of the blade into the rod.)
A-2. Notching the surface energy specimen:
Two methods were used to notch the rectangular surface
energy specimc;::ns; (1) with a wire saw and (2) by using a
diamond saw. In either case it was necessary to mark the
center of the specimen before making the cut. It was found
that one could mark them quickly and more accurately by
cutting a thin piece of paper in the same lengt·h as the
specimen and folding ·it exactly in half. The folded paper
was then opened and the sharp outside edge of the fold used
as an indicator 0f the specimen's center. By placing this
paper over the specimen, the center line could then be
marked with the sharp point of a hard lead pencil.
(1) The wire saw:
The wire saw is the piece of apparatus pictured in
Fig. 17. Wires of varyi~g diameter may be purchased,
ranging from as small as 0.0035". Some blades are
44

Figure 16: NOTCHED SPECIMENS: (top) wire saw cut, (bottom) diamond
blade cut
45

available which have diamonds impregnated in them. We
found these to be most unsatisfactory. Most of these
"blades" are merely continuous wire loops which carry an
abrasive compound (in our case 600 mesh boron carbide).
The contents of the cutting mixture we used was: 1 part
water, 1 part boron carbide and 4 parts. glycerine (by
weight). This mixture has a tendency to separate upon
sitting and should be mixed vigorously before each using.
The main difficulty with the wire saw notching is
simply that the blades are quite costly and their life
span was usually quite short. Some "hints" which will aid
one in the use of the wire saw will be given though, since
it is a very effective method of producing a very thin cut
in a material.
It was found that the width of the resulting crack
was effectively the diameter of the blade that was used to
make the cut. With much patience and a good supply of
blades, a cut can be made in most any material providing
that the specimen is not thick enough to keep the liquid
abrasive from penetrating the entire length of the crevice.
"HINTS"
(a) First of all, don't be in a hurry to make a cut.
The time necessary: to make a cut 0.100" deep in a hard
46

47
material (i.e. alumina) that is .025 - .035" thick, may
range from 3 to 15 minutes. If one has a very good blade . '
it may be possible to make the cuts in a minimum time. The
main problem causing blade breakage is that the spot where
the wire is welded together tends to be of a larger diameter
than the rest of the blade and this does not allow the wire
to run smoothly over the specimen.
(b) Be sure to mark the center of the specimen before
placing it in the saw. In order to be able to easily
determine the advance of the wire through the material, it
was found that a piece of cellophane tape placed horizon
tally on the specimen at the depth the notch is desired to
stop, makes it much easier to determine when the notch is
deep enough. The reason the depth of penetration of the
wire is hard to observe without the tape is that the black
cutting compound tends to coat the center of the sample and
hide the pencil-marked crack depth. If the tape extends a
small distance from the area being cut, the tape's top edge
is easily visible and the wire's depth readily observed.
(c) Before beginning to cut the specimen with the
wire saw, it helps if one will very carefully place a layer
of cellophase tape along the back side of the sample holder.
This tape should be positioned so that its top edge is
located where the bottom e~ge of the specimen will sit.
Then, when the specimens are put in the holder, they may
48

be slid in until they are firmly resting on the top edge
of this tape and if the specimen is then perfectly uniform
in height, every specimen will be cut straight and little
effort is necessary to align them.
(d) If another piece of tape is stuck to the back
side of the sample holder (can be seen by closely
examining Fig. 17) this will create a small pocket between
the tape and the sample. This pocket serves as a . '
reservoir for the cutting fluid and if kept full at all
times, it will aid in the cutting.
(2) The diamond saw:
Notching was done with the diamond saw when it became
quite costly to notch the specimens with the wire saw.
Using this method it is possible to notch several specimens
at the same time. The general idea of this method is that
the specimens are embedded in a medium and then a thin
diamond blade is passed through the entire block which
contains them. In this work sealing wax was used to embed
the specimens. A piece of wood with several parallel cuts
in it was used to hold the specimens vertical while the hot
sealing wax was being poured into a rectangular mould. It
was first necessary to allign the centers of the specimens
and make sure that they were all flat against the bottom
of the mould. The wax was then poured into the mould and
49

everything but the notched wood block was covered with wax.
After the wax had hardened the sides of the mould were
removed and the piece of wood pried off. The block of wax
was then placed in the mould again and the remaining
portion filled with wax; the end result being a rectangular
block of sealing wax with several samples "hidden" inside.
(Figures 18 and 19 show the two steps mentioned above.)
50
With the blade of the diamond saw set at a constant depth,
the sample block was mounted under the blade and moved into
it. (The entire sample block must be level or else the
notch depth will not be predictable.) In this work a blade
thickness of 0.012" was used. This resulted in a notch
width ranging from .028 - .030". It might also be advisable
to mention that the use of some type of mould release is
advisable when moulding sealing wax, as it has a tendency
to adhere to most any uncoated surface.
To remove the notched samples from the wax, they were
soaked in an acetone bath. Boiling water would have melted
the wax, but it was feared that differences in expansion
coefficients of the specimen and the wax might result in
breaking the specimen inside. Methanol will also dissolve
the wax, but more slowly. It was used in the final cleaning
of the specimens.

51
Figure 18: EMBEDDING SPECIMENS: Step I

52
, ,·;~ - - .... ,. .. --·· ... '
~· • I
-=--
Figure 19: EMBEDDING SPECIMENS: Step II

A-3. Breaking specimens:
The unit used to break the surface energy samples is
pictured ih Fig. 1. The knife edge was centered over the
inverted crack in the specimen and the load applied by
slowly rotating the small gear on top the jig. This small
gear drove the large center gear which in turn forced the
shaft downward. Directly above and connect.ed to the knife
edge is a small Kistler, model 912 quartz load cell. This
unit contains a pressure sensitive quartz crystal. When a
load is applied to it a char.ge is produced which is directly
proportional to the load applied. The load cell was sen-
53
sitive to loads ranging from O.Ql to 5,000 psi. It was
coated with a 3140 RTV coating to insulate it from any
possible heat that might be absorbed from the operator's
hands. A calibration of our load cell (pressure vs. output)
may be found in Fig. 21. The output of the load cell was
sent through a charge amplifier which contained a calibration
device that allowed us to adjust the amplifier to match the
output of our load cell. The output of this amplifier then
fed into our recorder and the load could be read directly
from the recorder paper in pounds per square inch. This
load (p), was then used in the surface energy equation,
Eq. 6. Figure 20 shows the entire experimental set-up.

54
0 N

i '""" \1)
Q)
r 0 ...J
::s 0 v 0 I.J -Q. ~
~ Q. t::s 0
2.0oK
0 o 1 ,oo 1 2oo 1 Joo
\000 2000 3000 ~000
Figure 21: LOAD CELL CALIBRATION
5000
f,.PliT {LB.) ..
Cl1 Cl1

APPENDIX B
FRACTURE EDGE OF
SPECIMENS
56

B-1. Profile of Fracture Edge:
Figures 22 through 28 show the fracture edge of the
broken specimens. The photos are of all seven different
materials used and are magnified 16 to 24 times actual size.
The purpose in taking these photos was to examine the
fracture edge and see just how irregular it was. All the
calculations of fracture surface energy (y) assume the
fracture surface to be perfectly smooth. From the photos
seen earlier of the magnified surface, one can readily see
that in many cases fracture occurred almost entirely along
grain boundaries. This means that the surface was surely
not smooth and that this will cause the reported values of
y to be slightly high, the magnitude of error depending
upon the individual specimen's grain size.
57

58
Figure 23: STEATITE FRACTURE EDGE

58
Figure 22: ZIRCON FRACTURE EDGE
Figure 23: STEATITE FRACTURE EDGE

59
Figure 24: ALUMINA (99. 5% dense) FRACTURE ·EDGE
Figure 25: ALUMINA (99% dense) FRACTURE EDGE

60
Figure 26: ALUMINA (96% dense) FRACTURE EDGE
Figure 27: ALUMINA (94% dense) FRACTURE EDGE

61
l
Figure 28: MULLITE FRACTURE EDGE

APPENDIX C
DATA FROM SURFACE
ENERGY SPECIMENS
62

STEATITE #460
Sample Fracture L d b c c/d p p Surface Number Energy
c-1(1) 1.81" 0.348" 0.034" 0.107" .3075 4.94# 2.63 23,871 ergs/em 2
c-1(3) 1. 81 0.350 0.036 0.101 .2886 5.16 2.63 20,718
c-1(5) 1. 81 0.349 0.049 0.099 .2837 6.24 2.63 16,090
c-1(6) 1. 81 0.354 0.042 0.119 .3362 5.26 2.63 19,484
c-1(7) 1. 81 0.346 0.040 0.088 .2543 6.38 2.63 22,281
c-2(1) 1. 81 0.352 0.043 0.123 .3494 5.17 2.63 19,575
c-2 (2) 1. 81 0.352 0.030 0.094 .2670 4.39 2.63 18,992
c-2(3) 1. 81 0.350 0.028 0.105 .3000 3.61 2.63 17,772
c-2(4) 1. 81 0.354 0.053 0.100 .2825 6.60 2.63 14,632
c-2(5) 1. 81 0.365 0.031 0.096 .2630 5.34 2.63 23,029
c-2(7) 1. 81 0.360 0.045 0.096 .2667 6.74 2.63 18,519
c-2(8) 1. 81 0.361 0.045 0.094 .2604 6.48 2.63 16,428
c-3(1) 1. 81 0.362 0.032 0.113 .3122 4.76 2.63 22,673
c-3 (2) 1. 81 0.364 0.034 0.088 .2418 6.42 2.63 24,972 0\ (.N

Sample L Number
c-3(3) 1.81"
c-3(4) 1. 81
c-3(5) 1. 81
c-3(7) 1. 81
STEATITE #460 (cont.)
d b c c/d p
0.362" 0.044" 0.116" .3204 5.90#
0.363 0.036 0.105 .2893 6.10
0.360 0.031 0.105 .2917 4.62
0.352 0.030 0.112 .3182 4.16
(Crack width for all specimens = 0.010")
p
2.63
2.63
2.63
2.63
Fracture Surface Energy
19,223 ergs/cm2
25,945
20,850
22,167
0\ ...
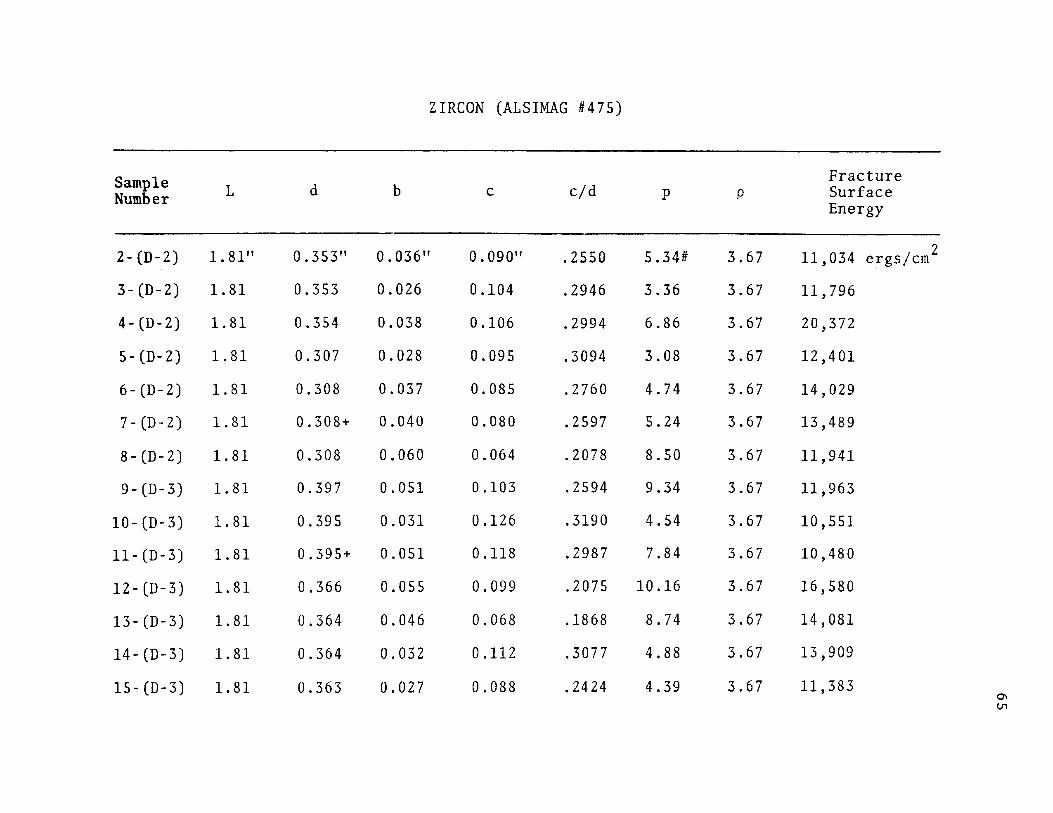
ZIRCON (ALSIMAG #475)
Sample Fracture Number L d b c c/d p p Surface
Energy
2-(D-2) 1.81" 0.353" 0.036" 0.090" .2550 5.34# 3.67 11,034 ergs/em 2
3- (D-2) 1.81 0.353 0.026 0.104 .2946 3.36 3.67 11,796
4- (D-2) 1. 81 0.354 0.038 0.106 .2994 6.86 3.67 20,372
5-(D-2) 1. 81 0.307 0.028 0.095 .3094 3.08 3.67 12,401
6- (D- 2) 1. 81 0.308 0.037 0.085 .2760 4.74 3.67 14,029
7- (D- 2) 1. 81 0.308+ 0.040 0.080 .2597 5.24 3.67 13,489
8- (D-2) 1. 81 0.308 0.060 0.064 .2078 8.50 3.67 11,941
9-(D-3) 1. 81 0.397 0.051 0.103 .2594 9.34 3.67 11,963
10-(D-3) 1. 81 0.395 0.031 0.126 .3190 4.54 3.67 10,551
11-(D-3) 1. 81 0.395+ 0.051 0.118 .2987 7.84 3.67 10,480
12-(D-3) 1. 81 0.366 0.055 0.099 .2075 10.16 3.67 16,580
13-(D-3) 1. 81 0.364 0.046 0.068 .1868 8.74 3.67 14,081
14-(D-3) 1. 81 0.364 0.032 0.112 .3077 4.88 3.67 13,909
15-(D-3) 1. 81 0.363 0.027 0.088 .2424 4.39 3.67 11,383 0\ tn
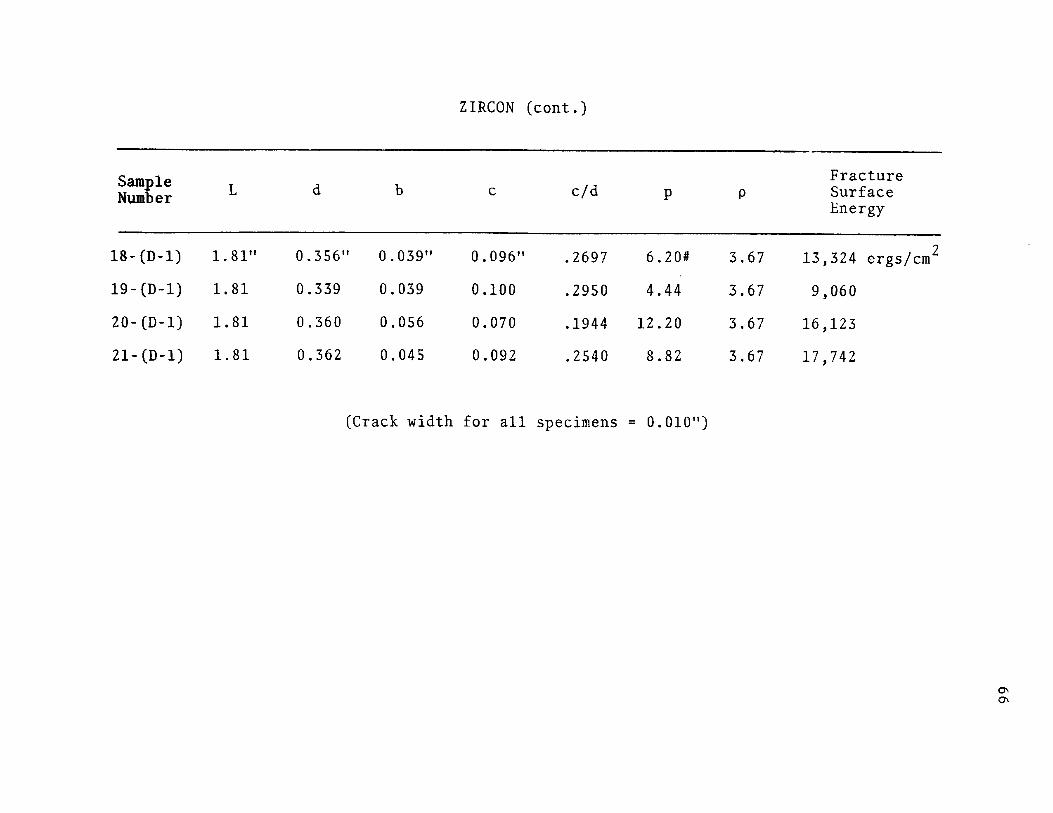
Sample L Number
18-(D-1) 1.81"
19- (D-1) 1. 81
20-(D-1) 1. 81
21- (D-1) 1. 81
ZIRCON (cont.)
d b c c/d p
0.356" 0.039" 0.096" .2697 6.20#
0.339 0.039 0.100 .2950 4.44
0.360 0.056 0.070 .1944 12.20
0.362 0.045 0.092 .2540 8.82
(Crack width for all specimens = 0.010")
p
3.67
3.67
3.67
3.67
Fracture Surface Energy
13,324 ergs/em
9,060
16,123
17,742
2
0\ 0\
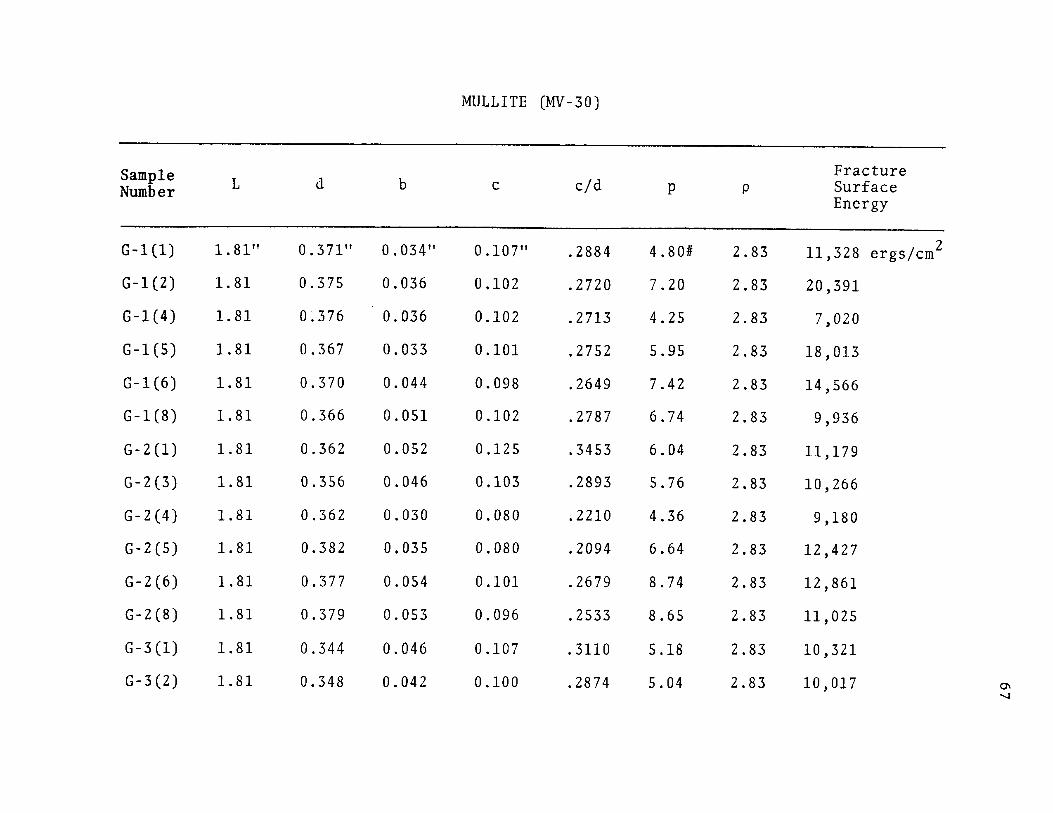
MULLITE (MV-30)
Sample Fracture L d b c c/d p p Surface Number
Energy
G-1(1) 1.81" 0.371" 0.034" 0.107" .2884 4.80# 2.83 11,328 ergs/crn2
G-1(2) 1. 81 0.375 0.036 0.102 .2720 7.20 2.83 20,391
G-1(4) 1. 81 0~376 0.036 0.102 .2713 4.25 2.83 7,020
G-1(5) 1.81 0.367 0.033 0.101 .2752 5.95 2.83 18,013
G-1(6) 1.81 0.370 0.044 0.098 .2649 7.42 2.83 14,566
G-1(8) 1. 81 0.366 0.051 0.102 .2787 6.74 2.83 9,936
G- 2 (1) 1.81 0.362 0.052 0.125 .3453 6.04 2.83 11,179
G-2(3) 1. 81 0.356 0.046 0.103 .2893 5.76 2.83 10,266
G-2(4) 1.81 0.362 0.030 0.080 .2210 4.36 2.83 9,180
G-2 (5) 1. 81 0.382 0.035 0.080 .2094 6.64 2.83 12,427
G-2(6) 1. 81 0.377 0.054 0.101 .2679 8.74 2.83 12,861
G-2(8) 1. 81 0.379 0.053 0.096 .2533 8.65 2.83 11,025
G-3(1) 1.81 0.344 0.046 0.107 .3110 5.18 2.83 10,321
G-3(2) 1. 81 0.348 0.042 0.100 .2874 5.04 2.83 10,017 0'1 ......,

Sample L Number
G-3(3) 1. 81 II
G-3(4) 1. 81
G-3(5) 1.81
G-3(6) 1.81
G-3(7) 1.81
G-3(8) 1. 81
MULLITE (cont.)
d b c c/d p
0.349" 0.036" 0.091" .2607 7.78#
0.334 0.046 0.092 .2754 5.98
0.336 0.042 0.102 .3036 7.70
0.332 0.048 0.089 .2681 5.90
0.332 0.037 0.093 .2801 4.64
0.332 0.048 0.096 .2892 6.90
(Crack width for all specimens = 0.010")
p
2.83
2.83
2.83
2.83
2.83
2.83
Fracture Surface Energy
28,073 ergs/cm2
12,564
28,329
11,017
12,202
16,793
0'1 00

SamLle Num er L
1(1-1) 1.67"
2 (I -1) 1.90
3(1-1) 1.90
4(1-1) 1.90
6(1-5) 1.90
7(1-5) 1.90
8(1-5) 1. 90
9(1-5) 1.90
10(1-5) 1.90
12(1-4) 1. 90
13(1-4) 1. 90
14(1-4) 1. 90
99.5% ALUMINA (ALSIMAG #753)
d b c c/d p p
0.381" 0.032" 0.140" .3675 8.18# 3.87
0.382 0.017 0.056 .1466 7.45 3.87
0.372 0.022 0.134 .3602 5.32 3.87
0.388 0.020 0.125 .3222 5.54 3.87
0.354 0.020 0.139 .3927 2.95 3.92
0.351 0.021 0.046 .1311 7.45 3.92
0.350 0.023 0.130 .3714 5.18 3.92
0.346 0.020 0.119 .3439 4.80 3.94
0.351 0.021 0.126 .3590 3.84 3.92
0.326 0.026 0.059 .1810 7.74 3.84
0.329 0.018 0.112 .3404 3.70 3.84
0.328 0.023 0.119 .3628 4.18 3.84
** Crack width 0.010" -- all others 0.028-0.030"
Fracture Surface Energy
17,193 ergs/cm2
19,687
20,881
19,750
10,764
15,027**
23,208
23,657
14,203
18,443
19,930
13,693
0\ \0

Sam£le Num er L
15(1-4) 1. 90"
16(1-2) 1.90
19(1-3) 1.90
21(1-3) 1.90
22(1-3) 1.90
23(1-3) 1. 90
24(1-2) 1.67
99.5% ALUMINA (cont.)
d b c c/d p p
0.333" 0.025" 0.030" .0901 9.471 3.84
0.064 0.023 0.033 .0907 10.30 3.84
0.352 0.018 0.063 .1790 6.28 3.90
0.359 0.019 0.122 .3398 3.96 3.90
0.348 0.025 0.119 .3420 4.68 3.90
0.354 0.024 0.125 .3521 4.71 3.90
0.362 0.016 0.028 .0773 8.15 3.84
** Crack width 0.010" -- all others 0.028-0.030"
Fracture Surface Energy
14,234 ergs/cm2** 15,210
19,725
15,578
13,994
15,454
13,280
""-! 0
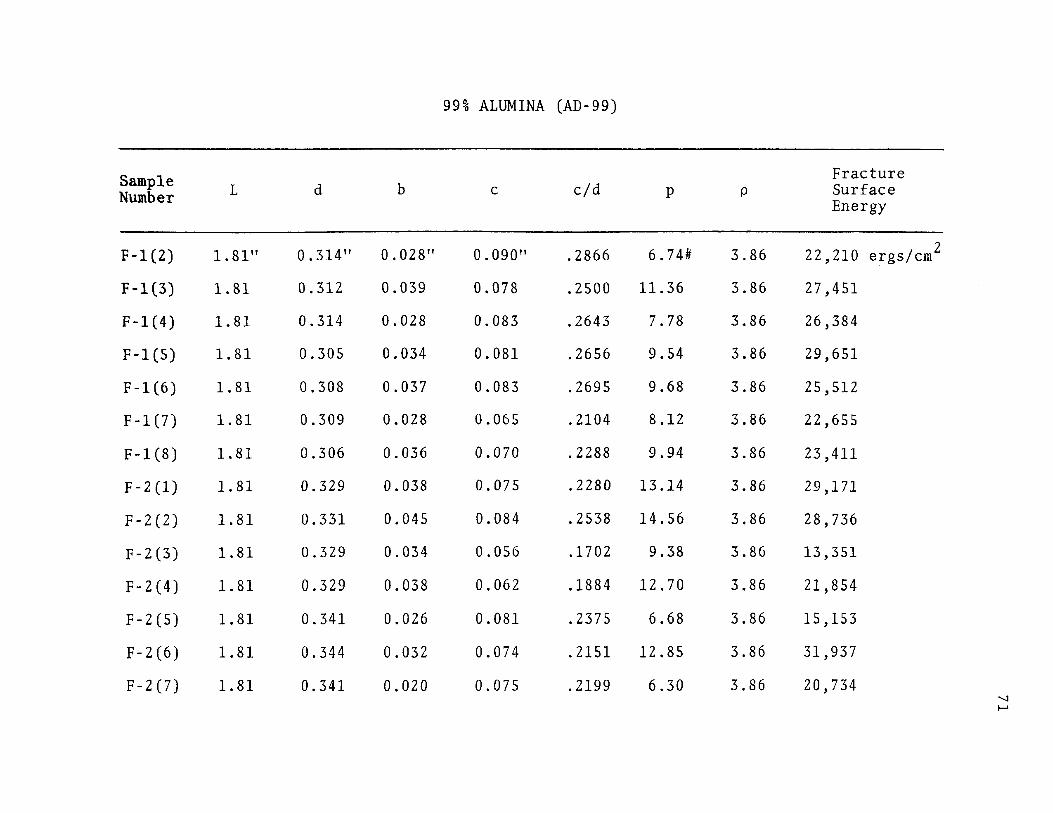
99% ALUMINA (AD-99)
Sample Fracture L d b c c/d p p Surface Number Energy
F-1(2) 1.81" 0.314" 0.028" 0.090" .2866 6.74# 3.86 22,210 ergs/cm2
F-1(3) 1.81 0.312 0.039 0.078 .2500 11.36 3.86 27,451
F-1(4) 1.81 0.314 0.028 0.083 .2643 7.78 3.86 26,384
F-1(5) 1.81 0.305 0.034 0.081 .2656 9.54 3.86 29,651
F-1(6) 1.81 0.308 0.037 0.083 .2695 9.68 3.86 25,512
F-1(7) 1. 81 0.309 0.028 0.065 .2104 8.12 3.86 22,655
F-1(8) 1. 81 0.306 0.036 0.070 .2288 9.94 3.86 23,411
F-2 (1) 1. 81 0.329 0.038 0.075 .2280 13.14 3.86 29,171
F-2 (2) 1. 81 0.331 0.045 0.084 .2538 14.56 3.86 28,736
F-2(3) 1.81 0.329 0.034 0.056 .1702 9.38 3.86 13,351
F-2(4) 1.81 0.329 0.038 0.062 .1884 12.70 3.86 21,854
F-2(5) 1.81 0.341 0.026 0.081 .2375 6.68 3.86 15,153
F-2(6) 1.81 0.344 0.032 0.074 .2151 12.85 3.86 31,937
F-2 (7) 1. 81 0.341 0.020 0.075 .2199 6.30 3.86 20,734 "-.J ......
Sample L Number
F-2(8) 1.81"
F-3(1) 1. 81
F-3(2) 1. 81
F-3(4) 1.81
F-3(5) 1. 81
F-3(6) 1. 81
F-3(7) 1. 81
F-3(8) 1. 81
99% ALUMINA (cont.)
d b c c/d p
0.341" 0.027" 0.074" .2170 11.18#
0.343 0.033 0.071 .2070 10.70
0.340 0.042 0.072 .2118 11.22
0.342 0.039 0.082 .2398 11.13
0.350 0.034 0.070 .2000 9.08
0.347 0.026 0.058 .1671 11.52
0.348 0.038 0.090 .2586 13.86
0.345 0.021 0.093 .2696 7.38
(Crack width for all specimens = 0.010")
p
3.86
3.86
3.86
3.86
3.86
3.86
3.86
3.86
Fracture Surface Energy
35,259 ergs/em
20,087
14,389
18,760
12,305
28,642
32,049
32,348
2
-.....)
N

Sample Number L
1 (A-3) 1.67"
Z(A-3) 1.90
3 (A-3) 1.90
4 (A-3) 1.90
5 (A-10) 1.90
7 (A-10) 1.90
8 (A- 2) 1. 90
9 (A- 2) 1. 67
10 (A- 2) 1. 90
ll(A-2) 1.90
12(A-2) 1.67
13 (A- 2) 1. 90
96% ALUMINA (ALSIMAG #614)
d b c c/d p
0.424" 0.064" 0.087" .2052 35.62#
0.427 0.029 0.077 .1803 13.62
0.426 0.040 0.079 .1854 17.05
0.428 0.030 0.068 .1589 14.10
0.392 0.043 0.145 .3699 9.64
0.394 0.036 0.055 .1396 18.95
0.302 0.072 0.061 .2020 36.60
0.398 0.058 0.093 .2337 19.00
0.418 0.056 0.072 .1722 22.49
0.416 0.040 0.036 .0865 27.25
0.395 0.068 0.101 .2557 27.75
0.370 0.062 0.095 .2568 20.60
** Very poor specimen (value discarded)
p
3.75
3.75
3.75
3.75
3.74
3.74
3.78
3.78
3.78
3.78
3.78
3.78
Fracture Surface Energy
26,659 ergs/cm2
21,063
18,010
18,357
17,059
26,140
81,864**
13,105
15,668
23,786
23,377
24,986
'I (.1'1
Sample L Number
14 (A- 2) 1.90"
15 (A-1) 1.90
16 (A-1) 1.90
17(A-1) 1.90
19(A-1) 1.90
96% ALUMINA (cont.)
d b c c/d p p
0.418" 0.030" 0.049" .1172 16.70# 3.78
0.344 0.028 0.066 .1919 8.51 3.75
0.394 0.047 0.087 .2208 14.60 3.75
0.383 0.064 0.076 .1984 24.30 3.75
0.397 0.062 0.090 .2268 21.40 3.75
(Crack width for all specimens = 0.028-0.030")
Fracture Surface Energy
20,641 ergs/em
18,417
14,854
21,395
18,493
2
.....,
.j::o

94% ALUMINA (ALSIMAG 1771)
Samh1e Fracture Num er L d b c c/d p p Surface
Energy
1 (B-1) 1.90" 0.363" 0.030" 0.051" .1405 12.90# 3.63 25,659 ergs/cm 2 2 (B-1) 1.90 0.347 0.041 0.078 .2248 11.97 3.63 22,559 3 (B-1) 1.67 0.365 0.030 0.056 .1534 13.10 3.63 21,682 4 (B-1) 1. 90 0.330 0.036 0.077 .2333 9.92 3.63 24,599 S(B-1) 1.67 0.364 0.052 0.098 .2692 19.14 3.63 29,802 6 (B- 2) 1. 67 0.384 0.062 0.090 .2344 27.26 3.64 30,947 7 (B- 2) 1. 67 0.384 0.080 0.087 .2266 33.30 3.64 25,818 8(B-2) 1.67 0.403 0.046 0.125 .3102 12.11 3.64 13,739 9(B-3) 1. 90 0.407 0.069 0.083 .2039 30.00 3.66 27,217
lO(B-5) 1. 90 0.364 0.038 0.088 .2418 13.60 3.66 27,321 11(B-5) 1. 90 0.365 0.037 0.026 .0712 25.87 3.66 30,456 13(B-5) 1. 90 0.374 0.034 0.027 .0722 22.28 3.66 25,124 14(B-5) 1. 90 0.372 0.039 0.027 .0726 24.25 3.66 23,108 lS(B-5) 1. 90 0.372 0.029 0.059 .1586 12.34 3.66 22,440 ....,
c.n

Sample L Number
17(B-5) 1.90,
18 (B-13) 1.90
19(B-13) 1.90
20(B-13) 1. 90
21(B-13) 1. 90
22 (B-13) 1. 90
94% ALUMINA (cont.)
d b c c/d p p
0.369, 0.029" 0.027" .0732 14.87# 3.66
0.352 0.033 0.026 .0739 17.70 3.63
0.342 0.046 0.164 .4795 . 7. 21 3.63
0.343 0.038 0.026 .0758 18.63 3.63
0.344 0.034 0.050 .1453 11.32 3.63
0.350 0.030 0.035 .1000 14.50 3.63
(Crack width for all specimens = 0.028-0.030")
Fracture Surface Energy
16,227 ergs/cm2
24,243
26,858
22,439
18,783
26,353
-....J 0\
APPENDIX D
MATERIALS AND THEIR
SUPPLIERS
77

D-1. Donated Materials:
The 99.5~ 96 and 94% aluminas, the steatite and zircon
were donated by: THE AMERICAN LAVA CORPORATION
Chattanooga., Tennessee 37045
through the efforts of Dr. Joe Bailey.
The mullite rods were donated by:
MC DANEL REFRACTORY PORCELAIN CO. 510 Nineth Avenue Beaver Falls, Pennsylvania 15010
The "HITEC" high temperature heat transfer salt was
donated by:
I. E. duPONT deNEMOURS & CO., INC. Explosives Department Wilmington, Delaware
D-2. Other Materials Used in Work:
Diamond Saw Blades (as thin as 0.012"):
CHAPMAN KNIVES & SAWS 3366 Tree Court Industrial St. Louis, Missouri
Wire Saw Blades and Abrasive:
SOUTH BAY TECHNOLOGY
4900 Double Drive El Monte, California 91731
78

Load Cell and Charge Amplifier:
KISTLER INSTRUMENT CORPORATION Clarence, New York
79

VIII. BIBLIOGRAPHY
1. AINSWORTH, John, "The Damage Assessment to Thermal Shocked High Density, High Purity Alumina," Ph.D. Dissertation, Universit~ of Missouri-Rolla Library Rolla, Missouri, 1968. '
2. DAVIDGE, R. W. and TAPPIN, G., "The Effective Surface Energy of Brittle Materials," J. Mat'ls. Science, ~~ 165-73 (1968).
3. SUMMERS, David A., et al., "A Comparison of Methods for the Determination of Surface Energy," Proc. -12th Symposium on Rock Mechanics, November 1970.
4. SRAWLEY, John E., "Plane Strain Fracture Toughness," Fracture, Leibowitz, Ed. (New York: Academic Press, 1969) 4, 45-68.
80
5. CHEN, Li-King, "Surface Energy Determinations in Plexiglas," M.S. Thesis, University of Missouri-Rolla Library, Rolla, Missouri, 1970.
6. WULFF, J., ROSE, M., et al., "Thermodynamics of Structure," The Structure and Proterties of Materials (New York: John W1ley Sons, Inc., 1966) 2, Chap. 3, 46-59.
7.
8.
9.
STEWART, G. H., "Science of Ceramics," pub. by The British Ceramic Society (London and New York: Academic Press, 1965) ~·
WEIDERHORN, S.M., "Fracture in Ceramics," Mech. and Therm. Prop. of Ceramics, J. B. Wachman, Jr., Ed. (NBS Special Pub. 303, May 1969).
TATTERSALL, H. G. and TAPPIN, G., "The Work of Fracture and Its Measurement in Metals , Cer. and Other Mat'ls.," J. Mat'ls. Sci.,.!_, 296-301 (1966).
10. ALLEN, B. C., "The Surface Tension of Liquid Transition Metals at Their Melting Points," Trans. Met. Soc. AIME, 227, 1175-83 (Oct. 1963).
11. KENNY, William J., "Energy-New Surface Relationship in ·the Crushing of Solids-Slow Compression Crushing of Single Particles of Glass," Ph.D. Dissertation, University of Minnesota, 1957.
12. PICKETT, Gerald, "Equations for Computation of Elastic Constants from Flexural and Tortional Resonant Frequencies of Vibration of Prisms and Cylinders," ASTM Proceedings, 45, 846-59 (1945).
81
13. WEIDERHORN, S.M., "Crack Propagation in Polycrystalline Ceramics," Ultra-fine-grained Ceramics (New York: Syracuse Un1vers1ty Press, 1970).

IX. VITA
Gene Arthur Pahlmann was born on July 27 1946 in ' '
Alton, Illinois. He was the first of three sons born to
Mr. and Mrs. Herman W. Pahlmann. His grade-school
education took place in Roxana and Alton, Illinois,
Fort Wayne, Indiana and finally Wood River, Illinois, where
he entered Junior High School and graduated from High School
on June 6, 1964. In September of 1964 he entered the
University of Missouri-Rolla as a freshman in Ceramic
Engineering. On January 19, 1969, he received his
Bachelor of Science in Ceramic Engineering and also a
commission as Second Lieutenant in the United State Army
Reserve.
His college education was financed through the
generous help of his father and by working during the
summers on cross-country natural gas pipeline construction.
In January of 1969 he enrolled as a special student in
the graduate school at the University of Missouri-Rolla.
In February of 1970 he received a fellowship from the
Refractories Institute, which lasted through the following
September, while he worked on his Master of Science in
Ceramic Engineering.
82

His academic interests lie not only in the field of
ceramics, where colored glasses are his greatest interest,
but also in the fields of explosive research and polymers.
83


![ASSESSMENT GEOLOGICAL REPORT ON [AIRPHOTO FRACTURE …aris.empr.gov.bc.ca/ARISReports/11832.pdf · assessment geological report on [airphoto fracture density analysis] on the perk](https://static.fdocuments.in/doc/165x107/5accbba17f8b9a93268cd027/assessment-geological-report-on-airphoto-fracture-arisemprgovbccaarisreports11832pdfassessment.jpg)