FRACTALITY OF SPATIAL DISTRIBUTION WITHIN BYTOM SYNCLINE, UPPER SILESIA ... · acta montana irsm as...
8
ACTA MONTANA IRSM AS CR (1996) Series A, NO.9 (100),65-72 FRACTALITY OF SPATIAL DISTRIBUTION OF BOTH FAULTS AND SEISMIC EVENT S WITHIN BYTOM SYNCLINE, UPPER SILESIA ADAM IDZIAK and LESLAW TEPER Uui versi ty of Silesia, Ear-th Sel. Faculty, Sosuowiec , Poland ABSTRACT. The Bytom syncline is one of main structural units forming the Upper Silesian Coa! Basin (USCB). It is the region wliere the great seisrnic activity is observed. The'ellergy of seismic event is usually les s tlian 10 7 J but Irem tirne to time tremors with energy greater t lran 10 B J occur. To expl ain if the higgest seismic eveuts can be connected with receut tectouic aetivity tlre fault network geolll.etry ancl spatial clistri but ion of seisrnic event epicenters were stuclied using fractal analysis. The ealculated fract al dimension of fault network was close to 1.G aud it was similar to the Iract al dirue nsio n 01' epiceuters equal to 1..52. This similarity may suggest that the whole fault network of the Bytom syncline is engagecl in generatiug seismic events. 1. STRUCTURE OF THE BYTOM SYNCLlNE Upper earboniferous deposits of northern part of the USCB are extensively folded. One of the bíggest depressíonal structures in the area is a synclinorial unit which was formed north of the Main anticline. The Bytom syncline forms the western part of the unit. Geometrie features of the Bytom syncline are similar to these of another neighbonr synforms aud antiforrns, pointing to their eommon origin [Tepel' 1988]. The features are, as follows: stable azimuth of structure elon- gation, sigmoidal bend ofaxis terrninations, asyrnmetry, southern vergence ancl braehysynclinal shape. Northern limb of the Bytom syncline, whieh has a clip of approx. 7 0 in the axial part, is much steeper in the peripheric part of the syncline reaching 60°, somewhere 80° (Andaluzja coalfielcl) and has sporaclically vertieal 01' even overturnecl position (Mieehowiee coalfield). The clip of the southern flank is not higher than 10° to N 01' NNW, In a transition zone between the Bytom syncline and clomes of the Main anticline dip angles reach 25°. The resultant orien tat ion of the axis is 286/4 0 while the axial surface is vertical. The Bytom syncline represents a type of widely-spaced, upright, asyrnrnetric brachysynforrn with southern vergenee ['feper 1988]. The first-rank basernent fracture along NE border of the USCB, called the Cra- cow deep fault, was infiuencing the rock -mass deforrnation in the Bytom syncline at least cluring Variscan time. Dúe to the activity of this fault, a system of folcls ancl faults was created. Its type, regulari ty and geometry were characteristic for
Transcript of FRACTALITY OF SPATIAL DISTRIBUTION WITHIN BYTOM SYNCLINE, UPPER SILESIA ... · acta montana irsm as...
ACTA MONTANA IRSM AS CR (1996)
Series A, NO.9 (100),65-72
FRACTALITY OF SPATIAL DISTRIBUTION
OF BOTH FAULTS AND SEISMIC EVENT S
WITHIN BYTOM SYNCLINE, UPPER SILESIA
ADAM IDZIAK and LESLAW TEPER
Uui versi ty of Silesia, Ear-th Sel. Faculty, Sosuowiec , Poland
ABSTRACT. The Bytom syncline is one of main structural units forming the UpperSilesian Coa! Basin (USCB). It is the region wliere the great seisrnic activity isobserved. The'ellergy of seismic event is usually les s tlian 107 J but Irem tirne totime tremors with energy greater t lran 10B J occur. To expl ain if the higgest seismiceveuts can be connected with receut tectouic aetivity tlre fault network geolll.etry anclspatial clistri but ion of seisrnic event epicenters were stuclied using fractal analysis.The ealculated fract al dimension of fault network was close to 1.G aud it was similarto the Iract al dirue nsio n 01' epiceuters equal to 1..52. This similarity may suggestthat the whole fault network of the Bytom syncline is engagecl in generatiug seismicevents.
1. STRUCTURE OF THE BYTOM SYNCLlNE
Upper earboniferous deposits of northern part of the USCB are extensivelyfolded. One of the bíggest depressíonal structures in the area is a synclinorialunit which was formed north of the Main anticline. The Bytom syncline formsthe western part of the unit. Geometrie features of the Bytom syncline are similarto these of another neighbonr synforms aud antiforrns, pointing to their eommonorigin [Tepel' 1988]. The features are, as follows: stable azimuth of structure elon-gation, sigmoidal bend ofaxis terrninations, asyrnmetry, southern vergence anclbraehysynclinal shape.
Northern limb of the Bytom syncline, whieh has a clip of approx. 70 in the axialpart, is much steeper in the peripheric part of the syncline reaching 60°, somewhere80° (Andaluzja coalfielcl) and has sporaclically vertieal 01' even overturnecl position(Mieehowiee coalfield). The clip of the southern flank is not higher than 10° to N01' NNW, In a transition zone between the Bytom syncline and clomes of the Mainanticline dip angles reach 25°. The resultant orien tat ion of the axis is 286/40 whilethe axial surface is vertical. The Bytom syncline represents a type of widely-spaced,upright, asyrnrnetric brachysynforrn with southern vergenee ['feper 1988].
The first-rank basernent fracture along NE border of the USCB, called the Cra-cow deep fault, was infiuencing the rock -mass deforrnation in the Bytom synclineat least cluring Variscan time. Dúe to the activity of this fault, a system of folclsancl faults was created. Its type, regulari ty and geometry were characteristic for

66 A.IDZIAf< and L.TEPER
the strike-slip stress fielcl with dextr al component of horizontal movement [Tepel'1988; 1990J.
A cleep-rootecl \,y-E orientecl fracture locatecl south of the Bytom syncline hascontrollecl the formation of new faults, as well as rejuvenation ane! modificationof the ole! 011es since the Tertiary [Teper et aJ. 1992]. The Tertiary-to-presentclynamics of the studied area has been clominatee! by force couple causing sinistralrelative movements of basement segments along the equatorial discontinuity (op.cit.). In a derivative structural pattern, which has appearecl in response withinthe sedimentary cover of the Bytom syn cline, submeridional dip-slip faults are themost frequent. That is consistent with a shape of externai part of fault network ina model of broad wrench zone introduced for the area [Teper, Sagan 1995J.
2. SEISMICITY OF THE BYTOM SYNCLINE
The Bytom syncline is a region where great seismic activity is observed. Mostof the seismic events, assumed to be inclucecl by mining activity, have the energynot exceeding 107 J. Their localization and character suggest an association withthe generation of new discontinuities in rock mass. The tremors with higher energyare also registered but their frequency is much lower. In the time interval 1977-1991 there were 1651 tremors with energy 106 J or more occurring in the stucliedarea, but only 189 of them had energy not less than 107 J. The irnpact of regionaltectonic processes on the origin of the strongest seismic events is postulatecl bysome of authors investigating the ine!uced seismicity of the USCB [Idziak, Zuberek1995].
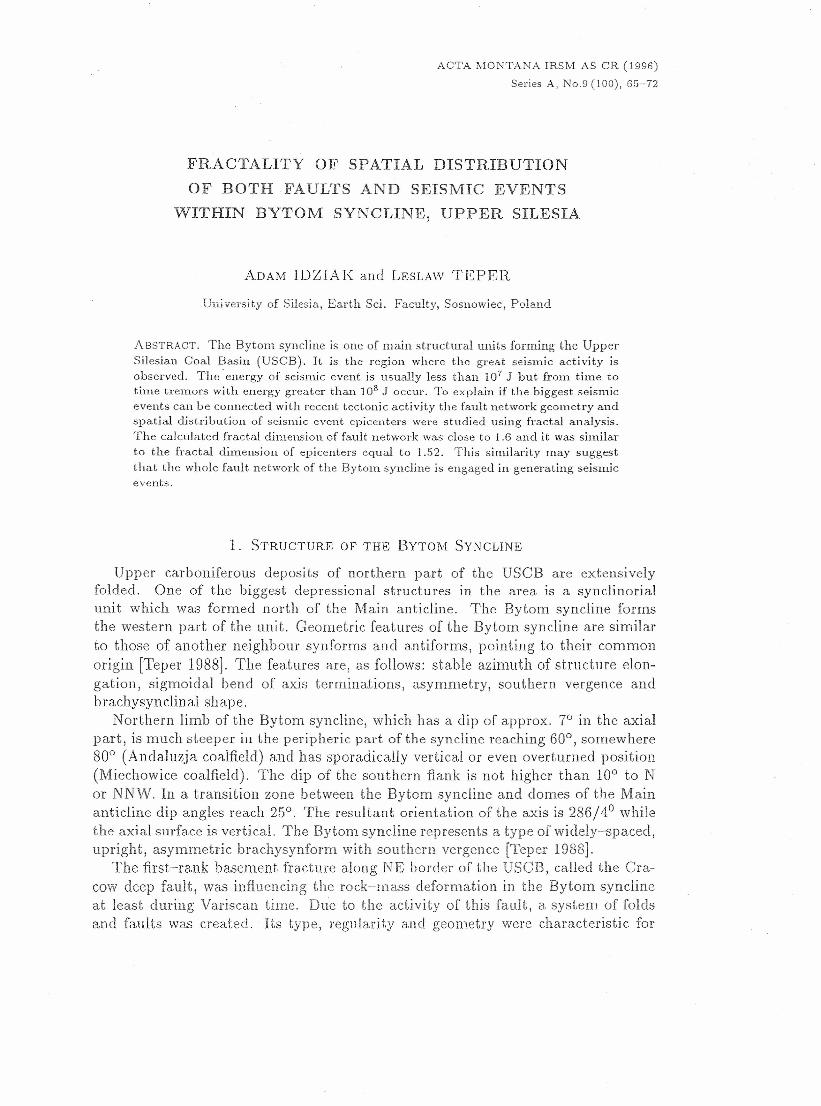
The spatial clistribution of tremor epicenters is homogeneous neither in the USCBas a whole nor in the Bytom syncline. The seismic map of the USCB is shown inFigure 1. Despite of mining activity carried out in all the USCB area tremor epi-centers concentrate in four regions connected with different geological units. In theBytom syncline bigger seismic activity is observed in the western ancl central partsof this structure and it e!ecreases toward the eastern part (Figure 2). Inhornogeneityof spatial tremor distribution suggests the fractal character of seismic phenomena.It means that spatial clistribution of seismicity in the Bytom syncline should bescale invariant.
3. FRACTAL GEOMETRY OF FAULT SYSTEMS IN THE BYTOM SYNCLINE
The geometry of fault systems in the Bytom syncline is complex and fractalmethocls have to be employed to describe it. To deterrnine the fractal climensionof these systems the algorithm known as a "box countirig methocl" was appliecl.Accordingly to the algorithm a fault network was firstly covered by No squareswith a side length 7'0. In the next steps the fault lines were covered with boxeswhose side length clecreased in sequent iterations. The lowest number of boxesneeded for covering all of the fault lines was counted in every iteration. If thefault systeme had a self'-similar structure this number shoulcl satisfy the following

FRACTALITY OP SPATIAL DISTRIBUTION OP BOTH FAULTS AND SEISMIC EVENTS ... 67
-1 aXJD -8X.()
0r---~---r..--'----r---T---~---r--~----r-~o
HXXXl-I---+-'
~
= fI~ ~€I ~*~.
~i I--I-~I
3CaXl I ---t--II j .•.
@$~ t-•
I YI
FIG. 1. Distribution of seismic events in the USCB dur ing 1977 - 1991period mapped in local geographieal coordinates.
equation [Manclelbrot 1983]:
N(rd = No . (!:i) -D J
1'0(1)
where N (Ii) is the number of boxes of sicle length li covering the faults lines anclD is the fractal dimension of fault system.
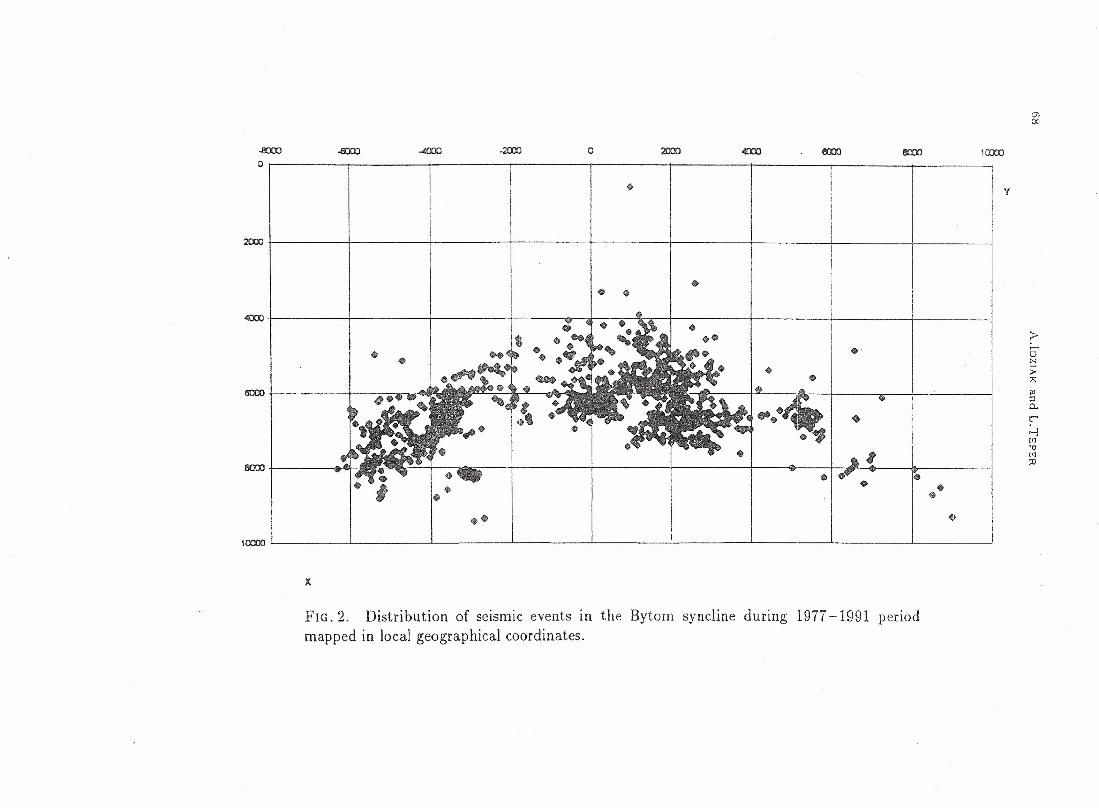
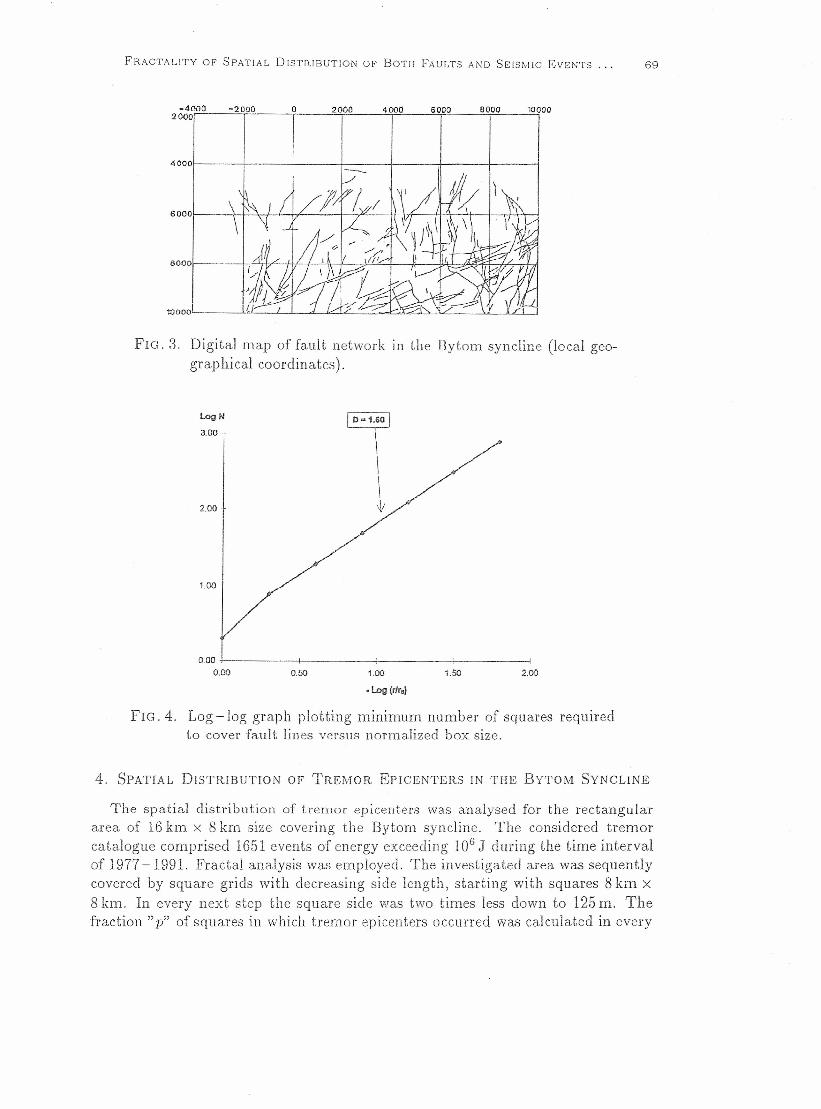
The log N - log(rlro) graph plotted for the experimental data should be linear.For the fault systems mapped in the Bytom syncline area (Figure 3) this graph
was linear in the box size range of 125 m to 8 km (Figure 4). The calculated fractaldimension of fault network was 1.60. Accordingly to [Hirata 1989] this value isan upper limit to the fractal dimension of the fracture geometry and points tothe generation of discontinuities in eonclitions of minimum energy needed for crackgrowth. The lower limit of fractal relationship for I = 125 m was due to the mapscale (1:25 000) whereas the upper limit was connected with the size of separatefault systems. For the boxes of side leugth bigger than 8 km spatial distributionof the clifferent fault systems was taken into account and the fractal dimension
changed.
o 110OO.s:JXJ
o~---------r---------r---------r---------r----~-----r--------~-----~
IOXO L- L- L- L- L- ~ ~ ~ L_ ~
FIG.2. Distribution of seismic events in the Bytom syncline during 1977 -1991 periodmapped in local geographieal eaordinates.
Ol1)0
HIlOO
y
F'RACTALITY or SPATIAL DISTRIBUTION or 80TH F'AULTS AND S81SMIC EVENTS .•. 69
4000r-·----~----------_+----~------~----~----4
600o f-----+-+--\c F-i--h"---'-----+-~c...--H \II---H·'-',--'+--+--'+-I+-1
-40002000
-2000 o 2000 4000 BOOO
I6000 10000
''"'I1Oooo~1 ----~~ __ L-L-~~~ __ ~dCd
Fw. 3. Digital map of fault network in the Bytom syncline (Ioeal geo-graphical coordinates).
LogN
3.00
1.00
2.00·
0.000.00 1.00
• Log (r/r.)
1.50 2.000.50
FIG. 4. Log -log graph plotting minimum number of squares requiredto cover fault lines versus norrn alized box size.
4. SPATIAL DrSTRIBUTION OF TRE!VIOR EPICENTERS IN THE BYTOM SYNCLINE
'I'he sp a.ti al clistribut.ion of trernor ep icent.ers was analysecl for the rectangulararea. ať 16 km x 8 km size eavering the Bytom syncline. The considered tremorcata.logue cornprised 1651 events oť energy exceeding 106 J during the tirne intervalof 1977 -1991.F'ractal a.nalysis was employed. The ínvestígated area was sequentlycovered by square gricls with decreasing side length, starting with squares 8 km x8 km. In every next step the square side was two tirnes less down to 125 m. Thefraction "p" of squares in which tremor epicenters occurrecl was calculated in every

70 A.IozrAl< and L.TEPER
iterative step. Fractal spatial clistribution of tremors should satisfy the relationship[Turcotte 1992]:
(
\ 2-Dp(7') = ~ 1 ,
roj(2)
where D is the fractal dimensíon of probability distribution and 1'/1'0 - the ratio ofsquare's sicle length "7'" to the initiallength 1'0.
The results obtained for the investigated structural unit (Figure 5) pointed outthe fradal distribution of tremors with fractal climension D = 1.52 for the grid sidebigger than 0.5 km.
-r.eo -1.60 ~1.~O -1.20 -1.00 -0.80 -O.BO -Q . .t!-O -0.20 0.00
logp
.,'I
//'
jt ",--
.0.20
.0.40
.0.60 [~-=D··19:1-"11
---c.0.80
-1.00
-1.20Log (m.)
FIG. 5. Log -log graph plotting geometrical probability of tremors oc-currence versus normalized box size.a - ernpirical clistribution of epicentersb - simulated random distribution of epicenters('. - estimated fractal distribution of epicenters
The geometrical probability af seismic event occurrence for randomly distributed1651 events with respect ta grid size is also shawn in Figure 5. As one can notice,the experirnental results differ significantly from the random distribution for thewhole--scale range. For grids with sides much bigger than the size of tremor focithe spatial distribution of epicenters is self - sirnilar. It rneans they tend to groupingthemselves in some areas. The lawer limitation af fract al distributian suggests thatinside the clusters the tremor distribution is either random or changes its fractalclimension. For a large scale of observation the tremors focus cannot be treatedas a point but as fracture ~one of finite dirnension cornparable with the length of agrid side. It affects epicenter localization accuracy ancl may break down the fract aldistribution of epicenters.

FRACTAL1TY or SPATIAL D1STRIBUT10N or 80TH FAULTS AND SE1SM1C EVENTS 71
5. Drscussror-
The spatial distribution of tremor epicenters is characterizecl by a geornetricalprobability of trernor occurrence in the chosen area. The distribution is fractal ifits depenclence on area size is governecl by a power law. The fract.al dimensioncan be explainecl by the concept of renormalization. Firstly the stuclíecl region iscovered by No squares and then every square is cliviclecl into k2 srnaller cells. Letthe probability of tremor occurrence be the same in every cell and equal to "f".Continuing this process n-times we will obtain k2n boxes. The average number ofboxes with tremors will be equal to (fk2y!. It is simple to sliow that the fr act alclimension of the distribution depends on " f":
D = Log (f.k2) .Logk
(3)
For a uniform distribution of tremors (J = 1) the fractal climension is equal to 2.The fractal dimensi on D = 1.52 is obtained for f ~ 0>7.
The presentecl results indicate that considered induced seismici.ty in the Bytomsyncline can be clescribecl as a fractal pracess in the limítecl range of scale. Thefractal dimension is equal to 1.52 what means that areas with trernors are morefrequent than those without seismic activity.
The "box counting" algorithrn - usecl for a fault network - gives the fractaldimensí on called the Kolmogorov's capacity dimensiou which is a measure 01' fillingthe spa.ce by elernents of investigated structure. The D - value obtained for theBytom syncline fault network characterizes a quite dense structure, similar to ariver network, with branches of first order, second order etc.
The sirnilarity of both ..:..tremor distribution aud fault geometry - fractal cli-mensions suggests that the whole fault network may be engaged in generating oftremors in the Bytom syncline. It can support the hypot.hesis about an importantrole of tectonic structure in the inducement of the strongest tremors.
Acknowledgment. The presentecl work was a part 01' the project supported bythe Scientific Research Committee of the Repu blic of Poland (grant KBN 9 S6 02045 03).
REFERENCESHir-ata T. (1989), Frccl al Dimension o] Fa uli 5'ysiems ln lapan - Fmct al Stru cture in Rod;
Fracture Geom eir-j a.i Various Sc al es, Pure Appl. Geophys. 131,1.57-170.Idziak A., Zuberek W.M. (1995), Fra.cuil ana/ysis o] mining indttced seísmicity in the Upp er
Si/esian Coa/ Basin, In: H.P.Rossmanith (editor), Ivlechanics of .Jointed arid Fault ed Rock,Balkerua, Rot t.crdam , pp. 679-682.
Manclelbrot B.B. (1983), Tlie Fractal Geometry o] No.Lure, Freernan , New York.Tepel' L. (1988), D'ejornva.tiow p attern o] Up p er carb onijero-us co-m plex rec oqni sed by some qeo m e-
chanica/ ro ck p ro p erties examin·ing in ih e NE p a+i oj Up p er Si/esian Co al Ba.sin, Ph.D.Thesis,Central Miniug Inst., Kat owice. (in Polish)
Tepel' 1. (1990), Correlauon betuieeti fold tectouics in NE p ari oj ih e USCB an d ib:e type o]dejormaiioti ob tain ed [rotti slrike-slíp zone model/ing, Proc. 3rcl Conf. "Development in CoalMining Geology", Paper Centr. Míníng Inst., Katowice, pp. 240-254. (in Polísh)

72 A.loZIAK and L.TEPER
Teper L., Idziak A., Sagan C., Zuberek W. (1992), New o.pp ro a ch: to the studíes o] the relatíonsbetsueen tectonics and míning trem ov OCCUTTenCe on example oj ilie Upp er Sílesian Oo al Basin(Poland), Acta Mont ana A2(BB), 161-177.
Teper L., Sagan G. (1995), Geolo q ical history and min ing seismicity in Up p er Si!esia (Paland),In: H.P.Rossmanith (editor), Mechanics of Jointed ancl Faultecl Rock, Balkema, Rotterclam,pp. 939-943.
Turcotte D.L. (1992), FTada/s and chaos in geology and geophysics, Cambridge Univ. Press, NewYork.