FPC reports an operating profit and sharply growing revenues
14
Fingerprint Cards AB (publ) Interim report April-June 2015 1 Fingerprint Cards (FPC) Interim Report for the second quarter, April-June 2015 FPC reports an operating profit and sharply growing revenues CEO’s comments Revenues for the second quarter of 2015 totaled SEK 445 M, up 912% year-on-year, and 218% compared with the first quarter of 2015. The sharp increase in revenues was due to a broad-based decision by smartphone suppliers earlier this year to introduce touch fingerprint sensors in their smartphones, which accelerated market growth, and to FPC’s ability, through our strong market position due to leading technology and a broad product portfolio, to meet customer needs. In the second quarter, the business generated an operating profit and a continued positive cash flow from operations. Operating profit totaled SEK 65 M during the second quarter of 2015, compared with a loss of SEK 19 M in the first quarter of 2015. The adjusted gross margin was 38% compared with 36% in the first quarter of 2015, and the gross margin was 36% compared with 27% in the first quarter of 2015. The improved gross margin was attributable to a changed product mix. The second quarter and period up to the interim report has, as continuously communicated, been characterized by an increased order inflow from FPC’s module partners and at the end of the quarter, the order backlog amounted to SEK 1,335 M. The reason for this is the growing number of smartphone suppliers who have chosen to integrate FPC’s touch fingerprint sensors in smartphones. During the period, Huawei, HTC, Oppo, Newman, LeTV, Coolpad, Meizu, Dazen, ZTE, Oneplus and ZUK launched smartphones with FPC’s touch fingerprint sensors, confirming FPC’s position as the leading supplier of touch fingerprint sensors to the smartphone market. A further sign of our strong position is that customers in their marketing of newly launched smartphones are increasingly announcing that they contain our sensors, with the improved features of our new touch fingerprint sensors receiving clear exposure. The performance and other features of the touch fingerprint sensors enable our customers to offer consumers a great user experience, making the touch fingerprint sensor a key component of their mobile. Another highly significant event during the quarter, from both a market perspective and for FPC, was that Google unveiled the new features in the next version of the Android operating system. The new version, known as Android M and now named Marshmallow or Android 6.0, will feature complete platform support for fingerprint sensors as well as Android Pay, a payment service that uses the fingerprint sensor to verify the identification of the user. When Google demonstrated the new services at its preview event on May 28, the prototype units used FPC’s touch fingerprint sensor FPC1025, which further underlines FPC’s industry leadership. Google’s introduction of support for fingerprint sensors in Android M, combined with the major interest in secure mobile payments from both consumers and smartphone suppliers, is considered a strong driver for the rapidly increasing penetration of fingerprint sensors in smartphones. During the second quarter, we launched two new touch fingerprint sensors: FPC1022 and FPC1035. These are primarily intended for rear-mounted integration with smartphones, where we have established a very strong market position, particularly with FPC1025 which has already been integrated with numerous launched smartphones. As part of our ambitious technology development, we can now also enable market-leading biometric performance for our latest touch fingerprint sensors, where the size of the sensor is significantly reduced compared with earlier sensors. The smaller size makes our sensors highly competitive, since phone integration will be easier. All launched touch fingerprint sensors to date in our product portfolio are now in mass production. The strong increase in sales means that, together with our suppliers and other partners, we have delivered sharply growing volumes over a short time. This requires a major effort from both FPC and our partners, but due to a variety of measures, our assessment is that we are well-equipped to meet the growing demand for our products. Apart from the rapidly growing touch fingerprint sensor business for smartphones, we are continuing to develop our offering for smartcards. This is paving the way for new, complementary business opportunities over time in cooperation with Zwipe and other business partners. We remain confident in continuously growing volume deliveries and a large number of new product launches featuring our touch fingerprint sensors. Future prospects Revenues for the third quarter of 2015 are expected to be approximately SEK 860 M, corresponding to year-on-year growth of more than 1200%. Due to the continued increase in gross profit and effects of operating cost allocation, operating profit is expected to further improve in the third quarter compared with the second quarter. Considering that forecast third-quarter revenues amount to approximately SEK 860 M, and that we also see sequential revenue growth during the fourth quarter, the revenue forecast for 2015 has been raised from approximately SEK 2,200 M, as previously announced, to approximately SEK 2,500 M. The reason for this is the growing interest from the market in integrating touch fingerprint sensors and the company’s strong product portfolio. At present, the company does not anticipate any additional external capital requirements, despite the sharp volume increase that is expected for the remainder of the year.
Transcript of FPC reports an operating profit and sharply growing revenues
Fingerprint Cards AB (publ) Interim report April-June 2015 1
Fingerprint Cards (FPC) Interim Report for the second quarter, April-June 2015
FPC reports an operating profit and sharply growing revenues
CEO’s comments
Revenues for the second quarter of 2015 totaled SEK 445 M, up 912% year-on-year, and 218% compared with the first quarter of 2015. The sharp increase in revenues was due to a broad-based decision by smartphone suppliers earlier this year to introduce touch fingerprint sensors in their smartphones, which accelerated market growth, and to FPC’s ability, through our strong market position due to leading technology and a broad product portfolio, to meet customer needs. In the second quarter, the business generated an operating profit and a continued positive cash flow from operations. Operating profit totaled SEK 65 M during the second quarter of 2015, compared with a loss of SEK 19 M in the first quarter of 2015. The adjusted gross margin was 38% compared with 36% in the first quarter of 2015, and the gross margin was 36% compared with 27% in the first quarter of 2015. The improved gross margin was attributable to a changed product mix. The second quarter and period up to the interim report has, as continuously communicated, been characterized by an increased order inflow from FPC’s module partners and at the end of the quarter, the order backlog amounted to SEK 1,335 M. The reason for this is the growing number of smartphone suppliers who have chosen to integrate FPC’s touch fingerprint sensors in smartphones. During the period, Huawei, HTC, Oppo, Newman, LeTV, Coolpad, Meizu, Dazen, ZTE, Oneplus and ZUK launched smartphones with FPC’s touch fingerprint sensors, confirming FPC’s position as the leading supplier of touch fingerprint sensors to the smartphone market. A further sign of our strong position is that customers in their marketing of newly launched smartphones are increasingly announcing that they contain our sensors, with the improved features of our new touch fingerprint sensors receiving clear exposure. The performance and other features of the touch fingerprint sensors enable our customers to offer consumers a great user experience, making the touch fingerprint sensor a key component of their mobile. Another highly significant event during the quarter, from both a market perspective and for FPC, was that Google unveiled the new features in the next version of the Android operating system. The new version, known as Android M and now named Marshmallow or Android 6.0, will feature complete platform support for fingerprint sensors as well as Android Pay, a payment service that uses the fingerprint sensor to verify the identification of the user. When Google demonstrated the new services at its preview event on May 28, the prototype units used FPC’s touch fingerprint sensor FPC1025, which further underlines FPC’s industry leadership. Google’s introduction of support for fingerprint sensors in Android M, combined with the major interest in secure mobile payments from both consumers and smartphone suppliers, is considered a strong driver for the rapidly increasing penetration of fingerprint sensors in smartphones.
During the second quarter, we launched two new touch fingerprint sensors: FPC1022 and FPC1035. These are primarily intended for rear-mounted integration with smartphones, where we have established a very strong market position, particularly with FPC1025 which has already been integrated with numerous launched smartphones. As part of our ambitious technology development, we can now also enable market-leading biometric performance for our latest touch fingerprint sensors, where the size of the sensor is significantly reduced compared with earlier sensors. The smaller size makes our sensors highly competitive, since phone integration will be easier. All launched touch fingerprint sensors to date in our product portfolio are now in mass production. The strong increase in sales means that, together with our suppliers and other partners, we have delivered sharply growing volumes over a short time. This requires a major effort from both FPC and our partners, but due to a variety of measures, our assessment is that we are well-equipped to meet the growing demand for our products. Apart from the rapidly growing touch fingerprint sensor business for smartphones, we are continuing to develop our offering for smartcards. This is paving the way for new, complementary business opportunities over time in cooperation with Zwipe and other business partners. We remain confident in continuously growing volume deliveries and a large number of new product launches featuring our touch fingerprint sensors.
Future prospects Revenues for the third quarter of 2015 are expected to be approximately SEK 860 M, corresponding to year-on-year growth of more than 1200%.
Due to the continued increase in gross profit and effects of operating cost allocation, operating profit is expected to further improve in the third quarter compared with the second quarter.
Considering that forecast third-quarter revenues amount to approximately SEK 860 M, and that we also see sequential revenue growth during the fourth quarter, the revenue forecast for 2015 has been raised from approximately SEK 2,200 M, as previously announced, to approximately SEK 2,500 M. The reason for this is the growing interest from the market in integrating touch fingerprint sensors and the company’s strong product portfolio.
At present, the company does not anticipate any additional external
capital requirements, despite the sharp volume increase that is
expected for the remainder of the year.
Fingerprint Cards AB (publ) Interim report April-June 2015 2
Key figures * Apr-Jun
2015 Apr-Jun
2014 Change, % Jan–Jun
2015 Jan–Jun
2014 Change, %
Jan–Dec 2014
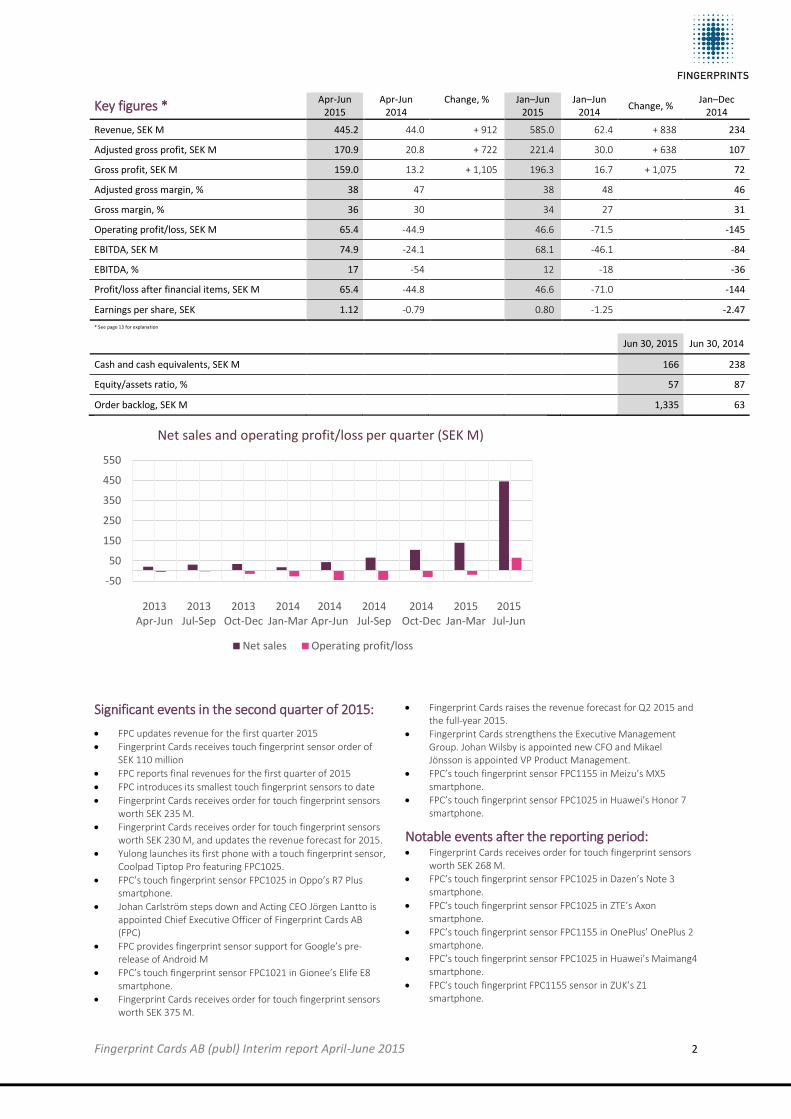
Revenue, SEK M 445.2 44.0 + 912 585.0 62.4 + 838 234
Adjusted gross profit, SEK M 170.9 20.8 + 722 221.4 30.0 + 638 107
Gross profit, SEK M 159.0 13.2 + 1,105 196.3 16.7 + 1,075 72
Adjusted gross margin, % 38 47 38 48 46
Gross margin, % 36 30 34 27 31
Operating profit/loss, SEK M 65.4 -44.9 46.6 -71.5 -145
EBITDA, SEK M 74.9 -24.1 68.1 -46.1 -84
EBITDA, % 17 -54 12 -18 -36
Profit/loss after financial items, SEK M 65.4 -44.8 46.6 -71.0 -144
Earnings per share, SEK 1.12 -0.79 0.80 -1.25 -2.47
* See page 13 for explanation
Jun 30, 2015 Jun 30, 2014
Cash and cash equivalents, SEK M 166 238
Equity/assets ratio, % 57 87
Order backlog, SEK M 1,335 63
Significant events in the second quarter of 2015:
FPC updates revenue for the first quarter 2015
Fingerprint Cards receives touch fingerprint sensor order of SEK 110 million
FPC reports final revenues for the first quarter of 2015
FPC introduces its smallest touch fingerprint sensors to date
Fingerprint Cards receives order for touch fingerprint sensors worth SEK 235 M.
Fingerprint Cards receives order for touch fingerprint sensors worth SEK 230 M, and updates the revenue forecast for 2015.
Yulong launches its first phone with a touch fingerprint sensor, Coolpad Tiptop Pro featuring FPC1025.
FPC’s touch fingerprint sensor FPC1025 in Oppo’s R7 Plus smartphone.
Johan Carlström steps down and Acting CEO Jörgen Lantto is appointed Chief Executive Officer of Fingerprint Cards AB (FPC)
FPC provides fingerprint sensor support for Google’s pre-release of Android M
FPC’s touch fingerprint sensor FPC1021 in Gionee’s Elife E8 smartphone.
Fingerprint Cards receives order for touch fingerprint sensors worth SEK 375 M.
Fingerprint Cards raises the revenue forecast for Q2 2015 and the full-year 2015.
Fingerprint Cards strengthens the Executive Management Group. Johan Wilsby is appointed new CFO and Mikael Jönsson is appointed VP Product Management.
FPC’s touch fingerprint sensor FPC1155 in Meizu’s MX5 smartphone.
FPC’s touch fingerprint sensor FPC1025 in Huawei’s Honor 7 smartphone.
Notable events after the reporting period: Fingerprint Cards receives order for touch fingerprint sensors
worth SEK 268 M.
FPC’s touch fingerprint sensor FPC1025 in Dazen’s Note 3 smartphone.
FPC’s touch fingerprint sensor FPC1025 in ZTE’s Axon smartphone.
FPC’s touch fingerprint sensor FPC1155 in OnePlus’ OnePlus 2 smartphone.
FPC’s touch fingerprint sensor FPC1025 in Huawei’s Maimang4 smartphone.
FPC’s touch fingerprint FPC1155 sensor in ZUK’s Z1 smartphone.
-50
50
150
250
350
450
550
2013Apr-Jun
2013Jul-Sep
2013Oct-Dec
2014Jan-Mar
2014Apr-Jun
2014Jul-Sep
2014Oct-Dec
2015Jan-Mar
2015Jul-Jun
Net sales and operating profit/loss per quarter (SEK M)
Net sales Operating profit/loss
Fingerprint Cards AB (publ) Interim report April-June 2015 3
Market and sales
To date, HTC, Huawei, Oppo, Meizu, Gionee, Newman, LeTV, Coolpad, Dazen, ZTE, OnePlus and ZUK have now launched smartphones featuring FPC’s touch fingerprint sensors.
Revenues in the second quarter of 2015 amounted to SEK 445.2 M. Compared with the year-earlier period, revenues rose 912%, and 218% compared with the first quarter of 2015
In the preceding period, a number of smartphone OEMs launched phones, mostly in China, featuring our FPC1020, FPC1021, FPC1025, FPC1150 and FPC1155 touch fingerprint sensors. As previously announced, the smartphone OEMs are now implementing faster touch fingerprint sensor integration in the broader product segments than we previously expected, largely driven by the introduction of secure payment services where the fingerprint sensor is a critical component. We also see that many manufacturers are deciding to introduce fingerprint sensors not only in a specific model, but also on a broad basis across their portfolios, which will raise volumes. Considering the extensive introduction of touch fingerprint sensors in an increasing number of models and their higher ASP compared with swipe sensors, this means increased revenues for FPC.
Therefore, the main focus of the sales organization in the short term, in cooperation with our module partners, distributors and customers, is to ensure that we can plan delivery of the growing touch fingerprint sensor volumes at the right time.
At June 30, 2015, the order backlog amounted to SEK 1,335 M.
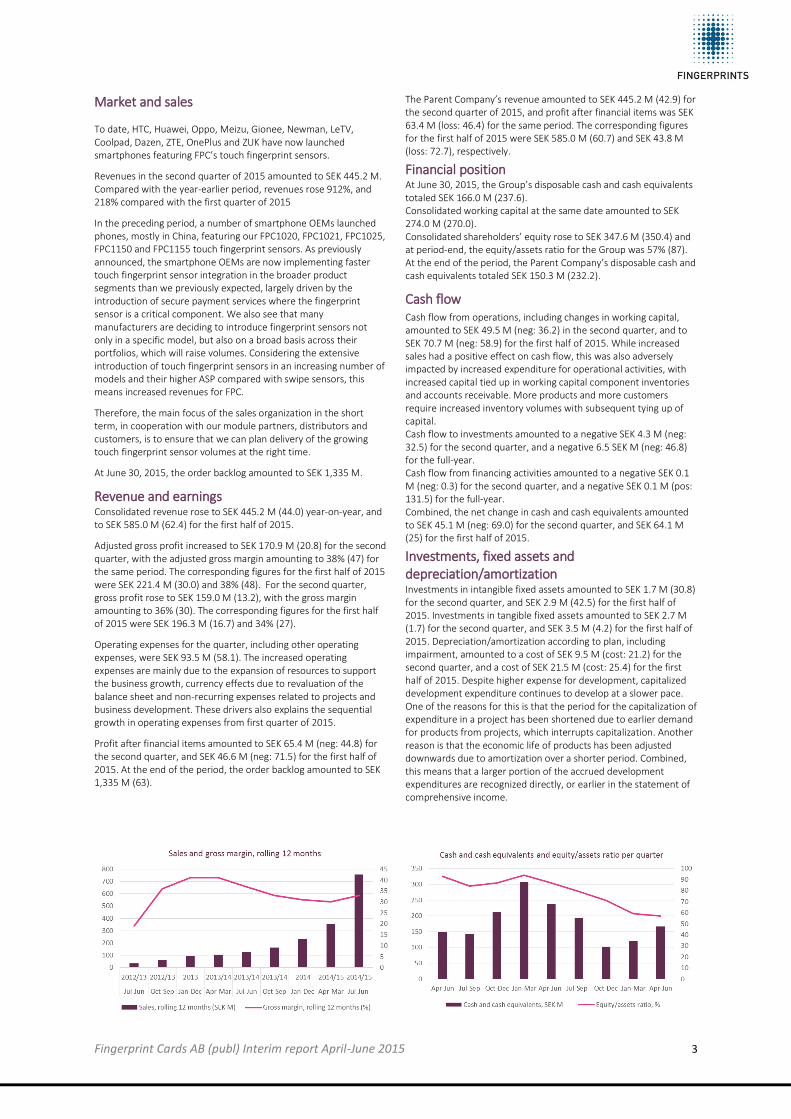
Revenue and earnings Consolidated revenue rose to SEK 445.2 M (44.0) year-on-year, and to SEK 585.0 M (62.4) for the first half of 2015.
Adjusted gross profit increased to SEK 170.9 M (20.8) for the second quarter, with the adjusted gross margin amounting to 38% (47) for the same period. The corresponding figures for the first half of 2015 were SEK 221.4 M (30.0) and 38% (48). For the second quarter, gross profit rose to SEK 159.0 M (13.2), with the gross margin amounting to 36% (30). The corresponding figures for the first half of 2015 were SEK 196.3 M (16.7) and 34% (27).
Operating expenses for the quarter, including other operating expenses, were SEK 93.5 M (58.1). The increased operating expenses are mainly due to the expansion of resources to support the business growth, currency effects due to revaluation of the balance sheet and non-recurring expenses related to projects and business development. These drivers also explains the sequential growth in operating expenses from first quarter of 2015.
Profit after financial items amounted to SEK 65.4 M (neg: 44.8) for the second quarter, and SEK 46.6 M (neg: 71.5) for the first half of 2015. At the end of the period, the order backlog amounted to SEK 1,335 M (63).
The Parent Company’s revenue amounted to SEK 445.2 M (42.9) for the second quarter of 2015, and profit after financial items was SEK 63.4 M (loss: 46.4) for the same period. The corresponding figures for the first half of 2015 were SEK 585.0 M (60.7) and SEK 43.8 M (loss: 72.7), respectively.
Financial position At June 30, 2015, the Group’s disposable cash and cash equivalents totaled SEK 166.0 M (237.6). Consolidated working capital at the same date amounted to SEK 274.0 M (270.0). Consolidated shareholders’ equity rose to SEK 347.6 M (350.4) and at period-end, the equity/assets ratio for the Group was 57% (87). At the end of the period, the Parent Company’s disposable cash and cash equivalents totaled SEK 150.3 M (232.2).
Cash flow Cash flow from operations, including changes in working capital, amounted to SEK 49.5 M (neg: 36.2) in the second quarter, and to SEK 70.7 M (neg: 58.9) for the first half of 2015. While increased sales had a positive effect on cash flow, this was also adversely impacted by increased expenditure for operational activities, with increased capital tied up in working capital component inventories and accounts receivable. More products and more customers require increased inventory volumes with subsequent tying up of capital. Cash flow to investments amounted to a negative SEK 4.3 M (neg: 32.5) for the second quarter, and a negative 6.5 SEK M (neg: 46.8) for the full-year. Cash flow from financing activities amounted to a negative SEK 0.1 M (neg: 0.3) for the second quarter, and a negative SEK 0.1 M (pos: 131.5) for the full-year. Combined, the net change in cash and cash equivalents amounted to SEK 45.1 M (neg: 69.0) for the second quarter, and SEK 64.1 M (25) for the first half of 2015.
Investments, fixed assets and depreciation/amortization Investments in intangible fixed assets amounted to SEK 1.7 M (30.8) for the second quarter, and SEK 2.9 M (42.5) for the first half of 2015. Investments in tangible fixed assets amounted to SEK 2.7 M (1.7) for the second quarter, and SEK 3.5 M (4.2) for the first half of 2015. Depreciation/amortization according to plan, including impairment, amounted to a cost of SEK 9.5 M (cost: 21.2) for the second quarter, and a cost of SEK 21.5 M (cost: 25.4) for the first half of 2015. Despite higher expense for development, capitalized development expenditure continues to develop at a slower pace. One of the reasons for this is that the period for the capitalization of expenditure in a project has been shortened due to earlier demand for products from projects, which interrupts capitalization. Another reason is that the economic life of products has been adjusted downwards due to amortization over a shorter period. Combined, this means that a larger portion of the accrued development expenditures are recognized directly, or earlier in the statement of comprehensive income.

Fingerprint Cards AB (publ) Interim report April-June 2015 4
Technological development, customer projects, sourcing and production In the second quarter, our product portfolio, which is the broadest and most comprehensive in the market in terms of touch fingerprint sensors for smartphone integration on the back and front, and as a side button, was supplemented with the FPC1022 and FPC1035 sensors, which are primarily designed for backside integration, and are the smallest touch fingerprint sensors that FPC has launched to date. All touch fingerprint sensors launched by FPC are now in mass production.
Extensive activities are now being carried out jointly by the development organization and customers to integrate the sensors with the other features of the telephone to ensure an optimal user experience. Secure payments and secure data handling in phones, in which the fingerprint sensor plays a central role, are included in the phones launched during the period.
Google’s use of FPC1025 for demonstrations of Android M is the result of major efforts by FPC’s development organization that has assisted Google with verifying the new features in Android M that require fingerprint support in the phone. These investments mean that FPC’s touch fingerprint sensors are well-prepared for the introduction of Android M when Google provides the new Android version to smartphone suppliers.
During the period, FPC’s sourcing and supply organization – together with suppliers and partners – continued their capacity expansion for our touch fingerprint sensors. Manufacturing capacity has been expanded by means of additional, qualified manufacturing plants, and our sensors are now manufactured at several of these plants. Production capacity is established at a stable level and work is now continuing on creating flexibility and scalability for additional volume increases. We also qualified our new FPC1140/FPC1145 and FPC1022/FPC1035 touch fingerprint sensors for mass production.
The number of customer projects continued to grow during the second quarter and, thus, also our customer organization. These projects are for the integration of touch fingerprint sensors in previously launched and future smartphones. A great deal of our efforts ahead of customer launches is dedicated to providing support for secure payment solutions – particularly Alipay – whereby these payment services are integrated into the majority of smartphones using our touch fingerprint sensors. We have also continued our focus on the payment card project with Zwipe for the next stage of development involving, among others, MasterCard.
Annual General Meeting At the Annual General Meeting (AGM) on June 3, 2015, a decision was made to adopt the income statement and balance sheet, adopt the appropriation of profit, discharge the Board of Directors and President from liability, and the re-election of the Board of Directors, whereby Urban Fagerstedt and Alexander Kotsinas were re-elected as regular Board members, and Katarina Bonde, Carl-Johan von Plomgren, Lars Söderfjell and Jan Wäreby were elected as new Board members. Urban Fagerstedt was re-elected Chairman of the Board. Resolutions were also passed on fees to the Board and auditor, the composition of the Nomination Committee, guidelines for the remuneration of senior executives and a resolution was passed to authorize the Board to make decisions on the issuance of up to 5 million Class B shares with deviation from the shareholders’ preferential right during the period up until the next AGM. A resolution was also passed to authorize the Board of Directors, during the period up until the next AGM, to make decisions on the issuance of up to 5 million Class B shares with preferential rights for shareholders.
Organization and personnel The number of employees at June 30, 2015 was 115 (80), including 91 (67) men and 24 (13) women. In addition to full-time employees, consultants primarily in technical development, customer projects and sales and marketing were used during the second quarter
corresponding to the equivalent of 81 (49) full-time positions, including 69 (42) men and 12 (7) women. Accordingly, including employees and consultants, FPC gave employment to 196 (129) individuals at June 30, 2015, including 160 (109) men and 36 (20) women.
Seasonal variations To date, sales have not shown any distinct seasonal variations.
Related-party transactions There were no transactions between FPC and related parties that had any material impact on the Group or Parent Company’s position and earnings during the reporting period.
Incentive programs Fingerprint Cards has three outstanding warrant programs that total 10.65% of the total number of shares and 9.07% of the total number of votes in the company. TO4: The Extraordinary General Meeting on September 5, 2012 approved the issue of 4,818,000 warrants with a term extending from September 6 to October 6, 2015. The price per warrant was SEK 0.15 at the time of issue. All of the warrants under the program are held by FPC’s employees. The exercise price for a Class B share is SEK 9.72. On full subscription with the support of all warrants in the program, 4,818,000 new Class B shares can be issued, corresponding to 8.53% of the total number of shares and 7.16% of the total number of voting rights, which will also raise the share capital by SEK 963,600. The program has been designated TO4. TO5: An Extraordinary General Meeting on March 4, 2013 approved the issue of 1,300,000 warrants with a term extending from February 5, 2016 to March 5, 2016. The price per warrant was SEK 1.79 at the time of issue. All of the warrants under the program are held by FPC’s employees. The exercise price for a Class B share is SEK 52.35. On full subscription with the support of all warrants in the program, 1,300,000 new Class B shares can be issued, corresponding to 2.45% of the total number of shares and 2.04% of the total number of voting rights, which will also raise the share capital by SEK 260,000. The program has been designated TO5. TO6: An Extraordinary General Meeting on November 6, 2013 resolved to issue 500,000 warrants with a term extending from November 27 to December 27, 2016. The price per warrant was SEK 4.53 at the time of issue. The program was directed at FPC’s employees, as well as individuals working full time for the company or the Group, on a consulting basis and where formal employment is with another company that is not a Group company. The exercise price for a Class B share is SEK 90.16. On full subscription with the support of all warrants in the program, 500,000 new Class B shares can be issued, corresponding to 0.8% of the total number of shares and 0.7% of the total number of voting rights, which will also raise the share capital by SEK 100,000. The program is designated TO6.
Fingerprint Cards AB (publ) Interim report April-June 2015 5
Significant risks and uncertainties – Group and Parent Company FPC is exposed to risks. Each of the risks below, other risks and the uncertainties named could, if they occur, have a material negative impact on the company’s operations, earnings, financial position or future outlook, or result in a decline in the value of the company’s shares, which could result in investors losing all or parts of their invested capital. The described risks and uncertainties are not ranked in any order of significance; nor are they claimed to be the only risks or uncertainties to which the company is exposed. Additional risks and uncertainties that the company is currently unaware of or that are currently not judged to be material could develop into factors that could in the future have a material negative impact on the company’s operations, earnings, financial
position or future outlook. The following description does not claim to be complete or exact, since risks and their degree of impact vary over time: Corporate risks: Financing, Rights, Development, Competencies Market risks: Political risk, Taxation, Currency-exchange risk, Macroeconomic conditions Operational risks: Production, Environment, Sales Credit risks: Counterparty Share risk: Dividend, Owner, Share price
For further information concerning the risks facing the Group, see the 2014 Annual Report, which is available on our website www.fingerprint.com
Future reporting dates Interim report July-September: November 5, 2015
For further information, contact: Jörgen Lantto, CEO, Fingerprint Cards AB (publ), +46 (0)31-60 78 20, [email protected]
Website: www.fingerprints.com/corporate/
Welcome to Fingerprint Cards Q2 2015 – Financial Report Webcast. The Webcast starts at 15.00 CET on Thursday August 20th 2015. Participants use this link to register and join the live event: https://engage.vevent.com/index.jsp?eid=3483&seid=46
Fingerprint Cards AB (publ), Corp. Reg. No. 556154-2381, discloses this information pursuant to the Swedish Securities Market Act (2007:528) and the Swedish Financial Instruments Trading Act (1991:980). This information was issued for publication on August 20, 2015 at 8:00 a.m. CET
Key information Issuing, publishing or distributing this press release may be subject to restrictions in certain jurisdictions. The recipient of this press release is responsible for using this press release and the constituent information in accordance with the rules and regulations prevailing in the particular jurisdiction. This press release does not constitute an offer, or invitation to acquire or subscribe for new securities in Fingerprint Cards in any jurisdiction.
Certification The Board of Directors and the CEO certify that this interim report provides a fair and accurate review of the operations, financial position and earnings of the Parent Company and the Group and that it describes the significant risks and uncertainties facing the Parent Company and the companies included in the Group.
Gothenburg, August 19, 2015
Urban Fagerstedt Katarina Bonde Alexander Kotsinas
Chairman Board member Board member
Carl-Johan von Plomgren Lars Söderfjell Jan Wäreby
Board member Board member Board member
Jörgen Lantto
CEO
Auditors’ review report

Fingerprint Cards AB (publ) Interim report April-June 2015 6
This interim report has not been examined by the company’s auditors.
Fingerprint Cards AB (publ) Interim report April-June 2015 7
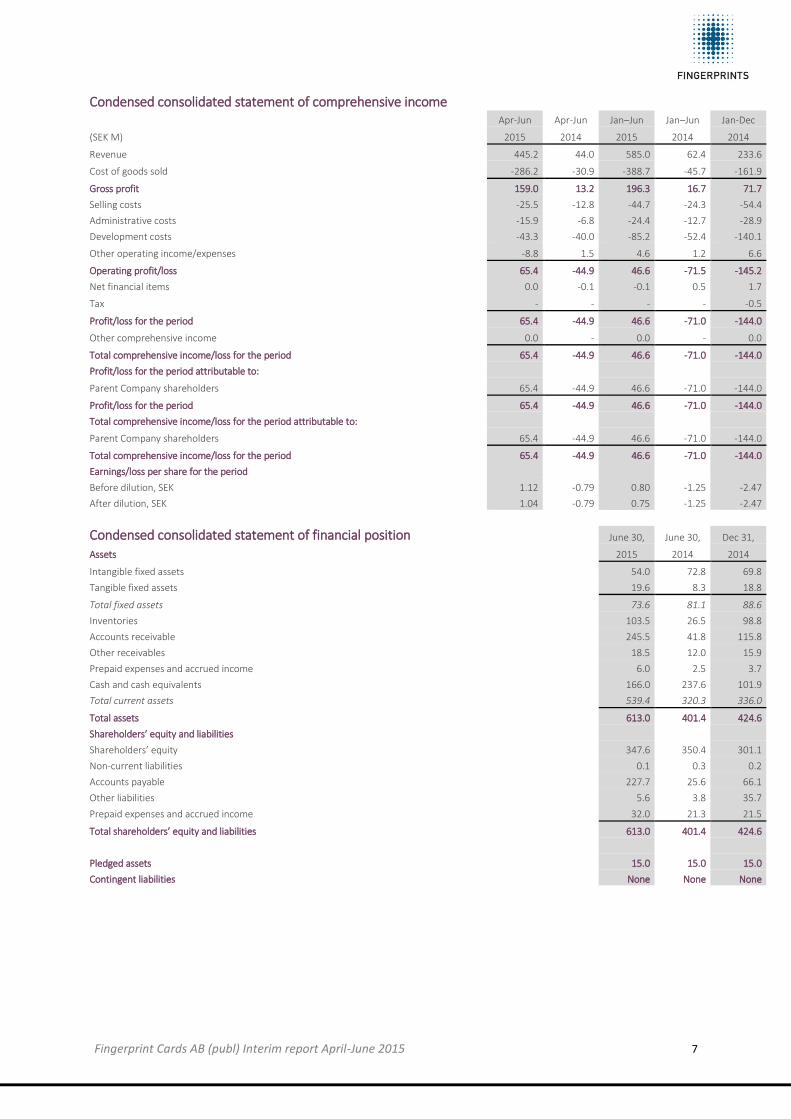
Condensed consolidated statement of comprehensive income
Apr-Jun Apr-Jun Jan–Jun Jan–Jun Jan-Dec
(SEK M) 2015 2014 2015 2014 2014
Revenue 445.2 44.0 585.0 62.4 233.6
Cost of goods sold -286.2 -30.9 -388.7 -45.7 -161.9
Gross profit 159.0 13.2 196.3 16.7 71.7
Selling costs -25.5 -12.8 -44.7 -24.3 -54.4
Administrative costs -15.9 -6.8 -24.4 -12.7 -28.9
Development costs -43.3 -40.0 -85.2 -52.4 -140.1
Other operating income/expenses -8.8 1.5 4.6 1.2 6.6
Operating profit/loss 65.4 -44.9 46.6 -71.5 -145.2
Net financial items 0.0 -0.1 -0.1 0.5 1.7
Tax - - - - -0.5
Profit/loss for the period 65.4 -44.9 46.6 -71.0 -144.0
Other comprehensive income 0.0 - 0.0 - 0.0
Total comprehensive income/loss for the period 65.4 -44.9 46.6 -71.0 -144.0
Profit/loss for the period attributable to:
Parent Company shareholders 65.4 -44.9 46.6 -71.0 -144.0
Profit/loss for the period 65.4 -44.9 46.6 -71.0 -144.0
Total comprehensive income/loss for the period attributable to:
Parent Company shareholders 65.4 -44.9 46.6 -71.0 -144.0
Total comprehensive income/loss for the period 65.4 -44.9 46.6 -71.0 -144.0
Earnings/loss per share for the period
Before dilution, SEK 1.12 -0.79 0.80 -1.25 -2.47
After dilution, SEK 1.04 -0.79 0.75 -1.25 -2.47
Condensed consolidated statement of financial position June 30, June 30, Dec 31,
Assets 2015 2014 2014
Intangible fixed assets 54.0 72.8 69.8
Tangible fixed assets 19.6 8.3 18.8
Total fixed assets 73.6 81.1 88.6
Inventories
103.5 26.5 98.8
Accounts receivable 245.5 41.8 115.8
Other receivables 18.5 12.0 15.9
Prepaid expenses and accrued income 6.0 2.5 3.7
Cash and cash equivalents 166.0 237.6 101.9
Total current assets 539.4 320.3 336.0
Total assets 613.0 401.4 424.6
Shareholders’ equity and liabilities
Shareholders’ equity 347.6 350.4 301.1
Non-current liabilities
0.1 0.3 0.2
Accounts payable 227.7 25.6 66.1
Other liabilities 5.6 3.8 35.7
Prepaid expenses and accrued income 32.0 21.3 21.5 15.2
Total shareholders’ equity and liabilities 613.0 401.4 424.6
Pledged assets 15.0 15.0 15.0
Contingent liabilities None None None
Fingerprint Cards AB (publ) Interim report April-June 2015 8
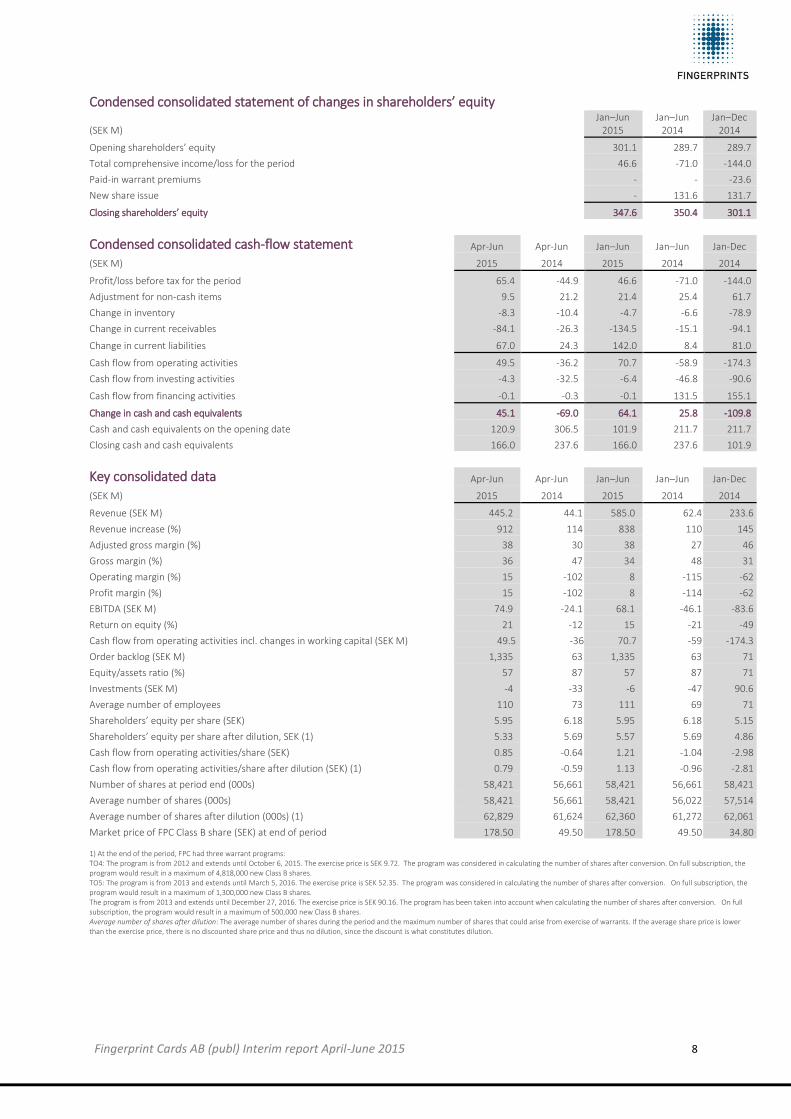
Condensed consolidated statement of changes in shareholders’ equity
(SEK M) Jan–Jun
2015 Jan–Jun
2014 Jan–Dec
2014
Opening shareholders’ equity 301.1 289.7 289.7
Total comprehensive income/loss for the period 46.6 -71.0 -144.0
Paid-in warrant premiums - - -23.6
New share issue - 131.6 131.7
Closing shareholders’ equity 347.6 350.4 301.1
Condensed consolidated cash-flow statement Apr-Jun Apr-Jun Jan–Jun Jan–Jun Jan-Dec
(SEK M) 2015 2014 2015 2014 2014
Profit/loss before tax for the period 65.4 -44.9 46.6 -71.0 -144.0
Adjustment for non-cash items 9.5 21.2 21.4 25.4 61.7
Change in inventory -8.3 -10.4 -4.7 -6.6 -78.9
Change in current receivables -84.1 -26.3 -134.5 -15.1 -94.1
Change in current liabilities 67.0 24.3 142.0 8.4 81.0
Cash flow from operating activities 49.5 -36.2 70.7 -58.9 -174.3
Cash flow from investing activities -4.3 -32.5 -6.4 -46.8 -90.6
Cash flow from financing activities -0.1 -0.3 -0.1 131.5 155.1
Change in cash and cash equivalents 45.1 -69.0 64.1 25.8 -109.8
Cash and cash equivalents on the opening date 120.9 306.5 101.9 211.7 211.7
Closing cash and cash equivalents 166.0 237.6 166.0 237.6 101.9
Key consolidated data Apr-Jun Apr-Jun Jan–Jun Jan–Jun Jan-Dec
(SEK M) 2015 2014 2015 2014 2014
Revenue (SEK M) 445.2 44.1 585.0 62.4 233.6
Revenue increase (%) 912 114 838 110 145
Adjusted gross margin (%) 38 30 38 27 46
Gross margin (%) 36 47 34 48 31
Operating margin (%) 15 -102 8 -115 -62
Profit margin (%) 15 -102 8 -114 -62
EBITDA (SEK M) 74.9 -24.1 68.1 -46.1 -83.6
Return on equity (%) 21 -12 15 -21 -49
Cash flow from operating activities incl. changes in working capital (SEK M) 49.5 -36 70.7 -59 -174.3
Order backlog (SEK M) 1,335 63 1,335 63 71
Equity/assets ratio (%) 57 87 57 87 71
Investments (SEK M) -4 -33 -6 -47 90.6
Average number of employees 110 73 111 69 71
Shareholders’ equity per share (SEK) 5.95 6.18 5.95 6.18 5.15
Shareholders’ equity per share after dilution, SEK (1) 5.33 5.69 5.57 5.69 4.86
Cash flow from operating activities/share (SEK) 0.85 -0.64 1.21 -1.04 -2.98
Cash flow from operating activities/share after dilution (SEK) (1) 0.79 -0.59 1.13 -0.96 -2.81
Number of shares at period end (000s) 58,421 56,661 58,421 56,661 58,421
Average number of shares (000s) 58,421 56,661 58,421 56,022 57,514
Average number of shares after dilution (000s) (1) 62,829 61,624 62,360 61,272 62,061
Market price of FPC Class B share (SEK) at end of period 178.50 49.50 178.50 49.50 34.80 1) At the end of the period, FPC had three warrant programs: TO4: The program is from 2012 and extends until October 6, 2015. The exercise price is SEK 9.72. The program was considered in calculating the number of shares after conversion. On full subscription, the program would result in a maximum of 4,818,000 new Class B shares. TO5: The program is from 2013 and extends until March 5, 2016. The exercise price is SEK 52.35. The program was considered in calculating the number of shares after conversion. On full subscription, the program would result in a maximum of 1,300,000 new Class B shares. The program is from 2013 and extends until December 27, 2016. The exercise price is SEK 90.16. The program has been taken into account when calculating the number of shares after conversion. On full subscription, the program would result in a maximum of 500,000 new Class B shares. Average number of shares after dilution: The average number of shares during the period and the maximum number of shares that could arise from exercise of warrants. If the average share price is lower than the exercise price, there is no discounted share price and thus no dilution, since the discount is what constitutes dilution.
Fingerprint Cards AB (publ) Interim report April-June 2015 9
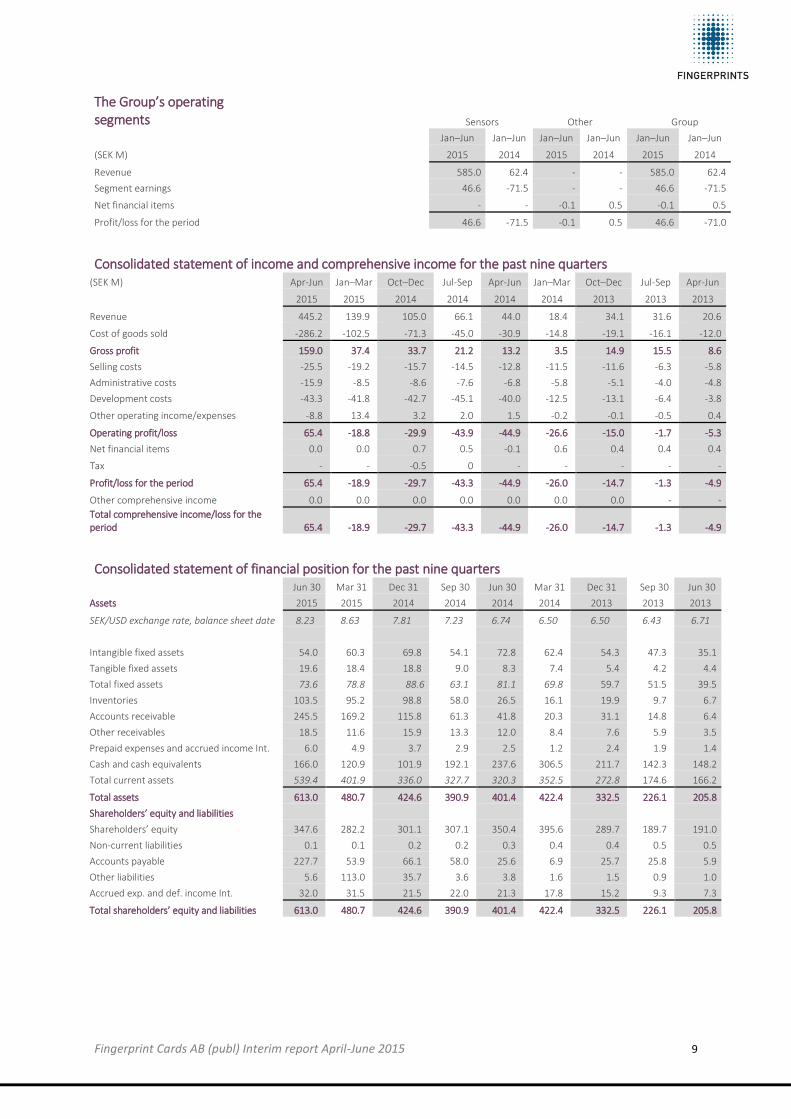
The Group’s operating segments Sensors Other Group
Jan–Jun Jan–Jun Jan–Jun Jan–Jun Jan–Jun Jan–Jun
(SEK M) 2015 2014 2015 2014 2015 2014
Revenue 585.0 62.4 - - 585.0 62.4
Segment earnings
46.6 -71.5 - - 46.6 -71.5
Net financial items - - -0.1 0.5 -0.1 0.5
Profit/loss for the period 46.6 -71.5 -0.1 0.5 46.6 -71.0
Consolidated statement of income and comprehensive income for the past nine quarters (SEK M) Apr-Jun Jan–Mar Oct–Dec Jul-Sep Apr-Jun Jan–Mar Oct–Dec Jul-Sep Apr-Jun
2015 2015 2014 2014 2014 2014 2013 2013 2013
Revenue 445.2 139.9 105.0 66.1 44.0 18.4 34.1 31.6 20.6
Cost of goods sold -286.2 -102.5 -71.3 -45.0 -30.9 -14.8 -19.1 -16.1 -12.0
Gross profit 159.0 37.4 33.7 21.2 13.2 3.5 14.9 15.5 8.6
Selling costs -25.5 -19.2 -15.7 -14.5 -12.8 -11.5 -11.6 -6.3 -5.8
Administrative costs -15.9 -8.5 -8.6 -7.6 -6.8 -5.8 -5.1 -4.0 -4.8
Development costs -43.3 -41.8 -42.7 -45.1 -40.0 -12.5 -13.1 -6.4 -3.8
Other operating income/expenses -8.8 13.4 3.2 2.0 1.5 -0.2 -0.1 -0.5 0.4
Operating profit/loss 65.4 -18.8 -29.9 -43.9 -44.9 -26.6 -15.0 -1.7 -5.3
Net financial items 0.0 0.0 0.7 0.5 -0.1 0.6 0.4 0.4 0.4
Tax - - -0.5 0 - - - - -
Profit/loss for the period 65.4 -18.9 -29.7 -43.3 -44.9 -26.0 -14.7 -1.3 -4.9
Other comprehensive income 0.0 0.0 0.0 0.0 0.0 0.0 0.0 - -
Total comprehensive income/loss for the period 65.4 -18.9 -29.7 -43.3 -44.9 -26.0 -14.7 -1.3 -4.9
Consolidated statement of financial position for the past nine quarters Jun 30 Mar 31 Dec 31 Sep 30 Jun 30 Mar 31 Dec 31 Sep 30 Jun 30
Assets 2015 2015 2014 2014 2014 2014 2013 2013 2013
SEK/USD exchange rate, balance sheet date 8.23 8.63 7.81 7.23 6.74 6.50 6.50 6.43 6.71
Intangible fixed assets 54.0 60.3 69.8 54.1 72.8 62.4 54.3 47.3 35.1
Tangible fixed assets 19.6 18.4 18.8 9.0 8.3 7.4 5.4 4.2 4.4
Total fixed assets 73.6 78.8 88.6 63.1 81.1 69.8 59.7 51.5 39.5
Inventories 103.5 95.2 98.8 58.0 26.5 16.1 19.9 9.7 6.7
Accounts receivable 245.5 169.2 115.8 61.3 41.8 20.3 31.1 14.8 6.4
Other receivables 18.5 11.6 15.9 13.3 12.0 8.4 7.6 5.9 3.5
Prepaid expenses and accrued income Int. 6.0 4.9 3.7 2.9 2.5 1.2 2.4 1.9 1.4
Cash and cash equivalents 166.0 120.9 101.9 192.1 237.6 306.5 211.7 142.3 148.2
Total current assets 539.4 401.9 336.0 327.7 320.3 352.5 272.8 174.6 166.2
Total assets 613.0 480.7 424.6 390.9 401.4 422.4 332.5 226.1 205.8
Shareholders’ equity and liabilities
Shareholders’ equity 347.6 282.2 301.1 307.1 350.4 395.6 289.7 189.7 191.0
Non-current liabilities 0.1 0.1 0.2 0.2 0.3 0.4 0.4 0.5 0.5
Accounts payable 227.7 53.9 66.1 58.0 25.6 6.9 25.7 25.8 5.9
Other liabilities 5.6 113.0 35.7 3.6 3.8 1.6 1.5 0.9 1.0
Accrued exp. and def. income Int. 32.0 31.5 21.5 22.0 21.3 17.8 15.2 9.3 7.3
Total shareholders’ equity and liabilities 613.0 480.7 424.6 390.9 401.4 422.4 332.5 226.1 205.8

Fingerprint Cards AB (publ) Interim report April-June 2015 10
Consolidated cash-flow statement for the past nine quarters
Apr-Jun Jan–Mar Oct–Dec Jul-Sep Apr-Jun Jan–Mar Oct–Dec Jul-Sep Apr-Jun
(SEK M) 2015 2015 2014 2014 2014 2014 2013 2013 2013
Profit/loss before tax for the period 65.4 -18.9 -29.7 -43.3 -44.9 -26.0 -14.7 -1.3 -4.4
Adjustments for non-cash items 9.5 12.0 13.6 22.7 21.2 4.2 3.7 3.0 3.0
Change in inventory -8.3 3.5 -40.7 -31.6 -10.4 3.8 -10.1 -3.0 5.5
Change in current receivables -84.1 -50.4 -57.7 -21.3 -26.3 11.2 -16.3 -11.4 -4.6
Change in current liabilities 67.0 75.0 39.8 32.9 24.3 -15.9 6.4 21.8 2.1
Cash flow from operating activities 49.5 21.2 -74.8 -40.6 -36.2 -22.7 -31.1 9.1 1.5
Cash flow from investing activities -4.3 -2.1 -39.0 -4.8 -32.5 -14.3 -11.9 -15.0 -7.3
Cash flow from financing activities -0.1 -0.1 23.6 -0.1 -0.3 131.8 112.4 -0.1 6.0
Change in cash and cash equivalents 45.1 19.0 -90.2 -45.5 -69.0 94.8 69.4 -6.0 -0.3 Cash and cash equivalents on the opening date 120.9 101.9 192.1 237.6 306.5 211.7 142.3 148.2 148.5
Closing cash and cash equivalents 166.0 120.9 101.9 192.1 237.6 306.5 211.7 142.3 148.2
Key consolidated figures for the past nine quarters Apr-Jun Jan–Mar Oct–Dec Jul-Sep Apr-Jun Jan–Mar Oct–Dec Jul-Sep Apr-Jun
(SEK M) 2015 2015 2014 2014 2014 2014 2013 2013 2013
Revenue (SEK M) 445.2 139.9 105.0 66.1 44.0 18.4 34.1 31.6 20.6
Revenue increase (%) 912 660 208 52 114 102 1,795 554 3,433
Adjusted gross margin (%) 38 36 44 46 47 50 56 57 53
Gross margin (%) 36 27 32 32 30 39 44 49 42
Operating margin (%) 15 -13 -28 -66 -102 -145 -44 -5 -26
Profit margin (%) 15 -13 -28 -65 -102 -142 -43 -4 -10
EBITDA (SEK M) 74.9 -6.8 -16.0 -21.1 -24.1 -22.4 -11.3 1.3 -2.3
Return on equity (%) 21 -6 -10 -13 -12 -6 -3 1 -3
Cash flow from operating activities (SEK M) 49.5 19.0 -74.8 -40.6 -36 -22.7 -31.1 11.5 1.0
Order backlog (SEK M) 1,335 364 71 50 63 41 22 38 27
Equity/assets ratio (%) 57 59 71 79 87 94 87 84 93
Investments (SEK M) -4 -2.1 39.0 -4.8 -33 -14.3 -11.9 -15.0 -7.3
Average number of employees 110 104 99 91 70 55 26 24 21
Shareholders’ equity per share (SEK) 5.95 4.83 5.15 5.42 6.18 6.98 5.19 3.67 3.70 Shareholders’ equity per share after dilution (SEK) (1) 5.53 4.57 4.86 5.02 5.69 6.41 5.20 3.46 3.40 Cash flow from operating activities per share (SEK) 0.85 0.33 -1.28 -0.72 -0.64 -0.40 -0.08 0.22 0.02 Cash flow from operating activities per share, after dilution (SEK) 0.79 0.32 -1.21 -0.66 -0.59 -0.37 -0.08 0.21 0.02
Number of shares at period end (000s) 58,421 58,421 58,421 56,661 56,661 56,661 54,161 51,661 51,661
Average number of shares (000s) 58,421 58,421 57,754 56,661 56,661 55,102 52,066 51,661 51,467 Average number of shares after dilution (000s) (1) 62,829 61,719 62,941 61,139 61,624 59,788 56,659 56,587 56,195
Market price of FPC Class B share (SEK) 178.50 53.50 34.80 36.50 49.50 54.00 54.25 52.50 57.25
(1) 1) At the end of the year, FPC had three warrant programs: TO4: The program is from 2012 and extends until October 6, 2015. The exercise price is SEK 9.72. The program was considered in calculating the number of shares
after conversion. On full subscription, the program would result in a maximum of 4,818,000 new Class B shares. TO5: The program is from 2013 and extends until March 5, 2016. The exercise price is SEK 52.35. The program was considered in calculating the number of shares after conversion. On full subscription, the program would result in a maximum of 1,300,000 new Class B shares. The program is from 2013 and extends until December 27, 2016. The exercise price is SEK 90.16. The program has been taken into account when calculating the number of shares after conversion. On full subscription, the program would result in a maximum of 500,000 new Class B shares. Average number of shares after dilution: The average number of shares during the period and the maximum number of shares that could arise from exercise of warrants. If the average share price is lower than the exercise price, there is no discounted share price and thus no dilution, since the discount is what constitutes dilution.
Fingerprint Cards AB (publ) Interim report April-June 2015 11
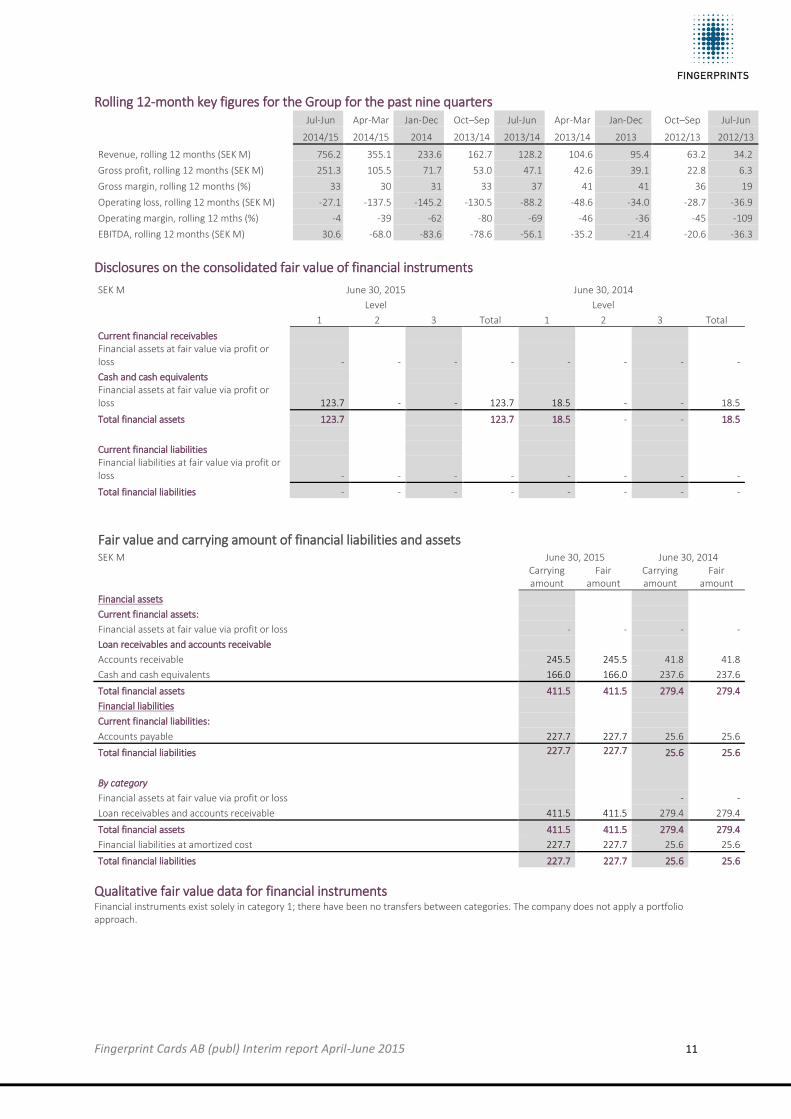
Rolling 12-month key figures for the Group for the past nine quarters
Jul-Jun Apr-Mar Jan-Dec Oct–Sep Jul-Jun Apr-Mar Jan-Dec Oct–Sep Jul-Jun
2014/15 2014/15 2014 2013/14 2013/14 2013/14 2013 2012/13 2012/13
Revenue, rolling 12 months (SEK M) 756.2 355.1 233.6 162.7 128.2 104.6 95.4 63.2 34.2
Gross profit, rolling 12 months (SEK M) 251.3 105.5 71.7 53.0 47.1 42.6 39.1 22.8 6.3
Gross margin, rolling 12 months (%) 33 30 31 33 37 41 41 36 19
Operating loss, rolling 12 months (SEK M) -27.1 -137.5 -145.2 -130.5 -88.2 -48.6 -34.0 -28.7 -36.9
Operating margin, rolling 12 mths (%) -4 -39 -62 -80 -69 -46 -36 -45 -109
EBITDA, rolling 12 months (SEK M) 30.6 -68.0 -83.6 -78.6 -56.1 -35.2 -21.4 -20.6 -36.3
Disclosures on the consolidated fair value of financial instruments
SEK M June 30, 2015
June 30, 2014
Level
Level
1 2 3 Total 1 2 3 Total
Current financial receivables Financial assets at fair value via profit or
loss - - - - - - - -
Cash and cash equivalents Financial assets at fair value via profit or loss 123.7 - - 123.7 18.5 - - 18.5
Total financial assets 123.7 123.7 18.5 - - 18.5
Current financial liabilities Financial liabilities at fair value via profit or
loss - - - - - - - -
Total financial liabilities - - - - - - - -
Fair value and carrying amount of financial liabilities and assets SEK M June 30, 2015 June 30, 2014
Carrying amount
Fair amount
Carrying amount
Fair amount
Financial assets Current financial assets: Financial assets at fair value via profit or loss - - - -
Loan receivables and accounts receivable
Accounts receivable 245.5 245.5 41.8 41.8
Cash and cash equivalents 166.0 166.0 237.6 237.6
Total financial assets 411.5 411.5 279.4 279.4
Financial liabilities
Current financial liabilities:
Accounts payable 227.7 227.7 25.6 25.6
Total financial liabilities 227.7 227.7 25.6 25.6
By category
Financial assets at fair value via profit or loss - -
Loan receivables and accounts receivable 411.5 411.5 279.4 279.4
Total financial assets 411.5 411.5 279.4 279.4
Financial liabilities at amortized cost 227.7 227.7 25.6 25.6
Total financial liabilities 227.7 227.7 25.6 25.6
Qualitative fair value data for financial instruments Financial instruments exist solely in category 1; there have been no transfers between categories. The company does not apply a portfolio approach.
Fingerprint Cards AB (publ) Interim report April-June 2015 12
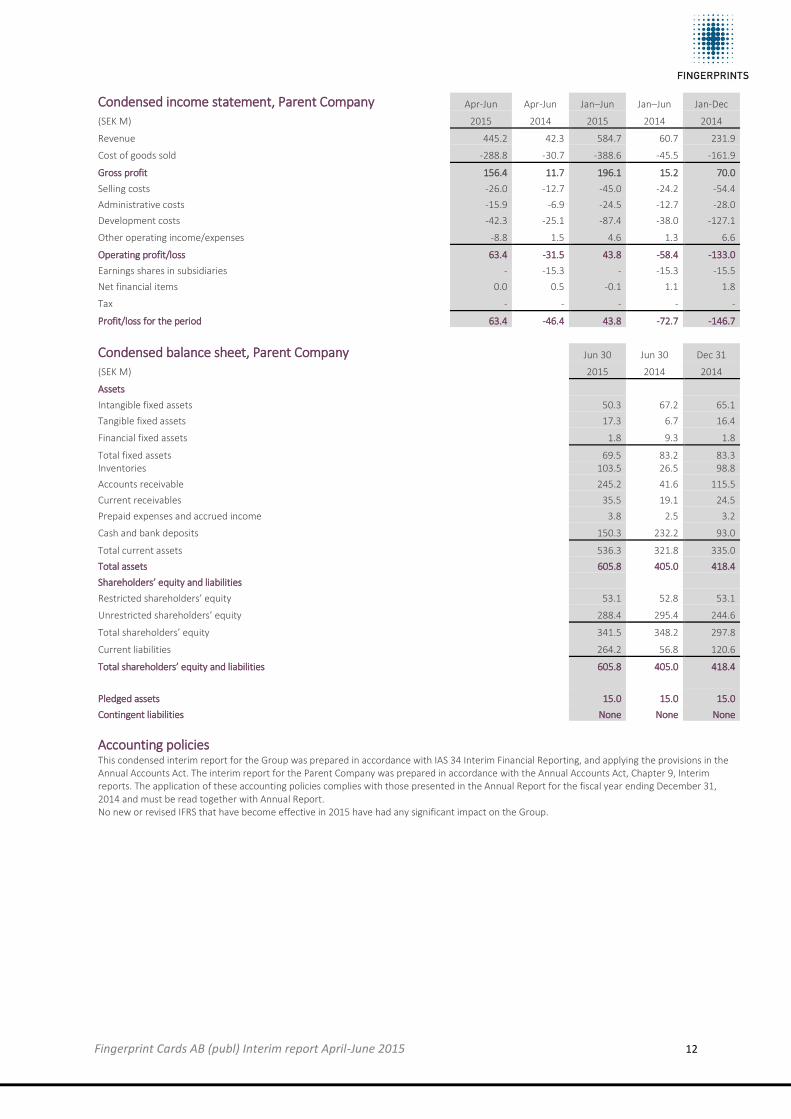
Condensed income statement, Parent Company Apr-Jun Apr-Jun Jan–Jun Jan–Jun Jan-Dec
(SEK M) 2015 2014 2015 2014 2014
Revenue 445.2 42.3 584.7 60.7 231.9
Cost of goods sold -288.8 -30.7 -388.6 -45.5 -161.9
Gross profit 156.4 11.7 196.1 15.2 70.0
Selling costs -26.0 -12.7 -45.0 -24.2 -54.4
Administrative costs -15.9 -6.9 -24.5 -12.7 -28.0
Development costs -42.3 -25.1 -87.4 -38.0 -127.1
Other operating income/expenses -8.8 1.5 4.6 1.3 6.6
Operating profit/loss 63.4 -31.5 43.8 -58.4 -133.0
Earnings shares in subsidiaries - -15.3 - -15.3 -15.5
Net financial items 0.0 0.5 -0.1 1.1 1.8
Tax - - - - -
Profit/loss for the period 63.4 -46.4 43.8 -72.7 -146.7
Condensed balance sheet, Parent Company Jun 30 Jun 30 Dec 31
(SEK M)
2015 2014 2014
Assets
Intangible fixed assets 50.3 67.2 65.1
Tangible fixed assets
17.3 6.7 16.4
Financial fixed assets 1.8 9.3 1.8
Total fixed assets 69.5 83.2 83.3 Inventories 103.5 26.5 98.8
Accounts receivable 245.2 41.6 115.5
Current receivables 35.5 19.1 24.5
Prepaid expenses and accrued income 3.8 2.5 3.2
Cash and bank deposits 150.3 232.2 93.0
Total current assets 536.3 321.8 335.0
Total assets 605.8 405.0 418.4
Shareholders’ equity and liabilities
Restricted shareholders’ equity 53.1 52.8 53.1
Unrestricted shareholders’ equity 288.4 295.4 244.6
Total shareholders’ equity 341.5 348.2 297.8
Current liabilities 264.2 56.8 120.6
Total shareholders’ equity and liabilities 605.8 405.0 418.4
Pledged assets 15.0 15.0 15.0
Contingent liabilities None None None
Accounting policies This condensed interim report for the Group was prepared in accordance with IAS 34 Interim Financial Reporting, and applying the provisions in the Annual Accounts Act. The interim report for the Parent Company was prepared in accordance with the Annual Accounts Act, Chapter 9, Interim reports. The application of these accounting policies complies with those presented in the Annual Report for the fiscal year ending December 31, 2014 and must be read together with Annual Report. No new or revised IFRS that have become effective in 2015 have had any significant impact on the Group.
Fingerprint Cards AB (publ) Interim report April-June 2015 13
About Fingerprint Cards
Fingerprint Cards AB (FPC) develops, produces and markets biometric components that, through the analysis and matching of an individual’s unique fingerprint, verify the person’s identity.
The technology consists of biometric sensors, processors, algorithms and modules that can be used separately or combined with others. The competitive advantages offered by FPC’s technology include unique image quality, extreme robustness, low power consumption and complete biometric systems. With these advantages and the ability to achieve extremely low manufacturing costs, the technology can be implemented in volume products, such as smart cards and mobile phones, where extremely rigorous demands are placed on these characteristics. FPC’s technology can also be used in IT and Internet products for security and access control, etc.
Vision FPC aims to be the leading supplier of components and systems for fingerprint verification. “Beyond keys and pin codes – FPC makes life easier through secure identification.”
Business concept FPC develops and sells leading biometric products and solutions to companies that develop security and comfort systems.
Business models FPC works with three business models – component sales, project sales and licensing. Sales are conducted via distributors and direct selling to product developers/systems integrators and OEMs (Original Equipment Manufacturers).
Product strategy FPC aims to be a supplier of components and systems for fingerprint verification. As well as developing and marketing components in the product categories – area sensors, touch fingerprint sensors and swipe sensors.
Patent strategy To pursue an active patent strategy based on careful monitoring of the market in an effort to evaluate new opportunities for filing patents and identifying possible infringement of FPC’s patents.
Production strategy Conduct production through close cooperation with selected subsuppliers. Production-critical elements of manufacturing are to
be conducted using tools owned by FPC but operated by the subsupplier. All manufacturing is to be conducted in accordance with forecasts based on information received from customers and distributors.
Market strategy To market products with a focus on product developers/system integrators either via distributors or directly. Sales at the producer level will occur in close cooperation with distributors. FPC will also actively pursue sales efforts. Sales of area sensors are to be broadened above and beyond the volume segment of IT applications for banks to encompass other IT segments. Geographically, the area sensor, in terms of bank applications, will be marketed primarily in India, South Korea, Japan and Brazil, and also in Europe and the US.
Swipe sensors are to be marketed to product developers/system integrators of mobile phones and other portable applications, such as tablet devices, USB keys, smart cards, etc. As a feature of the launch of swipe sensors, the company will participate actively in development projects together with mobile-phone manufacturers. Geographically, marketing will occur in China, Korea, Taiwan, Japan, Europe and the US.
Value-driving factors The potential to use mobile phones for payment applications, with the accompanying security requirements, is a major driving force, as is the possibility of using fingerprint sensors for the next generation of charge cards. Identity theft, impersonation and stricter authentication imposed by public authorities and organizations are also driving the demand for more secure solutions. Increased requirements in terms of comfort and security in connection with authentication are creating demand for alternatives to cards, pin codes and passwords. In addition to these factors, there are also cost savings, benefits of scale and the potential to facilitate greater use in, for example, emerging countries and elsewhere.
Fingerprint Cards AB (publ) Interim report April-June 2015 14
Glossary Algorithm A systematic procedure for how to conduct a calculation or solve a problem in a given number of steps. In FPC’s specific case, the method refers to the comparison of two fingerprints with each other.
Area sensor A sensor with the size of a fingertip that can scan an entire fingerprint simultaneously. The fingertip is simply drawn against the sensor surface; refer to swipe sensor.
ASIC Application Specific Integrated Circuit. An integrated circuit in the form of a silicon chip that is designed to conduct specific features – in our case the measurement of a fingerprint.
Authentication Control process for a particular identity; in conjunction with logging on, for example. The word is synonymous with verification.
Biometric system A pattern recognition system that identifies or verifies a person by studying a physiological character of the person, in our case a fingerprint pattern.
Chip A piece of silicon in which the integrated circuit is embedded, such as a sensor chip. Normally, a silicon wafer is cut into a number of chips, with each chip being essentially identical.
Dpi Dots per inch. Resolution per spacial unit, in this case, inches. The higher the value, the better the resolution and degree of detail.
Design Win The decision by a manufacturer, for example, a mobile phone manufacturer, to start developing one or more commercial products that will contain FPC’s technology as an integrated element of the manufacturer’s product(s).
Enrolment Compilation of biometric data used to create a template. The process by which biometric data is compiled from an individual and processed and stored as a reference image.
Identification Comparison of compiled biometric data with all stored templates for the purpose of identifying one of these templates (and thus an individual) from a multitude.
Swipe sensor A sensor with a width equal to a fingertip but much narrower than the length of the finger. The fingertip is drawn across the sensor surface and part of the fingertip is scanned step-wise; compare with area sensors. The fingerprint is scanned in this manner.
Matching The process of comparing an image of a fingerprint with a pre-processed template, and assessing whether or not they are similar.
Packaging The work and components, apart from the silicon chip, required for building a sensor.
Yield The percentage of a number of approved units divided by the number of initial units. The term is primarily used in production.
Sensor platform The silicon technology that FPC has created for the development of future sensors.
Template An arrangement of unique data that represents a certain fingerprint.
Touch fingerprint sensor A sensor with the size of a fingertip that can scan an entire fingerprint simultaneously. Touch fingerprint sensors are synonymous with area sensors but their surface is smaller and they are adapted for integration into smartphones. The fingertip is simply laid against the sensor surface; refer to swipe sensor. Verification The comparison of compiled biometric data between an individual and a given template for the purpose of verifying a match.
Wafer A thin circular slice of silicon containing a number of integrated circuits, such as sensor chips.
Definitions Earnings per share Earnings for the period attributable to the Parent Company’s shareholders divided by the Parent Company’s average number of shares for the fiscal year.
Earnings per share after dilution See “Earnings per share” plus adjustment for the number of shares and the paid exercise price resulting from current remuneration and personnel programs. Earnings per share after dilution can never be better than earnings per share before dilution.
Shareholders’ equity per share Shareholders’ equity attributable to the Parent Company’s shareholders divided by the number of shares outstanding, before dilution, at period-end.
Shareholders’ equity per share after dilution See “Shareholders’ equity per share” plus adjustment for the number of shares and the paid exercise price resulting from current remuneration and personnel programs.
Average number of shares The Parent Company’s average weighted number of shares for the fiscal year.
Average number of shares after dilution See “Average number of shares” plus an increase by the average number of shares that could be issued as a result of current remuneration and personnel programs.
Equity/assets ratio Shareholders’ equity divided by total assets.
Inventory turnover rate Cost of goods sold divided by average inventories.
Average credit period Average value of accounts receivable over the period in relation to revenue, multiplied by 360 days.
Working capital Current assets less current non-interest-bearing provisions and liabilities.
Gross profit Income less cost of goods sold.
Adjusted gross profit Income less cost of goods sold excluding production expenses and amortization according to plan of capitalized development expenditure, meaning that only the cost of materials with subcontracted work and freight costs are included in the costs component.
Cost of goods sold Cost for materials, production expenses and amortization according to plan of capitalized development expenditure.
Gross margin Gross profit as a percentage of revenue.
Adjusted gross margin Adjusted gross profit as a percentage of revenue.
Operating margin Operating profit/loss as a percentage of revenue.
Net margin Profit/loss for the period as a percentage of revenue.
EBITDA Earnings Before Interest Taxes Depreciation and Amortization. Operating profit before interest rates, taxes, depreciation/amortization and impairment losses.