Fox Report EXH 40 Air Liquide Hydrogen Project Application ...
155
APPLICATION I O R AUTHOKITY TO CONS I KUCT I AIR UQUIDE • Rodeo, California Hydrogen Plant Project Application for Authority to Construct and Major Facility Review Permit October 2005 0027630 Environmental Resources Management 1777 Bolelho Drive, Suite 260 W,limit Creek, Cnlifornia 945% Ji/ l-Jn 1 I
Transcript of Fox Report EXH 40 Air Liquide Hydrogen Project Application ...

APPLICATION I OR AUTHOKITY T O C O N S I KUCT
I AIR UQUIDE • Rodeo, California
Hydrogen Plant Project Application for Authority to Construct and Major Facility Review Permit
October 2005
0027630
Environmental Resources M a n a g e m e n t 1777 Bolelho Drive, Suite 260
W,limit Creek, Cnlifornia 945%
Ji/
l - Jn 1
I

AIR U Q U I D E • Rodeo, California
Hydrogen Plant Project Application for Authority to Construct and Major Facility Review Permit
October 2005
0027630
Tobey T s ^ b r AirUquidt Large hidustnes USE
i / u-'
Lynn McGuire Project Manager, FRM
Environmental Resources Management 1777 Bcrtelho Drive, Suite 260
Walnut Creek, CA 94596

TABLE OF CONTENTS
111 LIST OF TABLES
1 1.0 INTRODUCTION
1.2 PROJECT OVERVIEW
1 1.3 PROJECT SCHEDULE
1.4 AIR QUALITY REQUIREMENTS
2 1.5 APPLICATION SUMMARY
3 2.0 FACILITY AND PROJECT DESCRIPTION
3 2.1 NEW HYDROGEN PLANT EQUIPMENT 4 Feed Pretreatment 2 . 1 . 2
Reforming Shift Conversion Hydrogen Purification
4 2.1.2 4 2.1.3 5 2.1.4
2.2 ASSOCIATED OPERATIONS AND A UXILLARYEQUIPMENT 5 5 Startup Hydrogen/Syngas Flare
Cooling Tmoer Storage Tanks Other Auxiliary Equipment
2.2.1 5 2.2.2 6 2.2.3 6 2.2.4
7 3.0 ESTIMATED EMISSIONS
7 3.1 SMR FURNACE EMISSIONS
9 3.2 FUG1TIVE COMPONENT EMISSIONS
3.3 DEAERATOR VENT 11
11 3.4 COOLING TOWER
12 3.5 FLARE EMISSIONS
13 4.0 NEW SOURCE REVIEW OF TOXIC AIR CONTAMINANTS
13 4.1 COMBUSTION EMISSIONS
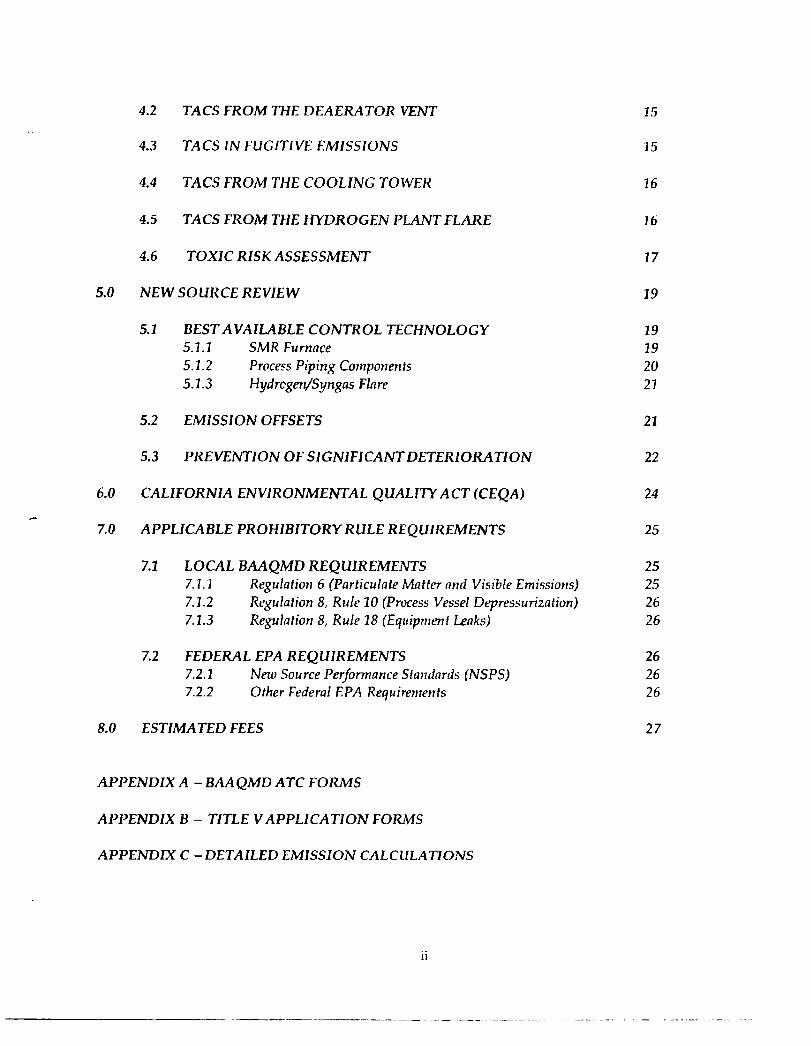
4.2 TA CS FR OM THE DEAERA TOR VENT 15
4.3 TACS IN FUCITIVE EMISSIONS 15
4.4 TACS FROM THE COOLING TOWER 16
4.5 TACS FROM THE HYDROGEN PLANT FLARE 16
4.6 TOXIC RISK ASSESSMENT 17
5.0 NEW SOURCE REVIEW 19
5.1 BEST A VAILABLE CONTROL TECHNOLOGY 19 5.1.1 SMR Furnace 19 5.1.2 Process Piping Components 20 5.1.3 Hydrogen/Syngas Flare 21
5.2 EMISSION OFFSETS 21
5.3 PREVENTION OF SIGNIFICANT DETERIORATION 22
6.0 CALIFORNIA ENVIRONMENTAL QUALITY ACT (CEQA) 24
7.0 APPLICABLE PROHIBITORY RULE REQUIREMENTS 25
7.1 LOCAL BAAQMD REQUIREMENTS 25 Regulation 6 (Particulate Matter and Visible Emissions) Regulation 8, Rule 10 (Process Vessel Depressurization) Regulation 8, Rule 18 (Equipment Leaks)
7.1.1 25 7.1.2 26 7.1.3 26
7.2 FEDERAL EPA REQUIREMENTS 26 New Source Performance Standards (NSPS) Other Federal EPA Requirements
7.2.1 26 7.2.2 26
8.0 ESTIMATED FEES 27
APPENDIX A - BAAQMD ATC FORMS
APPENDIX B - TITLE V APPLICATION FORMS
APPENDIX C -DETAILED EMISSION CALCULATIONS
i i

LIST OF TABLES
Summary ofNeiv Hydrogen Plant Emission 8 Table 3-1
New Hydrogen Plant Furnace Criteria Pollutant Emission Factors 9 Table 3-2
9 New SMR Furnace Criteria Pollutant Emissions Table 3-3
10 Table 3-4 Fugitive Component Count
Fugitive Component Emission Factors 11 Table 3-5
Total Fugitive Component Emissions 11 Table 3-6
12 Estimated Hydrogen Plant Cooling Tower Emissions Table 3-7
13 Estimated Flare Emissions Table 3-8
TAC Emission Factors for Combustion Sources 14 Table 4-1
TAC Emission Factors from the Proposed New Hydrogen Plant SMR Furnace
Table 4-2 15
16 TAC Emissions form the Deaerator Vent Table 4-3
16 TAC Emissions from Fugitive Components Table 4-4
17 TAC Emissions from Cooling Tower Table 4-5
TAC Emissions from the Flare Points 17 Table 4-6
Total Annual TAC Emissions from the Hydrogen Plant Project 18 Table 4-7
19 Total Hourly TAC Emissions from the Hydrogen Plant Project Table 4-8
20 Proposed BACTfor the SMR Furnace Table 5-1
22 Emission Offsets Table 5-2
23 Total Project Emissions for PSD Applicability Table 5-3
i i i

Table 8-1 Air Liquide Hydrogen Plant NSR Fees 27
Air Liquide Hydrogen Plant MFR Title V Fees Table 8-2 27
i v

3.0 INTRODUCTION
1.1 Contact Information
Owner Facility Name
Air Liquide Large Industries U.S. LP Rodeo SMR SIC Code 2813 NAICS Code 325120
BAAQMD Facility No. TBD Address 1380 San Pablo Avenue
Rodeo, California 94572-1299 Mr. Tobey Taylor (713) 624-8288 (713) 803-7448
Contact Name Phone Fax Email [email protected]
2.2 PROJECT OVERVIEW
This application is a request to the Bay Area Air Quality Management District (BAAQMD) for an Authority to Construct (ATC) and Major Facility Review operating permit for a new Hydrogen Plant to be constructed, owned, and operated by Air Liquide Large Industries US. LP (Air Liquide) at the ConocoPhillips Refinery in Rodeo, California. Although a separately owned and operated facility, this new plant is a component of a related project, ConocoPhillips' Clean Fuels Expansion Project (CFEP), which is being simultaneously planned and would be constructed concurrently with the proposed Hydrogen Plant. The BAAQMD has requested that this project be permitted under a separate ATC and Permit to Operate. Since this project and the CFEP are related, the criteria pollutant emissions from both projects were included in the Prevention of Significant Deterioration (PSD) applicability assessment and the toxic air contaminant emissions were included in the project Health Risk Assessment (HRA).
The proposed Hydrogen Plant will be supplied by feed streams from the ConocoPhillips Refinery and will incorporate energy conservation measures that will allow it to produce steam a n d / o r electricity from recovery of waste heat for use by the ConocoPhillips Refinery. The steam produced will enable the Refinery to shut down the Unit 240 B-l boiler (S-8).
1.3 PROJECT SCHEDULE
Construction is scheduled lo begin in September 2006. Tie-ins and modifications to existing process units are scheduled to take place during turnarounds planned for the first quarter of 2008. Startup is planned for the first quarter of 2008.
1 ERM AIR LlQL ' lDE/t t&Tbyi - lO/ia/OS

3.4 AIR QUALITY REQUIREMENTS
The proposed modifications will meet all BAAQMD and federal air quality regulatory requirements. The proposed project meets all requirements for New Source Review (BAAQMD Regulation 2, Rule 2). Best Available Control Technology (BACT) and emissions offsets will be provided, as required. The proposed project meets all requirements for New Source Review of Toxic Air Contaminants (TACs) (BAAQMD Regulation 2, Rule 5). An HRA will be submitted by ConocoPhillips that addresses TACs from both the CFEP and the New Hydrogen Plant Projects combined.
The Contra Costa County Community Development Department is preparing an Environmental Impact Report (E1R) in accordance with the California Environmental Quality Act (CEQA) review for the CFEP and Hydrogen Plant Projects combined.
The ConocoPhillips Refinery is a major source for PSD purposes as defined in the Code of Federal Regulations (CFR) Title 40 Part 52.21. The proposed new and modified source emissions associated with the CFEP and Hydrogen Plant Projects exceed the PSD significance levels for oxides of nitrogen (NO*), particulate matter less than 10 microns in diameter (PMio) and precursor organic compounds (POC) emissions. ConocoPhillips intends to conduct an emissions netting analysis for PMio that will result in emissions below significance levels, but NOx emissions will require that a PSD permit be obtained. POC emissions will be reviewed under BAAQMD's new source review process for non-attainment pollutants. ConocoPhillips is planning to submit a PSD permit application, including air quality impact and other required analysis for NO* and the results of the netting analysis for PMio, to the US EPA as a supplement to this application.
1.5 APPLICATION SUMMARY
The application and its attachment contain all the necessary information for the BAAQMD to evaluate the Hydrogen Plant Project. This application contains the following information:
• Section 2 describes the proposed project;
• Section 3 presents criteria pollutant emissions;
• Section 4 presents TAC emissions;
• Section 5 discusses New Source Review;
• Section 6 discusses CEQA;
• Section 7 presents Applicable Requirements; and
• Section 8 includes a Fee Estimate.
Appendix A includes the BAAQMD ATC forms. Appendix B includes the initial Title V application forms. Appendix C includes the detailed emission calculations.
2 AIR LIOUIDE/0027ex3C - l O / J B / d S E R M

2.0 FACILITY AND PROJECT DESCRIPTION
The proposed Hydrogen Plant will be wholly located within the ConocoPhillips Rodeo Refinery. The Refinery is located in unincorporated Contra Costa County, near the town of Rodeo, as shown on Figure 1. The Refinery consists of refining processes and support units that produce fuels, sulfur, and petroleum coke. The principal activity of the Refinery is fuels manufacturing, wherein it converts crude oil and other feedstock into gasoline, jet fuel, diesel, and small quantities of industrial fuels.
The Rodeo Refinery encompasses approximately 1,100 acres of land that consists of 495 acres in active refining activity and another 600 acres of undeveloped area. Figure 2 shows the Valero terminal to the north, an undeveloped area to the east, the Bayo Vista residential area to the south and San Pablo Bay to the west. A 300- to 600-foot-wide strip of undeveloped refinery land is maintained as buffer areas between the developed portion of the refinery and adjacent land uses to the south including the Bayo Vista residential area.
Interstate 80 and San Pablo Avenue run north-south through the Refinery property. The property is zoned Heavy Industrial. Land uses to the northeast of the Refinery are a combination of industrial and open space; east is primarily open space; a combination of residential, light commercial and light industrial uses is found to the south and southwest. The nearest sensitive receptor is a day-care facility near the southern property boundary, south of the undeveloped buffer zone.
Figure 3 shows a plot plan with the locations of the proposed Hydrogen Plant within the Refinery.
2.1 NEW HYDROGEN PLANT EQUIPMENT
The proposed Hydrogen Plant will supply hydrogen to the expanded hydrocracker, Unit 240. The Hydrogen Plant's proposed capacity is 120 million standard cubic feet per day (MMSCF/D) hydrogen production. It will be located within the perimeter of the Refinery on land that has already been developed. The Plant will be located on the east side of San Pablo Avenue west of the Refinery's coking Unit 200. The Hydrogen Plant will be owned and operated by Air Liquide.
The Hydrogen Plant will use Steam Methane Reforming (SMR), the most widely used technology for producing hydrogen from hydrocarbon (C1-C5) feedstocks. A proposed Hydrogen Plant Process Flow Diagram is presented on Figure 4. The New Hydrogen Plant will be capable of handling several different feeds, including gaseous feeds of natural gas and refinery fuel gas (RFG), and liquid feeds of butane and pentanes. As shown in Figure 4, the basic steps of the hydrogen manufacturing process are as follows:
3 AIR U Q U i n i : / « n 7 6 3 0 - l i V I P / C ? F.RM

• Feed Pretreatmcnt;
• Reforming;
• Shift Conversion; and
• Hydrogen Purification.
2.1.1 Feed Pretreatment
Any condensate in the gaseous feeds is removed in a knockout drum. The feed is then mixed with a small amount of hydrogen. This mixed feed is then preheated and fed to the Hydrotreater. The Hydrotreater converts sulfur compounds to hydrogen sulfide and saturates any unsaturated hydrocarbons present in the feed. The hydrotreated feed is then fed to the desulfurizers, where ZnO catalyst adsorbs the hydrogen sulfide.
2.3.2 Reforming
After pretreatment, the feed is mixed with superheated steam. The feed mixture then passes through catalyst filled tubes in the Reformer. In the presence of nickel catalyst, feed reacts with steam to produce hydrogen and carbon oxides by the following reforming reaction:
CH4 + H2O + heat = CO + 3H2 (1)
The Reformer product is known as SynGas, which is primarily hydrogen and carbon monoxide.
This reaction takes place under carefully controlled firing of the SMR furnace. The SMR furnace will be sized for a maximum firing capacity of approximately 1,100 million British Thermal Units per hour (MMBtu/hr), higher heating value. This furnace will be equipped with Low-NOx burners and a Selective Catalytic Reduction (SCR) system to reduce NO* emissions and meet BACT standards. Ammonia for the SCR will be delivered by truck and stored on site in a tank.
2.1.3 Shift Conversion
The process gas stream leaves the Reformer and is then fed to the Shift Converter. The Shift Converter contains a bed of copper-promoted iron-chromium catalyst. Most of the incoming carbon monoxide is shifted to carbon dioxide and hydrogen by the following shift reaction:
(2) CO + H2O = CO? + H2 + heat
The shift reaction gives off heat. The Shift Converter effluent process gas is cooled in the process feed and boiler feed water preheaters. The cooled stream then flows into the Hot Condensate Separator where steam condensate is separated. The overhead vapor stream is cooled and is then sent to the Cold Condensate Separator where
4 A IK UQUlDfc/Kn7h3P - l o m / C 5 ERM

condensate is separated and the gas is sent to the Pressure Swing Adsorption (PSA) hydrogen purification unit.
The process condensate is treated and recycled for use as boiler feed water. During the reforming process, the condensate absorbs some byproducts from the reforming reaction, chiefly methanol and ammonia. Most of the byproducts are stripped in the high pressure condensate stripper and recycled within the SMR. The remainder is vented to the atmosphere through the deaerator vent.
2.1.4 Hydrogen Purification
The PSA operates on a repeated cycle, having the two basic steps of adsorption and regeneration.
During the adsorption step, feed gas flows through adsorbents - granular materials that selectively attract and hold (adsorb) feed gas impurities, thus, producing high purity hydrogen product. The feed flow continues until the on-stream bed is loaded with impurities. At that time, a new adsorber is switched on-stream and the loaded adsorber is regenerated.
During regeneration, impurities are desorbed, which prepares the bed for the next adsorption cycle. Desorption consists of a step-wise depressurization, followed by purge. The adsorber vessel is then repressured and returned to service. The offgas generated from the PSA regeneration is sent to the Reformer Furnace where it provides most of the fuel requirement.
2.2 ASSOCIATED OPERATIONS AND AUXILIARY EQUIPMENT
2.2.1 Hydrogen/Syngas Flare
The Hydrogen Plant will have a flare to combust hydrogen and syngases during startup, shutdown, customer constraint periods, maintenance events, and process upsets. The gases combusted in the Hydrogen Plant flare will be products of the SMR reaction, either syngas produced by the reformer or hydrogen product. Any relief valve venting of SMR feed streams (hydrocarbon streams, such as natural gas, refinery gas, butane or pentane) will be routed to the ConcoPhillips refinery flare system. The Hydrogen Plant flare will also be used to control emissions from the ammonia tank pressure relief valve. The Hydrogen Plant will have no routine flaring emissions.
2.2.2 Cooling Tower
The cooling water tower will have capacity of 5.2 million gallon per day (3,600 gallons per minute) circulation rate. The cooling water tower will be a double-cell conventional induced draft unit. Air Liquide proposes to use high-efficiency drift eliminators (0.005% drift) to control particulate matter emissions. The proposed cooling lower will
5 AIR l . i g u r i 3 H / t W ~ 6 3 0 - ' . O / J S / C * ERM

cool the process gas after the shift converter. The only organic compounds expected in the process gas at that point are methane and ethane, so the cooling water will contain very little POC.
Based on BAAQMD Rule 2-1-128.4, the cooling water tower is exempt from permitting. The calculated PMio and POC emissions will be well below 5 tons per year and any potential toxic emissions will be below the risk screening trigger levels. Therefore, the BAAQMD Rule 2-1-319 requirements are met and the exemption will apply to this cooling water tower.
2.2.3 Storage Tanks
The SMR furnace will use an SCR process that utilizes 19% aqueous ammonia. Aqueous ammonia will be stored in a new pressure vessel with a nitrogen blanket. Ammonia storage tanks are exempt per BAAMQD Rule 2-1-123.2 because the tanks will contain an aqueous solution with less than 1 percent organic matter.
Glycol will be used as a coolant at the Hydrogen Plant. A small glycol tank, approximately 500 gallons in capacity, will be installed. Glycol has a high boiling point and will be exempt from permitting, per BAAQMD Rule 2-1-123.3.2. This exemption is for tanks storing organic liquids or mixtures containing organic liquids; where the initial boiling point of the organics is greater than 302 degrees Fahrenheit (0F) and exceeds the actual storage temperature by at least 180 0F.
2.2.4 Other Auxiliary Equipment
The Hydrogen Plant will incorporate energy conservation measures that will allow it to produce high-pressure steam from recovery of waste heat. This steam will be created in a waste heat boiler. Air Liquide will receive boiler feed water from ConocoPhillips, and will have a small chemical injection skid to control the boiler-water chemistry.
6 EKM MR LKX l»Dt /IXrTTMV) - 1 0 / 1 8 / 0 5

3.0 ESTIMATED EMISSIONS
Annual average emissions are calculated to determine the Hydrogen Plant Project total estimated emissions, the required amount of emission offsets, and the applicability of PSD requirements. Estimated emissions for the Hydrogen Plant Project are shown in Table 3-1. Annual mass emissions are calculated based on 24-hour-per-day and 365-day-per-year operation.
Table 3-1 Summary of Hydrogen Plant Project Emissions
Tons per Year
CO S O ? P M j o P O C Source NO*
27.9 33.7 5.6 17.8 13.0 N e w SMR Furnace1
Deaerator Vent
Flare Pi lots /NG Purge
Fugitives
8.8
0.2 0.005 1.6
1.2
35.3 Total 28.1 5.6 17.8 23.0
1. Based on preliminary BACT emission levels
3.1 SMR FURNA CE EMISSIONS
The New Hydrogen Plant requires a new SMR furnace rated at 1,100 MMBtu/hr of heat input for normal operations, and up to 1,300 MMBtu/hr for short-term conditions. The Hydrogen Plant will be equipped with a PSA unit to ensure high-purity hydrogen is produced. The offgas from the PSA unit will serve as the primary fuel source for the SMR furnace (approximately 70% of total furnace heat input; the percentage will vary depending on operating conditions). The SMR furnace will also burn refinery fuel gas supplied by ConocoPhillips a n d / o r natural gas. Due to the metallurgy of the air preheat section, the treated refinery fuel gas will be blended with natural gas to reduce the total sulfur content to below 35 ppmv. The PSA offgas is not treated for sulfur removal, since it is generated by the process, and all sulfur is removed from the process feed in the pretreatment section of the SMR.
The SMR furnace will be equipped with low-NO* burners and an SCR system to meet BACT standards. NOx emissions will not exceed 5 ppmv dry (ppmvd) at 3 percent Cb. Good combustion practices will ensure that CO and POC emissions are minimized. CO emissions will not exceed 10 ppmvd at 3 percent O 2 .
Using treated refinery fuel gas a n d / o r natural gas will minimize P M j o emissions. P M 1 0 and POC emissions are estimated by using factors from Table 1.4-2 of AP-42 (July 1998) and adjusting them for combustion of the PSA offgas and refiner)' fuel gas mixture. The
7 AIR : i 0 U 0 E / P 0 2 7 r ' . M - I C y 1 8 / 0 5 ERM

actual ratio of the PSA offgas to the other fuel will vary, depending on the operating conditions. The AP-42 PMio and POC emission factors (which are based on firing natural gas) are reduced by 50 percent due to the fact that hydrogen will make up nearly 50 percent of the combustibles in the SMR furnace fuel and would not generate PMio or POC.
The emission factor for S O 2 is also derived for the PSA offgas/refinery gas mixture as fuel to the SMR furnace, considering the sulfur content of each fuel type.
For each criteria pollutant emitted from the new SMR furnace. Table 3-2 provides emission factors that have been converted to units of pounds per MMBtu (of heat input).
Table 3-2 New Hydrogen Plant Furnace Criteria Pollutant Emission Factors
EF Pollutant Emission Factor Reference (Ib/MMBtu)
N O X 5 ppmvd @ 3% O2 SCAQMD BACT 0.0058
35 ppmv total sulfur in RFG/Natural Gas1 SCh 0.0012 BAAQMD BACT
AP-42 Section 1.4, Natural Gas Combustion (apply 'A value sincc 50% H2 in fuel)
AP-42 Section 1.4, Natural Gas Combustion (apply Vi value since 50% H2 in fuel)
P M M 0.0037 3.8 Ib/MMscf (natural gas)
POC 0 0027 2.75 Ib/MMscf (natural gas)
CO 10 ppmvd @ 3% Oj SCAQMD BACT 0.0070
'The combination of the PSA offgas/refinery gas/natural gas mixture will result in an overall emission factor of 0.0012 Ib/MMBtu total sulfur in the fuel fired in the SMR furnace under typical conditions.
Using these emission factors and the firing rate of the SMR furnace, the estimated criteria pollutant emissions f rom this proposed new source are shown in Table 3-3.
Table 3-3 New SMR Furnace Criteria Pollutant Emissions
Emissions' Pollutant
Ib/hr (1300 MMBhyfar) lon/yr (1100 MMBtu/hr)
7.5 27.9 NO,
1.5 5.6 SOi
4.8 17.8 PMio
POC 3.5 13.0
9.1 33.7 CO
1. Based on BACT emission levels.
8 AIR ijQurr>E/0cr7&30 -10/ is/c* E R M

3.2 FUGITIVE COMPONENT EMISSIONS
The proposed SMR Hydrogen Plant will include new sources of fugitive POC enussions. The number of new fugitive components for the Hydrogen Plant is estimated based on a design drawing hand-count, of a similar unit. The estimated count of new fugitive components is divided into three service categories including gas, light liquid, and heavy liquid. Table 3-4 provides an estimated fugitive component count for the New Hydrogen Plant.
Table 3-4 Fugitive Component Count
Component Counts Unit
Compressors/PRV Stream Valves Pumps Connectors Flanges
Gas 355 2856 0 10 5 SMR Hydrogen
Plant LL 70 2 0 100 0 ML 0 0 0 0 0
Notes: LL - Light Liquid Stream. HL - Heavy Liquid Stream
These estimated counts were used to estimate fugitive PCX! and toxic air contaminant emission increases from the proposed project. Pressure relief valves (PRVs) are not included in the fugitive component count because any new PRVs for the proposed Hydrogen Plant will be connected to a flare to control both fugitive leak and process upset emissions. PRVs on any of the fuel or feed streams upstream of the sulfur removal section of the SMR will be routed to the Refinery's vapor recovery system. All other PRVs will be routed to the Hydrogen Plant flare .
Fugitive POC emission estimates were calculated based on United States Environmental Protection Agency (USEPA) Correlation Equations as presented in Table IV-3a of the February 1999 California Air Resources Board/California Air Pollution Control Officers Association (CARB/CAPCOA) document entitled California Implementation Guidelines for Estimating Mass Emissions of Fugitive Hydrocarbon Leaks at Petroleum Facilities.
For the purposes of this application, the maximum leak rate allowed by the BAAQMD (100 ppmv for valves, 500 ppmv for pumps, etc.) was used as the screening value (SV) in each Correlation Equation. Use of BAAQMD maximum leak rates results in a conservative emissions estimate because most fugitive components have actual leak rates well below the BAAQMD maximum leak rates.
The SVs used for valves, flanges, connectors, pumps, and compressors, and the corresponding Correlation Equations are shown in Table 3-5. This table also displays resulting emission factors in pounds per hour per source. Using the Correlation Equation approach, with the BAAQMD maximum leak rates, the resulting emission
9 AIR u o u i D F / o o r t K - : o / : s / c 5 FKM

factors for each component type are the same for each type of service (gas, light liquid and heavy liquid).
Table 3-5 Fugitive Component Emission Factors
Screening Resulting Correlation Equation") Value, SV<J) Emission Factor
Resulting Emission Factor
Component Typi^Service
(ppmv) (kft/hr/source) (Ib/hi/source)
Valves/All 2.27E-6*(SV)A0.717
4.53E-6"(SV)A0 706
5.07E-5*(SV)A0.622
8.69E-6(SV)A0.642
100 7.1E-05 1.6E-04
ConnectorVA.ll 100 4.5E-05 1.0E-04 FlangeVAII
Pump Seals/All
Other<3l/All
100 1.2E-04 2 6E-04
500 2.4E-03 5.3E-03
500 4.7E-04 1.0E-03
1. California Implementation Guidelines for Estimating Mass Emissions of Fugitive Hydrocarbon Leaks at Petroleum Facilities, February 1999.
2. Screening Values assumed to be maximum leak rate allowed by BAAQMD, Regulation 8-18.
3. The "other" component type includes instruments, pressure relief valves, vents, compressors, dump lever arms, diaphragms, drains, hatches, meters, and polished rods stuffing boxes. This "other" component type should be applied for any component type other than connectors, flanges, open-ended lines, pumps, or valves.
The fugitive component emission factors in Table 3-5 include methane and ethane, which are non-precursor organic compounds (NPOC), and other reactive POC. Table 3-6 summarizes the total fugitive component emissions associated with the New Hydrogen Plant. The emissions in Table 3-6 are adjusted to only include POC emissions.
Table 3-6 Total Fugitive Component Emissions
Emissions Process Components
tor^/yr Lb/hr lb/day
0.24 0.05 Natural Gas
RFG Fuel
Butane Feed
Pentane Feed
RFG Feed
SMR Feed
0.01
1.2 0.23 0.05
0.33 1.8 0.08
0.72 0.12 0.03
0.24 0.04 0.01
0.72 0.03 0.12
After construction of the new hydrogen plant, an actual count of fugitive components will be conducted. This information will be provided to the BAAQMD to determine if any adjustments are needed for compliance with applicable requirements (i.e., a possible change in the quantity of required emission reduction credits).
10 A I R L I Q t ; : D F / 0 0 2 7 6 3 C - l O / i a / O i I.KM

3.3 DEAERATOR VENT
Process condensate is collected during cooling of syngas after shift conversion. During the reforming process, the condensate absorbs some byproducts from the reforming reaction, chiefly ammonia, and from the shift conversion, chiefly methanol. These byproducts are stripped in the high pressure condensate stripper, and are recycled. The small amount that does not get stripped is vented to the atmosphere through the Deaerator Vent. POC emissions from the deaerator vent (primarily methanol) expected to be 8.8 tons per year.
are
3.4 COOLING TOWER
The cooling tower associated with this project is an exempt source per BAAQMD Rule 2-1-128.4 since the estimated emissions of criteria pollutants are less than 5 tons per year. The primary emissions from cooling towers consist of PMio from water droplet drift and evaporation, and POC from organic compounds that leak into the cooling water from process fluids. The proposed cooling tower will cool lube oil, the steam generator, the product compressor, and the process gas after the shift converter, so the cooling water will contain very little POC. Emissions are calculated following the BAAQMD Permit Handbook procedures for cooling towers, with the exception that the AP-42 emission factor for POC is reduced to one-quarter of its referenced value due to the POC content of the process stream being cooled. The results of these calculations are shown in Table 3-7.
Table 3-7 Estimated Hydrogen Plant Cooling Tower Emissions
Operations parameter Value
Tower Capacity (MM gal/day) 5.2
Maximum waier hardness (ppm TDS)
Drift Loss (% of flow capacity)"*
Weight of water (lb/gal)
Maximum PMio emissions (lb/yr)i2!
Maximum PMio emissions (ton/yr)tJ)
POC Emission Factor
3000
0.0005%
8.34
237
0.12
1.5
Maximum POC emissions (lb/day)
Maximum POC emissions (ton/yr)
7.8
1.4
1. Vendor estimate
2. Calculation method from Section VI (Engineering Evaluation Template) of BAAQMD Permit Handbook Chapters, Cooling Towers.
3. EPA AP-42 Table 5.1-2. Uncontrolled by monitoring. Emission factor reduced to one-quarter of referenced value due to POC content of stream.
n 1 0 / 1 3 , 0 5 t l i M

3.5 FLARE EMISSIONS
The new flare proposed as part of the Hydrogen Plant Project will be used during maintenance periods, s tar tup/shutdown, customer constraint periods, and process upsets. A flare pilot will be maintained, which will be fired by natural gas. Table 3-8 summarizes the NOx and CO emissions associated with the flare for the pilots and sweep gas. More detailed calculations are provided in Appendix C.
Emissions of S O 2 from the pilot gas are estimated based upon natural gas content of 10 ppmv sulfur in natural gas. There is no sulfur present in the hydrogen or syngas products. Pilot gas emissions are based upon a design of 6 pilots with a capacity of 91.9 standard cubic feet per hour (scfh) each. In addition, 116.7 scfh of natural gas is used as a sweep gas.
Table 3-8 Estimated Flare Pilot Emissions
NO, CO Pilot Gas
Type
Pilot Gas to Flare (scfh) (torVVr)2 (toiytyr)'
Flare Pilot
Nat gas 668 Pilo^Swcep1 0.20 1.64
1. SOj emissions amount to 0.005 tons/yr from natural gas pilot.
2. NOx emission factors were provided by the flare vendor, Callidus (0.068 lb NO, /MMBtu) emissions
3. CO emissions were estimated using an emission factor derived by the TCEQ for non-stcam assist, low-Btu flares (0.5496 lb CO/MMBtu).
12 AIR U y u i U K / O M / e J O - : o / 1 8 / 0 5 i : h m

4.0 NEW SOURCE REVIEW OF TOXIC AIR CONTAMINANTS
In accordance with BAAQMD Regulation 2-5-100, if the project emits any compound, which is identified in Table 2-5-1 of Regulation 2, Rule 5, above the indicated trigger level, then a risk analysis is required. "Project emissions" include emissions from new sources and increased emissions from modified sources. The Rule requires that emissions of all TACs associated with a project be included in the risk analysis if any single TAC exceeds its hourly or annual trigger level.
The permit application for the CFEP at the Rodeo Refinery has already been submitted. The project is related, and both the CFEP and the New Hydrogen Plant emit TACs that exceed the Table 2-5-1 trigger levels.
Due to the exceedance of the trigger levels, ConocoPhillips will prepare an HRA that includes both the CFEP and I lydrogen Plant projects.
4.1 COMBUSTION EMISSIONS
The emission factors used to estimate TAC emissions from the New Hydrogen Plant SMR Furnace are shown in Table 4-1. These emission factors were developed from measurements on Refinery heaters firing RFG and abated with SCR.
Table 4-7 TAC Emission Factors for Combustion Sources1
Emiss ion Factor1 Emission Factor1
Compound C o m p o u n d (Ib/MM BTU) (Ib/MM BTU)
Acenaphthene
Acenaphthylene
Acetaldehyde
Ammonia 2
Anl imony
Arsenic
Benzene
Benzo(A) Anthracene
Benzo(A)Pyrene
Benzo(B)Fluoranthene
Benzo(K)Fluoranthene
Cadmium
Chromium 3
2.36E-09
1.55E-09
1.53E-05
4.53E-03
5.17E-07
8.50E-07
6.47E-05
3.21 E-08
8.96E-08
4.04E-08
2.41 E-08
9.88E-07
1.07E-06
1.63E-09
4.21 E-06
1.08E-08
1.11 E-04
1.03E-07
4.89E-06
6.81 E-06
1.80K-07
3.13E-07
9.42E-06
1.46E-08
5.63 E-06
2.17E-06
2.48E-09
1.96E-08
1.61 E-06
1.07E-04
Fluorene
Formaldehyde
Indeno (1,2,3-c d) pyre n e
Lead
Manganese
Mercury
Naphthalene
Nickel
Phenanthrene
Phenol
Propylene
Pyrene
Se len ium
Silver
Toluene
Chrysene
Copper
13 AIK U Q U 1 D L / 0 I C 7 6 » 1 0 / 1 8 / 0 5 ERM

Emiss ion Factor1 E m i s s i o n Factor1
C o m p o u n d C o m p o u n d flb/MM BTU) ( Ib /MM BTU)
3.73E-05
2 .08t-05
Xylene (total)
Zinc
3.02l-:-05
3.06E-09
Ethy lbenzene
Fluoranfhene
Source: WSI'A/API Air Tone Emission Factors for Combustion Sources Using Petroleum-Rased Fuels, final report. Volume 2, Appendix B, 14 April 1998.
2. Derived from an assumed ammonia slip concentration of 10 ppm.
3. No hexavalent chromium was detected, chromium (total) represents non-hexavalent chromium compounds.
Total proposed maximum hourly firing rate for the 1 lydrogen Plant SMR furnace is 1,300 MMBtu/hr. Total proposed annual fuel usage for the SMR fumace would be 9,636,000 MMBtu. Based on these projected fumace firing rates, the maximum hourly and annual emissions of these compounds from the SMR fumace are presented in Table 4-2. Note that the emission factors in Table 4-2 assume 100% Refinery Fuel Gas as a fuel. These factors are extremely conservative for the SMR as it will typically only use RFG for approximately 15% of the fuel.
Table 4-2 TAC Emissions from the Proposed Neiv Hydrogen Plant SMR Fumace
Annual Emissions
Hourly Annual Emissions
Hourly Emissions Emissions Compound Compound
(Ib/yr) (Ib/hr) (Ib/yr) (Ib/hr)
Acenaphthene
Acenaphthylene
Acetaldehyde
Ammonia
Antimony
Arsenic
Benzene
Benzo(A)Anthraccne
Benzo(A)Pyrene
Benzo(B)Fluoranthene
Benzo(K)Fluoranthene
Cadmium
Chromium (Note 1)
Chrysene
Copper
Ethylbenzene
Fluoranthene
2.07E-02
1.36E-02
1-34E+02
2.36E-06
1 55E-06
1.53E-02
Huorene 9.46E-02
9.72E+02
9 02F.-01
1.08E-05
1.11 E-01
1.03E-04
Formaldehyde
lndeno(1,2,3-cd)PyTene
Lead 4.38E+04 5.00E+00
5.17E-04
8.50E-04
6.47E-02
3.21 E-C5
8.%E-C5
4.04E-05
2.41 E-05
9.88E-04
1.07E-03
1.63E-06
4.21 E-03
4.28E+01 4.89E-03
6.81E-03
1.80E-04
4.53E+00
7.45E+00
5.67E+02
Manganese
Mercury
Naphthalene
Nickel
Phenanthrene
5.97F+01
1.58E+00
2.74E+00
8.25E+<n
3.13E-04
2.81 E-01
7.85E-01
9.42E-03
1.46E-05
5.63E-03
2.17E-03
2.48E-06
l.%E-05
1.611 E-03
1.07 E-01
3.73 E-02
2.08 E -02
1.28E-01
4.93E+01
1.90E+01
2.17E-02
1.72E-01
3.54E-01
2 11 E-01
8.65E+00
Phenol
Propylene
Pyrene
Selenium
Silver
Toluene
9.37E+00
I.43F-02
3.69E+01
2.65E+02
2.68E-02
1.41E+01
9.37E+02
3.02E-02 Xylene (Total)
Zinc
3.27 E +02
3.06E-06 1.82 E+02
1 4 E R M AIK llQU\VE/m27tti>-lC/l$/X>

As shown in the table above, 10 compounds have estimated emissions (those indicated in bold) that exceed the assigned risk screening trigger levels. Therefore, a risk analysis is required for the toxic emissions in this application.
4.2 TAGS FROM THE DEAERATOR VENT
Methanol and ammonia, byproducts from the shift and reforming reactions, are vented to the atmosphere through the deaerator vent. Estimated ammonia and methanol emissions are summarized in Table 4-3.
Table 4-3 TAC Emissions from the Deaerator Vent
Hourly Emissions A n n u a l Emissions
(Ib/hr) (Ib/yr)
5585 0.M Ammonia
Mrlhanol 17,520 2.0
4.3 TAGS IN FUGITIVE EMISSIONS
TACs present in fugitive emissions from the Hydrogen Plant process area were estimated from process design speciation profiles provided by Air Liquide. These profiles include the natural gas, RFG fuel, butane feed, RFG feed, SMR feed, and glycol lines. The speciation tables are presented in Appendix C.
Each speciation profile provides a weight percent breakdown of each chemical component that comprises total POC emissions. Therefore, fugitive TAC emissions for each component and service type are individually estimated by multiplying the weight percent of each toxic air contaminant (from the speciation profile) times the total fugitive POC emissions. Table 4-4 presents a summary of TAC fugitive mass emissions.
Table 4-4 TAC Emissions from Fugitive Components
Hydrogen Plant Process Area Pollutant
Ib^hr Ibs /y r
0.00055 1,3-Butadiene
n-Hexane
4.84
0.00086 7.50
15 r i iM AIK UQU!DE/ (WI7670- IO/1B/K

4.4 TACS FROM THE COOLING TOWER
Chloroform emissions from the cooling tower were calculated using an emission factor of 0.0034 pound chloroform (CHCb) per pound of chlorine (Ch) used to chlorinate the cooling waters. The emission factor is from Proposed Identification of Chloroform as a Toxic Air Contaminant, CARB, September 1990 on the CARB internet site at http://www.arb.ca.gov/toxics/summarv/chloroform A.pdf. Chlorine usage was based on bleach density of 10 pounds per gallon, 12.5 weight percent sodium hypochlorite (NaOCl) (average of 9 to 16 percent bleach solution), 0.3 pound chlorine (Ch) per gallon. Results are shown in Table 4-5.
Table 4-5 TAC Emissions from Cooling Tower
Cooling Tower Pollutant
I b ^ h r Ib s /y r
C h l o r i n e
C h l o r o f o r m *
4.5E-06 3.95E-02
0.00114 9.97
a. Chloroform emissions from the cooling tower were calculated using an emission factor of 0.0034 lb C H C L j pe r lb of Q 2 used to chlorinate the cooling waters. Emission factor is from Proposed Idenlificalioti of Chloroform as a Toxic Air Contaminant (CARB, September 1990. h l tp : / /www.a rb . ca .gov / tox ic s / summary /ch lo ro fonn_A.pdf ) . Q 2 usage based on bleach density of 10 lb/gal , 12.5 wt% NaOCL 0.60 lb Cl /ga l , and 0.3 lb C h / g a l .
4.5 TACS FROM THE HYDROGEN PLANT FLARE
The flare pilots will be fueled by natural gas, and TACs would be emitted during natural gas combustion. TACs were calculated using the natural gas flowrate for all six pilots and emission factors for natural gas combustion from the Ventura County Air Pollution Control District. TAC emissions from the flare pilots are summarized in Table 4-6.
Table 4-6 TAC Emissions from the Flare Pilots
Annual Emissions Natural Gas H o l i r l > ' Emissions
Natural Gas Emission Flowrate (Ib/hr) (Ib/yr)
Pollutant Factor (Ib/MMcf) (MMctyhr) Flare Pilots Flare Pilots
Benzene 0.159 7.46E-01 5.36E-04 8.52E-05
Formaldehyde
Naph tha l ene '
Acetaldehyde
1.169 5.36E-04
5.36E-04
5.36E-04
5.36E-04
5.36E-04
5.36E-04
5.48E+00 6.26E-04
0.014
0.043
6.57E-02
2.02E-01
7.50E-06
2.30E-05
5.36E-06 4.69E-02
1.14E+01
2.72E-01
Acrolein
Propylene
To luene
0.01
2.44 1 31E-03
3 .nE-05 0.05S
16 AIR UQL1DE/0027630 - 1 0 / 1 3 / 0 6 LXM

1.36E-01
6.78E+00
1.36E-01
1.55E-(fi 5.36E^)4 0.029 Xylenes
E t h y l b c n z e n e
Hex. ine
T.TSE-O-l
1.55E-05
5.36F.-04
5.36E-04
1.444
0.029
Source: VCAPCD AB2588 C o m b u s t i o n Emission Factors ( 5 / 1 7 / 0 1 )
1. A s s u m e P A H is n a p h t h a l e n e
4.6 TOXIC RISK ASSESSMENT
The total annual and hourly TAC mass emissions from the Hydrogen Plant Project are summarized in Tables 4-7 and 4-8, respectively. For several TAC species, the annual mass emissions exceed the trigger level specified in BAAQMD Table 2-5-1. One compound exceeds the acute trigger level. An HRA will be prepared in accordance with BAAQMD Regulation 2, Rule 5. It will use recent California EPA guidance document Air Toxics Hot Spots Program Risk Assessment Guidelines (2003). Risk assessment calculations are being conducted using the Hot Spots Analysis and Reporting Program (HARP) software.
The HRA results, including air dispersion and risk assessment modeling output, will be provided electronically to the BAAQMD as a supplement to this application. The HRA for the Hydrogen Plant Project will include emissions from the concurrently CFEP emission sources. BAAQMD Risk Screening Assessment (RSA) forms are provided with this application, which provide more detail on source parameters that will be used in the modeling.
Table 4-7 Total Annual TAC Emissions from the Hydrogen Plattt Project
Total A n n u a l E m i s s i o n s B A A Q M D Tr igger Level ( I b / J T )
S u b s t a n c e (Ib/yr)
A c e t a l d e h y d e
Acrolein
A m m o n i a
A n t i m o n y
Arsenic
Benzene
Benzo(a )an th racene
Benzo(a )py iene
B e n z o ( b ) f l u o r a n t h e n e
B e r u o ( k ) f l u o i a n t h e n e
l ^ - B u t a d i e n e
C a d m i u m
Chlor ine
C h l o r o f o r m
C h r o m i u m (Total)
1.34E+02
1.69E-02
4.94E+04
4.53E+00
7.45E+00
5.68E+02
281E-01
7.85E-01
3.54E-01
2.11 E+Ol
4.84E+00
8.65E+00
3.95E-02
9.97E+00
9.37E+00
3 . 6 9 e + 0 1
6.40E+01
2.30E+00
7.70F.+03
7.70E+00
1.20E-02
6.40E+00
0.011'
0 .011'
0.011»
0.011'
1.02E+00
450E-02
7.7E+00
3.40E+01
1.30E-03
9.30E+01 C o p p e r
17 ER>.t AIRUQL;ID£/OCC7630-10/1?/C5

Total Annual Emissions BAAQMD Trigger Level (Ib/yr) Substance (11^0
770H+04
3-OOE+Ol
2.70E+05
0.011»
5.40E+00
7.70E+00
5.60H-m
1.50E+05
5.30E+00
7.30E-01
7.70E+03
1.20E+05
7.70E+02
1.20E+04
2.70E+04
1.40E+03
2.71E+02
9.78E+02
7.63R00
9.02E-01
4.28E-HJ1
5.97E+01
1.58E+00
1.75E+04
2.81 E+00
8^5E+01
4.93E+01
3.05E+01
1.72E-01
9.38E+02
3.27E+02
1.82E+02
Ethylbenzene Formaldehyde
n -Hexane
IndenoJ l ^S -cdJpy rene
Lead M a n g a n e s e
Mercury
Methano l
N a p h t h a l e n e
Nickel
Phenol
Propylene
Se len ium
To luene
Xylene (Total)
Zinc
a. These substances are PAH derivatives that have OEHHA-developed Potency Equivalency Factors. These PAHs should be evaluated as benzo(a)pyrene equivalents. This evaluation process consists of mult iplying individual PAH-specific emission levels with their Potency Equivalency Factor, which is 0.1. The sum of these products is the benzo(a)pyrene equivalent level and should be compared to the benzo(a)pyrene equivalent trigger level.
Table 4-8 Total Hourly TAC Emissions from the Hydrogen Plant Project
Total Emissions B A A Q M D Trigger Level
(lb/hi) Subs tance
(Ib/hr)
Acrolein
A m m o n i a
Arsenic
Benzene
Chlor ine
Chloroform
5.36E-06
5.64E+00
8.50 E-04
6.48E-02
4.50E-06
1.14E-03
4.21 E-03
1.12E-01
1.80E-04
2.00E-00
9.42E-03
5.63E-03
l.OTE-Ol
3.73E-02
4.20E-04
7.10E+00
4.20E-04
2.90E+00
4.60E-01
3.30E-01
2.20E-01
2.10E-01
4.00E-03
6.20E+01
1.30E-02
1.30E+01
8.2E.01
4.90E+01
Coppe r
Formaldehyde
Mercury
Methano l
Nickel
Phenol
T o l u e n e
Xylene (Total)
18 AIR LIQUIDE/0027630 - 1 C / 1 S / 0 5

5.0 NEW SOURCE REVIEW
Under New Source Review (NSR) of criteria pollutant emissions, this project will be required to apply BACT, provide offsets, and undertake additional analysis toward the prevention of significant deterioration (PSD) of air quality in the region.
5.1 BEST AVAILABLE CONTROL TECHNOLOGY
BAAQMD Rule 2-2-301 requires that an applicant for an ATC or a Permit to Operate (PTO) apply BACT to:
"...any new or modified source which results in an emission from a new source, or an increase in emissions from a modified source, and which has the potential to emit 10.0 pounds or more per highest day of precursor organic compounds (POQ, non-precursor organic compounds (non-POC), nitrogen oxides (NOx), sulfur dioxide (SO2), PM10 or carbon monoxide (CO)."
The emissions from the new SMR furnace are estimated to trigger BACT for all pollutants. Fugitive emissions of POC from new equipment components may trigger BACT for fugitive components.
5.1.1 SMR Furnace
Air Liquide proposes a new 1,100 MMBtu/hr SMR furnace that will be equipped with low- NO* burners and SCR as the selected control technology. The furnace will burn a fuel mixture consisting of PSA offgas and low-sulfur refinery fuel gases and natural gas. Emissions of NO*, SO2, PMio, POC, NH3, and CO are typically specified as a dry volume concentration at 3 percent O2. The NO*, NH3, and CO limits are proposed as 3-hour averages.
The BACT for SO2 will be met by fuel selection. Due to the metallurgy of the air preheat section, the heater is proposed to fire on a mixture of PSA offgas, treated refinery fuel gas and natural gas to achieve a total sulfur content for the fuel of 35 ppmv. The expected limits by pollutant under normal operation are shown in Table 5-1.
Table 5-1 Proposed BACT for the SMR Furnace
Technology P o l l u t a n t B A C T N O , SCR 5 p p m v d @3% 0 2
10 p p m v d @3% Ch
S C A Q M D
CO Good combustion SCAQMD practice
19 AIR L i C U D E / S i r U O -10/18/C5 ERM

Technology Pollutant BACT
SO, 35 ppmv total sulfur in RFG/natural gas fired1
Fuel selection BAAQMD BACT Determination for ULSD project
Use of natural gas and/or Fuel selection and BAAQMD BACT good combustion Guideline 94.3.1 practice
Use of natural gas and/or Fuel selection
POC RFG
BAAQMD BACT Guideline 94.3.1
PM.o RFG
'•The combination of the PSA offgas/refinery gas /natura l gas mixture will result in an ovvrall emission factor of 0 0012 Ib/MMBtu total sulfur in the fuel fired in the SMR fumace under typical conditions.
Startup and shutdown conditions will vary from these limits.
5.1.2 Process Piping Components
For the Hydrogen Plant Project, Air Liquide proposes to comply with the same requirements listed in ConocoPhillips' recent Permit Condition No. 21099 listed in the Refinery's current Major Facility Review Permit. The requirements in Condition No. 21099 (shown below) were previously prescribed as BACT for the Rodeo Refinery's Ultra Low Sulfur Diesel (ULSD) Project, and are equivalent to the BAAQMD BACH and BACT2 guidelines and Regulation 8-18.
C O N D I T I O N 21099 - Conditions for ULSD Project Fugitive Components
1. The owner/operator shall equip all light hydrocarbon control valves installed as part of the ULSD Project with live loaded packing systems and polished stems, or equivalent. [BACT]
2. The owner/operator shall equip all flanges/connectors installed in the light hydrocarbon piping systems as part of the ULSD Project with graphitic-based gaskets unless the service requirements prevent this material. [BACT]
3. The owner/operator shall equip all new hydrocarbon centrifugal compressors installed as part of the ULSD Project with "wet" dual mechanical seals with a heavy liquid barrier fluid, or dual dry gas mechanical seals buffered with inert gas. |BACT]
4. The owner/operator shall equip all new light hydrocarbon centrifugal pumps installed as part of the ULSD Project with a seal-less design or with dual mechanical seals with a heavy liquid barrier fluid, or equivalent. [BACT]
5. The owner/operator shall integrate all new fugitive equipment installed as part of the ULSD Project, in organic service, into the facility fugitive equipment monitoring and repair program. [BACT]
6. The Owner/Operator shall submit a count of installed pumps, compressors, valves, and flanges/connectors every 180 days until completion of the project. For flanges/connectors, the owner/operator shall also provide a count of the number of
20 r f t M AIR L I Q U l D K / W 2 7 r * 0 - 1 ( ) / : f t / n S

graphitic-based and non-graphiHc gaskets used. The owner/operator has been permitted to install fugitive components (5,410 valves, 2,376 flanges, 3,564 connectors, 26 pumps, 14 compressors) with a total POC emission rate of 8.62 tons per year. If there is an increase in the total fugitive component emissions, the plant's cumulative emissions for the project shall be adjusted to reflect the difference between emissions based on predicted versus actual component counts. The owner/opera tor shall provide to the BAAQMD all additional required offsets at an offset ratio of 1.15:1 no later than 14 days after the submittal of the final POC fugitive equipment count. If the actual component count is less than the predicted, at the completion of the project, the total will be adjusted accordingly and all emission offsets applied by the owner/operator in excess of the actual total fugitive emissions will be credited back to owner/operator prior to issuance of the permits. [BACT, Cumulative Increase, Toxic Management]
5.3.3 Hydrogen/Syngas Flare
The flare will be used to control emissions from startup/shutdowns, maintenance, customer constraints, and process upsets. The flare will be elevated, air assisted, and will have a POC and CO destruction efficiency of 98%. Continuous pilots and will be fueled by natural gas. The flare will also have a continuous natural gas purge.
5.1.4 Deaerator Vent
The Deaerator Vent will have emissions of methanol and ammonia, which are byproducts of the shift and reforming reactions. Air Liquide will reduce emissions by using a high temperature shift converter, which produces less methanol than low or medium temperature shift converters. Air Liquide will also install a High Pressure Condensate Stripper that will remove nearly all of the ammonia and methanol and recycle it back to the process. The small fraction that cannot be stripped is vented to the atmosphere through the deaerator vent.
The BAAQMD has no rules specifically addressing methanol from hydrogen plants. However, the South Coast Air Quality Management District has adopted Rule 1189, which limits POC emissions to 0.5 Ibs/MMscfd of hydrogen produced. At the proposed hydrogen plant capacity of 120 MMscfd, that equates to 60 lbs of POC per day. The estimated emissions are less than 50 lbs of POC per day.
5.2 EMISSION OFFSETS
Although the Hydrogen Plant Project proposed by Air Liquide will not emit more than 35 tons per year of either NOx or POC, this project is related to the CFEP and together the projects will trigger the requirement to provide offsets under NSR. Similarly, although the proposed Hydrogen Plant is not a major facility on its own, it will obtain a Major Facility Review operating permit and will be subject to PMio and SO? NSR offset requirements.
21 ERM AIK u Q U i D E / r ^ a r t S C - I O / I S / U S

Offsets are required at a ratio to the amount of project emissions, as described in Regulations 2-2-302 (for POC and NOx) and 2-2-303 (for SO2 and PMio)- BAAQMD regulations do not require offsets for CO emissions. BAAQMD offset requirements are summarized in Table 5-2.
Table 5-2 Emission Offsets
Project E m i s s i o n Increase 1 R e q u i r e d O f f s e t s
Pol lutant O f f s e t R a t i o (ton/yr)
( toqfrr)
N O , 28.1 1.15 32.3
SO2 5.6 5.6 1.0
PM10 17.8 17.8 1.0
P O C 22.9 26.3 1.15
C O 35.4 N o t Required N o t Required
1. Air Liquide agrees to provide ernission reduction credits for all required emission offsets.
5.3 PREVENTION OF SIGNIFICANT DETERIORATION
The ConocoPhillips Rodeo Refinery is a major source under the PSD provisions of 40 CFR 52.21. To determine whether the proposed Hydrogen Plant Project modifications are significant, an accounting of emission increases is compared to PSD significance levels for each criteria pollutant. Because the proposed CFEP is a related project, the emissions from the CFEP sources are included in the analysis. Table 5-3 summarizes these emissions and compares the total for each criteria pollutant to the PSD significance levels. This comparison shows that the significance levels are exceeded for NO*, PM10, and POC emissions. POC emissions will be reviewed under BAAQMD's new source review process for non-attainment pollutants.
Table 5-3 Tot a I Project Emissions For PSD Applicability
POC CO Pollutant (tons/yr) N O , SO2 PM1 0
33.7 23.0 Hydrogen Plant Emission Increases '
Project Emission Increases
CFEP Increased Heater Util ization2
CFEP Increased Tank Util ization2
5.6 17.8 28.1
20.5 6.4 3.8 1.7 4.1
3.7 20.6 4.0 5.2 7.2
1.0
43.8 Total Project PSD Increases 52.5 11.3 27.6 48.6
P S D Applicabil i ty Significance T h r e s h o l d s 40 100 40 15 40
1. These etnissions have been upda t ed based on the information presented in this application f rom those listed in the CFEP permit application.
2. Increased utilization within permit ted limits.
22 ERM A : K L I O U I 3 E / O C 2 7 o 3 « - l O / l S / O S

ConocoPhilbps intends to conduct an emissions netting analysis for PMio that will include emissions that have occurred during the contemporaneous period beginning 5 years prior to proposed construction of the Hydrogen Plant Project. Thus, the contemporaneous period will include projects with emissions increases or decreases that have been implemented between September 2001, and proposed projects through Hydrogen Plant Project startup (anticipated between first to second quarter of 2008). This will allow ConocoPhillips to account for the reduction in emissions that will result from the B-l Boiler shutdown (and other recent emission reductions or increases) toward PSD applicability. This analysis will demonstrate that PMio emission levels will fall below the significance level of 15 tons per year.
Based on current information, it is presumed that NOx emissions will require that a PSD permit be obtained. ConocoPhillips is planning to submit a PSD permit application, including air quality impact and other required analysis for NO, and the results of the netting analysis for PMio, to the US EPA as a supplement to this application.
23 AIR UQUlDfc/WlTTbSO-10/18/05 f.RM

6.0 CALIFORNIA ENVIRONMENTAL QUALITY ACT (CEQA)
CEQA calls for a review of potential significant environmental impacts from proposed projects. This project has been determined to be subject to CEQA by Contra Costa County. An administrative draft EIR will be prepared by Contra Costa County. This draft will include all sources and activities that are the subject of this application. The BAAQMD is a responsible agency under CEQA and will review the document and provide comments, as appropriate to Contra Costa County on the draft EIR.
24 AIR (JQUIDEf0027639 • f O / t S / B EKM

7.0 APPLICABLE PROHJBJTORY KULE REQUIREMENTS
Air Liquide has built and operated several Hydrogen Plants similar to the proposed facility at the Rodeo Refinery. These plants exist as stand-alone hydrogen production facilities and support facilities located nearby to or on the premises of its customer(s). The proposed Hydrogen Plant is an industrial gas supply unit with a separate SIC code (SIC Code 2813) from the Refinery (SIC Code 2911). Although the Hydrogen Plant does not function as a petroleum refinery, it will receive feedstock from the Refinery and will produce a product that will be consumed by the Refinery. It is Air Liquide's opinion that rules and regulations that were developed to regulate petroleum refinery operations should not apply to this facility since it is not a petroleum refinery. However, to the extent that BAAQMD or the USEPA extend refinery regulations to support facilities. Air Liquide will comply with requirements deemed applicable. The following describes rules and regulations that apply more broadly than to just petroleum refineries that will apply to the proposed facility.
7.1 LOCAL BAAQMD REQUIREMENTS
This air permit application is being filed in accordance with the permitting requirements under BAAQMD Regulation 2, Rule 1: Permits, and Regulation 2, Rule 6: Major Facility Review (Title V). This application will undergo New Source Review by BAAQMD as required under Regulation 2, Rule 2. The Refinery and its process units are subject to other BAAQMD prohibitory rules. Those specific to the Hydrogen Plant Project are described below.
7.3.7 Regulation 6 (ParticulateMatter and Visible Emissions)
Regulation 6, which restricts the emissions of particulate matter, applies to all stack emission sources and some specific Refinery processes that emit particulate matter. The specific Regulation 6 rules listed below would apply to the new SMR furnace.
• Regulation 6-301 includes the Ringlemann 1 opacity limit, prohibiting particulate emissions that exceed this limit for more than 3 minutes in any hour;
• Regulation 6-301 limits visible particulate emissions during tube cleaning of combustion equipment;
• Regulation 6-305 prohibits nuisance fallout of visible particles;
• Regulation 6-310 sets an emission rate limit of 0.15 grains per dry standard cubic foot (gr/dscf) of exhaust gas volume;
• Regulation 6-311 restricts particulate emissions based on process weight rate; and
• Regulation 6-401 states that the plant operator must always be able to view the appearance of the emissions from the applicable sources, which in this case is the SMR furnace.
25 AIK L!QU!OE/0027t>0 m / i 5 / C 5 ERM

7.1.2 Regulation 8, Rule 10 (Process Vessel Depressurization)
Regulation 8-10 applies to pressurized vessels at refineries and chemical plants containing hydrocarbon materials. The proposed project will include new vessels (e.g., reactors) that will be subject to Regulation 8-10 at times when the vessels are depressurized and /or opened during shutdowns or maintenance.
7.1.3 Regulation 8, Rule 18 (Equipment Leaks)
Regulation 8-18 limits emissions of organic compounds from leaking equipment at petroleum refineries and chemical plants. This regulation applies to equipment, except for leaks at relief devices vented to control systems and leaks at devices that handle low vapor pressure (initial boiling point greater than 302 0F). The regulation states that equipment shall not be used that leaks total organic compounds in excess of 100 ppm, unless the leak has been discovered by the operator, minimized within 24 hours, and repaired within 7 days. For pumps, compressors, and pressure relief devices, this limit is 500 ppm. New components installed as part of the proposed Hydrogen Plant Project will be incorporated into a leak detection and repair (LDAR) program to comply with these criteria for inspection, repair, and subsequent reporting.
7.2 FEDERAL EPA REQUIREMENTS
7.2.1 New Source Performance Standards (NSPS)
The standards of performance for new stationary sources, as described in 40 CFR Part 60, apply to any pollutant for which there is a standard and for which a facility modification will cause an increase in the emission rate. There are no NSPS standards that apply to hydrogen plants.
7.2.2 Other Federal EPA Requirements
As described in Section 5.3 of this application, this project may be subject to federal PSD review under the provisions of 40 CFR 52.21.
The emissions of hazardous air pollutants (HAP) from this project do not exceed either 10 tons per year of a single HAP compound or 25 tons per year of total combined HAP compounds, so no federal maximum achievable control technology (MACT) standards under 40 CFR Part 63 will apply.
26 ERS! AlR :»QUm /O tC7 tOO - 1 0 / 1 8 / 0 5

5,0 ESTIMATED FEES
The estimated NSR fees for the ATC application are $145,838^601]. The fees include the filing, initial, and permit to operate fees, as shown in Table 8-1.
Table 8-1 Air Liquide Hydrogen Plant NSR Fees
Filing Initial Source Units PTO Fee RSF Total Basis Fee Fee
S-New Hydrogen Plant S272 $1,250 $624 $1,250 $3,396 Schedule F (G-l) 1
S-New SMR Furnace,
$272 $39,457 $19,723 539,729 $99,181 Schedule B 1100 MMBhyhr 1
A-New SCR For SMR Furnace $272 $19,729 $19,865 $39,865 BAAQMD 3-302.3 1
S-New Schedule F (G-l) $272 $1,250 $624 $1,250 53,396 Incinerators Flare Hydrogen Plant Flare1 1
Total $145,838
1. Flare is assumed not to be subject to Regulation 12-11.
In addition. Air Liquide is applying for a Major Facility Review permit under Regulation 2-6 for this facility. The fees associated with the Major Facility Review permit application are shown in Table 8-2.
Table8-2 Air Liquide Hydrogen Plant MFR Title V Fees
Annual Annual Source Emission
Fee
Annual Moni tor ing Total Initial Source Units Filing Fee Basis
Fee Fee3 Fee S-New H2 Plant Furnace, 1100 MMBtn/hr S-New Hydrogen Plant1
S-New
Hydrogen Plant Flare
Total
52,137 $3,855 Schedule P 5918 5298 S288 5214 1
$585 Schedule P S288 $214 583 1
5517 Schedule P $288 $214 515
$4,956
Regulated air pollutants from deaerator vent and fugitives.
Assumes one NO, and one TRS monitor.
The total NSR and MFR application fees for this project will be $150,794.
27 A I R iiyi.nDE/oo27630-ic>/i*/a.s tRM

Figures

o
Vi ' o d z » o
f JWSSIMi
H
i | i§ K*?*S f^&vA m o sTuoy—•
B4AS4 «• & M I w r * . «\ IS v s »
D
R K&3 gfl •P-C--^-'/
o O " 3
. ' .V
? sg
3> [•••V - vv 3»i¥ r^
i isag^Mt^^H "amteimM
m kC* m
'™P&rTYBOVNl>M,r
m •n i 9 ^ R
\. # ' \
Kil >-fe >:
m m 1M
m aa
S-»':;T?/aC
SS5? ^ K A > >
%W0wye^ Mmm§^ Sm^^a mmmvm
-. •':.
t-~-. ikT
x ,0 sgty
t Mto
Figure 1 S/te Location Map
ConocoPhiiHps Refinery Rodeo, California
ERM 05/05

, D'ow Dy J Estrada
Ootc 'Pro ec' No 0 5 ^ ^ ^ 0 ^ 0 0 3 0 0 0
CAU G: \ \ 0 0 3 0 0 3 0 0 0 - 0 4 . DWG
' I"'-
•%
' •I: • I C " . , g l ' f t
' ' *
V 9,9* '• \
i ? -r I » I M
. , £ ? ! •••
•w f.;.
•TrV •
<" k , ( •'» '• fey;?;-i r •••••• ? .
/ . - i f t -
»> » • •.
to ^ G»
• i « U» H ® » « > « * W / S & s U 41
iii* - • . « ' r i •f/r . w -r- A •• IV / -'A
(• : \
- .A\, .r-
lr • \ \
^r> > •%, « r S «•' * ' 1 - • ^ \
t » < © ' ! •,
\ v \ " \ 0) \ 4 • » > ^ 1 'l " ^
/ i •? AS. ' . r c s s a •A \\ • i \ %»
• 4 * k S * J lyt W
M
i W \ M \
\ 1 - v ;
*•
•\J| p / v ^ \ ><:*
\ . \ W / ;
J .*• ;
* ,•. EWE . ' j . v .
Figure 2 Project Site Pian
ConocoPfii/iips Refinery Rodeo, California
Source: ConocoPhil i ips ERM 04/05

|cic er [Sin J EitJccSc ' * " )0 19 /05 0030030 00 ' ^ 0030030 DO 003003000-04 d>:
i t r o B ® > a
• 4- ' : v ' i
^ \ » • » *
•' r*- ' i
I y!
/
i\ \ I %) €1
CI ^ i) ^ 0 §&
%)@> © O ft) *)
i CI I I e® • *
1 J;.tr! m ~ l , ' r ... i'.%- •»
h . •-"" . * • • v — - .
• * .'"i ; - v x ", " t " 1 '
« r !
J5.- I <8* " j
i ."*5 ' • ' '; < I
•Vi £J - , •' -•> at - s - . ^ T 'w *' f - %
-"• V . : ^ .•• .. •., *
. -t-V- ? * X • sv
w^?
I i-s
* e) «*1 i . » \ ^ ^ Hi
I .*•93,*
si K ® o \\ v
\\ m ^ s t »>
\ • w \ O -. \ ^ l » \ ' r«» \ »y\ > %) •. \ ; * >
.. o> ,V.' ' v
i \ ^ N vS^N & \ V
V-y ^
x*. \ N
\ J ! <.
. . .J /
. v • •*?• . ^ *
/
qjop SOT iaoD f - 50a
S o u r c e C o n o c o P h t f l p s (August 2002 Aariaf)
Figure 3 Locations of Site Modifications
ConocoPhWips Refinery Rodeo, California
£KM ! C * £

D a t e :
J. Estrodo 1 0 / 1 8 / 0 5 0 0 3 0 0 3 0 . 0 0 D r a w n 9 y ; '•VOJCCt INJO. CAO F i l e :
G:\ \003003000-05 .DWG
z1 k Steam Boiler Feed Water
Reforming Furnace Shift Feed
Treating — Hydrogen PSA Hydrocarbon Feed Converter
Steam
PSA Off Gas Refinery Fuel Gas
Figure 4 Proposed Hydrogen Plant Process Flow Diagram
ConocoPhi/iips Refin&ry Rodeo, California
EKM fOOS

Appendix A BAAQMD ATC Forms

B A Y A R E A
AinQuAirrY FORM P-101B
939 Ellis S t r e e t . . . San Francisco, CA 94109 AUTHORITY TO CONSTRUCT/ ( 4 1 5 ) 7 4 9 - 4 9 9 0 . . . FAX ( 4 1 5 ) 7 4 9 - 5 0 3 0
www.baaqmd.gov PERMIT TO OPERATE M A N A G E M E N T
D I S T R I C T
Application Information
Plant No. 325120 (leave blank if unknown)
NAICS
Business Name Air Liquide Large Industries U.S. LP
Equipment Description Hydrogen Plant Project If you qualify for the District's Accelerated Permitting Program, (see reverse for criteria), check here • If you are applying to permit portable equipment, in accordance with Regulation 2-1-220, check here •
New Plant Information If you have not previously been assigned a Plant Number by the District or if you want to update any Plant data that you have previously supplied to the District, please complete the New Plant Information box below.
Plant Address (equipment location) 1380 San Pablo Avenue
Zip 94572 City Rodeo State CA
Mailing Address 2700 Post Oak Boulevard, Suite 1800
Zip 77056 City Houston State TX
Plant Contact Tobey Taylor
Title Project Environmental Specialist
'elephone 713-624-8288 Fax 713-803-7448
| E-mail Address [email protected]
Application Contact Information {if different from plant contact) All correspondence regarding this application will be sent to the plant contact person unless you wish to designate a different contact for this application. If you are changing the plant contact person, complete the "New Plant Information" Section.
Application Contact
Title/Company
Mailing Address
Zip State City
Fax Telephone
E-mail Address
Small B u s i n e s s Certification You are entitled to a reduced permit fee if you qualify as a small business as defined by BAAQMD Regulation 3. In order to qualify, you must certify that your business meets all of the following criteria:
Q The business does not employ more than 10 persons and its gross annual income does not exceed $600,000. • The business is not an affiliate of a non-small business. (Note: a non-small business employs more than 10 persons
and/or its gross income exceeds $600,000.)
Signature: Date:
7/1S/0S

J Acceterated Permitting Program
•3 The Acceterated Permitting Program entities you to Install and operate qualifying sources of air pollution and abatement equipment without waiting for the District to Issue a Permit to Operate. In order to participate in this program you must certify that your project will meet alj of the following criteria. Please acknowledge each Rem by checking each box and signing bekiw. .1
• Uncontrofled emissions of any single poiutant are each less than 10 fttfiigfcest day. or the equipment has been precertified by the BAAQMD.
0 Emissions of toxic compounds do not exceed the trigger levels identified in Table 2-5-1 (see Regulation 2. Rule 5). • The project Is not subject to public notice requirements (source is either more than 1000 ft from the nearest school. o£
source does not emit any toxic compound in Table 2-5-1). 0 For reptecament of abatement equipment, the new equipment must have an equal or greater overaH abatement
efficiency for al pollutants than the eqiipment being replaced. • For alterations of existing sources, for aS poButants the alteration does not result in an increase in emissions. • Payment of appfcable fees (the minimum permR fee to install and operate each source). See Regulation 3 or contact
the Engineering Division for help in detemiining your fees.
1
Date: Signature: All AppUcations
Ail applications should contain the fottowi ng additional information: SI Completed data fonn(s) for each piece of equipment (data forms listed below} EI A facility map. drawn roughly to scale, that locales the equipment and its emission points {also see HRSA form) E3 Project/equipment description, manufacturer's data H Pollutant flow tfagiam El Discussion/calculations relating to emissions from the equipment • If a new Plant a local stree* map showing the location of your business
I hereby certify that the sources in this permit application: (check one) O Are 0 Are njrt within 1.000 feet of the outer boundary of the nearest school
Has an Environmental impact Report (EIR) or other Cafifomia Environmental Quality Act (CEQA) document been prepared for this project? • no £3 yes If yes. by whom? Contra Costa County Community Develooment Deoartment IMPORT AWT: Under (he California Public Records Act, all information in your permit application wig be conskJered a matter of public record and may be disclosed to a third party. If you wish to keep certain items separate as spedfled in Regutabon 2. Rule 1, Section 202.7, please complete the foRowing steps
(a) Make a copy of your permit appfication with the confidential information blanked out Label this copy "Public Copy". (b) Label the original copy "Confidential.* Carde all confidential items on each page. Label each page with confidential
information "Confidential*. (c) Pnepare a written justification for the confidentiality of each confidential item. Append this to the confidential copy.
Date: Signature: Mai the completed application tcr Bay Ares Air Quality Management District
939 Ellis Street San Frandsco. CA 94109 Attention. Engineering Division
"| The appropriate data formfs) should be completed for alt equipment requiring a Permit to Operate. The data forms are listed J below. If you are uncertain which data t'orm to use, need additional data forms, or require assistance completing a form,
please cafl the Engincrcting Division at (415) 749-4990. Forms are also available on the District's website at www.baaqmd.QOv/Dennit/forms.htm
Form A Form D Form G Form S Form T Form ICE
Combustion Equipment Semiconductor Fabrication Solvent Cleaning Operation Form S supplement for printers Emission Point
Form C Form F Form SC Form SS Form P
Abatement Device Dry cleaner Other Miscellaneous Surface Coaling Organic Liquid Loading/Storage Internal Combustion Engines
J
M M J 5

mm
DATA FORM G General Air Pofiution Sourc*
CJ ]*• f BAY AREA AIR QUALITY MANAGEMENT DISTRICT 839 Ellis Street - . San Francteco, CA94109... (415) 749-4990 FAX (415 74B-5030
Form G is for general air poftitJon sources. Use specific forms when applicable. If this source bums fuel, then also complete Fomi C.
sv
1. Business Name: Air Uqutde Large Industries U.S. IP
2. SIC No.: 2813
3. Name or Description: Hydrogen Manufacturing Unit
Plant No: (f unknown, tesvw btenk)
Date of Initial Operation
J Source No.: S-New
4. Make, Model, and Rated Capacity of Equipment 120 MMSCF/day Hydrogen Rant
^ 5 Process Code1 SO?6
6. Total throughput, last 12 mos. usage units2
1 7. Typical % of total throughput: Dec-Feb25 %
8. Typical operating times: 24 hrs/day
9. For batch or cycfic processes: NA
Material Code2 759 Usage Unit2 MMSCF
Maximum operating rate:5 usage units2 Ihr
Jur>-Auq25 % Seo-Nov25 %
62 weeks/year
minutes between cydes
Mar-Mav25 % 7 days/week
minutes/cyde a
10. Exhaust gases from source: Wet gas flowrate NA (at msxtmum ap&ration)
"F cfm at volume% Approximate water vapor content
* EMISSION FACTORS (at maxtmum operating rafej If this form is being submitted as part of an application for an authority to construct, completion of the following table is mandatory. If not, and the Source is already in operation, completion of the table is requested but not required.
If this source also bums fuel, do not indude those combustion products in the emission factors below; they are accounted for on Form C. If source test or other data are available for composite emissions only, estimate from those data the emissions attributable to just the general process and show bekw.
• Check box if factors to emissions after Abatement Device(s). i
Emission Factors ttAJsage Unit2 Basis Code 3 ut
NA 11. Particulate 12. Organics See Fugitive Errvsaons
Esfimates ' ^
13. Nitrogen Oxides (as NOj).. 14. Sullur Dioxide
15. Carbon Monoxide 16. Other
17. Other
NA
NA NA
] 18. With regard to air pollutant flow from this source, what sources(s), abatement device{s) and/or emission pofnt(s) are
Immediately downstream?
S- New J A-P" p ^
t -Se» Table GS or the Material Codes Tabl« {available upon request) S«® Tables G-1 through G-7 for code 'Se® Basis Code Table below
Date: io(z%(oS^ Person completing this form: Tobey Taylor P.ivwwjbrnistftvmG.doc - a/99

BAY AREA AIR QUALITY MANAGEMENT DISTRICT 939 Ellis S t ree t . . . San Francisco, CA 94109... (415) 749-4990 . . . f a x (415) 749-5030
Data Form C FUEL COMBUSTION SOURCE Website: www.baaqmd.gov
(for District use only)
New X Modified • Retro •
Form C is for all operations which burn fuel except for internal combustion engines (use Form ICE unless it is a gas turbine; for gas turbines use this form). If the operation also involves evaporation of any organic solvent, complete Form S and attach to this form. If the operation involves a process which generates any other air pollutants, complete Form G and attach to this form.
C] Check box if this source has a secondary function as an abatement device for some other source(s); complete lines 1, 2, and 7-13 on Form A (using the source number below for the Abatement Device No.) and attach to this form.
(If unknown, leave blank)
1. Company Name: Air Liquide Large Industries U.S. LP Plant No: Source No. New 2. Equipment Name & Number, or Description: Steam Methane Reforming Furnace
Maximum firing rate: 1300* 1(^6 (hourly) Btu/hr 1100' 10*6 (annual) Btu/hr
3. Make, Model:
4. Date of modification or initial operation: (if unknown, leave blank)
5. Primary use (check one): • electrical generation • space heat • waste disposal • abatement device Q cogeneration Q resource recovery E3 process heat; material heated Hydrogen Plant Feed
0 testing • other
6. SIC Number 2813 tf unknown leave blank
7. Equipment type (check one) Internal combustion
Use Form ICE (Internal Combustion Engine} unless it is a gas turbine
• gas turbine • other hp • salvage operation D liquid waste
• pathological waste • other
Incinerator Temperature Residence time
"F Sec
• boiler O dryer Others • afterburner D flare • open burning • other
Q oven Ex] furnace • kiln
Material dried, baked, or heated: Hydrogen Plant Feed I
• yes • no • yes • no • yes • no ^ yes • no
8. Overfire air? 9. Flue gas recirculation?
10. Air preheat? 11. Low NOx burners? 12. Maximum flame temperature
If yes, what percent If yes. what percsnt Temperature
Make, Model Callidus_
% %
0F
"F
13. Combustion products: Wet gas flowrate 385.000.acfm at 300_°F Typical Oxygen Content dry volume % or wet volume % or
14. Typical Use 24 hours/day
15. Typical % of annual total: Dec-Feb 25%
% excess air
7 52 weeks/year
Jun-Aug 25%
days/week
Mar-May 25% Sep-Nov 25%
16. With regard to air pollutant flow, what source{s) or abatement device(s) are immediately UPSTREAM? S New S S S s s A A A
With regard to air pollutant flow, what source(s) or abatement device(s), and/or emission points are immediately DOWNSTREAM?
I S S A New A P P

BAY AREA AIR QUALITY MANAGEMENT DISTRICT 939 Ellis Street... San Francisco. CA 94109. . . (415) 749-4090 . . . /ax (415) 749-5030 Wobsih: mN.baa(jmd.QOv
Data Form C FUEL COMBUSTION SOURCE »
(for District use ontv)
J New • Modified • Retro O
Form C is for ail operations which bum fuel except for internal combustion engines (use Form ICE unless it is a gas turbine; for gas turbines use this form). If the opera tier also involves evaporation of any organic solvent, complete Form S and attach to this form, if the operation involves a process which generates any other air poHutants. complete Fonn G and attach to this form.
d Check box if (his source has a secondary function as an abatement device for some other source(s); complete Snes 1.2, and 7-13 on Form A (using the source number below for the Abatement Device No.) and attach to this form.
(It unknewn, laava blank) Source No. New 1. Company Name: Air Liquide Large Industries U.S. LP Plant No:
2. Equipment Name & Number, or Description: Hydrogen Plant Flare
3. Make, Model: Maximum firing rate: Btu/hr 4. Date of modification or initial operation: (if unknown, leave blank)
5. Primary use (check one): • electrical generation • Q abatement device ( J U process heat material heated
B space heat cogene ration
waste disposal resource recovery
testing other
6. SIC Number 2813 II unfawnwi laave bfanfc
7. Equipment type (check one) Internal combustion
Use Foim ICE (Internal Combustion Engine) unless it is a gas turbine
• gas turbine • other .hp
Incinerator • salvage operation • liquid waste
• pathotogica! waste Temperature 0F • other Residence time Sec
• boiler • afterburner 13 flare • open burning • other
Others Q dryer O oven • furnace Material dried, baked, or heated: Q lain
8. Overfire air? 9. Flue gas redrculabon?
10. Air preheat?
• yes • no Dyes • no • yes • no
11. Low NOx burners? Q yes • no 12. Maximum flame temperature
If yes, what percent If yes, what percent Temperature
Make, Model
% %
CF
•F
13. Combustion products: Wet gas fiowrate 188.307 acfm at 1830 CF Typical Oxygen Content
14. Typical Use 24 hours/day
15. Typical % of annual total: Dec-Feb 25%
16. With regard to air poltutant flow, what source(s) or abatement device(s) are immediately UPSTREAM?
dry volume % or wet volume % or % excess air
1 52 weeks/year
Jun-Aug 25% days/week
Mar-May 25%
7
Sep-Nov 25%
1 S s s s A S S A A
With regard to air pollutant flow, what source{s) or abatement devico(s). and/or emission points are immediately DOWNSTREAM? I S s A A P P
1 Person completing ttii I is form: Tobey Taylor Date:
I

F U E L S
INSTRUCTIONS: Complete one line in Section A for each fuel. Section B is OPTIONAL. Please use the units at the bottom of each table. N/A means "Not Applicable." "SECTION A : FUEL DATA
Maximum | Possible Fuel Use
Nitrogen Content
(optional) Total Annual Typical Heat
Content Sulfur
Content Ash Content
(optional) Fuel Name Fuel Code" Usage"* Rate
Natural Gas Pilots 48.550 0.56E6 NA NA
5.
Natural Gas therm* Btu/hr N/A N/A Use the appropriate units for each fuel
N/A N/A Other Gas MSCF" MSCF/hr Btu/MSCF N/A N/A PPm Liquid m gal* wt% wt% m gal/hr Btu/m gal wt% Solid wt% ton/hr Btu/ton wt% w l% ton
S E C T I O N B : EMISSION FACTORS (opt iona l )
Part icu lates NOx CO Emission
Factor Fuel Name Fuel Code" "Basis Emission
Factor Emission "Basis
Code "Basis Code Code Factor
Use the appropriate units for each fuel: Natural Gas = lb/therm' Other Gas = Ib/MSCF'
= Ib/m gal' = lb/ton
Liquid Solid
Note: * M S C F - t h o u s a n d s t a n d a r d cub i c feet * m ga l = t housand ga l lons * t h e r m = 100,000 B T U
** S e e tab les be low for Fue l a n d Bas is C o d e s * "* To ta l annua l usage is: - P ro jec ted u s a g e over nex t 12 m o n t h s if e q u i p m e n t is new or modi f ied .
- Ac tua l u s a g e fo r last 12 mon ths if e q u i p m e n t is ex is t ing and unchanged .
* * Basis Codes * * F u e l Codes
Code Method Code Code Fuel Fuel
Not applicable for this pollutant Source testing or other mcasuremenl by plan! (attach copy) Source testing or other measurement by BAAQMD (give date) Specifications from vendor (attach copy) Material balance by plant using engineering expertise and knowledge of process Material balancc by BAAQMD Taken from AP-42 (compilation of Air I'ollutanl Emission Factors, EPA) Taken from literature, other than AP-42 (attach copy) Guess
Natural Gas Anthracite coal Bagasse Bark Bituminous coal Brown coal Bunker C fuel oil Coke Crude oil Diesel oil Digester gas Distillate oil Fuel oil #2 Gasoline Jet file)
189 0 25 Process gas - blast furnace 234 I 33
35 235 Process gas - CO 2 3 236 Process gas - cokc oven gas
Process gas - RMG Process gas - other Residual oil
43 238 4 47 237 242
80 242 5 Refuse derived fuel Landfill gas Solid propellant Solid waste Wood - hogged Wood - other Other - gaseous fuels Other - liquid fuels Other • solid fuels
89 495 6 511 98
493 256 7 466 8 315 304 392
551 305 158 198 160 LPG 200
Lignite Liquid waste Municipal solid waste
165 203 167 494
(revised: 6/01)

F U E L S
INSTRUCTIONS: Complete one line in Section A for each fuel. Section B is OPTIONAL. Please use the units at the bottom of each table. MIA means "Not Applicable." S E C T I O N A : FUEL DATA
Maximum Possible Fuel Use
Rate
Nitrogen Content
(optional) Total Annual
Usage"' Typical Heat
Content Sulfur
Content Ash Content
(optional) Fuel Name Fuel Code"'
PSA 28 5*10*6 3250 0 235 " 10*6 N/A RFG 7 0 * 10*6 770 1.3 ' 10*6 35 NG 8.6 * 10*6 980 1 02 * 10*6 N/A
5.
Natural Gas Use the appropriate units for each fuel
therm* Btu/hr N/A N/A N/A N/A MSCF* Other Gas MSCF/hr Btu/MSCF N/A N/A em
Liquid m gal ' m qal/hr Btu/m gal wt% wt% wt% Solid ton/hr wt% wt% wt% Btu/ton ton
S E C T I O N B : EMISSION FACTORS (opt ional )
Part iculates NOx CO "Basis Emission
Factor Emission
Factor "Basis Code
Emission Factor
"Basis Fuel Name Fuel Code" Code Code
Use the appropriate units for each fuel: Natural Gas - IbAherm'
Other Gas = Ib/MSCF' Liquid Solid
= Ib/mgal" = IbAon
Note: ' M S C F = t h o u s a n d s tandard cub i c feet * m ga l = t h o u s a n d ga l lons * t h e r m = 100 ,000 BTU
S e e tab les b e l o w for Fuel a n d Bas is C o d e s To ta l annua l u s a g e is: - P ro jec ted u s a g e ove r nex t 12 m o n t h s if e q u i p m e n t is n e w or mod i f ied .
- Ac tua l u s a g e for last 12 months if e q u i p m e n t is ex is t ing a n d u n c h a n g e d .
* * Basis Codes * * F u d C o d e s Method Code Fuel Fuel Code Code
Not applicable for this pollutant Source testing or other measurement by plant (attach copy) Source testing or other measurement by BAAQMD (give date) Specifications from vendor (attach copy) Material balance by plant using engineering expertise and
Natural Gas 0 189 Anthracite coal 25 1 Process gas - blast furnace 234 Bagasse 33 2 Process gas - CO-235 Bark 35 3 Process gas - coke oven gas
Process gas - RMG Process gas - other
236 Bituminous coal Brown coal
43 4 238 47
knowledge of process 237 Bunker C fijel oil 242 Material balance by BAAQMD 5 Residual oil 242 80 Coke
Crude oil Diesel oil Digester gas Distillate oil
Taken from AP-42 (compilation of Air Pollutant Emission Refuse derived fuel 6 495 89 Factors, EPA) Taken from literalurc, other than AP-42 (attach copy)
Landfill gas 511 98 7 Solid propellam
Solid waste 256 493
Guess 8 466 315 Wood - hogged Wood - other
304 Fuel o i l « 392 305 Gasoline
Jet fuel 551
Other - gaseous fuels Other - liquid fuels
198 158 200 LPG 160
Other - solid fuels 203 165 Lignite Liquid waste Municipal solid waste
167 494
(revised: 6/01)

J Data Form A
ABATEMENT DEVICE 1 B A Y A R E A A I R Q U A L I T Y M A N A G E M E N T D I S T R I C T
939 Ellis S l ree t . . . San Francisco. CA S4109. . . (415) 749-4990 . . . FAX (415) 749-5030
for office use only
J Abatement Device: Equipment/process whose primary purpose is to reduce the quantity of poO utant(s) emitted to the atmosphere.
j j 1. Business Name: Air UqukJe Large Industries U.S. LP Plant No: (tf unknown, toava Mark}
1 2. Name or Description Selective Catalytic Reduction Unit for SMR Furnace Abatement Device No: A- New
3. Make, Model, and Rated Capacity
4. Abatement Device Code (See table*) 66 Date of Initial Operation
5. With regard to air pcflutant flow into this abatement device, what sources(s) and/or abatement devices) are Immediate fy upstream? ]
S-S- New S- s-s-] A-
6. Typical gas stream temperature at inlet
tf this form is being submitted as part of an application for an Authority to Construct, completion of the following table Is mandatory. If not, and the Abatement Device is already in operation, completion of the table Is requested but not required.
"F ] 1 Basis Codes
(See Table") Weight Percent Reduction
(at typical operation) Pollutant
Paniculate Organics
Nitrogen Oxides (as NO2) 5 ppmvd @ 3% 02 3 sm j 10. Sulfur Dioxide
11. Czbon Monoxide
1 12. Other 13. Other
* | 14- O Check box if this Abatement Device bums fuel; complete lines 1,2 and 15-36 on Form C (using the Abatement •1 Device No. above lor the Source No.) and attach to this form.
15. With regard to air pollutant flow from this abatement device, what sources(s), abatement <Jevice(s) and/or emission point(s) are immediatoty downstream? ]
P - New
Person completing this form: Tobey Taylor ^ P wwwV=orm^ irovtsed. 7/39;
Date lo{z2/o<
]

•ABATEMENT DEVICE CODES
Code DEVICE Code DEVICE ADSORBER (See Vapor Recovery) AFTERBURNER
CO Boiler Catalytic Direct Flame Flare
NOx CONTROL Selective Catalytic Reduction (SCR) Non-Selective Catalytic Reduction (NSCR) Selective Non-Catalytic Reduction (SNCR)
SCRUBBER Baffle and Secondary Flow Centrifugal Cyclone, Irrigated Fibrous Packed Impingement Plate Impingement and Entrainment Mechanically Aided Moving Bed Packed Bed Preformed Spray Venturi Other
SETTLING CHAMBER (See Dry Inertial Collector) SULFUR DIOXIDE CONTROL
Absorption and Regeneration, for Sulfur Plant Claus Solution Reaction, for Sulfur Plant Dual Absorption, for H2S04 Plant Flue Gas Desulfurization, for Fossil Fuel Combustion Reduction and Solution Regeneration, for Sulfur Plant Reduction and Stretford Process, for Sulfur Plant Sodium Sulfite-Bisulfite Scrubber, for H2S04 Plant Other
VAPOR RECOVERY Adsorption, Activated Carbon/Charcoal Adsorption, Silica Adsorption, Other Balance Compression/Condensation/Absorption Compression/Refrigeration Condenser, Water-Cooled Condenser, Other Other
MISCELLANEOUS Not classified above
66 1 67 2 73 3 4 36 5 Fumace-firebox 37 6 Other 38
BAGHOUSE (See Dry Filter) CYCLONE (See Dry Inertial Collector and
Scrubber) DUST CONTROL
Water Spray DRY FILTER
Absolute Baghouse, Pulse Jet Baghouse, Reverse Air Baghouse, Reverse Jet Baghouse, Shaking Baghouse, Simple Baghouse, Other Envelope Moving Belt Other
DRY INERTIAL COLLECTOR Cyclone, Dynamic Cyclone, Multiple (12 inches dia. or more) Cyclone, Multiple (less than 12 inches
dia.) Cyclone, Simple Settling Chamber, Baffled/Louvered Settling Chamber, Simple Other
ELECTROSTATIC PRECIPITATOR Single Stage Single Stage, Wet Two Stage Two Stage, Wet Other
INCINERATOR (See Afterburner) INTERNAL COMBUSTION ENGINE CONTROL
Catalyzed Diesel Particulate Filter Non-Cat. Diesel Part. Filter w/ Active Regeneration Diesel Oxidation Catalyst Oxidation Catalyst
INCINERATOR (See Afterburner) KNOCK-OUT POT (See Liquid Separator) LIQUID SEPARATOR
Knock-out Pot Mist Eliminator, Horizontal Pad, Dry Mist Eliminator, Panel, Dry Mist Eliminator, Spray/Irrigated Mist Eliminator, Vertical Tube, Dry Mist Eliminator, Other Other
MlST ELIMINATOR (See Liquid Separator)
39 40 4 1 42
68 4 3 4 4
45 7 46 8 4 7 9
10 11 12 48 1 3 49 14 50 15 51 16
52 17 18 53 19
54 20 21 55 22 23 56
57 24 58 25 59 26 60 27 61 28 62
63 64
69 65 70
71 " B A S I S CODES 72 Method Code
0 Not applicable for this pollutant Source testing or other measurement by plant Source testing or other measurement by BAAQMD Specifications from vendor Material balance by plant using engineering expertise and knowledge of process Material balance by BAAQMD using engineering expertise and knowledge of process Taken from AP-42 ("Compilation of Air Pollutant Emission Factors," EPA) Taken from literature, other than AP-42 Guess
1 2
29 30 3 31 4 3 2
5 33 34
6 35
7 8 (revised: 9/05)
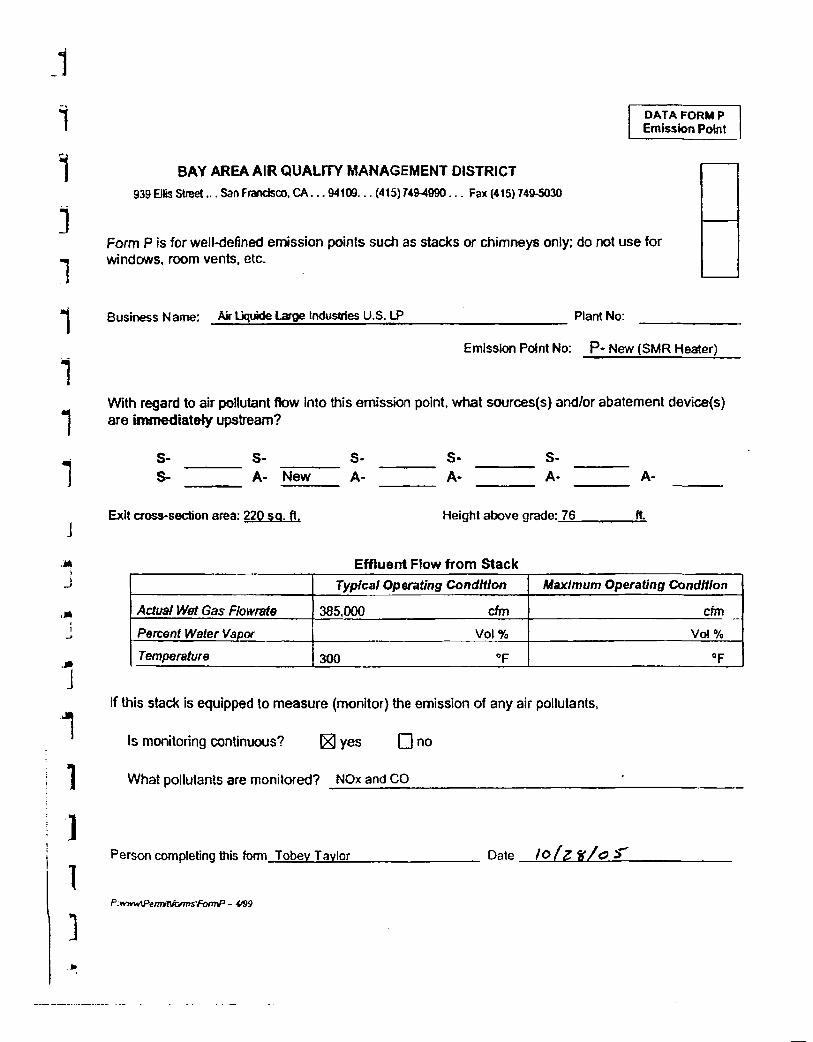
DATA FORM P Emission Point
"1 BAY AREA AIR QUALITY MANAGEMENT DISTRICT
939 Eilis Street... San Frandsco. CA... 94109... (415)749-4890... Fax (415)740-5030
Form P is for well-defined emission points such as stacks or chimneys only; do not use for windows, room vents, etc.
1 Business Name: Air Liquide Large Industries U.S. LP Plant No:
Emission Point No: P - New (SMR Heater)
1 With regard to air pollutant flow Into this emission point, what sources(s) and/or abatement dev ices) are immediately upstream? 1
s-A- New S-
Exit cross-section area: 220 so. ft. ft. Height above grade: 76 J
Effluent Flow from Stack J Typical Operating Condition Maximum Operating Condition
Actual Wert Gas Flowrate dm cfm 385,000
Percent Water Vapor Vol% Vol %
Temperature 0F "F 300 »
J If this stack is equipped to measure (monitor) the emission of any air pollutants,
Is monitoring continuous? ^ yes Q no
1 What pollutants are monitored? NOx and CO
] Date iofz'X/oS' Person completing this form Tobev Taylor
1 P.mvuAPemiinKjfms'fomP - 4/90
]

J
1 DATA FORM P Emission Point
1 BAY AREA AIR QUALITY MANAGEMENT DISTRICT 039 Ellis Street... San Francisco. C A . . . 94109... (415) 749-4990... Fax (415) 749-5030
Form P is for well-defined emission points such as stacks or chimneys only; do not use for windows, room vents, etc.
1 Business Name: Air Uquide L a y Industries U.S. LP Plant No:
Emission Point No: P-New (Flare)
With regard to air pollutant flow into this emission point, what sources(s) and/or abatement device(s) " J are Immediately upstream?
S- New S-
1 A-S-
Height above grade: 140 ft. so. ft. Exit cross-section area: 28
Effluent Flow from Stack Maximum Operating Condition Typical Operating Condition
cfm Actual Wet Gas Ftowrate 188.307 cfm
Vol % Vol % Percent Water Vapor
Temperature 0F 1,830 0F
] !f this stack is equipped to measure (monitor) the emission of any air pollutants,
Is monitoring continuous? • yes 0 no
What pollutants are monitored?
] le>(zHJo< Person completing this fnrm Tobev Tavlor Date
PxtvmVQnTiNocmsfQmP - 4^99
J

I F o r m RSA |
B A Y AREA AIR Q U A L I T Y MANAGEMENT DISTRICT 9 3 9 Ellis Street . . . San Francisco, C A 9 4 1 0 9 . . . ( 4 1 5 ) 7 4 9 - 4 9 9 0 . . . FAX ( 4 1 5 ) 7 4 9 - 5 0 3 0
WEBSITE: VWVW.BAAQMD.GOV
REQUEST FOR INFORMATION Risk Screening Analysis
NOTE: You must fill out this form for each source in the permit application that requires a risk screening, unless all sources exhaust through a single stack. These may be discrete sources such as stacks or area sources such as surface area fugitive emissions.
Plant Name Air Liouide Large Industries U.S. LP
Source Description SMR Furnace for H2 Plant
Source No.New Emission Point New (if known) (if known)
SECTION A 1. Is the source a clearly defined emission point; i.e., a stack or ventilation duct? ^ yes Q no
(If NO, go on to Section B)
2. Does the stack stand alone or is it located on the roof of a building? ^ alone Q on roof
3. What is the stack height? 76 feet meters or feet?
(Note: stack height only, whether freestanding or on rooftop)
4. What is the combined stack height and building height (if applicable)?. meters or feet
5. What is the stack diameter? 16.75 feet meters or feel
cfm or m^/sec 6. What is the stack gas flowrate? 385.000 cfm
7. What is the stack gas exit temperature? 300 F degrees (Fahrenheit or centigrade)
8. If the stack is located on a rooftop, what are the dimensions of the building?
meters or feet
meters or feet
meters or feet
height =
width =
length =
9. Are there any buildings, walls or other structures located near this source? d y e s ( 3 no If YES, what are their dimensions?
height =
width =
length =
distance from source
meters or feet
meters or feet
meters or feet
meters or feet
(Go on to Section C)

SECTION B
1. is \he source located within a building? [ j y e s D n o (If NO, please provide a description of the source. For example, fugitive emissions that must be evaluated a s an area source. If an area source, provide the dimensions of the area in question. Then go on to Section C. If YES, proceed to #2, below)
2. Does the building have a ventilation sys tem that is vented to the outs ide? Q yes • no
a. If NO, are the building's doors and windows kept open during hours of operation? 0 yes 0 no
3. P lease provide the building dimensions:
height =
width =
length =
meters or feet
meters or feet
meters or feet
4. Are there any buildings, walls, or other structures located near this source? • yes 0 no
If YES, what are their dimensions?
height =
width =
length =
distance from source
meters or feet
meters or feet
meters or feet
meters or feet
(Go on to Section C)
SECTION C
1. Indicate the area where the source is located (check one):
( 3 zoned for commercial use 0 zoned for residential use 0 zoned for mixed commercial and residential use
2. Distance from source (stack or building to property line = 100 feet meters or feet
3. Distance from source to nearest receptor** = 2.500 feet meters or feet
IMPORTANT: You must provide a plot plan or a map. drawn to scale, which clearly demonstrates the location of your site, the property lines and any surrounding residences and/or bus inesses . The plot plan or map should a lso show the location of the source(s) at the site and their relationship to the property line.
"Receptors are defined as individual dwellings where persons are assumed to be in continuous residence. Please note that this does not refer to places of business.
H:pub_data/forfTi$/riskscr2 (9/99)
2

1 Form RSA BAY AREA AIR QUALITY MANAGEMENT DISTRICT
939 Ellis S t r e e t . . . San Francisco, CA 9 4 1 0 9 . . . ( 4 1 5 ) 7 4 9 - 4 9 9 0 . . . FAX (415) 749-5030 WEBSITE: WWW.BAAQMD.GOV
REQUEST FOR INFORMATION Risk Screening Analysis
NOTE: You must fill out this form for each source in the permit application that requires a risk screening, unless all sources exhaust through a single stack. These may be discrete sources such as stacks or area sources such as surface area fugitive emissions.
Plant Name Air Liouide Laroe Industries U.S. LP
Source Description Hydrogen Plant Fugitives
Source No.New Emission Point (if known) (if known)
SECTION A 1. Is the source a clearly defined emission point; i.e., a stack or ventilation duct? Q yes E ] no
(If NO, go on to Section B)
2. Does the stack stand alone or is it located on the roof of a building? Q alone Q on roof
meters or feet? 3. What is the stack height?
(Note: stack height only, whether freestanding or on rooftop)
meters or feet 4. What is the combined stack height and building height (if applicable)?.
meters or feet 5. What is the stack diameter?
cfm or m^/sec 6. What is the stack gas flowrate?
degrees (Fahrenheit or centigrade) 7. What is the stack gas exit temperature?
8. If the stack is located on a rooftop, what are the dimensions of the building?
height =
width =
length =
9. Are there any buildings, walls or other structures located near this source? Q yes • no If YES, what are their dimensions?
height =
meters or feet
meters or feet
meters or feet
meters or feet
meters or feet
meters or feet
width =
length =
distance from source meters or feet
(Go on to Section C)

SECTION B
1. Is the source located within a building? Q yes ^ no
(If NO, please provide a description of the source. For example, fugitive emissions that must be evaluated a s an area source. If an area source, provide the dimensions of the area in question. Then go on to Section C. If YES, proceed to #2, below)
The hydrogen plant fugitive emissions are an area source.
The approximate demisions of the hydrogen plant will be 320 feet by 240 feet.
2. Does the building have a ventilation sys tem that is vented to the outside? Q yes • no
a. If NO, are the building's doors and windows kept open during hours of operation? Q yes Q no
3. Please provide the building dimensions:
height =
width =
length =
meters or feet
meters or feet
meters or feet
4. Are there any buildings, walls, or other structures located near this source? Q yes • no
If YES, what are their dimensions?
height =
width =
length =
distance from source
meters or feet
meters or fee t
meters or feet
meters or feet
fGo on to Section C)
SECTION C
1. Indicate the area where the source is located (check one):
O zoned for commercial use • zoned for residential use • zoned for mixed commercial and residential u se
meters or feet 2. Distance from source (stack or building to property line = 100 feet
meters or feet 3. Distance from source to nearest receptor** = 2.500 feet
IMPORTANT: You must provide a plot plan or a map, drawn to scale, which clearly demonstrates the location of your site, the property lines and any surrounding residences and/or businesses . The plot plan or map should also show the location of the source(s) at the site and their relationship to the property line.
"Receptors are defined as individual dwellings where persons are assumed to be in continuous residence. Please note that this does not refer to places of business.
i l:pub_data/forms/riskscr2 (9/99)
2

I F o r m RSA
BAY A R E A AIR QUALITY M A N A G E M E N T D I S T R I C T 9 3 9 Ellis Street . . . San Francisco. C A 3 4 1 0 9 . . . ( 4 1 5 ) 7 4 9 - 4 9 9 0 . . . FAX ( 4 1 5 ) 7 4 9 - 5 0 3 0
WEBSITE: WWW.BAAQMD.GOV
REQUEST FOR INFORMATION Risk Screening Analysis
NOTE: You must fill out this form for each source in the permit application that requires a risk screening, unless all sources exhaust through a single stack. These may be discrete sources such as stacks or area sources such a s surface area fugitive emissions.
Plant Name Air Liguide Large Industries U.S. LP
Source Description Hydrogen Plant Flare
Source No.New Emission Point New (if known) (if known)
SECTION A 1. Is the source a clearly defined emission point; i.e., a stack or ventilation duct? E3 yes Q no
(If NO. go on to Section B)
2. Does the stack stand alone or is it located on the roof of a building? ^ alone O on roof
3. What is the stack height? 140 feet meters or feet?
(Note: stack height only, whether freestanding or on rooftop)
4. What is the combined stack height and building height (if applicable)? NA meters or feet
5. What is the stack diameter? 6 feet meters or feet
cfm or m^/sec 6. What is the stack gas flowrate? 188.307 acfrn
7. What is the stack gas exit temperature? 1.830 F degrees (Fahrenheit or centigrade)
8. If the stack is located on a rooftop, what are the dimensions of the building?
height =
width =
length =
meters or feet
.meters or feet
meters or feet
9. Are there any buildings, walls or other structures located near this source? Q yes ^ no If YES. what are their dimensions?
height =
width =
length =
distance from source
meters or feet
meters or feet meters or feet
meters or feet
(Go on to Section C)

SECTION B
1. Is the source located within a building? D y e s d n o (If NO, p lease provide a description of the source. For example , fugitive emissions that must be evaluated a s an area source. If an area source, provide the dimensions of the area in question. Then go on to Section C. If YES, proceed to #2, below)
2. Does the building have a ventilation system that is vented to the outside? Q yes Q no
a. If NO, are the building's doors and windows kept open during hours of operation? • yes • no
3. P lease provide the building dimensions:
height =
width =
length =
meters or feet
meters or fee t
meters or feet
4. Are there any buildings, walls, or other structures located nea r this source? • yes • no
If YES, what a re their dimensions?
meters or feet
meters or fee t
meters or feet
height =
width =
length =
distance from source meters or feet
(Go on to Section C)
SECTION C
1. Indicate the area where the source is located (check one):
13 zoned for commercial use PI zoned for residential use O zoned for mixed commercial and residential use
meters or feet 2. Distance from source (stack or building to property line = 100 feet
meters or feet 3. Distance from source to nearest receptor** = 2.500 feet
IMPORTANT: You must provide a plot plan or a map, drawn to scale, which clearly demonstrates the location of your site, the property lines and any surrounding residences and/or businesses . The plot plan or map should also show the location of the source(s) at the site and their relationship to the property line.
"Receptors are defined as individual dwellings where persons are assumed to be in continuous residence. Please note that this does not refer to places of business.
H pub_data/forms/risksa'? (9/99)
2

Appendix B Title V Application Forms

Permit Services Division Bay Area Air Quality Management District
939 Ellis Street, San Francisco, CA 94109 • 749-4990 r3JZLu:
riMii . •T-tirr: .uu
FACILITY NAME: Rodeo SMR FACILITY ID:
'*•»* • p.-jvsTf *"'r" '"r^^fflriTrrrsBT— r-r-"——
\ i
I. FACILITY IDENTIFICATION
Facility Name: Rodeo SMR
Four digit SIC Code: 2813 _
Parent Company (if difTerent than Facility Name): Air Liquide Large Industries U.S. LP
Mailing Address: 1380 San Pablo Avenue, Rodeo, CA 94572
Street Address or Source Location: 1380 San Pablo Avenue, Rodeo, CA 94572
UTM Coordinates (if required):
Source Located within 50 miles of the state line:
EPA Plant ID:
6.
H Yes X No
• Yes X No Source Located within 1000 feet of a school:
Type of Organization D Corporation D Sole Ownership [] Government
X Partnership D Utility Company
Legal Owner's Namc:Air Liouide Larec Industries U.S. L.P.
Owner's Agent name (if any):
Responsible Official: Rich Deal
Plant Site Manager/Contact: Tobev Taylor
Type of Facility: Hydrogen Plant
General description of processes/products: Hydrogen Manufacturing
8 .
9
10.
I I .
12.
Telephone if: 713-624-8288 13.
14.
15.
Is a Federal Risk Management Plan pursuant to Scction 112(r) required? X Yes Q No (If application is submitted after Risk Management Plan due date, attach verification that the plan is registered with the appropriate agency )
16.
H ^puh d j ta Title WiiiLaforn! niM.inn TS lon:] Sunirnaryl doc

1 ESr 1 Permi t Services Division
Bay Area Air Quality Management District 939 Ellis Street, San Francisco, CA 94109 • 749-4990 i
i j j FACILITY NAME: Rodeo SMR FACILITY ID;
1 n . TYPE OF PERMIT ACTION wmmmm
1 X Initial Title V Appikation r>-' 'Ik
• Permit Renewal
• Significant Permit Modification
• Minor Permit Modification 1 1 Q Administrative Amendmenl
m . DESCRIPTION OF PERMIT ACTION
D T«nponu->- Source
U Add Rain Source
X G E M ' S
D Voluntary Emissions Caps
0 Alteminve Operating Scenarios
X Abatement Devices
Q Source Subject to MACT Requirements [Section 112]
•J Source Subject to Enhanced Monitoring
1. Does the pemat action requested involve:
1
1 2. Is source operating under a Cofrpliance Schedule? L; Yes
3. For permit modtitcanon, provide a general description of the proposed permit modification:
XNo
1 1 Rkh Deal
Name of Responsible Oflkial Stgoatve of Rtspotulble Oflficial
3 Zi 6<-T '7eo\^ Date: H:\piib_data-.T tilcV<iiiafcmri'1mhforrn'iT5-ronn\tLjnrxirY^ iioc
1 S J
]

1 * J Permit Smic« Division
Biy Area AJr Qaality MaBafrtMBl District 939 Ellis Stret t , San Fnncisco, CA M109 • 7 4 M 9 9 0 m
1 FACILITY NAME RodebSMR FACILITY#
T STATEMENT OF COMPLIANCE:
^ I certify the following: Read cach statrmcnt canfidly >ad [akial cack box for coafimatioa.
" 1 Q Based on information and belief formed after reasonable inquiry, the sourcefs) identified in the Applicable Requirements end Compliance Summary form that isfare) in compliance will continue to comply nith the appOcable requirements);
[ | Based on information and belief formed after reasonable inquiry, the sourcefs) identified in the Applicable Requirements and Compliance Summary form will compfy with future-effective applicable requirtmentfs), on a timely basis;
1 1 | Based on information and belief formed after reasonable inquiry, information on application forms,
all accompanying reports, end other required certifications is true, accurate, and complete;
j I All fees required by Regulation S, including Schedule P have been paid. 1 1
S T A T E M E N T O F NON-COMPLIANCE
Read s t a l r n t s i carefully- Initial box for coafirraatioB if statement ts true.
I certify the following;
1 • Based on information and belief formed after reasonable inquiry, the sourcefs) identified in the Schedule of Compliance application form that isfare) not in compliance with the applicable requirementfs) will comply in accordance with the attached compliance plan schedule. 1
1 i J w . 0 ^ -X Sigmtare of Responsible OfRciaJ
Rkh Deql. Vice President. Hydrogen Svneas Name of Responsible OiTlciaJ
X*> OoT IOOY
Date
I M pub_<btaVToicVNiaafomvtrfr/ofrrrTS-fofmcenAoc
]

Permit Services Division Bay Area Air Quality Management District
939 Ellis Street, San Francisco, CA 94109 • 749-4990
jf-jSiav
SlKvS? 2^V" 11 •«
FACILITY NAME: Rodeo SMR FACILITY ID:
I. STATIONARY SOURCE EMISSIONS
'•mmmmsgm* msmm PCTi
1 32.5 32.5 NOx 0
6.4 6.4 SOZ 0
17.8 PM10 17.8 0
] 22.9 roc 22.9 0
41.1 CO 0 41.1
]
tm
j mm
J ]
/ certify that based on information and belief formed after reasonable inquiry, the atutven, statementa, and information contained in this application (and supplemental attachments thereto) are true, accurate, and complete. This application consists of the application farms provided by the Bay Area Air Quality Management District and supplemental attachments. I also certify that I am the rtzponsible official as
1 erf In District Regulation 2, Rule 6.
I - Rich Peal Print Name of RfspoiulWe Oftldal SlgnatBre of Responsible Onicial
Vice Prtsident, Hydrogen Syngas Title of Responsible Official and Company N 2'i Ztof l>arc: ai i>e
1 J
Page I of 1 MApub^dau JttlcV^daiaronn mfrrorr^TS-f 'onn'eiiH^ionv sumnuA'.doc

P e r m i t S e r v i c e s D i v i s i o c Buy Area AJr Quali ty iVIuiagetneiit District
939 EIHJ Street, San F r u d s c o , C A 94109 • 749-4990
KS
TT
V FACSETTY 1 F A C I L I T Y N A M E : R o d e o S M f t
L I S T O F E Q U I P M E N T W I T H A N N U A L E M I S S I O N S
rricil •rdtr, 0*1 *11 Kfifmml aad/or opintf—i described ia S«ctMi 1-4-495^ aad ik«ir u a m l iwhi l tn (a tras per ytar. la a Use vac la* far eaek paflataaL If wttrt apsce fa reqaind, ate ad^tiaaal ( o m . Ptcas« type •» priM If saartts MT aed*Ma d* aot hart • soane amber, i ean the Smtree f catana blaak. FleaM attatk eminloa tatariatteaj to tkb font «r at aa appeadti to tkc ippUcatba. District cakal*ti«as guy be sted if fbc permittee flads dut they ire correct One sample eaieniatfoa for a grawp of idtatical warcet it ptfUclraL
] ] T y p e o f P o l l H t a n t N a m e o r
D e s c r i p t i o n A n n n a l E m i s s i o D S ,
to as p e r year (OHC luie for cacfa) - . S o u r c e #
32.3 H«w SJllR F u r n a c e NO* N e w 1 6.4 New SMR F u m a c s S 0 2 N e w
17.0 N»w SMR F u m a c s PM10 N e w
1 13 J) New SMR F u m a c s ROC N e w
39.5 Nmr SMR F u m a c s C O N e w
8.8 N e w Hydrogen Plant (Deaerator Vent) ROC 1 ROC N e w Hydrogen Plant (Fugi t ives) 1.1
N e w 0.2 NOx Flare (P l to t s /HG P u r g e )
1 N e w 0.005 Flare (Pl to te /NG P u r g e )
Flare (P i to te /NG P u r g e )
S 0 2
N e w 1.6 C O
1 1 ] ]
Emissions for year ending Date
i Page ! of 1 H 'pubj l saYT' . i l cVxt^a iofn i mf t fonr .TS - fo rnADcvGmis OCH

I
I Permit Services Division Bay Area Air Quality Management District
939 Ellis Street, San Francisco, CA 94109 « 749-4990 £ •*1.
F A C I U T Y NAME: •R&d^SSiR FACIUTY #:
L I S T O F E Q U I P M E N T E X E M P T F R O M D I S T R I C T P E R M I T R E Q U I R E M E N T S
In lumtrki) ordtr, KjtaU equpmctu whkh b etenpl from District permit rrqilremeau. Qte reltvaiit Strtten of Role 2-1 for baits for txeeptios. Please note dut emUsiou tnuit be bdow 5 ions per year of any regnlatcd pollatant for eath soum. If more space Is reqolrtd. Me icidlttsul forms. Pltaie type or print legOtly. In the "Emission Report" cohuoa, state frhether emisilons are Hsted In Ute detaBed EmbsJons Report f UlSiP EMISSIONS
RfiffORTED il .^Up^) i;:.
SOURCE DESCRIFnON ( b f ^ " I ; --gASIS FOR EXEMPTION I
New Cool ing Tower BAAQMD 2-1-128.4 Y
I New Glycol Tank BAAQMD 2-1-123.3.2 Y
1
I
1
1
] 1
/ O / Z H / P - T } Date
Page I of 1 i l : ^ p u b _ d j t a - T h 3 < V ' ( U ( a i D n n m f i f o n n \ 7 5-fwrTTi '<^rni i i .doc
]

.1 Permit Services Division
Bay Area Air Quality Management District 934 EUij Strut, &M Fnatisf, CA. 44104 - (41S) 77t-600e
iAdLTTYNAME: Rodeo SMR • - * - •
FACILITY#;
LIST OF ABATEMENT DEVICES
] la UUMrital anlcr , fist ill atatcoMiit dcviccs, tht u m e or dncriptioK, and tkc soortcs or opcratioa •b«l«L If more spacc Is r rqa i r td , SM addhtoMl f o r s s . Pkatc type or print Iceibly.
Sources or Operation Abated 1 . Name or Description Device#
Selective Catalytic Reduction System SMR Furnace, S-New A-New
]
"
1 1 ] ] ]
Date
)t ^ b j J a u . T . i l c V - a r j f t n n n v - i ' ^ i v T S - f o m a b J U n c m . j o c J Page i of 1

I J i i i k L. I I i t a gssj
Permit Services Division Bay Area Air Quality Management District
939 Ellis Street, San Francisco, CA 94109 • (415) 749-4990
FACILITY FACILITY NAME: Rodeo SMR
Source Name(s) Hydrogen Plant, and Steam Methane Reforming Furnace
Sou roe #(s):
APPLICABLE REQUIREMENTS In punuTicul nn ie r , ii«i sill ci|iiiprnrni with any uppllcablr r tqu l remcnt ) . Include any work p r sc t l r t i t i n tUrcb or thronEhput l lmiu p u r j u i o t to NSR o r District KeeuIatioDS. Indicate
(lit' (l.)U' liurfng ibc pi'rnilt term that the gjipllcsblc r e q u l r t m t n t ( j ) will be eCrcctive. If more Itaes a r e reqolred, plcate use addit ional fortnt. If InforuiatioD docs not fit in the cpaec n l l u i l r i l , JKJCII c l o c u n u T K u i i o n and rcfcrcncc It on lhl« form. Use the " F E " column to i ta te whether the reqai rement Is federally enforceable. Type or p r in t legibly.
runt ie KJrrtTrv*
DATI TEST M E T H O D S
(If any) M O N I T O R I N G
P R O T O C O L REPORTING P R O T O C O L
R E C O R D K E E P I N G P R O T O C O L
CtXVfTUANCt (V.N)
API 'LICABLE R E G U L A T I O N S FE
PLEASE R E F E R TO
ATTACHMENTS
J
IQlzS/oS-At tach a n y d o c u m e n t a t i o n to th is f o r m . P a g e I of 1 Da te
H V u b JunVriili:Vr,<JaiafO[m''jn<TfuiTn\T5-form ,'*n;52icv.doc

Hydrogen Plant Applicable Requirements
Table IV jSft-i nip]
BAAQMD
Regulation 8,
Role 2
Organic Compound - Miscellaneous Operations (6/15/94)
8-2-301 Miscellaneous Operations: emissions shall not exceed IS lb/day and
300 pptn carbon on a dry basis
Organic Cotr.pound - Process Vessel Deprcssurization (1/21 /2004)
Y
BAAQMD
Regulation 8,
Role 10
N 8-10-301 Deprcssunzalion Control Options
Opening of Process Vessels N 8-10-302
organic compounds cannot exceed 10,000 ppm (methane) pnor to
release to atniosphere
Organic compound concentration of a refinery process vessel may
exceed 10,000 ppm prior to release to atmosphere provided total
number of such vessels during S-year period docs not exceed 10%
8-10-302 1 N
N 8-10-302.2
N Turnaround Records. Annual report due February 1 of each year
with initial report of process vessels due 4/1/2004
8-10-401
Y Monitoring pnor to and during process vessel opening 8-10-501
Y Concentration measurement using EPA Method 21 8-10-502
N Recordkeeping 8-10-503
N 8-10-601 Monitoring Procedures
Organic Compound - Process Vessel Deprcssurization (7/20/83) SIP
Regulation 8,
Rule 10
Y Process Vessel Depressurizmg. POC emissions shall be vented
through a knock-out pot and (hen abated m one of the following
ways, to as low a vessel pressure as possible, but at least until
pressure is reduced to iess than 1000 mm Hg:
8-10-301
8-10-301 1 recovery to the fuel gas system
Y 8-10-301 2 combust ion at a fucboT nr incinerator
Y 8-10-301.3 c ;~bi i s t ior . at a f lare
containment such that emissions to atmosphere do not occur Y 8-10-301 A
Y Turnaround Records. The following records shall be kept foi each
process unit turnaround, and retained for at least 2 years and made
available lo the Distncl on demand during inspcclions:
8-10-401
Y 8-10-401 I dale of depressunzation <.vent
Y approxunale vessel hydroc:i ibon conceniialion when emiss ions to
a tmosphere begin
8-10-401 2

K . ; _ '
zy-m ^r5f:>^2l2bTdC"|&jg5^^ •? Sii blfc:,«
v."; ••isSfff.
[ approximate quaniity of POC emissions to atmosphere 8)0-401.3 Y
B A A Q M D
Regulation 8,
Rule 18
If a process unit has 5 consecutive quarters with <2% of valves
leaking at >10,000 ppm, then any individual valve which measures
<100 ppm for 5 consecutive quarters may be monitored annually
BAAQMD 8-18-404.1
Y
Tabic VII
H ^
P/E 8 10-401 2 (SIP) and 8-10-501 & 502
(non SIP)
Records POC Y abatement of emissions from proccss vessel
depressunzation is required until pressure is reduced to
BAAQMD
8 10-301
less than 1000 mm Hg

SMR Furnace Applicable Requircmeats
Table IV
m i s g-S?jj
BAAQMD
Regulation I
General Provisions and Definitions (5/2/01)
Monitoring May Be Required 1-521 Y
1-522 Continuous Emission Monitoring and Recordkeeping Procedures
reporting of inoperative CEMs 1-522.4 Y
CEM calibration requirements 1-522.5 Y
CEM accuracy requirements 1-522.6 Y
1-522.7 emission limit exceedance reporting requirements N
monitoring data submittal requirements 1-522 8 Y
1-522.9 recordkeeping requirements Y
1-522.10 Y Regulation 1-521 monitors shall meet requirements specified by
District
1-602 Area and Continuous Monitoring Requirements N
PROVISIONS N O LONGER IN CURRENT RULE SIP
Regulation 1 General Provisions and DetinlHons (6/28/99)
Continuous Emission Monitoring and Recordkeeping Procedures Y - note 1 1-522
Y - note I emission limit cxccedance reporting requirements 1-522.7
Particnlate Ma t t e r and Visible Emissions (12/19/90) BAAQMD
Regulation 6
6-301 Y RingelmannSl Limitation
Y Tube Cleaning 6-304
6-305 Y Visible Particles
Y Particulate Weight Limitation 6-310.3
Continuous Emission Monitoring Policy and Procedures (1/20/82) Y BAAQMD
Manual of
Procedures,
Volume V
Table VII PI
r-i
None for N BAAQMD Y
6-304
During tube cleaning,
Ringelmann No. 2 for 3
min/hr and 6 min/billiou btu
in 24 hours, applies lo
sources rated over 140
Opacity
gaseous-
fueled
sources
MMbtu/hr (with lubes)

7̂1 > -i - -
S | ¥
Opacity BAAQMD
6-301
Y Ringelmann I for no more Noue for N
than 3 minutes in any hour gaseous-
fueled
souices FP BAAQMD
6-305
Y Prohibition of nuisancc None N
FP BAAQMD
6-310.3
O.IS grain/dscf @ 6% 02 Y None for
gaseous
fueled
sources
Table VUI
BAAQMD
Regulations
Ringelmann No I Limitation 6-301 Manual of Procedures, Volume I, Evaluation of Visible
Emissions, EPA Method 9
6-304 Tube Cleaning Manual of Procedures, Volume 1, Evaluation of Visible Emissions
Manual ofProcedures, Volume IV. ST-15, Particulates Sampling
U S EPA Method 5
Particulate Weight Limitation 6-310

Appendix C Detailed Emission Calculations

Table 3-2 SMR Furnace Criteria Pollutant Emission Factors Air Liquide Hydrogen Plant Operational Emmissions
Emission Factor Ef Reference Polhitanl SCAQMD BACT ppmvd 6) 3% O j NOx 5 00058
so2 BAAQMD BACT (PSA/fuel gas Mix) 35 ppmv ttital S in RFG/NG 0 .0012
AP42 Section 1 4, Natural Gas Combustion (apply 1 /2 value since 50% H2 m fuel) 38 lb/MMc-f (natural gas) PM10 00037
AP42 Section 1.4. Natural Gas Combustion (apply 1/2 value since 50% H2 in fuel) POC 2.75 lb/MM4.*f (natural gas) 0 0027
ppmvd © 3% Oj SCAQMD BACT CO 10 0 0070
Assumptions for emissions factor table above: (1) NOx, CO, and NH3 "ppm" emission factors converted to "Ib/MMBtu" as follows: (x [lb/MMBtu]) = (y ppm © 3% 02) * (21% - 0%) / (21% - 3%) • (EPA Fd Factor [ft3/ MMBlu]) / (Molar Volume lfl3/ibmoll) • (Molecular weight [Ib/lbmol])
PM10 and POC "Ib/MMd* emission factors converted to "lb/MMBtu" as follows: (x [lb/MMBtu]) = (Emission factor [Ib/MMcf]; / (Natural gas heat content (Btu/scfl)
Fd Factor: Molar volume:
8150 ft3/MMBtu (Air Liquide) 379 ft3/lbmol (at STP: 25 C, 1 atm)
46 Ib/lbmol 28 Ib/lbmol 17 Ib/lbmt'l 64 Ib/lbmcl
235 Btu/scf (ConocoPhillips) 1340 Btu/scf (ConocoPhillips 3 year average) 1020 Btu/scf (AP42 basis)
NOx MW: COMW: NH3 MW: S02MW: PSA gas: Refinery Fuel Gas. Natural Gas
00300030- 10/21/2005 ERM

Table 3-6 Natural Gas Fugitive Component Emissions Air Liquide Hydrogen Plant Operational Emissions
Emission factors are taken from California Implementation Guidelines for Estimating Mass Emissions of Fugitive Hydrocarbon Leaks at Petroleum Facilities, February 1999, with screening values assumed to be the maxiinuin leak rate allowed by BAAQMD, Regulation 8-18.
Emission Factor, lb/hr/component
Emissions lb/hr Component Service Count tpy
Valve 1.56E-04 016 240 0.04 £1 1 56E.04 0.00 LL 0.00
Flange 1657 257E-04 0.43 1.87 E3* 2.57E-04 000 000 LL
• 0.00 PRV 1.03E-03 0.00 1 gas 0.00 Pump LL 5.32E-03 0.00
9.98E-<6 0.00 0.00 Sample Connection Compressor
2 gas 000 103E-03 000 0 gas
Total 0.47 204
Speciation Data Weight % lb/hr Component tpy
000 Hydrogen 000 0.00
060 0.00 0 01 Nitrogen Argon 0.00 0 .00 000
0.00 0.00 Oxygen 000 002 Carbon dioxide 100 000 000 000 Carbon monoxide 0.00
1.95 95.80 0 45 Methane 000 000 0.00 Ethylene
Ethane 004 2.10 0.01
0.00 0.00 0.00 Propene O.OO 0.01 036 Propane
0.00 0.00 000 13-Butadicne 0.00 0.00 0.00 IButene
0.00 000 0.05 i-Butane 000 0.05 000 n-Butane 0.00 0.00 0.00 1-Pentene 0.00 0.03 0.00 n-Pentane 000 000 001 n-Hexane 000 000 000 Water
000 0.00 000 Ammonia 000 000 000 Glycol
10000 2.04 046 Total 005 0 01 160 I'otal vex :
0030030 • 10/21/21X15 PagL-1 of 12 ERM

Table 3-6 Refinery Fuel Gas Fugitive Component Emissions Air Liquide Hydrogen Plant Operational Emissions
Emission factors are taken from California Implementation Guidelines for Estimating Mass Emissions of Fugitive Hydrocarbon Leaks at Petroleum Facilities, February 1999, with screening values assumed to be the maximum leak rate allowed by BAAQMD, Regulation 8-18.
Emission Factor, ib/hr/componen
Emissions Ib/hr Component Service Count tpy
Valve 80 1.56E-04 0.01 0.05 gas LL 1.56E-04 0.00 0.00
Range 500 2.57E-04 0.13 0.56 £as LL 2.57E-04 0.00 0.00
PRV 103E-03 0.00 1 0.00 gas LL Pump 532E-03 0.00 0.00
Sample Connection 2 9.98E-05 0.00 0.00 gas Compressor 103E-03 0 0.00 000 gas
0.62 | Total 0.14
Speciation Data Weight % Component Ib/hr tpy
Hydrogen 14.77 0.09 0.02 Nitrogen 0.00 0.00 0.00 Argon Oxygen
0.00 0.00 0.00 0.00 0.00 0.00
Carbon dioxide 0.27 000 0.00 Carbon monoxide 0.00 0.67 0.00 Methane 46.81 0.29 0.07 Ethylene 0.00 0.70 0.00
988 Ethane 0.01 006 0.01 120 0.00 Propene
Propane 0.06 10.38 0.01 0.00 1,3-Butadiene 0.39 0.00
1-Butene 0.00 0.51 0.00 4.09 003 i-Butane 0.01
0.05 8.08 0.01 n-Butane 0.00 0.00 0.00 1-Pentene 0 . 0 1 1.75 0.00 n-Pentane
0.51 000 n-Hexane 0.00 0.00 0.00 Water 0.00
0.00 0.00 0.00 Ammonia 0.00 Glycol 0.00 0.00 062 100.00 Total 0.14
37.48 0.23 Total VOC 005
0030030-10 /21 /2005 ERM P.igc 2 of 1

Table 3-6 Butane Feed Fugitive Component Emissions Air Liquidc Hydrogen Plant Operational Emissions
Emission factors are taken (rom California Implementation Guidelines for Estimating Mass Emissions of Fugitive Hydrocarbon Leaks at Petroleum Facilities, February 1999, with screening values assumed to be the maximum leak rate allowed by BAAQMD, Regulation 8-18.
Emission Factor, Ib/hr/component
Emissions Component Service Count Ib/hr tpy
Valve 10 156E-04 0.00 0.01 gas LL 70 1 56E-04 001 0.05
Flange 100 2 57E-04 0.03 0.11 g a s
LL 100 2 57E-04 0.03 0.11 PRV 1 1 03E-03 0.00 0.00 gas
Pump LL 2 532E-03 001 005 Sample Connection 2 998E-05 0.00 0.00 gas
Compressor 0 1 03E-Q3 000 000 gas Total 0.08 033
Speciation Data Component Weight % Ib/hr tpy
Hydrogen 0.00 0.00 0.00 000 Nitrogen 0.00 000
0.00 000 0.00 Argon Oxygen Carbon dioxide
0.00 0.00 000 000 000 000
Carbon monoxide 0.00 000 0.00 Methane 000 0.00 0.00
0.00 Ethylene 0.00 000 Ethane 000 0.00 0.00
000 0.00 Propene 0.00 Propane 1 ̂ -Butadiene
0.00 0.00 0.00 0.00 0.00 0 .00
0.00 0.00 0.00 1-Butene 0.02 455 0.00 i-Butane 031 0.07 n-Butane 94.26
000 000 1-Pentene 000 n-Pentane 000 0.00 1.19 n-Hexane 000 0.00 000
000 0.00 Water 000 0.00 0.00 0.00 Ammonia
0.00 Glycol 0.00 0.00 0.33 Total 008 10000
Total VOC 0 33 100 00 008
ERM Page 3 of 12 0030030-10 /21 /2005

Table 3-6 Isopentane Feed Fugitive Component Emissions Air Liquide Hydrogen Plant Operational Emissions
Emission factors are laken from California Implementation Guidelines for Estimating Mass Emissions of Fugitive Hydrocarbon Leaks at Petroleum Facilities, February 1999, with screening values assumed to be the maximum leak rate allowed by BAAQMD, Regulation 8-18.
Emission Factor, b /hr /componen
Emissions Component Service Count Ib/hr tpy
Valve 10 156E-04 000 001 gas LL 156E-04 0 0 0 0.00
0 0 3 Flange 100 2.57E-04 0.11 gas 0.00 LI. 2.57E-04 0.00
PRV 1.03E-03 0.00 0.00 1 jgas 0.00 Pump LL 532E-03 0.00
9.98E-05 Sample Connection 2 0.00 0.00 gas Compressor 1.03E-03 0 0.00 0.00 gas
Total 0 . 1 2 0.03
Speciation Data Weight % Ib/hr Component tpy
0.00 Hydrogen Nitrogen
0.00 0.00
0.00 0.00 0 0 0 0.00 0 0 0 0.00 Argon 0.00 Oxygen 000 0.00 0.00 Carbon dioxide 0.00 0.00
Carbon monoxide 0.00 0.00 0.00
0.00 0.00 0.00 Methane 0.00 0.00 Ethylene 0.00
Ethane 0.00 0.00 0.00
0.00 0.00 0.00 Propene Propane 0.00 0.00 O.OO
0.00 0.00 1,3-Butadiene 0.00
0.00 0.00 1-Butene 0.00 0.00 0.00 O.OO i-Butane 0.00 0.00 0.00 n-Butane
0.00 000 000 1-Pentene 0.03 0.12 n-Pentane 100.00
000 0.00 0.00 n-Hexane 0.00 O.OO 0.00 Water
000 0 0 0 Ammonia 0.00 0.00 000 0.00 Glycol
0 03 0 1 2 Total 100.00 0 0 3 0 . 1 2 [Total VOC 100 00
0 0 3 0 0 3 0 - 1 0 / 2 1 / 2 0 0 5 Pag1' 4 of 12 ERM

Table 3-6 RFG Teed Fugitive Component Emissions Air Liquide Hydrogen Plant Operational Emissions
Emission factors are taken from California Implementation Guidelines for Estimating Mass Emissions of Fugitive Hydrocarbon Leaks at Petroleum Facilities, February 1999, with screening values assumed to be the maximum leak rate allowed by BAAQMD, Regulation 8-18.
Emission Factor, b /hr /componen
Emissions Component Service Count Ib/hr tpy
Valve 10 1.56E-04 0.00 0.01 j g J S
LL 1.56E-04 0.00 0.00 Flange 100 2.57E-04 0.11 0.03 gas
LL 2.57E-04 0.00 0.00 PRV 1 1.03E-03 0.00 0.00 gas
Pump | Sample Connection
LL 532E-03 000 0.00
2 0.00 9.98E-05 0.00 gas Compressor 0 1.03E-03 0.00 0.00 gas
Total 0.03 0.12
Speciation Data Component Ib/hr Weight % tpy
Hydrogen 33.20 0.01 0.04 Nitrogen 0.00 0.00 0.00
Argon 0.00 0.00 0.00 Oxygen 0.00 000 0.00
000 Carbon dioxide 0 0 0 0.00
Carbon monoxide 0.00 0.00 0.00
Methane 33.20 001 004 Ethylene 0.00 0.00 0.00
Ethane 12.50 0.02 0 0 0 000 0.00 Propone 0.00
19.40 0.01 0.02 Propane 0.00 1,3-Butadiene 0.00 0.00
0.00 1-Butene 0.00 0.00 0.00 0.00 i-Butane 1.50 000 0.00 0.00 n-Butane 000 0.00 0.00 1-Pentene 000 0.10 000 n-Pentane 0 0 0 0 0 0 n-Hexane 0.10 0.00 0.00 000 Water
0.00 000 0.00 Ammonia Glycol 0 0 0 0.00 0.00
100.00 0 1 2 Totjl 0 0 3 004 Total VOC 0.01 33.60
0030030 -10/21/2005 Page 5 of 12 ERM

Table 3-6 SMR Feed Fugitive Component Emissions Air Liquide Hydrogen Plant Operational Emissions
Emission factors are taken from California Implementation Guidelines for Estimating Mass Emissions of Fugitive Hydrocarbon Leaks at Petroleum Facilities, February 1999, with screening values assumed to be the maximum leak rate allowed by BAAQMD, Regulation 8-18.
Emissions Emission Factor, b/hr/componen Service Count Component Ib/hr tpy
1.56E-04 Valve 5 0.00 0.00 gas 156E-04 0.00 LL 0.00
399 Flange 2.57E-04 0.10 0.45 j g s 0.00 LL 2.57E-04 0.00
1.03E-03 0.00 0.00 PRV gas 5.32E-03 0.00 Pump LL 0.00 9.98E-05 O.OO Sample Connection
Compressor 0.00 gas
0.00 1.03E-03 0.00 gas Total 0.45 0.10
Speciation Data Weight % Component Ib/hr tpy
0.08 Hydrogen Nitrogen
16.97 0.02 0.25 0.00 0.00
0.00 0.00 0.00 Argon 0.00 0.00 0.00 Oxygen
Carbon dioxide 0.00 0.00 0.41 0.00 000 Carbon monoxide 0.00
0.06 0.26 Methane 56.56 0.00 0.00 Ethylene 0.00
0.03 Ethane 7.26 0.01 0.00 0.00 0.00 Propene 005 0.01 10.07 Propane
0.00 0.00 1,3-Buladiene 0.00 0.00 000 0.00 1-Butene
0.00 001 i-Butanc 1.13 0.03 7.15 0.01 n-Butane 000 0.00 0.00 1-Pentene 000 0.00 n-Pentane 0.15
0.00 000 n-Hexane 0.06 0.00 0.00 Water 0.00
0.00 0.00 0.00 Ammonia 000 000 Glycol 0.00
045 10000 010 Total 0.12 [Total VOC 25.81 0.03
0030030 - 1 0 / 2 1 / 2 0 0 5 Page 6 of 12 ERM

Table 3-6 Glycol Fugitive Component Emissions AirLiquide Hydrogen Plant Operational Emissions
Emission factors are taken from California Implementation Guidelines for Estimating Mass Emissions of Fugitive Hydrocarbon Leaks at Petroleum Facilities, February 1999, with screening values assumed to be the maximum leak rate allowed by BAAQMD, Regulation 8-18.
Emission Factor, b /hr /componen
Emissions Component Service Ib/hr Count tpy
Valve 1.56E-04 0.00 0.00 gas HL 58 1.56E-04 0.01 0.04
Flange 2.57E-04 0.00 0.00 gas HL 730 2.57E-04 0.19 0.82
1.03E-03 PRV 0.00 0.00 gas 5.32E-03 HL 0.01 Pump 2 0.05
Sample Connection 9.98E-05 0.00 0.00 _gas Compressor 1.03E-03 0.00 0.00 gas
Total 0.21 0.91
Speciation Data Component Weight % Ib/hr tpy
Hydrogen 0.00 0.00 0.00
Nitrogen 0.00 0.00 0.00 Argon 000 O.OO 0.00
Oxygen 0.00 0.00 0.00
Carbon dioxide 0.00 0.00 0.00
Carbon monoxide 0.00 0.00 0 00 Methane 0.00 0.00 0.00
0.00 Ethylene 0.00 0.00
Ethane 0.00 0.00 0.00 0.00 Propene 0.00 0.00
0.00 0.00 0.00 Propane 1,3-Butadiene 0.00 0.00 0.00
0.00 0.00 1-Butene 0.00
0.00 0.00 0.00 i-Butane 0.00 000 0.00 n-Butane
l-Pentcne 0.00 0.00 0.00
n-Pentane 0.00 0.00 0.00
0.00 0.00 0.00 n-Hexane 40.00 0.08 0.36 Water 0.00 0.00 0.00 Ammonia 60.00 Glycol 0.12 0.55
Total 100.00 0.00 0 00 0 Total VOC 0.00 0.00 0.00
0030030-10/21/2005 ERM Page 7 of 12

Table 3-6 SMR Outlet Fugitive Component Emissions Air Liquide Hydrogen Plant Operational Emissions
Emission factors arc taken from California Implementation Guidelines for Estimating Mass Emissions of Fugitive Hydrocarbon Leaks at Petroleum Facilities, February 1999, with screening values assumed to be the maximum leak rate allowed by BAAQMD, Regulation 8-18.
Emission Factor, lb/hr/componen
Emissions Component Service Count lb/hr tpy
Valve 1.56E-04 4 0.00 000 El 0.00 LL 1.56E-04 0.00
Flange 2.57E-04 20 0.01 0.02 £as LL 2.57E-04 0.00 0.00
PRV 1.03E-03 0.00 0.00 gas Pump 5.32E-03 LL 0.00 0.00
Sample Connection 9.98E-05 0.00 0.00 ^as 1.03E-03 Compressor 0.00 0.00 gas
Total 0.03 0.01
Speciation Data Weight % Component lb/hr IEI
Hydrogen Nitrogen
46.59 0.00 0.01 0.00 0.03 0.00
0.00 0.00 0.00 Argon Oxygen 0.00 0.00 0.00 Carbon dioxide 5.81 0.00 0.00 Carbon monoxide 956 0.00 0.00
0.00 Methane 3.29 0.00 Ethylene 0.00 0.00 0.00
Ethane 0.00 0.00 0.00 0.00 Propone
Propane 13-Butadiene
0.00 0.00 0.00 0.00 0.00
0.00 0.00 0.00 0.00 0.00 0.00 1-Butene
i-Butane 0.00 0.00 0.00
0.00 n-Butane 0.00 000 O.OO 0.00 1-Pentene 0.00 000 0.00 0.00 n-Fentane 0.00 0.00 n-Hexane 0.00
0.00 0.01 Water 34.71 0.00 0.00 0.00 Ammonia
Glycol 0.00 0.00 0.00 002 0.00 Total 100.00 002 Total VOC 0.00 0.00
0030030- 1 0 / 2 1 / 2 0 0 5 Page 8 of 12 l-RM

Table 3-6 Shifted Gas Fugitive Component Emissions Air Liquide Hydrogen Plant Operational Emissions
Emission factors arc laken from California Implementation Guidelines for Estimating Mass Emissions of Fugitive Hydrocarbon Leaks al Petroleum Facilities, February 1999, with screening values assumed to be the maximum leak rate allowed by BAAQMD, Regulation 8-18.
Emission Factor, b/hr/componen
Emissions Component Service Count Ib/hr tpy
Valve 0.03 156E-04 0.01 47 £ - L LL 1.56E-04 0.00 0.00
Flange 2.57E-04 0.04 0.16 143 gas LL 2.57E-04 0.00 0.00
1.03E-03 PRV 0.00 0.00 gas 5.32E-03 Pump 0.00 0.00 LL
Sample Connection 9.98E-05 0.00 0.00 1 £as Compressor 0.00 0.00 1.03E-03 gas
0.19 Total 0.04
Speciation Data Component Ib/hr Weight % tpy
0.02 0.10 Hydrogen 53.07 0.00 Nitrogen
Argon 0.00 0.03
0.00 0.00 0.00 0.00 0 x y p c "
Carbon dioxide 0.00 0.00
002 0.01 1228 0.01 Carbon monoxide 0.00 3.09 0.01 0.00 Methane 3.29 0.00 Ethylene 0.00 0.00 0.00 Ethane 000 0.00 0.00 0.00 0.00 Propane 0.00 0.00 0.00 Propane 0.00 0.00 1,3-Butadiene 0.00
0.00 0.00 0.00 1-Butene 0.00 0.00 0.00 i-Butane 0.00 0.00 0.00 n-Butane 0.00 0.00 0.00 1-Penlene
000 0.00 n-Pentane 0.00 0.00 0.00 n-Hexane 0.00
28 24 005 0.01 Water 0.00 000 0.00 Ammonia
0.00 Glycol 000 000 0.14 0.03 100.00 Total 0.00 Total VOC 000 0.00
0030030-10/21/2005 ERM Pago 9 0112

Table 3-6 Process Condensate Fugitive Component Emissions Air Liquide Hydrogen Plant Operational Emissions
Emission factors are taken from California Implementation Guidelines for Estimating Mass Emissions of Fugitive Hydrocarbon Leaks at Petroleum Facilities, February 1999, with screening values assumed to be the maximum leak rate allowed by BAAQMD, Regulation 8-18.
Emission Factor, Ib/hr/component
Emissions Component Service Count Ib/hr IEI
Valve 1.56E-<M 0.00 0.00 _gas LL 161 1 56E-04 0.03 0.11
Flange 257E-04 0.00 0.00 gas LL 431 2.57E-04 on 0.49
PRV 1.03E-03 4 0.00 0.02 £21 Pump LL 6 532E-03 0.03 0.14
Sample Connection 998E-05 0.00 0.00 gas Compressor 1.03E-03 0.00 0.00 gas
Total 0.17 0.75
Speciation Data Component Weight % Ib/hr tpy
Hydrogen 0.01 0.00 0.00 Nitrogen 0.00 0.00 0.00
0.00 0.00 0.00 Argon 0.00 Oxygen 0.00 0.00
Carbon dioxide 0.00 0.13 0.00 Carbon monoxide 0.00 0.00 0.00
0.00 0.00 0.00 Methane 0.00 0.00 0.00 F.thylene
Ethane 0.00 0.00 0.00 0.00 0.00 0.00 Propene
Propane 1,3-Butadiene
0.00 0.00 0.00 0.00 000 000 0.00 0.00 0.00 1-Butene
0.00 0.00 000 i - B u t a n e 0.00 0.00 0.00 n-Butane 0.00 0.00 0.00 1-Pentene 0.00 000 000 n-Pentane 0.00 0.00 000 n-Hexane 0.75 99.85 Water 0.17 0.00 000 0.00 Ammonia
0.00 0.00 0.00 Glycol 0.00 Total 100.00 000 0.00 Total VOC 0.00 0.00
0030030-10/21/2005 Pape 10 oH 2 ERM

Table 3-6 Stripper Overhead Fugitive Component Emissions Air Liquide Hydrogen Plant Operational Emissions
Emission factors are taken from California Implementation Guidelines for Estimating Mass Emissions of Fugitive Hydrocarbon Leaks at Petroleum Facilities, February 1999, with screening values assumed to be the maximum leak rate allowed by BAAQMD, Regulation 8-18.
Emission Factor, Emissions Component Service Count b/ hr/ componen Ib/hr tpy
Valve 19 1.56E-04 0.00 0.01 LL 1.56E-04 000 0.00
Flange 2.57E-04 0.01 0.05 45 gas LL 0.00 2.57E-04 0.00
1.03E-03 PRV 0.00 0.00 1 gas Pump LL 5.32E-03 0.00 0.00
Sample Connection 0.00 0.00 9.98E-05 _gas Compressor 1.03E-03 0.00 0.00 gas
Total 0.02 007
Speciation Data tpy Ib/hr Component Weight %
Hydrogen 0.00 0.00 0.01 0.00 0.00 Nitrogen 0.00 0.00 0.00 0.00 Argon
Oxygen 0.00 0.00 0.00 Carbon dioxide 0.00 0.00 0.13 Carbon monoxide 0.00 0.00 0.00
0.00 0.00 Methane 0.00 000 Ethylene 0.00 0.00
Ethane 0.00 0.00 0.00 000 0.00 Propenc
Propane 1,3-Butadiene
0.00 0.00 0.00 0.00
000 0.00 0.00 0.00 0.00 0.00 1-Butene
0.00 0.00 i-Butane 0.00 0.00 0.00 n-Butane 0.00
0.00 0.00 1-Pentene 0.00 0.00 0.00 n-Pentane 0.00
0.00 0.00 n-Hexane 0.00 0.02 0.07 Water 99.85
0.00 0.00 Ammonia 0.00 0.00 0.00 Glycol 0.00 0.00 000 Total 100.00
0.00 Total VOC 0.00 0.00
0030030 - 10/2V2005 Page 11 Of 12 F-.RM

Table 3-6 PSA Offgas Fugitive Component Emissions Air Lujuide Hydrogen Plant Operational Emissions
Emission factors are taken from California Implementation Guidelines for Estimating Mass Emissions of Fugitive Hydrocarbon Leaks at Petroleum Facilities, February 1999, with screening values assumed to be the maximum leak rate allowed by BAAQMD, Regulation 8-18.
Emission Factor, b/hr/componen
Emissions Component Count Ib/hr Service tpy
0.23 Valve 344 1.56E-04 0.05 gas 0.00 LL 0.00 1.56E-04
Flange 2.28 2022 052 2.57E-04 gas 257E-04 0.00 LL 0.00
PRV 0.00 0.00 103E-03 I gas Pump 0.00 LL 0.00 532E-03
Sample Connection 0.00 0.00 1 9.98E-05 £21 Compressor 0.00 0.00 1.03E-03 gas
2.52 0.58 Total
Speciation Data ib/hr Component Weight % toy
0.64 Hydrogen 0.15 25.31 0.00 0.00 Nitrogen 0.14 0.00 0.00 Argon 0.00
0.00 0.00 Oxygen 0.00 Carbon dioxide 0.28 1.23 48.67
0.07 Carbon monoxide 0.31 12.27 0.08 0.33 Methane 13.08
0.00 0.00 Ethylene Ethane
0.00 0.00 0.00 0.00 0.00 0.00 Propene 0.00 0 . 0 0 a 0.00 Propane
1,3-Butadiene 0.00
0.00 000 0.00 0.00 0.00 0.00 1-Butene
0.00 0.00 0.00 i-Butane 0.00 0.00 0.00 n-Butane
0.00 0.00 0.00 1-Pentene 0.00 0.00 0.00 n-Pentane
n-Hexane 0.00 0.00 0.00 0.01 0.00 Water 0.55 0.00 0.00 0.00 Ammonia 0.00 0.00 0.00 Glycol
100 00 2.51 0.57 Total 0.00 0.00 Total VOC 000
0030030-10/21/2005 URM Page 12 of 12

Table 3-S Estimated Flare Emissions Air Liquiiie Hydrogen Plant Operational Emissions
1. NOx and CO Factors 0.068 lb NOx/MMBtu (Callidus-supplied factor)
054% lb CO/MMBtu (TCEQ factor for non-steam assist, low-Btu flare) 98% DREforCO
U. Summary
Source Pollutant [b/hr try Hlol/Swegp Emissions NOx 005 0J0
CO 037 1M
111. Calculations
A. Pilot Emissions 6 Pilots
91.9 scfh/ pilot. Natural Gas 551.4 scfh total for pilots 116.7 scfh sweep pis. Natural Gas 668.1 scfh total for pilots and sweep gas 1020 Btu/scf, Natural Gas HI IV
10 ppmv Sulfur in KG NOx
0.068 lb NO* MMBtu - 0.0463394 lb NOx 668.1 scfNG 1020 Btu 1 hr scfNG MMBtu Btu hr 1000000
0.05 lb NOx - 0.2029666 tons NOx 8760 hr I ton 2000 lb hr n
S22 MMBtu - 03745315 lb CO 0.5496 lb CO 668.1 scfNG 1020 Btu 1
hr sdN'G 1000000 Btu hr MMBtu
= 1.640448 tons CO lb CO 8760 hr 037 1 ton 2000 lb hr JGL y
S02 IbS = 0.0005549 IbS Ibmol S scfNG 32 ft3S 668 1 1 10
hr IbmoJ 5 3853 ft3 S ft3 NG hr 1000000
0.001 lb 502 IbS02 IbS 0.0006 t>4 hr IbS 32 hr
0.005 tonsSO?1 lbS02 8760 hr 000 1 ton
l b 2000 hr 1L V
0030030 10/21/2005 P i p I oi J

Table 3-8
Estimated Flare Emissions Air Liquide Hydrogen Plant Operational Emissions
B. Customer Constraint 3.40 mmsdh ot hydrogen
6 events per year 3.75 hours per event 325 Bmyscf. HHV Hydrogen
NOx 3.40 7514 lb NOx mmsd i 12 325 MMBtu 0068 lb CO
MMBtu hr mmsd hr
75.14 tb NOx 375 hours 6 0.85 tons NOx 1 events ton hr 2000 lbs event w n
C Loss of PSA 6.41 mmsdh syngas
0.0512 sd Methane/sd Syngas 1012 Eku/sd, methane
290.18 Btu/sd, syngas 700.1 Ibmol/hrCO
28 lb CO/lbmol 98X DRH for CO
1 event/yr 4.8 hrs/event
£2 thermaj
18154 lb CO 0.5496 lb CO -6.41 mmscf Syngas 0.(512 scf Methane MMBtu 1012 hr scf Syngas MMscf MMBtu hr
datrot/ed = | 332.06 lb CO tbmol CO lb CO ORE 700.10 28 0.98
Ibmol CO hr hr
138 tons CO 574.59 hrs lb CO 4.8 1 I ton event lbs 2000 hr event
NOx 126.48 lb NOx 290.18 MMBtu 0.068 lb NOx mnurf Syngas 6.41
hr MMScf SG MMBtu hr
030 tons NOx 4.8 hre lb NOx 1 126.48 1 ton event lbs 2000 hr event i i yr
ocaoaa- iD/Ji/axs P» tf 2o( 3

Table 3-8 Estrmatrd Flare Emissions Air Ltquide Hydrogen Plant Operational Emissions
P. PSA Maintenance Since the PSA has 12 beds, emissions are estimated by taking 2/12ths of the emissions from losing the entire PSA.
b events/yr 1 hr/eveiU
21.08 Jb/hr 0.06 tpy
NOx
CO 9577 Ib/hr 0.29 tpy
E. Plant Maximum flaring will occur when the plant is operating at 50% capacity. Therefore, emissions are estimated by taking 1/2 of the Loss of PSA cas*.
2 events/yr 8 hrs/event
63.24 lb/ hr 0.51 tpy
NOx
2S730 Ib/hr 2-30 tpy
CO
F. Contfacmal Outage Maximum flaring will occur when the plant is operating at 50% capacity. Therefore, emissions are estimated by taking 1/2 of the Loss of PSA case
4 events/yr 8 hrs/event
63.24 Ib/hr 1.01 tpy
NOx
287JO Ib/hr 4.60 tpy
CO
Total Estimated FUre Process Emissions
] 273 tpy NOx
] 8 5 6 fry CO
(10X030 10/n/200S P. ig i 3 o l 3

Table 4-4 Summary of Total Speciated Emissions from Fugitive Components Air Liquide Hydrogen Plant Operational Emissions
Component Emissions Ib/hr tpy
Hydrogen 0.21 0 05 Nitrogen 000 0.01 Argon 000 0.00 Oxygen 000 0.00 Carbon dioxide 0.02 0.01 Carbon monoxide 0.00 000 Methane 058 Z54 Ethylene 0.00 0.00 Ethane 003 0.15 Propene3 00075 0.0017 Propane 0.03 014 1,3-Butadiene2 0.0006 00024 1-Butene 0.00 000
0.05 i-Butane 001 0.40 n-Butane 009
1-Pentene 000 0.00 002 n-Pentane 0.00
n-HexaneJ 0.0037 0.0009 036 0.08 Water
0.00 0.00 .mmonia 0.55 Glycol 0.12
4.48 "otal 1.02
[Total POC' 1.17 0.27 'Excludes methane and inorganic ^AC species
0030030 -10/21/2005 ERM

I
Table 4-5 TAC Emissions from the Cooling Tower Ah Liquide Hydrogen Plant Operational Emissions
E»limated Bleach Use Chemical
Concentration
Water C h l o r i n e C h l o r i n e
H o u r l y 1
Igal /hi)
CI , UMK«3 C h l o r o f o r m E m i f s i o n s 4 Circula t ion Rate A n n u a l Density E m i s s i o n s l -miss ions
(galfrr) (Ib/hr) ( i tvV««) (lb|iyeir) Drift Lo» (Ib/hr) (ppmw) ( Ib / ip l ) IgP" ' ) ( lb/hr) Qb/yrl 0 000005 0 0000005 3.600 9,777 0 3 100 1 9 3 3 l.HE-03 1 . 1 4 50E-06 0 0395 8.34
1 Based on a dai ly circulat ion ra te of 5.2 M M g a J / d a y . 2 CalculMed based on a p rev ious ly pe rmi t t ed cool ing lower . Uni t 236.
X t ra l /hr
M i l g p m
I
1.7 e a l / h r 5300 gpnt (f luid C P Uiul 236 ULIUW}
1.1161 g a l / h x % M
^Chlor ine (CI)) u sage ba.scd on bleach densi ty of 10 l b / g a l , 12 5 wt.% K A O O , 0 , 6 0 l h C l / g a l a n d 0.3 lb C ^ / g a l 4 Chloroform (CHCIj ) emiss ions are c a k u l a t c d u s i n g a n emiss ion fac tor of 0.0034 lb C H G j / lb CJ^
The emission factor is f r o m Proposed Identi/rcatWH of Chloroform As a Toxic Air Cotitaminant, CARB, 9 /90 .
Es t imated Bleach Use
a2 Usage* Ch lo ro fo rm Emissions4 Circula t ion Rate B A A Q M D
Source bio
ConocoPhi l l ips
Unil
H o u r l y Annua l
M/M ( l b /h r ) ( l b / year) ( l b / h r )
I 68E-03
( l b / y e a r ) (CT"") 5,500 4 . 3 4 0 453 236 14,465 0 5 14 8
Page 1 o f \ BRM 0030030 • io /2 i / :oos

I
I
Table 4-6 TAC Emissions from the Flare Pilots Air Liquide Hydrogen Plant Operational Emissions
Hourly Emissions Annual Emissions * Natural Gas
Flowratc Natural Gas
Emission Factor (Ib/hr) (Ib/yr)
Flare Pilots (Ib/MMcf) (MMc^hr) Pollutant Flare Pilots Benzene 8.52E-05 0.159 5.36E-04 7.46E-01
Fornialdehvile 6.26E-04 1.169 5.36E-04 5.48E+00 ni Naphthalene 5.36E-04 7.50E-U6 0.014 6.57E-02
Acelaldehyde 2.30E-05 0.043 5.36E-04 2.02E-01 Acrolein 5.36E-06 0.01 536E-04 4.69E-02
Propylene 5.36E-04 1.31E-03 2.44 1.14E+01 Toluene 3.11E-05 0.058 5.36E-04 2.72E-01 Xylenes 0.029 1.55E-05 1.36E-01 5.36E-04
Ethylbenzene 7 73E-04 6 78E+00 1.444 5.36E-04 5.36E-04 l,55E-05 1.36E-01 Hexane 0 029
Source: VCAPCD AB2588 Combustion Emission Factors (5/17/01) Notes: (1) Assume PAH is naphthalene
This tab not included in permit application calculation appendix
0030030 -10/21/2005 ERM

APPLICATION' FOR AUTHORITY TO CON'STRUCTi
E3 AIR UQUIDE !
Rodeo, California
Hydrogen Plant Project Application for Authority to Construct
and Major Facility Review Permit
Project Update Document
September 2006
0027630
Environmental Resources Management 1777 Botelho Drive, Suite 260
Walnut Creek, California 94596

A I R L I Q U I D E n Bay Area Air QualiK' Management District 939 Ellis Street San Francisco, CA 94109
Attn: Engineering Division
Re: Application for Authority to Construct and Major Facility Review Permit Hydrogen Plant Project Air Liquide Large Industries U.S. LP
Dear Sir or Madam:
Enclosed, please find one ropy of the above referenced application for a new Hydrogen Plant The plant will be owned, constructed, and operated by Air Liquide Large Industries U.S. LP at the ConocoPhillips Refiner)' in Rodeo, California. This project is a component of a related project, ConocoPhillips Clean Fuels Expansion Project.
Thank you for your prompt attention to this application. 1/ you have any questions, please contact me at 713-624-8288 or at [email protected].
Regards,
Tobey A. Taylor Environmental Specialist
C C Brenda Cabral, BAAQMD Chris Knowles, Air Liquide Valerie Uyeda, ConocoPhillips Lynn McGuire, ERM
i
AIR LIQUIDE LARGE INDUSTRIES U.S LP 2/00 Pes) Oak Etoievaid. Suite 1800. Housion, TX 77056 Maitag Address P O. Box 460229, Houston, TX 77056-3229 Phone 713-62*M5QOC

PROPOSED
ENGINEERING EVALUATION Air Liquide Large Industries , U.S. LP; Facility B7419
APPLICATION NO. 13678
March 13, 2007
1

PROPOSED-March 13, 2007
Table of Contents
3 1. BACKGROUND
5 2. EMISSIONS
13 3. BEST AVAILABLE CONTROL TECHNOLOGY (BACT)
17 4. CUMULATIVE INCREASE AND OFFSETS
18 5. STATEMENT OF COMPLIANCE
29 6. RECOMMENDATIONS
29 7. PERMIT CONDITIONS
41 APPENDIX A
51 APPENDIX B
2

PROPOSED-March 13, 2007
1. BACKGROUND
Air Liquide has submitted an application to build a hydrogen plant at the ConocoPhillips refinery in Rodeo. This is part of ConocoPhillips "Clean Fuel Expansion Project (CFEP)." The purpose of the project is to process heavy gas oil that Conoco produces at the coker crude unit, coker, and pre-fractionator into gasoline and diesel fuel.
Conoco needs more hydrogen than it can currently produce to process the heavy gas oil. Air Liquide will build a new hydrogen plant on site and will retain ownership of the plant and operate it. However, Conoco will use all of the facility's output. BAAQMD Regulation 2-1-213 defines facility as:
"Any property, building, structure or installation (or any aggregation of facilities) located on one or more contiguous or adjacent properties and under common ownership or control of the s a m e person.. ."
The hydrogen plant will be on Conoco property, so it meets the conditions of "contiguous or adjacent." In addition, the hydrogen plant will take its feed from the refinery. Conoco will direct the hydrogen plant to produce the amount of hydrogen that it needs at any time, so the hydrogen plant is considered to be under Conoco's control. Therefore, the hydrogen plant will be considered to be part of the refinery.
Since it is part of the refinery, the two projects (CFEP and hydrogen plant) will be considered as one project for the purposes of NSR, PSD, Major Facility Review (Title V), offsets, NSPS, NESHAPS, and any other applicable requirements.
The Title V regulations in 40 CFR 70 allow agencies to issue more than one Title V permit to a facility. Because the hydrogen plant will be owned and operated by Air Liquide, it will have a separa te plant number, B7419, and a separa te application, No. 13678.
The ConocoPhillips Carbon Plant, Plant A0022, is owned and operated by ConocoPhillips. It is contiguous to the refinery. Although it has a separate plant number and Title V permit, it is also considered part of the facility. The applicant will reduce emissions at the carbon plant to obtain reductions in actual emissions of PM10 for the purposes of CEQA and contemporaneous offsets of SO2.
The list of equipment at the proposed Air Liquide plant is shown below: 51, Hydrogen Plant, 120 MMscf/day, including HRSG and steam turbine
generator (12 MW) 52, Hydrogen Plant Furnace, 1,072 MMbtu/hr abated by A1, SCR 53, Hydrogen Plant Flare, 2200 MMbtu/hr 54, Cooling Tower, 3,700 gpm 55, Ammonia Tank, 10,000 gal-19% aqueous ammonia
3

PROPOSED-March 13, 2007
Evaluation Report, Application No. 13678, Air Liquids Large Industries US L.P., Facility B7459
A1, Selective Catalytic Reduction Unit abating S2, Hydrogen Plant Furnace
S4, Cooling Tower, is exempt from permits because BAAQMD Regulation 2-1-128.4 exempts water cooling towers provided that the source does not require permitting pursuant to BAAQMD Regulation 2-1-319. This section would require permits if the source emits more than 5 tons per year of any regulated air pollutant. Some large cooling towers emit enough POC or PM10 to require permits. This cooling tower will have permit conditions requiring monitoring to ensure that the emissions of POC and PM10 each do not exceed the amounts stated in the application.
S5, Ammonia Tank, is exempt from permits because BAAQMD Regulation 2-1-113.2 exempts vessels used exclusively for the storage of any aqueous solution containing less than 1% organic compounds by weight provided that the source does not require permitting pursuant to BAAQMD Regulation 2-1-319. This section would require permits if the source emits more than more than 5 tons per year of any regulated air pollutant or the source emits more than the trigger level for any toxic air contaminant. The tank is a pressure tank and is unlikely to emit more than the trigger level of ammonia (7,700 lb) in any year.
Air Liquide will use the excess heat generated at the hydrogen plant to make steam and will provide steam to ConocoPhillips. This will enable ConocoPhillips to shut down an older 256 MMbtu/hr boiler, S8. Air Liquide will also use steam to power a steam turbine to generate electricity for its own use and for ConocoPhillips. A maximum of 12 MW will be generated; 4.5 MW will be used by the new hydrogen plant. ConocoPhillips will use the remainder.
4

PROPOSED-March 13, 2007
Evaluation Report, Application No. 13678, Air Liquids Large Industries US L.P., Facility B7459
2. EMISSIONS Following is a summary of the proposed emissions of NOx, SO2, PM10, POC, and CO in tons per year from the proposed Air Liquide hydrogen plant. The annual emissions are calculated for the average operating rate of 975 MMbtu/hr. The maximum daily emissions are calculated for the maximum operating rate of 1,072 MMbtu/hr.
Summary of Hydrogen Plant Emiss ions
Tons per Year
Source NOx SO2 PM10 POC CO (975 MMBtu/hr,
34.2 annual average) New SMR Furnace 28.1 5.0 15.8 11.5 Deaerator Vent 0.8 Flare Pilots/NG Purge 0.12 0.004 1.1 Startup/Shutdown 2.7 0 0 0.1 11
Cooling Tower 0.5 1.5
Fugitives 1.5
Total 30.9 5.0 16.3 15.4 46.2
Lb per Day
Source NOx SO2 PM10 POC CO (1072 MMBtu/hr, hourly maximum) New SMR Furnace 169 30 95 69 206
Deaerator Vent 4.4 Flare Pilots/NG Purge 0.68 0.022 5.9
Cooling Tower 2.5 8
Fugitives 8.2
Total 170 30 97.5 89.9 21 2
Air Liquide has calculated the maximum daily emissions for the flare. If the pressure swing absorption process malfunctions, up to 6.41 MMscf/hr of syngas could be sent to the flare for 4.8 hours/event. The composition of syngas is mainly hydrogen, methane, and CO, as shown below:
5

PROPOSED-March 13, 2007
Evaluation Report, Application No. 13678, Air Liquide Large Industries US L.P., Facility B7459
Component Hydrogen Nitrogen Carbon Dioxide Carbon Monoxide Methane Ethane Water
% by Weight % by Volume 13.4 73 0.2 <0.09
68.5 17 10.3 4 7.3 5
<0.001 <0.0001 0.3 0.2
In this case, approximately 686 lb NOx/day would be emitted and 3,537 lb CO/day would be emitted. In this case, the hydrogen plant and hydrogen plant furnace would shut down, so normal emissions would not be emitted concurrently with the flare emissions.
Lb per Highest Day
Source NOx SO2 PM10 POC CO Flare 686 0 negligible 0 3,537
The detailed calculations of the flare emissions are in Appendix A.
6

PROPOSED-March 13, 2007
Evaluation Report, Application No. 13678, Air Liquide Large Industries US L.P., Facility B7459
Following is the detail of the emissions of toxic air contaminants on which the health risk screening analysis was based. These emissions were based on a heat input rate of 1,100 MMbtu/hr to S2, Hydrogen Plant Furnace. The average hourly rate has been reduced to 975 MMbtu/hr, so the typical emissions will be lower. Also the proposed emissions of methanol have been reduced to 0.61 lb/day or 223 lb/yr. Emission factors from WSPA/API's Air Toxic Emission Factors for Combustion Sources Using Petroleum-Based Fuels, final report, Volume 2, Appendix B, April 14, 1998 have been used for the calculations of all emissions from the heater except ammonia and sulfuric acid mist. The ammonia calculations are based on the "ammonia slip", the ammonia that is lost when injected into A1, SCR, for NOx control. The sulfuric acid mist is based on the assumption that the ratio of SO2 to SO3 in combustion is 20:1, and that all SO3 becomes sulfuric acid mist. The detailed calculations are in Appendix B of the engineering evaluation for Application 13424.
Emiss ions (lb/yr) S2, Subs tance Hydrogen
Plant Fugitives
Total Annual Emiss ions
(lb/yr)
BAAQMD Trigger Level
(lb/yL)
Hydrogen Plant
Furnace
Deaerator Vent
Cooling Towera Flare Pilots
Acenaphthene 2.27E-02 2.27E-02 Acenaphthylene 1.49E-02 1.49E-02 Acetaldehyde 1.47E+02 2.02E-01 1.48E+02 6.40E+01 Acrolein 4.69E-02 4.69E-02 2.30E+00 Ammonia 4.82E+04 5.59E+03 0.00E+00 5.38E+04 7.70E+03 Antimony 4.98E+00 4.98E+00 7.70E+00 Arsenic 8.19E+00 8.19E+00 1.20E-02 Benzene 6.23E+02 7.46E-01 6.40E+00 6.24E+02
0.011b Benzo(a)anthracene 3.09E-01 3.09E-01
0.011b Benzo(a)pyrene 8.63E-01 8.63E-01
0.011b Benzo(b)fluoranthene 3.89E-01 3.89E-01
0.011b Benzo(k)fluoranthene 2.32E-01 2.32E-01
7

PROPOSED-March 13, 2007
Evaluation Report, Application No. 13678, Air Liquide Large Industries US L.P., Facility B7459
Emiss ions (lb/yr) S2, Subs tance Hydrogen
Plant Fugitives
Total Annual Emiss ions
(lb/yr)
BAAQMD Trigger Level
(lb/yL)
Hydrogen Plant
Furnace
Deaerator Vent
Cooling Towera Flare Pilots
1,3-Butadiene 4.84 1.10E+00 4.84E+00 Cadmium 9.52E+00 9.52E+00 4.50E-02 Chlorine 3.95E-02 3.95E-02 7.70E+00 Chloroform 9.94E+00 9.94E+00 3.40E+01 Chromium (Total) 1.03E+01 1.03E+01 1.30E-03 Chrysene 1.57E-02 1.57E-02 Copper 4.06E+01 4.06E+01 9.30E+01 Ethylbenzene 2.91 E+02 6.78E+00 2.98E+02 7.70E+04 Fluoranthene 2.95E-02 2.95E-02 Fluorene 1.04E-01 1.04E-01 Formaldehyde 1.07E+03 5.48E+00 3.00E+01 1.08E+03 n-Hexane 1.36E-01 7.50E+00 7.63E+00 2.70E+05 Indeno(1,2,3-cd)pyrene 9.93E-01 9.93E-01 0.011* Lead 4.71 E+01 4.71E+01 5.40E+00 Manganese 6.56E+01 6.56E+01 7.70E+00 Mercury 1.73E+00 1.73E+00 5.60E-01
1.75E+04 2.23+02 Methanol 1.75E+04 1.50E+05
Naphthalene 3.02E+00 6.57E-02 3.08E+00 5.30E+00 Nickel 9.08E+01 9.08E+01 7.30E-01 Phenanthrene 1.41 E-01 1.41E-01 Phenol 5.43E+01 5.43E+01 7.70E+03 Propylene 2.09E+01 1.14E+01 3.24E+01 1.20E+05 Pyrene 2.39E-02 2.39E-02
8

PROPOSED-March 13, 2007
Evaluation Report, Application No. 13678, Air Liquide Large Industries US L.P., Facility B7459
Emiss ions (lb/yr) S2, Subs tance Hydrogen
Plant Fugitives
Total Annual Emiss ions
(lb/yr)
BAAQMD Trigger Level
(lb/yr)
Hydrogen Plant
Furnace
Deaerator Vent
Cooling Towera Flare Pilots
Selenium 1.89E-01 1.89E-01 7.70E+02 Silver 1.55E+01 1.55E+01 Sulfuric Acid Mist 8.6E+02 8.6E+02 3.9E+01 Toluene 1.03E+03 2.72E-01 1.03E+03 1.20E+04 1,2,4-Trimethyl benzene Xylene (Total) 3.59E+02 1.36E-01 3.60E+02 2.70E+04 Zinc 2.00E+02 2.00E+02 1.40E+03
a Chloroform emissions from the cooling tower were calculated using an emission factor of 0.0034 lb CHCL3 per lb of Ch used to chlorinate the cooling waters. Emission factor is from Proposed Identification of Chloroform as a Toxic Air Contaminant (CARB, September 1990. http://www.arb.ca.gov/toxics/summary/chloroform_A.pdf). Ch usage based on bleach density of 10 lb/gal, 12,5 wt% NaOCL (avg. of 9-16% bleach solution), 0.3 lb C^/gal. b These subs tances are PAH derivatives that have OEHHA-developed Potency Equivalency Factors. These PAHs should be evaluated a s benzo(a)pyrene equivalents. This evaluation process consists of multiplying individual PAH-specific emission levels with their Potency Equivalency Factor, which is 0.1. The sum of these products is the benzo(a)pyrene equivalent level and should be compared to the benzo(a)pyrene equivalent trigger level.
This table shows the average hourly emissions of toxic air contaminants:
Emiss ions (lb/hr) Subs tance Hydrogen
Plant Fugitives
Total Hourly Emiss ions
(lb/hr)
BAAQMD Trigger Level
(lb/hr)
Deaerator Vent
Cooling Tower SMR Furnace Flare Pilots
Acenaphthene 3.07E-06 3.07E-06
9

PROPOSED-March 13, 2007
Evaluation Report, Application No. 13678, Air Liquide Large Industries US L.P., Facility B7459
Emiss ions (Ib/hr) Subs tance Hydrogen
Plant Fugitives
Total Hourly Emiss ions
(lb/hr)
BAAQMD Trigger Level
(lb/hr)
Deaerator Vent
Cooling Tower
SMR Furnace Flare Pilots
Acenaphthylene 2.02E-06 2.02E-06 Acetaldehyde 1.99E-02 1.99E-02 2.30E-05 Acrolein 5.36E-06 4.20E-04 5.36E-06 Ammonia 6.50E+00 0.00E+00 7.14E+00 7.10E+00 6.40E-01 Antimony 6.72E-04 6.72E-04 Arsenic 1.11E-03 1.11E-03 4.20E-04 Benzene 8.41 E-02 8.42E-02 2.90E+00 8.52E-05 Benzo(a)anthracene 4.17E-05 4.17E-05 Benzo(a)pyrene 1.16E-04 1.16E-04 Benzo(b)fluoranthene 5.25E-05 5.25E-05 Benzo(k)fluoranthene 3.13E-05 3.13E-05 1,3-Butadiene 5.53E-04 5.53E-04 Cadmium 1.28E-03 1.28E-03 Chorine 4.50E-06 4.60E-01 4.50E-06 Chloroform 1.13E-03 3.30E-01 1.13E-03 Chromium (Total) 1.39E-03 1.39E-03 Chrysene 2.12E-06 2.12E-06 Copper 5.47E-03 5.47E-03 2.20E-01 Ethylbenzene 3.93E-02 4.00E-02 7.73E-04 Fluoranthene 3.98E-06 3.98E-06 Fluorene 1.40E-05 1.40E-05 Formaldehyde 1.44E-01 1.45E-01 2.10E-01 6.26E-04 n-Hexane 8.56E-04 8.72E-04 1.55E-05 Indeno(1,2,3-cd)pyrene 1.34E-04 1.34E-04
10

PROPOSED-March 13, 2007
Evaluation Report, Application No. 13678, Air Liquide Large Industries US L.P., Facility B7459
Emiss ions (lb/hr) Subs tance Hydrogen
Plant Fugitives
Total Hourly Emiss ions
(lb/hr)
BAAQMD Trigger Level
(lb/hL)
Deaerator Vent
Cooling Tower
SMR Furnace Flare Pilots
Lead 6.36E-03 6.36E-03 Manganese 8.85E-03 8.85E-03 Mercury 2.34E-04 2.34E-04 4.00E-03 Methanol 2.00E+00 6.20E+01 2.55-02 Naphthalene 4.07E-04 4.14E-04 7.50E-06 Nickel 1.22E-02 1.22E-02 1.30E-02 Phenanthrene 1.90E-05 1.90E-05 Phenol 7.32E-03 7.32E-03 1.30E+01 Propylene 2.82E-03 4.13E-03 1.31E-03 Pyrene 3.22E-06 3.22E-06 Selenium 2.55E-05 2.55E-05 Silver 2.09E-03 2.09E-03 Sulfuric Acid Mist 9.8E-02 9.8E-02 2.6E-01 Toluene 1.39E-01 1.39E-01 8.20E+01 3.11E-05 1,2,4-Trimethyl benzene Xylene (Total) 4.85E-02 4.85E-02 4.90E+01 1.55E-05 Zinc 2.70E-02 2.70E-02
The detailed emission calculations for each source are in Attachment A.
The summary of the emissions for the whole project, which includes Applications No. 13424 for Facility A0016, ConocoPhillips, No. 13678 for Air Liquide, and No. 15328 for contemporaneous offsets from Facility A0022,
11

PROPOSED-March 13, 2007
Evaluation Report, Application No. 13678, Air Liquide Large Industries US L.P., Facility B7459
ConocoPhillips Carbon Plant, are contained in Application No. 13424. The discussion of emissions for the purposes of PSD applicability, CEQA, offsets, and BACT are also contained in Application No. 13424.
12

PROPOSED-March 13, 2007
Evaluation Report, Application No. 13678, Air Liquide Large Industries US L.P., Facility B7459
3. BEST AVAILABLE CONTROL TECHNOLOGY (BACT)
Following are the maximum daily emissions for the various sources:
Lb per Highest Day
Source NOx SO2 PM10 POC CO New SMR Furnace 169 30 95 69 206 Hydrogen Plant 12.6 Hydrogen Plant Flare 686 3,537 Cooling Tower 2.5 8
S1, Hydrogen Plant, is subject to BACT because it emits more than 10 lb/highest day of POC.
S2, Hydrogen Plant Furnace, is subject to BACT because it emits more than 10 lb/highest day of these pollutants: NOx, SO2, POC, CO, and PM10.
S3, Hydrogen Plant Flare, is subject to BACT because it emits more than 10 lb/highest day of these pollutants: NOx and CO.
The following source is not subject to BACT because it will not emit more than 10 lb/day of NOx, SO2, POC, CO, or PM10:
S5, Ammonia Tank
The following source is not subject to BACT because it is exempt from permitting in accordance with BAAQMD Regulation 2-1-128.4.
S4, Cooling Tower If the source emits more than 5 tons per year of any regulated air pollutant, it would still be subject to permitting in spite of the exemption.
The applicant estimates that emissions of POC will be less than 8.0 lb/day (1.5 tpy) and the emissions of PM10 will be less than 2.5 lb/day. POC levels in cooling towers can spike, however, if there is a leak in a heat exchanger. The permit will contain monitoring conditions to ensure that the POC emissions remain under 5 tons per year. It is far less likely that PM10 emission will be over 5 tons per year, especially with limits on dissolved solids content of the water.
S5, Ammonia Tank, will not have emissions of NOx, SO2, POC, CO, or PM10 and therefore is not subject to BACT.
S1, Hydrogen Plant
13

PROPOSED-March 13, 2007
Evaluation Report, Application No. 13678, Air Liquide Large Industries US L.P., Facility B7459
The components (valves, flanges, pumps, compressors, etc.) at the hydrogen plant and the deaerator vent are subject to BACT because they are estimated to emit more than 10 lb POC/highest day. BACT for petroleum refinery fugitive emissions in accordance with the Section 3 of the District's BACT handbook is:
• Graphitic gaskets for f langes • Live loaded packing systems and polished stems, or equivalent, for valves • "Wet" dual mechanical seals with a heavy liquid barrier fluid, or dual dry
gas mechanical seals buffered with inert gas for hydrocarbon centrifugal compressors
• Seal-less design or dual mechanical seals with a heavy liquid barrier fluid, or equivalent, for pumps
• Fugitive equipment monitoring and repair program for all components
BACT for the deaerator vent at hydrogen plants has not been hitherto defined. Air Liquide has proposed 4.35 lb POC/day at the vent. No other hydrogen plants in the Bay Area have m a s s emission limits on the deaerator vents. Source tests of the vents have shown much higher emissions. No BACT determinations or limits for deaerator vents were found in the EPA, ARB, or SCAQMD BACT Clearinghouses. SCAQMD does have Rule 1189 with a limit of 0.5 lb VOC/MMscf of H2 produced. This would be equivalent to 60 lb POC/day at the vent.
The above emission rate will be considered to be BACT for this source.
S2, Hydrogen Plant Furnace Air Liquide has proposed the following BACT levels for S2, Hydrogen Plant Furnace.
14

PROPOSED-March 13, 2007
Evaluation Report, Application No. 13678, Air Liquide Large Industries US L.P., Facility B7459
Emission Factor,
lb/MMbtu Pollutant Concentration Refe rence for BACT NOx 5 p p m v d @ 3 % O2 0 . 0 0 6 5 8 * S C A Q M D BACT
p p m v total S in R F G / N G S O 2 3 5 0 . 0 0 1 2 BAAQMD BACT (PSA/fue l g a s Mix)
lb/MMcf (natural A P 4 2 Sec t ion 1.4, Natural G a s C o m b u s t i o n (apply P M 1 0 3 .8 0 . 0 0 3 7
g a s ) 1/2 v a l u e s i n c e 5 0 % H 2 in fuel)
lb/MMcf (natural A P 4 2 Sec t ion 1.4, Natural G a s C o m b u s t i o n (apply P O C 2 . 7 5 0 . 0 0 2 7
g a s ) 1/2 v a l u e s i n c e 5 0 % H 2 in fuel)
C O 10 p p m v d @ 3 % O2 0 . 0 0 8 0 S C A Q M D BACT
*South Coast Air Quality Management District
These levels are lower than the levels in the District BACT/TBACT handbook. Air Liquide is relying on a top-down analysis of BACT for NOx and PM10 at the hydrogen plant that was performed by ConocoPhillips for Application 13424. This analysis is required as part of the PSD analysis. This analysis is attached in Appendix B. The furnace is compared to various recent hydrogen plant furnaces. These furnaces burn primarily pressure swing absorption gas (PSA gas), which results in lower emissions of NOx and CO than natural gas and refinery fuel gas (RFG). The applicant estimates that this furnace will burn approximately 85% PSA gas and 15% RFG/natural gas.
There are 4 BACT determinations by the SCAQMD for hydrogen plant furnaces with levels for NOx of 5 ppmdv @ 3% O2. This is the lowest NOx emission limit achieved in practice. BACT will be achieved by using SCR and by burning mostly PSA gas .
For particulate matter, the conclusion drawn by the top-down analysis was that only good combustion practice is considered to be BACT for controlling PM10 from gas-fired heaters. The level proposed by the applicant is equivalent to 0.0025 gr/dscf (assuming that the F-factor is the s a m e a s the F-factor for natural gas). This is lower than the 0.01 proposed for a 2,088 MMbtu/hr natural gas fired boiler proposed in SCAQMD BACT determination #427061 in 2006.
Also, SCAQMD BACT determination #411357 established that 0.0065 lb PM10/MMbtu was BACT (based on a limit of 3642 lb/mo, 780 MMbtu/hr, an assumption of 720 hr/mo. operation). Air Liquide has proposed 0.0037 lb PM10/MMbtu for this application.
For SO2, the level proposed compares favorably with the 40 ppm S in fuel a s H2S in SCAQMD BACT determination #411357 for a 780 MMbtu/hr steam reformer furnace with similar fuels, and very favorably with the 0.2 lb/MMbtu level in SCAQMD BACT determination #427061 for a 2,088 natural gas-fired boiler.
15

PROPOSED-March 13, 2007
Evaluation Report, Application No. 13678, Air Liquide Large Industries US L.P., Facility B7459
The proposed CO concentration of 10 ppm@ 3% O2 is equivalent to the last SCAQMD BACT determination #411357.
For POC, SCAQMD BACT determination #411357 determined that 0.0061 lb POC/MMbtu was BACT (based on a limit of 3399 lb/mo, 780 MMbtu/hr, an assumption of 720 hr/mo operation). Air Liquide has proposed 0.0027 lb POC/MMbtu for this application.
The District concludes that the levels proposed for S2, Hydrogen Plant Furnace, represent BACT.
Air Liquide is relying on a top-down analysis of BACT for NOx and PM10 at the hydrogen plant furnace that was performed by ConocoPhillips for Application 13424. This analysis is required a s part of the PSD analysis. The analysis is attached in Appendix B.
Air Liquide has also proposed a maximum emission rate during start-up, shutdown, and malfunction of 50 lb NOx/clock hour.
S3, Hydrogen Plant Flare The main purpose of the flare is to dispose of hydrogen and CO in an emergency for safety reasons. Hydrogen is not a pollutant.
The flare's emissions on the highest day may be up to 686 lb NOx/day and 3,537 lb CO/day, a s shown in the flare calculations in Appendix A. However, the flare will only be used occasionally when there is a shutdown, malfunction, during maintenance, or when there is a sudden drop in the refinery's use of hydrogen. The total annual emissions from the flare are estimated at 2.7 tpy NOx and 11 tpy CO. There are also small ongoing emissions from the flare pilots, which ensure that a flame is present at all times. Because the emissions of NOx and CO will be more than 10 lb/day on the highest day, the flares are subject to BACT.
The District's BACT/TBACT Workbook states that an enclosed ground level flare with a control efficiency of 98.5% for POC is BACT1. BACT1 for CO is undetermined at this point.
The applicant has stated that the flare is not subject to BACT for POC because the g a s e s sent to the flare do not contain more than 10 lb POC/day. Following is the gas composition:
16

PROPOSED-March 13, 2007
Evaluation Report, Application No. 13678, Air Liquide Large Industries US L.P., Facility B7459
Component Hydrogen Nitrogen Carbon Dioxide Carbon Monoxide Methane Ethane Water
% by Weight % by Volume 13.4 73 0.2 <0.09
68.5 17 10.3 4 7.3 5
<0.001 <0.0001 0.3 0.2
Because none on the components is considered to be POC, the flare is not subject to BACT for POC.
As shown in the flare calculations, the flare is a control device for CO and a generator of NOx. The calculations a s s u m e 98% control of CO.
Testing is not feasible for elevated flares because they are open and have no stack. If the flare were enclosed, it might be possible to test for destruction efficiency. It is likely that if the flare were enclosed, NOx emissions would rise and CO emissions would drop due to increased residence time. It is not sensible to specify an enclosed ground level flare simply to enable testing. Moreover, enclosed ground level flares are generally small. For example, the largest enclosed ground level flare at a landfill in the District, where these flares are commonly used, in the District has a capacity of 120 MMbtu/hr.
Due to the capacity of this flare (2,220 MMbtu/hr), District staff concluded that a ground-level enclosed flare was not feasible in this case. The facility will install an elevated flare. These flares are considered to have a control efficiency of 98% for CO.
4. CUMULATIVE INCREASE AND OFFSETS
The cumulative increase for the facility is shown below.
Tons per Year
NOx SO2 PM10 POC CO
Total 30.9 5.0 15.8* 13.9* 46.2 *The emissions from the exempt cooling tower at the hydrogen plant are not considered to be part of the cumulative increase and are not subject to offsets.
17

PROPOSED-March 13, 2007
Evaluation Report, Application No. 13678, Air Liquide Large Industries US L.P., Facility B7459
Offsets a re required by BAAQMD Regulation 2-2-302 for NOx and P O C b e c a u s e the emiss ions of the facility, which includes the Conoco refinery (Facility A0016) and the Conoco carbon plant (Facility A0022), will be grea ter than 35 tons per year. The refinery emitted approximately 335 tons NOx and 2 8 3 tons P O C and the carbon plant emitted approximately 532 tons NOx in 2005 according to District es t imates .
In acco rdance with BAAQMD Regulation 2-2-302.2, POC credits shall be used to offset part of the NOx increases .
Offsets a re required by BAAQMD Regulation 2-2-303 for SO2 and PM10 at major facilities. Conoco is a major facility for PM10 b e c a u s e the refinery emitted approximately 126 tons PM10 and the carbon plant emitted approximately 6 3 tons PM10 in 2005 according to District es t imates . It is a major facility for SO2 b e c a u s e the refinery emitted approximately 424 tons SO2 and the carbon plant emitted approximately 1212 tons SO2 in 2 0 0 5 according to District es t imates .
The discussion of offsets required and provided for this project can be found in the engineering evaluation for Application 13424.
5. STATEMENT OF COMPLIANCE BAAQMD Regulation 1, General Prov i s ions The District requires NOx CEMs from sou rce s that u s e SCR for control, therefore S2, Hydrogen Plant Furnace, is subject to 1-521 and 1-522. The source will a lso be required to have a CO CEM.
S2, Hydrogen Plant Furnace, will be subject to flow and ammonia injection monitoring and therefore will be subject to the parametr ic monitoring requirements in Section 1-523.
BAAQMD Regulation 2, Rule 1, General Requirements S4, Cooling Tower, is exempt from permits b e c a u s e BAAQMD Regulation 2-1-128.4 exempt s water cooling towers provided that the source d o e s not require permitting pursuant to BAAQMD Regulation 2-1-319. This section would require permits if the source emits more than more than 5 tons per year of any regulated air pollutant. S o m e cooling towers emit enough POC or PM10 to require permits. This cooling tower will have permit conditions requiring monitoring to e n s u r e that the emiss ions of POC and PM10 each do not exceed the amoun t s s ta ted in the application, which were 1.5 tons per year and 0.5 tons per year, respectively.
18

PROPOSED-March 13, 2007
Evaluation Report, Application No. 13678, Air Liquide Large Industries US L.P., Facility B7459
S5, Ammonia Tank, 10,000 gal, is not required to have a permit b e c a u s e the s to rage of a q u e o u s solutions that contains less than one percent by weight organic compounds is exempt in a c c o r d a n c e with Section 123.2. The tank will be a p re s su re vesse l with a nitrogen blanket. It will s tore 19% a q u e o u s ammonia . The ammonia concentration will be limited to 19% b e c a u s e s to rage of higher concentrat ions is subject to 40 CFR 68, Accidental Re lease .
BAAQMD Regulation 2, Rule 5, New S o u r c e Review Of Toxic Air Contaminants In acco rdance with BAAQMD Regulation 2, Rule 5, health risk a s s e s s m e n t analysis w a s prepared by the facility and reviewed by District Staff. The project risk, including Plant A0016, ConocoPhillips refinery, m e e t s the requirements a s follows:
• Project cance r risk is less than 10.0 in a million; • Project chronic hazard index is less than 1.0; and • Project acu te hazard index is less than 1.0.
The cance r risk for S2, Hydrogen Plant Furnace, is greater than 1.0 in a million. Therefore, the source is subject to TBACT in a c c o r d a n c e with Section 2-5-301 of the rule. TBACT is the u s e of extremely clean fuels. Approximately 85% of the fuel that will be burned in the Heater will be PSA gas , which is extremely clean and h a s very little sulfur.
Also, the risk a s s e s s m e n t for S2 is conservative, b e c a u s e it w a s b a s e d on an a v e r a g e heat input rate of 1,100 MMbtu/hr, but the final a v e r a g e heat input rate will be 975 MMbtu/hr, which is 12.8% less.
The chronic health index for all sou rce s is below 0.2.
BAAQMD Regulation 6, Particulate Matter and Visible E m i s s i o n s The following sou rce s a re the new s o u r c e s of particulate matter in this application:
52, Hydrogen Plant Furnace aba ted by A1, S C R 53, Hydrogen Plant Flare, 2200 MMbtu/hr 54, Cooling Tower, 3 ,700 gpm
S2, Hydrogen Plant Furnace, and A1, SCR, a re subject to Sect ions 6-301, 6-305, and 6-310 .3 of the regulation. Section 6-301 is a requirement that visible emiss ions may not exceed 1.0 Ringelmann for more than 3 min/hr. Section 6 -305 is a requirement that a unit may not emit visible particles that fall outside of the facility's property. Section 6-310 .3 is the grain-loading limit for hea t t ransfer operat ions of 0 .15 gr filterable particulate/dscf @ 6% O2. (The "gr" used in this
19

PROPOSED-March 13, 2007
Evaluation Report, Application No. 13678, Air Liquide Large Industries US L.P., Facility B7459
section m e a n s "grains," which a re equal to 1/7000 of a pound.) S2 burns g a s e o u s fuels and is expec ted to comply with t h e s e requirements .
S3, Hydrogen Plant Flare, is subject to Sect ions 6-301, 6-305, and 6-310 of the regulation. Section 6-310 is the general grain-loading limit of 0 .15 gr filterable particulate/dscf. S 3 burns g a s e s and is expec ted to comply with t h e s e requirements .
S4, Cooling Tower, is subject to Sect ions 6-301, 6-305, 6-310, and 6-311 of the regulation. The cooling tower is expec ted to comply with t h e s e requirements. Previous analysis for Application 10349 s h o w s that, for cooling towers, the amount of particulate matter is so small and the airflow is so large that compliance with 6-301, 6-310, and 6-310 is a s su red .
Compliance with Section 6-311 is on a p roces s weight basis . The flow rate of water for the cooling tower is 3 ,700 gal/min. This is equivalent to 1.85 million lb/hr. If the p roces s weight is over 57,320 lb/hr, the limit is 40 lb filterable particulate/hr. The emission rate shown in the calculations in Appendix A is 0.1 lb/hr, therefore the source will comply with Section 6-311.
BAAQMD Regulation 7, O d o r o u s E m i s s i o n s The purpose of Regulation 7 is the general control of odorous compounds . Most odorous pollutants a re handled generally. A few are mentioned by name. One of t h e s e is ammonia .
S1 Hydrogen Plant, and S2, Hydrogen Plant Furnace, a re sou rce s of ammonia . Section 7-303 limits concentration of ammonia from Type A emission points to 5000 ppm. Ammonia is used at S2 in the SCR for a b a t e m e n t of NOx. The hydrogen plant will emit up to 10 ppm of ammonia from the deaera to r vent. The hea te r will comply b e c a u s e it h a s a limit of 10 ppmv ammonia @ 3% oxygen, a s will the hydrogen plant b e c a u s e the concentration at the vent is low. The concentration of ammonia in the s tacks of both sou rces will be m e a s u r e d by source test after construction.
BAAQMD Regulation 8, Rule 2, Misce l laneous Operat ions The deaera to r vent at the Hydrogen Plant, S1, and the cooling tower, S4, will be subject to this rule. Section 301 h a s the following limit:
"A person shall not d ischarge into the a tmosphe re from any miscel laneous operation an emission containing more than 6 .8 kg. (15 lbs.) per day and containing a concentration of more than 300 PPM total carbon on a dry basis."
20

PROPOSED-March 13, 2007
Evaluation Report, Application No. 13678, Air Liquide Large Industries US L.P., Facility B7459
If the emiss ions at the deae ra to r mee t 4 .35 lb/day a s s ta ted by the applicant, the deaera to r will comply easily. Annual source tes t s will be required to e n s u r e compliance.
Cooling towers a re exempt from this rule, in acco rdance with Section 8-2-114, if bes t modern pract ices a re used. The District h a s determined "best modern practices" for cooling towers and h a s documented them in the engineering evaluation for ConocoPhillips' Application 10349 a s follows:
"... daily visual inspection, plus water sampling and analysis for indicators of hydrocarbon leaks once per shift, is the bes t modern practice."
S4, Cooling Tower, will not comply with best modern practices, and therefore is subject to Regulation 8, Rule 2. The engineering evaluation also determined that the margin of compliance for most refinery cooling towers is 1000:1. Therefore, the cooling tower will comply with Regulation 8, Rule 2.
BAAQMD Regulation 8, Rule 10, P r o c e s s V e s s e l Depressurizat ion The Hydrogen Plant, S1, will be subject to this rule. Section 301 of the rule requires that the emiss ions during depressurizing be controlled by an aba t emen t device or the fuel g a s sys tem until the vesse l is a s c lose to a tmospher ic p re s su re a s possible, but at least until the partial p ressu re of organic compounds in that vesse l is less than 4.6 psig.
Section 302 requires that no p roces s vesse l may be opened to the a t m o s p h e r e un less the internal concentration of total organic compounds h a s been reduced prior to r e l ease to a t m o s p h e r e to less than 10,000 parts per million (ppm), with the following exception. Vesse l s may be opened when the concentration of total organic compounds is 10,000 ppm or grea ter provided that the total number of such ves se l s opened with such concentration during any consecut ive five year period d o e s not exceed 10% of the total p roces s vesse l population, the organic compound emiss ions from the opening of t h e s e v e s s e l s d o e s not exceed 15 pounds per day and the ves se l s a re not opened on any day on which the APCO predicts an e x c e e d a n c e of a National Ambient Air Quality Standard for ozone or dec la res a Spa re the Air Day.
S1 is expec ted to comply with t h e s e requirements .
BAAQMD Regulation 8, Rule 18, Equipment Leaks The components-valves , f langes, pumps, compressors , p re s su re relief devices-are subject to this rule. The rule h a s total organic leak limits of 100 ppm for valves and f langes and 500 ppm for pumps, compressors , and p ressu re relief devices. This is a "work-practice" s tandard. The facility is obligated to test the componen t s for leaks on a periodic bas is and repair the leaks. A small
21

PROPOSED-March 13, 2007
Evaluation Report, Application No. 13678, Air Liquide Large Industries US L.P., Facility B7459
percen tage of non-repairable leaks a re allowed until the next turnaround or five years , whichever is sooner .
The facility will have an inspection program for this regulation and is expec ted to comply with t h e s e s tandards .
BAAQMD Regulation 8, Rule 28, Episodic R e l e a s e s from Pressure Relief D e v i c e s at Petroleum Refineries and Chemical Plants This regulation applies to p re s su re relief devices (PRDs) installed on refinery equipment. Section 8-28-302 applies to P R D s on new or modified equipment. It requires that t h e s e P R D s comply with all requirements of BAAQMD Regulation 2, Rule 2, including BACT. BACT1 at this time is a rupture disk with a vent to a fuel g a s recovery system, furnace, or flare with a recovery/destruction efficiency of 98%. All new PRDs installed pursuant to this project a re subject to this s tandard. The applicant h a s determined that the u s e of rupture disks is not feas ible at the hydrogen plant b e c a u s e of the high number of p re s su re cycles and high tempera tures . The hydrogen plant will be required to comply with BACT2, the requirement to vent to a fuel g a s recovery system, furnace, or flare with a recovery/destruction efficiency of 98%.
Permit conditions with the BACT requirement will be a d d e d to t h e s e units. The facility is expec ted to comply with this requirement.
BAAQMD Regulation 9, Rule 1, Sulfur Dioxide S2, Hydrogen Plant Furnace, and S3, Hydrogen Plant Flare, a re small sou rce s of SO2 emissions. T h e s e sou rce s a re not subject to the 300-ppm limit in Section 9-1-301 of the rule b e c a u s e the refinery complies with the exemption in Section 9-1-110. The exemption requires ground level monitoring and compliance with the ground level concentration limit.
BAAQMD Regulation 9, Rule 3, Nitrogen Ox ides from Heat Transfer Operat ions S2, Hydrogen Plant Furnace, is subject to the rule b e c a u s e it applies to new heat t ransfer operat ions with a maximum heat input grea ter than 250 MMbtu/hr, per Section 9-3-303. The source will easily comply with the 125 ppm limit for g a s e o u s fuels b e c a u s e it is des igned to comply with the 5 ppm @ 3% O2 BACT limit.
BAAQMD Regulation 9, Rule 10, Nitrogen Oxides and Carbon Monoxide from Boilers, S t e a m Generators and P r o c e s s Heaters in Petroleum Refineries
22

PROPOSED-March 13, 2007
Evaluation Report, Application No. 13678, Air Liquide Large Industries US L.P., Facility B7459
S2, Hydrogen Plant Furnace, is not subject to this regulation b e c a u s e it applies to affected units. Affected units a re defined by Section 9-10-220 a s "any petroleum refinery boiler, s t eam generator , or p roces s heater . . . having an Authority to Construct or a Permit to Opera te prior to January 5, 1994." This hea te r will be subject to current BACT limits for NOx and CO, which a re more stringent, instead of the Regulation 9, Rule 10, limits.
BAAQMD Regulation 12, Rule 11, Flare Monitoring at Petroleum Refineries and BAAQMD Regulation 12, Rule 12, Flares at Petroleum Refineries S1, Hydrogen Plant, will have a hydrogen plant flare for the purpose of flaring hydrogen and p ressu re swing absorption g a s if there is an upset . BAAQMD Regulation 12, Rules 11 and 12, apply to petroleum refineries, which a re defined for the pu rposes of the rule as:
"A facility that p r o c e s s e s petroleum, a s defined in the North American Industrial Classification Standard No. 32411 and including any assoc ia ted sulfur recovery plant."
B e c a u s e the hydrogen plant will not p roces s petroleum, the hydrogen plant flare will not be subject to BAAQMD Regulation 12, Rules 11 and 12. The flare will be used exclusively to burn hydrogen, p ressu re swing absorption g a s that is genera ted by the plant, and natural g a s in the pilots for the flare. All three of t h e s e material a re low in sulfur b e c a u s e the f eed to the hydrogen plant is low in sulfur and sulfur is removed from the f eed by a zinc oxide catalyst. If the feed to the hydrogen plant or the hydrogen plant fu rnace must be flared d u e to an upset, it will be burned in the refinery flares.
N S P S Subpar t D This subpar t applies to fossil-fuel fired s t eam generat ing units with a hea t input over 250 MMbtu/hr. The definition of fossil-fuel fired s team generat ing unit in Section 60.41(a) is "a fu rnace or boiler u sed in the p roces s of burning fossil fuel for the purpose of producing s team by hea t transfer." S2, Hydrogen Plant Furnace, is not subject to 40 CFR 60, Subpar t D, b e c a u s e it is primarily a fu rnace instead of a s team generat ing unit, although it d o e s gene ra t e s team. In any case , S2 would easily comply with the 0.1 lb particulate matter/MMbtu s tandard in Section 60.42(a)(1) the 20% opacity s tandard in Section 60.42(a)(2), and the 0.2 lb NOx/MMbtu. S2 is expec ted to emit about 0 .0037 lb PM10/MMbtu and 0 .00658 lb NOx/MMbtu. Since the fuel will be very clean, it is not expec ted to have any visible emissions.
The s tandard d o e s not contain a limit for sulfur dioxide for gaseous - fue led heaters .
23

PROPOSED-March 13, 2007
Evaluation Report, Application No. 13678, Air Liquide Large Industries US L.P., Facility B7459
Subpart Da This subpart applies to electric utility steam-generating units with an electrical output that is higher than 25 MW per Sections 60.40Da and 60.41 Da. Electricity will be generated at the hydrogen plant, but the output will be about 10.4 MW so S2, Hydrogen Plant Furnace, is not subject to the standard.
Subpart Db This subpart applies to steam generating units with a heat input over 100 MMbtu/hr. The definition of steam generating units in Section 60.41b excludes process heaters, so S2, Hydrogen Plant Furnace, is not subject to the standard.
Subpart Dc This subpart applies to steam generating units with a heat input over 10 MMbtu/hr and under 100 MMbtu/hr. The definition of steam generating units in Section 60.41c excludes process heaters, so S2, Hydrogen Plant Furnace, is not subject to the standard.
NSPS, Subpart J S2, Hydrogen Plant Furnace, and S3, Flare, will be subject to 40 CFR 60, Subpart J, Standards of Performance for Petroleum Refineries because they it will burn fuel gas a s defined by the NSPS: "any gas which is generated at a petroleum refinery and which is combusted."
The heater will be subject to the H2S limit for fuel in Section 60.104(a)(1) of 0.10 gr/dscf or approximately 160 ppm. S2 will comply with the limit because it will burn either complying refinery fuel gas that will be supplied by the refinery, natural gas, or PSA gas, which is derived from the complying refinery fuel gas or natural gas and therefore cannot contain more H2S than the limit.
Air Liquide will be responsible for continuously monitoring the H2S content of the refinery, natural gas, and PSA gas at S2, Hydrogen Plant Furnace, a s required by Section 60.105(a)(4). The permit conditions will also allow Air Liquide to install an SO2 CEM instead of monitoring the sulfur in the furnace and hydrogen plant feed a s allowed by 40 CFR 60.105(a)(3).
The flare will also be subject to the H2S limit for fuel in Section 60.104(a)(1). The standard states:
a) No owner or operator subject to the provisions of this subpart shall: (1) Burn in any fuel gas combustion device any fuel gas that contains hydrogen sulfide (H2S) in excess of 230 mg/dscm (0.10 gr/dscf). The combustion in a flare of process upset g a s e s or fuel gas that is released to the flare a s a result of relief valve leakage or other emergency malfunctions is exempt from this paragraph.
Process upset g a s e s are defined in Section 60.101 as:
24

PROPOSED-March 13, 2007
Evaluation Report, Application No. 13678, Air Liquide Large Industries US LP., Facility B7459
Process upset gas means any gas genera ted by a pe t ro leum ref inery process unit as a result of start-up, shut -down, upset or mal funct ion.
W h e n the hydrogen plant sends gases to the f lare due to a start-up, shu t -down upset or malfunct ion, the f lare wil l not be subject to Sect ion 60.104(a)(1) . However, w h e n the hydrogen plant sends gases to the f lare due to "customer constraint", "contractual outage", or p lanned maintenance, the f lare wil l be subject.
In any case, the f lare wil l comply wi th the s tandard because it wil l only burn c lean hydrogen or PSA gas. In those cases where the flare is subject to the standard, the facil ity will be required to monitor the H2S content of the gas cont inuously in accordance with Sect ion 60.104, unless the facility obtains an alternative monitor ing plan from USEPA.
EPA intends to propose changes to Subpart J in Apri l 2007, and finalize changes by Apri l 2008. If these changes al low the facility to monitor the H2S content in a different way or exempts some fuels from monitoring, the permit condit ion will allow Air Liquide to take advantage of changes in the standard when the changes are finalized.
MONITORING ANALYSIS S1, H y d r o g e n Plant is s u b j e c t to a n a n n u a l t h roughpu t limit, cumula t ive i n c r e a s e limits of 4 . 3 5 lb P O C / d a y f rom t h e d e a e r a t o r vent a n d 8 .2 lb fugit ive P O C / d a y , an a m m o n i a limit of 0 .64 Ib/hr f rom t h e d e a e r a t o r vent , a n d a limit on total sulfur in t h e f e e d to t h e h y d r o g e n plant. T h e h y d r o g e n plant is a l s o s u b j e c t to t h e c o m b i n e d o rgan i c c o m p o u n d limit in BAAQMD Regula t ion 8, Rule 2. T h e h y d r o g e n plant will b e sub jec t to a n a n n u a l s o u r c e tes t to d e t e r m i n e compliance with t h e d e a e r a t o r ven t limits. T h e o w n e r / o p e r a t o r will d e t e r m i n e compliance with t h e fugit ive P O C limit by us ing t h e m e t h o d s in BAAQMD Regula t ion 8, Rule 18, Equ ipmen t Leaks . T h e total sulfur con ten t of the f e e d to t h e h y d r o g e n plant will b e de t e rmined o n c e pe r w e e k at t he outlet of the z inc oxide f e e d treatment s y s t e m in the hydrogen plant by taking a g r a b s a m p l e a n d m e a s u r i n g it o n c e per week . Alternately, the owner /ope ra to r m a y install a n S 0 2 CEM on S2, Hydrogen Plant F u r n a c e s tack. Sulfur in the hydrogen plant f e e d is r e m o v e d by the z inc oxide f e e d t r ea tmen t sys t em. T h e plant h a s two b e d s of z inc oxide a n d monitors sulfur at t he outlet periodically. If the sulfur is r e m o v e d from the feed , the s y n g a s (PSA g a s ) that is fed to the hydrogen plant f u r n a c e a n d that provides approximately 8 5 % of the hea t input to the f u r n a c e should h a v e no sulfur.
Therefore , monitoring for sulfur in the f e e d is an effective me thod of ensur ing that t he s y n g a s h a s no sulfur. S ince the amoun t of zinc oxide should last at least nine months , monitoring on a weekly bas i s is sufficient monitoring. The owner /opera tor a lso h a s the option of installing an S 0 2 CEM on the S2, Hydrogen Plant Furnace, stack.
25

PROPOSED-March 13, 2007
Evaluation Report, Application No. 13678, Air Liquide Large Industries US L.P., Facility B7459
S2, Hydrogen Plant Furnace, has limits on hourly and annual heat input, concentration limits on NOx, CO, and NH3, lb/MMbtu limits on POC, SO2, and PM10, hourly and annual mass emission limits on NOx, CO, POC, PM10, and SO2, NH3, and sulfuric acid mist, and sulfur and H2S limits on the fuel. The heater will have a fuel meter to ensure compliance with the heat input limits. Since the heater is abated by SCR, it will have a NOx CEM to ensure that the abatement device is in compliance. A CO CEM is required by 40 CFR 63, Subpart DDDDD. The fuel gas will be monitored for H2S with a continuous emission monitor a s required by 40 CFR 60, Subpart J, unless EPA amends the standard to allow another monitoring method. In addition, total sulfur will be monitored 3 times/day. The owner/operator will perform an annual test for compliance with the POC, PM10, SO2, sulfuric acid mist, and ammonia limits. Non-compliance with the POC and PM10 limits are not expected at this source. Since the source will be permitted to emit about 24 tpy of ammonia, the owner/operator will develop a correlation between the ammonia concentration and the ammonia injection rate. After the correlation is developed, the owner/operator will monitor ammonia continuously via the injection rate.
S3, Hydrogen Plant Flare The flare is subject to annual limits for NOx, CO, POC, PM10, SO2 and a daily limit for NOx. Emissions will be monitored by installing a flow meter at the inlet to the flare and calculating the emissions for each event in the s a m e manner as shown in Appendix A.
If g a s e s are sent to the flare that are considered to be startup, shutdown, malfunction, or upset gases , the facility must monitor the g a s e s continuously for H2S in accordance with 40 CFR 60.104.
In addition, the flare is subject to standard conditions to determine if the 1.0 Ringelmann limit in BAAQMD Regulation 6-301 is exceeded during flaring events.
S4, Cooling Tower, is subject to monitoring of dissolved solids to ensure that the particulate matter emissions are a s described in the permit application. It is also subject to visual monitoring, and chlorine content monitoring to ensure that POC emissions are a s described. If POC emissions are found, the owner/operator must measure the POC emissions using EPA Laboratory Method 8015.
S5, Ammonia Tank: The tank is not expected to have emissions, so no monitoring has been imposed. Overall annual emission limits have been imposed in Condition 23181, parts B.1-B.3, to ensure that the emissions of the project are less than the emissions proposed by the applicant. The reason that this condition has been imposed is to allow the facility to exceed certain limits during startup and shutdown and still
26

PROPOSED-March 13, 2007
Evaluation Report, Application No. 13678, Air Liquide Large Industries US L.P., Facility B7459
comply with the annual limits. Part B.4 contains the monitoring and reporting for t h e s e limits.
CEQA The California Environmental Quality Act (CEQA) calls for a review of potential significant environmental impacts from proposed projects. This project h a s been determined to be subject to CEQA by the Contra Cos ta County Community Development Depar tment (CCCCDD). The CCCCDD is the Lead Agency for CEQA for this project. In a c c o r d a n c e with Regulation 2-1-310.3, the District may not i ssue an Authority to Construct for this project until final action h a s been taken by the Lead Agency. A draft Environmental Impact Report (EIR) w a s prepared by the CCCCDD in November, 2006. This EIR includes all sou rce s and activities that a re the subject of this application. The District is a responsible agency under CEQA and h a s provided c o m m e n t s to the CCCCDD on the draft EIR. T h e s e comments , a s well a s o thers received by CCCCDD have been a d d r e s s e d in a revised EIR.
(To be completed after appea l period.) On , the final EIR w a s certified by the Contra Cos ta County
, a mandatory 10-day appea l period Planning Commission. On for the EIR ended . Thus, the District may issue an Authority to Construct for this project.
NESHAPS 40 CFR 63, Subpart CC The deaera to r vents at the hydrogen plants a re not considered miscel laneous p roces s vents according to Section 60.641.
Relief valve d i scharges a re not considered miscel laneous p roces s vents.
40 CFR 63, Subpart DDDDD S2, Hydrogen Plant Furnace, is subject to 40 CFR 63, Subpar t DDDDD, National Emission S tandards for Hazardous Air Pollutants for Industrial, Commercial, and Institutional Boilers and P r o c e s s Heaters . The emission limit is 400 ppm CO. There a re no other limits for gaseous - fue led boilers. The s tandard also requires cont inuous CO monitoring.
40 CFR 70, Title V The facility is subject to the Title V program b e c a u s e it is part of a major facility (the ConocoPhillips Refinery and Carbon Plant) a s defined by BAAQMD Regulation 2-6-206. The definition of "Part 70 permit" in Section 70.2 acknowledges that a "group of permits" may cover a "source." (EPA's definition
27

PROPOSED-March 13, 2007
Evaluation Report, Application No. 13678, Air Liquide Large Industries US L.P., Facility B7459
of "source" is similar to the District's definition of "facility.") Because more than one permit may be given to a facility, the District may grant a separate permit to Air Liquide.
The District will propose the Title V permit after the District has received public comment on and finalized the conditions.
40 CFR 72-78, ACID RAIN Electricity will be generated using excess heat at the hydrogen plant. The hydrogen plant will not be subject to 40 CFR 72-78 because it will not sell electricity. The hydrogen plant or ConocoPhillips will consume all electricity that is produced. The standards apply only to "utilities," which are defined in 40 CFR 72.2 a s "any person who sells electricity."
PSD The discussion of the PSD analysis is contained in the engineering evaluation for Application 13424 and is hereby incorporated by reference.
28

PROPOSED-March 13, 2007
Evaluation Report, Application No. 13678, Air Liquide Large Industries US L.P., Facility B7459
RECOMMENDATIONS Issue a conditional authority to construct for the following sources:
51, Hydrogen Plant (120 MMscf/day) including HRSG and steam turbine generator (12 MW)
52, Hydrogen Plant Furnace, 1072 MMbtu/hr abated by A1, SCR 53, Hydrogen Plant Flare, 2200 MMbtu/hr
6.
Issue a letter of exemption to the following sources: 54, Cooling Tower, 3,700 gpm (exempt per BAAQMD Regulation
2-1-128.4) 55, Ammonia Tank, 10,000 gal 19% aqueous solution (exempt per
BAAQMD Regulation 2-1-113.2)
7. PERMIT CONDITIONS Any condition that is preceded by an asterisk is not federally enforceable.
CONDITION 23178 S1, Hydrogen Plant 1. The production of S1, Hydrogen Plant, shall not exceed 120 MMscf H2/day,
averaged over any consecutive 12-months. [Cumulative Increase]
The owner/operator of the electrical generator associated with the hydrogen plant shall not generate more than 12 MW at any time. The owner/operator shall ensure that the hydrogen plant or the refinery consumes all of the electricity that is produced by the generator. [2-1-301, 2-1-305]
The owner/operator shall not burn any fuel in the HRSG associated with the S1, Hydrogen Plant. [2-1-301, 2-1-305]
The owner/operator shall ensure that the emissions of POC from the deaerator vent at S1 do not exceed 4.35 lb/day. [2-1-301, 2-1-305, Cumulative Increase]
4.
The owner/operator shall ensure that the emissions of NH3 from the deaerator vent at S1 do not exceed 0.64 lb/hr. [Toxics Risk Management]
The owner/operator shall ensure that the fugitive emissions of POC from the components (valves, flanges, pumps, compressors, connectors, sample points, etc.) at the hydrogen plant do not exceed 3,000 lb/year. [Cumulative Increase, 2-1-305]
6.
29

PROPOSED-March 13, 2007
Evaluation Report, Application No. 13678, Air Liquide Large Industries US L.P., Facility B7459
The owner/operator shall ensure that the concentration of total sulfur in the feed to the hydrogen plant does not exceed 35 ppmv. [Cumulative Increase, 2-1-305]
The owner/operator shall measure total sulfur at the outlet of the zinc oxide feed treatment system in the hydrogen plant by taking a grab sample and measuring it once per week. Alternately, the owner/operator may install an SO2 CEM on S2, Hydrogen Plant Furnace stack. [BACT, Cumulative Increase]
No later than 90 days from the startup of S1 and every year thereafter, the owner/operator shall conduct a District-approved source test to determine compliance with the limit in Parts 4 and 5 for POC and NH3. The owner/operator shall conduct the POC source tests in accordance with the Manual of Procedures, Volume IV, Method ST-7 or EPA Method 25 or 25A. The owner/operator shall conduct the NH3 source tests in accordance with the Manual of Procedures, Volume IV, Method ST-1B. The owner/operator shall submit the source test results to the District staff no later than 60 days after the source test. [Cumulative Increase, 2-1-305]
9
10. The owner/operator shall ensure that all pressure relief devices on the process unit are vented to a fuel gas recovery system, furnace, or flare with a recovery/destruction efficiency of 98%. [8-28-302, BACT]
Fugitive Components at S1, Hydrogen Plant, and S2, Hydrogen Plant Furnace 11. The owner/operator shall equip all new light hydrocarbon control valves
installed at S1 and S2 with live loaded packing systems and polished stems, or equivalent.
[BACT]
12. The owner/operator shall equip all new flanges/connectors installed in the light hydrocarbon piping systems at S1 and S2 with graphitic-based gaskets unless the service requirements prevent this material. [BACT]
13. The owner/operator shall equip all new hydrocarbon centrifugal compressors installed at S1 and S2 with "wet" dual mechanical seals with a heavy liquid barrier fluid, or dual dry gas mechanical seals buffered with inert gas. [BACT]
14. The owner/operator shall equip all new light hydrocarbon centrifugal pumps installed at S1 and S2 with a seal-less design or with dual mechanical seals with a heavy liquid barrier fluid, or equivalent. [BACT]
15. The owner/operator shall establish a facility fugitive equipment monitoring and repair program in accordance with BAAQMD Regulation 8, Rule 18. [BACT, Regulation 8, Rule 18]
30

PROPOSED-March 13, 2007
Evaluation Report , Application No. 13678, Air Liquide Large Industries U S L.P., Facility B7459
16. The Owner/Operator shall submit a count of installed pumps, compressors, valves, and flanges/connectors every 180 days starting the startup date of the first unit, S1 or S2, until construction is complete. For flanges/connectors, the owner/operator shall also provide a count of the number of graphitic-based and non-graphitic gaskets used. The owner/operator has been permitted to install fugitive components (948 valves in gas service, 48 valves in light liquid service, 4,193 flanges in gas service, 98 flanges in light liquid service, 5 pumps in light liquid service, 4 sample connections in gas service, 3 compressors in gas service) with a total POC emission rate of 1.5 ton/yr. If there is an increase in the total fugitive component emissions, the plant's cumulative emissions for the project shall be adjusted to reflect the difference between emissions based on predicted versus actual component counts. The owner/operator shall provide to the District all additional required offsets at an offset ratio of 1.15:1 no later than 14 days after the submittal of the final POC fugitive equipment count. If the actual component count is less than the predicted, at the completion of the project, the total will be adjusted accordingly and all emission offsets applied by the owner/operator in excess of the actual total fugitive emissions will be credited back to owner/operator prior to issuance of the permits. [BACT, Cumulative Increase, Toxic Management]
17. In order to determine compliance with part 6, the owner/operator shall determine the daily emissions of fugitive components within 90 days of start-up, and within 30 days of the end of every calendar quarter thereafter. The owner/operator shall use the last concentration measured in accordance with BAAQMD Regulation 8, Rule 18, for each component. The owner/operator shall use the equations in ARB publication California Implementation Guidelines for Estimating Mass Emissions of Fugitive Hydrocarbon Leaks at Petroleum Facilities. [Cumulative Increase, 2-1-305]
CONDITION 2 3 1 7 9 S2, Hydrogen Plant Furnace 1. S2 shall use only pressure swing adsorption (PSA) off gas, refinery fuel gas
and pipeline quality natural gas as fuel. [Cumulative Increase, PSD]
Total fuel firing at S2 shall not exceed 9,636,000 MMbtu (HHV) over any consecutive 12-month period. [Cumulative Increase, PSD]
Total fuel firing at S2 shall not exceed 1,072 MMbtu (HHV) during any clock hour. [Cumulative Increase, PSD]
The owner/operator shall ensure that the feed to S2 does not contain more than 35 ppmv total sulfur. [BACT, Cumulative Increase, 2-1-305]
4.
The following emission concentration limits from S2 shall not be exceeded. These limits shall not apply during startup periods not exceeding 24 hours (72 hours when drying refractory or during the first startup following catalyst
31

PROPOSED-March 13, 2007
Evaluation Report, Application No. 13678, Air Liquide Large Industries US L.P., Facility B7459
replacement) and shutdown periods not exceeding 24 hours. The District may approve other startup and shutdown durations.
a. NOx: 5 ppmv @ 3% oxygen, averaged over any clock hour [BACT, PSD]
b. CO: 10 ppmv @ 3% oxygen, averaged over any 1 hour period [BACT] c. POC: 0.0027 lb/MMbtu, averaged over any 1 hour period [BACT] d. PM10: 0.0037 lb/MMbtu, averaged over any 1 hour period [BACT, PSD] e. SO2: 0.0012 lb/MMbtu, averaged over any 1 hour period [BACT] [BACT]
6. *The following emission concentration limits from S2 shall not be exceeded. NH3: 10 ppmv @ 3% oxygen (8 hr average) [Toxic Management]
7a. The following hourly mass emission limits from S2 shall not be exceeded. These limits shall not apply during startup periods not exceeding 24 hours (72 hours when drying refractory or during the first startup following catalyst replacement) and shutdown periods not exceeding 24 hours. The District may approve other startup and shutdown durations.
a. NOx: b. CO: c. POC: d. PM10: e. SO2:
7.5 lb per clock hour [BACT, PSD] 9.1 lb per clock hour [BACT] 3.5 lb per clock hour [BACT] 4.8 lb per clock hour [BACT, PSD] 1.5 lb per clock hour [BACT]
7b. The following hourly mass emission limit from S2 shall not be exceeded. 50 lb per clock hour [BACT, PSD] a. NOx:
[BACT]
*The following hourly mass emission limit from S2 shall not be exceeded. a. NH3: 6.5 lb per clock hour [Toxic Management]
The following hourly mass emission limit from S2 shall not be exceeded. a. Sulfuric acid mist: 0.098 lb per clock hour [Toxic Management, PSD]
9.
The following annual mass emission limits from S2 shall not be exceeded including periods of startup, shutdown, upset and malfunction: a. NOx: b. CO: c. POC: d. PM10: e. SO2: [Cumulative Increase]
10.
28.1 tons per any consecutive 12 months [BACT, PSD] 34.2 tons per any consecutive 12 months [BACT] 11.5 tons per any consecutive 12 months [BACT] 15.8 tons per any consecutive 12 months [BACT, PSD] 5.0 tons per any consecutive 12 months [BACT]
*The following annual mass emission limits from S2 shall not be exceeded including periods of startup, shutdown, upset and malfunction.
11.
32

PROPOSED-March 13, 2007
Evaluation Report, Application No. 13678, Air Liquide Large Industries US L.P., Facility B7459
a. NH3: 48,200 lb per any consecutive 12 months [Toxic Management]
The following annual mass emission limits from S2 shall not be exceeded including periods of startup, shutdown, upset and malfunction. a. Sulfuric acid mist: 860 lb any consecutive 12 months [2-1-305, Toxic Management, PSD]
12.
A1, SCR unit, shall abate the S2, Hydrogen Plant Furnace, at all times, with the following exceptions. Operation of A1 is not required for limited periods during startup and shutdown. S2 may operate without SCR abatement on a temporary basis for periods of planned or emergency maintenance. A District-approved NOx CEM shall monitor and record the S2 NOx emission rate whenever S2 operates without abatement. All emission limits applicable to S2 shall remain in effect even if it is not operated with SCR abatement. [BACT, Cumulative Increase]
13.
14a. The owner/operator shall test refinery fuel gas prior to combustion at S2 to determine total sulfur concentration with a total sulfur analyzer (Houston Atlas or equivalent) at least once per 8-hour shift (3 times per calendar day). At least 90% of these samples shall be taken each calendar month. No readable samples or sample results shall be omitted. To demonstrate compliance with Part 4, the owner/operator shall measure and record the daily average sulfur content. The owner/operator shall keep records of sulfur content in fuel gas for at least five years and shall make these records available to the District upon request. The owner/operator is not required to test PUC-quality natural gas for total sulfur. If the sulfur content of feed to S1, Hydrogen Plant, is monitored in accordance with Condition 23178, part 8, and the sulfur content is less than 35 ppmv, the owner/operator is not required to test PSA gas for total sulfur. [BACT, Cumulative Increase]
14b. If the owner/operator elects to install a SO2 CEM at the S2, Hydrogen Plant Furnace, stack, the owner/operator is not required to perform the monitoring in Condition 23178, parts 7 and 8 and Condition 23179, parts 4, 14a, and 15. In this case, the monitor shall comply with BAAQMD Manual of Procedures, Volume V, and 40 CFR 60.105(a)(3). The monitor shall be used to determine compliance with the SO2 limit in 40 CFR 60.105(a)(3) of 20 ppmd @ 0% O2, and the hourly limit in part 7a.
15. The owner/operator shall install, calibrate, maintain, and operate a District-approved continuous monitoring system and recorder for H2S in the gas that is burned by the heater. The owner/operator shall keep the H2S data for at least five years and shall make these records available to the District upon request. If USEPA amends 40 CFR 60, Subpart J, such that a continuous monitoring system is not required for this heater, the owner/operator will not be required to install the system. If the system has been installed, the owner/operator may remove the system. [40 CFR 60.105(a)(4), Cumulative Increase]
33

PROPOSED-March 13, 2007
Evaluation Report, Application No. 13678, Air Liquide Large Industries US L.P., Facility B7459
No later than 90 days from the startup of S2, the owner/operator shall conduct District-approved source tests to determine initial compliance with the limits in Parts 5, 6, 7, 8, and 9 for NOx, CO, POC, PM10, NH3, SO2, sulfuric acid mist, and POC. The owner/operator shall conduct the source tests in accordance with Part 18. The owner/operator shall submit the source test results to the District source test manager and the District Director of Compliance and Enforcement no later than 60 days after the source test.
16.
[BACT, Cumulative Increase, PSD]
On an annual basis, the owner/operator shall conduct District-approved source tests to determine compliance with the limits in Parts 5c, 5d, 5e, 7c, 7e, 7e, 8, and 9 for POC, PM10, NH3, SO2, and sulfuric acid mist. The owner/operator shall conduct the source tests in accordance with Part 18. The owner/operator shall submit the source test results to the District source test manager and the District Director of Compliance and Enforcement no later than 60 days after the source test.
[BACT, Cumulative Increase, PSD, Toxics Risk Management]
17.
18. The owner/operator shall submit protocols for all source test procedures to the District's Source Test Section prior to conducting any tests. The owner/operator shall comply with all applicable testing requirements for continuous emissions monitors as specified in Volume V of the District's Manual of Procedures. The owner/operator shall notify the District's Source Test Section, in writing, of the source test protocols and projected test dates at least 7 days prior to testing. [BACT, Cumulative Increase, PSD]
19. The following instruments shall be installed and maintained to demonstrate compliance with Parts 5a, 5b, 7a, 7b, 9a and 9b, BAAQMD Regulation 1-520 and 40 CFR 63, Subpart DDDDD: a. continuous NOx analyzer/recorder b. continuous CO analyzer/recorder c. continuous O2 or CO2 analyzer/recorder The instruments shall operate at all times of operation of S2 including start-up, shutdown, upset, and malfunction, except as allowed by BAAQMD Regulation 1-522, BAAQMD Manual of Procedures, Volume V, and 40 CFR 63, Subpart DDDDD. If necessary to comply with this requirement, the owner/operator shall install dual-span monitors. [1-520, BACT, Cumulative Increase, 40 CFR 63.7500, PSD]
20. The owner/operator shall equip S2 with a District-approved continuous fuel flow monitor and recorder in order to determine fuel consumption. A parametric monitor as defined in Regulation 1-238 is not acceptable. The owner/operator shall keep continuous fuel flow records for at least five years and shall make these records available to the District upon request.
[Cumulative Increase]
21. Ammonia (NH3) emission concentrations at the hydrogen plant stack shall not exceed 10 ppmv, on a dry basis, corrected to 3% O2, on a clock hour
34

PROPOSED-March 13, 2007
Evaluation Report , Application No. 13678, Air Liquide Large Industries U S L.P., Facility B7459
basis. This ammonia emission concentration shall be verified by the continuous recording of the ammonia solution injection rate to A1, SCR. The correlation between the heat input rates, the SCR ammonia solution injection rates, and corresponding ammonia emission concentration at the hydrogen plant stack shall be determined in accordance with permit condition 23. (Toxics Risk Management for NH3)
22. The owner/operator shall demonstrate compliance with part 21 by using a properly operated and maintained continuous monitor (during all hours of operation including start-up and shutdown periods) for the ammonia solution injection rate. The owner/operator shall record the ammonia solution injection rate every 15 minutes (excluding normal calibration periods) and shall summarize the ammonia solution injection rate for each clock hour. (Toxics Risk Management for NH3)
23. Within 60 days of start-up of the hydrogen plant furnace, the owner/operator shall conduct a District-approved source test on at the hydrogen plant stack to determine the corrected ammonia emission concentration to determine compliance with part 21. The source test shall determine the correlation between the heat input rates of the hydrogen plant furnace, the ammonia solution injection rate, and the corresponding ammonia emission concentration at the emission point. The source test shall be conducted over the expected operating range of the hydrogen plant furnace to establish the range of ammonia solution injection rates necessary to achieve NOx emission reductions while maintaining ammonia slip levels. Source testing shall be repeated on an annual basis thereafter. Ongoing compliance with part 21 shall be demonstrated through calculations of corrected ammonia concentrations based upon the source test correlation and continuous records of ammonia solution injection rate. Source test results shall be submitted to the District within 45 days of conducting the tests. (Toxics Risk Management for NH3)
24. The owner/operator shall comply with the applicable requirements of 40 CFR 63, Subpart DDDDD, National Emission Standards for Hazardous Air Pollutants for Industrial, Commercial, and Institutional Boilers and Process Heaters. (This part will be deleted after the Title V permit is issued.) [40 CFR 63, Subpart DDDDD]
CONDITION 2 3 1 8 0 S3, Hydrogen Plant Flare 1. The owner/operator shall ensure that only the following streams are sent to
S3, Hydrogen Plant Flare: a. Hydrogen b. Syn-gas c. Venting from the ammonia tank d. PSA Offgas
35

PROPOSED-March 13, 2007
Evaluation Report, Application No. 13678, Air Liquide Large Industries US L.P., Facility B7459
The owner/operator shall ensure that any feed for S1, Hydrogen Plant, or any fuel including natural gas that is provided to S2, Hydrogen Plant Furnace, is not flared in S3, Hydrogen Plant Flare.
The owner/operator shall ensure that S3, Hydrogen Plant Flare, is only used during startup, shutdown, upset, or malfunction of S1, Hydrogen Plant.
The owner/operator shall install a flow meter to determine the flow of gases to the flare. The flow meter shall comply with the requirements for flow meters in BAAQMD Regulation 12, Rule 11. [Cumulative increase]
The owner/operator shall ensure that the emissions of S3, Hydrogen Plant Flare, do not exceed the following limits: a. NOx: 2.8 tons/any consecutive 12 months b. CO: 12.1 tons/any consecutive 12 months c. NOx: 129 lb/any consecutive 60 minutes
4
The owner/operator shall estimate the emissions every month by using the flow data to the flare and estimating emissions using the emission factors provided in Application 13678.
6 If the limits in parts 4a and 4b are exceeded, the owner/operator shall apply to increase the annual limit within 60 days of determining that the limit has been exceeded, shall provide offsets for the increase in the limits. If the limit in part 4c is exceeded, the owner/operator shall determine using PSD modeling if the CAAQS or NAAQS for NO2 was exceeded during the event, and if so, shall report the exceedance to the BAAQMD Director of Enforcement and Compliance.
For the purposes of these conditions, a flaring event is defined as a flow rate of vent gas flared in any consecutive 15 minutes period that continuously exceeds 330 standard cubic feet per minute (scfm). If during a flaring event, the vent gas flow rate drops below 330 scfm and then increases above 330 scfm within 30 minutes, that shall still be considered a single flaring event, rather than two separate events. For each flaring event during daylight hours (between sunrise and sunset), the owner/operator shall inspect the flare within 15 minutes of determining the flaring event, and within 30 minutes of the last inspection thereafter, using video monitoring or visible inspection following the procedure described in Part 8. [Regulation 2-6-409.2]
The owner/operator shall use the following procedure for the initial inspection and each 30-minute inspection of a flaring event.
a. If the owner/operator can determine that there are no visible emissions using video monitoring, then no further monitoring is necessary for that particular inspection.
36

PROPOSED-March 13, 2007
Evaluation Report , Application No. 13678, Air Liquide Large Industries U S L.P., Facility B7459
b. If the owner/operator cannot determine that there are no visible emissions using video monitoring, the owner/operator shall conduct a visual inspection outdoors using either:
i. EPA Reference Method 9; or ii. Survey the flare by selecting a position that enables a clear view of the flare at least 15 feet, but not more than 0.25 miles, from the emission source, where the sun is not directly in the observer's eyes.
c. If a visible emission is observed, the owner/operator shall continue to monitor the flare for at least 3 minutes, or until there are no visible emissions, whichever is shorter. d. The owner/operator shall repeat the inspection procedure for the duration of the flaring event, or until a violation is documented in accordance with Part 9. After a violation is documented, no further inspections are required until the beginning of a new calendar day. [Regulation 6-301, 2-1-403]
9. The owner/operator shall comply with one of the following requirements if visual inspection is used:
a. If EPA Method 9 is used, the owner/operator shall comply with Regulation 6-301 when operating the flare. b. If the procedure of Part 8.b.ii is used, the owner/operator shall not operate a flare that has visible emissions for three consecutive minutes. [Regulation 2-1-403]
The owner/operator shall keep records of all flaring events, as defined in Part 7. The owner/operator shall include in the records the name of the person performing the visible emissions check, whether video monitoring or visual inspection (EPA Method 9 or visual inspection procedure of Part 8) was used, the results of each inspection, and whether any violation of this condition (using visual inspection procedure in Part 8) or Regulation 6-301 occurred (using EPA Method 9). [Regulation 2-1-403]
10.
11. The owner/operator will ensure that S3, Flare, complies with all applicable provisions of 40 CFR 60, Subpart J. This provision will be deleted when the applicable citations from this standard are incorporated into the Major Facility Review permit. [40 CFR 60, Subpart J]
CONDITION 2 3 1 8 1 A. Facility Conditions
*The owner/operator shall notify the District in writing by fax or email no less than three calendar days in advance of any scheduled startup or shutdown of any process unit, and, for any unscheduled startup or shutdown of a process unit, within 48 hours or within the next normal business day. The notification shall be sent in writing by fax or email to the Director of Enforcement and Compliance. This requirement is not federally enforceable. [Regulation 2-1-403]
37

PROPOSED-March 13, 2007
Evaluation Report, Application No. 13678, Air Liquide Large Industries US L.P., Facility B7459
2. The owner/operator shall ensure that the concentration of ammonia in the ammonia tank is less than 20% by weight so that 40 CFR 68, Accidental Release, does not apply. [2-1-305]
B. Project Mass Emission Limits 1. Following are the sources that are subject to the project mass emission
limits: 51, Hydrogen Plant including HRSG and steam turbine generator 52, Hydrogen Plant Furnace 53, Hydrogen Plant Flare
2. The owner/operator shall ensure that the annual emissions of the above sources do not exceed the following annual emission limits, including periods of startup, shutdown, malfunction, and upset emissions. a. NOx b. SO2 c. PM10 d. POC e. CO f. Sulfuric acid mist g. Ammonia
30.9 tpy 5.0 tpy 15.8 tpy 13.9 tpy 46.2 tpy 0.43 tpy 26.9 tpy
The owner/operator shall ensure that the daily emissions of the above sources do not exceed the following daily emission limit, including periods of startup, shutdown, malfunction, and upset emissions.
2.35 lb/day [PSD] a. Sulfuric acid mist
4. The owner/operator shall determine whether the emissions are below the allowable mass emissions for the above sources as shown below. The owner/operator calculate and report the emissions of NOX, SO2, PM10, POC, CO, ammonia, and sulfuric acid mist on an annual basis in the following manner.
The owner/operator shall the use the POC emission rate determined by the annual source test data at the deaerator for S1. The owner/operator shall use the data generated by the BAAQMD Regulation 8, Rule 18, monitoring to determine the annual POC emission rate for the components. The owner/operator shall use the mass emissions data generated by the NOx and CO CEMs at S2. The owner/operator shall use the monitoring for total sulfur in the feed to the hydrogen plant. The owner/operator shall use the monitoring for total sulfur in the feed to the hydrogen plant furnace. The owner/operator shall use the emission rates of sulfuric acid mist, PM10, POC, and CO determined in annual and semi annual source tests at S245 and the records of heat input to calculate emissions of sulfuric acid mist, PM10, POC, and CO. The owner/operator shall use the ammonia injection monitoring and the records of heat input to calculate emissions of ammonia.
a.
b.
d.
g.
38

PROPOSED-March 13, 2007
Evaluation Report , Application No. 13678, Air Liquide Large Industries U S L.P., Facility B7459
h. The owner/operator shall use the calculations of flare emissions required by BAAQMD Condition 23180, part 5.
[2-1-305]
If the annual emissions, as determined in part B.4, are above the allowable emissions for the project, the owner/operator shall supply additional offsets, where applicable, and perform additional analysis for PSD, if necessary. The results of the analysis shall be submitted to the Director of Compliance and Enforcement on an annual basis on the anniversary of the startup of S2, Hydrogen Plant Furnace.
The owner/operator shall comply with the requirements of BAAQMD Regulation 8, Rule 18. (This part will be deleted after the Title V permit is issued.) [BAAQMD Regulation 8, Rule 18]
CONDITION 2 3 4 1 4 S4, Cooling Tower 1. The owner/operator shall ensure that the cooling tower is designed to have
a drift of no more than 0.005% of total cooling water flow. [Cumulative Increase]
The owner/operator shall ensure that the dissolved solids content in the cooling water at S4, Cooling Tower, does not exceed 3000 ppm total dissolved solids. [Cumulative Increase]
The owner/operator shall take a sample and perform a visual inspection of the cooling tower water at the cooling tower on a daily basis to check for signs of hydrocarbon in the cooling water. (Regulation 2-6-503)
4. The owner/operator shall take a sample of the cooling tower water 3 times per week at the cooling tower and analyze for chlorine content as an indicator of hydrocarbon leakage into the cooling water. On a monthly basis, the owner/operator shall sample the water in the inlet line and in the return line of the cooling tower and determine the VOC content in each line using EPA laboratory method 8015. (Regulation 2-6-503)
The owner/operator shall maintain monthly records of sodium hypochlorite usage at each cooling tower above. (Regulation 2-6-501)
6. The owner/operator shall sample the cooling tower water at least once per month and subject the sample to a District approved laboratory analysis to determine its total dissolved solids content. (Regulations 2-6-503)
If the monitoring in part 3 or part 4 indicates that there is a hydrocarbon leak into the cooling water, the owner/operator shall submit a report to the Enforcement and the Engineering divisions at the District. The owner/operator shall submit reports on a weekly basis until the monitoring
39

PROPOSED-March 13, 2007
Evaluation Report, Application No. 13678, Air Liquide Large Industries US L.P., Facility B7459
indicates that no hydrocarbon leaks into the cooling water. (Regulation 1-441)
6 If the monitoring in part 3 or part 4 indicates a hydrocarbon leak, the owner/operator shall estimate the daily amount of VOC emitted using the following procedure. The owner/operator shall sample the water in the inlet line and in the return line and determine the VOC content in each line using EPA laboratory method 8015. This analysis shall be performed each week until VOC levels return to normal. The owner/operator shall report the VOC estimates to the Enforcement and the Engineering divisions at the District on a monthly basis. The owner/operator shall use the VOC estimates to confirm that no more than 5 tons VOC per year was emitted at the source. If more than 5 tons VOC per year is emitted at the source, the facility shall submit an application for a District permit within 90 days of determining that the source is subject to District permits. If the source requires a permit, the source shall be subject to BACT and offsets. (Regulations 1-441, 2-1-424, 2-6-416.2, 2-6-501, 2-6-503)
7. The owner/operator shall maintain the following records for five years from the date of record: a. Records of daily visual inspection b. Records of chlorine content 3 times per week c. Records of monthly usage of sodium hypochlorite d. Records of monthly determination of total dissolved solids e. Records of any indications of hydrocarbon leaks f. Records of any analyses of VOC content in cooling tower inlet and
outlet (Regulation 2-6-501)
By: Brenda Cabral Supervising Air Quality Engineer
Date
40

PROPOSED-March 13, 2007
Evaluation Report, Application No. 13678, Air Liquide Large Industries US L.P., Facility B7459
A P P E N D I X A
41

PROPOSED-March 13, 2007
Evaluation Report, Application No. 13678, Air Liquide Large Industries US L.P., Facility B7459
S1, Hydrogen Plant Emissions
The detailed calculations are available in electronic format upon request .
42

PROPOSED-March 13, 2007
Evaluation Report, Application No. 13678, Air Liquide Large Industries US L.P., Facility B7459
S2, Hydrogen Plant Furnace Emissions
The following emission calculations have been submitted by the applicant.
Hydrogen Plant Furnace Criteria Pollutant Emission Factors Air Liquide Hydrogen Plant Operational Emissions
Pol lu tant Emiss ion Factor EF ( lb /MMBtu) Reference
NOx 5 ppmvd @ 3 % O2 0 . 0 0 6 5 8 SCAQMD BACT
S O 2 3 5 p p m v total S in R F G / N G 0 . 0 0 1 2 BAAQMD BACT (PSA/fuel g a s Mix)
A P 4 2 Sect ion 1.4, Natural G a s Combus t ion PM10 3.8 lb/MMcf (natural g a s ) 0 . 0 0 3 7 (apply 1/2 va lue s ince 5 0 % H2 in fuel)
A P 4 2 Sect ion 1.4, Natural G a s Combus t ion P O C 2 .75 lb/MMcf (natural g a s ) 0 . 0 0 2 7 (apply 1/2 va lue s ince 5 0 % H2 in fuel)
C O 10 ppmvd @ 3 % O2 0 .0080 SCAQMD BACT
A s s u m p t i o n s for e m i s s i o n s fac tor tab le a b o v e :
(1) NOx, CO, and NH3 "ppm" emiss ion fac to r s conver ted to "lb/MMBtu" a s follows:
(x [lb/MMBtu]) = (y p p m @ 3 % O2) * (21% - 0%) / ( 2 1 % - 3%) * (EPA Fd Fac tor [ft3/MMBtu]) / (Molar Volume [ft3/lbmol]) *
(Molecular weight [lb/lbmol])
PM10 and P O C "lb/MMcf" emiss ion fac tors conver ted to "lb/MMBtu" a s follows:
(x [lb/MMBtu]) = (Emiss ion factor [lb/MMcf]) / (Natural g a s hea t con ten t [Btu/scf])
43
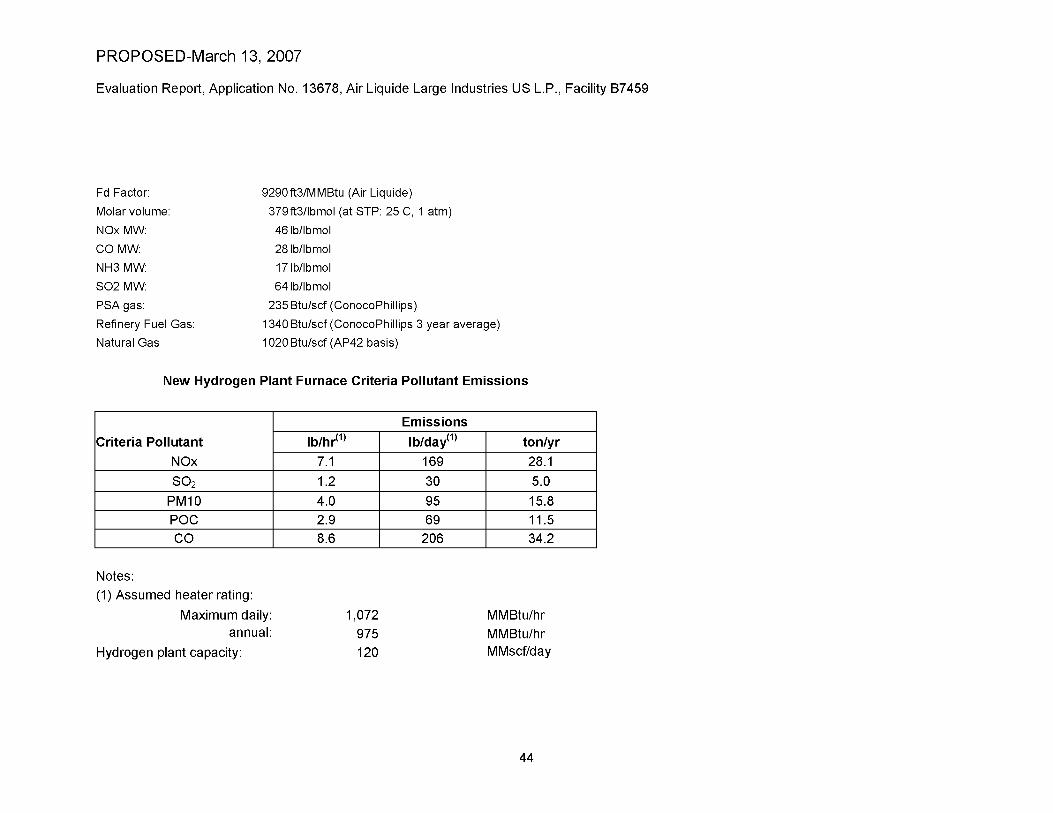
PROPOSED-March 13, 2007
Evaluation Report, Application No. 13678, Air Liquide Large Industries US L.P., Facility B7459
Fd Factor : 9 2 9 0 ft3/MMBtu (Air Liquide)
3 7 9 ft3/lbmol (at S T P : 2 5 C, 1 a t m )
4 6 lb/lbmol
2 8 lb/lbmol
17 lb/lbmol
6 4 lb/lbmol
2 3 5 Btu/scf (ConocoPhi l l ips )
Molar vo lume :
NOx MW:
C O MW:
N H 3 MW:
S O 2 MW:
P S A g a s :
Ref ine ry Fuel G a s :
Natura l G a s
1 3 4 0 Btu/scf (ConocoPhi l l ips 3 y e a r a v e r a g e )
1 0 2 0 Btu/scf ( A P 4 2 ba s i s )
New Hydrogen Plant Furnace Criteria Pollutant Emiss ions
Emiss ions (1 ) (1 ) Criteria Pollutant
NOx lb/hr lb/day ton/yr
7.1 1 69 28.1
S O 2 1.2 30 5.0 PM10 4.0 95 15.8 POC 2.9 69 11.5 CO 8.6 206 34.2
Notes: (1) Assumed heater rating:
Maximum daily: annual:
1,072 MMBtu/hr MMBtu/hr MMscf/day
975 Hydrogen plant capacity: 120
44

PROPOSED-March 13, 2007
Evaluation Report, Application No. 13678, Air Liquide Large Industries US L.P., Facility B7459
S3, Hydrogen Plant Flare Emissions
The following emission calculations have been submitted by the applicant.
Estimated Flare Emissions Air Liquide Hydrogen Plant Operational Emissions
I. NOx and CO Factors 0.0641 lb NOx/MMBtu (TCEQ factor for non-steam assist, low-Btu flare, LHV) 0.5496 lb CO/MMBtu (TCEQ factor for non-steam assist, low-Btu flare, LHV)
98% DRE for CO
II. Summary
Source Pollutant lb/hr tpy Pilot/Sweep Emissions NOx 0.03 0.12
CO 0.24 1.07 SO2 0.0004 0.004
III. Calculations
A. Pilot Emissions 4 Pilots
91.9 scfh/pilot, Natural G a s 367.6 scfh total for pilots 116.7 scfh s w e e p gas, Natural Gas
45

PROPOSED-March 13, 2007
Evaluation Report, Application No. 13678, Air Liquide Large Industries US L.P., Facility B7459
484.3 scfh total for pilots and s w e e p g a s 919 Btu/scf, Natural G a s LHV
10 ppmv Sulfur in NG
NOx 484.3 scf NG 919 Btu 0.0641 lb NOx 1 MMBtu = 0 .028529 lb NOx
hr scf NG MMBtu 1000000 Btu hr
0.03 lb NOx 8760 hr 1 = 0.124957 tons NOx ton hr 2000 lb yr yr
CO 484.3 scf NG 919 Btu 0.5496 lb CO 1 MMBtu = 0.244611 lb CO
hr scf NG MMBtu 1000000 Btu hr
0.24 lb CO 8760 hr 1 = 1.071398 tons CO ton hr 2000 lb yr yr
SO2 10 ft3 S 484 .3 scf NG 1 lbmol S 32 lb S = 0.000402 lb S
1000000 ft3 NG hr 385.3 ft3 S lbmol S hr
0.0004 lb S 64 lb SO2 0.001 lb S O 2 hr 32 lb S hr
0.00 lb SO2 8760 hr 1 0.004 tons SO2 ton hr 2000 lb yr yr
B. Cus tomer Constraint 2.79 mmscfh of hydrogen
46

PROPOSED-March 13, 2007
Evaluation Report, Application No. 13678, Air Liquide Large Industries US L.P., Facility B7459
6 events per year 3.75 hours per event 274 Btu/scf, HHV Hydrogen
NOx 2.79 mmscf H2 274 MMBtu 0.0641 lb CO 49.00 lb NOx
hr mmscf MMBtu hr
49.00 lb NOx 3.75 hours 6 1 0.55 tons NOx events ton hr 2000 lbs event yr yr
C. Loss of PSA 7.74 mmscfh s y n g a s
0.0516 scf Methane/scf Syngas 909 Btu/scf, me thane
261.1 Btu/scf, s y n g a s 835.31 lbmol/hr CO
28 lb CO/lbmol 98% DRE for CO
1 event/yr 5.3 hrs/event
CO
thermal 7.74 mmscf Syngas 0.0516 scf Methane 909 MMBtu 0.5496 lb CO = 199.53 lb CO
hr scf Syngas MMscf MMBtu hr
des t royed 835.31 lbmol CO 28 lb CO 0.98 DRE = 467.77 lb CO
hr lbmol CO hr
47
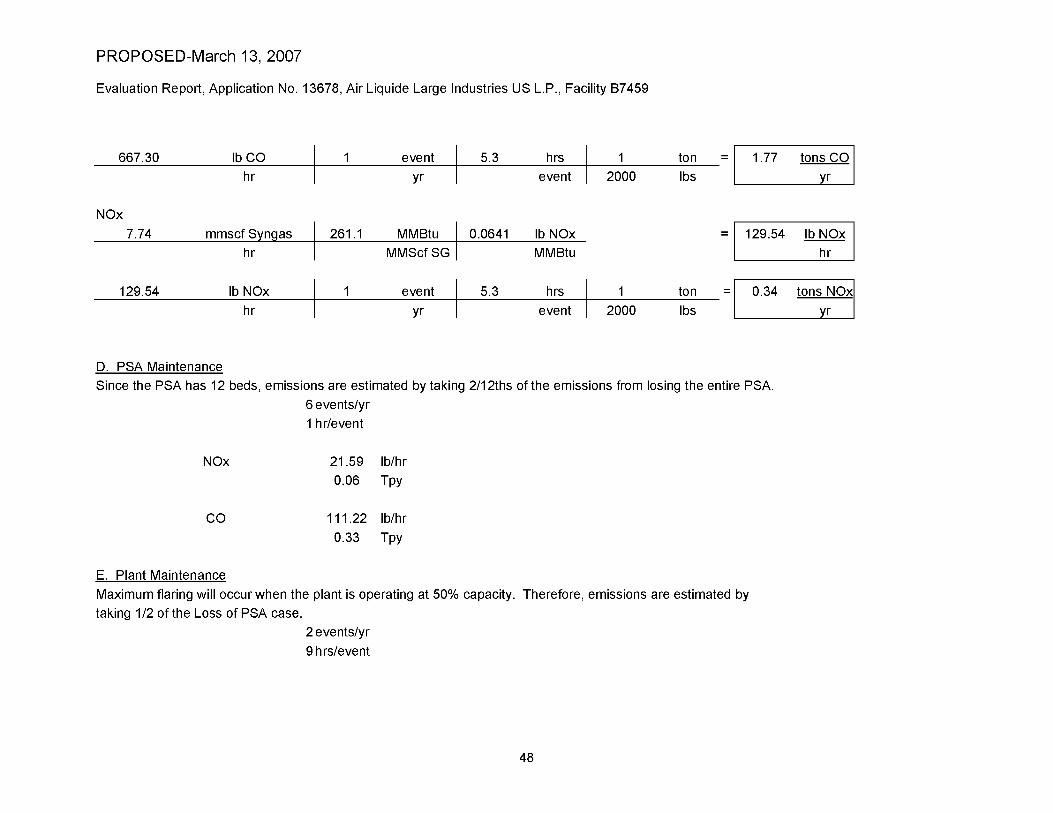
PROPOSED-March 13, 2007
Evaluation Report, Application No. 13678, Air Liquide Large Industries US L.P., Facility B7459
667.30 lb CO 1 5.3 hrs 1 1.77 tons CO event ton hr 2000 lbs event yr yr
NOx 7.74 mmscf Syngas 261.1 MMBtu 0.0641 lb NOx 129.54 lb NOx
hr MMScf SG MMBtu hr
129.54 lb NOx 1 5.3 hrs 1 0.34 tons NOx event ton hr 2000 lbs event yr yr
D. PSA Maintenance Since the PSA has 12 beds, emiss ions are est imated by taking 2/12ths of the emiss ions from losing the entire PSA.
6 events/yr 1 hr/event
NOx 21.59 lb/hr 0.06 Tpy
CO 111.22 lb/hr 0.33 Tpy
E. Plant Maintenance Maximum flaring will occur when the plant is operating at 50% capacity. Therefore, emiss ions are est imated by taking 1/2 of the Loss of PSA case .
2 events/yr 9 hrs/event
48

PROPOSED-March 13, 2007
Evaluation Report, Application No. 13678, Air Liquide Large Industries US L.P., Facility B7459
64.77 lb/hr 0.57 tpy
NOx
333.65 lb/hr 2.94 tpy
CO
F. Contractual Outage Maximum flaring will occur when the plant is operating at 50% capacity. Therefore, emissions are estimated by taking 1/2 of the Loss of PSA case .
4 events/yr 9 hrs/event
64.77 lb/hr 1.15 tpy
NOx
333.65 lb/hr 5.94 tpy
CO
Total Estimated Flare P r o c e s s Emiss ions
2.68 tpy NOx
10.98 tpy CO
49

PROPOSED-March 13, 2007
Evaluation Report, Application No. 13678, Air Liquide Large Industries US L.P., Facility B7459
S4, Cooling Tower
Table 3-7
Estimated Hydrogen Plant Cooling Tower Emiss ions
Value Operations parameter
5.3 Tower Capacity, MM gal/day 1300 Maximum water hardness , ppm TDS
1 0.0044% Drift Loss, % of flow capacity 8.34 Weight of water, lb/gal
Maximum PM10 emissions, lb/yr2
Maximum PM10 emissions, ton/yr2
927.7
0.46
POC Emission Factor 3 1.50 8.0 Maximum POC emissions, lb/day
2917 Maximum POC emissions, lb/yr 1.5 Maximum POC emissions, ton/yr
1 Vender Estimate 2Calculation method from Section VI (Engineering Evaluation Template) of BAAQMD Permit Handbook Chapters, Cooling Towers 3EPA AP-42 Table 5.1-2. Uncontrolled emission factor is 6 lbs POC/MMgal. Emission factor reduced to 1/4 of referenced value due to POC content of stream.
50

PROPOSED-March 13, 2007
Evaluation Report, Application No. 13678, Air Liquide Large Industries US L.P., Facility B7459
APPENDIX B
ConocoPhillips Analysis of BACT for NOx and PM10 for Facility A0016, ConocoPhillips Refinery, and Facility B7459, Air Liquide
Following is ConocoPhillips' review of Best Available Control Technology for S45, Heater, S1004, Sulfur Recovery Unit, and Facility B7149, S2, Heater from
Prevention of Significant Deterioration Application submitted on June 2, 2006
4.0 BEST AVAILABLE CONTROL TECHNOLOGY This section addresses BACT requirements for the proposed ConocoPhillips CFEP, a s well a s the related new Hydrogen Plant on the Refinery site to be owned and operated by Air Liquide Large Industries U.S. LP. BAAQMD Rule 2-2-301 requires BACT to be applied to:
"...any new or modified source which results in an emission from a new source, or an increase in emissions from a modified source, and which has the potential to emit 10.0 pounds or more per highest day of precursor organic compounds (POC), non-precursor organic compounds (NPOC), nitrogen oxides (NOx), sulfur dioxide (SO2), PM10, or carbon monoxide (CO)."
Proposed controlled emission levels to meet BAAQMD BACT requirements, from recent BAAQMD BACT determinations and the BAAQMD BACT Guidelines (BAAQMD 2005) can be found in the Clean Fuels Project Application for Authority to Construct and Significant Revision to Major Facility (ConocoPhillips 2006) and the Hydrogen Plant Project Application for Authority to Construct and Major Facility Review Permit (Air Liquide 2005). Included in BAAQMD Regulation 2, Rule 2, are provisions that implement federal PSD requirements. USEPA policy includes a "top-down" BACT analysis for all pollutants emitted in PSD-significant quantities from new and modified emissions. As described in Section 3.0, PSD requirements apply to NOx and P M i 0 in this proposed action. To supplement the BACT analysis presented in the above-referenced BAAQMD Authority to Construct (ATC) Applications, the remainder of this section presents "top-down" BACT analyses for the proposed new and modified sources of NOx and PM10, based on the USEPA RACT/BACT/LAER Clearinghouse (RBLC), California Air Resources Board (CARB) BACT Clearinghouse, and available information on other recently issued permits. USEPA guidance for a "top-down" BACT analysis requires reviewing all possible control options starting at the top level of control efficiency. In the course of the BACT analysis, one or more options may be eliminated from consideration because they are demonstrated to be technically infeasible or have unacceptable energy, economic, or environmental impacts on a case-by-case (site-specific) basis. The s teps required for a "top-down" BACT review are:
51

PROPOSED-March 13, 2007
Evaluation Report, Application No. 13678, Air Liquide Large Industries US L.P., Facility B7459
1. Identify All Available Control Technologies
2. Eliminate Technically Infeasible Options
3. Rank Remaining Technologies
4. Evaluate Remaining Technologies (in terms of economic, energy, and environmental impacts)
5. Select BACT (the most efficient technology that cannot be rejected for economic, energy, or environmental impact reasons is BACT)
U246 HEAVY GAS OIL (HGO) FEED HEATER The proposed new U246 HGO Feed Heater supporting the modified Unit 240/246 Unicracker is proposed to be fired on refinery fuel gas (RFG), with natural gas a s a backup fuel. The new HGO Feed Heater would be a natural draft process heater rated at 85 million British thermal units per hour (MMBtu/hr).
4.1
4.1.1 NOx BACT - U246 HGO Feed Heater 1. Identify All Available Control Technologies Table 3 lists the technologies identified for controlling NOx emissions from process heaters fired on RFG or natural gas.
NOx Control Technologies Table 3
C o n t r o l T e c h n o l o g y
No C o n t r o l s ( B a s e C a s e )
W a t e r / S t e a m Inject ion
S e l e c t i v e N o n - C a t a l y t i c R e d u c t i o n ( S N C R )
C o m b u s t i o n C o n t r o l s (Low-NOx B u r n e r s )
S e l e c t i v e Ca ta ly t ic R e d u c t i o n ( S C R )
Low-NOx B u r n e r s a n d S N C R
Low-NOx B u r n e r s a n d S C R
S C O N O x
52

PROPOSED-March 13, 2007
Evaluation Report, Application No. 13678, Air Liquide Large Industries US L.P., Facility B7459
2. Eliminate Technically Infeasible Options All the control me thods identified in Table 3 a re considered technically feasible for a p roces s hea te r fired on RFG, except SCONOx™, SNCR, and water / s team injection. SCONOx. SCONOx™ u s e s a potassium ca rbona te (K2CO3) coated catalyst to reduce NOx emissions . The catalyst oxidizes carbon monoxide (CO) to carbon dioxide (CO2), and nitric oxide (NO) to NO2. The CO 2 is exhaus ted while the NO2
a b s o r b s onto the catalyst to form potassium nitrite (KNO2) and potassium nitrate (KNO3). Dilute hydrogen g a s is p a s s e d periodically ac ros s the sur face of the catalyst to convert the KNO2 and KNO3 to K2CO3, water (H2O), and elemental nitrogen (N2), thereby regenerat ing the K2CO3 coating for further absorption. The H2O and N2 a r e exhaus ted . SCONOx h a s not been demons t ra ted on RFG-fired p roces s hea te r s (Arizona Depar tment of Environmental Quality [ADEQ] 2005). It h a s only been demons t ra ted on combustion sou rce s burning exclusively natural gas . The per formance of SCONOx is sensitive to sulfur in the exhaus t s t ream. In addition, the hea t ratings on natural g a s burners demons t ra ted with SCONOx are lower than the proposed HGO Feed Heater. Thus, there a re significant technical dif ferences be tween the proposed source and those few sou rce s whe re SCONOx h a s been demons t ra ted in practice. T h e s e preclude a finding that SCONOx h a s been demons t ra ted to function efficiently on sou rce s identical or similar to the proposed p roces s heater . Se lec t ive Non-Catalytic Reduct ion (SNCR). SNCR is a post-combustion NOx control technology b a s e d on the reaction of urea or ammonia (NH3) and NOx. SNCR involves injecting urea/NH 3 into the combustion g a s path to reduce the NOx to nitrogen and water. This is descr ibed by the following chemical equations:
2 CO ( N H 2 ) 2 (urea) + 4 NO + O 2 ^ 4 N 2 + 2 C O 2 + 4 H 2 O 4 C O ( N H 2 ) 2 + 2 N O 2 + 4 O 2 ^ 5 N 2 + + 4 C O 2 + 8 H 2 O
4 NH3 (ammonia) + 4 NO + O 2 ^ 3 N2 + 6 H2O 4 N H 3 + 2 N O 2 + O 2 ^ 3 N 2 + 6 H 2 O
Tempera tu re s ranging from 1,200°F to 2,000°F are required for optimum SNCR performance. Operation at t empera tu res below this range results in NH3 slip, while operation above this t empera ture range results in oxidation of NH3, forming additional NOx. Exhaust t empera tu res of p roces s hea te r s a re typically below the optimum tempera ture range. In addition, the urea /ammonia must have sufficient res idence time, approximately 3 to 5 seconds , at the optimum operating t empera tu res for efficient NOx reduction. SNCR can only be used in induced draft p roces s hea te r s b e c a u s e of the need to recirculate the flue gas . The HGO Feed Heater will be a natural draft p rocess heater . In addition, existing information on SCNR s y s t e m s indicate they achieve NOx reductions ranging from 30 to 75 percent (USEPA 2001), thus SNCR is an
53

PROPOSED-March 13, 2007
Evaluation Report, Application No. 13678, Air Liquide Large Industries US L.P., Facility B7459
inferior control technology to either SCR or modern combustion controls for an RFG-fired process heater. Therefore, SNCR is considered infeasible for this review. Water/Steam Injection. The injection of steam or water into the combustion zone can decrease peak flame temperatures, thus reducing thermal NOx formation. Steam injection is predominantly used with gas turbines. There is little data available to document the effectiveness of water/steam injection for process heaters and no application of this type could be found. Steam injection has been specified a s a control method for boilers on a very limited basis. Only one was listed in the USEPA RBLC da tabase during the ADEQ's recent review of the Arizona Clean Fuels Yuma, LLC project (ADEQ 2005). This review showed a controlled emission rate higher than low NOx burners produced today. Additionally, there are operating issues concerning flame stability using low NOx burners with steam injection. Therefore, water/steam injection is considered infeasible for this review. 3. Rank Remaining Technologies Technically feasible NOx control technologies are listed in Table 4 with typical emission levels, ranked from most efficient to least efficient. Combustion Controls. Combustion controls reduce NOx emissions by controlling the combustion temperature or the availability of oxygen (O2). These are referred to a s "low NOx burners" or "ultra-low NOx burners." There are several designs of low/ultra-low NOx burners currently available. These burners combine two NOx reduction s teps into one burner, typically staged air with internal flue gas recirculation (IFGR) or staged fuel with IFGR, without any external equipment. In staged air burners with IFGR, fuel is mixed with part of the combustion air to create a fuel-rich zone. High-pressure atomization of the fuel creates the recirculation. Secondary air is routed by means of pipes or ports in the burner block to optimize the flame and complete combustion. This design is predominantly used with liquid fuels.
NOx Control Hierarchy for Process Heaters Fired on Refinery Fuel Gas
Table 4
Typical Emiss ion Level Techno logy
ppmv 1 lb /MMBtu 2
7 0 .0085 Combus t ion Controls and S C R 3
18 0 .022 Selec t ive Catalytic Reduct ion (SCR)
54

PROPOSED-March 13, 2007
Evaluation Report, Application No. 13678, Air Liquide Large Industries US L.P., Facility B7459
2 9 0 .035 Combus t ion Controls
89 0.11 No Cont ro ls 4
Source : Petroleum Refinery Tier 2 BACT Analysis Report, Final Report (EPA, 2001) .
Parts per million by volume (ppmv), dry basis, corrected to 3% oxygen. 2
Pounds (lbs) of NOx produced per MMBtu of fuel heat input. 3 Recent data show a range of values, with 7 ppmv representing the low end of current permitted
levels on RFG-fired refinery heaters . S e e discussion of current BACT determinations in text for more details.
4 Emission level shown is for a natural draft heater; an induced draft hea ter would typically have higher uncontrolled NOx levels, on the order of 179 ppmv at 3% O2, dry (USEPA 2001).
In s t aged fuel burners with IFGR, fuel p re s su re induces the IFGR, which c rea t e s a fuel lean zone and a reduction in oxygen partial pressure . This design is predominantly used for g a s fuel applications. The range of per formance achieved in practice for the best combustion controls is 2 5 to 29 ppmv at 3% O2, dry (0.03 to 0 .035 lb/MMBtu), with the upper end of range represent ing hea te r s firing g a s with high hydrogen content (USEPA 2001). Burners that could achieve 10 ppmv or lower a re under development , but a re not currently available for p roces s heaters . RFG is high in hydrogen content, so for hea te r s burning RFG or a mixture of RFG and natural gas , the upper end of the demons t ra ted range (29 ppmv at 3% O2, dry, or 0 .035 lb/MMBtu) would be appropriate a s the achievable per formance level for combustion controls on RFG-fired p rocess heaters . Se lec t ive Catalytic Reduct ion (SCR). SCR is a p roces s that involves post-combustion removal of NOx from flue g a s with a catalytic reactor. In the SCR process , ammonia injected into the exhaus t g a s reac ts with nitrogen oxides and oxygen to form nitrogen and water. SCR converts nitrogen oxides to nitrogen and water by the following reactions:
4 NO + 4 N H 3 + O 2 ^ 4 N 2 + 6 H 2 O
6 NO + 4 N H 3 ^ 5 N 2 + 6 H 2 O
2 N O 2 + 4 N H 3 + O 2 ^ 3 N 2 + 6 H 2 O
6 N O 2 + 8 N H 3 ^ 7 N 2 + 12 H 2 O The react ions take place on the sur face of a catalyst. The function of the catalyst is to effectively lower the activation energy of the NOx decomposit ion reaction. Technical factors related to this technology include the catalyst reactor design, optimum operating temperature , sulfur content of the fuel, catalyst deactivation d u e to aging, ammonia slip emissions, and design of the NH3 injection sys tem. The most common catalysts a re c o m p o s e d of vanadium, titanium, molybdenum, and zeolite. Sulfur dioxide and sulfur trioxide a re genera ted in the flue g a s when sulfur-containing compounds in fuel a re combus ted . Catalyst s y s t e m s promote partial oxidation of sulfur dioxide (from sulfur and mercap tans in the fuel) to sulfur
1
55

PROPOSED-March 13, 2007
Evaluation Report, Application No. 13678, Air Liquide Large Industries US L.P., Facility B7459
trioxide, which combines with water to form sulfuric acid, causing corrosion over time. In addition, sulfur trioxide and sulfuric acid reac ts with e x c e s s ammonia to form ammonium salts. T h e s e ammonium sal ts may c o n d e n s e a s the flue g a s e s a re cooled, which over time can accumula te on the catalyst causing "plugging" and catalyst deterioration, often referred to a s "fouling." T h e s e effects can be minimized by proper operation, including:
Controlling the amount of sulfur in the fuel.
Using a properly des igned ammonia injection system to maximize the efficient mixing of ammonia and flue g a s without colder su r f aces present on which ammonium sal ts can c o n d e n s e .
Operating with the lowest amount of ammonia n e e d e d to achieve the desired performance. To achieve high NOx reduction rates, SCR vendors sugges t a higher ammonia injection rate than stoichiometrically required, which necessar i ly results in ammonia slip. Thus, an emiss ions tradeoff be tween NOx and ammonia occurs in high NOx reduction applications.
Operating at t empera tu res above the dew point of ammonium sal ts and sulfuric acid. Optimal operating t empera tu res vary by catalyst but generally range from 500 to 800°F. Operating above the maximum tempera ture results in oxidation of NH3 to either nitrogen oxides (thereby adding NOx emissions) or ammonium nitrate. Operating below the optimal t empera ture inc reases ammonia slip and catalyst fouling. Refinery p roces s hea te r s typically opera te in the range of 450 to 700°F, thus would be expected to opera te above the dew point of ammonium sal ts and sulfuric acid to minimize fouling and corrosion. SCR s y s t e m s have been used on p roces s hea te r s burning mixtures of RFG and natural gas . SCR s y s t e m s achieve 80 to 90 percent reductions in NOx emiss ions (USEPA 2001). The 90 percent reduction is relative to an uncontrolled induced draft hea te r s ince the higher NOx emiss ions (approximately 179 ppmv at 3% O2, dry, or 0.22 lb/MMBtu) ve r sus a natural draft hea te r (approximately 89 ppmv at 3% O2, dry, 0.11 lb/MMBtu) provides a grea ter driving force for increased m a s s t ransfer and also e n h a n c e s the S C R ' s mechanical draft requirements . This yields an outlet NOx emission level of approximately 18 ppmv at 3% O2, dry, or 0.011 lb/MMBtu. For a natural draft heater, maximum S C R control efficiency is on the order of 80 percent due to lower uncontrolled emission rates, yielding approximately the s a m e controlled NOx emission rate. Thus, a typical achievable per formance level for SCR s y s t e m s on RFG-fired p roces s hea te r s is 18 ppmv at 3% O2, dry, or 0.011 lb/MMBtu. SCR and Combust ion Controls. This control option u s e s SCR downst ream of combustion controls to reduce NOx emissions . With this combination, the inlet NOx level to the S C R is lower, so lower outlet NOx can be achieved. However, the S C R may not achieve the s a m e percent reduction per formance compared to no upst ream combustion controls b e c a u s e of the lower NOx inlet levels. As is
56

PROPOSED-March 13, 2007
Evaluation Report, Application No. 13678, Air Liquide Large Industries US L.P., Facility B7459
discussed further below, a review of the USEPA RBLC and CARB BACT Clearinghouse showed permit limits of 7 ppmv NOx at 3% O2, dry, a s the lowest level achieved in practice on refinery process heaters with SCR and combustion controls fired on a combination of RFG and natural gas. Therefore, the achievable performance level for SCR and combustion controls on RFG-fired process heaters is 7 ppmv at 3% O2, dry, or about 0.0085 lb/MMBtu. 4. Evaluate Remaining Technologies Technically feasible technologies are reviewed on a case-by-case basis taking into consideration energy, environmental, and economic impacts beginning with the top option. If the top option is not selected a s BACT, the next most effective control is evaluated until it cannot be ruled out for energy, environmental, or economic reasons. In this case, the top technically feasible control option, SCR with combustion controls, is the proposed control technology. Therefore, the selection of BACT consists of establishing the lowest controlled NOx emission level achievable with this control technology, taking into consideration the lowest controlled NOx emissions currently achieved in practice, and if necessary, energy, environmental and economic impacts between different potential controlled emission levels using this technology. A review of the USEPA RLBC and CARB BACT Clearinghouse was conducted. These reviews resulted in the lowest NOx emission limits for refinery heaters fired on RFG/natural gas found in the South Coast Air Quality Management District (SCAQMD). A review of the BACT Determinations published by the SCAQMD provided further details. There were three SCAQMD BACT Determinations for 7 ppmv NOx at 3% O2, dry, documented in the USEPA Petroleum Refinery Tier 2 BACT Analysis Report (USEPA 2001) for process heaters burning natural gas or a combination of RFG and natural gas. These were for: (1) Chevron El Segundo Refinery (Permit No. D64697, D62860, D64621); (2) TOSCO Refinery, Wilmington (Application 326118);1 and (3) CENCO Refinery, Santa Fe Springs (Application 352869). The ADEQ (2005) recently issued a permit for a similar project, Arizona Clean Fuels Yuma, LLC (ADEQ Permit Number 1001205). In their top-down BACT finding issued on 3 February 2005, the ADEQ summarized the following findings for the highest efficiencies achievable with SCR and combustion controls on RFG-fired process heaters (all 3-hour averages): High-Efficiency SCR:
NOx: 0.0085 lb/MMBtu (7 ppmv at 3% O2, dry)2
1 Noted in the SCAQMD BACT Determinations to be for a 460-MMBtu/hr Hydrogen Reforming Furnace also combusting Pressure Swing Absorption (PSA) off gas.
2 Although the NOx permit limit for Arizona Clean Fuels Yuma LLC is presented as ppm
corrected to 3% O2, dry, the ADEQ Technical Report presents results in ppm corrected to 0%
57

PROPOSED-March 13, 2007
Evaluation Report, Application No. 13678, Air Liquide Large Industries US L.P., Facility B7459
Moderate-Efficiency SCR: NOx: 0 .0125 lb/MMBtu (10 ppmv at 3%O2, dry)
The ADEQ concluded for Arizona Clean Fuels Yuma LLC that the beneficial environmental impacts of increased NOx control for the high-efficiency SCR w a s outweighed by a d v e r s e environmental impacts of increased ammonia slip. Therefore, the NOx emiss ions level found to be BACT w a s 10 ppmv at 3% O2, dry. The proposed NOx emission limit for the ConocoPhillips HGO Feed Heater is 7 ppmv at 3% O2, dry. This is equivalent to the high-efficiency SCR option that w a s ruled out by ADEQ, and m a t c h e s the lowest NOx emission limit achieved in practice. No further energy, environmental, or economic impact a s s e s s m e n t is needed . 5. Select BACT/ Document the Selection is BACT Based on this review, NOx BACT is proposed a s SCR with combustion controls (low NOx burners) at 7 ppmv at 3% O2, dry, or 0 .0086 lb/MMBtu.3
4.1.2 PM10 BACT - U246 HGO Feed Heater 1. Identify All Available Control Technologies Table 5 lists the control technologies identified for controlling PM10 emiss ions from p roces s hea te r s fired on natural g a s or RFG.
PM10 Control Technologies Table 5
Cont ro l Techno logy
Good Combust ion Practice Cyclone
Wet G a s Sc rubbe r
Electrostatic Precipitator
Baghouse /Fabr i c Filters
G o o d Combust ion Practice. By maintaining hea te r s in good working order and limiting the sulfur in the f eed fuels, P M i 0 emiss ions a re controlled. Cyclone. A cyclone ope ra t e s on the principle of centrifugal force. Exhaust g a s en te rs tangentially at the top of the cyclone and spirals towards the bottom. As
O2, dry. These have been converted to 3% O2, dry, for the purposes of the ConocoPhillips analysis.
3 J Slight difference from the previous conversions from 7 ppmv at 3% O2, dry, due to fuel heat value assumptions and/or rounding.
58

PROPOSED-March 13, 2007
Evaluation Report, Application No. 13678, Air Liquide Large Industries US L.P., Facility B7459
the g a s sp ins , heavier particles hit the outside wall and a re collected at the bottom. Cleaned g a s e s c a p e s through an inner tube. Wet G a s Scrubber. A wet g a s sc rubber u s e s gas/liquid contacting to remove particles primarily by inertial impaction on liquid droplets, followed by collection of the larger liquid droplets a s liquid waste . Electrostatic Precipitator (ESP). An E S P u s e s an electric field to charge and collect particles in a g a s s tream, followed by collection of the particles on oppositely charged plates. Baghouse /Fabr ic Filter. A b a g h o u s e is a metal housing containing many fabric bags . A partial vacuum pulls the dirty air through the fabric bags, filtering the particles from the exhaus t s t ream. 2. Eliminate Technically Infeasible Options All options in Table 5 a re technically feasible. 3. Rank Remaining Technologies S e e next (Step 4) discussion. 4. Evaluate Remaining Technologies While the listed control technologies a re all technically feasible, only good combustion practice is used for controlling P M i 0 emiss ions from gas-fired heaters . The other technologies a re not used b e c a u s e of inherently low PM10
emiss ions from g a s e o u s fuel combustion. A cyclone would be ineffective in capturing the extremely small particles gene ra t ed from g a s e o u s fuel combustion, and cos t s assoc ia ted with designing the other add-on s y s t e m s to capture minute particles in low concentrat ions would be economically infeasible. This is a well-accep ted finding of all past BACT determinat ions for the control of PM1 0 from combustion of g a s e o u s fuels. A review of the USEPA RLBC and CARB BACT Clear inghouse w a s conducted for currently achieved control levels. Findings were the s a m e a s summar ized by the ADEQ for the Arizona Clean Fuels Yuma LLC (ADEQ 2005). ADEQ proposed a PM1 0 emission limit of 0 .0075 lb/MMBtu a s representat ive of good combustion practice with gas-fired p roces s heaters , b a s e d on the AP-42 emission factor (USEPA 1995a et seq.) for natural g a s combustion and typical natural g a s heat content. This is consis tent with the lowest level achieved in practice.
59

PROPOSED-March 13, 2007
Evaluation Report, Application No. 13678, Air Liquide Large Industries US L.P., Facility B7459
5. Select BACT/ Document the Selection is BACT Based on this review, PM10 BACT is proposed as good combustion practice. The USEPA AP-42 natural gas combustion factor was adjusted with the estimated fuel heat content of the proposed RFG/natural gas mixture to calculate a proposed PM10 BACT emission level of 0.0057 lb/MMBtu.
4.2 HYDROGEN PLANT REFORMER Furnace The proposed new Hydrogen Plant Steam Methane Reformer (SMR) Furnace is proposed to be fired on a mix of approximately 85 percent Pressure Swing Absorption (PSA) off gas and 15 percent RFG/natural gas.
NOx BACT - Hydrogen Plant Reformer Furnace 4.2.1 1. Identify All Available Control Technologies The available technologies are the s a m e as listed in Table 3 of Section 4.1.1. 2. Eliminate Technically Infeasible Options All the control methods identified in Table 3 are considered technically feasible for a Hydrogen Plant Reformer fired on the proposed mix of fuels, except SCONOx, SNCR, and water/steam injection, for the s a m e reasons provided for a refinery process heater in Section 4.1.1. 3. Rank Remaining Technologies Technically feasible NOx control technologies are the s a m e a s listed in Table 4 of Section 4.1.1. Since the proposed mix of fuels includes natural and RFG, the emission levels presented in Table 4 can still be considered typical for this application. Inclusion of PSA off gas, however, affects combustion characteristics, and hence, can impact the actual achievable emission levels. Consideration of PSA off gas is included in the following BACT evaluation discussion. 4. Evaluate Remaining Technologies Technically feasible technologies are reviewed on a case-by-case basis taking into consideration energy, environmental, and economic impacts beginning with the top option. If the top option is not selected a s BACT, the next most effective control is evaluated until it cannot be ruled out for energy, environmental, or economic reasons. In this case, the top technically feasible control option, SCR with combustion controls, is the proposed control technology. Therefore, the selection of BACT consists of establishing the lowest controlled NOx emission level achievable with this control technology, taking into consideration the lowest controlled NOx emissions currently achieved in practice, and if necessary, energy, environmental and economic impacts between different potential controlled emission levels using this technology. A review of the USEPA RLBC and CARB BACT Clearinghouse was conducted. These reviews resulted in the lowest NOx emission limits for hydrogen reformer furnaces fired on PSA off gas and RFG/natural gas found in the SCAQMD. A review of the SCAQMD BACT Determinations provided further details.
60

PROPOSED-March 13, 2007
Evaluation Report, Application No. 13678, Air Liquide Large Industries US L.P., Facility B7459
PSA off gas is high in hydrogen content, and therefore has the potential to form less NOx and PM10. There were five SCAQMD BACT Determinations for hydrogen reformer furnaces. In reverse chronological order, these NOx emission limits were: (1) Chevron El Segundo Refinery (Application 411357, 5/19/2004, 5 ppmv at 3% O2, dry); (2) Praxair, Ontario (Application 389926, 7/17/2002, 5 ppmv at 3% O2, dry); (3) TOSCO Refinery, Wilmington (Application 326118, 9/9/1999, 7 ppmv at 3% O2, dry); (4) Chevron El Segundo Refinery (Application 341340, 7/14/1999, 5 ppmv at 3% O2, dry) and (5) Air Products and Chemicals, Inc. (Application 337979, 6/16/1999, 5 ppmv at 3% O2, dry). The proposed NOx emission limit for the Air Liquide Hydrogen Reformer is 5 ppmv at 3% O2, dry. Since this is the lowest NOx emission limit achieved in practice, no further energy, environmental, or economic impact a s se s smen t is needed . 5. Select BACT/ Document the Selection is BACT Based on this review, NOx BACT is proposed a s SCR with combustion controls (low NOx burners) at 5 ppmv at 3% O2, dry, or 0.0058 lb/MMBtu.
4.2.2 PM10 BACT - Hydrogen Plant Reformer Furnace 1. Identify All Available Control Technologies The available technologies are the s a m e as listed in Table 5 of Section 4.1.2. 2. Eliminate Technically Infeasible Options All options in Table 5 are technically feasible. 3. Rank Remaining Technologies S e e next (Step 4) discussion. 4. Evaluate Remaining Technologies While the listed control technologies are all technically feasible, only good combustion practice is used for controlling PM10 emissions from gas-fired heaters, a s described in Section 4.1.2. A review of the USEPA RLBC and CARB BACT Clearinghouse was conducted for currently achieved control levels. No applicable PM10 BACT emission levels were found. The five SCAQMD BACT Determinations for hydrogen reformer furnaces did not include PM10, thus, from Section 4.1.2, a PM10 emission limit of 0.0075 lb/MMBtu is representative of good combustion practice with gas-fired process heaters. In this case, the proposed Hydrogen Reformer will fire up to 85 percent PSA off gas, which produces less PM10 emissions due to high hydrogen content. It is proposed that with the inclusion of PSA off gas, a reasonable PM10
emission limit would be half the amount produced by natural gas alone, or 0.0037 lb/MMBtu. 5. Select BACT/ Document the Selection is BACT Based on this review, PM10 BACT is proposed a s good combustion practice at 0.0037 lb/MMBtu. The proposed PM10 emissions level is consistent with the lowest level achieved in practice, with further consideration given for the PSA off gas in the fuel mixture.
4.3 SULFUR RECOVERY UNIT (SRU)
61

PROPOSED-March 13, 2007
Evaluation Report, Application No. 13678, Air Liquide Large Industries US L.P., Facility B7459
The proposed new Unit 235 SRU will be a closed Claus process supported by an amine-based TGTU to convert unreacted hydrogen sulfide (H2S) from the Claus process. The TGTU is also a closed process. Any unreacted H2S in the tail gas passing through the TGTU will be oxidized in a new tail gas incinerator, which is the emission point for the process. Vents from the new sulfur loading rack will also be routed to the tail gas incinerator for oxidation of H2S. Therefore, BACT for the SRU was a s s e s s e d for NOx and P M i 0 from the tail gas incinerator.
4.3.1 NOx BACT - SRU Tail Gas Incinerator 1. Identify All Available Control Technologies The available technologies are the s a m e as listed in Table 3 of Section 4.1.1. 2. Eliminate Technically Infeasible Options The only option listed in Table 3 that is technically feasible for an SRU tail gas incinerator is combustion control with low-NOx burners. The other technologies are either based on lowering flame temperature, which is not compatible with the primary function of the incinerator (i.e., efficient oxidation of reduced sulfur compounds), or add-on controls that have not been demonstrated technically feasible for a thermal oxidizer. There are significant technical differences between thermal oxidizers and the combustion sources for which these technologies have been demonstrated in practice. 3. Rank Remaining Technologies The only technically feasible NOx control technology is combustion control with low-NOx burners. 4. Evaluate Remaining Technologies Technically feasible technologies are reviewed on a case-by-case basis taking into consideration energy, environmental, and economic impacts beginning with the top option. If the top option is not selected a s BACT, the next most effective control is evaluated until it cannot be ruled out for energy, environmental, or economic reasons. In this case, a review of the USEPA RLBC and CARB BACT Clearinghouse was conducted for the most efficient low-NOx burners achieved in practice for tail gas thermal oxidizers for SRU TGTUs. These reviews resulted in the lowest NOx emission limit achieved in practice a s 42.2 ppmv @ 7 % O 2 , dry, or 0.0667 lb/MMBtu, associated with the recently issued PSD permit for the SRU TGTU at the ConocoPhillips Ferndale Refinery. This level, for a unit currently in operation, is similar to the 0.06 lb/MMBtu level proposed by the ADEQ for the Arizona Clean Fuels Yuma LLC (ADEQ 2005), a facility not yet in operation.
62

PROPOSED-March 13, 2007
Evaluation Report, Application No. 13678, Air Liquide Large Industries US L.P., Facility B7459
5. Select BACT/ Document the Selection is BACT Based on this review, NOx BACT is proposed a s combustion control with low-NOx burners at 42.2 ppmv at 7% O2, dry, or 0.0667 lb/MMBtu.
4.3.2 PM10 BACT - SRU Tail Gas Incinerator 1. Identify All Available Control Technologies The available technologies are the s a m e as listed in Table 5 of Section 4.1.2. 2. Eliminate Technically Infeasible Options All options in Table 5 are technically feasible. 3. Rank Remaining Technologies S e e next (Step 4) discussion. 4. Evaluate Remaining Technologies While the listed control technologies are all technically feasible, only good combustion practice is used for controlling PM10 emissions from the combustion of gaseous fuels, a s described in Section 4.1.2. A review of the USEPA RLBC and CARB BACT Clearinghouse was conducted for currently achieved control levels. No applicable PM10 BACT emission levels were found. It is proposed that reasonable PM10 emission limit would be the amount produced by natural gas alone, or 0.0075 lb/MMBtu. 5. Select BACT/ Document the Selection is BACT Based on this review, PM10 BACT is proposed a s good combustion practice at 0.0075 lb/MMBtu. The proposed PM10 emissions level is consistent with the lowest level achieved in practice.
New Flaring The proposed project includes a new Hydrogen Plant flare that would operate during planned and unplanned events. The shutdown and startup of the new Unit 240/246 would also cause new flaring emissions from the existing Main Flare, but this is estimated to occur only once every three years. Flares operate primarily a s air pollution control devices, but are nonetheless emission sources subject to BACT analyses. The technically feasible control options for emissions of all pollutants from flares are equipment design specifications and work practices: minimizing exit velocity, ensuring adequate heat value of combusted gases , and minimizing the quantity of g a s e s combusted. Each of these control options is technically feasible and is required for the operation of emergency flares at the refinery. The equipment design criteria for emergency flares are based largely on the parallel requirements set forth in the NSPS regulations (40 CFR 60.18) and the National Emission Standards for Hazardous Air Pollutants (NESHAP) regulations (40 CFR 63.11). These include a maximum allowable exit velocity, a requirement for smokeless operation, and a minimum allowable net heating value for g a s e s combusted in the flares. ConocoPhillips is not aware of any more stringent requirements imposed on flares at any other petroleum refinery, nor any
4.4
63
PROPOSED-March 13, 2007
Evaluation Report, Application No. 13678, Air Liquide Large Industries US L.P., Facility B7459
other technically feasible control options for emissions of any pollutants from flares.
64