Foveated Shot Detection for Video Segmentation · 2014-09-30 · 1 Foveated Shot Detection for...
12
1 Foveated Shot Detection for Video Segmentation Giuseppe Boccignone, Angelo Chianese, Vincenzo Moscato and Antonio Picariello Abstract—We view scenes in the real world by moving our eyes three to four times each second, and integrating informa- tion across subsequent fixations (foveation points). By taking advantage of this fact, in this paper we propose an original approach to partitioning of a video into shots based on a foveated representation of the video. More precisely, the shot- change detection method is related to the computation, at each time instant, of a consistency measure of the fixation sequences generated by an ideal observer looking at the video. The proposed scheme aims at detecting both abrupt and gradual transitions between shots using a single technique, rather than a set of dedicated methods. Results on videos of various content types are reported and validate the proposed approach Index Terms— Attentive Vision, Video Segmentation, Shot Detection, Hard Cuts, Dissolves. I. I NTRODUCTION Detection of shot boundaries provides a base for nearly all video abstraction and high level video segmentation methods [34], [27]. In this paper, we propose a novel approach to parti- tioning of a video into shots based on a foveated representation of the video. A shot is usually conceived in the literature as a series of interrelated consecutive frames taken contiguously by a single camera and representing a continuous action in time and space. In other terms, a shot is a subsequence generated by the camera from the time it “starts” recording images, to the time it “stops” recording [16]. However, shot segmentation is ill- defined. On the one hand, a video is generated by composing several shots by a process called editing, and due to edit activity different kinds of transitions from one shot to another, either abrupt or gradual, may take place. An abrupt transition, or hard cut, occurs between two consecutive frames and is the most common type. An example is provided in Fig. 1. Fig. 1. An example of hard cut effect from a TREC01 video. An abrupt transition occurs between the second and the third frame Gradual transitions such as fades, wipes and dissolves (see Fig. 2 below) are spread over several frames and are obtained using some spatial, chromatic or spatio-chromatic effect; these are harder to detect from a purely data analysis point of view because the difference between consecutive frames is smaller. It has been observed [2] from a study of video production techniques, that the production process originates several con- straints, which can be useful for video edit classification in the framework of a model based approach to segmentation. But the use of such constraints implies high costs in designing shot models due to the high number of degrees of freedom available in shot production (for review and discussion, see [27], [16]). Fig. 2. An example of dissolve effect On the other hand, for the purposes of video retrieval, one would like to mark the case of any large visual change, whether camera stops or not (e.g., a large object entering the scene). Thus, from a general standpoint, shot detection should rely on the recognition of any significant discontinuity in the visual content flow of the video sequence [16]. Meanwhile, the detection process should be unaffected by less significant changes within the same shot, like object/camera motion and lighting changes, which may contribute to missed or false detections. In such a complex scenario, despite the number of proposals in the literature, robust algorithms for detecting different types of boundaries have not been found, where ro- bustness is related to both detection performance and stability with minimum parameter tuning [21]. At the heart of our ability to detect changes from one view of a scene to the next is the mechanisms of visual attention. Film makers have long had the intuition that changes to the visual details across cuts are not detected by audiences, particularly when editing allows for smooth transitions [51]. In the movie Ace Ventura: When Nature Calls the pieces on a chess board disappear completely from one shot to the next. In Goodfellas a child is playing with blocks that appear and disappear across shots. In fact, almost every movie, and almost every cut, has some continuity mistake, yet, most of the time people are blind to these changes. It has been noted that change blindness is evident when mistakes occur far from the viewer’s focus of attention [51]. The term attention captures the cognitive functions that are responsible for filtering out unwanted information and bringing to consciousness what is relevant for the observer [7], [52], [23]. Visual attention, in turn, is related to how we view scenes in the real world: moving our eyes (saccade) three to four times each second, and integrating information across subsequent fixations [60]. Saccades represent overt shifts of
Transcript of Foveated Shot Detection for Video Segmentation · 2014-09-30 · 1 Foveated Shot Detection for...
1
Foveated Shot Detection for Video SegmentationGiuseppe Boccignone, Angelo Chianese, Vincenzo Moscato and Antonio Picariello
Abstract— We view scenes in the real world by moving oureyes three to four times each second, and integrating informa-tion across subsequent fixations (foveation points). By takingadvantage of this fact, in this paper we propose an originalapproach to partitioning of a video into shots based on afoveated representation of the video. More precisely, the shot-change detection method is related to the computation, at eachtime instant, of a consistency measure of the fixation sequencesgenerated by an ideal observer looking at the video. The proposedscheme aims at detecting both abrupt and gradual transitionsbetween shots using a single technique, rather than a set ofdedicated methods. Results on videos of various content typesare reported and validate the proposed approach
Index Terms— Attentive Vision, Video Segmentation, ShotDetection, Hard Cuts, Dissolves.
I. I NTRODUCTION
Detection of shot boundaries provides a base for nearly allvideo abstraction and high level video segmentation methods[34], [27]. In this paper, we propose a novel approach to parti-tioning of a video into shots based on a foveated representationof the video.
A shot is usually conceived in the literature as a seriesof interrelated consecutive frames taken contiguously by asingle camera and representing a continuous action in time andspace. In other terms, a shot is a subsequence generated by thecamera from the time it “starts” recording images, to the timeit “stops” recording [16]. However, shot segmentation is ill-defined. On the one hand, a video is generated by composingseveral shots by a process calledediting, and due to editactivity different kinds of transitions from one shot to another,eitherabruptor gradual, may take place. An abrupt transition,or hard cut, occurs between two consecutive frames and is themost common type. An example is provided in Fig. 1.
Fig. 1. An example of hard cut effect from a TREC01 video. An abrupttransition occurs between the second and the third frame
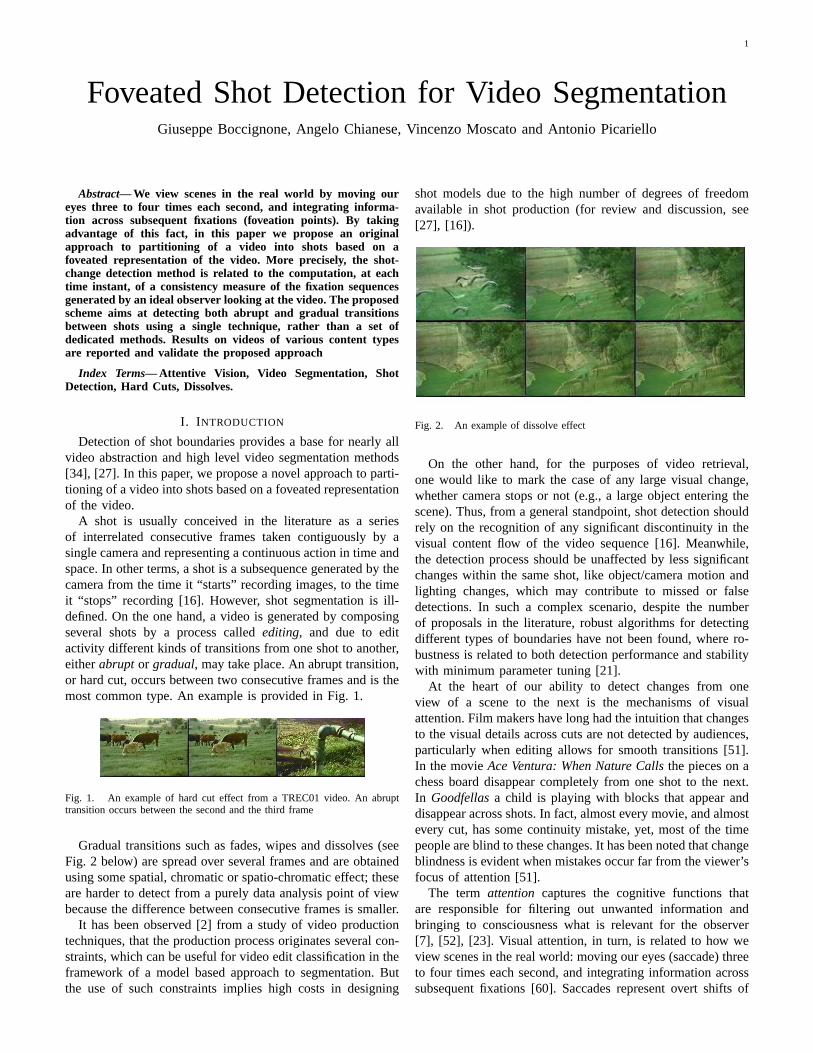
Gradual transitions such as fades, wipes and dissolves (seeFig. 2 below) are spread over several frames and are obtainedusing some spatial, chromatic or spatio-chromatic effect; theseare harder to detect from a purely data analysis point of viewbecause the difference between consecutive frames is smaller.
It has been observed [2] from a study of video productiontechniques, that the production process originates several con-straints, which can be useful for video edit classification in theframework of a model based approach to segmentation. Butthe use of such constraints implies high costs in designing
shot models due to the high number of degrees of freedomavailable in shot production (for review and discussion, see[27], [16]).
Fig. 2. An example of dissolve effect
On the other hand, for the purposes of video retrieval,one would like to mark the case of any large visual change,whether camera stops or not (e.g., a large object entering thescene). Thus, from a general standpoint, shot detection shouldrely on the recognition of any significant discontinuity in thevisual content flow of the video sequence [16]. Meanwhile,the detection process should be unaffected by less significantchanges within the same shot, like object/camera motion andlighting changes, which may contribute to missed or falsedetections. In such a complex scenario, despite the numberof proposals in the literature, robust algorithms for detectingdifferent types of boundaries have not been found, where ro-bustness is related to both detection performance and stabilitywith minimum parameter tuning [21].
At the heart of our ability to detect changes from oneview of a scene to the next is the mechanisms of visualattention. Film makers have long had the intuition that changesto the visual details across cuts are not detected by audiences,particularly when editing allows for smooth transitions [51].In the movieAce Ventura: When Nature Callsthe pieces on achess board disappear completely from one shot to the next.In Goodfellasa child is playing with blocks that appear anddisappear across shots. In fact, almost every movie, and almostevery cut, has some continuity mistake, yet, most of the timepeople are blind to these changes. It has been noted that changeblindness is evident when mistakes occur far from the viewer’sfocus of attention [51].
The term attention captures the cognitive functions thatare responsible for filtering out unwanted information andbringing to consciousness what is relevant for the observer[7], [52], [23]. Visual attention, in turn, is related to how weview scenes in the real world: moving our eyes (saccade) threeto four times each second, and integrating information acrosssubsequent fixations [60]. Saccades represent overt shifts of

2
spatial attention that can be performed either voluntarily (top-down), or induced automatically (bottom-up) by salient targetssuddenly appearing in the visual periphery and allow anobserver to bring targets of interest onto the fovea, the retinalregion of highest spatial resolution. Eye movements, thoughbeing characterized by some degree of randomness [47], [6],are likely to occur in a specific path (thescanpath, [37]) soas to focus areas that are deemed important. The scanpathcan be conceived as a visuomotor pattern resulting fromthe perceptual coupling of observer and observed scene. Anexample generated on the third frame of Fig. 1 is illustratedin Fig. 3.
Fig. 3. Scanpath eye-tracked from a human observer while viewing the thirdframe presented in Fig. 1. The scanpath has been graphically overlapped onthe original image: circles represent fixations, and lines trace displacements(saccades) between fixations.
In the course of a scan we have a rich visual experience fromwhich we abstract the meaning or gist of a scene. During nextscan, if the gist is the same our perceptual system assumesthe details are the same. Clearly, this “sketch” representationnot only serves the information reduction purpose of filteringunwanted information, but also, by integrating the gist fromone view to the next, to achieve the impression of a stableworld. However, the lack of a detailed representation of theoutside world from one view to the next can rise failures ofchange detection [51].
The background question which motivates this work iswhether these mechanisms that are useful to prevent audiencesnoticing the transitions, can conversely be exploited to detectsuch transitions, and thus help for video segmentation. Intu-itively, one could argue that if the playback speed is reduced(or, equivalently, the saccade rate increased) change blindnesseffects would be reduced too. This corresponds to introducingan ideal observer or agent, capable of tuning his saccadicrate. In some sense, this is akin to Gargi’s experimental studyof human ground-truthing, where most consistent results inmarking shot changes were obtained when subjects performedsuch task at half speed after viewing the sequence once at fullspeed [16].
The rationale behind our approach is that perceptual capac-ity of an observer can be defined at two levels [38]. At thefirst level there is the ability of the agent to explore the scenein ways mediated by knowledge of patterns of visuomotorbehavior, that is the ability to exploit the interdependencebetween incoming sensory information and motor behavior(eye movements). At the second, higher level there is the
accessing by the observer of information related to the natureof observer’s own exploration.
For example, while viewing a video sequence, it is rea-sonable that in the presence of similar visual configurations,and in the absence of an habituation mechanism, an observershould consistently deploy attention to visually similar regionsof interest and by following a similar motor pattern; clearly,when the gist of the world observed undergoes a significantchange, the visuomotor pattern cannot be exploited further,since inconsistent, and a new scanpath will be generated.Such an intuitive assumption can be theoretically motivatedon the basis that after an abrupt transition the video signal isgoverned by a new statistical process [28]. Indeed, it has beenshown [6] that gaze-shift is strongly constrained by structureand dynamics of the underlying random field modelling theimage. Quantitatively, if a measureM of attention consistencyis defined,M should decrease down to a minimum value. Forinstance, this is what is likely to occur when a view abruptlychanges.
On the other hand, a view change may occur across longdelay intervals, as in gradual transitions. In this case,Mshould account for a behavior similar to that experienced inchange blindness experiments, where subjects fail to detect aslow, global spatio-chromatic editing of a sequence presentingthe same image [38], but suddenly succeed when the framerate of presentation is increased, due to the reduction of thetime lag between the first and the last frames of the transition.In this case theM function should vary smoothly across theinterval, while decreasing rapidly if measured on the first andthe last frames of the same interval. It is worth remarking thatshots involved in a dissolve transition may have similar colordistribution, which a color histogram would hardly detect [28],while differing in structural information that can be detectedby appropriate algorithms (e.g., edge based); as in the caseof hard cuts, the sequence of attention shifts can be suitablyexploited, since its dynamics [6] is strongly intermingled withthe complexity of the statistical process modelling the signal(e.g., two-source model for a dissolve [28]).
As regards the second level, namely the evaluation ofinformation about the nature of visual exploration itself, itcan be stated as an inference drawn by the observer from itsown sensorimotor behavior under prior knowledge available.On such assumption, the problem of detecting a shot changegiven the change of the observer’s behaviorM, naturallyleads to a Bayesian formulation, and can be conceived asa signal detection problem where the probability that a shotboundaryB occurs, given a behaviorM, is compared againstthe probability that a shot boundary is not present.
The introduction of this approach has several advantages,both theoretical and practical. First it allows to find a uniformmethod for treating both abrupt and gradual transitions. Asdiscussed above, this result stems from relations occurringbetween the dynamics of gaze-shifts and statistical processesmodelling the observed image [6]; also, the method is wellgrounded in visual perception theories [37], [38]. As such, itis suitable to overcome usual shortcomings of other simplertechniques proposed so far (e.g, histogram manipulations). Inthis sense, higher robustness can be achieved, as regards per-

3
formance and stability in detecting important visual changeswhile discarding negligible ones. Then, once the distinctivescanpath has been extracted from a frame, subsequent analysisneeds only to process a sparse representation of the frame.Eventually, attentive analysis can, in perspective, provide asound and unitary framework at higher levels of video contentanalysis. For instance, key frame selection/generation couldbe conceived in terms of average scanpath of shot frames;multimodal processing for deriving semantic properties ofa scene, can be stated in terms of attentive audio/visualintegration.
In Section 2, we briefly discuss background and relatedwork on shot segmentation. In Section 3, we outline the modelfor foveated analysis of a video sequence. In Section 4 thecomputation of patterns of visuomotor behavior is discussed.In Section 5 we derive the procedure to calculate theMfunction and the boundary detection algorithm. Sections 6presents the experimental protocol and results obtained. Someconcluding remarks are given in Section 7.
II. BACKGROUND AND RELATED WORK
Assume as input to a segmentation system a video se-quence, that is a finite sequence of time parameterized images,(f(t0), f(t1), . . . f(tN )), where each imagef(tn) is called aframe. Each frame is a color image, namely a mapping fromthe discrete image supportΩ ⊆ Z2 to an m-dimensionalrange,f : Ω → Q ⊆ Zm; in other terms, it is a set of single-valued images, or channels, sharing the same domain, i.e.,f(x, y) = (fi(x, y))T , where the indexi = 1, .., m, definesthe i-th color channel and(x, y) denotes a point in theΩlattice.Q = q1, ..., qN is the set of colors used in the image.Each frame displays a view, a snapshot, of a certain visualconfiguration representing an original world scene.
A time segmentation of a videof defined on the timeinterval [t0, tN ] is a partition of the video sequence intoNb
subsequences or blocks. One such partition can be obtainedin two steps. First, a mappingT : Zm → F of the framef(tn) ∈ Zm to a representationT (f(tn)) ∈ F , F being asuitable feature space, is performed. Then, given two consec-utive framesf(tn) and f(tn+l), where l ≥ 1 is the skip orinterframe distance, a discriminant functionD : F ×F → R+
is defined to quantify the visual content variation betweenT (f(tn)) and T (f(tn+l)), such that a boundary occurs atframe f(tn) if D(T (f(tn)), T (f(tn+l))) > T , where T isa suitable threshold.
Thus, in principle, to solve the shot detection problem threesteps must be undertaken: choose an appropriate mappingT ;define a robust discriminant functionD; devise a (universal)thresholdT .
As regards the first two points, different techniques havebeen used: pixel based methods, such as the mean absolutevalue of intensity between frames [24],[39], or block matching[50] [21], histograms difference [61],[15], [16], [34], [64]motion difference [63] and perceived motion energy [31],differential geometry [58].
For what concerns the third point, heuristically chosenthresholds have been proposed [34],[39]. However a fixed
thresholding approach is not feasible especially when con-sidering gradual transitions. In particular, dissolve effects arereputed the most common ones, but also the most difficult todetect [13], [57]. A dissolve can be obtained as a combinationof fade-out and fade-in, superimposed on the same filmstrip; fade-out occurs when the visual information graduallydisappears, leaving a solid color frame, while fade-in takesplace when the visual information gradually appears from asolid color frame (refer again to Fig. 2).
Dissolve detection is still a challenging problem. Fewtechniques have been published [29]. Variable thresholdinghas been proposed in [61] and [64], the latter relying ongaussian distribution of discontinuity values. For instance in[64] the twin-comparison approach using a pair of thresholds,for detecting hard cuts and gradual transitions, respectively,has been introduced. More significant improvements have beenachieved by recasting the detection problem in a statisticalframework. A novel and robust approach has been presentedby Lienhart [30], which relies on multiresolution analysis oftime series of dissolve probabilities at various time scales;experiments achieved a detection rate of75% and a false alarmrate of16% on a standard test video set. Further, it has beenrecently argued that a statistical framework incorporating priorknowledge in model based [20], statistical approaches leads tohigher accuracy for choosing shot boundaries [58], [21].
III. O UTLINE OF THE MODEL FOR FOVEATED VIDEO
ANALYSIS
The evaluation of attention consistency relies on the modelof foveated analysis outlined in Fig. 4.
In the preattentive stage, salient features are extracted byspecific detectors operating in parallel for all points of theimage, at different spatial scales, and organized in the form ofcontrast maps. In order to obtain such a representation differentmethods can be adopted, e.g., [42], [22], [14]. It is worthremarking, that the model presented in this paper is unaffectedby the method chosen to implement such preattentive stage.We experimented with schemes proposed in [14], [22], andopted for the latter due to simplicity and limited computationalcomplexity. Precisely, low-level vision features are derivedfrom the original color image decomposed at several spatialscales using Gaussian [8] and oriented pyramids (via convolu-tion with Gabor filters [19]). Note that pyramid computationis an O(|Ω|) method, where|Ω| represents the number ofsamples in the image supportΩ.
The features considered are: brightness(I); color channelstuned to red (R), green (G), blue (B) and yellow (Y) hues;orientation (O). From color pyramids, red/green (RG) andblue/yellow (BY) pyramids are derived by subtraction. Then,from each pyramid a contrast pyramid is computed encodingdifferences between a fine and a coarse scale for a givenfeature. As a result, one contrast pyramid encodes for imageintensity contrast, four encode for local orientation contrast,and two encode for red/green(RG) and blue/yellow (BY)contrast (see [22], for details).
Successively, this preattentive representation, undergoesspecialized processing through a“Where” system devoted to

4
Fig. 4. A general model of attentive/foveated video analysis. At a lowerlevel, the observer generates visuomotor patterns, related to the content of thesequence. At a higher level, the observer detects scene changes by judginghis own visuomotor behavior in the context of prior knowledge available
localizing objects, and a“What” system tailored for identi-fying them. Clearly, tight integration of these two informa-tion pathways is essential, and indeed attentive mechanismsplay a fundamental role. A plausible assumption is that, inthe “What” pathway, early layers provide feature extractionmodules, whose activity is subjected to temporal modulationby the “Where” pathway and the related attention shiftingmechanism, so that unmodulated responses are suppressed.
In the “Where” pathway, the preattentive contrast maps arecombined into a master or saliency map [22], [33], [1], whichis used to direct attention to the spatial location with the high-est saliency (attention shifting stage). The region surroundingsuch location represents the current focus of attention (FOA),Cs . By traversing spatial locations of decreasing saliency, ascanpath(Cs)s=1,2,.. is obtained by connecting a sequence ofFOAs, and stored.
It is important to note that, in general and specifically in thiswork, such “working memory” retains either a representationof a set of visual features (measured at FOAs) and a motormap of how such features have been explored; indeed, thememory of an attentive system is avisuomotor traceof a worldview [38],[18], rather than a classical feature representationof the original scene, and any subsequent information-lookuptask entails a prediction/confirmation upon such visuomotorscheme. DenoteT (f(t)) the visuomotor trace (simply, thetrace) of framef(t).
At the higher perceptual level, the observer infers scenechanges by judging his own visuomotor behavior. To this end,given two framesf(t) andf(t + l) (for notational simplicity,t = tn), an effective procedure is needed to compute thefunctionM(t)) which gauges the consistency between the twotracesT (f(t)) andT (f(t+ l)). A way to solve this problem,is suggested by experiments performed by Walker and Smith[59], who provided evidence that when observers are askedto make a direct comparison between two simultaneouslypresented pictures, a repeated scanning, in the shape of aFOA by FOA comparison, occurs. Using this procedure,which we nameinformation look-up loop, the consistency
M will eventually be calculated as the average of the localconsistencies measured on pairs of FOAs, iteratively selectedfrom the two tracesT (f(t)) andT (f(t + l)) according to a“best fit” prediction strategy. The behavior of theM function,is then used by a detection module, based on Bayesian decisiontheory, which, under prior contextual knowledge available,infers fromM the presence of a scene transition, either abruptor gradual.
In sections IV and V, we detail how the different levels ofour attentive system have been designed.
IV. L OW PERCEPTUAL LEVEL: GENERATION OF
VISUOMOTOR PATTERNS
At this lower perceptual level, the agent observes the se-quence and generates patterns of visuomotor behavior (traces).
A. The Where system: from preattentive features to attentionshifting
The goal of the “Where” system is to build a saliencymap of the frame and define over this map the motor trace,that is the sequence of FOAs(Cs)s=1,2,...,K . To this end, thecontrast features for intensity, color and orientation, obtainedfrom the preattentive stage, are summed across scales (pyramidlevels) into three separate contrast maps, one for intensity, onefor color and one for orientation. Eventually, the three maps,normalized between0 and 100, are linearly summed into aunique master map (for simplicity, we compute the latter asthe average of the three maps), or saliency map (SM).
By using the SM map, the attention shifting mechanismcould be implemented through a variety of ways (e.g., [17],[42], [6], [22], [54]). One intuitive method for traversingspatial locations of decreasing saliency, is to use a winner-take-all (WTA) strategy [22], [54], in which the most salientlocation “wins” and determines the setting of the FOA; thewinner is subsequently inhibited in order to allow competitionamong less salient locations, for predicting the next FOA. Asimple and efficient way of implementing such strategy isthrough a WTA neural network, e.g. an array of integrate-and-fire neurons with global inhibition [22]. It is worth notingthat a WTA algorithm, due to fast convergence properties,hasO(n) time complexity,n being the number of processingelements (neurons) of the network. In our scheme the numberof neurons is constrained by the number of samples in thesaliency map (each point of the map, represents the input toone neuron) . Since the map resides at an intermediate scalebetween the highest and the lowest resolution scales, namelyat scale 4, a reduction factor 1:16 is achieved with respect tothe original image, thus the time complexity of the WTA stageis given by|Ω|/16 time units.
This solution has the advantage of providing information onthe fixation time spent on the FOA (the firing time of WTAneurons) and our model, differently from others proposed inthe literature, explicitly exploits such information. After the“Where” processing, the framef(t) is represented by a spatio-temporal, or motor trace representing the stream of foveationpoints(Ct
s(ps; τs))s=1,2,...,K , whereps = (xs, ys) is the center
5
of FOA s, and the delay parameterτs is the observation timespent on the FOA before a saccade shifts toCs+1.
As outlined in Fig. 5 the generation of spatio-temporalinformation is basically an information reduction step in whichwe assume that the “Where” system “projects” towards the“What” system and signals theFOA to be analyzed.
Fig. 5. Generation of the visuomotor trace of a single frame. The schemeshows the selection of a FOA by the “Where” pathway, and the extractionof FOA information by the “What” pathway. For visualization purposes, thetrace is represented as a graph-like structure: each node corresponds to asingle FOA, and the arc joining two FOAs denotes a saccade.
B. The What pathway: properties encoding
In the “What” pathway, features are extracted from eachhighlightedFOA, relative to color, shape and texture. AFOAis represented in the intensity and color opponent pyramids, atthe highest resolution scale. Note that in biological vision, thespatial support of the FOA is usually assumed as circular;here, for computational purposes, each FOA is defined ona square supportDps ⊆ Ω, centered onps, of dimension|Dps | = 1
36 |Ω|. In the following we drop theτ parameterfor sake of simplicity.
Color features. Given a set of representative colorsQ =q1, ..., qB, a color histogramh(C(p)) = hb of the FOAC(p) is defined on binsb ranging in[1, B], such thathb givenfor any pixel in Dp, is the probability that the color of thepixel is qb ∈ Q. Here,B = 16× 16× 16 is used. For a threechannel frame, the FOA histogram calculation time is|Dp|×3.
Shape and texture features. A wavelet transform (WT )of the FOA has been adopted [32]. Denote the waveletcoefficients aswk
l (x, y), where (x, y) ∈ Dp, l indicates thedecomposition level andk indexes the sub-bands. In our case,due to the limited dimension of the FOA, only a first leveldecomposition (l = 1) is considered, and in the sequel, fornotational simplicity the indexl is dropped. Decompositiongives rise to4 subregions of dimension|Dp|/4. Then, onlythe details components of theWT are taken into account, inorder to characterize shape (edges) and texture. Namely, fork = 1, 2, 3, the detail sub-bands contain horizontal, verticaland diagonal directional information, respectively, and are
represented by coefficient planes[
wk(x, y)]
k=1,2,3. Next,
the Wavelet Covariance Signature is computed, i.e. the featurevector of coefficient covariancesΣ2
Cms
= σ2X,Y , where:
σ2X,Y =
∑x,y
1|Dp|/4
3∑
k=1
Xk(x, y)Yk(x, y). (1)
The pair (Xk, Yk) is in the set of coefficient plane pairs(wk
i , wkj ), i and j being used to index the three channels,
and(x, y) span over the sub-band lattice of dimension|Dp|/4.Note that, the FOA wavelet representation at level1 can beobtained through2h|Dp| operations, whereh is the size ofconvolution filters (hereh = 3) [32], while calculation ofcovariances can be accomplished in|Dp|2 operations. Clearly,|Σ2| = 18.
As summarized in Fig. 5, the saccadic movements togetherwith their resultant fixations, and feature analysis of foveatedregions, allow the formation of the traceT (f(t)), briefly T (t),of the view observed in framef(t):
T (t) = (T ts )s=1,...,K (2)
whereT ts = (Ct
s, hb(Cts), Σ
2Ct
s).
V. H IGH PERCEPTUAL LEVEL: INFERENCE OF SCENE
CHANGES FROM VISUOMOTOR BEHAVIOR
At this level, the observer evaluates the information re-garding the nature of visual exploration itself and infersthe presence of a shot boundary from its own sensorimotorbehavior under prior knowledge available on the kinds oftransitions he is dealing with.
A. Attention consistency via information look-up
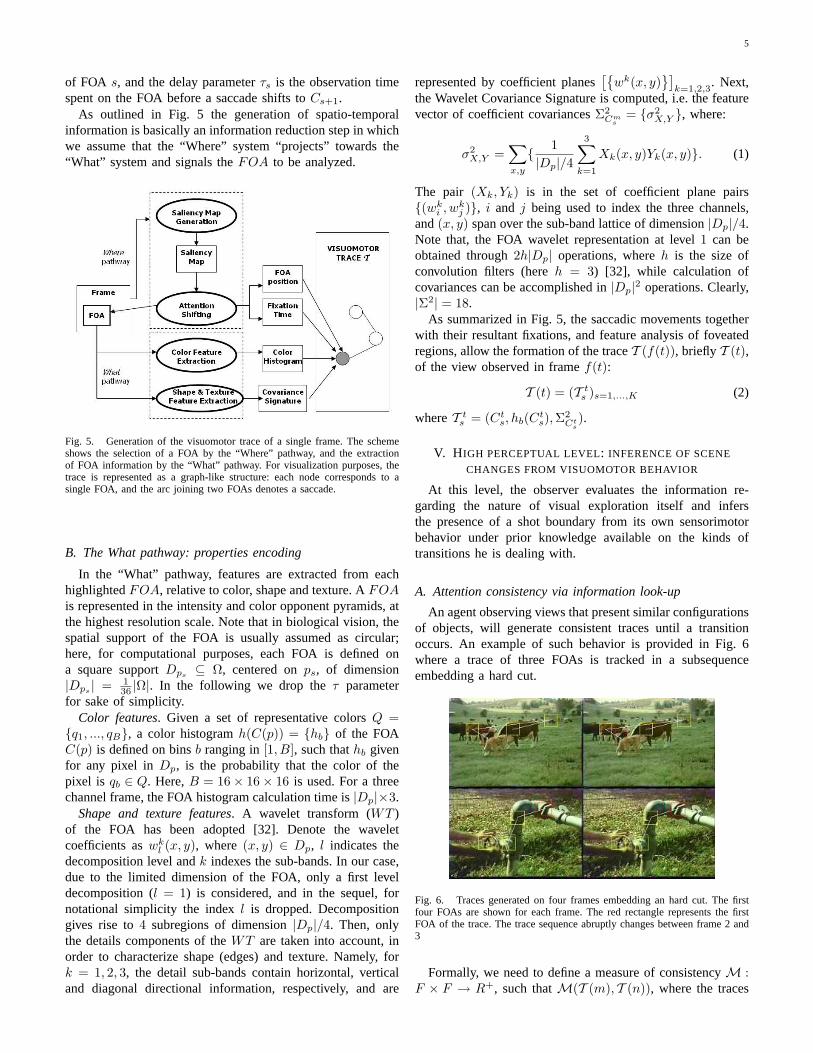
An agent observing views that present similar configurationsof objects, will generate consistent traces until a transitionoccurs. An example of such behavior is provided in Fig. 6where a trace of three FOAs is tracked in a subsequenceembedding a hard cut.
Fig. 6. Traces generated on four frames embedding an hard cut. The firstfour FOAs are shown for each frame. The red rectangle represents the firstFOA of the trace. The trace sequence abruptly changes between frame 2 and3
Formally, we need to define a measure of consistencyM :F × F → R+, such thatM(T (m), T (n)), where the traces

6
T (m) and T (n) have been generated by observing framesf(tm) = f(m) andf(tm + l) = f(n). A strategy to solve thisproblem is to make a FOA by FOA comparison [59]. Thisinformation look-up loop is summarized in the scheme of Fig.7.
Fig. 7. The information look-up loop for determining the attention consis-tencyM related to framesm and n, by exploiting the visuomotor tracesT (m), T (n).
The procedure, which we denote Attention Consis-tency (AC), given a fixation pointCm
r (pr; τr) in a firstframe, selects the homologous pointCn
s (ps; τs) in a sec-ond frame among those belonging to a local tempo-ral window defined in the interval[s − H, s + H], i.e.[Cn
s (ps; τr), Cns±1(ps±1; τs±1), ..., Cn
s±H(ps±H ; τs±H)]. The
choice is performed by computing, for the pairCmr andCn
s ,the FOA consistency
Mr,s = αMr,sspatial + βMr,s
temporal + γMr,svisual, (3)
where α, β, γ ∈ [0, 1], and by choosing the FOAs as s =arg maxMr,s. Such “best fit” is retained and eventuallyused to computeM(T (m), T (n)) as the average of the firstK FOA consistencies:
M =1K
K∑
f=1
Mr,sf . (4)
This “best fit” strategy has been chosen in order to reduce thesensitivity of the algorithm both to the starting FOA point andto the fact that, in similar images, some FOAs could be missingdue to lighting changes and noise, even if this is unlikely tooccur for small interframe distances.
Right-hand terms of Eq. 3, namelyMr,sspatial, Mr,s
temporal,Mr,s
visual, account for local measurements of spatial temporaland visual consistency, respectively. These are calculated asfollows.
Local spatial consistency. Mr,sspatial is gauged through the
`1 distance between homologousFOAs’s centers:
d(pr, ps) = |xr − xs|+ |yr − ys|. (5)
The distance is “penalized” if, for the two frames, the dis-placement between the currentFOA and the next one is notin the same direction:
d(pr, ps) = d(pr, ps) · e−∆(pr,ps), (6)
∆ being the difference of direction between twoFOAs,
∆ = ζ·sgn[(xr−xr−1)·(xs−xs−1)]·sgn[(yr−yr−1)·(ys−ys−1)],(7)
where ζ is a penalization constant. Thus, afterd(pr, ps)normalization:
Mr,sspatial = 1− d(pr, ps). (8)
Local temporal consistency. Mr,stemporal takes into account
the difference of time that the observer gazes at two differentfixation points. To this end the1 distance is introduced:
d(τr, τs) = |τr − τs|. (9)
The distance measured in Eq. 9 is normalized with respectto the maximum fixation time of the scanpath. Then temporalconsistency is calculated as
Mr,stemporal = 1− d(τr, τs). (10)
Local visual consistency. Mr,svisual is defined using either
color and texture/shape properties. Evaluation of consistencyin terms of color is performed by exploiting well knownhistogram intersection, which again is an`1 distance on thecolor space [53]. Given the two color histogramsh(Cm
r ) andh(Cn
s ), defined on the same number of binsb = [1, . . . , B],
dr,scol =
B∑
b=1
(min(hb(Cmr ), hb(Cn
s )))/B∑
b=1
hb(Cmr ), (11)
where∑B
b=1 hb(Cmr ) is a normalization factor. Then,
Mr,scol = 1− dr,s
col. (12)
Computational complexity for the histogram analysis part isproportional to the number of bins in the histogram, thustaking B time units.
Shape and texture consistency is measured as
Mr,stex = 1− 1
R
|Σ2|∑
i=1
|Σ2Cm
r[i]− Σ2
Cns[i]|
min(|Σ2Cm
r[i]|, |Σ2
Cns[i]|) , (13)
whereR is a normalization factor to bound the sum in[0, 1],and |Σ2| the number of features in the feature vectorΣ2
computed through Eq. 1. Eventually,FOA’s visual contentconsistency is given from the weighted mean of terms calcu-lated via Eqs. 12 and 13:
Mr,svisual = µ1Mr,s
col + µ2Mr,stex. (14)
The computation cost of Eq. 3 is approximately linear in thenumber of histogram binsB, since|Σ2| = 18, and Eqs. 8 and10, are performed in constant time units. Thus, the algorithm

7
(cfr. Eq. 4) requires(2H + 1)BK operations, which meansthat, onceH and B have been fixed as in our case, the ACalgorithm is linear in the number of FOAsK; in particular,a value ofH = 2 for the best fit window provides suitableresults. The value ofK = 10 was chosen either because, inthis way, eachFOA is only visited once, and for the bottom-up importance of earliest FOAs [40]. For what concerns thesetting of equation parameters, considering again Eq. 3, wesimply useα = β = γ = 1/3, granting equal informationalvalue to the three kinds of consistencies; similarly, we setµ1 = µ2 = 1/2 in Eq.14.
B. Using attention consistency and prior knowledge for de-tecting shot transitions
The observer’s behavior can be formalized as the attentionconsistency gauged over subsequences of the video sequencef . To this end, let us generalize the local attention consistencymeasureM to a parametrized familyM : F × F × N+ →R+, which accounts for the attentive behavior over the fullsequencef , namely(M(T (i), T (i + l)))i=0,l,...,N/l.
In such framework, the problem of inferring a shot changegiven the change of observation behaviorM(t) can be con-ceived as a signal detection problem where the probabilitythat a shot boundaryB occurs, given a behaviorM(t),P (B|M(t)), is compared against the probability that a shotboundary is not present,P (B|M(t)). More precisely, theobserver’s judgement of his own behavior can be shaped ina Bayesian approach where detection becomes the inferencebetween two hypotheses:
• H0: no shot boundary occurs between the two framesunder analysis (B)
• H1: a shot boundary occurs between the two frames (B)
In this setting the optimal decision is provided by a test whereH1 is chosen ifp(M(t)|B)P (B) > p(M(t)|B)P (B) andH0
is chosen, otherwise. Namely a cut occurs if:
L(t) >P (B)P (B)
=1− P (B)
P (B)(15)
whereL(t) = p(M(t)|B)p(M(t)|B)
represents a likelihood ratio.In general, the prior shot probabilityP (B) models shot
boundaries as arrivals over discrete, nonoverlapping temporalintervals, and a Poisson process seems an appropriate prior[58], [21], which is based on the number of frames elapsedsince the last shot boundary. Hanjalic has suggested [21] thatthe prior P (B) should be more conveniently corrected by afactor depending upon the structural context of the specificshot boundary, gauged through a suitable function.
It is possible to generalize this suggestion resorting tocontextual Bayesian analysis [46] in which an occurrenceof the propertyB is detected by taking into account thebehaviorM(t) given a contextE, that is a set of eventse1, e2, ..., en characterizingB. Namely, H1 is chosen ifp(M(t)|B,E)P (S|E) > p(M(t)|B, E)P (B|E). Thus, a cutis detected according to the likelihood ratio
L(t) >1− P (B|E)
P (B|E), (16)
where now the r.h.s. of Eq. defines the adaptive threshold:
T (t) =1− P (E|B)P (B)
P (E|B)P (B). (17)
The prior probability P (B) models the Poisson processof boundary arrival according to the cumulative probabilityP (B) = 1
2 ·∑λ(t)
w=0µw
w! exp(−µ) [21].As regards P (E|B), under weak coupling assump-
tion [62] of structural eventse1, e2, ..., en, we can setP (e1, e2, ..., en|B) =
∏i P (ei|B). The events that constitute
the structural context can be described as follows.Consider the behavior of functionM for both abrupt and
gradual transitions. An example is depicted in Fig. 8 relatedto a video sequence characterized by the presence of two hardcuts embedding a dissolve.
Fig. 8. Plot ofM(t) function for a sequence characterized by one a dissolveregion embedded between two abrupt transitions
The first event we deal with is ashapeevent: when thegist of the world observed abruptly changes (hard cut),Mdecreases down to a minimum value.
Thus, as regards hard cuts, to calculate the probabilityP (E|B), we use a sliding window of dimensionW = 10,centered on the framef(t), thus including all frames in thetemporal interval[t− W
2 , t + W2 ], chosen with the interframe
distancel = 5. For each frame, we consider the probabilitythat the difference between the first minimum ofM, Mmin1,and the second minimumMmin2 detected within the temporalwindow, be significant
P (E|B) = P (shape|Bcut) =1
1 + exp(β′δ)(18)
where δ represents the normalized difference(Mmin1 −Mmin2)/Mmin1.
On the contrary, during a dissolve, the difference betweenconsecutive frames is reduced, and a frame is likely to be sim-ilar to the next one. Thus, the consistency function will varysmoothly across the transition interval. Indeed, the behaviorof M along a dissolve region is of parabolic type, and can bemore precisely appreciated in Fig. 9, whereM(t) decreases

8
very slowly till a local minimum point (fade-out effect), thenslowly increases (fade-in effect).
Fig. 9. Attention consistencyM in a dissolve region and its parabolic fitting
A second event, which we denotedM, stems from thefact that the first derivative function ofM is approximatelyconstant and about zero in those frames characterized bydissolve effects (see Fig. 10). Clearly, previous events are not
Fig. 10. First derivative ofM(t) in the same region shown in Fig. 9
sufficient to completely characterize the context of a dissolveregion: in factM could exhibit a similar trend, e.g. in shotsfeaturing a slow zoom. Thus, the inconsistency between theedge frames, that is the first and last frames of an hypotheticaldissolve region, must be taken into account. We denote thisevent achangeevent.
Summing up, in the case of dissolves we can assume:
P (E|B) = P (shape|Bdis)P (dM|Bdis)P (change|Bdis)(19)
To calculate the probabilityP (E|B), we use a sliding win-dow of dimensionW = 20, centered on the framef(t), whichincludes all frames in the temporal interval[t − W
2 , t + W2 ],
chosen with the interframe distancel = 5. The first term onthe r.h.s. of Eq.19 is defined as
P (shape|Bdis) =1
1 + exp(β′(dminP )), (20)
where dminP represents the distance between the absoluteminimum ofM within the temporal window and the minimumof the parabolic fitting performed onM values occurring inthe same window.
The second termP (dM|Bdis) accounting for the probabil-ity that derivativedM
dt be close to zero, is modelled as
P (dM|Bdis) = exp(−k|dMdt
− µ|), (21)
whereµ is the mean value ofdMdt within the time window. Tocompute derivatives, theM curve is preprocessed via medianfiltering [41] in order to avoid noise boost-up.
The third termP (change|Bdis), representing the probabil-ity that the first and the last frame of the dissolve be different,is given by
P (change|Bdis) = 1− 1
1 + exp(−β(M(T (fstart), T (fend))− δ′)),
(22)wherefstart andfend are the first and last frame of the slidingwindow, fstart = ft−W
2and fend = ft+ W
2respectively. The
variationδ′ is defined as
δ′ = Mmin + (Mmax −Mmin)/2 (23)
whereMmin and Mmax represent the absolute minimumand maximum values of theM function within the window,respectively.
The likelihood in Eq.16 is estimated, on training sequences,by computing the histograms of theM(t) values within a shotand at its boundaries, respectively; then, ideal distributionsare derived in non parametric form through Parzen windows[12] using kernelsξ(1 − M) exp(−(1 − M)) (boundaries)and 1
σ√
2πexp(−((1−M)− µ)2/2σ2) (within shot) , where
ξ = 2.5, µ = 1.1, σ = 0.4, are the estimated parameters.Eventually, the decision module can be outlined as in Fig. 11.
Fig. 11. The decision module for inferring boundary presence fromM(t)behavior and prior/contextual knowledge
The input is represented by theM(t) sequence computedby applying the AC algorithm on the video sequence, together

9
with contextual knowledge. Boundary detection is accom-plished according to a two-step procedure, which we denoteInconsistency Detection (ID).
In a first step abrupt transitions are detected by meansof Eqs. 16, 17, 18. At the end of this phase we obtain thepositions of hard cuts, which partition the original video in asequence of blocks representing candidate shots.
In a second step, the frames interested in dissolve effects aredetected. For each block, dissolve regions are individuated bymeans of Eqs. 16, 17, 20, 21, 22, computed through a slidingwindow centered on each frame of the block, chosen accordingto an interframe distancel = 5. Eventually, the output of thesystem is represented by the list of shot boundary positions,defining the shot segmentation of the original video.
The first step of the ID algorithm has complexityO(N/l),N being the number of frames of the video sequence. The sec-ond step isO(WNbLb/l), whereW,Nb, Lb are the dimensionof the sliding window, the number of blocks partitioned alongthe first step, and the maximum block length, respectively.
The dimensions of the sliding windows have been chosen bymeans of an analysis ofROC curves obtained for the trainingset in order to maximize true detections with respect to falsealarms.
VI. EXPERIMENTS AND RESULTS
To evaluate the performance of the proposed shot detectionalgorithm, a database of video sequences has been obtainedfrom documentaries and news belonging to TREC01 videorepository and from famous movies. The database representsa total of 1694 cuts and 440 dissolves in approximately166 min. of video. The selected sequences are complex withextensive graphical effects. Videos were captured at a rateof 30 frames/sec,640 × 480 pixel resolution, and stored inAV I format. These video sequences are also characterizedfor presenting significant dissolve effects. For each sequence aground-truth was obtained by three experienced humans usingvisual inspection [16].
To obtain an estimate of parameters for detection, thetraining set, shown in Table I, has been used.
TABLE I
DESCRIPTION OF THE VIDEO TRAINING SET
Sequence Dur.(sec.) Transitions (Abrupt-Gradual)The School of Athens (Docum.) 60 0-9
BOR03 (Doc. TREC01) 330 34-21ANNI006 (Doc. TREC01) 366 41-28
The Time Machine (Movie) 118 15-6The Life is Beautiful (Movie) 600 100-30
Moulin Rouge (Movie) 700 200-10Total 36 min 390-104
Experiments for performance evaluation were carried out ona test set including a total of 1304 cuts and 336 dissolves in130 min. of video, which is summarized in Table II.
The comparison between the proposed algorithm’s outputand the ground truth relies on the well knowrecall andprecision figures of merit [16]:
recall = detects/(detects + MD) (24)
TABLE II
DESCRIPTION OF THE VIDEO SEQUENCES IN THE TEST SET
Sequence Dur.(sec.) Transitions (Abrupt-Gradual)ANNI005 (Doc.TREC01) 245 38-8BOR02 (Doc.TREC01) 328 20-9BOR07 (Doc.TREC01) 420 45-22BOR08 (Doc.TREC01) 350 42-18NAD31 (Doc.TREC01) 516 51-19NAD33 (Doc.TREC01) 310 41-8NAD53 (Doc.TREC01) 692 62-36NAD55 (Doc.TREC01) 485 49-24NAD57 (Doc.TREC01) 420 43-23
SENSES111 (Doc.TREC01) 388 31-18Desert Storm (News) 30 4-4
Mandela (News) 22 0-3Dinosaurs (Movie) 600 205-50
Harry Potter (Movie) 661 176-21Matrix (Movie) 617 162-0
The Fifth Element (Movie) 600 191-0The Lord of the Rings II (Movie) 627 63-33
The Patriot (Movie) 500 81-47Total 130 min 1304-336
precision = detects/(detects + FA) (25)
wheredetects denotes the correctly detected boundaries, whileMD and FA denote missed detections and false alarms,respectively. In other terms, at fixed parameters,recall mea-sures the ratio between right detected shot changes and totalshot changes in a video, whileprecision measures the ratiobetween right detected shot changes and the total shot changesdetected by algorithm.
Results obtained are provided in Tables III and IV andsummarized in Table V.
TABLE III
ABRUPT TRANSITION PERFORMANCE OF THE FOVEATED DETECTION
METHOD
Video Cuts Detections MD FAANNI005 38 40 0 2BOR02 20 19 1 0BOR07 45 50 1 6BOR08 42 41 2 3NAD31 51 52 0 1NAD33 41 41 0 0NAD53 62 65 1 4NAD55 49 49 0 0NAD57 43 42 2 1
SENSES111 31 31 2 2Desert Storm 4 4 0 0
Dinosaurs 205 210 3 8Harry Potter 176 176 0 0
Matrix 162 170 2 10The Fifth Element 191 189 3 1
The Lord of the Rings II 63 67 0 4The Patriot 81 83 1 3
Total 1304 1322 18 45
The proposed method achieves a 97% recall rate with a 95%precision rate on abrupt transitions, and a 92% recall rate witha 89% precision rate on gradual transitions (Table V). In orderto provide an idea about the quality of this results, we referto the discussion published by Hanjalic [21]. In particular, ondissolve detection, it is worth comparing with Lienahrt [30]and works therein reported, [29], [63].
Also, Table V provides results in terms of theF1 metric,

10
TABLE IV
GRADUAL TRANSITION PERFORMANCE OF THE FOVEATED DETECTION
METHOD
Video Dissolves Detections MD FAANNI005 8 8 2 2BOR02 9 10 3 4BOR07 22 24 3 5BOR08 18 16 2 0NAD31 19 22 1 4NAD33 8 8 0 0NAD53 36 38 0 2NAD55 24 27 2 5NAD57 23 21 3 1
SENSES111 18 21 1 4Desert Storm 4 4 0 0
Mandela 3 3 0 0Dinosaurs 50 52 5 7
Harry Potter 21 22 1 2The Lord of the Rings II 33 35 5 7
The Patriot 47 49 2 4Total 336 360 30 43
TABLE V
PERFORMANCE OF THE METHOD
Type of Transition Average Recall Average Precision F1Abrupt 0.97 0.95 0.93Gradual 0.92 0.89 0.90
F1 = 2 × precision × recall/(precision + recall), whichis commonly used to combineprecision and recall scores[48], F1 being high only when both scores are high. Summingup, the method proposed here achieves an overall averageF1 performance of0.91 when considering both kinds oftransitions. This result can indicatively be compared to theperformance of a recently proposed method [48] that usesglobal and block wise histogram differences, camera motionlikelihood, followed by k-nearest neighbor classification. Suchmethod achieves anF1 performance of0.94 and 0.69, forhard cuts and gradual transitions, respectively, resulting in anaverage performance of0.82; interestingly enough, this resultis higher than average scores (0.82 and0.79) obtained by thetwo best performing systems at 2001 TREC evaluation [48]. Itis worth noting that, in our case, the overall score of0.91 alsoaccounts for results obtained by processing movies included inour test set, which eventually resulted to be the most critical.For completeness sake, by taking into account only TREC01video sequences, the overall performance of our method is0.925.
As regards the efficiency of the method, recall that to obtainthe visuomotor trace of the frame, main effort is spent onpyramid and WTA computation, which can be estimated asan O(|Ω|) step, where|Ω| represents the number of samplesin the image supportΩ, while FOA analysis involves lowertime complexity, since each of theK FOAs is defined on alimited support with respect to the original image (1/36|Ω|)and only 10 FOAs are taken into account to form a trace.The AC algorithm isO(K), that is linear in the number ofFOAs. The first step of ID algorithm has complexityO(N/l),N and l being the number of frames of the video sequenceand the interframe distance, respectively. The second stepis O(WNbLb/l), whereW,Nb, Lb are the dimension of the
sliding window, the number of blocks partitioned along thefirst step, and the maximum block length, respectively. Fromthis analysis, by considering operations performed on a singleframe, we can expect that most of the time will be spent in thelow-level perception stage, while the AC and ID algorithmswill have higher efficiency, the former only performing on asparse representation of the frame (K = 10) and the latterworking onM(t) values of the sliding window of dimensionW . This is experimentally confirmed from the results obtainedand reported in Table VI.
TABLE VI
AVERAGE FRAME PROCESSING TIME FOR EACH STEP
Steps Low-level AC algorithm ID algorithmElapsed time (msec) 26 6.2 2.8
The system achieves a processing speed per frame of about35 ms on the Pentium IV 2.4 GHz PC (1 GB RAM). It isworth noting that the current prototype has been implementedusing the Java programming language, running in WindowsXP operating system, without any specific optimization.
Clearly, for time critical applications, the bottleneck of theproposed method, that is the computing of visuomotor traces,could be easily reduced by resorting to existing hardwareimplementation of pyramidal representations ([9]) and moreefficient realizations of the WTA scheme (e.g., in [4] a networkis presented, which hasO(lg n) time complexity).
VII. C ONCLUSION
In this paper, we have defined a novel approach to partition-ing of a video into shots based on a foveated representation ofthe video. To the best of our knowledge, foveation mechanismshave never been taken into account for video segmentation,while there are some recent applications to video compres-sion (refer to [26]). The motivation for the introduction ofthis approach stems from the fact that success or failure inthe perception of changes to the visual details of a sceneacross cuts are related to the attentive performance of theobserver [51]. By exploiting the mechanism of attention shift-ing through saccades and foveations, the proposed shot-changedetection method computes, at each time instant, a consistencymeasureM(t) of the foveation sequences generated by anideal observer looking at the video. The problem of detectinga shot change given the change of consistencyM(t) has beenconceived as a Bayesian inference of the observer from hisown visual behavior.
The main results achieved can be summarized as follows.The proposed scheme allows the detection of both cuts anddissolves between shots using a single technique, rather thana set of dedicated methods. Also, it is well grounded in visualperception theories and allows to overcome usual shortcom-ings of many other techniques proposed so far. In particular,features extracted are strictly related to the visual content ofthe frame; this, for instance is not true for simpler methods,such as histogram based methods, where, in general, totallydifferent frames may have similar histograms (e.g., a framegenerated by randomly flipping the pixels of another frame

11
has the same histogram of the original one). Further, theFOA representation is robust with respect to smooth viewchanges: for instance, an object translating with respect a abackground, gives rise to a sequence of similar visuomotortraces. Meanwhile, a large object entering the scene wouldbe recognized as a significant discontinuity in the visualcontent flow of the video sequence; in this sense, the approachaccounts for the more general definition of shot as a sequenceof frames that was, or appears to be, continuously capturedfrom the same camera [16]. Once the distinctive scanpathhas been extracted from a frame, subsequent feature analysisneed only to process a sparse representation of the frame;note that for each frame, we consider10 FOAs, each FOAbeing defined on a square support region whose dimension is1/36 of the original image; further reduction is achieved atthe detection stage, where only theM function is processed(cfr. Table VI). Last, the perceptual capacity of an observerto account for his own visual behavior, naturally leads, in thisframework, to a Bayesian decision formulation for solving thedetection problem, in a vein similar to [58], [21]. In particular,by resorting to recently proposed contextual Bayesian analysis[46], we have generalized some suggestions introduced in [21]for exploiting structural information related to different typesof transitions.
It is worth remarking that, with respect to the specificproblem of gradual transitions, the present work focuses ondissolve detection. However, the detection scheme can beeasily extended to other kinds of transitions; for instance,preliminary experiments performed on wipes (not reportedhere, because out of the scope of this paper) show a behavior oftheM function characterized by a damped oscillatory pattern.Also, beyond the context of video segmentation, the proposedtechnique introduces some noveltiesper sewith respect to the“Where” and “What” integration problem, the explicit use ofthe fixation time in building a visuomotor trace, and as regardsthe way to exploit the extracted information for comparingdifferent views (information look-up problem).
Results on a test set representing a total of 1304 cutsand 336 dissolves in 130 min. of video, including videosof different kinds are reported and validate the proposed ap-proach. The performance of the currently implemented systemis characterized by a 97% recall rate with a 95% precisionrate on abrupt transitions, and a 92% recall rate with a 89%precision rate on gradual transitions. Meanwhile it exhibitsa constant quality of detection for arbitrary complex moviesequences with no need for tuning parameters. Interestinglyenough, the system has been trained on a small data set withrespect to the test set used.
However, the introduction of an attention based approachnot only is motivated by performance in shot-detection, but inperspective it could constitute an alternative to traditional ap-proaches, and overcome their limitations for high-level videosegmentation. Consider, for instance, the issue of scene changedetection by jointly exploiting video and audio information.Audio and pictorial information play different roles and, tosome extent, complementary. When trying to detect a scenedecomposition of the video sequence, the analysis of visualdata may provides candidate cuts, which are successively
validated through fusion with information extracted from audiodata. How to perform such fusion, in a principled way, is un-clear. However, behavioral studies and cognitive neurosciencehave remarked the fundamental role of attention in integratingmultimodal information [5]; and the approach proposed herecould serve as a sound basis for such integration. In this way,the low level and high level video analysis could share theprocessing steps, making the entire content analysis processmore effective and efficient.
ACKNOWLEDGMENTS
The authors are grateful to the Referees and AssociateEditor, for their enlightening and valuable comments thathave greatly improved the quality and clarity of an earlierversion of this paper. This research was also funded by theItalian Ministero per l’ Universita’ e la Ricerca Scientifica eTecnologica and by the INFM.
REFERENCES
[1] B. Adams, C. Breazeal, R.A. Brooks, and B. Scassellati, “HumanoidRobots: A New Kind of Tool,”IEEE Int. Systems, 2000, pp. 25–31.
[2] S. Antani, R. Kasturi, and R. Jain, “A survey on the use of patternrecognition methods for abstraction, indexing and retrieval of imagesand video,”Pattern Recognition, 2002, vol. 35, pp. 945–965.
[3] G. Backer, B. Mertshing and M. Bollmann, “Data and Model-DrivenGaze Control for an Active-Vision System,”IEEE Trans. on PatternAnalysis and Machine Intelligence, vol. 23, no. 12, 2001, pp. 1415–1429.
[4] Barnden and J.A. Srinivas, “Temporal winner-take-all networks: a time-based mechanism for fast selection in neural networks,”IEEE Transac-tions on Neural Networks,vol. 4, 1993, pp. 844–853.
[5] A. Berthoz, “Le sens du mouvement,” Ed. Odile Jacob, 1997.[6] G. Boccignone and M. Ferraro, “Gaze shift as a constrained random
walk,” Physica A, vol. 331, (2004), pp. 207–218.[7] D. Broadbent, “Perception and Communication,”” Pergamon, New York,
NY, 1958.[8] P.J. Burt and E.H. Adelson, “The Laplacian pyramid as a compact image
code,” IEEE Trans. on Communication, vol. 9, 1983, pp. 532–540.[9] P.J. Burt, “A Pyramid-Based Front-End Processor for Dynamic Vision
Applications,” Proc. of the IEEE, vol. 90 (7), 2002, pp. 1188–1200.[10] D. A. Chernyak and L. W. Stark, “TopDown Guided Eye Movements,”
IEEE Trans. on Systems, Man and Cybernetics- Part B, vol. 31, no. 4,2001, pp. 514–522.
[11] J. Denzler and C.M. Brown, “Information theoretic sensor data selectionfor active object recognition and state estimation,”IEEE Trans. onPattern Analysis and Machine Intelligence, vol. 24, no. 2, 2002, pp.145–157.
[12] R.O. Duda, P.E. Hart, and D.G. Stork, “Pattern Classification,” Wileyand Sons, N.Y, 2001.
[13] W.A.C. Fernando, C.N. Canagarjah, and D.R. Bull, “Fade and DissolveDetection in Uncompressed and Compressed Video Sequences,”IEEEInternational Conference on Image Processing, vol.3, 1999, pp. 299–303.
[14] M. Ferraro, G. Boccignone and T. Caelli, “Entropy-based representationof image information,”Patt. Recognit. Lett., vol. 23, 2002, pp. 1391–1398.
[15] B. Furht, S. W. Smoliar, and H. Zhang, “Video and Image Processingin Multimedia Systems,” Norwell, MA Kluwer, 1995.
[16] U.Gargi, R. Kasturi and S.H. Strayer, “Performance characterization ofvideo-shot change detection methods,”IEEE Trans. on Circ. Sys. forVideo Tech., vol.10, no. 1, 2000, pp. 1–13.
[17] G.J. Giefing, H.Janssen, and H. Mallot, “Saccadic Object Recognitionwith an Active Vision System,”Proc. 10th Eur. Conf. Art. Intell., 1992,pp. 803–805.
[18] M. A. Goodale and G. K.Humphrey, “The objects of action andperception,” Cognition, vol. 67, 1998, pp. 181–207.
[19] H. Greenspan, S. Belongie, P. Perona, S. Rakshit, and C.H. Anderson,“Overcomplete steerable pyramid filters and rotation invariance,”Proc.IEEE Computer Vision and Pattern Recognition, Seattle, Wash., 1994,pp. 222–228.

12
[20] A. Hampapur, R. Jain, and T.Weymouth, “Digital video segmentation,in Proc. ACM Multimedia94, 1994, pp. 357-364.
[21] A. Hanjalic, “Shot-Boundary Detection: Unraveled and Resolved?,”IEEE Trans. Circuits Syst. Video Technol., vol. 12, 2002, pp. 90–105.
[22] L. Itti, C. Koch, and E. Niebur, “A model of saliency-based visualattention for rapid scene analysis,”IEEE Trans. on Pattern Analysisand Machine Intelligence, vol. 20, 1998, pp. 1254–1259.
[23] L. Itti and C. Koch, “Computational modelling of visual attention,”Nature Reviews, vol. 2, 2001, pp. 1–11.
[24] T. Kikukawa and S. Kawafuchi, “Development of an automatic summaryediting system for the audio visual resources,”Trans. Inst. Electron.,Inform., Commun. Eng., vol. J75-A, no. 2, 1992, pp. 204-212.
[25] G. Krieger, I. Rentschler, G. Hauske, K. Schill, and C. Zetsche, “Objectand scene analysis by saccadic eye-movements: an investigation withhigher order statistics,”Spat. Vis., vol. 13, 2000, pp. 201–214.
[26] S. Lee, M. S. Pattichis, and A. C. Bovik, “Foveated Video Compressionwith Optimal Rate Control,” IEEE Trans. on Image Processing, vol.10, no. 7, 2001, pp. 977–992.
[27] D. Li and H. Lu, “Model based video segmentation,”IEEE Trans.Circuits Systems Video Technol., no. 5, 1995, pp. 533–544.
[28] R. Lienhart, “Reliable transition detection in videos: a survey andpracticioner’s guide,”International Journal of Image and Graphics, Vol.1, No. 3, 2001, pp. 469–486.
[29] R. Lienhart, “Comparison of Automatic Shot Boundary Detection Algo-rithms,” Proc. of SPIE 3656-29 Image and Video Processing, vol. VII,1999, pp. 1–12.
[30] R. Lienhart, “Reliable Dissolve Detection”,Proc. SPIE 4315, 2001, pp.219–230.
[31] T. M. Liu, H. J. Zhang, and F. H. Qi, “A novel Video Key FrameExtraction Algorithm,” IEEE International Symposium on Circuits andSystem, vol. 4, 2002, pp. 149–152.
[32] S. Mallat, “A wavelet tour of signal processing,” Academic Press, NY,1998.
[33] R. Milanese, S. Gil, and T. Pun, “Attentive mechanisms for dynamicand static scene analysis,”Opt. Eng., vol. 34, 1995, pp. 2428-2434.
[34] A. Nagasaka and Y. Tanaka, “Automatic video indexing and full-videosearch for object appearances,”Visual Database Systems II, 1995,pp.113–127.
[35] W. W. Nelson and G. R. Loftus, “The functional visual field duringpicture viewing,”Journ. of. Exp. Psych., Human Learning and Memory,vol. 6, 1980, pp. 391–399.
[36] E. Niebur and C. Koch, ”Computational architectures for attention,” TheMIT Press, Cambridge, MA, 1998.
[37] D. Noton and L. Stark, “Scanpaths in saccadic eye movements whileviewing and recognising patterns,”Vis. Res., vol. 11, 1971, pp. 929–942.
[38] K. O’Regan, “Solving the ’real’ mysteries of visual perception: Theworld as an outside memory,”Can. J. of Psychology, vol. 46, no. 3,1992, pp. 461–488.
[39] K. Otsuji, Y. Tonomura, and Y. Ohba, “Video browsing using brightnessdata,” in Proc. SPIE-IST VCIP91, vol. 1606, 1991, pp. 980-989.
[40] D. Parkhurst, K.Law, and E.Niebur, “Modeling the role of salience inthe allocation of overt visual attention,”Vis. Res., vol. 42, 2002, pp.107-123.
[41] I. Pitas and A. N. Venetsanopoulos, “Non-linear Filters,” Kluwer, 1989.[42] C. M. Privitera and L. W. Stark, “Algorithms for Defining Visual
Regions-of-Interest: Comparison with Eye Fixations,”IEEE Trans. onPattern Analysis ans Machine Intelligence, vol. 22, no. 9, 2000, pp.970–982.
[43] R. P. N. Rao and D. H. Ballard, “Dynamic model of visual recognitionpredicts neural response properties in the visual cortex,”Neur. Comp.,vol 9, 1997, pp. 721–763.
[44] R.P.N. Rao, “An optimal estimation approach to visual perception andlearning,” Vis. Res.,vol. 39, 1999, pp. 1963–1989.
[45] R.A. Rensink, J.K. O’Regan, and J.J. Clark, “To see or not to see: theneed for attention to perceive changes in scenes,”Psych. Sc., vol. 8,1997, pp. 368-373.
[46] W. Richards, A. Jepson, and J. Feldman, “Priors, preferences andcategorical percepts,” inPerception as Bayesian Inference, D.C. Knill,W. Richards, eds., Cambridge University Press, MA, 1996, pp. 93–122.
[47] R. D. Rimey and C. M. Brown, “Controlling Eye Movements withHidden Markov Models,”Int. J. of Comp. Vis., vol. 7, 1991, pp. 47–65.
[48] Y. Qi, A. Haptmann, and T. Liu, “Suprvised Classification for VideoShot Segmentation,”Proceedings of ICME 2003, 2003.
[49] K. Schill, E. Umkehrer, S. Beinlich, G. Krieger, and C. Zetzsche,“Scene analysis with saccadic eye movements: top-down and bottom-upmodeling,” J. Electronic Imaging(in press).
[50] B. Shahraray, “Scene change detection and content-based sampling ofvideo sequences,” inProc. IST-SPIE, vol. 2419, Feb. 1995, pp. 2-13.
[51] D.J. Simons and D.T. Levin, “Change blindess ,”Trends in Cog. Sc.,no. 7, 1997, pp. 261–267.
[52] E.A. Styles, “The psychology of attention. Psychology Press,” Hove,1997.
[53] M.J. Swain and D.H. Ballard, “Color indexing,”Int. Journal of ComputerVision, vol. 7, n. 1, 1991, pp. 11–32.
[54] J. K. Tsotsos, et al., “Modeling visual-attention via selective tuning,”Art. Intell., vol.78, 1995, pp. 507–545.
[55] A.M. Tekalp, “Digital video processing,” Prentice Hall, NJ, 1995.[56] S. Thorpe, A. Delorme, and R. Van Rullen, “Spike-based strategies for
rapid processing,”Neural Networks, vol. 14, 2001, pp. 715–725.[57] B.T. Truong, C. Dorai, and S. Venkatesk, “New Enhancements to Cut,
Fade, and Dissolve detection Processes in Video Segmentation,”ACMMultimedia, 2000, pp. 219–227.
[58] N. Vasconcelos and A. Lippman, “Statistical models of video structurefor content analysis and characterization,”IEEE Trans. Image Process-ing, vol. 9, Jan 200, pp. 3-19.
[59] G.J. Walker-Smith, A.G. Gale, and J.M. Findlay, “Eye movementstrategies involved in face perception,”Perception, vol. 6, 1977, pp.313–326.
[60] A.L. Yarbus, “Eye movements and vision,” Plenum Press, New York,NY, 1967.
[61] B.-L. Yeo and B. Liu, “Rapid scene analysis on compressed video,”IEEE Trans. Circuits Syst. Video Technol., vol. 5, Dec. 1995, pp. 533-544.
[62] A.L. Yuille and H.H. Bulthoff, “Bayesian decision theory and psy-chophysics,” in Perception as Bayesian Inference, D.C. Knill, W.Richards, eds., Cambridge University Press, MA, 1996, pp. 123–162.
[63] R. Zabih, J. Miller, and K. Mai, “A Feature-Based Algorith, for Detect-ing and Classifying Scene Breaks,”Proc. ACM Int. Conf. Multimedia,1995, pp. 189–200.
[64] H. Zhang, A. Kankanhalli, and S. W. Smoliar, “Automatic partitioningof full-motion video,” Multimedia Syst., vol. 1, 1993, pp. 10-28.