Foveal Avascular Zone in Normal Tension...
8
Research Article Foveal Avascular Zone in Normal Tension Glaucoma Measured by Optical Coherence Tomography Angiography Maja Zivkovic, 1,2 Volkan Dayanir, 3 Tolga Kocaturk, 4 Marko Zlatanovic, 2 Gordana Zlatanovic, 1,2 Vesna Jaksic, 5 Marija Radenkovic, 2 Predrag Jovanovic, 1,2 Sanja Sefic Kasumovic, 6 Mladjan Golubovic, 7 and Svetlana Jovanovic 8 1 Medical Faculty, Department of Ophthalmology, University of Nis, Nis, Serbia 2 Ophthalmology Clinic, Clinical Center Nis, Nis, Serbia 3 BATIGOZ Health Group Eye Clinic, Izmir, Turkey 4 Department of Ophthalmology, Adnan Menderes University Medical School, Aydin, Turkey 5 Medical Faculty, Department of Ophthalmology, University of Belgrade, Belgrade, Serbia 6 Eye Clinic “Dr. Sefic”, Sarajevo, Bosnia and Herzegovina 7 Center for Anesthesiology and Reanimatology, Clinical Center Nis, Nis, Serbia 8 Department of Ophthalmology, Faculty of Medical Sciences, University of Kragujevac, Kragujevac, Serbia Correspondence should be addressed to Svetlana Jovanovic; [email protected] Received 6 September 2017; Revised 22 November 2017; Accepted 27 November 2017; Published 17 December 2017 Academic Editor: Mitsuru Nakazawa Copyright © 2017 Maja Zivkovic et al. is is an open access article distributed under the Creative Commons Attribution License, which permits unrestricted use, distribution, and reproduction in any medium, provided the original work is properly cited. Aim. To measure diameter of foveal avascular zone (FAZ), FAZ area, and vessel density using Optical Coherence Tomography Angiography (OCT-A) in patients with normal tension glaucoma (NTG) and to establish the possible role of OCT-A in diagnosis and follow-up of patients with NTG. Methods. Twenty-one eyes of 21 patients with NTG and 30 eyes of 30 healthy subjects underwent complete ophthalmic examination as well as OCT-A on ZEISS AngioPlex. 3×3 macula scans were used to measure vertical, horizontal, and maximum diameter of FAZ by two graders. Mean values and interobserver variability were analyzed. Image J was used for analysis of FAZ area and vessel density. Results. Mean vertical diameter ( = 5.58, < 0.001), horizontal diameter ( = 3.59, < 0.001), maximum diameter ( = 5.94, < 0.001), and FAZ area ( = 5.76, < 0.001) were statistically significantly enlarged in the NTG group compared to those in the control group. Vessel density ( = −5.80, < 0.001) was statistically significantly decreased in the NTG group compared to that in the control group. Conclusion. OCT-A could have an important role in the future in diagnosis of patients with NTG. In patients with NTG, there is larger FAZ area, while the vessel density is reduced in comparison to the control group. 1. Introduction Normal tension glaucoma (NTG), also called low-tension glaucoma, is a chronic, progressive optic neuropathy with optic nerve deterioration and glaucomatous visual field defects [1]. Values of intraocular pressure (IOP) do not exceed the normal range of 21mmHg [2]. Vascular dysfunction has been proposed as one of the most important factors in the development and progression of NTG3. is makes the study of blood flow in NTG extremely essential. e mechanisms underlying the abnormal ocular blood flow [3–5] in NTG are still not clear, but the risk factors for glaucomatous optic neuropathy likely include oxidative stress [6], vasospasm [7], and endothelial dysfunction [8]. According to the vascular theory, damage results from low or fluctuating ocular blood flow (OBF) causing ischemia and reperfusion injury in optic nerve head (ONH), respec- tively [9]. e role of vasospasm and ischemia as the primary cause of such a vascular failure in the systemic micro- and macrocirculation [10] in NTG leads to chronic oxidative stress affecting ONH and ganglion cells. Hindawi BioMed Research International Volume 2017, Article ID 3079141, 7 pages https://doi.org/10.1155/2017/3079141
Transcript of Foveal Avascular Zone in Normal Tension...
Research ArticleFoveal Avascular Zone in Normal Tension GlaucomaMeasured by Optical Coherence Tomography Angiography
Maja Zivkovic,1,2 Volkan Dayanir,3 Tolga Kocaturk,4 Marko Zlatanovic,2
Gordana Zlatanovic,1,2 Vesna Jaksic,5 Marija Radenkovic,2 Predrag Jovanovic,1,2
Sanja Sefic Kasumovic,6 Mladjan Golubovic,7 and Svetlana Jovanovic8
1Medical Faculty, Department of Ophthalmology, University of Nis, Nis, Serbia2Ophthalmology Clinic, Clinical Center Nis, Nis, Serbia3BATIGOZ Health Group Eye Clinic, Izmir, Turkey4Department of Ophthalmology, Adnan Menderes University Medical School, Aydin, Turkey5Medical Faculty, Department of Ophthalmology, University of Belgrade, Belgrade, Serbia6Eye Clinic “Dr. Sefic”, Sarajevo, Bosnia and Herzegovina7Center for Anesthesiology and Reanimatology, Clinical Center Nis, Nis, Serbia8Department of Ophthalmology, Faculty of Medical Sciences, University of Kragujevac, Kragujevac, Serbia
Correspondence should be addressed to Svetlana Jovanovic; [email protected]
Received 6 September 2017; Revised 22 November 2017; Accepted 27 November 2017; Published 17 December 2017
Academic Editor: Mitsuru Nakazawa
Copyright © 2017 Maja Zivkovic et al. This is an open access article distributed under the Creative Commons Attribution License,which permits unrestricted use, distribution, and reproduction in any medium, provided the original work is properly cited.
Aim. To measure diameter of foveal avascular zone (FAZ), FAZ area, and vessel density using Optical Coherence TomographyAngiography (OCT-A) in patients with normal tension glaucoma (NTG) and to establish the possible role of OCT-A in diagnosisand follow-up of patients with NTG. Methods. Twenty-one eyes of 21 patients with NTG and 30 eyes of 30 healthy subjectsunderwent complete ophthalmic examination as well as OCT-A on ZEISS AngioPlex. 3 × 3 macula scans were used to measurevertical, horizontal, and maximum diameter of FAZ by two graders. Mean values and interobserver variability were analyzed.Image J was used for analysis of FAZ area and vessel density. Results. Mean vertical diameter (𝑡 = 5.58, 𝑝 < 0.001), horizontaldiameter (𝑡 = 3.59, 𝑝 < 0.001), maximum diameter (𝑡 = 5.94, 𝑝 < 0.001), and FAZ area (𝑡 = 5.76, 𝑝 < 0.001) were statisticallysignificantly enlarged in the NTG group compared to those in the control group. Vessel density (𝑡 = −5.80, 𝑝 < 0.001) wasstatistically significantly decreased in the NTG group compared to that in the control group. Conclusion. OCT-A could have animportant role in the future in diagnosis of patients with NTG. In patients with NTG, there is larger FAZ area, while the vesseldensity is reduced in comparison to the control group.
1. Introduction
Normal tension glaucoma (NTG), also called low-tensionglaucoma, is a chronic, progressive optic neuropathy withoptic nerve deterioration and glaucomatous visual fielddefects [1]. Values of intraocular pressure (IOP) do not exceedthe normal range of 21mmHg [2]. Vascular dysfunction hasbeen proposed as one of the most important factors in thedevelopment and progression of NTG3.This makes the studyof blood flow in NTG extremely essential. The mechanismsunderlying the abnormal ocular blood flow [3–5] in NTG
are still not clear, but the risk factors for glaucomatous opticneuropathy likely include oxidative stress [6], vasospasm [7],and endothelial dysfunction [8].
According to the vascular theory, damage results fromlow or fluctuating ocular blood flow (OBF) causing ischemiaand reperfusion injury in optic nerve head (ONH), respec-tively [9].The role of vasospasm and ischemia as the primarycause of such a vascular failure in the systemic micro- andmacrocirculation [10] in NTG leads to chronic oxidativestress affecting ONH and ganglion cells.
HindawiBioMed Research InternationalVolume 2017, Article ID 3079141, 7 pageshttps://doi.org/10.1155/2017/3079141

2 BioMed Research International
Several techniques (color Doppler imaging (CDI), scan-ning laser ophthalmoscopy, fundus fluorescein angiography(FFA), and laser Doppler flowmetry) have been used to mea-sure retrobulbar and intraocular hemodynamics in patientswith glaucoma [11]. All the methods currently in use tomeasure ocular blood flow (OBF) have inherent limitationsand measure different aspects of OBF [11].
In the last year, ophthalmology had a revolutionary dis-covery, Optical Coherence Tomography Angiography (OCT-A). We can measure dimensions of the foveal avascular zone(FAZ) with great reproducibility for the first time [12]. Sincevascular theory is one of the proposed theories in pathogene-sis of NTG, OCT-A might help us to better understand thepathogenesis of NTG. Until now, few papers have studiedperipapillary vessel density in primary open angle glaucoma(POAG), but no paper has studied dimensions of FAZ inpatients with NTG [12, 13]. To the best of our knowledge, thisis the first study evaluating FAZ in NTG patients using OCT-A.
2. Aim of the Paper
The aim of this paper is to measure diameter size of FAZ,FAZ area, and vessel density using OCT-A in patients withNTG and to establish possible role of OCT-A in diagnosis ofpatients with NTG.
3. Methods
This is a cross-sectional case control study. Study was con-ducted in a group of patients with confirmed NTG and insubjects without glaucoma thatwere age and gendermatched.Twenty-one eyes of 21 patients with NTG and 30 eyes of 30healthy subjects underwent complete ophthalmic examina-tion as well as OCT-A on Zeiss AngioPlex, CIRRUS HD-OCT Model 5000 instrument (Carl Zeiss Meditec, Dublin,CA). Considering that FAZ can vary in size and shape, controlgroup was established with a bigger number of healthypersons. Ocular examinations were performed in the periodfrom June 2016 to December 2016 at the Ophthalmology EyeHospital-Clinic Maja, Nis, Serbia. This study was approvedby the Ethics Committee fromOphthalmology Eye Hospital-Clinic Maja, Nis, Serbia, following the tenets of the Dec-laration of Helsinki with informed consent obtained fromall the participants. All the patients were with previouslydiagnosed NTG and complete cardiological, neurological,and rheumatological examination already done, as well ascolor Doppler imaging. All patients were treated with topicalantiglaucoma drug 𝛼2-agonist brimonidine 0.2% for at leastone year and a maximum of two years, without any othertopical or systemic medication taken in the last year.
Each patient underwent a complete ophthalmic examina-tion including best corrected visual acuity (BCVA), IOPmea-surement by Goldman applanation tonometry, gonioscopy,visual field testing using Swedish interactive thresholdingalgorithm (SITA-standard) central 24-2 Humphrey perime-try (Humphrey field analyzer II, Carl Zeiss Meditec, Dublin,CA, USA), biomicroscopy, fundus examination with a plus90-diopter lens, multicolor disc photograph, and OCT-A on
Zeiss AngioPlex, CIRRUS HD-OCTModel 5000 instrument(Carl Zeiss Meditec, Dublin, CA). Diagnostic criteria forNTG follow the criteria of the European Glaucoma Society[1]: (1) patients older than 35 years, (2) normal IOP withouttreatment, less than 21mmHg, (3) optic nerve head damagetypical of glaucoma, (4) visual field defects typical of glau-coma, (5) gonioscopy, open anterior chamber angle, and (6)no history of steroid use. Patients with systemic disease withocular involvement like diabetes and neurological diseasescapable of causing visual field loss or optic disc deteriorationand other eye disease (except glaucoma), opacification ofocularmedia, intraocular surgery, refractive errorsmore than+/− 2 D, and history of ocular traumawere excluded from thestudy.Thedatawas stratified based on patient Caucasian race.
Inclusion criteria for the control group (CG) were (1)no history or evidence of retinal and eye pathology, (2)no history of intraocular surgery, (3) IOP ≤ 21mmHg, (4)having to be free of optic disc damage and without anysystemic and neurological diseases capable of causing visualfield loss or optic disc deterioration, (5) intact neuroretinalrim and normal retinal nerve fiber layer (RNFL) thickness,and (6) normal standard automated perimetry (defined as aglaucoma hemifield test within normal limits and a patternstandard deviation within 95% confidence-interval limits).
OCT angiography was scanned by a 68 kHz Cirrus HD-OCT 5000-based Optical Micro Angiography (OMAG) pro-totype system.Automated segmentation of the superficial anddeep capillary plexus was used for analysis. Images obtainedwere checked for quality (Signal Strength more than 6/10), aswell as absence of artifacts.
Currently, OCT-A Zeiss AngioPlex allows access to 3 ×3, 6 × 6, and 8 × 8 scans. In this study, considering thatit was very important to get accurate measurement of FAZ,3 × 3 scans were exclusively used as they give the bestview of the FAZ. We have analyzed the dimensions of FAZmanually bymeasuring vertical and horizontal diameters andused Image J for analysis of FAZ area and vessel density.Also considering the phenomenon of capillary drop out inpatients with NTG, we introduced the concept of maximumdiameter that would fit the largest diameter of FAZ for agiven FAZ analyzed (Figures 1(a)–1(c)). Two experiencedophthalmologists who were blind to the diagnoses made allthemeasurements of FAZ diameters (vertical, horizontal, andmaximum) in order to determine interobserver variability.Superficial vascular network of angiography was used since ithas been proven that there is a high interobserver variabilityin measuring of the deep vascular network, primarily due tothe shadow artifacts caused by vessels of superficial vascularnetwork. Superficial vascular network supplies the superficialstructures, namely, RNFL, ganglion cell layer, and innerplexiform layer (IPL), that are affected by glaucoma. Meanvalues of vertical, horizontal, and maximum diameters wereused for comparison.
All 3 × 3 OCT-A images were exported from the systemas a Joint Photographic Experts Group file into the NationalInstitutes of Health Image J 1.50 (a publically availableimage processing program developed by National Institutesof Health, Bethesda, Maryland, USA) software. The FAZarea and vessel density were calculated using a previously

BioMed Research International 3
(a) (b) (c)
Figure 1: Measurement of (a) vertical, (b) horizontal, and (c) maximum diameter of foveal avascular zone.
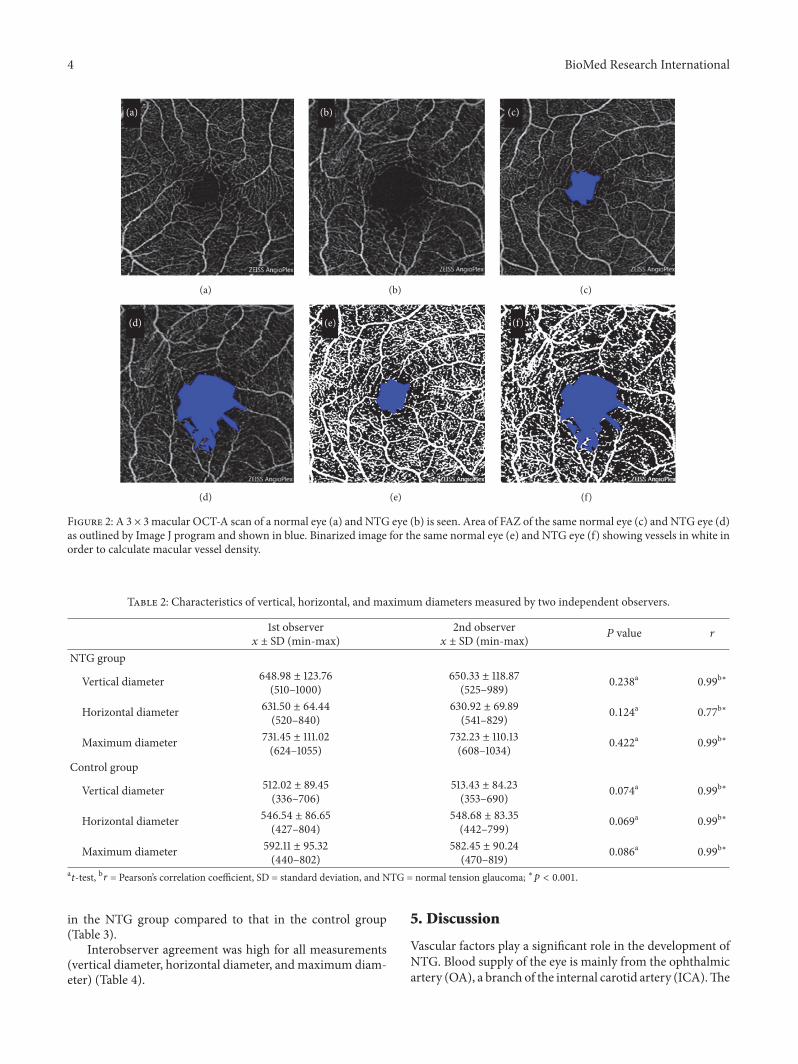
published method [14]. FAZ area was manually outlinedby the polygon selection tool. The dimension of the FAZwas expressed as square millimeters [15]. To calculate vesseldensity, images were binarized through a threshold strategysimilarly to other studies [14, 15]. The image was convertedfrom 8-bit into red green blue (RGB) colour type. Theadjusting threshold tool set to mean was applied; the dark-background option was selected. The FAZ area was coloredto pure blue. White pixels were considered as vessel, blackpixels were considered as background, and blue pixels wereautomatically excluded from the analysis. Vessel density wasexpressed as the ratio of vessel pixels to the total area (Figures2(a)–2(f)).
3.1. Statistical Analysis. Statistical analysis was performedwith the statistical package SPSS 22 for Windows. Primarydata obtained were analyzed by descriptive statistical meth-ods and methods for testing hypotheses. From the descrip-tive statistical methods, the following were used: measuresof central tendency, measures of variability, and structureindicators expressed as a percentage. To determine the nor-mality of distribution, Kolmogorov-Smirnov test was used.To test differences between 2 arithmetic means, the 𝑡-testfor independent samples (Independent-Samples 𝑡-test) wasused. To test differences of arithmeticalmean between 2mea-surements, 𝑡-test for dependent samples (Paired-Samples 𝑡-test) was used. Chi-square test of homogeneity was examinedwhether the two groups differ according to the proportion ofthe variable of interest. To test interobserver reliability, doublemixed model intraclass correlation coefficient (ICC) wasused.
Correlation analysis was performed by measuring thecorrelation between two variables. The Pearson’s correlationcoefficient was used to determine the direction and strengthof the connection. The conclusion was done at the level ofstatistical significance of 0.05.
4. Results
4.1. Patient Demographics and Baseline Characteristics of theGroup. NTG group included 21 eyes of 11 female and 10 malepatients. Mean age was 70.1 ± 6.4 years (mean ages of women
Table 1: Demographic and baseline characteristics.
NTG group(𝑛 = 21)
Control group(𝑛 = 30)
𝑃 value
Number of eyes (patients) 21 30Eye (left/right) 11/10 15/15 1.00a
Men age (SD), years 70.1 (6.4) 69.5 (5.4) 0.70b
Gender (female/male) 11/10 16/14 0.61a
a𝜒2-test, b𝑡-test, NTG = normal tension glaucoma, and SD = standard
deviation.
and men were 69.6 ± 6.4 and 70.5 ± 6.7 years, resp.). Controlgroup consisted of 30 eyes of 16 female and 14 male subjects.Mean age was 69.5 ± 5.4 years (mean ages of women andmenwere 71.6 ± 5.2 and 67.0 ± 4.6 years, resp.). There was no sta-tistically significant difference between the NTG and controlgroups with respect to gender proportion (𝜒2 = 0.46, 𝑝 =0.61) and age (𝑡 = 0.40, 𝑝 = 0.70). In the NTG and controlgroups, there was no statistically significant difference in theparticipation of the left and right eyes (𝜒2 = 0.00, 𝑝 = 1.00)(Table 1).
Statistically significant difference was not observedbetween the two measurements done within NTG and con-trol groups, respectively, for vertical (𝑡 = −1.32, 𝑝 = 0.238;𝑡 = −1.90, 𝑝 = 0.074), horizontal (𝑡 = −1.19, 𝑝 = 0.124; 𝑡 =−1.92, 𝑝 = 0.069), and the maximum diameters (𝑡 = −0.78,𝑝 = 0.422; 𝑡 = −1.79, 𝑝 = 0.086) (Table 2).
Measurements done by two independent observers in theNTG and control groups, respectively, for vertical (𝑟 = 0.99,𝑝 < 0.001; 𝑟 = 0.99, 𝑝 < 0.001), horizontal (𝑟 = 0.77,𝑝 < 0.001; 𝑟 = 0.99, 𝑝 < 0.001), and the maximum diameter(𝑟 = 0.99, 𝑝 < 0.001; 𝑟 = 0.99, 𝑝 < 0.001) were significantlypositively correlated.
Mean foveal avascular zone vertical diameter (𝑡 = 5.58,𝑝 < 0.001), horizontal diameter (𝑡 = 3.59, 𝑝 < 0.001), max-imum diameter (𝑡 = 5.94, 𝑝 < 0.001), and foveal avascularzone area (𝑡 = 5.76, 𝑝 < 0.001) in 3 × 3 macula superficialscan were all statistically significantly enlarged in NTG groupcompared to those in the control group. Vessel density (𝑡 =−5.80, 𝑝 < 0.001) was statistically significantly decreased
4 BioMed Research International
(a)
(a)
(b)
(b)
(c)
(c)
(d)
(d)
(e)
(e)
(f)
(f)
Figure 2: A 3 × 3 macular OCT-A scan of a normal eye (a) and NTG eye (b) is seen. Area of FAZ of the same normal eye (c) and NTG eye (d)as outlined by Image J program and shown in blue. Binarized image for the same normal eye (e) and NTG eye (f) showing vessels in white inorder to calculate macular vessel density.
Table 2: Characteristics of vertical, horizontal, and maximum diameters measured by two independent observers.
1st observer𝑥 ± SD (min-max)
2nd observer𝑥 ± SD (min-max) 𝑃 value 𝑟
NTG group
Vertical diameter 648.98 ± 123.76(510–1000)
650.33 ± 118.87(525–989) 0.238a 0.99b∗
Horizontal diameter 631.50 ± 64.44(520–840)
630.92 ± 69.89(541–829) 0.124a 0.77b∗
Maximum diameter 731.45 ± 111.02(624–1055)
732.23 ± 110.13(608–1034) 0.422a 0.99b∗
Control group
Vertical diameter 512.02 ± 89.45(336–706)
513.43 ± 84.23(353–690) 0.074a 0.99b∗
Horizontal diameter 546.54 ± 86.65(427–804)
548.68 ± 83.35(442–799) 0.069a 0.99b∗
Maximum diameter 592.11 ± 95.32(440–802)
582.45 ± 90.24(470–819) 0.086a 0.99b∗
a𝑡-test, b𝑟 = Pearson’s correlation coefficient, SD = standard deviation, and NTG = normal tension glaucoma; ∗𝑝 < 0.001.
in the NTG group compared to that in the control group(Table 3).
Interobserver agreement was high for all measurements(vertical diameter, horizontal diameter, andmaximum diam-eter) (Table 4).
5. Discussion
Vascular factors play a significant role in the development ofNTG. Blood supply of the eye is mainly from the ophthalmicartery (OA), a branch of the internal carotid artery (ICA).The

BioMed Research International 5
Table 3: Characteristics of the average value of vertical, horizontal, and maximum diameter, foveal avascular zone area, and vessel density inNTG and control group.
Average between 2measurements
NTG group𝑥 ± SD
(min-max)
Control group𝑥 ± SD
(min-max)𝑃 value
Vertical diameter 649.43 ± 112.55(517.5–994.5)
512.23 ± 85.90(344.5–697.0) <0.001a
Horizontal diameter 630.34 ± 63.10(530.5–834.5)
559.77 ± 83.52(434.5–801.5) <0.001a
Maximum diameter 731.45 ± 112.96(616.0–1044.5)
586.83 ± 88.39(455.5–810.5) <0.001a
Foveal avascular zone area 0.412 ± 0.060(0.295–0.472)
0.292 ± 0.048(0.178–0.399) <0.001a
Vessel density 39.55 ± 3.81(35.40–41.90)
46.21 ± 3.36(43.10–50.80) <0.001a
a𝑡-test, NTG = normal tension glaucoma, 𝑥 = mean, and SD = standard deviation.
Table 4: Interobserver reliability.
NTG group(𝑛 = 21)
ICC (95% CI)
Control group(𝑛 = 30)
ICC (95% CI)
Vertical diameter 0.996(0.991–0.999)
0.994(0.990–0.997)
Horizontal diameter 0.989(0.974–0.995)
0.994(0.988–0.996)
Maximum diameter 0.996(0.991–0.998)
0.996(0.992–0.998)
NTG = normal tension glaucoma, ICC = intraclass correlation coefficient,and 95% CI = 95% confidence interval.
OA gives rise to ciliary arteries, which supply the choroid,outer retina, and ONH, and the central retinal artery (CRA)that supplies inner retina. Branches of CRA branch out onthe RNFL level making up the superficial plexus within theganglion cell layer while the deeper branches reach out to theinner nuclear layer and provide deep plexus [8, 10, 11].
For retrobulbar circulation monitoring, currently themost widely used method is CDI. CDI is a perfect tool toassess the large ophthalmic vessels, such as the OA, CRA,and the short posterior ciliary arteries (SPCAs) [16]. Themean velocity and the resistivity index (RI) are the twoimportant parameters that can be followed, except that RIdoes not accurately correlatewith the resistance offered by theophthalmic vessels [17, 18]. Kocaturk et al. reported increasedvascular resistance inOA in pseudoexfoliation glaucoma [19].Many studies demonstrated that the blood flow resistancewas increased and blood flow velocities were decreased intheOA and SPCAs of patients with POAG, pseudoexfoliationsyndrome, andNTG [9, 17–19]. Reduced blood flow velocitiesand increased RI in retrobulbar vessels in patients with NTGmay explain the reason for theONHfluorescein filling defectsand capillary loss of the ONH of these patients [18].
Since it is proven that there are changes at the level of OA,CRA, and SPCAs, the main arteries that supply the eye withblood, great importance is given in finding adequatemethodsthat will examine the most credible changes in intraocular
blood vessels. Numerous studies have followed the retinalarteriovenous passage (AVP) times and the perfusion ofretinal and choroidal microvascular beds with fluoresceinangiography and found that the AVP was prolonged in NTGpatients [20]. Arend et al. examined whether a macular capil-lary density reduction and/or peripapillary diameter changesaccount for the pathological retinal circulation in patientswith NTG [21]. They speculated that pathological alterationsof arterial or venous diameter or macular vasculature mightoccur inNTG, causing gliosis-like repairmechanisms, or thatretinal capillary density is reduced as a sign of ischaemicdisease. Capillary dropout or vasoconstriction of the retinalvasculature could contribute to increased resistance. In thestudy, they used digital scanning laser fluorescein angiogra-phy (Rodenstock Instruments, Ottobrunn,Germany) and theangiograms were recorded on NTSC Sony videotapes. Theirresults showed that the AVP time of NTG patients was signif-icantly prolonged when compared with healthy subject data,but morphological data of FAZ and perifoveal intercapillaryareas did not differ from healthy subjects; neither did peri-papillary arterial and venous diameter measurements [21].
In recent years, the measurement of ocular blood flowhas become easier and noninvasive owing to the developmentof OCT-A. OCT-A enables us to measure the dimension ofFAZ, capillary-free area in centralmacula with high accuracy.Up to now, there was not any information in the literatureon FAZ area and macular vessel density at NTG measuringwith OCT-A, although there are many papers related to theperipapillary and macular vessel density in healthy persons[22, 23] and in patients with the POAG. Yarmohammadi etal. have found that reduced peripapillary and macular vesseldensity were detectable in the perimetrically intact hemireti-nae of glaucoma eyes with a single-hemifield defect [24].Their conclusion was that OCT-A potentially shows promisefor identifying focal glaucomatous damage before VF defectsare detectable.
Numerous studies using OCT-A in patients with openangle glaucoma have demonstrated reduced ONH and peri-papillary vessel densities in patients with glaucoma [25–27].Also many studies have demonstrated that peripapillary

6 BioMed Research International
angioflow density shows strong correlation with the RNFLthickness [26–28].
There are only few papers that were done with NTGpatients, but the authors followed only peripapillary vesseldensity, not macular vessel density. Shin et al. demonstratedthat peripapillary vessel density maps of superficial and deepretinal layers were significantly reduced at the 7 and 11 o’clockpositions in glaucomatous eyes [29]. Scripsema et al. com-pared perfused peripapillary capillary densities in POAG,NTG, and normal patients using OCT-A and showed thatPOAG and NTG patients had a reduction of perfused cap-illaries that progressed in size when comparing early, moder-ate, and severe glaucoma groups [30]. Bojikian et al. inves-tigated optic disc perfusion differences in healthy subjects,POAG, and NTG and showed that optic disc perfusion wassignificantly reduced in POAG andNTG groups compared tonormal controls, but no difference was seen between POAGand NTG groups with similar levels of VF damage [20].Igarashi et al. published that flow density and the disappear-ance angle of the radial peripapillary capillaries were signif-icantly and independently correlated with glaucoma-relatedfunctional and morphological changes in the optic nerve inPOAG and NTG [31].
Our study is the first one that follows macular vessel den-sity and FAZ area in NTG. In our study, larger FAZ areas withreduced vessel density were found in NTG patients. It wouldbe possible to define an exact value of FAZ area to supportthe diagnosis of NTG or other types of glaucoma with largernumber of patients. These vascular parameters are graduallybecoming important in terms of diagnosis, progression, andtreatment options in the management of the patients withglaucoma.
As far as we know, this is the first study that will shed lighton further investigation about FAZ in patients with NTG.Further investigations related to the FAZ and peripapillaryandmacular vessel density are needed with larger numbers ofpatients in order to determine the role ofOCT-A in glaucoma.
6. Conclusion
OCT-A could have an important role in the future indiagnosis of patients with NTG as well as in understandingthe pathophysiology of NTG. We have shown that, for thefirst time in the literature, NTG patients have larger FAZ areaand reduced macular vessel density compared to the controlgroup.
Disclosure
There is no financial or proprietary interest in any materialsor methods described herein.
Conflicts of Interest
The authors have no proprietary or commercial interests inany concept or product discussed in this paper.
References
[1] European Glaucoma Society, Terminology and Guidelines forGlaucoma, Editrice Dogma, Savon, Italy, 4nd edition, 2014.
[2] M. B. Shields and G. L. Spaeth, “The glaucomatous process andthe evolving definition of glaucoma,” Journal of Glaucoma, vol.21, no. 3, pp. 141–143, 2012.
[3] C. D. Phelps and J. J. Corbett, “Migraine and low-tensionglaucoma. A case-control study,” Investigative Ophthalmology &Visual Science, vol. 26, no. 8, pp. 1105–1108, 1985.
[4] J. Flammer, K. Konieczka, and A. J. Flammer, “The primaryvascular dysregulation syndrome: implications for eye diseases,”EPMA Journal, vol. 4, no. 1, article 14, 2013.
[5] M. Mozaffarieh and J. Flammer, “Ocular blood flow andglaucomatous optic neuropathy,” Ocular Blood Flow and Glau-comatous Optic Neuropathy, pp. 1–105, 2009.
[6] M. Mozaffarieh and J. Flammer, “New insights in the patho-genesis and treatment of normal tension glaucoma,” CurrentOpinion in Pharmacology, vol. 13, no. 1, pp. 43–49, 2013.
[7] Y. Delaney, T. E. Walshe, and C. O’Brien, “Vasospasm inglaucoma: clinical and laboratory aspects,” Optometry andVision Science, vol. 83, no. 7, pp. 406–414, 2006.
[8] N. Fan, P. Wang, L. Tang, and X. Liu, “Ocular blood flow andnormal tension glaucoma,” BioMed Research International, vol.2015, Article ID 308505, 2015.
[9] J. C. Tsai, “Influencing ocular blood flow in glaucoma patients:The cardiovascular system and healthy lifestyle choices,” Cana-dian Journal of Ophthalmology, vol. 43, no. 3, pp. 347–350, 2008.
[10] J. Bossuyt, G. Vandekerckhove, T. L. M. De Backer et al.,“Vascular dysregulation in normal-tension glaucoma is notaffected by structure and function of the microcirculationor macrocirculation at rest: A case-control study,” Medicine(United States), vol. 94, no. 2, p. e425, 2015.
[11] S. Xu, S. Huang, Z. Lin, W. Liu, and Y. Zhong, “Color dopplerimaging analysis of ocular blood flow velocities in normaltension glaucoma patients: ameta-analysis,” Journal of Ophthal-mology, vol. 2015, pp. 1–24, 2015.
[12] R. Mastropasqua, L. Toto, P. A. Mattei et al., “Reproducibilityand repeatability of foveal avascular zone area measurementsusing swept-source optical coherence tomography angiographyin healthy subjects,” European Journal of Ophthalmology, vol. 27,no. 3, pp. 336–341, 2017.
[13] W. A. Samara, E. A. T. Say, C. T. L. Khoo et al., “Correlationof foveal avascular zone size with foveal morphology in normaleyes using optical coherence tomography angiography,” Retina,vol. 35, no. 11, pp. 2188–2195, 2015.
[14] M. B. Parodi, M. V. Cicinelli, A. Rabiolo et al., “Vessel densityanalysis in patients with retinitis pigmentosa by means ofoptical coherence tomography angiography,” British Journal ofOphthalmology, vol. 101, no. 4, pp. 428–432, 2017.
[15] M. Battaglia Parodi, A. Rabiolo, M. V. Cicinelli, P. Iacono,F. Romano, and F. Bandello, “Quantitative analysis of opticalcoherence tomography angiography in adult-onset foveomac-ular vitelliform dystrophy,” Retina, 2017.
[16] F. Jimenez-Aragon, E. Garcia-Martin, R. Larrosa-Lopez, J.M. Artigas-Martın, P. Seral-Moral, and L. E. Pablo, “Role ofcolor Doppler imaging in early diagnosis and prediction ofprogression in glaucoma,” BioMed Research International, vol.2013, Article ID 871689, 11 pages, 2013.
[17] I. Marjanovic, M. Marjanovic, A. Martinez, V. Markovic, M.Bozic, and V. Stojanov, “Relationship between blood pressure

BioMed Research International 7
and retrobulbar blood flow in dipper and nondipper primaryopen-angle glaucoma patients,” European Journal of Ophthal-mology, vol. 26, no. 6, pp. 588–593, 2016.
[18] M. T. Nicolela, S. N. Ferrier, C. A. Morrison et al., “Effects ofcold-induced vasospasm in glaucoma: the role of endothelin-1,”Investigative Ophthalmology & Visual Science, vol. 44, no. 6, pp.2565–2572, 2003.
[19] T. Kocaturk, I. Isikligil, B. Uz, V. Dayanir, and Y. O. Dayanir,“Ophthalmic artery blood flowparameters in pseudoexfoliationglaucoma,” European Journal of Ophthalmology, vol. 26, no. 2,pp. 124–127, 2015.
[20] K. D. Bojikian, C. Chen, J. C. Wen et al., “Optic disc perfusionin primary open angle and normal tension glaucoma eyes usingoptical coherence tomography-based microangiography,” PLoSONE, vol. 11, no. 5, p. e0154691, 2016.
[21] O. Arend, A. Remky, N. Plange, B. J Martin, and A. Harris,“Capillary density and retinal diametermeasurements and theirimpact on altered retinal circulation in glaucoma: A digital flu-orescein angiographic study,” British Journal of Ophthalmology,vol. 86, no. 4, pp. 429–433, 2002.
[22] A. Shahlaee,M. Pefkianaki, J. Hsu, and A. C. Ho, “Measurementof foveal avascular zone dimensions and its reliability in healthyeyes using optical coherence tomography angiography,” Ameri-can Journal of Ophthalmology, vol. 161, pp. 50–55.e1, 2016.
[23] G. N.Magrath, E. A. T. Say, K. Sioufi, S. Ferenczy,W. A. Samara,and C. L. Shields, “Variability in foveal avascular zone andcapillary density using optical coherence tomography angiog-raphy machines in healthy eyes,” Retina, 2016.
[24] A. Yarmohammadi, L. M. Zangwill, A. Diniz-Filho et al., “Peri-papillary andMacularVesselDensity in PatientswithGlaucomaand Single-Hemifield Visual Field Defect,” Ophthalmology, vol.124, no. 5, pp. 709–719, 2017.
[25] X. Wang, C. Jiang, T. Ko et al., “Correlation between optic discperfusion and glaucomatous severity in patients with open-angle glaucoma: an optical coherence tomography angiographystudy,” Graefe’s Archive for Clinical and Experimental Ophthal-mology, vol. 253, no. 9, pp. 1557–1564, 2015.
[26] L. Liu, Y. Jia, H. L. Takusagawa et al., “Optical coherence tomog-raphy angiography of the peripapillary retina in glaucoma,”JAMA Ophthalmology, vol. 133, no. 9, pp. 1045–1052, 2015.
[27] A. Yarmohammadi, L. M. Zangwill, A. Diniz-Filho et al.,“Optical coherence tomography angiography vessel density inhealthy, glaucoma suspect, and glaucoma eyes,” InvestigativeOphthalmology & Visual Science, vol. 57, no. 9, pp. OCT451–OCT459, 2016.
[28] G. Hollo, “Intrasession and between-visit variability of sectorperipapillary angioflow vessel density values measured with theangiovue optical coherence tomograph in different retinal layersin ocular hypertension and glaucoma,” PLoS ONE, vol. 11, no. 8,Article ID e0161631, 2016.
[29] J. W. Shin, K. R. Sung, J. Y. Lee, J. Kwon, andM. Seong, “Opticalcoherence tomography angiography vessel density mapping atvarious retinal layers in healthy and normal tension glaucomaeyes,” Graefe’s Archive for Clinical and Experimental Ophthal-mology, vol. 255, no. 6, pp. 1193–1202, 2017.
[30] N. K. Scripsema, P. M. Garcia, R. D. Bavier et al., “Opti-cal coherence tomography angiography analysis of perfusedperipapillary capillaries in primary open-angle glaucoma andnormal-tension glaucoma,” Investigative Opthalmology&VisualScience, vol. 57, no. 9, p. OCT611, 2016.
[31] R. Igarashi, S. Ochiai, Y. Sakaue et al., “Optical coherencetomography angiography of the peripapillary capillaries in
primary open-angle and normal-tension glaucoma,” PLoSONE,vol. 12, no. 9, p. e0184301, 2017.

Submit your manuscripts athttps://www.hindawi.com
Stem CellsInternational
Hindawi Publishing Corporationhttp://www.hindawi.com Volume 2014
Hindawi Publishing Corporationhttp://www.hindawi.com Volume 2014
MEDIATORSINFLAMMATION
of
Hindawi Publishing Corporationhttp://www.hindawi.com Volume 2014
Behavioural Neurology
EndocrinologyInternational Journal of
Hindawi Publishing Corporationhttp://www.hindawi.com Volume 2014
Hindawi Publishing Corporationhttp://www.hindawi.com Volume 2014
Disease Markers
Hindawi Publishing Corporationhttp://www.hindawi.com Volume 2014
BioMed Research International
OncologyJournal of
Hindawi Publishing Corporationhttp://www.hindawi.com Volume 2014
Hindawi Publishing Corporationhttp://www.hindawi.com Volume 2014
Oxidative Medicine and Cellular Longevity
Hindawi Publishing Corporationhttp://www.hindawi.com Volume 2014
PPAR Research
The Scientific World JournalHindawi Publishing Corporation http://www.hindawi.com Volume 2014
Immunology ResearchHindawi Publishing Corporationhttp://www.hindawi.com Volume 2014
Journal of
ObesityJournal of
Hindawi Publishing Corporationhttp://www.hindawi.com Volume 2014
Hindawi Publishing Corporationhttp://www.hindawi.com Volume 2014
Computational and Mathematical Methods in Medicine
OphthalmologyJournal of
Hindawi Publishing Corporationhttp://www.hindawi.com Volume 2014
Diabetes ResearchJournal of
Hindawi Publishing Corporationhttp://www.hindawi.com Volume 2014
Hindawi Publishing Corporationhttp://www.hindawi.com Volume 2014
Research and TreatmentAIDS
Hindawi Publishing Corporationhttp://www.hindawi.com Volume 2014
Gastroenterology Research and Practice
Hindawi Publishing Corporationhttp://www.hindawi.com Volume 2014
Parkinson’s Disease
Evidence-Based Complementary and Alternative Medicine
Volume 2014Hindawi Publishing Corporationhttp://www.hindawi.com