Fourth-Quarter and Full-Year 2017 Results - Cabot Oil & Gas · Fourth-Quarter and Full-Year 2017...
28
A decade of progress and perseverance in the Marcellus Shale. February 23, 2018 Fourth-Quarter and Full-Year 2017 Results
Transcript of Fourth-Quarter and Full-Year 2017 Results - Cabot Oil & Gas · Fourth-Quarter and Full-Year 2017...

A decade of progress and perseverance in the Marcellus Shale.
February 23, 2018
Fourth-Quarter and Full-Year 2017 Results

2
This presentation includes forward‐looking statements within the meaning of Section 27A of the Securities Act of 1933, as amended, and
Section 21E of the Securities Exchange Act of 1934, as amended. The statements regarding future financial and operating performance and
results, strategic pursuits and goals, market prices, future hedging and risk management activities, and other statements that are not historical
facts contained in this report are forward-looking statements. The words “expect”, “project”, “estimate”, “believe”, “anticipate”, “intend”, “budget”,
“plan”, “forecast”, “outlook”, “target”, “predict”, “may”, “should”, “could”, “will” and similar expressions are also intended to identify forward-looking
statements. Such statements involve risks and uncertainties, including, but not limited to, market factors, market prices (including geographic
basis differentials) of natural gas and crude oil, results of future drilling and marketing activity, future production and costs, legislative and
regulatory initiatives, electronic, cyber or physical security breaches and other factors detailed herein and in our other Securities and Exchange
Commission (SEC) filings. See “Risk Factors” in Item 1A of the Form 10-K and subsequent public filings for additional information about these
risks and uncertainties. Should one or more of these risks or uncertainties materialize, or should underlying assumptions prove incorrect, actual
outcomes may vary materially from those indicated. Any forward-looking statement speaks only as of the date on which such statement is
made, and Cabot Oil & Gas (the “Company” or “Cabot”) does not undertake any obligation to correct or update any forward-looking statement,
whether as the result of new information, future events or otherwise, except as required by applicable law.
This presentation may contain certain terms, such as resource potential, risked or unrisked resources, potential locations, risked or unrisked
locations, EUR (estimated ultimate recovery) and other similar terms that describe estimates of potentially recoverable hydrocarbons that the
SEC rules prohibit from being included in filings with the SEC. These estimates are by their nature more speculative than estimates of proved,
probable and possible reserves and may not constitute “reserves” within the meaning of SEC rules and accordingly, are subject to substantially
greater risk of being actually realized. These estimates are based on the Company’s existing models and internal estimates. Actual locations
drilled and quantities that may be ultimately recovered from the Company’s interests could differ substantially. Factors affecting ultimate
recovery include the scope of the Company’s ongoing drilling program, which will be directly affected by the availability of capital, drilling and
production costs, availably of drilling services and equipment, drilling results, lease expirations, transportation constraints, regulatory approvals,
actual drilling results, including geological and mechanical factors affecting recovery rates, and other factors. These estimates may change
significantly as development of the Company’s assets provide additional data. Investors are urged to consider carefully the disclosures and risk
factors about Cabot’s reserves in the Form 10‐K and other reports on file with the SEC.
This presentation also refers to Discretionary Cash Flow, EBITDAX, Free Cash Flow, Adjusted Net Income (Loss), Return on Capital Employed
(ROCE) and Net Debt calculations and ratios. These non-GAAP financial measures are not alternatives to GAAP measures, and should not be
considered in isolation or as an alternative for analysis of the Company’s results as reported under GAAP. For additional disclosure regarding
such non-GAAP measures, including definitions of these terms and reconciliations to the most directly comparable GAAP measures, please
refer to Cabot’s most recent earnings release at www.cabotog.com and the Company’s related 8-K on file with the SEC.
Forward-Looking Statements and Other Disclaimers
3
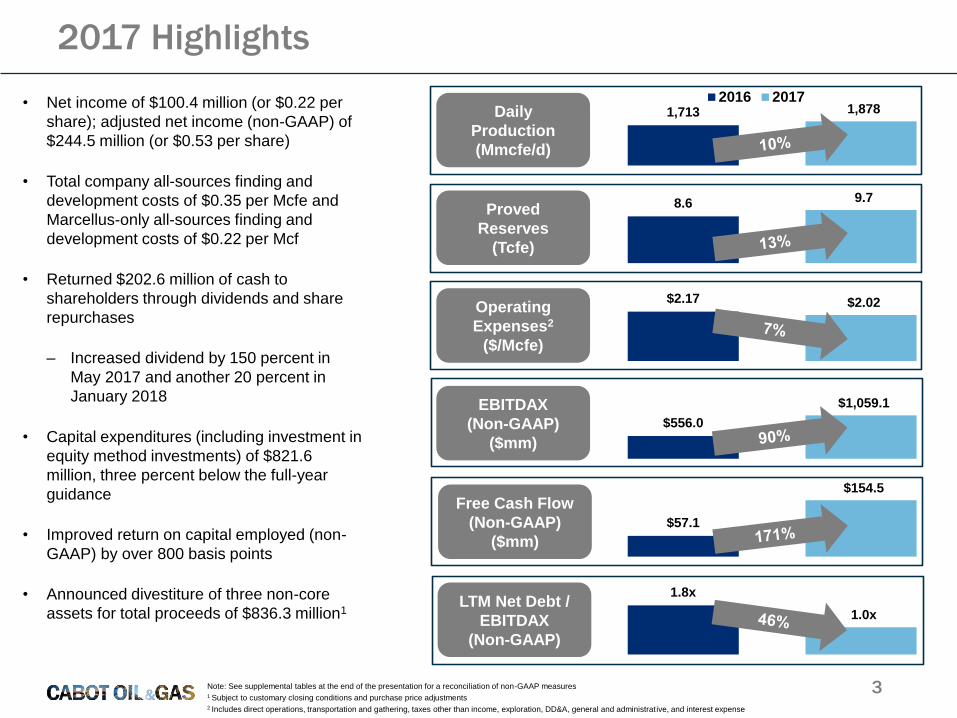
• Net income of $100.4 million (or $0.22 per
share); adjusted net income (non-GAAP) of
$244.5 million (or $0.53 per share)
• Total company all-sources finding and
development costs of $0.35 per Mcfe and
Marcellus-only all-sources finding and
development costs of $0.22 per Mcf
• Returned $202.6 million of cash to
shareholders through dividends and share
repurchases
– Increased dividend by 150 percent in
May 2017 and another 20 percent in
January 2018
• Capital expenditures (including investment in
equity method investments) of $821.6
million, three percent below the full-year
guidance
• Improved return on capital employed (non-
GAAP) by over 800 basis points
• Announced divestiture of three non-core
assets for total proceeds of $836.3 million1
Note: See supplemental tables at the end of the presentation for a reconciliation of non-GAAP measures1 Subject to customary closing conditions and purchase price adjustments2 Includes direct operations, transportation and gathering, taxes other than income, exploration, DD&A, general and administrat ive, and interest expense
Daily
Production
(Mmcfe/d)
1,713 1,8782016 2017
Proved
Reserves
(Tcfe)
8.6 9.7
Operating
Expenses2
($/Mcfe)
$2.17 $2.02
EBITDAX
(Non-GAAP)
($mm)
$556.0
$1,059.1
Free Cash Flow
(Non-GAAP)
($mm)
$57.1
$154.5
1.8x
1.0xLTM Net Debt /
EBITDAX
(Non-GAAP)
2017 Highlights
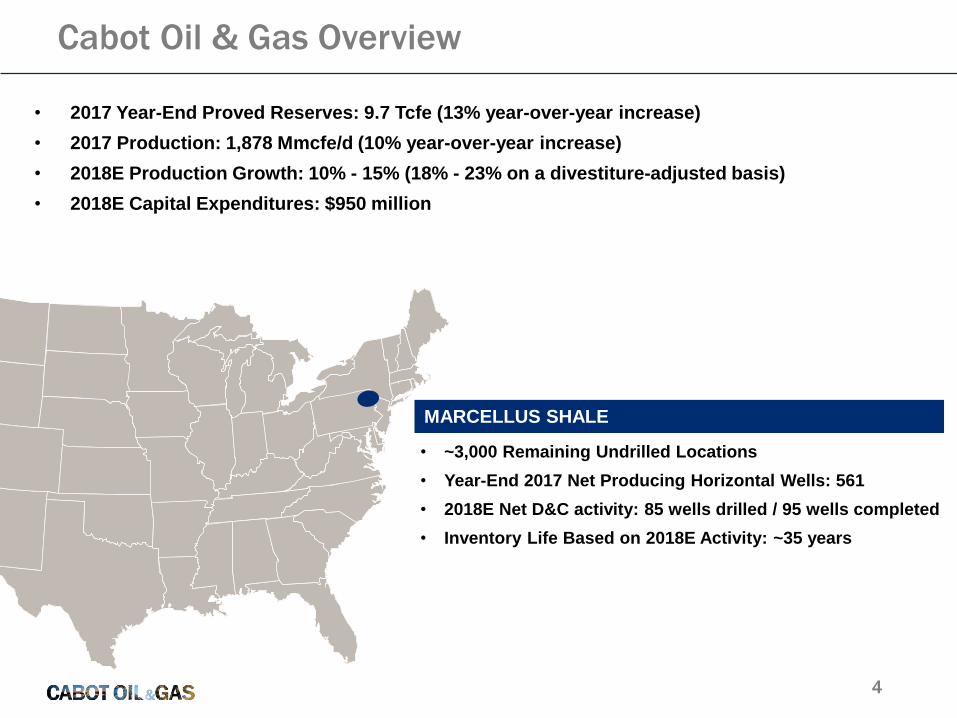
• ~3,000 Remaining Undrilled Locations
• Year-End 2017 Net Producing Horizontal Wells: 561
• 2018E Net D&C activity: 85 wells drilled / 95 wells completed
• Inventory Life Based on 2018E Activity: ~35 years
• 2017 Year-End Proved Reserves: 9.7 Tcfe (13% year-over-year increase)
• 2017 Production: 1,878 Mmcfe/d (10% year-over-year increase)
• 2018E Production Growth: 10% - 15% (18% - 23% on a divestiture-adjusted basis)
• 2018E Capital Expenditures: $950 million
4
MARCELLUS SHALE
Cabot Oil & Gas Overview

5
Cabot Oil & Gas Strategy
Deliver growth in production and
reserves per debt-adjusted share while
generating positive free cash flow
Generate an improving return on
capital employed (ROCE) that
exceeds our cost of capital
Increase the return of capital to
shareholders through dividends
and share repurchases
Maintain a strong balance sheet
to maximize financial flexibility
• 20%+ CAGR in production and reserves per debt-adjusted share from
2011 – 2017
• Three-year plan production CAGR of 17% - 21% (20% - 24% on a
divestiture-adjusted basis)
• Forecasted cumulative free cash flow of $1.6 bn - $2.5 bn from 2018 – 2020
allows for potential share repurchases and/or debt reduction, furthering
enhancing debt-adjusted per share growth
• Anticipate ROCE increasing from 7.3% in 2017 to 18% - 23% by 2020
(based on a $2.75 - $3.25 NYMEX price range)
• ROCE would be further enhanced by future share repurchases or debt
reduction
• Returned over $200 mm of capital to shareholders in 2017
– $124 mm of share repurchases (~5 mm shares)
– $79 mm of dividends
• Increased dividend by 150 percent in 2017 and 20 percent in 2018
• Increased share repurchase program authorization to 30 mm shares
(~6.5% of current shares outstanding)
• Net debt / LTM EBITDAX of 1.0x (target of 1.0x - 1.5x)
– Forecasted deleveraging during the three-year plan allows for potential
incremental balance sheet capacity in the future
• Current liquidity of ~$2.2 bn including cash on hand of $480 mm as of
12/31/2017, with further proceeds from Eagle Ford divestiture anticipated
in Q1 20181
Disciplined capital allocation focused on delivering debt-adjusted per share growth,
generating positive free cash flow, improving corporate returns on capital employed,
increasing return of capital to shareholders, and maintaining a strong balance sheet
Note: See supplemental tables at the end of the presentation for a reconciliation of non-GAAP measures1 Subject to customary closing conditions and purchase price adjustments
• Increased share repurchase program authorization to 30 million shares (~6.5% of current shares outstanding)
• Debt-adjusted per share growth and ROCE metrics added to the 2018 incentive compensation plan

2011 2012 2013 2014 2015 2016 2017
6
Daily Production Per Debt-Adjusted Share
2011 2012 2013 2014 2015 2016 2017
Year-End Proved Reserves Per Debt-Adjusted Share
Proven Track Record of Debt-Adjusted per Share Growth
Note: Debt-adjusted share count is calculated as the sum of the annual weighted average shares outstanding plus the incremental “debt shares” by dividing total debt by the average
annual share price.

7
$1.21
$0.87
$0.55
$0.71 $0.57
$0.37 $0.35
2011 2012 2013 2014 2015 2016 2017
Total Company All-Sources Finding & Development Costs ($/Mcfe)
Marcellus All-Sources Finding & Development Costs ($/Mcf)
$0.65
$0.49
$0.40 $0.43
$0.31 $0.26
$0.22
2011 2012 2013 2014 2015 2016 2017
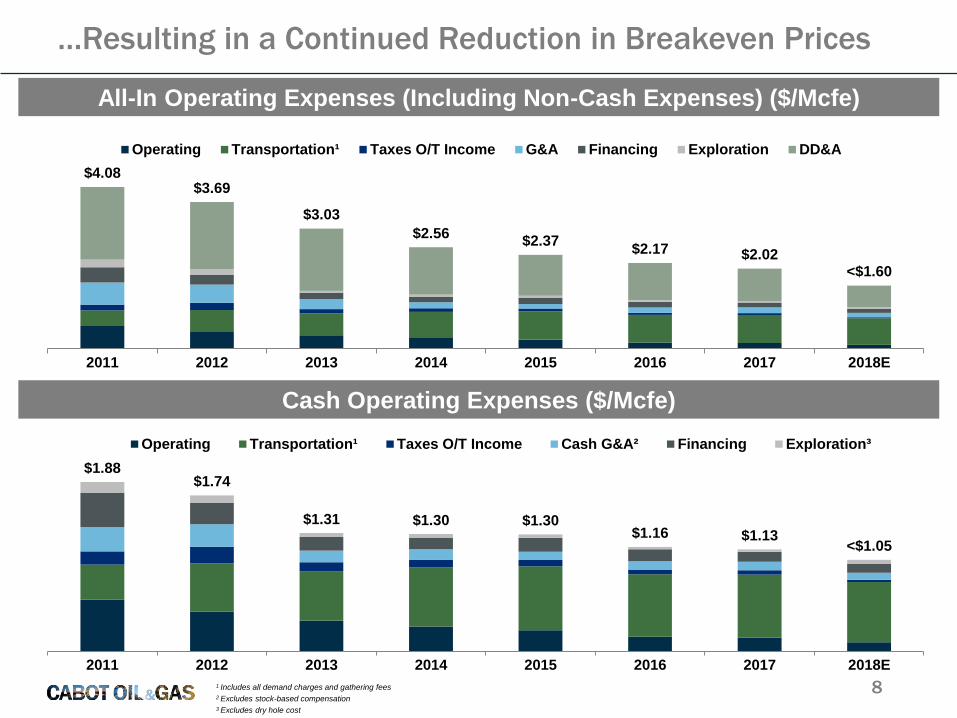
Industry-Leading Cost Structure Continues to Improve…
8
$1.88$1.74
$1.31 $1.30 $1.30$1.16 $1.13
<$1.05
2011 2012 2013 2014 2015 2016 2017 2018E
Operating Transportation¹ Taxes O/T Income Cash G&A² Financing Exploration³
1 Includes all demand charges and gathering fees
2 Excludes stock-based compensation
3 Excludes dry hole cost
Cash Operating Expenses ($/Mcfe)
…Resulting in a Continued Reduction in Breakeven Prices
$4.08$3.69
$3.03
$2.56$2.37
$2.17 $2.02<$1.60
2011 2012 2013 2014 2015 2016 2017 2018E
Operating Transportation¹ Taxes O/T Income G&A Financing Exploration DD&A
All-In Operating Expenses (Including Non-Cash Expenses) ($/Mcfe)

9
Net Debt to LTM EBITDAX
1.4x 1.4x
0.9x
1.2x
2.5x
1.8x
1.0x
2011 2012 2013 2014 2015 2016 2017
Cabot’s Balance Sheet is Well-Positioned to Provide Financial Flexibility Through the Commodity Price Cycle
Target Leverage Ratio:
1.0x – 1.5x
Note: See supplemental tables at the end of the presentation for a reconciliation of non-GAAP measures

84%
8%
6%2%
Marcellus Shale Exploration Areas
Pipeline Investments Corporate
2018 Capital Budget and Operating Plan
10
2018E Production Growth: 10% - 15% (18% - 23% on a divestiture-adjusted basis)
Marcellus Net D&C Activity by Quarter2018E Total Program Spending: $950 mm
(includes $60 mm of equity pipeline investments)
Net Production by Quarter (Mmcfe/d)1
20 23 22 2020 2327 25
0
24
36
23
Q1 2018 Q2 2018 Q3 2018 Q4 2018
Wells Drilled Wells Completed Wells TIL
Q1 2018 Q2 2018 Q3 2018 Q4 2018
~1,825 –
1,875
+6%+11%
+13%
• Assumes Gen 5 Completion Design Across the Majority of the 2018 Program
• 2018 Drilling Program Average Lateral Length: 8,300 feet
• 2018 Average Well Cost (Including Facilities): $8.3 million ($1,000 per lateral foot)
1 Q2 – Q4 production forecasts are subject to change based on the in-service timing of new infrastructure projects and takeaway capacity. Sequential growth rates are based on the midpoint of guidance.
Note: Due to larger pad sizes in Q1 and the 2nd completion crew not coming online until February 2018, wells
completed in Q1 will not be turned-in-line (TIL) until early-to-mid April 2018
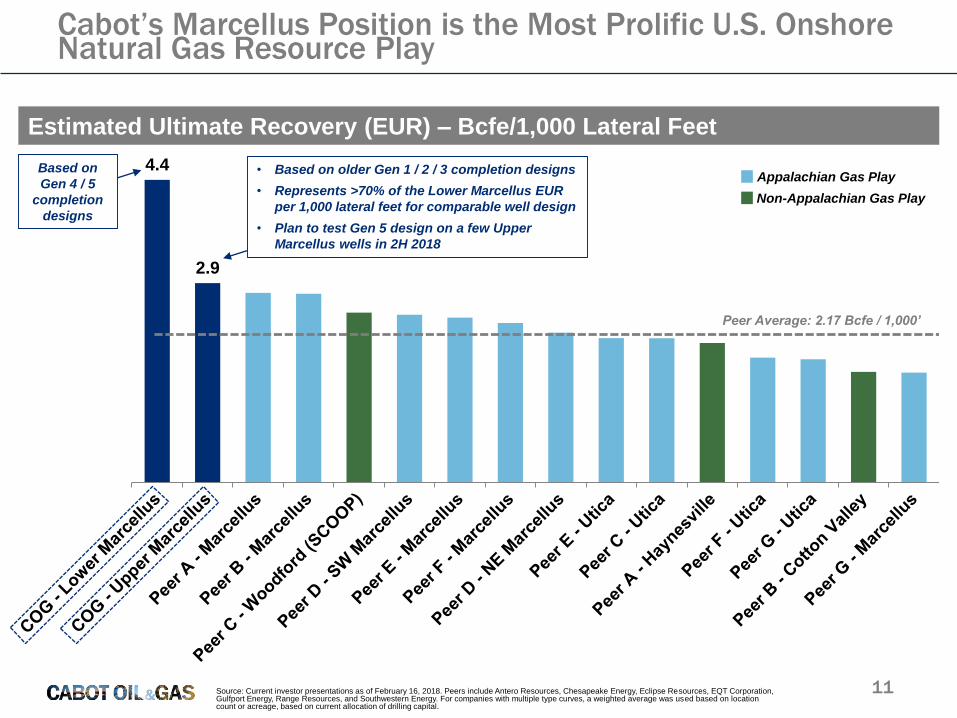
4.4
2.9
Appalachian Gas Play
Non-Appalachian Gas Play
Peer Average: 2.17 Bcfe / 1,000’
11
Estimated Ultimate Recovery (EUR) – Bcfe/1,000 Lateral Feet
Source: Current investor presentations as of February 16, 2018. Peers include Antero Resources, Chesapeake Energy, Eclipse Resources, EQT Corporation, Gulfport Energy, Range Resources, and Southwestern Energy. For companies with multiple type curves, a weighted average was used based on location count or acreage, based on current allocation of drilling capital.
Cabot’s Marcellus Position is the Most Prolific U.S. Onshore Natural Gas Resource Play
Based on
Gen 4 / 5
completion
designs
• Based on older Gen 1 / 2 / 3 completion designs
• Represents >70% of the Lower Marcellus EUR
per 1,000 lateral feet for comparable well design
• Plan to test Gen 5 design on a few Upper
Marcellus wells in 2H 2018

12
~2.15Bcf/d
2.2 2.32.6
3.6~3.7Bcf/d
165 Mmcf/d
240Mmcf/d
1 Bcf/d
150Mmcf/d
Current GrossProduction Capacity
Moxie FreedomPower Plant
(June 2018 - currentlyunder construction)
Lackawanna EnergyCenter Power Plant(June to December
2018 - currently underconstruction)
Atlantic Sunrise(Mid-2018 - currentlyunder construction)
PennEast(2019)
Future GrossProduction Capacity
Cabot continues to evaluate new opportunities to increase firm transport capacity / firm sales and remains
confident it can organically grow its production base above 3.7 Bcf/d through the following opportunities:
1) additional sales on currently approved takeaway projects (i.e. Atlantic Sunrise / PennEast)
2) incremental sales on potential future expansion projects
3) increasing in-basin market share
4) new in-basin demand projects
5) future greenfield takeaway projects (including Constitution Pipeline)
•350 Mmcf/d (COG transport capacity): 20 years
•500 Mmcf/d (COG transport capacity): 15 years
•150 Mmcf/d (3rd party transport capacity): 3 years
Note: COG firm transport capacity / firm sales are stated on a gross basis before royalties
2018 is an Inflection Year for Cabot

13
Cabot is committed to returning capital to shareholders
Return of Capital to Shareholders ($mm)
$13 $17 $25 $33 $33 $36
$79
$111
$165$139
$124
$0
$25
$50
$75
$100
$125
$150
$175
$200
$225
2011 2012 2013 2014 2015 2016 2017 2018E
Dividends Share Repurchases
Increased
Dividend
33%
Increased
Dividend
100%
Increased
Dividend
150%
Increased
Dividend
20%
Commodity Price
Downturn
Recently
increased
share
repurchase
authorization
to 30mm
shares
($~720mm1)
1As of February 22, 2018Note: The chart above excludes the Company’s 2016 equity issuance

3.8%
1.5%1.3%
1.0%0.7% 0.6% 0.5%
0.3% 0.2% 0.2% 0.0% 0.0% 0.0% 0.0% 0.0% 0.0% 0.0%
Peer A Peer B Peer C COG Peer D Peer E Peer F Peer G Peer H Peer I Peer J Peer K Peer L Peer M Peer N Peer O Peer P
14Source: FactSet as of 02/19/2018; peers include: AR, CHK, XEC, CXO, CLR, DVN, ECA, EQT, MRO, MUR, NFX, NBL, PXD, QEP, RRC, SWN.
1 Free cash flow yield is calculated as consensus estimates for cash from operations less capital expenditures
2 EQT pro forma for Rice Energy acquisition
Current Dividend Yield
Cabot offers a compelling combination of top-tier yield, free cash flow and growth
2019E Free Cash Flow Yield1
2017 – 2019E Production CAGR2
5.4% 5.3% 5.1% 4.5% 4.1% 3.8% 3.5% 2.9% 2.4% 1.7% 0.9% 0.8% 0.6%
(0.7%)(2.6%)
(4.3%)
(7.3%)
COG Peer F Peer C Peer J Peer D Peer A Peer M Peer H Peer E Peer I Peer N Peer G Peer L Peer B Peer K Peer P Peer O
21.8% 20.7% 19.9% 19.7% 18.7%16.9% 16.8% 16.6%
15.0%
11.1% 9.9%
7.0% 6.1%4.6% 4.0% 3.5%
1.5%
COG Peer J Peer L Peer M Peer F Peer I Peer G Peer H Peer N Peer E Peer C Peer P Peer D Peer B Peer A Peer O Peer K

$245
2017 Actual 2018E 2019E 2020E
$2.75 NYMEX $3.00 NYMEX $3.25 NYMEX
15Note: See the assumptions slide in the appendix for further detail and definitions.
1 Based on midpoint of production guidance. The CAGRs and improvement in ROCE represented in the arrows above are based on the $2.75 NYMEX case.
Adjusted Net Income ($mm)1 Discretionary Cash Flow ($mm)1
Free Cash Flow ($mm)1
7.3%
2017 Actual 2018E 2019E 2020E
$2.75 NYMEX $3.00 NYMEX $3.25 NYMEX
Return on Capital Employed1
$976
2017 Actual 2018E 2019E 2020E
$2.75 NYMEX $3.00 NYMEX $3.25 NYMEX
$155
2017 Actual 2018E 2019E 2020E
$2.75 NYMEX $3.00 NYMEX $3.25 NYMEX
Three-Year Cabot Oil & Gas Outlook
$1.6 bn - $2.5 bn of estimated cumulative after-tax
free cash flow from 2018 – 2020 to reinvest in
the business and return capital to shareholders
Three-Year Production CAGR: 17% - 21% (20% - 24% on a divestiture-adjusted basis)
Incremental share repurchases and debt reduction would further enhance the
growth of these metrics on a debt-adjusted per share basis and improve ROCE
0%
10%
20%
30%
40%
50%
60%
70%
0%
5%
10%
15%
20%
25%
201
8E
CO
G @
$2.7
5 N
YM
EX
201
8E
CO
G @
$3.0
0 N
YM
EX
201
8E
CO
G @
$3.2
5 N
YM
EX
Co
ns
um
er
Sta
ple
s
Ma
teri
als
Info
rma
tio
n T
ec
hn
olo
gy
Co
ns
um
er
Dis
cre
tio
nary
Ind
us
tria
ls
Healt
hca
re
Uti
liti
es
Real
Esta
te
En
erg
y
Te
lec
om
mu
nic
ati
on
s
ROCE 2018E - 2019E EPS Growth
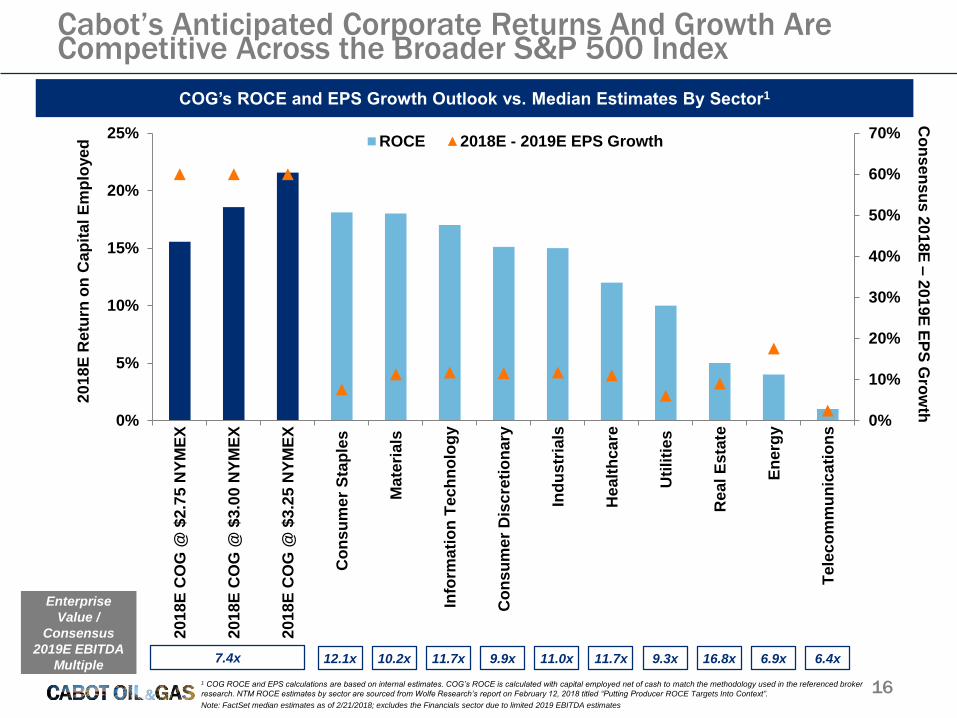
161 COG ROCE and EPS calculations are based on internal estimates. COG’s ROCE is calculated with capital employed net of cash to match the methodology used in the referenced broker
research. NTM ROCE estimates by sector are sourced from Wolfe Research’s report on February 12, 2018 titled “Putting Producer ROCE Targets Into Context”.
Note: FactSet median estimates as of 2/21/2018; excludes the Financials sector due to limited 2019 EBITDA estimates
COG’s ROCE and EPS Growth Outlook vs. Median Estimates By Sector1
Cabot’s Anticipated Corporate Returns And Growth Are Competitive Across the Broader S&P 500 Index
Enterprise
Value /
Consensus
2019E EBITDA
Multiple7.4x 12.1x
20
18
E R
etu
rn o
n C
ap
ital E
mp
loye
d
Co
ns
en
su
s 2
01
8E
–2
01
9E
EP
S G
row
th
10.2x 11.7x 9.9x 11.0x 11.7x 9.3x 16.8x 6.9x 6.4x

17
Illustrative Average Annual After-Tax Corporate Free Cash Flow at 3.7 Bcf/d Flat ($bn)
$1.0
$1.2
$1.4
$2.75 NYMEX $3.00 NYMEX $3.25 NYMEX
Average Annual Maintenance Capital: ~$500mm
Implied FCF Yield
Based on Current
Market Cap1:
9%
Implied FCF Yield
Based on Current
Market Cap1:
11%
Implied FCF Yield
Based on Current
Market Cap1:
13%
Best-in-Class Marcellus Capital Efficiency
1 Based on market capitalization as of February 22, 2018
Note: Assumes ($0.35) long-term weighted-average differential to NYMEX
Cabot’s expects to reach 3.7 Bcf/d of gross production in 2020
Cabot management expects to grow volumes above this illustrative 3.7 Bcf/d maintenance level by securing
incremental firm transport capacity / firm sales and / or increasing in-basin market share
Cabot would generate $1.6bn - $2.5bn of cumulative after-tax corporate free cash flow from 2018 – 2020 before
getting to this maintenance level (based on a $2.75 - $3.25 NYMEX price range in 2018 – 2020)
The illustrative annual free cash flow estimates below include the impact of income taxes, corporate overhead, and
interest expense

Appendix

Full-year 2018 total company daily production growth
guidance: 10% - 15% (18% - 23% on a divestiture-adjusted
basis to reflect the impact of the previously announced
Eagle Ford, East Texas, and West Virginia dispositions)
– 2018 exit-to-exit divestiture-adjusted production
growth guidance: 35%+
– Q1 2018 production guidance: 1,825 – 1,875 Mmcfe/d
(97% natural gas)
2018 total program spending: $950 million
– Marcellus Shale: $800 million
– Exploration Areas: $75 million
– Pipeline Investments: $60 million
– Corporate: $15 million
2018 Marcellus Shale drilling and completion activity:
– 85 net wells drilled / 95 net wells completed
2018 income tax rate guidance: 23% - 24%
2018 deferred tax rate guidance: 100%+ (The Company
expects to receive a refund in 2018 associated with the
recent repeal of the corporate alternative minimum tax)
2018E Differential Guidance (Before the Impact of Derivatives)
Q1 2018 FY 2018
Natural Gas ($/Mcf) ($0.40) – ($0.45) ($0.45) – ($0.50)
2018E Natural Gas Price Exposure By Index
Q1 2018 FY 2018
Fixed Price (~$2.75/Mcf) 24% 20%
NYMEX 24% 21%
TGP Zone 4 – 300 Leg 19% 21%
Leidy Line Receipts 18% 14%
Millennium East 7% 6%
Dominion 6% 6%
Columbia 2% 3%
D.C. Area Market NA 8%
PJM Power Market NA 1%
Note: Fixed price percentages above include volumes associated with
sales agreements that have floor prices. An additional deduct of ~$0.05
per Mcf should be applied to account for fuel use.
FY 2018E Cost Assumptions ($/Mcfe, unless otherwise noted)
Direct operations $0.09 - $0.11
Transportation and gathering $0.66 - $0.68
Taxes other than income $0.02 - $0.03
Depreciation, depletion and amortization $0.50 - $0.60
Interest expense $0.09 - $0.11
General and administrative ($mm)1 $60
Exploration ($mm)2 $35(1) Excluding stock-based compensation(2) Excluding exploratory dry hole costs; includes exploration
administration expense and geophysical expenses
2018 Guidance

20
$304
$87$188
$62
$575
$312
$0
$100
$200
$300
$400
$500
$600
2018 2019 2020 2021 2022 2023 2024 2025 2026
7.2%
6.5%
4.3%
6.2%
3.7%
Natural Gas (NYMEX) Swaps
Total Volume (Bcf)
Average Price per Mcf
Natural Gas (NYMEX) Basis Swaps
Total Volume - Leidy (Bcf)
Average Price per Mcf (Leidy)
Total Volume – Transco (Bcf)
Average Price per Mcf (Transco)
98.0
$2.87
34.1
($0.68)
10.7
$0.41
As of 12/31/2017 $bn
Cash and Cash Equivalents $0.5
Debt $1.5
Net Debt $1.0
Net Capitalization $3.6
Liquidity $2.2
Net Debt / Capitalization 29.2%
Net Debt / LTM EBITDAX 1.0x
2018 Hedge Position1
Debt Maturity Schedule ($mm) (Including Weighted Average Coupon Rate)
Capitalization / Liquidity
4.2%
Financial Position and Risk Management Profile
1As of February 22, 20182Based on the midpoint of the production guidance range
Approximately 34% of Cabot’s forecasted 2018 natural gas
volumes are locked-in at an average price of ~$2.80 per Mcf
(includes NYMEX swaps and fixed price contracts)2

21
2018 – 2019 Hedge Summary
2018 Natural Gas Swaps
# of Total $/Mcf
Pricing Index Contracts Mcf/Day Fixed Price Duration
LDS NYMEX 26 252,574 $2.93 Feb-18 Dec-18
LDS NYMEX 5 48,572 $3.10 Feb-18 Oct-18
2018 Natural Gas Basis Swaps
# of Total $/Mcf
Pricing Index Contracts Mcf/Day Fixed Price Duration
Leidy 5 48,572 ($0.71) Jan-18 Dec-18
Leidy 5 48,572 ($0.68) Feb-18 Dec-18
2018-2019 Natural Gas Basis Swaps
# of Total $/Mcf
Pricing Index Contracts Mcf/Day Fixed Price Duration
Transco 3 29,143 $0.42 Jan-18 Dec-19
Note: As of February 22, 2018
The table above does not include fixed price deals that cover ~20%
of Cabot’s forecasted 2018 natural gas volumes at ~$2.75 per Mcf

22
Three-Year Outlook Assumptions
Three-Year Outlook Assumptions (Slide 15)
• ~($0.50) per Mcf weighted-average basis differential in 2018 and ~($0.35) per Mcf weighted-average basis differential in 2019
and 2020
• ~$850 million of annual total company capital spending in 2019 and 2020 (no investments in equity pipelines in 2019 and
2020 as Constitution is not included in this three-year outlook)
• No capital associated with exploration activity in 2019 and 2020; however, assumes ~$35 million of corporate exploration
expense annually. This assumption is subject to change based on the initial results from the ongoing testing in the
Company’s exploratory areas
• Refinancing of notes at maturity based on current market indications
• For purposes of this illustrative analysis, free cash flow is maintained on the balance sheet (ROCE outlook does not reflect
the benefit of this free cash flow)
• Corporate tax rate between 23% and 24% in 2018 – 2020
• Deferred tax rates dependent on NYMEX price assumptions—100%+ in 2018 for all three price cases; a range of 70% to
100%+ in 2019 and 25% to 50% in 2020
• Service cost inflation of 5%+ annually in 2019 and 2020 (subject to market conditions)
• Cash G&A expense increases of 3% and 4% in 2019 and 2020, respectively
• No change to the current Pennsylvania state Impact Fee
23
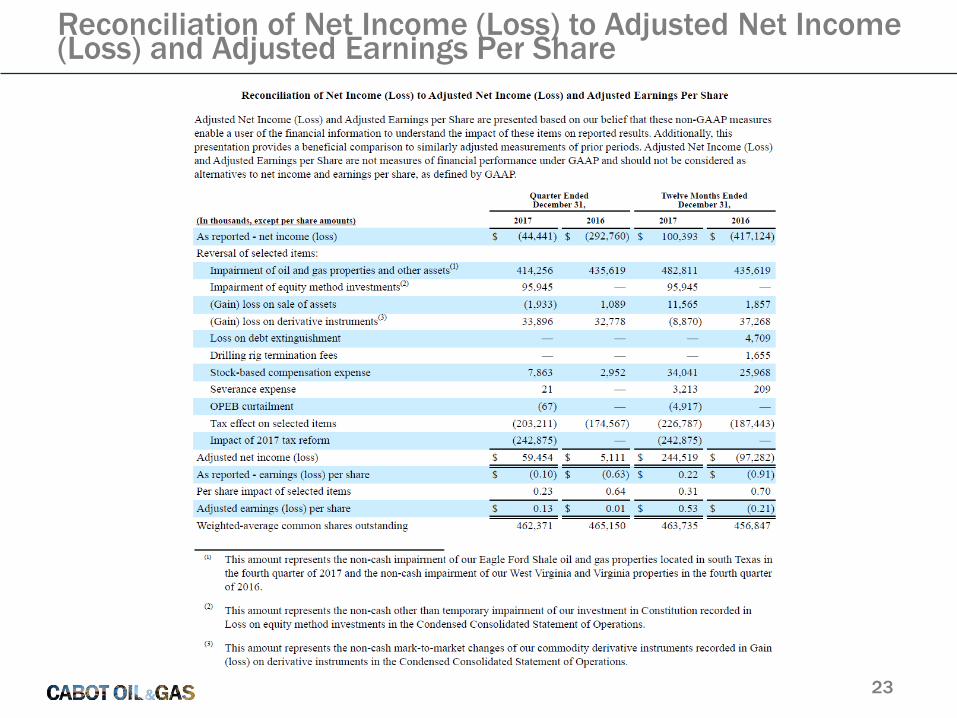
Reconciliation of Net Income (Loss) to Adjusted Net Income (Loss) and Adjusted Earnings Per Share

24
EBITDAX Calculation and Reconciliation

25
Net Debt Reconciliation

26
Discretionary Cash Flow and Free Cash Flow Calculation and Reconciliation

27
Return on Capital Employed (ROCE) Calculation and Reconciliation
A decade of progress and perseverance in the Marcellus Shale.