FOURTH QUARTER & FISCAL 2021 RESULTS
23
FOURTH QUARTER & FISCAL 2021 RESULTS October 27, 2021
Transcript of FOURTH QUARTER & FISCAL 2021 RESULTS

FOURTH QUARTER & FISCAL 2021 RESULTSOctober 27, 2021
2
FORWARD-LOOKING STATEMENTS Certain statements made in this presentation and the associated conference call may constitute "forward-looking statements" under the Private Securities Litigation Reform Act of 1995. Forward-looking statements include information concerning future strategic objectives, business prospects, anticipated savings, financial results (including expenses, earnings, liquidity, cash flow and capital expenditures), industry or market conditions, demand for and pricing of our products, acquisitions (including our proposed acquisitions of Charles Stanley PLC and TriState Capital Holdings, Inc.) and divestitures, anticipated results of litigation, regulatory developments, and general economic conditions. In addition, words such as “believes,” “expects,” “anticipates,” “intends,” “plans,” “estimates,” “projects,” “forecasts,” and future or conditional verbs such as “will,” “may,” “could,” “should,” and “would,” or negatives of such terms or other comparable terminology, as well as any other statement that necessarily depends on future events, are intended to identify forward-looking statements. Forward-looking statements are not guarantees, and they involve risks, uncertainties and assumptions. Although we make such statements based on assumptions that we believe to be reasonable, there can be no assurance that actual results will not differ materially from those expressed in the forward-looking statements. We caution investors not to rely unduly on any forward-looking statements and urge you to carefully consider the risks described in our filings with the Securities and Exchange Commission (the “SEC”) from time to time, including our most recent Annual Report on Form 10-K, and subsequent Quarterly Reports on Form 10-Q and Current Reports on Form 8-K, which are available at www.raymondjames.com and the SEC’s website at www.sec.gov. We expressly disclaim any obligation to update any forward-looking statement in the event it later turns out to be inaccurate, whether as a result of new information, future events, or otherwise.

3
Paul ReillyChairman & CEO, Raymond James Financial
OVERVIEW OF RESULTS

4Note: All share and per share information has been retroactively adjusted to reflect the September 21, 2021 3-for-2 stock split. * These are non-GAAP measures. See the schedule in the Appendix of this presentation for a reconciliation of our non-GAAP measures to the most directly comparable GAAP measures and for more information on these measures.
FISCAL 4Q21 HIGHLIGHTS $ in millions, except per share amounts 4Q21
vs. 4Q20
vs. 3Q21
As Reported:Net revenues RECORD $ 2,695 30% 9%Net income RECORD $ 429 105% 40%Earnings per common share - diluted RECORD $ 2.02 102% 39%
4Q20 3Q21Return on equity 21.3 % 11.9% 15.9%
vs. 4Q20
vs. 3Q21
Non-GAAP Measures:*Adjusted net income RECORD $ 437 76% 13%Adjusted earnings per common share - diluted RECORD $ 2.06 73% 13%
4Q20 3Q21Adjusted return on equity 21.7 % 14.1% 19.9%Return on tangible common equity 23.7 % 12.9% 17.7%Adjusted return on tangible common equity 24.1 % 15.3% 22.2%
5
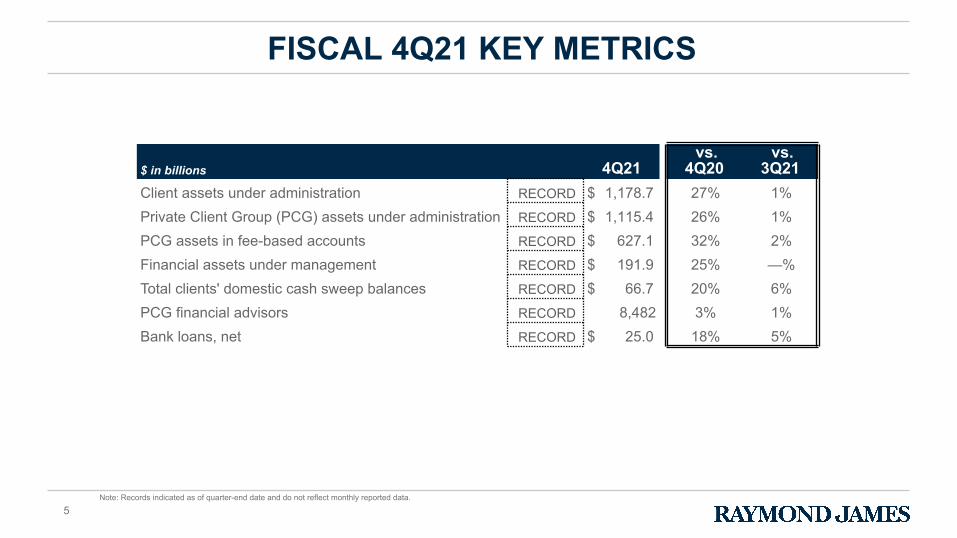
FISCAL 4Q21 KEY METRICS
$ in billions 4Q21 vs.
4Q20 vs.
3Q21Client assets under administration RECORD $ 1,178.7 27% 1%Private Client Group (PCG) assets under administration RECORD $ 1,115.4 26% 1%PCG assets in fee-based accounts RECORD $ 627.1 32% 2%Financial assets under management RECORD $ 191.9 25% —%Total clients' domestic cash sweep balances RECORD $ 66.7 20% 6%PCG financial advisors RECORD 8,482 3% 1%Bank loans, net RECORD $ 25.0 18% 5%
Note: Records indicated as of quarter-end date and do not reflect monthly reported data.
6
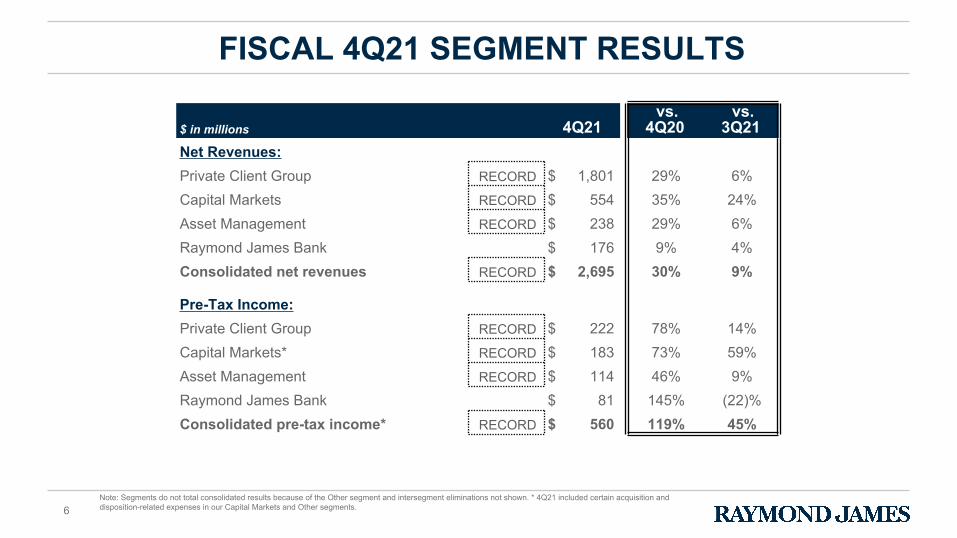
FISCAL 4Q21 SEGMENT RESULTS
$ in millions 4Q21 vs.
4Q20 vs.
3Q21Net Revenues:Private Client Group RECORD $ 1,801 29% 6%Capital Markets RECORD $ 554 35% 24%Asset Management RECORD $ 238 29% 6%Raymond James Bank $ 176 9% 4%Consolidated net revenues RECORD $ 2,695 30% 9%
Pre-Tax Income:Private Client Group RECORD $ 222 78% 14%Capital Markets* RECORD $ 183 73% 59%Asset Management RECORD $ 114 46% 9%Raymond James Bank $ 81 145% (22)%Consolidated pre-tax income* RECORD $ 560 119% 45%
Note: Segments do not total consolidated results because of the Other segment and intersegment eliminations not shown. * 4Q21 included certain acquisition and disposition-related expenses in our Capital Markets and Other segments.

7
FY 2021 HIGHLIGHTS
$ in millions, except per share amounts FY 2021vs.
FY 2020As Reported:Net revenues RECORD $ 9,760 22%Net income RECORD $ 1,403 72%Earnings per common share - diluted RECORD $ 6.63 71%
FY 2020Return on equity 18.4 % 11.9%
vs. FY 2020
Non-GAAP Measures:*Adjusted net income RECORD $ 1,492 74%Adjusted earnings per common share - diluted RECORD $ 7.05 73%
FY 2020Adjusted return on equity 19.5 % 12.5%Return on tangible common equity 20.4 % 13.0%Adjusted return on tangible common equity 21.6 % 13.6%
Note: All share and per share information has been retroactively adjusted to reflect the September 21, 2021 3-for-2 stock split. * These are non-GAAP measures. See the schedule in the Appendix of this presentation for a reconciliation of our non-GAAP measures to the most directly comparable GAAP measures and for more information on these measures.

8
FY 2021 SEGMENT RESULTS
$ in millions FY 2021vs.
FY 2020Net Revenues:Private Client Group RECORD $ 6,611 19%Capital Markets RECORD $ 1,885 46%Asset Management RECORD $ 867 21%Raymond James Bank $ 672 (12)%Consolidated net revenues RECORD $ 9,760 22%
Pre-Tax Income:Private Client Group RECORD $ 749 39%Capital Markets* RECORD $ 532 136%Asset Management RECORD $ 389 37%Raymond James Bank $ 367 87%Consolidated pre-tax income* RECORD $ 1,791 70%
Note: Segments do not total consolidated results because of the Other segment and intersegment eliminations not shown. * FY 2021 included certain acquisition and disposition-related expenses in our Capital Markets and Other segments and losses on extinguishment of debt in our Other segment.

9
Paul ShoukryChief Financial Officer, Raymond James Financial
FINANCIAL REVIEW

10
CONSOLIDATED NET REVENUES
$ in millions 4Q21 vs.
4Q20 vs.
3Q21
Asset management and related administrative fees $ 1,366 36% 8%
Brokerage revenues 541 9% (2)%
Account and service fees 170 21% 6%
Investment banking 364 64% 32%
Interest income 215 7% 5%
Other* 74 30% 35%
Total revenues 2,730 29% 9%
Interest expense (35) (17)% (13)%
Net revenues $ 2,695 30% 9%
* 4Q21 Other revenues included $18M of private equity gains which were included in our Other segment. Of this amount, $5M were attributable to noncontrolling interests and were offset in Other expenses.

11Note: May not total due to rounding. * Raymond James Bank Deposit Program (RJBDP) is a multi-bank sweep program in which clients' cash deposits in their brokerage accounts are swept into interest-bearing deposit accounts at Raymond James Bank and various third-party banks.
Clie
nts'
Dom
estic
Cas
h Sw
eep
Bal
ance
s ($
B)
Cash Sw
eep Balances as a %
of Dom
estic PCG
AU
A
Clients' Domestic Cash Sweep Balancesas a % of Domestic PCG Assets Under Administration (AUA)
25.6 26.7 28.2 29.3 31.4
26.0 26.1 25.1 25.1 24.5
4.08.8 9.5 8.6 10.855.6
61.6 62.8 62.966.7
6.7% 6.7%6.5%
6.1%6.3%
4Q20 1Q21 2Q21 3Q21 4Q21
DOMESTIC CASH SWEEP BALANCES
Year-over-year change: 20% Sequential change: 6% RJBDP - RJ Bank* RJBDP - Third-Party Banks* Client Interest Program

12
NET INTEREST INCOME & RJBDP FEES (THIRD-PARTY BANKS)
* As reported in Account and Service Fees in the PCG segment. ** Computed by dividing annualized RJBDP fees - third-party banks, which are net of the interest expense paid to clients by the third-party banks, by the average daily RJBDP balances at third-party banks.
Firmwide Net Interest Income RJBDP Fees (Third-Party Banks)*
$ in
mill
ions
180 186 182 183 198
159 165 163 165 180
21 21 19 1818
4Q20 1Q21 2Q21 3Q21 4Q21
Average Yield on RJBDP(Third-Party Banks)**
0.33% 0.31% 0.30% 0.29% 0.29%
4Q20 1Q21 2Q21 3Q21 4Q21
Net Interest Margin
2.09% 2.02% 1.94% 1.92% 1.92%
1.56% 1.45% 1.32% 1.31% 1.33%
4Q20 1Q21 2Q21 3Q21 4Q21
Firmwide Net Interest Margin RJ Bank Net Interest Margin

13
CONSOLIDATED EXPENSES
$ in millions 4Q21 vs.
4Q20vs.
3Q21
Compensation, commissions and benefits $ 1,774 25% 7%
Non-compensation expenses:
Communications and information processing 114 14% 5%
Occupancy and equipment 60 5% 3%
Business development 36 29% 16%
Investment sub-advisory fees 37 42% 9%
Professional fees 32 39% 23%
Bank loan provision/(benefit) for credit losses* 5 (89)% NM
Acquisition and disposition-related expenses** 10 43% 43%
Other*** 67 (12)% (17)%
Total non-compensation expenses 361 (12)% (15)%
Total non-interest expenses $ 2,135 17% 2%
Total Compensation Ratio
68.1% 67.5% 69.5% 67.2% 65.8%
4Q20 1Q21 2Q21 3Q21 4Q21
Total Non-Compensation Expenses$ in millions
408323
277
425361
4Q20 1Q21 2Q21 3Q21 4Q21
* The Bank loan provision/(benefit) for credit losses in 4Q21 was determined under the current expected credit loss (“CECL”) model as a result of our October 1, 2020 adoption of new accounting guidance related to the measurement of credit losses on financial instruments. ** Acquisition and disposition-related expenses in 4Q21 primarily associated with our acquisitions of Financo, LLC and Cebile Capital, which were completed in fiscal 2021, and Charles Stanley Group PLC and TriState Capital Holdings, Inc., which were announced in July and October 2021, respectively. These expenses were included in our Capital Markets and Other segments. *** 4Q21 Other revenues included $18M of private equity gains which were included in our Other segment. Of this amount, $5M were attributable to noncontrolling interests and were offset in Other expenses.

14* 4Q20 included a $7M loss in our Capital Markets segment related to the sale of our interests in certain entities that operated predominantly in France, which closed during 1Q21, and $46M in our Other segment related to the reduction in workforce expenses associated with position eliminations that occurred in response to the economic environment. ** 3Q21 included certain acquisition and disposition-related expenses in our Capital Markets and Other segments and losses on extinguishment of debt in our Other segment. *** 4Q21 included certain acquisition and disposition-related expenses in our Capital Markets and Other segments. **** This is a non-GAAP measure. See the schedule in the Appendix of this presentation for a reconciliation of our non-GAAP measures to the most directly comparable GAAP measures and for more information on these measures.
12.3%
18.0%18.8%
15.6%
20.8%
14.9%
18.0%
19.8%21.2%
Pre-Tax Margin (GAAP) Pre-Tax Margin (Adjusted)****
4Q20* 1Q21 2Q21 3Q21** 4Q21***
CONSOLIDATED PRE-TAX MARGIN

15
OTHER FINANCIAL INFORMATION
$ in millions, except per share amounts 4Q21 vs.
4Q20 vs.
3Q21
Total assets $ 61,891 30% 8%
RJF corporate cash* $ 1,157 (47)% (26)%
Total equity attributable to RJF $ 8,245 16% 5%
Book value per share $ 40.08 15% 5%
Tangible book value per share** $ 36.11 13% 5%Weighted-average common and common equivalent shares outstanding – diluted 211.7 1% —%
4Q20 3Q21
Tier 1 capital ratio*** 25.0 % 24.2% 24.4%
Total capital ratio*** 26.2 % 25.4% 25.6%
Tier 1 leverage ratio*** 12.6 % 14.2% 12.6%
Effective tax rate 23.4 % 18.4% 20.3%
Note: All share and per share information has been retroactively adjusted to reflect the September 21, 2021 3-for-2 stock split. * This amount includes cash on hand at the parent, as well as parent cash loaned to Raymond James & Associates ("RJ&A"), which RJ&A has invested on behalf of RJF in cash and cash equivalents or otherwise deployed in its normal business activities. ** This is a non-GAAP measure. See the schedule in the Appendix of this presentation for a reconciliation of our non-GAAP measures to the most directly comparable GAAP measures and for more information on these measures. *** Estimated.

16
Dividends Paid and Share Repurchases*$ in millions
101
65
114102
54
50
10
60 48
51
55
5454
54
Share Repurchases* Dividends Paid
4Q20 1Q21 2Q21 3Q21 4Q21
CAPITAL MANAGEMENT
$632 million remains under current share repurchase authorization
Number of Shares Repurchased*(thousands)
1,017 162 750 563 —
Average Share Price of Shares Repurchased* $49.16 $61.86 $80.04 $85.70 —
Note: All share and per share information has been retroactively adjusted to reflect the September 21, 2021 3-for-2 stock split. * Under the Board of Directors' share repurchase authorization.
Total of $436 million over the past 5 quarters

17
RAYMOND JAMES BANK KEY CREDIT TRENDS
$ in millions 4Q21 vs.
4Q20 vs.
3Q21Bank loan provision/(benefit) for credit losses* $ 5 (89)% NMNet charge-offs:Charge-offs related to loan sales $ 1 (96)% —%All other 6 NM 100%Total net charge-offs $ 7 (73)% 75%
4Q20 3Q21Nonperforming assets as a % of total assets 0.20 % 0.10% 0.12%Bank loan allowance for credit losses as a % of loans held for investment* 1.27 % 1.65% 1.34%Criticized loans as a % of loans held for investment 3.27 % 4.35% 4.07%
* The Bank loan provision/(benefit) for credit losses in 4Q21 was determined under the current expected credit loss (“CECL”) model as a result of our October 1, 2020 adoption of new accounting guidance related to the measurement of credit losses on financial instruments.

18
OUTLOOK

APPENDIX
19

20Note: Please refer to the footnotes on slide 23 for additional information.
Three months ended Twelve months ended
$ in millions September 30, 2020 December 31, 2020 June 30, 2021 September 30, 2021 September 30, 2020 September 30, 2021
Net income $ 209 $ 312 $ 307 $ 429 $ 818 $ 1,403
Non-GAAP adjustments:
Losses on extinguishment of debt (1) — — 98 — — 98
Acquisition and disposition-related expenses (2) 7 2 7 10 7 19
Reduction in workforce expenses (3) 46 — — — 46 —
Pre-tax impact of non-GAAP adjustments 53 2 105 10 53 117
Tax effect of non-GAAP adjustments (13) — (26) (2) (13) (28)
Total non-GAAP adjustments, net of tax 40 2 79 8 40 89
Adjusted net income $ 249 $ 314 $ 386 $ 437 $ 858 $ 1,492
Pre-tax income $ 256 $ 399 $ 385 $ 560 $ 1,052 $ 1,791
Pre-tax impact of non-GAAP adjustments (as detailed above) 53 2 105 10 53 117
Adjusted pre-tax income $ 309 $ 401 $ 490 $ 570 $ 1,105 $ 1,908
Pre-tax margin (4) 12.3 % 18.0 % 15.6 % 20.8 % 13.2 % 18.4 %
Non-GAAP adjustments:
Losses on extinguishment of debt (1) — % — % 3.9 % — % — % 1.0 %
Acquisition and disposition-related expenses (2) 0.4 % — % 0.3 % 0.4 % 0.1 % 0.1 %
Reduction in workforce expenses (3) 2.2 % — % — % — % 0.5 % — %
Total non-GAAP adjustments, net of tax 2.6 % — % 4.2 % 0.4 % 0.6 % 1.1 %
Adjusted pre-tax margin (4) 14.9 % 18.0 % 19.8 % 21.2 % 13.8 % 19.5 %
continued on next slide
We utilize certain non-GAAP financial measures as additional measures to aid in, and enhance, the understanding of our financial results and related measures. These non-GAAP financial measures have been separately identified in this document. We believe certain of these non-GAAP financial measures provides useful information to management and investors by excluding certain material items that may not be indicative of our core operating results. We utilize these non-GAAP financial measures in assessing the financial performance of the business, as they facilitate a comparison of current- and prior-period results. We believe that return on tangible common equity and tangible book value per share are meaningful to investors as they facilitate comparisons of our results to the results of other companies. In the following tables, the tax effect of non-GAAP adjustments reflects the statutory rate associated with each non-GAAP item. These non-GAAP financial measures should be considered in addition to, and not as a substitute for, measures of financial performance prepared in accordance with GAAP. In addition, our non-GAAP financial measures may not be comparable to similarly titled non-GAAP financial measures of other companies. The following tables provide a reconciliation of non-GAAP financial measures to the most directly comparable GAAP measures for those periods which include non-GAAP adjustments.
RECONCILIATION OF NON-GAAP FINANCIAL MEASURES TO GAAP FINANCIAL MEASURES (UNAUDITED)

21
Book value per share (6) (7) As of
$ in millions, except per share amounts September 30, 2020 June 30, 2021 September 30, 2021
Total equity attributable to Raymond James Financial, Inc. $ 7,114 $ 7,863 $ 8,245
Less non-GAAP adjustments:
Goodwill and identifiable intangible assets, net 600 862 882
Deferred tax liabilities, net (34) (56) (64)
Tangible common equity attributable to Raymond James Financial, Inc. $ 6,548 $ 7,057 $ 7,427
Common shares outstanding 204.9 205.4 205.7
Book value per share (6) (7) $ 34.72 $ 38.28 $ 40.08
Tangible book value per share (6) (7) $ 31.96 $ 34.36 $ 36.11
Three months ended Twelve months ended
Earnings per common share (5) (6) September 30, 2021 September 30, 2021
Basic $ 2.08 $ 6.81
Non-GAAP adjustments:
Losses on extinguishment of debt (1) — 0.48
Acquisition and disposition-related expenses (2) 0.05 0.09
Tax effect of non-GAAP adjustments (0.01) (0.14)
Total non-GAAP adjustments, net of tax 0.04 0.43
Adjusted basic $ 2.12 $ 7.24
Diluted $ 2.02 $ 6.63
Non-GAAP adjustments:
Losses on extinguishment of debt (1) — 0.46
Acquisition and disposition-related expenses (2) 0.05 0.09
Tax effect of non-GAAP adjustments (0.01) (0.13)
Total non-GAAP adjustments, net of tax 0.04 0.42
Adjusted diluted $ 2.06 $ 7.05
RECONCILIATION OF NON-GAAP FINANCIAL MEASURES TO GAAP FINANCIAL MEASURES (UNAUDITED)
continued on next slideNote: Please refer to the footnotes on slide 23 for additional information.

22
Return on equity Three months ended Twelve months ended
$ in millions September 30, 2020 June 30, 2021 September 30, 2021 September 30, 2020 September 30, 2021
Average equity (8) $ 7,040 $ 7,728 $ 8,054 $ 6,860 $ 7,635
Impact on average equity of non-GAAP adjustments:
Losses on extinguishment of debt (1) — 49 — — 39
Acquisition and disposition-related expenses (2) 4 4 5 1 6
Reduction in workforce expenses (3) 23 — — 9 —
Tax effect of non-GAAP adjustments (7) (13) (1) (2) (11)
Adjusted average equity (8) $ 7,060 $ 7,768 $ 8,058 $ 6,868 $ 7,669
Average equity (8) $ 7,040 $ 7,728 $ 8,054 $ 6,860 $ 7,635
Less:
Average goodwill and identifiable intangible assets, net 601 865 872 605 809
Average deferred tax liabilities, net (33) (56) (60) (31) (53)
Average tangible common equity (8) $ 6,472 $ 6,919 $ 7,242 $ 6,286 $ 6,879
Impact on average equity of non-GAAP adjustments:
Losses on extinguishment of debt (1) — 49 — — 39
Acquisition and disposition-related expenses (2) 4 4 5 1 6
Reduction in workforce expenses (3) 23 — — 9 —
Tax effect of non-GAAP adjustments (7) (13) (1) (2) (11)
Adjusted average tangible common equity (8) $ 6,492 $ 6,959 $ 7,246 $ 6,294 $ 6,913
Return on equity (9) 11.9 % 15.9 % 21.3 % 11.9 % 18.4 %
Adjusted return on equity (9) 14.1 % 19.9 % 21.7 % 12.5 % 19.5 %
Return on tangible common equity (9) 12.9 % 17.7 % 23.7 % 13.0 % 20.4 %
Adjusted return on tangible common equity (9) 15.3 % 22.2 % 24.1 % 13.6 % 21.6 %
RECONCILIATION OF NON-GAAP FINANCIAL MEASURES TO GAAP FINANCIAL MEASURES (UNAUDITED)
Note: Please refer to the footnotes on slide 23 for additional information.

23
FOOTNOTES(1) Losses on extinguishment of debt include make-whole premiums, the accelerated amortization of debt issuance costs, and certain legal and other professional fees associated with the redemptions of
our $250 million of 5.625% senior notes due 2024 and our $500 million of 3.625% senior notes due 2026 which occurred during our fiscal third quarter of 2021.
(2) The three and twelve months ended September 30, 2020 included a $7 million loss in our Capital Markets segment related to the sale of our interests in certain entities that operated predominantly in France, which closed during our fiscal first quarter of 2021. For fiscal 2021 periods, acquisition and disposition-related expenses in our Other segment primarily included professional and integration expenses associated with our acquisitions of NWPS Holdings, Inc., Financo, LLC, and Cebile Capital which were completed in fiscal 2021, and Charles Stanley Group PLC and TriState Capital Holdings, Inc., announced in July 2021 and October 2021, respectively. Acquisition and disposition-related expenses in our Capital Markets segment for fiscal 2021 included amortization expense related to intangible assets with short useful lives primarily associated with our Financo, LLC and Cebile Capital acquisitions.
(3) Reduction in workforce expenses for the three and twelve months ended September 30, 2020 are associated with position eliminations that occurred in our fourth fiscal quarter of 2020 in response to the economic environment. These expenses were included in our Other segment and primarily consisted of severance and related payroll expenses, as well as expenses related to company-paid benefits.
(4) Pre-tax margin is computed by dividing pre-tax income by net revenues for each respective period or, in the case of adjusted pre-tax margin, computed by dividing adjusted pre-tax income by net revenues for each respective period.
(5) Earnings per common share is computed by dividing net income (less allocation of earnings and dividends to participating securities) by weighted-average common shares outstanding (basic or diluted as applicable) for each respective period or, in the case of adjusted earnings per common share, computed by dividing adjusted net income (less allocation of earnings and dividends to participating securities) by weighted-average common shares outstanding (basic or diluted as applicable) for each respective period.
(6) During our fourth fiscal quarter of 2021 the Board of Directors approved a 3-for-2 stock split, effected in the form of a 50% stock dividend, payable September 21, 2021. All share and per share information has been retroactively adjusted to reflect this stock split.
(7) Book value per share is computed by dividing total equity attributable to Raymond James Financial, Inc. by the number of common shares outstanding at the end of each respective period or, in the case of tangible book value per share, computed by dividing tangible common equity by the number of common shares outstanding at the end of each respective period. Tangible common equity is defined as total equity attributable to Raymond James Financial, Inc. less goodwill and intangible assets, net of related deferred taxes.
(8) Average equity is computed by adding total equity attributable to Raymond James Financial, Inc. as of the date indicated to the prior quarter-end total, and dividing by two, or in the case of average tangible common equity, computed by adding tangible common equity as of the date indicated to the prior quarter-end total, and dividing by two. For the annual period, average equity is computed by adding the total equity attributable to Raymond James Financial, Inc. as of each quarter-end date during the indicated period to the beginning of year total, and dividing by five, or in the case of average tangible common equity, computed by adding tangible common equity as of each quarter-end date during the indicated period to the beginning of year total, and dividing by five. Adjusted average equity is computed by adjusting for the impact on average equity of the non-GAAP adjustments, as applicable for each respective period. Adjusted average tangible common equity is computed by adjusting for the impact on average tangible common equity of the non-GAAP adjustments, as applicable for each respective period.
(9) Return on equity is computed by dividing annualized net income by average equity for each respective period or, in the case of return on tangible common equity, computed by dividing annualized net income by average tangible common equity for each respective period. Adjusted return on equity is computed by dividing annualized adjusted net income by adjusted average equity for each respective period, or in the case of adjusted return on tangible common equity, computed by dividing annualized adjusted net income by adjusted average tangible common equity for each respective period.