FOURTH QUARTER 2020 Supplemental Operating and Financial Data
27
Supplemental Operating and Financial Data ALL AMOUNTS IN THIS REPORT ARE UNAUDITED. FOURTH QUARTER 2020 Fort Mill, SC
Transcript of FOURTH QUARTER 2020 Supplemental Operating and Financial Data
Supplemental Operating and Financial Data
ALL AMOUNTS IN THIS REPORT ARE UNAUDITED.
FOURTH QUARTER 2020
Fort Mill, SC

Supplemental Q4 2020 2
Table of Contents
CORPORATE INFORMATIONCompany Profile......................................................................................................................................................................................... 3
Investor Information................................................................................................................................................................................... 4
Research Coverage.................................................................................................................................................................................... 5
FINANCIALSKey Financial Data...................................................................................................................................................................................... 6
Consolidated Balance Sheets................................................................................................................................................................... 7
Consolidated Statements of Income (Loss)............................................................................................................................................. 8
Debt Summary............................................................................................................................................................................................ 10
Debt Maturity Schedule............................................................................................................................................................................. 11
Leverage Ratios, Coverage Ratios and Public Debt Covenants........................................................................................................... 12
Capital Expenditures Summary................................................................................................................................................................ 13
Property Acquisitions and Dispositions Information Since January 1, 2020...................................................................................... 14
Investments in Unconsolidated Joint Ventures...................................................................................................................................... 15
Calculation and Reconciliation of NOI and Cash Basis NOI................................................................................................................. 16
Reconciliation and Calculation of Same Property NOI and Same Property Cash Basis NOI............................................................ 17
Calculation of EBITDA, EBITDAre and Adjusted EBITDAre.................................................................................................................. 18
Calculation of FFO, Normalized FFO and CAD...................................................................................................................................... 19PORTFOLIO INFORMATION
Summary Same Property Results.............................................................................................................................................................. 20
Occupancy and Leasing Summary........................................................................................................................................................... 21
Tenant Diversity and Credit Characteristics............................................................................................................................................ 22
Tenants Representing 1% or More of Total Annualized Rental Income.............................................................................................. 23
Lease Expiration Schedule........................................................................................................................................................................ 24
NON-GAAP FINANCIAL MEASURES AND CERTAIN DEFINITIONS.................................................................................................................... 25
WARNING CONCERNING FORWARD-LOOKING STATEMENTS........................................................................................................................ 27
Please refer to Non-GAAP Financial Measures and Certain Definitions for terms used throughout this document.

Supplemental Q4 2020 3
The Company:Office Properties Income Trust, or OPI, we, our, or us, is a real estate investment trust, or REIT, focused on owning, operating and leasing properties primarily leased to single tenants and those with high credit quality characteristics such as government entities. The majority of our properties are office buildings. OPI is a component of 135 market indices and it comprises more than 1% of the following indices as of December 31, 2020: Invesco KBW Premium Yield Equity REIT ETF INAV Index (KBWYIV), BI North America Office REIT Valuation Peers (BROFFRTV), Bloomberg Reit Office Property Index (BBREOFPY) and the TFMS HIPS Index (TFMSHIPP).
Management:OPI is managed by The RMR Group LLC, or RMR LLC, the majority owned operating subsidiary of The RMR Group Inc. (Nasdaq: RMR). RMR is an alternative asset management company that is focused on commercial real estate and related businesses. RMR primarily provides management services to publicly traded real estate companies, privately held real estate funds and real estate related operating businesses. As of December 31, 2020, RMR had $32.0 billion of real estate assets under management and the combined RMR managed companies had approximately $10 billion of annual revenues, nearly 2,100 properties and approximately 43,000 employees. We believe that being managed by RMR is a competitive advantage for OPI because of RMR’s depth of management and experience in the real estate industry. We also believe RMR provides management services to us at costs that are lower than we would have to pay for similar quality services if we were self managed.
RETURN TO TABLE OF CONTENTS
Corporate Headquarters:Two Newton Place255 Washington Street, Suite 300Newton, MA 02458-1634(617) 219-1440
Stock Exchange Listing:Nasdaq
Trading Symbols:Common Shares: OPISenior Unsecured Notes due 2046: OPINISenior Unsecured Notes due 2050: OPINL
Snapshot (as of December 31, 2020)(1):Total properties: 181Total sq. ft.: 24.9 million Percent leased: 91.2%
(1) Excludes three properties owned by two unconsolidated joint ventures.
Company Profile

Supplemental Q4 2020 4
Board of Trustees
Donna D. Fraiche Barbara D. Gilmore John L. HarringtonIndependent Trustee Independent Trustee Independent Trustee
William A. Lamkin Elena B. Poptodorova Jeffrey P. SomersIndependent Trustee Lead Independent Trustee Independent Trustee
David M. Blackman Adam D. PortnoyManaging Trustee Chair of the Board & Managing Trustee
Executive Officers
Christopher J. Bilotto Matthew C. BrownPresident and Chief Operating Officer Chief Financial Officer and Treasurer
Contact Information
Investor Relations InquiriesOffice Properties Income Trust Financial, investor and media inquiries should be directed to:Two Newton Place Olivia Snyder, Manager, Investor Relations,255 Washington Street, Suite 300 at (617) 219-1410 or [email protected], MA 02458-1634(617) [email protected]
Investor Information
RETURN TO TABLE OF CONTENTS
Washington, DC

Supplemental Q4 2020 5
Equity Research Coverage
B. Riley Securities, Inc. BofA SecuritiesBryan Maher James [email protected] [email protected](646) 885-5423 (646) 855-5808
JMP Securities Mizuho SecuritiesAaron Hecht Omotayo [email protected] [email protected](415) 835-3963 (646) 949-9672
Morgan Stanley RBC Capital MarketsVikram Malhotra Michael [email protected] [email protected](212) 761-7064 (440) 715-2649
Rating Agencies
Moody's Investors Service S&P GlobalLori Marks Michael [email protected] [email protected](212) 553-0376 (212) 438-2508
OPI is followed by the analysts and its credit is rated by the rating agencies listed on this page. Please note that any opinions, estimates or forecasts regarding OPI’s performance made by these analysts or agencies do not represent opinions, forecasts or predictions of OPI or its management. OPI does not by its reference above imply its endorsement of or concurrence with any information, conclusions or recommendations provided by any of these analysts or agencies.
Research Coverage
Issuer Ratings:Moody's: Baa3S&P Global: BBB-
RETURN TO TABLE OF CONTENTS

Supplemental Q4 2020 6
AsofandfortheThreeMonthsEnded Asof12/31/2020 9/30/2020 6/30/2020 3/31/2020 12/31/2019 12/31/2020
SelectedBalanceSheetData: Capitalization:Totalgrossassets $ 4,398,350 $ 4,409,391 $ 4,400,379 $ 4,431,934 $ 4,580,792 Totalcommonshares(atendofperiod) 48,318,366Totalassets $ 3,946,436 $ 3,973,045 $ 3,977,663 $ 4,028,705 $ 4,193,136 Closingprice(atendofperiod) $ 22.72Totalliabilities $ 2,337,044 $ 2,336,373 $ 2,311,233 $ 2,338,331 $ 2,487,382 Equitymarketcapitalization(atendofperiod) $ 1,097,793Totalshareholders'equity $ 1,609,392 $ 1,636,672 $ 1,666,430 $ 1,690,374 $ 1,705,754 Debt(principalbalance) 2,242,842
Totalmarketcapitalization $ 3,340,635SelectedIncomeStatementData:Rentalincome $ 146,625 $ 145,806 $ 145,603 $ 149,885 $ 160,184 Liquidity:Netincome(loss) $ (1,664) $ (3,797) $ 1,299 $ 10,840 $ 65,029 Cashandcashequivalents $ 42,045NOI $ 97,168 $ 95,763 $ 98,834 $ 100,186 $ 103,158 Availabilityunder$750millionunsecuredrevolving
creditfacility 750,000AdjustedEBITDAre $ 91,301 $ 89,817 $ 92,883 $ 94,213 $ 96,513FFO $ 61,610 $ 62,628 $ 66,640 $ 64,268 $ 66,443 Totalliquidity $ 792,045NormalizedFFO $ 61,842 $ 62,628 $ 67,197 $ 67,550 $ 66,443CAD $ 42,344 $ 44,557 $ 45,543 $ 47,366 $ 39,744RollingfourquarterCAD $ 179,810 $ 177,210 $ 171,277 $ 182,453 $ 188,606
PerCommonShareData(basicanddiluted):Netincome(loss) $ (0.03) $ (0.08) $ 0.03 $ 0.23 $ 1.35FFO $ 1.28 $ 1.30 $ 1.39 $ 1.34 $ 1.38NormalizedFFO $ 1.28 $ 1.30 $ 1.40 $ 1.40 $ 1.38CAD $ 0.88 $ 0.93 $ 0.95 $ 0.98 $ 0.83RollingfourquarterCAD $ 3.74 $ 3.68 $ 3.56 $ 3.79 $ 3.92
Dividends:Annualizeddividendspaidpershareduringtheperiod $ 2.20 $ 2.20 $ 2.20 $ 2.20 $ 2.20Annualizeddividendyield(atendofperiod) 9.7% 10.6% 8.5% 8.1% 6.8%NormalizedFFOpayoutratio 43.0% 42.3% 39.3% 39.3% 39.9%CADpayoutratio 62.5% 59.1% 57.9% 56.1% 66.3%RollingfourquarterCADpayoutratio 58.8% 59.6% 61.8% 58.0% 56.1%
(dollars in thousands, except per share data)
RETURN TO TABLE OF CONTENTS
Key Financial Data
Supplemental Q4 2020 7
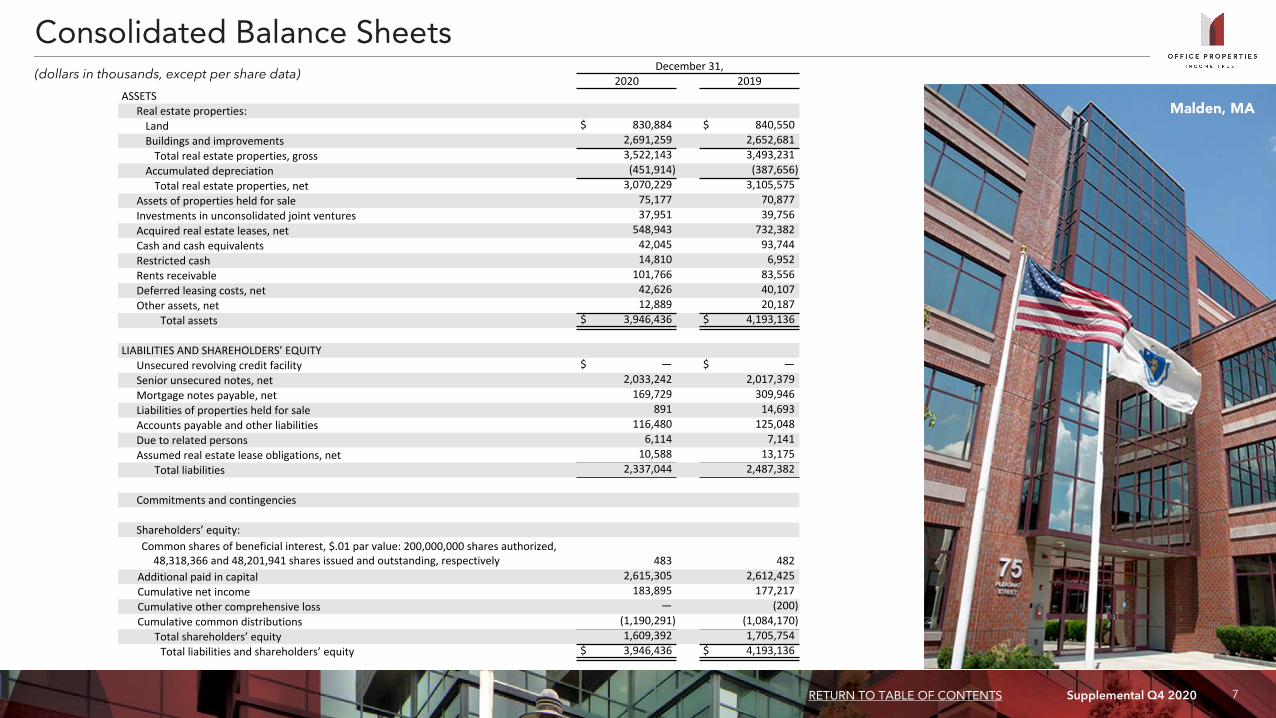
December31,2020 2019
ASSETSRealestateproperties:Land $ 830,884 $ 840,550Buildingsandimprovements 2,691,259 2,652,681Totalrealestateproperties,gross 3,522,143 3,493,231
Accumulateddepreciation (451,914) (387,656)Totalrealestateproperties,net 3,070,229 3,105,575
Assetsofpropertiesheldforsale 75,177 70,877Investmentsinunconsolidatedjointventures 37,951 39,756Acquiredrealestateleases,net 548,943 732,382Cashandcashequivalents 42,045 93,744Restrictedcash 14,810 6,952Rentsreceivable 101,766 83,556Deferredleasingcosts,net 42,626 40,107Otherassets,net 12,889 20,187
Totalassets $ 3,946,436 $ 4,193,136
LIABILITIESANDSHAREHOLDERS’EQUITYUnsecuredrevolvingcreditfacility $ — $ —Seniorunsecurednotes,net 2,033,242 2,017,379Mortgagenotespayable,net 169,729 309,946Liabilitiesofpropertiesheldforsale 891 14,693Accountspayableandotherliabilities 116,480 125,048Duetorelatedpersons 6,114 7,141Assumedrealestateleaseobligations,net 10,588 13,175
Totalliabilities 2,337,044 2,487,382
Commitmentsandcontingencies
Shareholders’equity:Commonsharesofbeneficialinterest,$.01parvalue:200,000,000sharesauthorized,48,318,366and48,201,941sharesissuedandoutstanding,respectively 483 482
Additionalpaidincapital 2,615,305 2,612,425Cumulativenetincome 183,895 177,217Cumulativeothercomprehensiveloss — (200)Cumulativecommondistributions (1,190,291) (1,084,170)
Totalshareholders’equity 1,609,392 1,705,754Totalliabilitiesandshareholders’equity $ 3,946,436 $ 4,193,136
Consolidated Balance Sheets(dollars in thousands, except per share data)
RETURN TO TABLE OF CONTENTS
Malden, MA

Supplemental Q4 2020 8
See accompanying notes on the following page.
ThreeMonthsEndedDecember31, YearEndedDecember31,2020 2019 2020 2019
Rentalincome $ 146,625 $ 160,184 $ 587,919 $ 678,404
Expenses: Realestatetaxes 16,418 18,354 65,119 73,717Utilityexpenses 5,607 7,933 25,384 34,302Otheroperatingexpenses 27,432 30,739 105,465 120,943Depreciationandamortization 62,226 63,512 251,566 289,885Lossonimpairmentofrealestate(1) — 8,150 2,954 22,255Acquisitionandtransactionrelatedcosts(2) 232 — 232 682Generalandadministrative 7,071 7,271 28,443 32,728
Totalexpenses 118,986 135,959 479,163 574,512
Gainonsaleofrealestate(3) 33 71,593 10,855 105,131Dividendincome — — — 1,960Lossonequitysecurities,net(4) — — — (44,007)Interestandotherincome 41 198 779 1,045Interestexpense(includingnetamortizationofdebtpremiums,discountsandissuancecostsof$2,431,$2,476,$9,593and$10,740,respectively) (28,842) (30,032) (108,303) (134,880)
Lossonearlyextinguishmentofdebt(5) — — (3,839) (769)Income(loss)beforeincometaxexpenseandequityinnetlossesofinvestees (1,129) 65,984 8,248 32,372Incometaxexpense (157) (269) (377) (778)Equityinnetlossesofinvestees (378) (686) (1,193) (1,259)Netincome(loss) $ (1,664) $ 65,029 $ 6,678 $ 30,335
Weightedaveragecommonsharesoutstanding(basicanddiluted) 48,161 48,094 48,124 48,062
Percommonshareamounts(basicanddiluted): Netincome(loss) $ (0.03) $ 1.35 $ 0.14 $ 0.63
AdditionalData:Generalandadministrativeexpenses/totalassets(atendofperiod) 0.18% 0.17% 0.72% 0.78%Non-cashstraightlinerentadjustmentsincludedinrentalincome $ 3,116 $ 8,142 $ 16,079 $ 27,507Leasevalueamortizationincludedinrentalincome $ (1,291) $ (82) $ (5,440) $ (2,710)Leaseterminationfeesincludedinrentalincome $ 90 $ 2 $ 98 $ 9,185Non-cashamortizationincludedinotheroperatingexpenses(6) $ 121 $ 121 $ 484 $ 484Non-cashamortizationincludedingeneralandadministrativeexpenses(6) $ 151 $ 151 $ 603 $ 603
Consolidated Statements of Income (Loss)(amounts in thousands, except per share data)
RETURN TO TABLE OF CONTENTS
Kansas City, MO

Supplemental Q4 2020 9
(1) Loss on impairment of real estate for the year ended December 31, 2020 represents an adjustment of $2,954 to reduce the carrying value of four properties to their estimated fair value less costs to sell during the nine months ended September 30, 2020. Loss on impairment of real estate for the three months ended December 31, 2019 includes an adjustment of $9,739 to reduce the carrying value of one property to its estimated fair value less costs to sell and a $250 loss on impairment of real estate related to the sale of three properties, offset by the recovery of impairment losses recorded in previous periods of $1,839 related to the sale of four properties. Loss on impairment of real estate for the year ended December 31, 2019 also includes adjustments totaling $11,479 to reduce the carrying value of 10 properties to their estimated fair value less costs to sell and $2,626 of losses on impairment of real estate related to the sale of 35 properties during the nine months ended September 30, 2019.
(2) Acquisition and transaction related costs for the three months and year ended December 31, 2020 represent costs related to an acquisition opportunity we terminated in November 2020. Acquisition and transaction related costs for the year ended December 31, 2019 consist of post-merger activity costs incurred in connection with our acquisition of Select Income REIT, or SIR, on December 31, 2018 in a merger transaction, or the Merger, and other related transactions.
(3) Gain on sale of real estate for the year ended December 31, 2020 represents a $10,855 net gain on the sale of 10 properties. Gain on sale of real estate for the three months ended December 31, 2019 represents a $71,593 net gain on the sale of seven properties. Gain on sale of real estate for the year ended December 31, 2019 also includes a $33,538 net gain on the sale of three properties during the nine months ended September 30, 2019.
(4) Loss on equity securities, net represents a realized loss for the year ended December 31, 2019 from the sale of our 2.8 million shares of The RMR Group Inc., or RMR Inc., common stock on July 1, 2019.
(5) Loss on early extinguishment of debt for the year ended December 31, 2020 includes prepayment fees related to the repayment of two mortgage notes, write offs of the unamortized portion of certain discounts and issuance costs resulting from the early repayment of debt and a loss related to the settlement of a mortgage note receivable in connection with a property we sold in 2016. Loss on early extinguishment of debt for the year ended December 31, 2019 includes write offs of the unamortized portion of certain discounts and issuance costs resulting from the early repayment of debt.
(6) We recorded a liability for the amount by which the estimated fair value for accounting purposes exceeded the price we paid for our former investment in RMR Inc. common stock in June 2015. This liability is being amortized on a straight line basis through December 31, 2035 as an allocated reduction to business management fee expense and property management fee expense, which are included in general and administrative and other operating expenses, respectively.
Consolidated Statements of Income (Loss) (Continued)(dollars in thousands)
RETURN TO TABLE OF CONTENTS
Provo, UT

Supplemental Q4 2020 10
Fixedvs.VariableRateDebt
Fixed100%
CouponRate(2)
InterestRate(3)
PrincipalBalance MaturityDate
DueatMaturity
YearstoMaturity
UnsecuredFloatingRateDebt:$750,000unsecuredrevolvingcreditfacility(4)(5) 1.196% 1.196% $ — 1/31/2023 $ — 2.1
UnsecuredFixedRateDebt:Seniorunsecurednotesdue2022 4.150% 4.196% 300,000 2/1/2022 300,000 1.1Seniorunsecurednotesdue2022 4.000% 4.000% 300,000 7/15/2022 300,000 1.5Seniorunsecurednotesdue2024 4.250% 4.404% 350,000 5/15/2024 350,000 3.4Seniorunsecurednotesdue2025 4.500% 4.521% 650,000 2/1/2025 650,000 4.1Seniorunsecurednotesdue2046 5.875% 5.875% 310,000 5/1/2046 310,000 25.3Seniorunsecurednotesdue2050 6.375% 6.375% 162,000 6/23/2050 162,000 29.5Subtotal/weightedaverage 4.687% 4.726% 2,072,000 2,072,000 8.3
SecuredFixedRateDebt:Mortgagedebt-OnepropertyinLakewood,CO 8.150% 6.150% 350 3/1/2021 118 0.2Mortgagedebt-OnepropertyinWashington,DC 4.220% 4.190% 25,804 7/1/2022 24,668 1.5Mortgagedebt-ThreepropertiesinSeattle,WA 3.550% 4.210% 71,000 5/1/2023 71,000 2.3Mortgagedebt-OnepropertyinChicago,IL 3.700% 4.210% 50,000 6/1/2023 50,000 2.4Mortgagedebt-OnepropertyinWashington,DC 4.800% 4.190% 23,688 6/1/2023 22,584 2.4Subtotal/weightedaverage 3.878% 4.208% 170,842 168,370 2.2
Total/weightedaverage 4.625% 4.687% $2,242,842 $ 2,240,370 7.9
See accompanying notes on the following page.
Securedvs.UnsecuredDebt
Unsecured92.4%
Secured7.6%
Debt Summary (1)
As of December 31, 2020(dollars in thousands)
RETURN TO TABLE OF CONTENTS

Supplemental Q4 2020 11
$600,000
$350,000
$650,000$472,000
$143,784
UnsecuredFloatingRateDebt UnsecuredFixedRateDebt SecuredFixedRateDebt
2021 2022 2023 2024 2025 2026andthereafter$0
$100,000
$200,000
$300,000
$400,000
$500,000
$600,000
$700,000
(1) Excludes two mortgage notes with an aggregate principal balance of $82,000 which are secured by three properties owned by two unconsolidated joint ventures in which we own 51% and 50% interests. See page 15 for additional information regarding these joint ventures and related mortgage notes.
(2) Reflects the interest rate stated in, or determined pursuant to, the contract terms.
(3) Includes the effect of mark to market accounting for certain mortgages and discounts on senior unsecured notes. Excludes the effect of debt issuance costs amortization.
(4) We are required to pay interest on borrowings under our revolving credit facility at a rate of LIBOR plus a premium of 110 basis points per annum. We also pay a facility fee of 25 basis points per annum on the total amount of lending commitments under our revolving credit facility. Both the interest rate premium and facility fee are subject to adjustment based upon changes to our credit ratings. The interest rate listed is as of December 31, 2020 and excludes the 25 basis point facility fee. Subject to the payment of an extension fee and meeting certain other conditions, we may extend the maturity date of our revolving credit facility by two additional six month periods.
(5) The maximum aggregate borrowing availability under the credit agreement governing our revolving credit facility may be increased to up to $1,950,000 in certain circumstances.
(6) Represents the amount, if any, outstanding under our revolving credit facility at December 31, 2020.
(7) Represents Secured Fixed Rate Debt payments in 2021 and mortgage debt maturing in 2021 that has a principal balance of $350 at December 31, 2020.
$1,540(7)
Year UnsecuredFloatingRate UnsecuredFixedRate SecuredFixedRate TotalDebt %ofTotalDebt
2021 $ — $ — $ 1,540 $ 1,540 0.1%
2022 — 600,000 25,518 625,518 27.9%
2023 — — 143,784 143,784 6.4%
2024 — 350,000 — 350,000 15.6%
2025 — 650,000 — 650,000 29.0%
2026andthereafter — 472,000 — 472,000 21.0%
Totalprincipalbalance $ — $ 2,072,000 $ 170,842 $ 2,242,842 100.0%
Percentoftotalprincipalbalance 0.0% 92.4% 7.6% 100.0%
$25,518
RETURN TO TABLE OF CONTENTS
Debt Maturity Schedule (1)
As of December 31, 2020(dollars in thousands)
(6)
(6)

Supplemental Q4 2020 12
Leverage Ratios, Coverage Ratios and Public Debt Covenants(dollars in thousands)
RETURN TO TABLE OF CONTENTS
AsofandfortheThreeMonthsEnded
12/31/2020 9/30/2020 6/30/2020 3/31/2020 12/31/2019
LeverageRatios:
Netdebt(1)/totalgrossassets 50.0% 49.9% 49.9% 50.2% 50.0%
Netdebt(1)/grossbookvalueofrealestateassets 46.9% 46.6% 46.4% 47.1% 48.9%
Secureddebt(1)/totalassets 4.3% 4.3% 5.3% 6.1% 7.8%
Variableratedebt(1)/netdebt(1) 0.0% 0.0% 9.1% 15.7% 0.0%
CoverageRatios:
AdjustedEBITDAre/interestexpense 3.2x 3.3x 3.7x 3.5x 3.2x
Netdebt(1)/annualizedAdjustedEBITDAre 6.0x 6.1x 5.9x 5.9x 5.9x
PublicDebtCovenants:
Totaldebt(1)/adjustedtotalassets(maximum60.0%) 46.3% 46.4% 46.3% 47.1% 48.7%
Secureddebt(1)/adjustedtotalassets(maximum40.0%) 3.5% 3.5% 4.4% 5.1% 6.7%
Consolidatedincomeavailablefordebtservice/debtservice(minimum1.50x) 3.4x 3.3x 3.7x 3.8x 3.5x
Totalunencumberedassets/unsecureddebt(1)(minimum150.0%) 214.0% 213.3% 215.8% 208.1% 203.0%
(1) Debt amounts represent the outstanding principal balance as of the date reported. Total debt excludes two mortgage notes with an aggregate principal balance of $82,000 which are secured by three properties owned by two unconsolidated joint ventures in which we own 51% and 50% interests. See page 15 for more information regarding these joint ventures and related mortgage notes.
Atlanta, GA

Supplemental Q4 2020 13
FortheThreeMonthsEnded
12/31/2020 9/30/2020 6/30/2020 3/31/2020 12/31/2019
Leaserelatedcosts $ 8,746 $ 7,192 $ 11,921 $ 7,113 $ 10,351
Buildingimprovements 11,466 10,579 10,005 9,230 10,578
Recurringcapitalexpenditures 20,212 17,771 21,926 16,343 20,929
Development,redevelopmentandotheractivities 5,598 5,521 2,578 3,161 3,489
Totalcapitalexpenditures $ 25,810 $ 23,292 $ 24,504 $ 19,504 $ 24,418
Averagerentablesq.ft.duringperiod(2) 24,899 24,909 24,908 25,316 26,508
Buildingimprovementsperaveragesq.ft.duringperiod $ 0.46 $ 0.42 $ 0.40 $ 0.36 $ 0.40
(1) Excludes capital expenditures related to three properties owned by two unconsolidated joint ventures in which we own 51% and 50% interests. See page 15 for more information regarding these joint ventures.
(2) Rentable square footage is subject to changes when space is remeasured or reconfigured for tenants.
Capital Expenditures Summary (1)
(dollars and sq. ft. in thousands, except per sq. ft. data)
RETURN TO TABLE OF CONTENTS
Chicago, IL

Supplemental Q4 2020 14
Acquisitions(1):
DateAquired Location
NumberofProperties Sq.Ft.
PurchasePrice
PurchasePrice/Sq.Ft. CapRate
WeightedAverage
RemainingLeaseTerminYears
PercentLeasedatAcquisition
12/22/2020 FortMill,SC 1 150 $ 35,125 $ 234 8.1% 10.8 100.0%
Dispositions:
DateSold LocationNumberofProperties Sq.Ft.
GrossSalesPrice
1/8/2020 Stafford,VA 2 65 $ 14,063
1/24/2020 Windsor,CT 1 97 7,000
2/28/2020 Lincolnshire,IL 1 223 12,000
3/11/2020 Trenton,NJ 1 267 30,100
3/19/2020 Fairfax,VA 1 83 22,200
10/19/2020 Fairfax,VA 4 171 25,100
1/13/2021 KansasCity,MO(2) — 10 845
1/22/2021 Richmond,VA 1 311 130,000
Total 11 1,227 $ 241,308
(1) On February 21, 2020, we also acquired a property adjacent to a property we own in Boston, MA for a purchase price of $11,500, excluding acquisition related costs.
(2) Consists of a warehouse facility adjacent to a property we own in Kansas City, MO.
Property Acquisitions and Dispositions Information Since January 1, 2020(dollars and sq. ft. in thousands, except per sq. ft. data)
RETURN TO TABLE OF CONTENTS
Fort Mill, SC
Supplemental Q4 2020 15
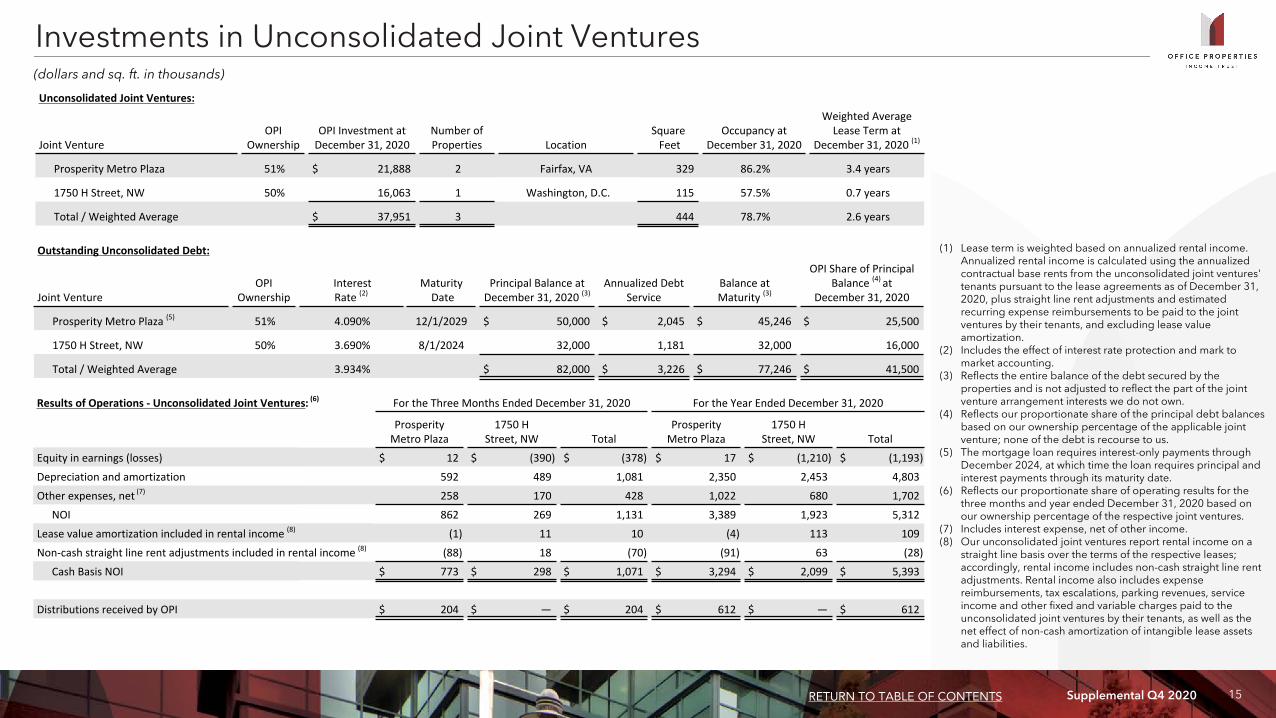
UnconsolidatedJointVentures:
JointVentureOPI
OwnershipOPIInvestmentatDecember31,2020
NumberofProperties Location
SquareFeet
OccupancyatDecember31,2020
WeightedAverageLeaseTermat
December31,2020(1)
ProsperityMetroPlaza 51% $ 21,888 2 Fairfax,VA 329 86.2% 3.4years
1750HStreet,NW 50% 16,063 1 Washington,D.C. 115 57.5% 0.7years
Total/WeightedAverage $ 37,951 3 444 78.7% 2.6years
(1) Lease term is weighted based on annualized rental income. Annualized rental income is calculated using the annualized contractual base rents from the unconsolidated joint ventures' tenants pursuant to the lease agreements as of December 31, 2020, plus straight line rent adjustments and estimated recurring expense reimbursements to be paid to the joint ventures by their tenants, and excluding lease value amortization.
(2) Includes the effect of interest rate protection and mark to market accounting.
(3) Reflects the entire balance of the debt secured by the properties and is not adjusted to reflect the part of the joint venture arrangement interests we do not own.
(4) Reflects our proportionate share of the principal debt balances based on our ownership percentage of the applicable joint venture; none of the debt is recourse to us.
(5) The mortgage loan requires interest-only payments through December 2024, at which time the loan requires principal and interest payments through its maturity date.
(6) Reflects our proportionate share of operating results for the three months and year ended December 31, 2020 based on our ownership percentage of the respective joint ventures.
(7) Includes interest expense, net of other income.(8) Our unconsolidated joint ventures report rental income on a
straight line basis over the terms of the respective leases; accordingly, rental income includes non-cash straight line rent adjustments. Rental income also includes expense reimbursements, tax escalations, parking revenues, service income and other fixed and variable charges paid to the unconsolidated joint ventures by their tenants, as well as the net effect of non-cash amortization of intangible lease assets and liabilities.
Investments in Unconsolidated Joint Ventures(dollars and sq. ft. in thousands)
RETURN TO TABLE OF CONTENTS
ResultsofOperations-UnconsolidatedJointVentures:(6) FortheThreeMonthsEndedDecember31,2020 FortheYearEndedDecember31,2020
ProsperityMetroPlaza
1750HStreet,NW Total
ProsperityMetroPlaza
1750HStreet,NW Total
Equityinearnings(losses) $ 12 $ (390) $ (378) $ 17 $ (1,210) $ (1,193)
Depreciationandamortization 592 489 1,081 2,350 2,453 4,803
Otherexpenses,net(7) 258 170 428 1,022 680 1,702
NOI 862 269 1,131 3,389 1,923 5,312
Leasevalueamortizationincludedinrentalincome(8) (1) 11 10 (4) 113 109
Non-cashstraightlinerentadjustmentsincludedinrentalincome(8) (88) 18 (70) (91) 63 (28)
CashBasisNOI $ 773 $ 298 $ 1,071 $ 3,294 $ 2,099 $ 5,393
DistributionsreceivedbyOPI $ 204 $ — $ 204 $ 612 $ — $ 612
OutstandingUnconsolidatedDebt:
JointVentureOPI
OwnershipInterestRate(2)
MaturityDate
PrincipalBalanceatDecember31,2020(3)
AnnualizedDebtService
BalanceatMaturity(3)
OPIShareofPrincipalBalance(4)at
December31,2020
ProsperityMetroPlaza(5) 51% 4.090% 12/1/2029 $ 50,000 $ 2,045 $ 45,246 $ 25,500
1750HStreet,NW 50% 3.690% 8/1/2024 32,000 1,181 32,000 16,000
Total/WeightedAverage 3.934% $ 82,000 $ 3,226 $ 77,246 $ 41,500

Supplemental Q4 2020 16
FortheThreeMonthsEnded FortheYearEnded12/31/2020 9/30/2020 6/30/2020 3/31/2020 12/31/2019 12/31/2020 12/31/2019
CalculationofNOIandCashBasisNOI:Rentalincome $ 146,625 $ 145,806 $ 145,603 $ 149,885 $ 160,184 $ 587,919 $ 678,404Propertyoperatingexpenses (49,457) (50,043) (46,769) (49,699) (57,026) (195,968) (228,962)
NOI 97,168 95,763 98,834 100,186 103,158 391,951 449,442Non-cashstraightlinerentadjustmentsincludedinrentalincome (3,116) (3,912) (3,468) (5,583) (8,142) (16,079) (27,507)Leasevalueamortizationincludedinrentalincome 1,291 1,312 1,405 1,432 82 5,440 2,710Leaseterminationfeesincludedinrentalincome (90) (2) (3) (3) (2) (98) (9,185)Non-cashamortizationincludedinpropertyoperatingexpenses(2) (121) (121) (121) (121) (121) (484) (484)
CashBasisNOI $ 95,132 $ 93,040 $ 96,647 $ 95,911 $ 94,975 $ 380,730 $ 414,976
ReconciliationofNetIncome(Loss)toNOIandCashBasisNOI:Netincome(loss) $ (1,664) $ (3,797) $ 1,299 $ 10,840 $ 65,029 $ 6,678 $ 30,335Equityinnetlossesofinvestees 378 279 260 276 686 1,193 1,259Incometaxexpense(benefit) 157 (54) 235 39 269 377 778
Income(loss)beforeincometaxexpense(benefit)andequityinnetlossesofinvestees (1,129) (3,572) 1,794 11,155 65,984 8,248 32,372
Lossonearlyextinguishmentofdebt — — 557 3,282 — 3,839 769Interestexpense 28,842 27,097 25,205 27,159 30,032 108,303 134,880Interestandotherincome (41) (2) (30) (706) (198) (779) (1,045)Lossonequitysecurities,net — — — — — — 44,007Dividendincome — — — — — — (1,960)Gainonsaleofrealestate (33) — (66) (10,756) (71,593) (10,855) (105,131)Generalandadministrative 7,071 7,059 7,204 7,109 7,271 28,443 32,728Acquisitionandtransactionrelatedcosts 232 — — — — 232 682Lossonimpairmentofrealestate — 2,954 — — 8,150 2,954 22,255Depreciationandamortization 62,226 62,227 64,170 62,943 63,512 251,566 289,885
NOI 97,168 95,763 98,834 100,186 103,158 391,951 449,442Non-cashamortizationincludedinpropertyoperatingexpenses(2) (121) (121) (121) (121) (121) (484) (484)Leaseterminationfeesincludedinrentalincome (90) (2) (3) (3) (2) (98) (9,185)Leasevalueamortizationincludedinrentalincome 1,291 1,312 1,405 1,432 82 5,440 2,710Non-cashstraightlinerentadjustmentsincludedinrentalincome (3,116) (3,912) (3,468) (5,583) (8,142) (16,079) (27,507)
CashBasisNOI $ 95,132 $ 93,040 $ 96,647 $ 95,911 $ 94,975 $ 380,730 $ 414,976
(1) Excludes three properties owned by two unconsolidated joint ventures in which we own 51% and 50% interests. See page 15 for more information regarding these joint ventures.
(2) We recorded a liability for the amount by which the estimated fair value for accounting purposes exceeded the price we paid for our former investment in RMR Inc. common stock in June 2015. A portion of this liability is being amortized on a straight line basis through December 31, 2035 as a reduction to property management fees expense, which are included in property operating expenses.
Calculation and Reconciliation of NOI and Cash Basis NOI (1)
(dollars in thousands)
RETURN TO TABLE OF CONTENTS

Supplemental Q4 2020 17
FortheThreeMonthsEnded FortheYearEnded
12/31/2020 12/31/2019 12/31/2020 12/31/2019
ReconciliationofNOItoSamePropertyNOI:
Rentalincome $ 146,625 $ 160,184 $ 587,919 $ 678,404
Propertyoperatingexpenses (49,457) (57,026) (195,968) (228,962)
NOI 97,168 103,158 391,951 449,442
Less:NOIofpropertiesnotincludedinsamepropertyresults (2,096) (7,010) (10,053) (63,454)
SamePropertyNOI $ 95,072 $ 96,148 $ 381,898 $ 385,988
CalculationofSamePropertyCashBasisNOI:
SamePropertyNOI $ 95,072 $ 96,148 $ 381,898 $ 385,988
Add:Leasevalueamortizationincludedinrentalincome 694 (482) 3,071 604
Less:Non-cashstraightlinerentadjustmentsincludedinrentalincome (3,044) (7,503) (15,061) (25,468)
Leaseterminationfeesincludedinrentalincome (90) (2) (98) (1,543)
Non-cashamortizationincludedinpropertyoperatingexpenses(2) (117) (109) (459) (396)
SamePropertyCashBasisNOI $ 92,515 $ 88,052 $ 369,351 $ 359,185
(1) Excludes three properties owned by two unconsolidated joint ventures in which we own 51% and 50% interests. See page 15 for more information regarding these joint ventures.
(2) We recorded a liability for the amount by which the estimated fair value for accounting purposes exceeded the price we paid for our former investment in RMR Inc. common stock in June 2015. A portion of this liability is being amortized on a straight line basis through December 31, 2035 as a reduction to property management fees expense, which are included in other operating expenses.
Reconciliation and Calculation of Same Property NOI and Same Property Cash Basis NOI (1)
(dollars in thousands)
RETURN TO TABLE OF CONTENTS
Washington, DC

Supplemental Q4 2020 18
FortheThreeMonthsEnded FortheYearEnded
12/31/2020 9/30/2020 6/30/2020 3/31/2020 12/31/2019 12/31/2020 12/31/2019
Netincome(loss) $ (1,664) $ (3,797) $ 1,299 $ 10,840 $ 65,029 $ 6,678 $ 30,335
Add(less):Interestexpense 28,842 27,097 25,205 27,159 30,032 108,303 134,880
Incometaxexpense(benefit) 157 (54) 235 39 269 377 778
Depreciationandamortization 62,226 62,227 64,170 62,943 63,512 251,566 289,885
EBITDA 89,561 85,473 90,909 100,981 158,842 366,924 455,878
Add(less):Lossonimpairmentofrealestate — 2,954 — — 8,150 2,954 22,255
Gainonsaleofrealestate (33) — (66) (10,756) (71,593) (10,855) (105,131)
Distributionsreceivedfromunconsolidatedjointventures 204 255 102 51 397 612 2,370
Equityinlossesofunconsolidatedjointventures 378 279 260 276 350 1,193 1,541
EBITDAre 90,110 88,961 91,205 90,552 96,146 360,828 376,913
Add(less):Acquisitionandtransactionrelatedcosts(1) 232 — — — — 232 682Generalandadministrativeexpensepaidincommonshares(2) 959 856 1,121 379 367 3,315 3,087
Lossonearlyextinguishmentofdebt — — 557 3,282 — 3,839 769
Lossonequitysecurities,net(3) — — — — — — 44,007
AdjustedEBITDAre $ 91,301 $ 89,817 $ 92,883 $ 94,213 $ 96,513 $ 368,214 $ 425,458
Calculation of EBITDA, EBITDAre, and Adjusted EBITDAre(dollars in thousands)
(1) Acquisition and transaction related costs for the three months and year ended December 31, 2020 represent costs related to an acquisition opportunity we terminated in November 2020. Acquisition and transaction related costs for the year ended December 31, 2019 represent post-merger activity costs incurred in connection with the Merger and other related transactions.
(2) Amounts represent equity based compensation to our Trustees, our officers and certain other employees of RMR LLC.
(3) Loss on equity securities, net represents a realized loss for the year ended December 31, 2019 for the sale of our 2.8 million shares of RMR Inc. common stock on July 1, 2019.
RETURN TO TABLE OF CONTENTS

Supplemental Q4 2020 19
FortheThreeMonthsEnded FortheYearEnded
12/31/2020 9/30/2020 6/30/2020 3/31/2020 12/31/2019 12/31/2020 12/31/2019
Netincome(loss) $ (1,664) $ (3,797) $ 1,299 $ 10,840 $ 65,029 $ 6,678 $ 30,335
Add(less):Depreciationandamortization:
Consolidatedproperties 62,226 62,227 64,170 62,943 63,512 251,566 289,885
Unconsolidatedjointventureproperties 1,081 1,244 1,237 1,241 1,345 4,803 5,903
Lossonimpairmentofrealestate — 2,954 — — 8,150 2,954 22,255
Gainonsaleofrealestate (33) — (66) (10,756) (71,593) (10,855) (105,131)
Lossonequitysecurities,net(1) — — — — — — 44,007
FFO 61,610 62,628 66,640 64,268 66,443 255,146 287,254
Add(less):Acquisitionandtransactionrelatedcosts(2) 232 — — — — 232 682
Lossonearlyextinguishmentofdebt — — 557 3,282 — 3,839 769
NormalizedFFO 61,842 62,628 67,197 67,550 66,443 259,217 288,705
Add(less):Non-cashexpenses(3) 607 533 808 79 76 2,027 1,974
Distributionsfromunconsolidatedjointventures 204 255 102 51 397 612 2,370
Depreciationandamortization-unconsolidatedjointventures (1,081) (1,244) (1,237) (1,241) (1,345) (4,803) (5,903)
Equityinnetlossesofinvestees 378 279 260 276 686 1,193 1,259
Lossonearlyextinguishmentofdebtsettledincash — — — (1,138) — (1,138) —
Non-cashstraightlinerentadjustmentsincludedinrentalincome (3,116) (3,912) (3,468) (5,583) (8,142) (16,079) (27,507)
Leasevalueamortizationincludedinrentalincome 1,291 1,312 1,405 1,432 82 5,440 2,710
Netamortizationofdebtpremiums,discountsandissuancecosts 2,431 2,477 2,402 2,283 2,476 9,593 10,740
Recurringcapitalexpenditures (20,212) (17,771) (21,926) (16,343) (20,929) (76,252) (85,742)
CAD $ 42,344 $ 44,557 $ 45,543 $ 47,366 $ 39,744 $ 179,810 $ 188,606
Weightedaveragecommonsharesoutstanding(basicanddiluted) 48,161 48,132 48,106 48,095 48,094 48,124 48,062
Percommonshareamounts(basicanddiluted):
Netincome(loss) $ (0.03) $ (0.08) $ 0.03 $ 0.23 $ 1.35 $ 0.14 $ 0.63
FFO $ 1.28 $ 1.30 $ 1.39 $ 1.34 $ 1.38 $ 5.30 $ 5.98
NormalizedFFO $ 1.28 $ 1.30 $ 1.40 $ 1.40 $ 1.38 $ 5.39 $ 6.01
CAD $ 0.88 $ 0.93 $ 0.95 $ 0.98 $ 0.83 $ 3.74 $ 3.92
(1) Loss on equity securities, net represents a realized loss for the year ended December 31, 2019 for the sale of our 2.8 million shares of RMR Inc. common stock on July 1, 2019.
(2) Acquisition and transaction related costs for the three months and year ended December 31, 2020 represent costs related to an acquisition opportunity we terminated in November 2020. Acquisition and transaction related costs for the year ended December 31, 2019 represent post-merger activity costs incurred in connection with the Merger and other related transactions.
(3) Non-cash expenses include equity based compensation, adjustments recorded to capitalize interest expense and amortization of the liability for the amount by which the estimated fair value for accounting purposes exceeded the price we paid for our former investment in RMR Inc. common stock in June 2015. This liability is being amortized on a straight line basis through December 31, 2035 as an allocated reduction to business management fee expense and property management fee expense, which are included in general and administrative and other operating expenses, respectively.
Calculation of FFO, Normalized FFO and CAD(amounts in thousands, except per share data)
RETURN TO TABLE OF CONTENTS
Supplemental Q4 2020 20
FortheThreeMonthsEnded FortheYearEnded
12/31/2020 12/31/2019 12/31/2020 12/31/2019
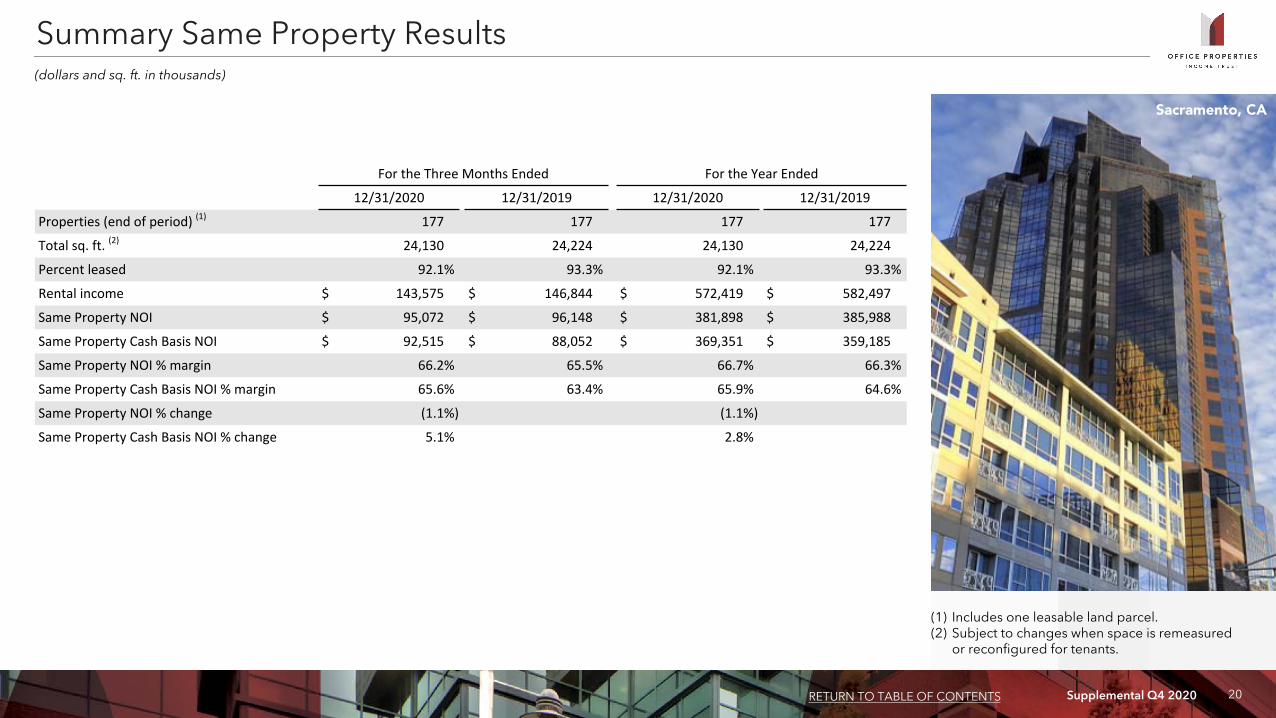
Properties(endofperiod)(1) 177 177 177 177
Totalsq.ft.(2) 24,130 24,224 24,130 24,224
Percentleased 92.1% 93.3% 92.1% 93.3%
Rentalincome $ 143,575 $ 146,844 $ 572,419 $ 582,497
SamePropertyNOI $ 95,072 $ 96,148 $ 381,898 $ 385,988
SamePropertyCashBasisNOI $ 92,515 $ 88,052 $ 369,351 $ 359,185
SamePropertyNOI%margin 66.2% 65.5% 66.7% 66.3%
SamePropertyCashBasisNOI%margin 65.6% 63.4% 65.9% 64.6%
SamePropertyNOI%change (1.1%) (1.1%)
SamePropertyCashBasisNOI%change 5.1% 2.8%
(1) Includes one leasable land parcel.(2) Subject to changes when space is remeasured
or reconfigured for tenants.
Summary Same Property Results(dollars and sq. ft. in thousands)
RETURN TO TABLE OF CONTENTS
Sacramento, CA
Supplemental Q4 2020 21
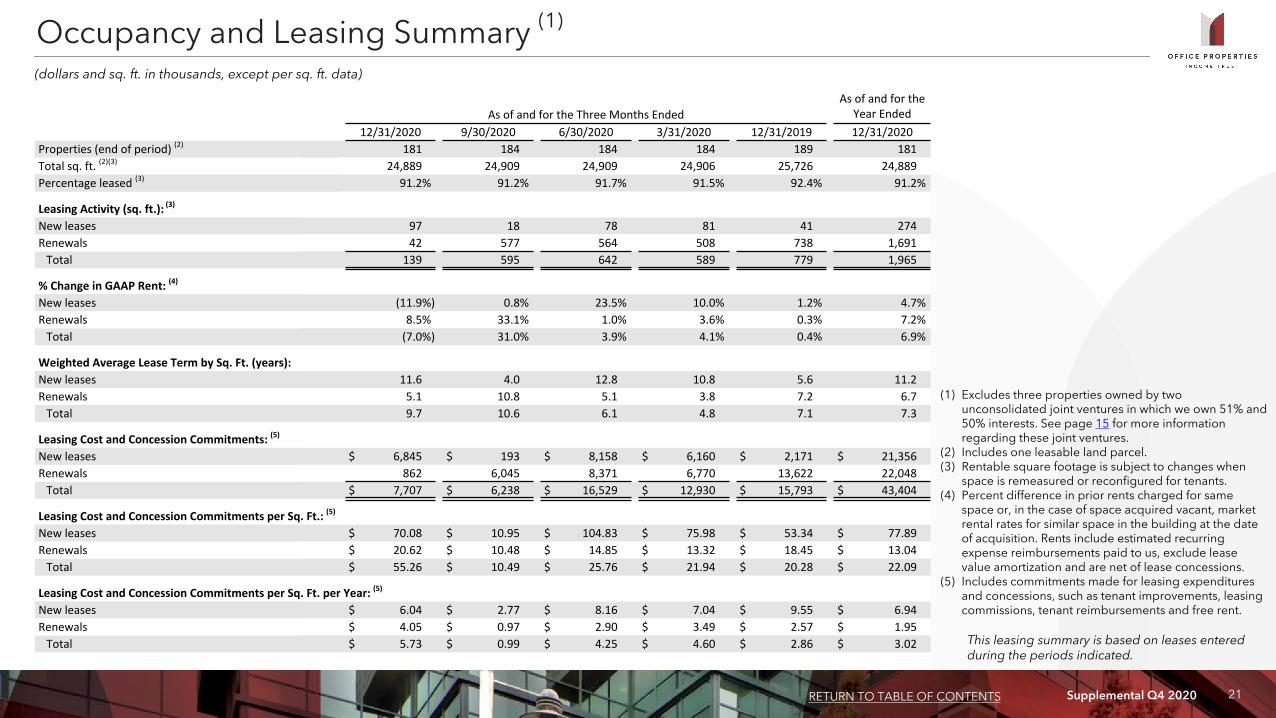
AsofandfortheThreeMonthsEndedAsofandforthe
YearEnded
12/31/2020 9/30/2020 6/30/2020 3/31/2020 12/31/2019 12/31/2020Properties(endofperiod)(2) 181 184 184 184 189 181Totalsq.ft.(2)(3) 24,889 24,909 24,909 24,906 25,726 24,889Percentageleased(3) 91.2% 91.2% 91.7% 91.5% 92.4% 91.2%
LeasingActivity(sq.ft.):(3)
Newleases 97 18 78 81 41 274Renewals 42 577 564 508 738 1,691Total 139 595 642 589 779 1,965
%ChangeinGAAPRent:(4)
Newleases (11.9%) 0.8% 23.5% 10.0% 1.2% 4.7%Renewals 8.5% 33.1% 1.0% 3.6% 0.3% 7.2%Total (7.0%) 31.0% 3.9% 4.1% 0.4% 6.9%
WeightedAverageLeaseTermbySq.Ft.(years):Newleases 11.6 4.0 12.8 10.8 5.6 11.2Renewals 5.1 10.8 5.1 3.8 7.2 6.7Total 9.7 10.6 6.1 4.8 7.1 7.3
LeasingCostandConcessionCommitments:(5)
Newleases $ 6,845 $ 193 $ 8,158 $ 6,160 $ 2,171 $ 21,356Renewals 862 6,045 8,371 6,770 13,622 22,048Total $ 7,707 $ 6,238 $ 16,529 $ 12,930 $ 15,793 $ 43,404
LeasingCostandConcessionCommitmentsperSq.Ft.:(5)
Newleases $ 70.08 $ 10.95 $ 104.83 $ 75.98 $ 53.34 $ 77.89Renewals $ 20.62 $ 10.48 $ 14.85 $ 13.32 $ 18.45 $ 13.04Total $ 55.26 $ 10.49 $ 25.76 $ 21.94 $ 20.28 $ 22.09
LeasingCostandConcessionCommitmentsperSq.Ft.perYear:(5)
Newleases $ 6.04 $ 2.77 $ 8.16 $ 7.04 $ 9.55 $ 6.94Renewals $ 4.05 $ 0.97 $ 2.90 $ 3.49 $ 2.57 $ 1.95Total $ 5.73 $ 0.99 $ 4.25 $ 4.60 $ 2.86 $ 3.02
(1) Excludes three properties owned by two unconsolidated joint ventures in which we own 51% and 50% interests. See page 15 for more information regarding these joint ventures.
(2) Includes one leasable land parcel.(3) Rentable square footage is subject to changes when
space is remeasured or reconfigured for tenants.(4) Percent difference in prior rents charged for same
space or, in the case of space acquired vacant, market rental rates for similar space in the building at the date of acquisition. Rents include estimated recurring expense reimbursements paid to us, exclude lease value amortization and are net of lease concessions.
(5) Includes commitments made for leasing expenditures and concessions, such as tenant improvements, leasing commissions, tenant reimbursements and free rent.
Occupancy and Leasing Summary (1)
(dollars and sq. ft. in thousands, except per sq. ft. data)
This leasing summary is based on leases entered during the periods indicated.
RETURN TO TABLE OF CONTENTS
Supplemental Q4 2020 22
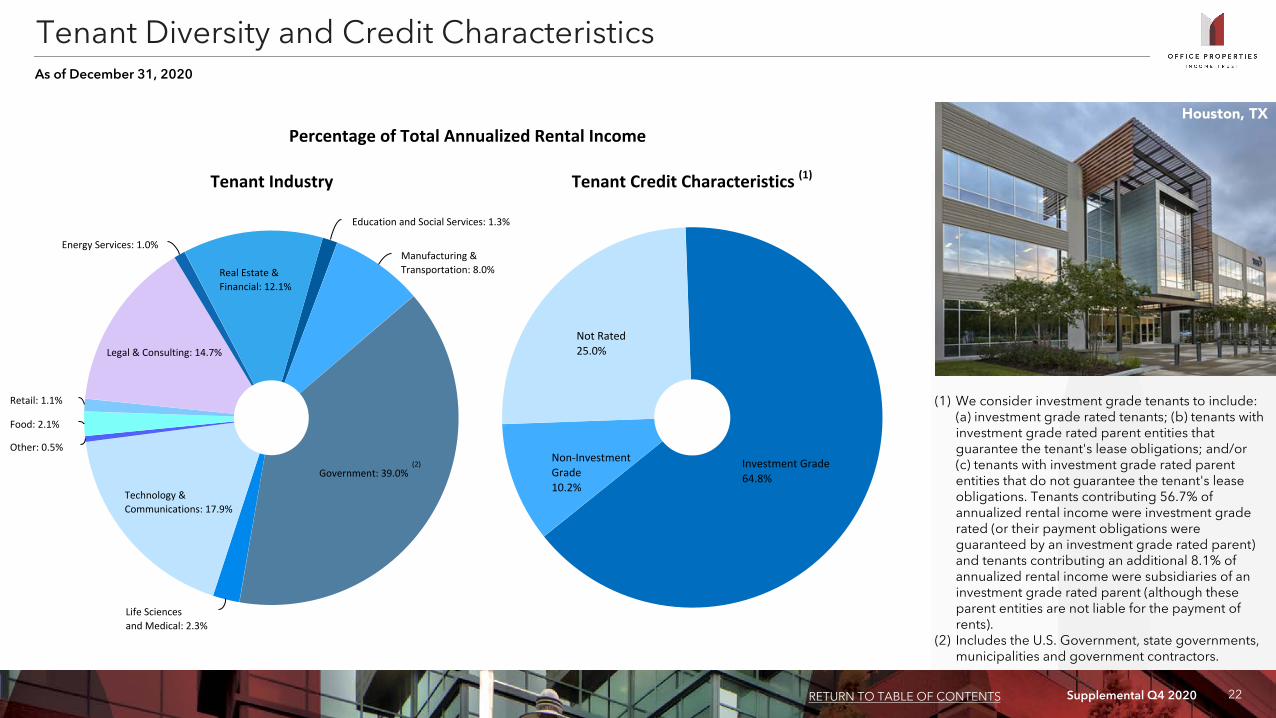
InvestmentGrade64.8%
Non-InvestmentGrade10.2%
NotRated25.0%
PercentageofTotalAnnualizedRentalIncome
TenantCreditCharacteristics(1)
(4)
(3)
EducationandSocialServices:1.3%
Manufacturing&Transportation:8.0%
Government:39.0%
LifeSciencesandMedical:2.3%
Technology&Communications:17.9%
Other:0.5%
Food:2.1%
Retail:1.1%
Legal&Consulting:14.7%
EnergyServices:1.0%
RealEstate&Financial:12.1%
TenantIndustry
(1) We consider investment grade tenants to include: (a) investment grade rated tenants; (b) tenants with investment grade rated parent entities that guarantee the tenant's lease obligations; and/or (c) tenants with investment grade rated parent entities that do not guarantee the tenant's lease obligations. Tenants contributing 56.7% of annualized rental income were investment grade rated (or their payment obligations were guaranteed by an investment grade rated parent) and tenants contributing an additional 8.1% of annualized rental income were subsidiaries of an investment grade rated parent (although these parent entities are not liable for the payment of rents).
(2) Includes the U.S. Government, state governments, municipalities and government contractors.
Tenant Diversity and Credit CharacteristicsAs of December 31, 2020
RETURN TO TABLE OF CONTENTS
(2)
Houston, TX

Supplemental Q4 2020 23
(4)
(3)
Tenant CreditRating(1) Sq.Ft.%ofLeased
Sq.Ft.Annualized
RentalIncome
%ofTotalAnnualized
RentalIncome 1 U.S.Government InvestmentGrade 5,316 23.4% $ 145,916 25.2%
2 Shook,Hardy&BaconL.L.P. NotRated 596 2.6% 19,199 3.3%
3 StateofCalifornia InvestmentGrade 648 2.9% 19,142 3.3%
4 BankofAmericaCorporation InvestmentGrade 617 2.7% 16,520 2.9%
5 WestRockCompany(2) InvestmentGrade 311 1.4% 12,871 2.2%
6 F5Networks,Inc. NotRated 299 1.3% 12,777 2.2%
7 CommonwealthofMassachusetts InvestmentGrade 311 1.4% 11,953 2.1%
8 CareFirstInc. NotRated 207 0.9% 11,684 2.0%
9 NorthropGrummanCorporation InvestmentGrade 337 1.5% 11,320 2.0%
10 TysonFoods,Inc. InvestmentGrade 248 1.1% 11,011 1.9%
11 MicroFocusInternationalplc NonInvestmentGrade 406 1.8% 8,710 1.5%
12 CommScopeHoldingCompanyInc. NonInvestmentGrade 228 1.0% 8,097 1.4%
13 StateofGeorgia InvestmentGrade 308 1.4% 7,094 1.2%
14 PNCBank InvestmentGrade 441 1.9% 6,902 1.2%
15 ServiceNow,Inc. InvestmentGrade 149 0.7% 6,481 1.1%
16 AllstateInsuranceCo. InvestmentGrade 468 2.1% 6,473 1.1%
17 CompassGroupplc InvestmentGrade 267 1.2% 6,386 1.1%
18 AutomaticDataProcessing,Inc. InvestmentGrade 289 1.3% 6,047 1.0%
19 Church&DwightCo.,Inc. InvestmentGrade 250 1.1% 6,019 1.0%
20 TailoredBrands,Inc.(3) NonInvestmentGrade 206 0.9% 5,898 1.0% 11,902 52.6% $ 340,500 58.7%
(1) We consider investment grade tenants to include: (a) investment grade rated tenants; (b) tenants with investment grade rated parent entities that guarantee the tenant's lease obligations; and (c) tenants with investment grade rated parent entities that do not guarantee the tenant's lease obligations. Tenants contributing 56.7% of annualized rental income were investment grade rated (or their payment obligations were guaranteed by an investment grade rated parent) and tenants contributing an additional 8.1% of annualized rental income were subsidiaries of an investment grade rated parent (although these parent entities were not liable for the payment of rents).
(2) Tenant occupied a property located in Richmond, VA that was classified as held for sale as of December 31, 2020 and sold in January 2021.
(3) In August 2020, Tailored Brands, Inc. filed for Chapter 11 bankruptcy. The tenant has paid its rental obligations to us through December 31, 2020. On January 25, 2021, the lease was assumed in bankruptcy court. As a condition to this lease being assumed, we entered into a lease amendment with the tenant as of January 25, 2021 that includes a reduction of approximately 104,000 square feet. As a result of this lease restructure, this tenant will no longer represent 1% or more of our annualized rental income.
Tenants Representing 1% Or More of Total Annualized Rental IncomeAs of December 31, 2020(dollars and sq. ft. in thousands)
RETURN TO TABLE OF CONTENTS

Supplemental Q4 2020 24
Year(2)
NumberofLeasesExpiring
LeasedSquareFeet
Expiring
%ofTotalLeased
SquareFeetExpiring
Cumulative%ofTotalLeased
SquareFeetExpiring
AnnualizedRentalIncome
Expiring
%ofTotalAnnualized
RentalIncomeExpiring
Cumulative%ofTotalAnnualized
RentalIncomeExpiring
2021 82 3,657 16.1% 16.1% $ 69,903 12.1% 12.1%
2022 74 1,944 8.6% 24.7% 54,821 9.5% 21.6%
2023 65 2,403 10.6% 35.3% 76,436 13.2% 34.8%
2024 58 3,858 17.0% 52.3% 101,530 17.6% 52.4%
2025 54 2,030 8.9% 61.2% 43,585 7.5% 59.9%
2026 31 1,724 7.6% 68.8% 45,837 7.9% 67.8%
2027 31 2,027 8.9% 77.7% 52,385 9.1% 76.9%
2028 15 901 4.0% 81.7% 25,858 4.5% 81.4%
2029 15 934 4.1% 85.8% 24,798 4.3% 85.7%
2030andthereafter 39 3,227 14.2% 100.0% 82,865 14.3% 100.0%
Total 464 22,705 100.0% $ 578,018 100.0%
Weightedaverageremainingleaseterm(inyears) 5.0 5.1
(1) Excludes three properties owned by two unconsolidated joint ventures in which we own 51% and 50% interests. See page 15 for more information regarding these joint ventures.
(2) The year of lease expiration is pursuant to current contract terms.
Lease Expiration Schedule (1)
As of December 31, 2020(dollars and sq. ft. in thousands)
RETURN TO TABLE OF CONTENTS
Norfolk, VA

Supplemental Q4 2020 25
Non-GAAP Financial MeasuresWe present certain “non-GAAP financial measures” within the meaning of applicable rules of the Securities and Exchange Commission, or SEC, including NOI, Cash Basis NOI, Same Property NOI, Same Property Cash Basis NOI, EBITDA, EBITDAre, Adjusted EBITDAre, FFO, Normalized FFO and CAD. These measures do not represent cash generated by operating activities in accordance with GAAP and should not be considered alternatives to net income (loss) as indicators of our operating performance or as measures of our liquidity. These measures should be considered in conjunction with net income (loss) as presented in our consolidated statements of income (loss). We consider these non-GAAP measures to be appropriate supplemental measures of operating performance for a REIT, along with net income (loss). We believe these measures provide useful information to investors because by excluding the effects of certain historical amounts, such as depreciation and amortization expense, they may facilitate a comparison of our operating performance between periods and with other REITs and, in the case of NOI, Cash Basis NOI, Same Property NOI and Same Property Cash Basis NOI reflecting only those income and expense items that are generated and incurred at the property level may help both investors and management to understand the operations of our properties.
NOI and Cash Basis NOIThe calculations of net operating income, or NOI, and Cash Basis NOI exclude certain components of net income (loss) in order to provide results that are more closely related to our property level results of operations. We calculate NOI and Cash Basis NOI as shown on page 16 and Same Property NOI and Same Property Cash Basis NOI as shown on page 17. We define NOI as income from our rental of real estate less our property operating expenses. NOI excludes amortization of capitalized tenant improvement costs and leasing commissions that we record as depreciation and amortization expense. We define Cash Basis NOI as NOI excluding non-cash straight line rent adjustments, lease value amortization, lease termination fees, if any, and non-cash amortization included in other operating expenses. We calculate Same Property NOI and Same Property Cash Basis NOI in the same manner that we calculate the corresponding NOI and Cash Basis NOI amounts, except that we only include same properties in calculating Same Property NOI and Same Property Cash Basis NOI. We use NOI, Cash Basis NOI, Same Property NOI and Same Property Cash Basis NOI to evaluate individual and company-wide property level performance. Other real estate companies and REITs may calculate NOI, Cash Basis NOI, Same Property NOI and Same Property Cash Basis NOI differently than we do.
EBITDA, EBITDAre and Adjusted EBITDAreWe calculate earnings before interest, taxes, depreciation and amortization, or EBITDA, EBITDA for real estate, or EBITDAre, and Adjusted EBITDAre as shown on page 18. EBITDAre is calculated on the basis defined by The National Association of Real Estate Investment Trusts, or Nareit, which is EBITDA, excluding gains and losses on the sale of real estate, loss on impairment of real estate assets and adjustments to reflect our share of EBITDAre of our unconsolidated joint ventures. In calculating Adjusted EBITDAre, we adjust for the items shown on page 18 and include business management incentive fees, if any, only in the fourth quarter versus the quarter when they are recognized as expense in accordance with GAAP due to their quarterly volatility not necessarily being indicative of our core operating performance and the uncertainty as to whether any such business management incentive fees will be payable when all contingencies for determining such fees are known at the end of the calendar year. Other real estate companies and REITs may calculate EBITDA, EBITDAre and Adjusted EBITDAre differently than we do.
FFO and Normalized FFOWe calculate funds from operations, or FFO, and Normalized FFO as shown on page 19. FFO is calculated on the basis defined by Nareit, which is net income (loss), calculated in accordance with GAAP, plus real estate depreciation and amortization of consolidated properties and our proportionate share of the real estate depreciation and amortization of unconsolidated joint venture properties, but excluding impairment charges on real estate assets, any gain or loss on sale of real estate and equity securities, as well as certain other adjustments currently not applicable to us. In calculating Normalized FFO, we adjust for the other items shown on page 19 and include business management incentive fees, if any, only in the fourth quarter versus the quarter when they are recognized as an expense in accordance with GAAP due to their quarterly volatility not necessarily being indicative of our core operating performance and the uncertainty as to whether any such business management incentive fees will be payable when all contingencies for determining such fees are known at the end of the calendar year. FFO and Normalized FFO are among the factors considered by our Board of Trustees when determining the amount of distributions to our shareholders. Other factors include, but are not limited to, requirements to maintain our qualification for taxation as a REIT, limitations in our credit agreement and public debt covenants, the availability to us of debt and equity capital, our expectation of our future capital requirements and operating performance and our expected needs for and availability of cash to pay our obligations. Other real estate companies and REITs may calculate FFO and Normalized FFO differently than we do.
Cash Available for Distribution (CAD)We calculate cash available for distribution, or CAD, as shown on page 19. We define CAD as Normalized FFO minus recurring real estate related capital expenditures and other non-cash and non-recurring items. CAD is among the factors considered by our Board of Trustees when determining the amount of distributions to our shareholders. Other real estate companies and REITs may calculate CAD differently than we do.
RETURNTOTABLEOFCONTENTS
Non-GAAP Financial Measures and Certain Definitions
RETURN TO TABLE OF CONTENTS

Supplemental Q4 2020 26
Adjusted total assets and total unencumbered assets include the original cost of real estate assets calculated in accordance with GAAP before impairment writedowns, if any, and exclude depreciation and amortization, accounts receivable and intangible assets.
Annualized dividend yield is the annualized dividend per share paid during the period divided by the closing price of our common shares at the end of the period.
Annualized rental income is calculated using the annualized contractual base rents from our tenants pursuant to our lease agreements as of December 31, 2020, plus straight line rent adjustments and estimated recurring expense reimbursements to be paid to us, and excluding lease value amortization.
Building improvements generally include expenditures to replace obsolete building components and expenditures that extend the useful life of existing assets.
Cap rate represents the ratio of (x) annual straight line rental income, excluding the impact of above and below market lease amortization, based on existing leases at the acquisition date, less estimated annual property operating expenses as of the date of the acquisition, excluding depreciation and amortization expense, to (y) the acquisition purchase price, including the principal amount of assumed debt, if any, and excluding acquisition related costs.
Consolidated income available for debt service is earnings from operations excluding interest expense, depreciation and amortization, loss on asset impairment, unrealized and realized gains or losses on equity securities, gains and losses on early extinguishment of debt, gains and losses on sales of properties and equity in earnings of unconsolidated joint ventures and including distributions from our unconsolidated joint ventures, if any, determined together with debt service for the period presented.
Development, redevelopment and other activities generally include capital expenditure projects that reposition a property or result in new sources of revenue.
GAAP is U.S. generally accepted accounting principles.
Gross book value of real estate assets is real estate properties at cost, plus certain acquisition costs, if any, before depreciation and purchase price allocations, less impairment writedowns, if any.
Gross sales price is equal to the gross contract price, includes purchase price adjustments, if any, and excludes closing costs.
Leased square feet is pursuant to leases existing as of December 31, 2020, and includes (i) space being fitted out for tenant occupancy pursuant to our lease agreements, if any, and (ii) space which is leased, but is not occupied or is being offered for sublease by tenants, if any. Square footage measurements are subject to changes when space is remeasured or reconfigured for new tenants.
Lease related costs generally include capital expenditures used to improve tenants' space or amounts paid directly to tenants to improve their space and leasing related costs, such as brokerage commissions and tenant inducements.
Net debt is total debt less cash.
Percent leased includes (i) space being fitted out for occupancy pursuant to our lease agreements, if any, and (ii) space which is leased, but is not occupied or is being offered for sublease by tenants, if any, as of the measurement date.
Purchase price represents the gross purchase price, including assumed debt, if any, and excludes acquisition related costs and purchase price allocations.
Rolling four quarter CAD represents CAD for the preceding twelve month period as of the respective quarter end date.
Same properties for the three months ended December 31, 2020 is based on properties we owned continuously since October 1, 2019; excludes properties classified as held for sale and properties undergoing significant redevelopment, if any, and three properties owned by two unconsolidated joint ventures in which we own 51% and 50% interests.
Same properties for the year ended December 31, 2020 is based on properties we owned continuously since January 1, 2019; excludes properties classified as held for sale and properties undergoing significant redevelopment, if any, and three properties owned by two unconsolidated joint ventures in which we own 51% and 50% interests.
Same property cash basis NOI margin is Same Property Cash Basis NOI as a percentage of cash basis rental income. Cash basis rental income excludes non-cash straightline rent adjustments, the net effect of non-cash amortization of intangible lease assets and liabilities and lease termination fees, if any.
Same property NOI margin is Same Property NOI as a percentage of rental income.
Total gross assets is total assets plus accumulated depreciation.
Weighted average remaining lease term is the average remaining lease term in years weighted based on rental income as of the date of acquisition.
Non-GAAP Financial Measures and Certain Definitions (Continued)
RETURN TO TABLE OF CONTENTS

Supplemental Q4 2020 27
This supplemental operating and financial data may contain forward-looking statements within the meaning of the Private Securities Litigation Reform Act of 1995 and other securities laws. Whenever we use words such as “believe”, “expect”, “anticipate”, “intend”, “plan”, “estimate”, “will”, “may” and negatives or derivatives of these or similar expressions, we are making forward-looking statements. These forward-looking statements are based upon our present intent, beliefs or expectations, but forward-looking statements are not guaranteed to occur and may not occur. Actual results may differ materially from those contained in or implied by our forward-looking statements. Forward-looking statements involve known and unknown risks, uncertainties and other factors, some of which are beyond our control.
The information contained in our filings with the SEC, including under “Risk Factors” in our periodic reports, or incorporated therein, identifies important factors that could cause our actual results to differ materially from those stated in or implied by our forward-looking statements. Our filings with the SEC are available on the SEC's website at www.sec.gov. You should not place undue reliance upon forward-looking statements. Except as required by law, we do not intend to update or change any forward-looking statements as a result of new information, future events or otherwise.
Warning Concerning Forward-Looking Statements
RETURN TO TABLE OF CONTENTS
Burlington, VT