Fourth generation detour matrix-based topological indices for … · 2017-10-28 · Fourth...
56
Int. J. Computational Biology and Drug Design, Vol. 5, Nos. 3/4, 2012 335 Copyright © 2012 Inderscience Enterprises Ltd. Fourth generation detour matrix-based topological indices for QSAR/QSPR – Part-1: development and evaluation Rakesh Kumar Marwaha Faculty of Pharmaceutical Sciences, M.D. University, Rohtak 124-001, India Email: [email protected] Email: [email protected] Harish Jangra Department of Pharmacoinformatics, National Institute of Pharmaceutical Education and Research, S.A.S. Nagar, Mohali 160-062, India Email: [email protected] Kinkar C. Das Department of Mathematics, Sungkyunkwan University, Suwon 440-746, South Korea Email: [email protected] Email: [email protected] P.V. Bharatam Department of Medicinal Chemistry, National Institute of Pharmaceutical Education and Research, S.A.S. Nagar, Mohali 160-062, India Email: [email protected] A.K. Madan* Faculty of Pharmaceutical Sciences, Pt. B.D. Sharma University of Health Sciences, Rohtak 124-001, India Email: [email protected] *Corresponding author Abstract: In the present study, four detour matrix-based Topological Indices (TIs) termed as augmented path eccentric connectivity indices 1–4 (denoted by 1 2 3 , , AP C AP C AP C and 4 AP C ) as well as their topochemical versions (denoted
Transcript of Fourth generation detour matrix-based topological indices for … · 2017-10-28 · Fourth...

Int. J. Computational Biology and Drug Design, Vol. 5, Nos. 3/4, 2012 335
Copyright © 2012 Inderscience Enterprises Ltd.
Fourth generation detour matrix-based topological indices for QSAR/QSPR – Part-1: development and evaluation
Rakesh Kumar Marwaha Faculty of Pharmaceutical Sciences, M.D. University, Rohtak 124-001, India Email: [email protected] Email: [email protected]
Harish Jangra Department of Pharmacoinformatics, National Institute of Pharmaceutical Education and Research, S.A.S. Nagar, Mohali 160-062, India Email: [email protected]
Kinkar C. Das Department of Mathematics, Sungkyunkwan University, Suwon 440-746, South Korea Email: [email protected] Email: [email protected]
P.V. Bharatam Department of Medicinal Chemistry, National Institute of Pharmaceutical Education and Research, S.A.S. Nagar, Mohali 160-062, India Email: [email protected]
A.K. Madan* Faculty of Pharmaceutical Sciences, Pt. B.D. Sharma University of Health Sciences, Rohtak 124-001, India Email: [email protected] *Corresponding author
Abstract: In the present study, four detour matrix-based Topological Indices (TIs) termed as augmented path eccentric connectivity indices 1–4 (denoted by
1 2 3, ,AP C AP C AP C and 4AP C ) as well as their topochemical versions (denoted
336 R.K. Marwaha et al.
by 1 2 3, ,AP C AP C AP Cc c c and 4
AP Cc ) have been conceptualised. A modified detour
matrix termed as chemical detour matrix (Δc) has also been proposed so as to facilitate computation of index values of topochemical versions of the said TIs. Values of the proposed TIs were computed for all the possible structures containing three, four and five vertices using an in-house computer program. The said TIs exhibited exceptionally high discriminating power and high sensitivity towards branching/relative position of substituent(s) in cyclic structures amalgamated with negligible degeneracy. Due care was taken during the development of TIs so as to ensure that reduction in index values of complex chemical structures to be within reasonable limits without compromising discriminating power. The mathematical properties of one of the proposed TIs have also been studied. With exceptionally high discriminating power, high sensitivity towards branching as well as relative position(s) of substituents in cyclic structures and negligible degeneracy, the proposed indices offer a vast potential for use in characterisation of structures, similarity/ dissimilarity studies, lead identification and optimisation, combinatorial library design and quantitative structure-activity/property/toxicity/pharmacokinetic relationship studies.
Keywords: augmented path eccentric connectivity indices 1–4; augmented path eccentric connectivity topochemical indices 1–4; path eccentricity; detour matrix; chemical detour matrix; chemical path; Wiener’s index; Balaban’s index; Randic’s molecular connectivity index; eccentric connectivity index.
Reference to this paper should be made as follows: Marwaha, R.K., Jangra, H., Das, K.C., Bharatam, P.V. and Madan, A.K. (2012) ‘Fourth generation detour matrix based topological indices for QSAR/QSPR – Part-1: development and evaluation’, Int. J. Computational Biology and Drug Design, Vol. 5, Nos. 3/4, pp.335–360.
Biographical notes: Rakesh Kumar Marwaha is an Assistant Professor in Pharmaceutical Chemistry at the Department of Pharmaceutical Sciences, MD University, Rohtak. He obtained his Masters Degree from the Department of Pharmaceutical Sciences and Drug Research, Punjabi University Patiala. He is currently pursuing his PhD from MD University, Rohtak under the guidance of Prof. A.K.Madan. He has more than 10 years of professional experience. He has keen interest in computational chemistry and in-silico drug discovery.
Harish Jangra is an MS (Pharm) student in the Department of Pharmacoinformatics at the National Institute of Pharmaceutical Education and Research, S.A.S. Nagar, Punjab, India. He has keen interest in scientific programming, chemo- and bio-informatics tool development as well as mechanistic study of CYP450 mediated metabolism.
Kinkar Chandra Das obtained his MTech in Computer Science and Data Processing and his PhD in Spectral Graph Theory from the Indian Institute of Technology, Kharagpur, India in 2004. He won the French scholarship from the Ministry of France, helping him to be a part of LRI, University Paris XI, France, for one year. After that he joined the Department of Mathematics, Sungkyunkwan University in 2006, where he presently holds the position of Associate Professor. His main areas of research interest are spectral graph theory, molecular graph theory, graph colouring and graph labelling, etc. He has published more than 70 research papers in these areas in reputed international journals. He has been on the editorial boards of the journal MATCH Communications in Mathematical and in Computer Chemistry, Journal of Applied & Computational Mathematics (JACM) and Open Journal of Discrete Mathematics.
Fourth generation detour matrix-based topological indices for QSAR/QSPR 337
Prasad V. Bharatam is a Professor in Medicinal Chemistry at the National Institute of Pharmaceutical Education and Research (NIPER), SAS Nagar. He obtained his MSc from Santiniketan, West Bengal and his PhD from the University of Hyderabad, Andhra Pradesh, India. He gained research experience in pioneering research universities in the USA and Germany. He served as a Lecturer and Reader in the Department of Medicinal Chemistry, Guru Nanak Dev University, between 1994 and 2001. He is working at NIPER since 2001. He received many awards, including the Ranbaxy Research award, the OPPI Scientist award, the IBM Faculty award, etc. He is an AvH fellow and an FRSC. He has guided about 20 students for PhD and published about 140 research articles.
A.K. Madan possesses Bachelors Degrees in both Pharmacy and Chemical Engineering and a Masters Degree in Pharmaceutics. He did his PhD in Chemical Engineering from the Indian Institute of Technology, Delhi. He has 7 monographs, 13 patents and >115 research publications. His diverse research areas include chemical computation, (Q)SAR, pharmaceutical process development, pharmaceutical technology, biotechnology and inclusion phenomena. Some of the molecular descriptors developed by him for drug design have already been incorporated in various software such as Dragon, ADAPT, SarchitectTM, Pre-ADMET, MOLGENQSPR, ADME Model Builder and MoDeL. He has 39 years experience in teaching and research. This includes > 20 years in Delhi University, Delhi and 14 years at MD University, Rohtak. He is currently working as a Professor in Pt. BD Sharma University of Health Sciences, Rohtak 124-001, India.
1 Introduction
The study of (quantitative) structure activity/property relationship [(Q)SAR/QSPR] constitutes a vital research area in computational chemistry and has been widely utilised for the prediction of physico-chemical properties and biological activities of organic compounds (Katritzky et al., 2000; Katritzky et al., 2001; Ferydoun et al., 2008). This study not only leads to development of a model for the prediction of the property under investigation of new compounds that have not been synthesised, but can also identify and describe important structural features of molecules that are relevant to variations in molecular properties, thus enabling researcher to gain some insight into structural factors affecting molecular properties (Ferydoun et al., 2008; Benigni and Bossa, 2008). These QSAR/QSPR predictive models have gained significance during the past decade due to the recognition of the importance of these models in building ‘developability’ into drug leads, resulting in fewer expensive downstream failures in the drug-discovery process (Winkler, 2002). But the inherent problem in the study of structure-property/activity relationships pertains to the quantification/characterisation of chemical structures. During the last decade, several research efforts have been mainly focused on studying how to catch and convert – by a theoretical pathway – the information encoded in the molecular structure into one or more numbers – termed as molecular descriptors – used to establish quantitative relationships between structure and biological activities and other empirical properties (Todeschini, 2000). Recently, the attention of scientists has turned to the use of more general structural parameters, in particular those derived from the chemical graph theory (Sahu and Lee, 2008).
338 R.K. Marwaha et al.
In the chemical graph theory, chemical structures are simply represented as hydrogen depleted graphs whose vertices and edges act as atoms and covalent bonds respectively and are termed as molecular graphs (Murcia-Soler et al., 2003; Pogliani, 2000). These graphs depict the molecular topology or pattern of connectedness of atoms in a molecule (Basak et al., 1994). Molecular graphs can simply be characterised by graph invariants. A graph invariant is a graph theoretical property which is preserved by isomorphism and can be a simple number, a sequence of numbers or a polynomial (Basak et al., 2000). This conformational independence attains significance in the study of molecules that are flexible and when the proper conformation of the molecules is not well defined (Stanton, 2008). A numerical graph invariant that characterises the molecular structure is commonly known as a topological index (Garcia-Domenech et al., 2008; Basak and Gute, 1997). They offer simple means of measuring molecular branching, shape and size (Ivanciuc and Balaban, 1999). TIs have the distinct advantage that unlike other molecular descriptors, these indices can be quickly computed for any known or unknown chemical structures (Balaban et al., 2007).
Topostructural and topochemical indices usually are two dimensional (2D) indices, which are collectively known as TIs. Topostructural indices encode information strictly on the basis of adjacency and connectedness of atoms within a molecule, whereas topochemical indices encode information pertaining to both molecular topology and chemical nature of atoms and bonds in a molecule (Basak and Gute, 1997). Topostructural indices can be easily derived from matrices, such as the distance matrix and/or the adjacency matrix, which represents a molecular graph. When the distance matrix or adjacency matrix is weighed corresponding to heteroatom(s) such as N, O and Cl, in a molecule, then the resulting matrix may be termed a chemical distance or chemical adjacency matrix. Indices or descriptors derived from such matrices are known as topochemical indices or topochemical descriptors (Dureja et al., 2008). TIs have been classified according to their nature in various generations. First-generation TIs are integer numbers obtained via simple ‘bookkeeping’ operations from local vertex invariants, which are integer numbers involving just one vertex at a time, whereas second-generation TIs are real numbers derived through sophisticated (‘structural’) operations from integer local vertex invariants, involving more than one vertex at a time. Third-generation TIs are real numbers based on real-number local vertex invariants, having extremely low or no degeneracy (Balaban, 1992). TIs having discriminating power of ≥100 for all possible structures containing only five vertices [with or without heteroatom(s)] have been reported as fourth-generation topological descriptors (Dureja et al., 2008).
TIs can also be classified on the basis of adjacency, distance, distance-cum-adjacency, centricity, information content and as those based on the Valence Electron Mobile (VEM) environment. Adjacency-based TIs are based on the consideration that the whole set of connections between adjacent pairs of atoms may be represented in a matrix form, termed as adjacency matrix, e.g., Platt index (F) (Platt, 1947), Zagreb group parameters M1 and M2 (Gutman and Trinajstic, 1972), etc. Distance-based topological indices employ the distance matrix to characterise molecular graphs. The distance matrix is defined as a real, square, symmetrical matrix of order n, representing the distance traversed in moving from vertex i to vertex j in graph G, e.g., the Wiener index W (Wiener, 1947). Distance-cum-adjacency based TIs employ the distance matrix as well as the adjacency matrix to characterise molecular graphs. These TIs contain more

Fourth generation detour matrix-based topological indices for QSAR/QSPR 339
topological information in a graph, G, than other TIs derived only from the adjacency or the distance matrix, e.g., the eccentric connectivity index (Sharma et al., 1997). In centric graph indices, the concept of graph centre is based on molecular topological distances between the graph vertices. The centre vertices have the smallest maximal distance to the other vertices. Invariants derived from the concept of centre are called centric graph descriptors, e.g., the centric index B (Balaban, 1979). The information theory has been used in the chemical graph theory for describing chemical structures and for providing correlations between physico-chemical and structural properties. Information indices are constructed for various matrices and also for some topological indices. The advantage of such indices is that they may be used directly as simple numerical descriptors in a comparison with physical, chemical or biological parameters of molecules in structure property and activity relationships. It can also be noted that information indices normally have greater discriminating power for isomers when compared to other TIs, e.g., the information content index (I) (Bonchev et al., 1981) and Structural Information Content (SICγ) (Basak et al., 1980; Basak and Magnuson, 1983). The descriptors developed in the VEM environment are called TAU descriptors. A vertex in the molecular graph is considered to be composed of a core and a valence electronic environment and their extensions are called Extended Topochemical Atom (ETA) descriptors. ETA descriptors utilise core count (α), VEM count (β) and electronegativity term (ε). ETA parameters are sufficiently rich in chemical information to encode the structural features that contribute significantly to the biological activity/toxicity of compounds (Roy and Ghosh, 2003, 2004 and 2010; Roy and Das, 2011).
Distance-based topological indices employ the distance matrix or the detour matrix to characterise molecular graphs. The distance matrix is based on topological distance, which is the number of edges in the shortest path between vertices vi and vj, whereas the detour matrix is based on the number of edges in the longest path between vertices vi and vj in a molecular graph G (Todeschini, 2000). Though most of the well-known distance-based TIs are derived from the distance matrix, there exist only a handful of TIs based upon the detour matrix. As a consequence there exists a vast potential in utilising the detour matrix for developing novel TIs (Castro et al., 2000). High discriminating power, absence of degeneracy and non-correlation with well-known TIs are some of the desirable features for the development of novel TIs (Ivanciuc et al., 1997; Basak et al., 2004). The necessity of developing even better TIs that describe molecular structure in a more effective way can be best understood by considering the recent advances in drug-discovery technologies that promise to accelerate the process of lead discovery and optimisation (Estrada and Molina, 2001; Estrada et al., 2001).
In the present study, four detour matrix-based TIs termed as augmented path eccentric connectivity indices 1–4 (denoted by 1 2 3, ,AP C AP C AP C and 4
AP C ) as well as
their topochemical versions (denoted by 1 2 3, ,AP C AP C AP Cc c c and 4
AP Cc ) have been
conceptualised. A computer program was also developed for the computation of the values of the proposed TIs. The said TIs were evaluated for discriminating power, degeneracy, intercorrelation with some of the widely used TIs and sensitivity towards branching as well as relative positions of substituents in cyclic structures. The mathematical properties of one of the proposed TIs were also studied.
340 R.K. Marwaha et al.
2 Methodology
2.1 Calculation of topological indices
2.1.1 Augmented path eccentric connectivity index–1
The augmented path eccentric connectivity index-1 ( 1AP C ) may be defined as the
summation of the square root of the product of augmented adjacency and path eccentricity of the vertex vi involved in a hydrogen-suppressed molecular graph, with the resulting value divided by a constant factor k1. It can be expressed as:
1 2
1 11
1/n
AP Ci i
i
k M
(1)
where Mi is the augmented adjacency and is defined as the product of degrees of all the vertices (vj), adjacent to vertex vi, Δηi is the path eccentricity of vertex vi, k1 has a value of 10 and n is the number of vertices in graph G. For a molecular graph (G), v1, v2, …, vn are vertices and the number of first neighbours of a vertex vi is the degree of this vertex. The detour distance Δ (vi, vj | G) between the vertices vi and vj of graph is the length of the longest path having maximum number of edges separating vi and vj. The path eccentricity Δηi of vertex vi, in graph G is the length of the longest path having maximum number of edges separating vi and vertex vj that is farthest from vi, (Δηi = max Δ (vi,vj) j | G) (Todeschini and Consonni, 2000).
Similarly, the topochemical version of the aforementioned index termed as augmented path eccentric connectivity topochemical index–1 ( 1
AP Cc ) may be defined as
the summation of the square root of the product of augmented chemical adjacency and chemical path eccentricity of vertex vi involved in a hydrogen-suppressed molecular graph, with the resulting value divided by a constant factor k1. It can be expressed as:
1 2
1 11
1/n
AP Cc ic ic
i
k M
(2)
where Mic is the augmented chemical adjacency (defined as the product of chemical degrees of all the vertices vj adjacent to vertex vi), Δηic is chemical path eccentricity of vertex vi, value of k1 is equal to 10 and n is the number of vertices in graph G. Chemical path eccentricity of vertex vi may be defined as the length of the longest chemical path having maximum number of edges separating vi and vertex vj that is farthest from vi in graph G [Δηic = max Δ (vi, vj), j | G]. The chemical degree of vertex vi can be determined by using the chemical adjacency matrix(Ac), which is obtained by substituting the non-zero row elements of the adjacency matrix corresponding to heteroatoms like N, O, Cl, S, Br, etc., with relative atomic weight with respect to the carbon atom when moving from the carbon atom to any of these heteroatom(s) and with 1 when moving from any of these heteroatom(s) to the carbon atom (Goel and Madan, 1995; Kumar et al., 2004; Bajaj et al., 2004). The chemical path eccentricity of vertex vi, can be determined by modifying the detour matrix. This modified form of the detour matrix may be termed the chemical detour matrix (Δc) and may be simply obtained by substituting all the non-zero row elements of the detour matrix with the respective chemical paths. A chemical path will have a value of only 1 for each edge linking carbon with carbon, but in case of
Fourth generation detour matrix-based topological indices for QSAR/QSPR 341
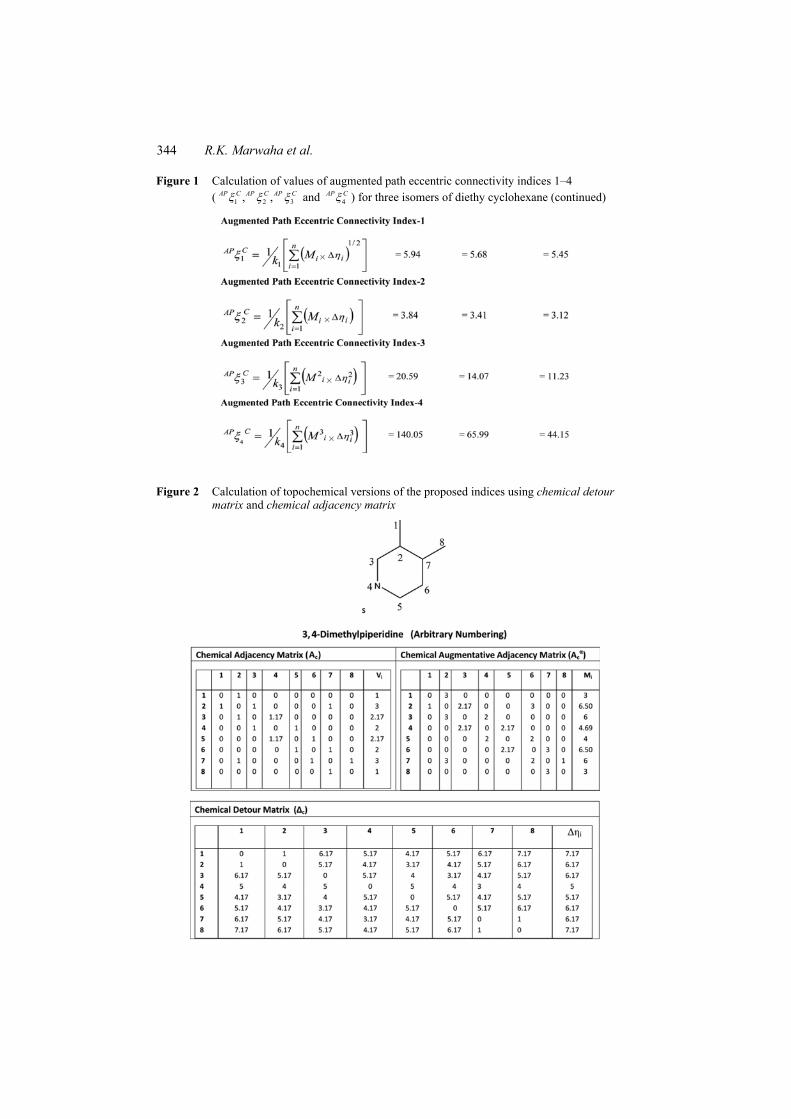
heteroatoms like N, O, Cl, S, Br, etc., it will be substituted with the relative atomic weights with respect to the carbon atom when moving from the carbon atom to any of these heteroatom(s) and with 1 when moving from any of these heteroatom(s) to the carbon atom. The chemical detour matrix for 3,4-dimethylpiperidine has been exemplified in Figure 2. Both the chemical adjacency matrix and the chemical detour matrix take into consideration the presence as well as relative position of heteroatom(s) in hydrogensuppressed molecular structures.
2.1.2 Augmented path eccentric connectivity index–2
The augmented path eccentric connectivity index–2 ( 2AP C ) may be defined as the
summation of the product of augmented adjacency and path eccentricity of vertex vi involved in a hydrogen-suppressed molecular graph, with the resulting value divided by a constant factor k2. It can be expressed as:
2 21
1/n
AP Ci i
i
k M
(3)
where Mi is the augmented adjacency and is defined as the product of degrees of all the vertices (vj), adjacent to vertex vi, Δηi is the path eccentricity of vertex vi, value of k2 is equal to 100 and n is the number of vertices in graph G.
Similarly, the topochemical version of the above index, termed augmented path eccentric connectivity topochemical index–2 ( 2
AP Cc ) may be defined as the summation of
the product of augmented chemical adjacency and chemical path eccentricity of the vertex vi, involved in a hydrogen-suppressed molecular graph, with the resulting value divided by a constant factor k2. It can be expressed as:
2 21
1/n
AP Cc ic ic
i
k M
(4)
where Mic is the augmented chemical adjacency and is defined as the product of chemical degrees of all the vertices (vj), adjacent to vertex vi, Δηic is the chemical path eccentricity of vertex vi, value of k2 is equal to 100 and n is the number of vertices in graph G.
2.1.3 Augmented path eccentric connectivity index–3
The augmented path eccentric connectivity index–3 ( 3AP C ) may be defined as the
summation of the squared product of augmented adjacency and path eccentricity of vertex vi involved in a hydrogen-suppressed molecular graph, with the resulting value divided by a constant factor k3. It can be expressed as:
2 23 3
1
1/N
AP Ci i
i
k M
(5)
where Mi is the augmented adjacency and is defined as the product of degrees of all the vertices (vj), adjacent to vertex vi, Δηi is the path eccentricity, value of k3 is equal to 1000 and n is the number of vertices in graph G.

342 R.K. Marwaha et al.
Similarly, the topochemical version of the aforementioned index is termed augmented path eccentric connectivity topochemical index–3 ( 3
AP Cc ) may be defined as the
summation of the squared product of augmented chemical adjacency and chemical path eccentricity of the vertex vi, involved in a hydrogen-suppressed molecular graph, with the resulting value divided by a constant factor k3. It can be expressed as:
2 23 3
1
1/n
AP Cc ic ic
i
k M
(6)
where Mic is the augmented chemical adjacency and may be defined as the product of chemical degrees of all the vertices vj adjacent to vertex vi, Δηic is the chemical path eccentricity of vertex vi, value of k3 is equal to 1000 and n is the number of vertices in graph G.
2.1.4 Augmented path eccentric connectivity index–4
The augmented path eccentric connectivity index–4 ( 4AP C ) may be defined as the
summation of the product of the third power of the augmented adjacency and path eccentricity of vertex vi, involved in a hydrogen-suppressed molecular graph, with the resulting value divided by a constant factor k4. It can be expressed as:
3 34 4
1
1/n
AP Ci i
i
k M
(7)
where Mi is the augmented adjacency and is defined as the product of degrees of all the vertices (vj), adjacent to vertex vi, Δηi is the path eccentricity, value of k4 is equal to 10,000 and n is the number of vertices in graph G.
Similarly, the topochemical version of the above index, termed augmented path eccentric connectivity topochemical index–4 ( 4
AP Cc ) may be defined as the summation of
the product of augmented chemical adjacency and chemical path eccentricity of the vertex vi, involved in a hydrogen-suppressed molecular graph, with the resulting value divided by a constant factor k4. It can be expressed as:
3 34 4
1
1/n
AP Cc ic ic
i
k M
(8)
where Mic is the augmented chemical adjacency and may be defined as the product of chemical degrees of all vertices (vj), adjacent to vertex vi, Δηic is the chemical path eccentricity of vertex vi, value of k4 is equal to 10,000 and n is the number of vertices in graph G.
Augmented path eccentric connectivity indices can be easily calculated from the detour matrix (Δ) and augmented adjacency matrix (Aα). The calculation of the augmented path eccentric connectivity indices 1–4 ( 1 2 3, ,AP C AP C AP C and 4
AP C ) for
three isomers of diethylcyclohexane has been exemplified in Figure 1. The calculation of the topochemical versions of the said indices ( 1 2 3, ,AP C AP C AP C
c c c and 4AP C
c ) for 3,
4-dimethylpiperidine has been exemplified in Figure 2.

Fourth generation detour matrix-based topological indices for QSAR/QSPR 343
Figure 1 Calculation of values of augmented path eccentric connectivity indices 1–4 ( 1 2 3, ,AP C AP C AP C and 4
AP C ) for three isomers of diethy cyclohexane
344 R.K. Marwaha et al.
Figure 1 Calculation of values of augmented path eccentric connectivity indices 1–4 ( 1 2 3, ,AP C AP C AP C and 4
AP C ) for three isomers of diethy cyclohexane (continued)
Figure 2 Calculation of topochemical versions of the proposed indices using chemical detour matrix and chemical adjacency matrix

Fourth generation detour matrix-based topological indices for QSAR/QSPR 345
Figure 2 Calculation of topochemical versions of the proposed indices using chemical detour matrix and chemical adjacency matrix (continued)
3 Evaluation of proposed TIs
Augmented path eccentric connectivity indices 1–4 as well as their topochemical counterparts were evaluated for discriminating power, degeneracy, intercorrelation with existing TIs and sensitivity towards branching as well as relative position of substituent(s) in cyclic structures. The discriminating power and degeneracy of the augmented path eccentric connectivity indices and their topochemical counterparts were investigated using all possible structures with three, four and five vertices (Tables 1 and 2). However, each chemical structure contained one nitrogen atom as heteroatom in case of topochemical indices (Tables 3 and 4).
Table 1 Index values of path eccentric connectivity indices (1–4) for all possible structure containing three, four and five vertices
S.No. Structure 1AP C 2
AP C 3AP C 4
AP C
1 0.50 0.09 0.03 0.013
2 0.85 0.24 0.19 0.15
3 0.89 0.20 0.10 0.09
4
0.84 0.19 0.11 0.06
5
1.43 0.53 0.79 1.29
6 1.38 0.48 0.58 0.069
7
2.24 1.26 4.05 13.27
8
3.60 3.24 26.24 212.57

346 R.K. Marwaha et al.
Table 1 Index values of path eccentric connectivity indices (1–4) for all possible structure containing three, four and five vertices (continued)
S.No. Structure 1AP C 2
AP C 3AP C 4
AP C
9 1.34 0.36 0.26 0.197
10
1.29 0.34 0.25 0.195
11
1.23 0.33 0.26 0.204
12
1.96 0.81 1.55 3.30
13
2.06 0.87 1.66 3.48
14
1.95 0.80 1.50 3.16
15
2.83 1.60 5.12 16.38
16
2.02 0.84 1.58 3.28
17
2.78 1.56 5.04 16.76
18
3.08 1.96 8.46 38.25
19 3.16 2.19 12.54 81.46
20 4.90 5.29 69.02 949.35
21 4.36 3.84 30.72 255.59
22
2.00 0.80 1.28 2.05
23
2.96 1.8 7.06 29.55
24
4.37 3.96 34.99 331.26
25
4.54 4.32 43.78 497.66
26
6.6 9.00 187.92 4595.62
27
6.96 10.24 243.71 6219.37
28
10.40 22.40 1126.40 60686.34
29
16.00 51.20 5242.88 429496.73

Fourth generation detour matrix-based topological indices for QSAR/QSPR 347
Table 2 Comparison of discriminating power and degeneracy of path eccentric connectivity indices (1–4) using all possible structures with three, four and five vertices
1
AP C 2AP C 3
AP C 4AP C
For three vertices
Minimum value 0.5 0.09 0.03 0.013
Maximum value 0.85 0.24 0.19 0.15
Ratio 1:1.7 1:2.7 1:6.3 1:11.5
Degeneracy 0/2 0/2 0/2 0/2
For four vertices
Minimum value 0.84 0.19 0.10 0.06
Maximum value 3.6 3.24 26.24 212.57
Ratio 1:4.3 1:17.05 1:262.4 1:3542.8
Degeneracy 0/6 0/6 0/6 0/6
For five vertices
Minimum value 1.2 33 0.25 0.195
Maximum value 16.0 5120 5242.88 429496.73
Ratio 1:13.3 1:155.15 1:20971 1:2202547
Degeneracy 0/21 1/21 0/21 0/21
Notes: Degeneracy = Number of compounds having same values/total number of compounds with same number of vertices.
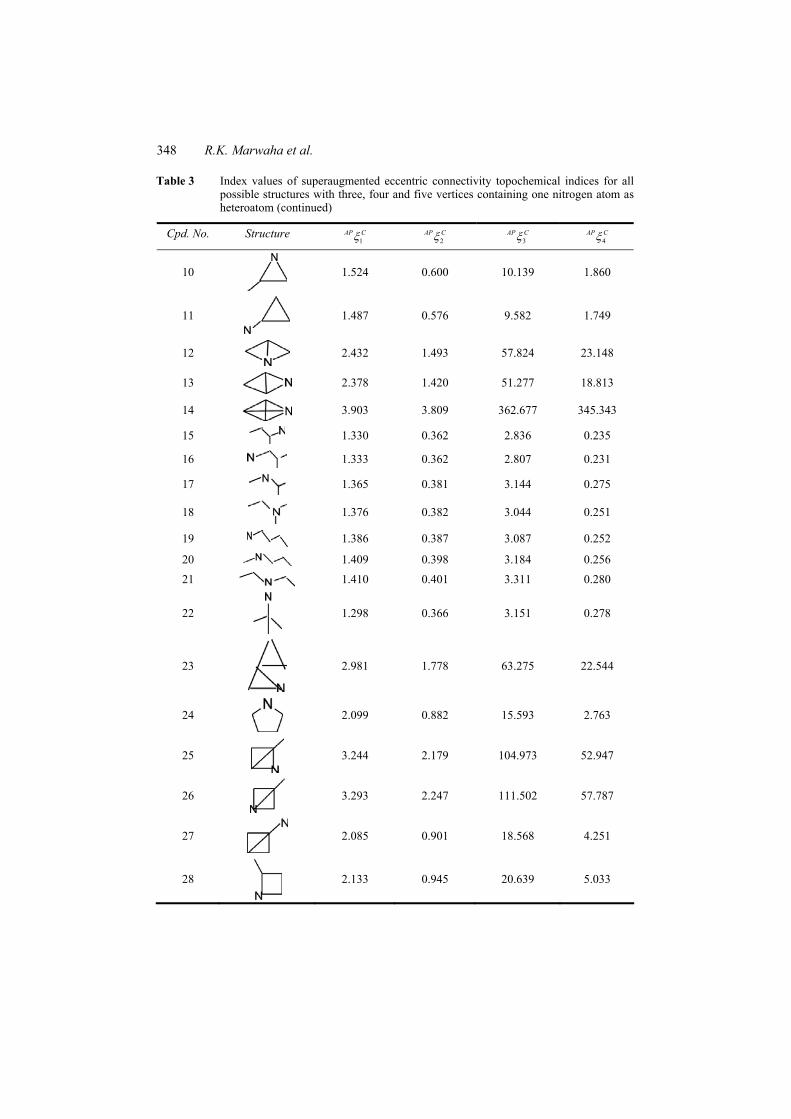
Table 3 Index values of superaugmented eccentric connectivity topochemical indices for all possible structures with three, four and five vertices containing one nitrogen atom as heteroatom
Cpd. No. Structure 1
AP C 2AP C 3
AP C 4AP C
1 0.532 0.100 0.394 0.016
2 0.533 0.101 0.421 0.018
3
0.919 0.281 2.642 0.248
4 0.923 0.215 1.203 0.069
5 0.946 0.225 1.314 0.079
6
0.883 0.212 1.355 0.090
7
0.891 0.210 1.292 0.083
8
1.472 0.542 7.397 1.013
9
1.546 0.615 10.567 1.959
348 R.K. Marwaha et al.
Table 3 Index values of superaugmented eccentric connectivity topochemical indices for all possible structures with three, four and five vertices containing one nitrogen atom as heteroatom (continued)
Cpd. No. Structure 1
AP C 2AP C 3
AP C 4AP C
10
1.524 0.600 10.139 1.860
11
1.487 0.576 9.582 1.749
12
2.432 1.493 57.824 23.148
13
2.378 1.420 51.277 18.813
14
3.903 3.809 362.677 345.343
15 1.330 0.362 2.836 0.235
16 1.333 0.362 2.807 0.231
17
1.365 0.381 3.144 0.275
18
1.376 0.382 3.044 0.251
19 1.386 0.387 3.087 0.252
20 1.409 0.398 3.184 0.256
21 1.410 0.401 3.311 0.280
22
1.298 0.366 3.151 0.278
23
2.981 1.778 63.275 22.544
24
2.099 0.882 15.593 2.763
25
3.244 2.179 104.973 52.947
26
3.293 2.247 111.502 57.787
27
2.085 0.901 18.568 4.251
28
2.133 0.945 20.639 5.033
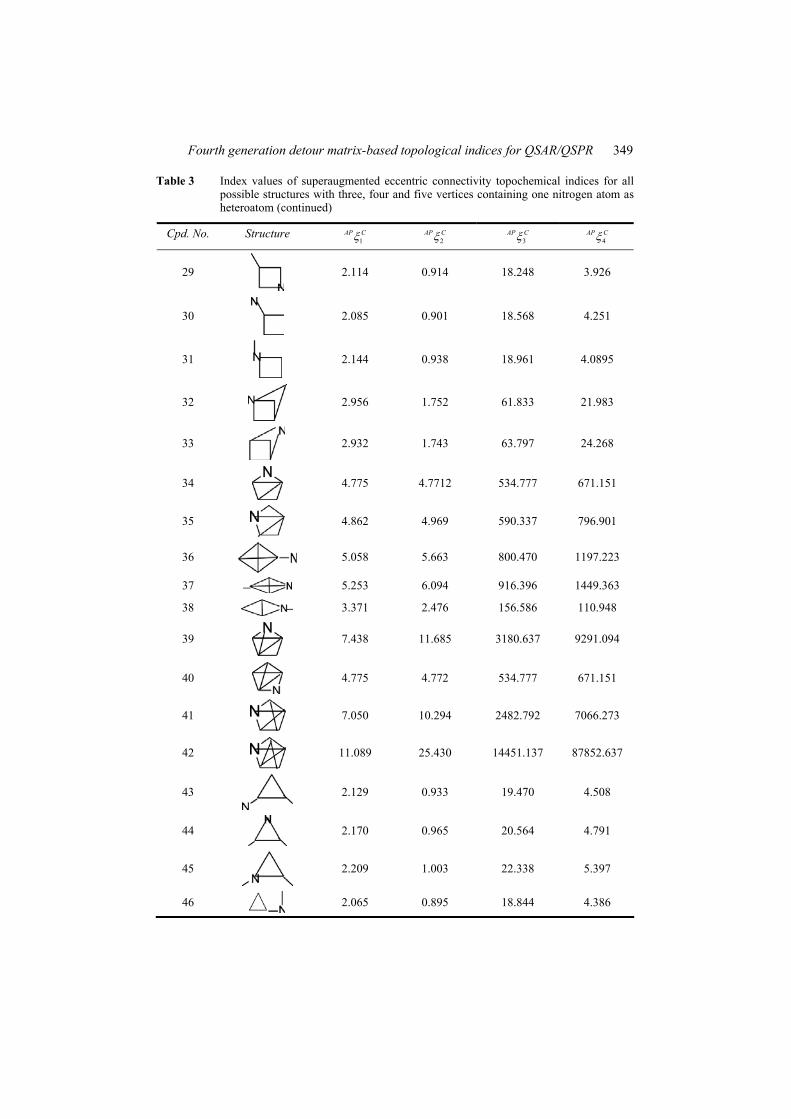
Fourth generation detour matrix-based topological indices for QSAR/QSPR 349
Table 3 Index values of superaugmented eccentric connectivity topochemical indices for all possible structures with three, four and five vertices containing one nitrogen atom as heteroatom (continued)
Cpd. No. Structure 1
AP C 2AP C 3
AP C 4AP C
29
2.114 0.914 18.248 3.926
30
2.085 0.901 18.568 4.251
31
2.144 0.938 18.961 4.0895
32
2.956 1.752 61.833 21.983
33
2.932 1.743 63.797 24.268
34
4.775 4.7712 534.777 671.151
35
4.862 4.969 590.337 796.901
36
5.058 5.663 800.470 1197.223
37 5.253 6.094 916.396 1449.363
38 3.371 2.476 156.586 110.948
39
7.438 11.685 3180.637 9291.094
40
4.775 4.772 534.777 671.151
41
7.050 10.294 2482.792 7066.273
42
11.089 25.430 14451.137 87852.637
43
2.129 0.933 19.470 4.508
44
2.170 0.965 20.564 4.791
45
2.209 1.003 22.338 5.397
46
2.065 0.895 18.844 4.386

350 R.K. Marwaha et al.
Table 3 Index values of superaugmented eccentric connectivity topochemical indices for all possible structures with three, four and five vertices containing one nitrogen atom as heteroatom (continued)
Cpd. No. Structure 1
AP C 2AP C 3
AP C 4AP C
47 2.027 0.864 17.581 3.923
48
2.100 0.930 20.510 4.968
49
2.076 0.909 19.708 4.721
50
3.329 2.426 152.996 108.994
51
3.267 2.354 148.233 106.597
52
3.398 2.554 175.376 137.674
53
4.604 4.407 442.528 484.187
54
4.675 4.523 453.238 479.501
55
4.672 4.523 460.900 507.783
56
2.017 0.857 17.684 4.114
57
2.067 0.892 18.651 4.3624
58
3.170 2.067 94.710 46.956
59
3.116 1.991 87.088 40.983
60
3.113 1.984 85.679 39.499
61
4.589 4.251 375.506 344.124
The sensitivity of the proposed indices towards branching as well as the relative position of substituent in cyclic structures was evaluated using three isomers of diethylcyclohexane (Figure 1). The intercorrelation of three proposed path eccentric connectivity indices with other well-known indices like Wiener’s index, the Balaban’s index (D), Randic’s molecular connectivity index, the eccentric connectivity index and Zagreb indices (M1 and M2) was investigated (Figure 3). This intercorrelation was determined with respect to index values of all possible structures containing three, four and five vertices. The degree of inter-correlation between various TIs can be easily determined as per the standard criteria (Trinajstic et al., 2001; Nikolic et al., 2003).

Fourth generation detour matrix-based topological indices for QSAR/QSPR 351
Table 4 Comparison of discriminating power and degeneracy of path eccentric connectivity topochemical indices (1–4) using all possible structures with three, four and five vertices containing one nitrogen atom as heteroatom
1
AP Cc 2
AP Cc 3
AP Cc 4
AP Cc
For three vertices
Minimum value 0.532 0.100 0.394 0.016
Maximum value 0.919 0.281 2.642 0.248
Ratio 1:1.7 1:2.8 1:6.7 1:15.5
Degeneracy 0/3 0/3 0/3 0/3
For four vertices
Minimum value 0.883 0.210 1.203 0.069
Maximum value 3.903 3.809 362.677 345.343
Ratio 1:4.4 1:18.1 1:301.5 1:5005
Degeneracy 0/11 0/11 0/11 0/11
For five vertices
Minimum value 1.298 0.362 2.807 0.231
Maximum value 11.089 25.430 14451.137 87852.637
Ratio 1:8.5 1:70. 5 1:5148.3 1:380314.4
Degeneracy 0/47 1/47 0/47 0/47
Notes: Degeneracy = Number of compounds having same values/total number of compounds with same number of vertices.
Figure 3 Plots depicting intercorrelation of augmented path eccentric connectivity index–2 with Weiner index, Balaban-D, MCI, Zagreb indices M1and M2

352 R.K. Marwaha et al.
4 Mathematical properties of augmented path eccentric connectivity index–2
Throughout, let G = (V, E) be a simple connected graph with vertex set v = {1, 2, ..., n} and edge set E. Also let n and m be, respectively, the number of vertices and edges of G. Assume that Gc is the complement graph of graph G and mc is the number of edges in Gc. Let vi be the degree of vertex i for i = l, 2, ..., n and also let μi be the average degree of the adjacent vertices of vertex i. We use i~j, when vertices i and j are adjacent. The minimum vertex degree is denoted by δ and the maximum by Δ. For two vertices i and j (i ≠ j), d(i, j), the distance between i and j is the number of edges in a maximum path joining i and j. The path eccentricity of vertex i in G is denote by Δηi and is defined as Δηi = max{d(i, j):j V(G)}. When more than one graph is under discussion, we may write μi (G) instead of μi. We will assume familiarity with basic graph-theoretic notions; see, for example, Bondy and Murthy (1976). The topostructural descriptor of graph G is denoted by 2
AP C G and is defined as
2 21
1/n
AP Ci i
i
k M
where Mi is the product of degree of all vertices j adjacent to vertex i, Δηi is path eccentricity of vertex i and n is the number of vertices in graph G. Since k2 in the aforementioned equation represents a constant factor with a value of 100, the same was not taken into consideration while studying mathematical properties.
As usual, Kn, K1,n – 1 and Kp,q(p + q = n) denote respectively the complete graph, the star and the complete bipartite graph on n vertices. We have
2
2 1, 1 1 2 1 .AP CnK n
2 1 .nAP C
nK n n
For p > q,
1 1 12 , 2AP c q p p
p qK q p q q
and for p = q
12 , 2 2 1 .AP c p
p pK p p
Now we obtain the maximum topostructural descriptor.
Theorem 1: Let G be a connected graph of order n. Then the complete graph Kn is the maximum topostructural descriptor.
Proof: We suppose that G is not isomorphic to complete graph Kn. First we assume that the maximum degree Δ = n – 1 in G. Let p be the number of vertices of degree n – 1 in G. Thus we have
1
21
2
2
1 1
1 1 ,
nnAP c
i ii
n AP cn
G M p n n
n p n n K

Fourth generation detour matrix-based topological indices for QSAR/QSPR 353
as 11
n
iM n and 1i n for all i such that vi = n – 1 and 2
1n
iM n and
1i n for all i such that vi n – 2.
Next we assume that the maximum degree Δ < n – 1 in G. Thus we have
2
2 21
1 2 ,n
nAP c AP ci i n
i
G M n n n K
as 22
n
iM n and 1i n for all i.
Hence, the complete graph Kn is the maximum topostructural descriptor. Now we give a lower bound on the topostructural descriptor of tree T.
Theorem 2: Let T be a tree of order n and maximum degree Δ. Then
2 1 2 1AP c T n
with equality if and only if G is isomorphic to a star K1,n – 1.
Proof: Let 1 be the maximum degree vertex of degree Δ in T. So we have M1 ≥ 1 and Δηi ≥ 1. Now we have Mi ≥ Δ for each vertex i adjacent to vertex 1. Since T is a tree, we have Δηi ≥ 2, for all i, i ≠ 1. Thus
2 1 12 2
1 2 1 2 1 .n n
AP ci i i
i i
T M M M n
Now suppose that the equality holds. Then all the inequalities in the above argument must be equalities. So we have
Δη1 = 1 and Δηi = 2 for all i = 2, ..., n.
Also, we have M1 = 1. From Δηi = 1, we get Δ = n – 1. Using these results, we conclude that vi = 1 for all i, i = 2,..., n. Hence, G is isomorphic to a star K1,n – 1.
Conversely, one can see easily that the equality holds for star K1,n – 1. Now we give an upper bound to the topostructural descriptor for bipartite graph.
Theorem 3: Let G = (V, E) be a connected bipartite graph with bipartition V = U∩W such that U∩W= Φ, |U| = p and |W| = q, p ≥ q. Then the complete bipartite graph Kp,q is the maximum topostructural descriptor.
Proof: We assume that G is not isomorphic to complete bipartite graph Kp,q. Since G is bipartite, every edge connects a vertex in U to one in W, where U {1, 2, ..., p} and W {p1, p2, ...,pq}. We have Mi ≤ pq for i = 1,2, ..., p; Mi ≤ qp for i = p+1, p+2, ..., p+q. Moreover, there exists at least one i(1 ≤ i ≤ p) such that Mi ≤ pq as G is not isomorphic to complete bipartite graph Kp,q. If p > q, then we have Δηi ≤ 2q for all i, i = 1, 2, ..., p and Δηi ≤ 2q – 1 for all i, i = p+1, p+2, ...,p+q.
21 1
1
1 1 12 ,
2 2 1
2 .
pnAP c
i i i ii i
p qq p
i ii p
q p p AP cp q
G M M
M p p q q q q
q p q q K

354 R.K. Marwaha et al.
Otherwise, p = q. In this case, we have Δηi < 2p – 1 for all i, i = 1, 2, …, n. Thus, we have
2
21 1
1
2 ,
2 1 2 1 2 2 1
.
p pAP c
i i i ii i p
p p p
AP cp p
G M M
p p p p p p p p
K
Hence, the complete bipartite graph Kp,q is the maximum topostructural descriptor. Suppose μi is the average degree of the adjacent vertices of vertex i. Since μi ≤ Δ and
vi ≤ Δ, then we have
:
:
,
i
i i
i
v
jj j N v
i j ij j N i
v
M vv
by arithmetic-geometric mean inequality.
Equality holds in above if and only if vi = Δ for all i, 1 ≤ i ≤ n. Now we give a lower bound and an upper bound to the topostructural descriptor of graph G.
Theorem 4: Let G be a connected graph of order n > 2 with maximum degree Δ and minimum degree δ. Then
22 1AP cn G n n
Moreover, the equality holds on the left hand side if and only if G is isomorphic to the regular graph, with eccentricity of each vertex 2; the equality holds on the right hand side if and only if G is isomorphic to the regular graph with eccentricity of each vertex n – 1.
Proof: If G is a star K1,n – 1, then
2
2 1, 1 1 2 1 2AP cnK n n
as n > 2. For star K1,n – 1 (δ = 1), the inequality on the left hand side holds. Otherwise, the eccentricity of each vertex in G is greater than or equal to 2. For each vertex i, Mi ≥ δδ. Thus, we have
21 1
2 2 .n n
AP ci i i
i i
G M M n
Equality holds if and only if Δηi = 2, 1 ≤ i ≤ n and Mi = δδ, 1 ≤ i ≤ n; that is, if and only if G is isomorphic to the regular graph, with eccentricity of each vertex 2 as G is connected.
Second Part: We have Δηi ≤ n – 1 for all i, 1 ≤ i ≤ n. Also, we have Mi ≤ ΔΔ for all i, 1 ≤ i ≤ n.
21 1
1 1 .n n
AP ci i i
i i
G M n M n n

Fourth generation detour matrix-based topological indices for QSAR/QSPR 355
Equality holds if and only if Δηi = n – 1, 1 ≤ i ≤ n and Mi = ΔΔ, 1 ≤ i ≤ n; that is, if and only if G is isomorphic to the regular graph with eccentricity of each vertex n – 1. Hence the theorem.
For a graph G, the chromatic number χ (G) is the minimum number of colours needed to colour the vertices of G in such a way that no two adjacent vertices are assigned the same colour. The bounds involving the chromatic number χ (G) of a graph G and its complement Gc (Nordhaus and Gaddum, 1956) are
2 1.cn G G n
Motivated by the above results, we now obtain analogous conclusions for the topostructural descriptors.
Theorem 5: Let G be a connected graph on n ≥ 5 vertices with a connected complement Gc.
Then 1 1
2 22 1 1 1 ,n nAP c AP c cn n G G n n n
where Δ and δ are the maximum degree and minimum degree in G. Moreover, the equality holds on the left hand side if and only if G is isomorphic to the regular graph, with eccentricity of each vertex 2 in G and Gc and the equality holds on the right hand side if and only if G is isomorphic to the regular graph, with eccentricity of each vertex n – 1 in G and Gc.
Proof: Since G and Gc are connected graphs, we have Δ < n – 1 and Δc < n – 1. Also we have Δηi (G) ≥ 2 for all i and Δηi (G
c) ≥ 2 for all i. Thus,
2 2
1 1 1
1
2
2 1 ,
n n nAP c AP c c c c c
i i i i i ii i i
n
G G M M M M
n n
by Theorem 4. Moreover, the equality holds on the left hand side if and only if G is isomorphic to the regular graph, with eccentricity of each vertex 2 in G and Gc, by Theorem 4. Now,
1
2 21 1
1 1 ,n n
nAP c AP c c c ci i i i
i i
G G M M n n n
by Theorem 4. Moreover, the equality holds on the right hand side if and only if G is isomorphic to the regular graph, with eccentricity of each vertex n – 1 in G and Gc, by Theorem 4. Hence the theorem.
5 Results and discussion
Large numbers of TIs have been reported in the literature during recent past. These are being used for chemical documentation, isomer discrimination, studies of chemical complexity, chirality, similarity/dissimilarity, QSAR, QSPR, QSTR, QSPkR, drug design and database selection, lead optimisation, rational combinatorial library design and for deriving multilinear regression models (Estrada and Uriarte, 2001, Estrada et al., 2003). Though a large number of Tls of diverse nature have been reported in the literature, only

356 R.K. Marwaha et al.
a small fraction of these have been successfully utilised in QSAR/QSPR/QSTR. As a consequence, there is a strong need to develop novel TIs with high discriminating power and negligible degeneracy (Dureja and Madan, 2007).
A vast majority of distance-based TIs take recourse to the distance matrix to define the topological molecular parameters. Each entry in the distance matrix is defined according to the minimum distance between various vertices; however, resorting to the maximum distance between various vertices can be an interesting and potentially useful alternative (Castro et al., 2000). The detour matrix is based upon the principle of maximum distance between various vertices and can accordingly provide a requisite platform for the development of improved TIs. The path eccentricity Δηi of vertex vi, in a graph G is the length of the longest path having maximum number of edges separating vi and vertex vj that is farthest from vi. Therefore, the highest value in a row of the detour matrix will simply represent path eccentricity of the concerned vertex. Accordingly, four adjacency cum detour distance-based indices as well as their topochemical counterparts have been conceptualised in the present study. Topostructural versions of these indices can easily be calculated from a detour matrix (Δ) and an augmentative adjacency matrix (Aα). To facilitate the computation of topochemical indices, a modified detour matrix termed as chemical detour matrix (Δc) has also been proposed.
The simultaneous consideration of both path eccentricity and Mi (product of degrees of all the adjacent vertices) will naturally augment the sensitivity of the proposed TIs. As observed in Figure 1, a simple change in the position of the ethyl group from ortho to either meta or para will lead to a steep change in the index value of the proposed TIs. In case of 4
AP c the index value changes by more than three times from 140.05 to 44.15, as
the ethyl substituent is simply shifted from the ortho to the para position. This major change in the index value without the changing number of vertices simply reveals extremely the high sensitivity of the proposed indices.
Discriminating power is one of the basic and important characteristics of a TI (Konstantinova and Vidyuk, 2003). It is the ratio of the highest to the lowest value for all possible structures with the same number of vertices (Dureja and Madan, 2007). As observed in Table 2, the ratio of the highest to lowest value for all possible structures containing five vertices for 1
AP C is 13, for 2AP C is 155, for 3
AP C is 20,971 and for
4AP C is 2,202,547, which is exceptionally high. The exceptionally high discriminating
power of the proposed indices renders them extremely sensitive towards minor changes in molecular structures. This extreme sensitivity towards branching as well as the relative position of substituents in the cyclic structure and the high discriminating power of the proposed indices are clearly evident from the respective values of all possible structures with five vertices. Further, it may be concluded that if it is desirable to encode chemical information of a particular heteroatom involved in a molecular structure, one can easily resort to the topochemical version of these indices, denoted by 1 2 3, ,AP C AP C AP C
c c c and
4AP C
c respectively. The discriminating power of the topochemical versions of the
proposed TIs is also almost similar. Degeneracy is a measure of the ability of an index to differentiate between the
relative positions of atom in a molecule. 1AP C , 3
AP C and 4AP C did not exhibit any
degeneracy for all possible structures with three, four and five vertices, whereas 2AP C
had a very low degeneracy of 1 in the case of all possible structures with five vertices

Fourth generation detour matrix-based topological indices for QSAR/QSPR 357
(Table 2). Degeneracy further decreases with the use of topochemical versions of the proposed TIs (Table 4). Extremely low degeneracy indicates the enhanced capability of these indices to differentiate and demonstrate slight variations in the molecular structure, which clearly reveals the remote chance of different structures having the same index value.
Intercorrelation analysis of the proposed topological indices with other well-known and widely used topological indices revealed that these are not correlated with Wiener’s index, the molecular connectivity index, the eccentric connectivity index and Balaban’s D index (Table 5). However, these proposed indices are weakly correlated with Zagreb indices M1 and M2 as per the criteria specified by Trinajstic et al. (2001) and Nikolic et al. (2003).
Table 5 Intercorrelation matrix
D W X ξC M1 M2 1AP C 2
AP C 3AP C 4
AP C
D 1.0 0.617 0.018 0.079 –0.659 –0.634 –0.627 –0.544 –0.432 –0.402
W 1.0 0.725 0.673 0.038 0.046 –0.046 –0.116 –0.118 –0.115
X 1.0 0.930 0.614 0.630 0.497 0.325 0.220 0.198
ξC 1.0 0.531 0.552 0.401 0.202 0.075 0.049
M1 1.0 0.990 0.949 0.811 0.656 0.613
M2 1.0 0.964 0.845 0.706 0.667
1AP C 1.0 0.949 0.841 0.804
2AP C 1.0 0.963 0.940
3AP C 1.0 0.997
4AP C 1.0
High index values can many times cause inconvenience and lead to problems, particularly when dealing with complex chemical structures. Many researchers in the past have resorted to either logarithmic or square root approaches so as to reduce index values to reasonable limits. However, these approaches also result in steep reduction in discriminating power. A unique approach was adopted during the development of TIs so as to ensure reduction of the index values of complex chemical structures to be within reasonable limits without compromising discriminating power. This is simply achieved by dividing all the index values by a constant factor (Kn). Since both the maximum and minimum index values (of structures containing same number of vertices) are divided by a constant factor, their ratio or discriminating power remains unaffected.
Mathematical properties of one of the four proposed TIs ( 2AP C ) have also been
studied. In this paper, we defined the topostructural descriptor of graphs and we determined the extremal topostructural descriptor of graphs in terms of n (order of the graph), Δ (maximum degree) and δ (minimum degree). Moreover, we obtained Nordhaus and Gaddum type results for topostructural descriptor of the graph. The bounds of a descriptor are important information of a molecule (graph), in the sense that they establish the approximate range of the descriptor in terms of molecular structural parameters.

358 R.K. Marwaha et al.
6 Conclusion
Studies reveal that the proposed path eccentricity-based TIs have exceptionally high discriminating power amalgamated with negligible degeneracy. Moreover, the Nordhaus and Gaddum type results for the topostructural descriptor of the graph are obtained. The simplicity, exceptionally high discriminating power, ease of calculation, extreme sensitivity towards branching as well as relative position of substituents coupled with negligible degeneracy endow the proposed topological indices with vast potential for use in the characterisation of structures, similarity/dissimilarity studies, lead identification, lead optimisation, combinatorial library design and quantitative structure-activity/property/ toxicity/pharmacokinetic relationship studies for the prediction of various physico-chemical, biological, toxicological and pharmacokinetic properties, such as will facilitate drug design.
References
Bajaj, S., Sambi, S.S. and Madan A.K. (2004) ‘Prediction of carbonic anhydrase activation by tri/tetrasubstituted-pyridinium-azole compounds: a computational approach using novel topochemical descriptor’, QSAR Comb. Sci., Vol. 23, pp.01–09.
Balaban, A.T., Beteringhe, A., Constantinescu, T., Filip, P.A. and Ivanciuc, O. (2007) ‘Four new topological indices based on the molecular path code’, J. Chem. Inf. Model., Vol. 47, No. 3, pp.716–731.
Balaban, A.T. (1979) ‘Chemical graphs XXXIV. Five new topological indices for the branching of tree like graphs [1]’, Theoret. Chim. Acta., Vol. 53, pp.355–375.
Balaban, A.T. (1992) ‘Using real numbers as vertex invariants for third-generation topological indexes’, J. Chem. Inf. Comput. Sci., Vol. 32, No. 1, pp.23–28.
Basak, S.C. and Gute, B.D. (1997) ‘Characterization of molecular structures using topological indices’, SAR and QSAR in Environmental Research, Vol. 7, pp.1–21.
Basak, S.C. and Magnuson, V.R. (1983) ‘Molecular topology and narcosis: a quantitative structure-activity relationship (QSAR) study of alcohols using complementary information content (CIC)’, Arzneim. Forsch. Drug Res., Vol. 33, pp.501–503.
Basak, S.C., Balaban, A.T., Grunwald, G.D. and Gute, B.D. (2000) ‘Topological indices: their nature and mutual relatedness’, J.Chem. Inf. Comput. Sci., Vol. 40, No. 4, pp.891–898.
Basak, S.C., Bertelsen, S. and Grunwald, G.D. (1994) ‘Application of graph theoretical parameters in quantifying molecular similarity and structure-activity relationships’, J. Chem. Inf. Comput. Sci., Vol. 34, No. 2, pp.270–276.
Basak, S.C., Gute, B.D. and Balaban, A.T. (2004) ‘Interrelationship of major topological indices evidenced by clustering’, Croat. Chem. Acta., Vol. 77, pp.331–344.
Basak, S.C., Roy, A.B. and Ghosh, J.J. (1980) ‘Study of the structure-function relationship of pharmacological and toxicological agents using information theory’, in: Avula, X.J.R., Bellman, R., Luke, Y.L. and Rigler, A.K., (Eds.): Proceedings of the Second International Conference on Mathematical Modeling, University of Missouri-Rolla, USA, pp.851–856.
Benigni, R. and Bossa, C. (2008) ‘Predictivity of QSAR’, J. Chem. Inf. Model., Vol. 48, No. 5, pp.971–980.
Bonchev, D., Mekenyan, O. and Trinajstic, N. (1981) ‘Isomer discrimination by topological information approach’, J. Comput. Chem., Vol. 2, No. 2, pp.127–148.
Bondy, J.A. and Murty, U.S.R., (1976) Graph Theory with Applications, Macmillan, London.
Castro, E.A., Tueros, M. and Toropov, A.A. (2000) ‘Maximum topological distances based indices as molecular descriptors for QSPR 2-Application to aromatic hydrocarbons’, Computers and Chemistry, Vol. 24, pp.571–576.
Fourth generation detour matrix-based topological indices for QSAR/QSPR 359
Dureja, H. and Madan, A.K. (2007) ‘Superaugmented eccentricity connectivity indices: new generation highly discriminating topological descriptors for QSAR/QSPR modeling’, Med. Chem. Res., Vol. 16 pp.331–341.
Dureja, H., Gupta, S. and Madan, A.K. (2008) ‘Predicting anti-HIV-1 activity of 6-arylbenzonitriles: Computational approach using superaugmented eccentric connectivity topochemical indices’, J. Mol. Graph. Model., Vol. 26, pp.1020–1029.
Estrada, E. and Molina, E. (2001) ‘Novel local (fragment-based) topological molecular descriptors for QSPR/QSAR and molecular design’, J. Mol. Graph. Model, Vol. 20, pp.54–64.
Estrada, E. and Uriarte, E. (2001) ‘Recent advances on the role of topological indices in drug discovery research’, Curr. Med. Chem., Vol. 8, pp.1573–1588.
Estrada, E., Patlewicz, G. and Uriarte, E. (2003) ‘From molecular graphs to drugs. A review on the use of topological indices in drug design and discovery’, Indian J. Chem., Vol. 42A, pp.1330–1346.
Ferydoun, A., Ali, R.A. and Najmeh, M. (2008) ‘Study on QSPR method for theoretical calculation of heat of formation for some organic compounds’, Afr. J. Pure Appl. Chem., Vol. 2, No. 1, pp.006–009.
García-Domenech, R., Gálvez, J. de Julian-Ortiz, J.V. and Pogliani, L. (2008) ‘Some new trends in chemical graph theory’, Chem. Rev., Vol. 108, pp.1127–1169.
Goel A. and Madan A.K. (1995) ‘Structure-Activity study on anti-infl ammatory pyrazole carboxylic acid hydrazide analogs using molecular connectivity indices’, J. Chem. Inf. Comput. Sci., Vol. 35, pp.510–514.
Gutman, I. and Trinajstic, N. (1972) ‘Graph theory and molecular orbitals. Total φ-electron energy of alternant hydrocarbons’, Chem. Phys. Lett., Vol. 17, No. 4, pp.535–538.
Ivanciuc, O. and Balaban, A.T (1999) ‘The graph description of chemical structures’, in: Devillers, J. Balaban, A.T. (Eds.): Topological Indices and Related Descriptors in QSAR and QSPR, Gordon and Breach Science Publishers, The Netherlands, pp.59–167.
Ivanciuc, O., Laidboeur, T. and Carol-Bass, D. (1997) ‘Degeneracy of topologic distance descriptors for cubic molecular graphs: example of small fullerenes’, J. Chem. Inf. Comput. Sci., Vol. 37, No. 3, pp.485–488.
Katritzky, A.R., Maran, U., Lobanov, V.S. and Karelson, M. (2000) ‘Structurally diverse quantitative structure – property relationship correlations of technologically relevant physical properties’, J. Chem. Inf. Comput. Sci., Vol. 40, No. 1, pp.1–18.
Katritzky, A.R., Petrukhin, R. and Tatham, D. (2001). ‘Interpretation of quantitative structure – property and-activity relationships’, J. Chem. Inf. Comput. Sci., Vol. 41, No. 3, pp.679–685.
Konstantinova, E.V. and Vidyuk, M.V. (2003) ‘Discriminating test of information and topological indices: Animals and Trees’, J. Chem. inf. Comput. Sci., Vol. 43, pp.1860–1871.
Kumar, V., Sardana, S. and Madan A.K. (2004) ‘Predicting anti-HIV activity of 2,3-diaryl-1,3-thiazolidin-4-ones: computational approach using reformed eccentric connectivity index’, J. Mol. Model, Vol. 10, pp.399–407.
Murcia-Soler, M., Pérez-Giménez, F., García-March, F.J., Salabert-Salvader, M.T., Díaz-Villanueva, W. and Medina-Casamayor, P. (2003) ‘Discrimination and selection of new potential antibacterial compounds using simple topological descriptors’, J. Mol. Graph. Model., Vol. 21, pp.375–390.
Nikolić, S., Kovaćević, G., Miličević, A. and Trinajstić, N. (2003) ‘The zagreb indices 30 years after’, Croat. Chem. Acta., Vol. 76, No. 2, pp.113–124
Nordhaus, E.A. and Gaddum, J.W. (1956) ‘On complementary graphs’, Amer. Math. Monthly, Vol. 63, No. 3, pp.175–177.
Platt, J.R. (1947) ‘Infl uence of neighbor bonds on additive bond properties in paraffins’, J. Chem. Phys., Vol. 15, pp.419–20.
Pogliani, L. (2000) ‘From molecular connectivity indices to semiemperical connectivity terms: recent trends in graph theoretical descriptors’, Chem. Rev., Vol. 100, No. 10, pp.3827–3858.

360 R.K. Marwaha et al.
Roy, K. and Das, R.N. (2011) ‘On Extended Topochemical Atom (ETA) Indices for QSPR Studies’, in: Castro, E.A. Hagi, A.K (Eds.): Advanced Methods and Applications in Chemoinformatics: Research Progress and New Applications, IGI Global, PA, pp.380–411.
Roy, K. and Ghosh, G. (2004) ‘QSTR with extended topochemical atom indices. 3. toxicity of nitrobenzenes to tetrahymena pyriformis’, QSAR Comb. Sci., Vol. 23, pp.99–108.
Roy, K. and Ghosh, G., (2010) ‘Exploring QSARs with Extended Topochemical Atom (ETA) indices for modeling chemical and drug toxicity’, Current Pharmaceutical Design, Vol. 16, No. 24, pp.2625–2639.
Roy, K. and Ghosh, G. (2003) ‘Introduction of extended topological atom (ETA) indices in the valence electron mobile (VEM) environment as tools for QSAR/QSPR studies’, Internet Electron . J. Mol. Des., Vol. 2, No. 9, pp.599–620.
Sahu, P.K. and Lee, S.L. (2008) ‘Net-sign identity information index: a novel approach towards numerical characterization of chemical signed graph theory’, Chem. Phys. Lett., Vol. 454, pp.133–138.
Sharma, V. Goswami, R. and Madan, A.K. (1997) ‘Eccentric connectivity index: A novel highly discriminating topological descriptor for structure property and structure activity studies’, J. Chem. Inf. Comp. Sci., Vol. 37, No. 2, pp.273–282.
Stanton, D.T. (2008) ‘On the importance of topological descriptors in understanding structure-property relationships’, J. Comput Aided Mol. Des., Vol. 22, pp.441–460.
Todeschini, R. (2000) ‘Molecular descriptors and chemometrics: a powerful combined tool for pharmaceutical, toxicological and environment problems’, Molecular descriptors – the free online resource. http://www.moleculardescriptors.eu
Todeschini, R. and Consonni, V. (2000) Handbook of Molecular Descriptors: Methods and Principal in Medicinal Chemistry, Vol. 11, Wiley VCH Weuinheim.
Trinajstic, N., Nikolic, S., Basak, S.C. and Lukovits, I. (2001) ‘Distance indices and their hypercounterparts: intercorrelation and use in the structure-property modeling’, SAR and QSAR Environ. Res., Vol. 12, pp.31–54.
Wiener, H. (1947) ‘Structural determination of paraffin boiling points’, J. Am. Chem. Soc., Vol. 69, No. 1, pp.17–20.
Winkler, D.A. (2002) ‘The role of quantitative structure-activity relationships (QSAR) in biomolecular discovery’, Brief Bioinform., Vol. 3, No. 1, pp.73–86.
Int. J. Computational Biology and Drug Design, Vol. 7, No. 1, 2014 1
Copyright © 2014 Inderscience Enterprises Ltd.
Fourth generation detour matrix-based topological descriptors for QSAR/QSPR – Part-2: application in development of models for prediction of biological activity
Rakesh Kumar Marwaha Faculty of Pharmaceutical Sciences, M.D. University, Rohtak 124-001, India Email: [email protected] Email: [email protected]
A.K. Madan* Faculty of Pharmaceutical Sciences, Pt. B.D. Sharma University of Health Sciences, Rohtak 124-001, India Email: [email protected] *Corresponding author
Abstract: Augmented path eccentric connectivity topochemical indices (reported in part-1 of the manuscript) along with 42 diverse non-correlating molecular descriptors (shortlisted from a large pool of 2D and 3D MDs) were successfully utilised for the development of models through decision tree, random forest and moving average analysis for the prediction of antitubercular activity of aza and diazabiphenyl analogues of active compound (6S)-2- Nitro-{[4-(trifluoromethoxy)benzyl]oxy}-6,7-dihydro-5H-imidazo[2,1-b][1,3] oxazine (PA-824). The statistical significance of the proposed models was assessed through overall accuracy of prediction, intercorrelation analysis, sensitivity, specificity and Matthew’s correlation coefficient (MCC). The accuracy of prediction of the proposed models varied from a minimum of 81% to a maximum of ~99%. High accuracy of prediction amalgamated with high MCC values clearly indicates robustness of the proposed models. The said models offer a vast potential for providing lead structures for the development of potent antitubercular drugs.
Keywords: antitubercular activity; PA-824 analogues; augmented path eccentric connectivity topochemical indices (1-4); total size index/weighted by atomic masses; Gutman MTI by valence vertex degrees; second component size directional WHIM index/weighted by atomic van der Waals volume.
Reference to this paper should be made as follows: Marwaha, R.K. and Madan, A.K. (2014) ‘Fourth generation detour matrix-based topological descriptors for QSAR/QSPR – Part-2: application in development of models for prediction of biological activity’, Int. J. Computational Biology and Drug Design, Vol. 7, No. 1, pp.1–30.

2 R.K. Marwaha and A.K. Madan
Biographical notes: Rakesh Kumar Marwaha is an Assistant Professor in Pharmaceutical Chemistry at Department of Pharmaceutical Sciences, M.D. University, Rohtak, INDIA. He obtained his Master’s degree from Department of Pharmaceutical Sciences and Drug Research, Punjabi University Patiala. He is currently perusing his PhD from M.D. University, Rohtak under the guidance of Prof. A.K. Madan. He has more than 11 years of professional experience. He has keen interest in computational chemistry and in-silico drug discovery.
A.K. Madan possesses Bachelor’s degrees in both Pharmacy and Chemical Engineering, Master’s degree in Pharmaceutics and PhD in Chemical Engineering from Indian Institute of Technology, Delhi. He has eight monographs, 12 patents and >115 research publications. His diverse research areas include chemical computation, (Q)SAR, pharmaceutical process development, pharmaceutical technology, biotechnology and inclusion phenomena. He has developed and published ~50 molecular descriptors for drug design. Some of these molecular descriptors have already been incorporated in various software such as Schrodinger, Dragon, ADAPT, Sarchitect TM, Pre-ADMET, MOLGEN-QSPR, ADME Model Builder and MoDeL. He has 40 years of experience in teaching and research. He is currently working as Professor in Pt. BD Sharma University of Health Sciences, Rohtak, India.
1 Introduction
Tuberculosis (TB) is a contagious airborne disease caused by Mycobacterium tuberculosis, a highly pathogenic bacteria with an extremely slow growth rate, an unusual outer membrane of very low permeability and a cunning ability to survive inside the human host despite a potent immune response (Rowland and Niederweise, 2012). The World Health Organization (WHO) estimates that about eight to ten million new TB cases occur annually worldwide and the incidence of TB continues to rise. TB has reemerged as a serious health threat, complicated by the spread of multidrug-resistant (MDR) strains and synergy with the HIV pandemic, compelling the WHO to declare it a global emergency in 1993 (Kmentova et al., 2010; Haydel, 2010; Zhang, 2005). Unfortunately, no new anti-TB drugs except rifabutin and rifapentine have been introduced in the US market and other countries during a span of 40 years after release of rifampicin (Tomioka and Namba, 2006). The current recommended standard chemotherapy for TB, called DOTS (Directly Observed Treatment, Short-course), is a six month therapy consisting of an initial two-months intensive phase of treatment with four drugs, INH, RIF, PZA, and EMB, followed by a continuation phase of treatment with INH and RIF for additional four months. However, DOTS alone may not work in areas where there is high incidence of MDR-TB and its cure rate is as low as 50% (WHO, 2009). In order to overcome such situations, WHO has recommended the use of DOTS-Plus, which is DOTS plus second-line TB drugs for the treatment of MDR-TB up to 24 months which is not only costly but has a significant toxicity also (Zhang, 2005).
Aforementioned situations highlight the priority of the discovering the new molecular scaffolds as well as re-engineering and repositioning of some existing drug families for efficacious clinical control of tuberculosis (Koul et al., 2011). There are currently at least ten drugs in various phases of clinical trials. These drugs belong to chemical classes either already employed in first or second-line treatment regimens and are being explored

Fourth generation detour matrix-based topological descriptors 3
for more optimised use at higher doses and new combinations (rifamycins, fluoroquinolones and oxazolidinones) or represent potential novel members acting through previously untried mechanisms of action (nitroimidazoles, diarylquinolines, ethylene diamines and pyrroles) (Ginsberg, 2010). However, there are numerous constraints which have deterred pharmaceutical companies from investing in new anti- TB drugs. The research is expensive, slow and difficult, and necessitates specialised facilities for handling Mycobacterium tuberculosis. Moreover there are few animal models that closely mimic the human TB disease, therefore, the development time of any new anti-TB drug will be much longer (Tomioka and Namba, 2006).
In-silico techniques have already proven their usefulness in pharmaceutical research for the selection/identification and/or design/optimisation of new chemical entities during early stages of drug discovery process, particularly in terms of time and cost-savings. Use of computational techniques in drug discovery and development process is rapidly gaining momentum in terms of popularity, implementation and appreciation (Kapetanovic, 2008) and has become an indispensable tool in the pursuit of innovative and new pharmaceutical drugs (Nadine et al., 2008). The prediction of physiochemical and biological properties of substances through the application of (quantitative) structure activity/property relationship [(Q)SAR/QSPR] has acquired an utmost significance during past few decades (Duchowicz et al., 2008). FDA has also highlighted the importance of developing predictive models in lieu of expensive and labour-intensive experimental measurements, for safety and efficacy in drug development (FDA, 2004). (Q)SAR acts as a vital informative tool by extracting significant patterns in MDs related to the measured biological activity. This leads to better understanding of mechanisms of given biological activity for further design of lead structures with improved therapeutic activity profile. In drug discovery process and environmental toxicology, (Q)SAR models are now being regarded as a scientifically validated tools for predicting and classifying the biological activities of untested molecules (Roy and Mitra, 2011). Several (Q)SAR models of diverse nature have been reported in literature for different chemical classes of antitubercular compounds involving use of various 2D and 3D MDs. Diverse correlation and classification techniques have been used to development of these models (Kovalishyn et al., 2011; Thengyai et al., 2011; Ray and Roy, 2012; Khunt et al., 2012).
In the present study, all the four augmented path eccentric connectivity topochemical indices (denoted by 1
AP Cc , 2
AP Cc , 3
AP Cc and 4
AP Cc ) reported in part-1 of the
manuscript were successfully utilised through random forest, decision tree and moving average analysis to develop suitable models for the prediction of antitubercular activity of analogues of PA- 824.These models were compared with the models developed using other 2D and 3D MDs of diverse nature computed by using Dragon software (version 1.0) (Tetko, 2005).
2 Methodology
2.1 Data set
A data set comprising of 121 aza and diazabiphenyl analogues of (6S)-2-Nitro-{[4- (trifluoromethoxy)benzyl]oxy}-6,7-dihydro-5H-imidazo[2,1-b][1,3]oxazine (PA-824) was selected for present study (Kmentova et al., 2010). The basic structures of PA-824 and its analogues have been illustrated in Figure 1 and the various substituents are enlisted in Table 4 (training set) and Table 5 (test set). Antitubercular activity has been

4 R.K. Marwaha and A.K. Madan
expressed quantitatively as the minimum inhibitory concentration [MIC(M)] defined as lowest compound concentration affecting > 90% growth inhibition determined under aerobic (MABA) (Falzari et al., 2005) and anaerobic (LORA) (Cho et al., 2007) conditions. Analogues having MIC value of ≤ 0.1 μM under aerobic conditions were considered to be active, [labelled as either as “A” or “+” (N=40)] and analogues having MIC value of >0.1 M under aerobic conditions were considered to be inactive [labelled as “B” or “-” (N=81)] for the purpose of present study. Average MIC (M) and ClogP values in various ranges of proposed models were also calculated.
Figure 1 Basic structures of PA-824 analogues
O
N
N
O2N
O R
O
N
NO2N
O
NR
Basic structure –I (For compd. No. 1-3) Basic structure –II ( Compd. No. 4-8)
O
N
NO2N
O
NR
O
N
NO2N
O
N
R
Basic structure –III (Compd. No. 9-17) Basic structure –IV (Compound No. 18 – 37)
O
N
NO2N
ON
R2
3
4
5
6
2'
3'4'
5'
6'
O
N
NO2N
O
2
3
4
5
62'
3'
4'
5'
6'
N R
Basic structure –V (Compound No. 38 - 65) Basic structure –VI (Compound No. 66 - 98)
O
N
NO2N
O
NN
1
1'
2
2'
3
3'
4
4'
5
5'
6
6'
O
N
NO2N
O N
N
2
3
4
5
62'
3'
4'
5'
6'
R
Basic structure –VII (Compound No. 99 – 106) Basic structure –VIII Compound No. 107 – 111)
O
N
NO2N
ON
N
2
3
4
5
62'
3'
4'
5'6'
R
O
N
NO2N
O N
N
2
3
4
5
6
3'
4'
6'
R
Basic structure –IX (Compound No. 112 – 116) Basic structure –X (Compound No. 117 – 121)

Fourth generation detour matrix-based topological descriptors 5
2.2 Molecular descriptors
Topochemical versions of all the four augmented path eccentric connectivity indices (denoted by 1 2, ,AP C AP C
c c 3AP C
c and 4 )AP Cc along with 700 other 2D and 3D
molecular descriptors of diverse nature were used to capture the structural characteristics of the compounds from all aspects. These indices were calculated using and E-Dragon software (version 1.0) (Tetko et al., 2005) and an in-house computer program. The structures of all the compounds of the dataset were initially drawn in freely available software SYBYL 7 as per standard procedure and the 3D-structures were energy minimised using Powell method with termination gradient set at 0.05 Kcal/(mol*A) and a maximum of 1000 iterations employing Tripos Force Field. These Energy minimised 3D-structures of the molecules were saved as .mol2 files to enable them to be portable to in-house computer programme for generating the augmented path eccentric connectivity indices and DRAGON software for generating other MDs of diverse nature such as topological descriptors, constitutional descriptors, GETAWAY descriptors, Randic molecular profiles, topological charge indices, geometrical, WHIM and RDF descriptors etc. Most of these descriptors have been reviewed in various textbooks (Todeschini and Consonni, 2000; Todeschini and Consonni, 2009; Devillers and Balaban, 1999; King, 1983; Diudea et al., 2006; Madan and Dureja, 2010). All degenerative MDs were discarded. For the remaining MDs, a pairwise correlation analysis for all classes of MDs was undertaken. One descriptor in any pair of MDs whose pair wise correlation exceeded 0.9 was eliminated. This exclusion method was used to minimise, in a first step, the colinearity and correlation between various MDs. Finally, a set of 46 MDs (Table 1) from a large pool of MDs was shortlisted for further analysis with DT, RF and MAA.
Table 1 List of molecular descriptors*
Code Name of descriptor
A1 Augmented path eccentric connectivity topochemical index-1 1( )AP Cc
A2 Augmented path eccentric connectivity topochemical index-2 2( )AP Cc
A3 Schultz MTI by valence vertex degrees (SMTIV)
A4 Gutman MTI by valence vertex degrees (GMTIV)
A5 Wiener-type index from van der Waals weighted distance matrix (Whetv)
A6 Wiener-type index from polarisability weighted distance matrix (Whetp)
A7 Molecular electropological variation(DELS)
A8 E-state Topological parameter (TIE)
A9 Total information content index (neighbourhood symmetry of 2-order) (TIC2)
A10 Complementary information content(neighbourhood symmetry of 1-order)(CIC1)
A11 Information content index (neighbourhood symmetry of 2-order)(IC2)
A12 Eigenvalue 04 from edge adj. matrix weighted by resonance integrals(EEig04r)
A13 Eigenvalue 05 from edge adj. matrix weighted by resonance integrals(EEig05r)

6 R.K. Marwaha and A.K. Madan
Table 1 List of molecular descriptors* (continued)
Code Name of descriptor
A14 Highest eigenvalue n.3 of burden matrix/weighted by atomic masses(BEHm3)
A15 Highest eigenvalue n.6 of burden matrix/weighted by atomic masses (BEHm6)
A16 Highest eigenvalue n.5 of burden matrix/weighted by atomic van der Waals volume (BEHv5)
A17 Second component size directional WHIM index/weighted by atomic masses (L2m)
A18 Ist component accessibility directional WHIM index/weighted by atomic masses(E1m)
A19 Ist component size directional WHIM index/weighted by atomic van der Waals volume (L1v)
A20 2nd component size directional WHIM index/weighted by atomic van der Waals volume(L2v)
A21 3rd component accessibility directional index/weighted by atomic Sanderson electronegativities (E3e)
A22 Ist component size directional WHIM index/weighted by atomic polarisabilities (L1p)
A23 Ist component size directional WHIM index/weighted by atomic electropological states(L1s)
A24 Ist component accessibility directional WHIM index/weighted by atomic electropological states (E1s)
A25 T total size index/unweighted (Tu)
A26 Total size index/weighted by atomic masses (Tm)
A27 Total size index/weighted by atomic polarisabilities (Tp)
A28 A total size index/unweighted (Au)
A29 A total size index/weighted by atomic van der Waals volumes (Av)
A30 A total size index/weighted by atomic Sanderson electronegativities(Ae)
A31 A total size index/weighted by atomic by atomic electropological states (As)
A32 V total size index/weighted by atomic masses (Vm)
A33 V total size index/weighted by atomic Sanderson electronegativities(Ve)
A34 Distance/detour ring index of order 6 (D/Dro6)
A35 Molecular connectivity topochemical index (MCI)
A36 Eccentric adjacency index A( )
A37 Augmented eccentric connectivity index ( )A c
A38 Super adjacency topochemical index Ac
A39 Eccentric connectivity topochemical index ( )cc
A40 Connective eccentricity index ( )C
A41 Pendentic eccentricity topochemical index ( )Pc

Fourth generation detour matrix-based topological descriptors 7
Table 1 List of molecular descriptors* (continued)
Code Name of descriptor
A42 Superaugmented Eccentric Connectivity Topochemical Indices-1 1( )SAc c
A43 Superaugmented Eccentric Connectivity Topochemical Indices-2 2( )SAc c
A44 Superaugmented Eccentric Connectivity Topochemical Indices-3, 3( )SAc c
A45 Superpendentic index ( )P A46 Wiener’s topochemical index (Wc)
Note: *These descriptors are largely defined in various books (Todeschini and Consonni, 2000; Todeschini and Consonni, 2009; Devillers and Balaban, 1999; King, 1983; Diudea et al., 2006; Madan and Dureja, 2010).
2.3 Decision tree
Decision tree is known for its ability to select important descriptors among many and ignore (often irrelevant) others. It has an established foundation in both the machine learning and artificial intelligence (Svetnik et al., 2003). By its simplest description, DT analysis is a divide-and-conquer approach to classification which can be used to discover features and extract patterns in large databases that are important for discrimination and predictive modelling (Myles et al., 2004). The development of a DT model comprises of two steps – tree construction and tree pruning. In the tree construction process, a parent population is split into two child nodes which become parent population for further splits. The splits are selected to maximally distinguish the response variable in the right and left nodes. The splitting continues until compounds in each node are either in one activity category or cannot be split further to improve the model. In order to avoid over-fitting the training data, the tree needs to be cut down to a desired size using tree cost-complexity obliteration (pruning) (Tong et al., 2003). In the second step, a set of smaller, nested trees is obtained by pruning of certain nodes of the tree obtained in the first step. The selection of the weakest branches is based on a cost-complexity measure that decides which subtree, from a set of subtrees with the same number of terminal nodes, has the lowest error. Finally, from the set of all nested subtrees, the tree with the lowest value of error in cross-validation (CV) is selected as the optimal tree (Gupta and Aires-de-Sousa, 2007). DTs are widely used in botany, taxonomy and medical diagnosis due to their easy interpretability and accuracy (Granitto et al., 2007). In present study, the data set comprising of 121 analogues of antitubercular compound PA-824 was divided into training set and independent test set using random generation function of Microsoft excel. Compounds corresponding to a value of <0.65 generated through random function were treated as training set (81 compounds) whereas those with values of ≥ 0.65 were treated as independent test set (40 compounds). A classification tree was grown with the R program version 2.1.0 using the RPART library which, by default, does cross-complexity pruning via tenfold cross-validation. This tree was further validated using independent test set. All parameters were kept at their default values (Svetnik et al., 2003; Goyal et al., 2010; http://cran.r-project.org).

8 R.K. Marwaha and A.K. Madan
2.4 Random forest
Significant improvement in classification accuracy has been achieved by growing an ensemble of trees and letting them vote for the most popular class. Random forest (RF) is an ensemble of unpruned classification trees created by bootstrap samples of the training data and random feature selection in tree induction. Therefore, all trees in a forest are different. The prediction was made by majority vote (or average) of the individual trees (Breiman, 2001; Dureja et al., 2008). Compared to a single decision tree method, the RF method generally performs better in terms of prediction accuracy because ensemble techniques attempt to compensate for the weakness of an individual tree by combining the predictions of multiple trees (Bruce et al., 2007). Besides preserving most of the appealing features of DT, RF performs a type of cross-validation in parallel with training step by using so called Out-of-Bag (OOB) samples (Svetnik et al., 2003).OOB data is used to calculate prediction accuracy (Meng et al., 2009). In the present study RF was grown for prediction of biological activity based on a quantitative description of compound’s molecular structure with the R program (version 2.1.0) using the RF library on a training set described under decision tree above. Resulting model was cross validated using an independent test set (Svetnik et al., 2003; http://cran.r-project.org; Goyal et al., 2010).
2.5 Moving average analysis
In order to construct single molecular descriptor based model for predicting activity based ranges, moving average analysis (MAA) was utilised (Gupta et al., 2001; Dureja et al., 2008). For the selection and evaluation of range specific features, exclusive activity ranges were discovered from frequency distribution of response level and subsequently identifying the active range by analysing the resultant data by maximisation of moving average with respect to active compounds (< 35% inactive, 35-65% as transitional and > 65% as active) (Gupta et al., 2001; Dureja et al., 2008). According to this method the minimum size of range is based on moving average of 65% of the correctly predicted compounds. However, if the moving average percentage of correct prediction lies between 50±15%, it is classified as transitional range (Gupta et al., 2001; Dureja et al., 2008). Index values of all the 46 chosen descriptors were carefully analysed and suitable models were developed after identification of the active ranges. Subsequently, each analogue of data set was assigned a biological activity using these models which was then compared with the reported activity (Kmentova et al., 2010). Finally, four descriptors including the two descriptors identified best by the DT were shortlisted for MAA. Classification ability and non-correlation nature of TIs were the sole criteria adopted for short listing of TIs for MAA. Entire data set comprising of 121 analogues of PA-824 was divided into two parts. All the odd numbered analogues (61 compounds) constituted the training set whereas all the even numbered analogues (60 compounds) constituted the test set
2.6 Model validation
The validation of the DT based models and self-consistency test were performed by tenfold cross validation (CV) method (Cyril, 1997).The goodness of models was evaluated by calculating sensitivity (defined as the ability of the model to avoid “false

Fourth generation detour matrix-based topological descriptors 9
negatives”), specificity (its ability to avoid “false positives’’) (Han et al., 2008; Roy and Mitra, 2011), overall accuracy of prediction (Han et al., 2008; Lamanna et al., 2008) and Matthews correlation coefficient (MCC) (Matthews, 1975).The sensitivity and specificity can be defined as per following:
(%) *100 (%) *100[( )] [( )]
NP
P N N P
TTSensitivity Specificity
T F T F
Where the true positive (TP) is the number of compounds correctly predicted as active, false negative (FN) is the number of compounds incorrectly predicted as inactive, true negative (TN) is the number of compounds correctly predicted as inactive, false positive (FP) is the number of compounds incorrectly predicted as active. Thus, the overall accuracy is defined as:
(%) *100P N
P N N P
T TQ
T F T F
Using this information, MCC was calculated as:
1/2
. .
( )( )( )( )P N N P
P N P P N N N P
T T F FMCC
T F T F T F T F
As there is no perfect way of describing the confusion matrix of true and false positives and negatives by a single number, MCC is generally regarded as being one of the best such measures that account both for over and under prediction. The value of MCC varies from –1 to +1. Higher values of MCC indicate better predictions (Baldi et al., 2000; Carugo, 2007). A frequent problem is that MDs are intercorrelated and raise doubt concerning the meaning of large number of descriptors to be utilised for modelling studies (Hollas et al., 2005). From a practical application point of view, MDs used should be least correlated (Basak et al., 2004). To encounter this problem, statistical significance of MDs used in building predictive models was also assessed by intercorrelation analysis. The degree of correlation was appraised by the correlation coefficient ‘r’. Pairs of MDs with r 0.97 are known to be highly inter-correlated whereas those with 0.90 r 0.97 may be treated as appreciably correlated. MDs with 0.50 r 0.89 are considered to be weakly correlated and finally the pairs of MDs with low r-values (< 0.50) are not correlated (Trinajstic et al., 2001; Nikolic et al., 2003).
3 Results and discussion
Importance of developing predictive models in lieu of expensive and labour-intensive experimental testing, for safety and effectiveness in drug development has been highlighted by FDA and this could lead to significant reduction in the time and cost of drug discovery process (McGee, 2005; FDA, 2004). An inspection of the published (Q)SAR and QSPR models shows that molecular graph descriptors/TIs are used with success in modelling various properties and demonstrates that they are valuable descriptors of chemical structure (Ivanciuc et al., 2001). In recent years, TIs have been reported and utilised for chemical documentation, isomer discrimination, study of

10 R.K. Marwaha and A.K. Madan
molecular complexity, chirality, similarity/dissimilarity, (Q)SAR/QSPR, drug design and database selection, lead optimisation, rational combinatorial library design and for deriving multilinear regression models etc. (Gozalbes et al., 2002). High discriminating power and absence of degeneracy are two properties of an ideal topological index, which the researchers in theoretical chemistry are striving to achieve. Augmented path eccentric connectivity indices (1-4) proposed by authors in part-1 of the manuscript have proven to be highly discriminating with negligible degeneracy. These indices have been successfully utilised in the present study for development of suitable models through DT, RF and MAA for predicting antitubercular activity of 121 aza and diazabiphenyl analogues of an active compound (6S)-2-Nitro-{[4-(trifluoromethoxy)benzyl]oxy}-6,7- dihydro-5H-imidazo[2,1-b][1,3]oxazine (PA-824) (Kmentova et al., 2010).The decision tree was built by utilising 46 descriptors of diverse nature to test their importance. This recursive partitioning technique gives rise to a tree-like structure and assigns a probability value of 0 (zero) to 1 (one) (Singh et al., 2008). Compounds with a probability equal to or greater than 0.5 are designated as active, while others are designated as inactive. DT identified seven most important descriptors; A26 [total size index/weighted by atomic masses (Tm)], A20 [2nd component size directional WHIM index/weighted by atomic van der Waals volume(L2v)], A19 [1st component size directional WHIM index/weighted by atomic van der Waals volume (L1v)] and A23 [Ist component size directional WHIM index/weighted by atomic electropological states(L1s)] (Todeschini et al., 1995; Todeschini and Lasagni, 1994; Todeschini and Gramatica, 1997a; Todeschini and Gramatica, 1997b; Todeschini and Gramatica, 1997c; Todeschini and Gramatica, 1998; Todeschini and Consonni, 2009), A1 [augmented path eccentric connectivity topochemical index-1 1( )]AP C
c (Marwaha et al., 2012), A9 [total
information content index (neighborhood symmetry of 2-order (TIC2)] (Magnuson et al., 1983; Tetko, 2005) and A16[highest eigenvalue n.5 of burden matrix/weighted by atomic van der Waals volume (BEHv5)] (Burden, 1989; Burden, 1997; Tetko, 2005). One out of these most important descriptors selected by DT was 1 .AP C
c Selection of this descriptor
(proposed by the authors in part-1 of the manuscript), as one of most important by DT demonstrates the usefulness of proposed descriptors in drug design.
Among the remaining descriptors, A20 (L2v), A19 (L1v), and A23 (L1s) are directional Weighted Holistic Invariant Molecular (WHIM) descriptors and A26 (Tm) is non-directional WHIM descriptor. A9 (TIC2) is information content molecular descriptor and A16 (BEHv5) is information content index. WHIM descriptors are built in such a manner so as to extract relevant molecular 3D information regarding molecular size, shape, and symmetry and atom distribution with respect to invariant reference frames. The directional WHIM size descriptors are defined as the eigenvalues λ1, λ2 and λ3 of the weighted (e.g. weighted by atomic van der Waals volume in case of A19) covariance matrix of the molecule atomic coordinates and they take into consideration the molecular size in each principal direction. Non-directional WHIM descriptors (e.g. A26) are directly derived from directional WHIM descriptors by disappearing any information related to the principal axes. The only description is related to a global- holistic - view of the molecule. (Todeschini et al., 1995; Todeschini and Lasagni, 1994; Todeschini and Gramatica, 1997a; Todeschini and Gramatica, 1997b; Todeschini and Gramatica, 1997c; Todeschini and Gramatica, 1998; Todeschini and Consonni, 2009). Total information content MDs are calculated as information content of molecules, based on the calculation

Fourth generation detour matrix-based topological descriptors 11
of equivalence classes from molecular graph. Among them the MDs of neighborhood symmetry also take into consideration the neighborhood degree and edge multiplicity (Magnuson et al., 1983; Tetko, 2005) whereas Burden eigenvalue based MDs are obtained from positive and negative eigenvalue of adjacency matrix, weighing the diagonal elements with atom weights (Burden, 1989; Burden, 1997; Tetko, 2005).
The resulting topology of the decision tree is shown in Figure 2 where the respective descriptor is denoted with an alphanumerical abbreviation that refers to Table 1. DT classified analogues of PA-824 in the training set with an accuracy of 98.8% and in the tenfold validated set with an accuracy of ~72.2 % (average of ten observations) with regard to antitubercular activity (MABA). DT was further cross validated using an independent test set and accuracy of prediction was 82.5% and 74.5% (average of ten observations) in case tenfold cross validated test set. The goodness of DT based model was further evaluated by calculating sensitivity, specificity and MCC. The sensitivity, specificity and MCC of DT based model in the training set were found to be 100%, 98.1% and 0.974 respectively during validation and 63%, 79% and 0.425 respectively during tenfold cross-validations (Table 2). Similarly, the sensitivity, specificity and MCC of DT based model in an independent test set were found to be 63.6%, 89.7% and 0.549 respectively during cross validation and 59.23%, 81.8% and 0.413 respectively during tenfold cross validation (Table 3). High values of MCC simply indicate robustness of proposed model (Tables 2 and 3).
The RF was also grown utilising 46 descriptors enlisted in Table 1. The RF classified PA-824 analogues with regard to antitubercular activity with an accuracy of 81.3% and 80.0 % in the training test and test set respectively. Out-of-bag estimate of error was found to be 18.7% and 20.0% in the training set and an independent test set respectively. The sensitivity, specificity and MCC values of RF based model were found to be 74.2%, 84.0% and 0.582 in training set and 60%, 88.5% and 0.514 in an independent test set respectively (Tables 2 and 3). High value of MCC in RF based model simply indicates robustness of the proposed model.
In addition to DT and RF analysis, a number of single index based models were also developed using MAA. Out of these, four best models involving non correlating descriptors were finally selected. These four models were based upon A26 [Total size index/weighted by atomic masses (Tm)], A1 [augmented path eccentric connectivity topochemical index-1 1( )]AP C
c (both identified best from DT analysis), A4 [Gutman
MTI by valence vertex degrees (GMTIV)] (Gutman, 1994) and A20 [Second component size directional WHIM index/weighted by atomic van der Waals volume (L2v)]. Entire data set comprising of 121 analogues of PA-824 was divided into two parts, all the odd numbered analogues (61 compounds) constituted the training set whereas all the even numbered analogues (60 compounds) constituted the validation set.
The accuracy of prediction was up to ~89.5% in training set and 90.7% in cross validation set. The index values of various analogues along with their substituents are presented in Tables 6 and 7. The rationale behind choosing these four TIs for development of models was that these indices are non-correlating and provide structural information on entirely different parameters/features. Combination of these selected descriptors of diverse nature used in the proposed models has the capability to take care of various features needed for drug design of potent antitubercular agents.

12 R.K. Marwaha and A.K. Madan
Figure 2 Topology of decision tree distinguishing active compounds {A} from inactive compounds {B}
Table 2 Confusion matrix for antitubercular activity of PA-824 analogues and recognition rate of models based on DT and RF in training set
Number of compounds Predicted Model Description Ranges
Active Inactive
Sensitivity (%)
Specificity (%)
Overall Accuracy of
Prediction MCC
Training set Active Inactive
29 01
00 51
100 98.1 98.8 0.974 Decision Tree Cross validated
set * Active
Inactive21.6 9.8
12.7 36.9
63 79 72.2 0.425
Random Forest Active Inactive
23 08
08 42 74.2 84.0 81.3 0.582
Note: *Based on average of 10 validations.
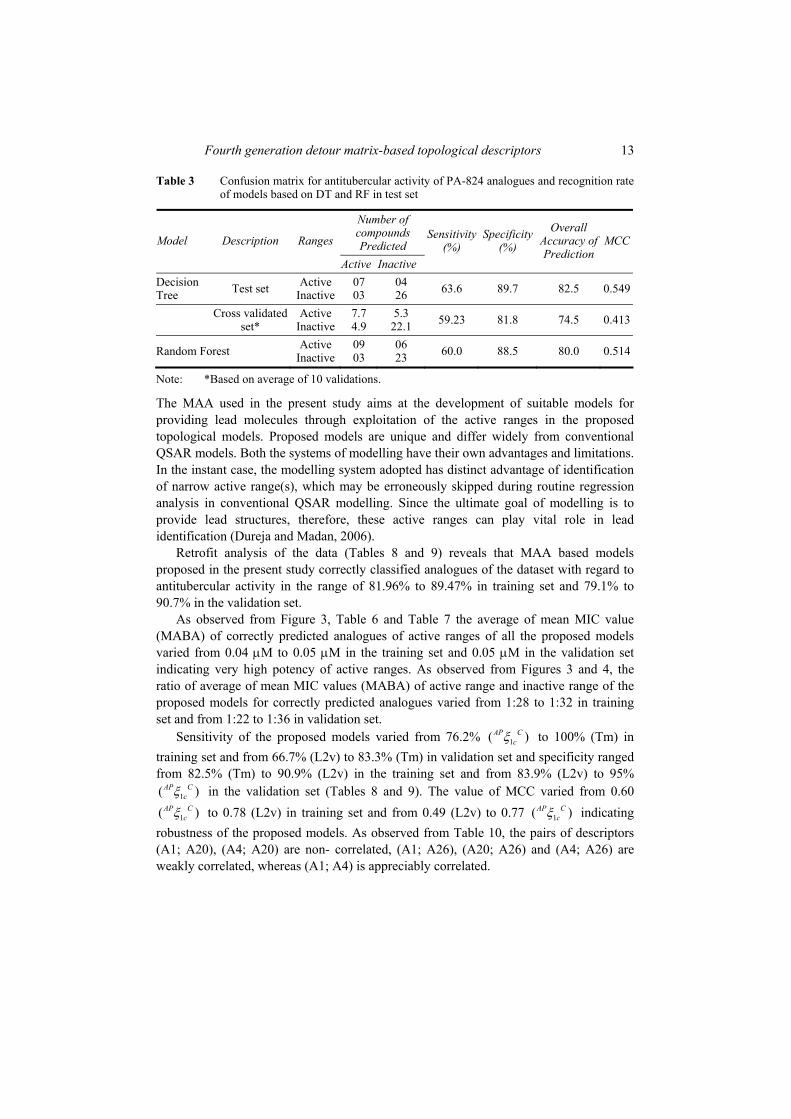
Fourth generation detour matrix-based topological descriptors 13
Table 3 Confusion matrix for antitubercular activity of PA-824 analogues and recognition rate of models based on DT and RF in test set
Number of compounds Predicted Model Description Ranges
Active Inactive
Sensitivity (%)
Specificity (%)
Overall Accuracy of Prediction
MCC
Decision Tree Test set Active
Inactive07 03
04 26 63.6 89.7 82.5 0.549
Cross validated
set* Active
Inactive7.7 4.9
5.3 22.1
59.23 81.8 74.5 0.413
Random Forest Active Inactive
09 03
06 23
60.0 88.5 80.0 0.514
Note: *Based on average of 10 validations.
The MAA used in the present study aims at the development of suitable models for providing lead molecules through exploitation of the active ranges in the proposed topological models. Proposed models are unique and differ widely from conventional QSAR models. Both the systems of modelling have their own advantages and limitations. In the instant case, the modelling system adopted has distinct advantage of identification of narrow active range(s), which may be erroneously skipped during routine regression analysis in conventional QSAR modelling. Since the ultimate goal of modelling is to provide lead structures, therefore, these active ranges can play vital role in lead identification (Dureja and Madan, 2006).
Retrofit analysis of the data (Tables 8 and 9) reveals that MAA based models proposed in the present study correctly classified analogues of the dataset with regard to antitubercular activity in the range of 81.96% to 89.47% in training set and 79.1% to 90.7% in the validation set.
As observed from Figure 3, Table 6 and Table 7 the average of mean MIC value (MABA) of correctly predicted analogues of active ranges of all the proposed models varied from 0.04 M to 0.05 M in the training set and 0.05 M in the validation set indicating very high potency of active ranges. As observed from Figures 3 and 4, the ratio of average of mean MIC values (MABA) of active range and inactive range of the proposed models for correctly predicted analogues varied from 1:28 to 1:32 in training set and from 1:22 to 1:36 in validation set.
Sensitivity of the proposed models varied from 76.2% 1( )AP Cc to 100% (Tm) in
training set and from 66.7% (L2v) to 83.3% (Tm) in validation set and specificity ranged from 82.5% (Tm) to 90.9% (L2v) in the training set and from 83.9% (L2v) to 95%
1( )AP Cc in the validation set (Tables 8 and 9). The value of MCC varied from 0.60
1( )AP Cc to 0.78 (L2v) in training set and from 0.49 (L2v) to 0.77 1( )AP C
c indicating
robustness of the proposed models. As observed from Table 10, the pairs of descriptors (A1; A20), (A4; A20) are non- correlated, (A1; A26), (A20; A26) and (A4; A26) are weakly correlated, whereas (A1; A4) is appreciably correlated.

14 R.K. Marwaha and A.K. Madan
Table 4 Relationship between topological indices and antitubercular activity of PA-824 analogues in the training set
Ant
itube
rcul
ar a
ctiv
ity
Pre
dict
ed
Com
poun
d N
o.
Bas
ic
Stru
ctur
e A
za
R
1A
PC c
Tm
L
2v
GM
TIV
1A
PC c
Tm
L
2v
GM
TIV
Rep
orte
d(K
men
tova
et
al.,
201
0)
1 I
O
CF
3
28.0
8 29
.06
1.17
4 36
511
3 I
O
CF
3
37.8
1 44
.02
1.56
7 63
279
+
+
+
+
+
5 II
3-
aza
4-F
33
.15
23.3
9 3.
398
3313
3
7 II
3-
aza
4-O
CH
2Ph
45.4
8 31
.79
9.71
7 57
590
+
±
9 II
I 2-
aza
--
30.8
2 27
.17
3.08
8 27
528
11
III
2-az
a 4-
OC
F2H
37
.14
32.7
9 4.
415
5273
6
13
III
3-az
a 4-
OC
F3
36.9
7 34
.74
3.72
5 53
728
±
15
III
3-az
a 4-
OC
H3
33.5
4 30
.69
4.25
4 34
978
17
III
4-az
a --
30
.81
27.2
1 2.
98
2784
0
19
IV
2-az
a 4-
CF
3 36
.19
41.6
2 1.
352
5640
8 +
+
±
± +
21
IV
2-az
a 4-
CN
32
.52
35.8
9 1.
333
3893
0
±
+
23
IV
2-az
a 4-
F
31.6
1 32
.92
1.38
1 35
833
±
+

Fourth generation detour matrix-based topological descriptors 15
Table 4 Relationship between topological indices and antitubercular activity of PA-824 analogues in the training set (continued)
Ant
itub
ercu
lar
activ
ity
Pre
dict
ed
Com
poun
d N
o.
Bas
ic
Stru
ctur
e A
za
R
1A
PC c
Tm
L
2v
GM
TIV
1A
PC c
Tm
L
2v
GM
TIV
Rep
orte
d(K
men
tova
et
al.,
201
0)
25
IV
2-az
a 4-
OC
H3
32.8
1 36
.50
1.53
9 36
578
+
27
IV
3-az
a 4-
CF
3 36
.15
41.7
3 1.
338
5651
2 +
+
±
± +
29
IV
3-az
a 4-
F
31.6
2 33
.99
1.32
2 36
613
±
+
31
IV
3-az
a 4-
NH
2 31
.42
33.8
2 1.
327
3273
7
±
33
IV
3-az
a 4-
OC
H3
32.8
0 36
.53
1.53
3 36
718
+
+
35
IV
4-az
a --
30
.14
31.0
1 1.
398
2911
6
±
37
IV
4-az
a 3-
F
31.9
6 33
.23
1.40
8 36
145
±
39
V
2’-a
za
4-C
N
33.1
5 28
.19
4.78
1 36
786
41
V
2’-a
za
4-O
CF 3
38
.85
34.1
6 5.
363
6169
7 +
±
43
V
2’-a
za
3-F
,4-O
CH
3 35
.27
28.9
0 5.
248
4133
5
45
V
4’-a
za
4-C
F3
36.9
9 30
.45
4.80
8 53
664
±
+
47
V
4’-a
za
4-F
32
.35
27.2
7 4.
047
3466
5
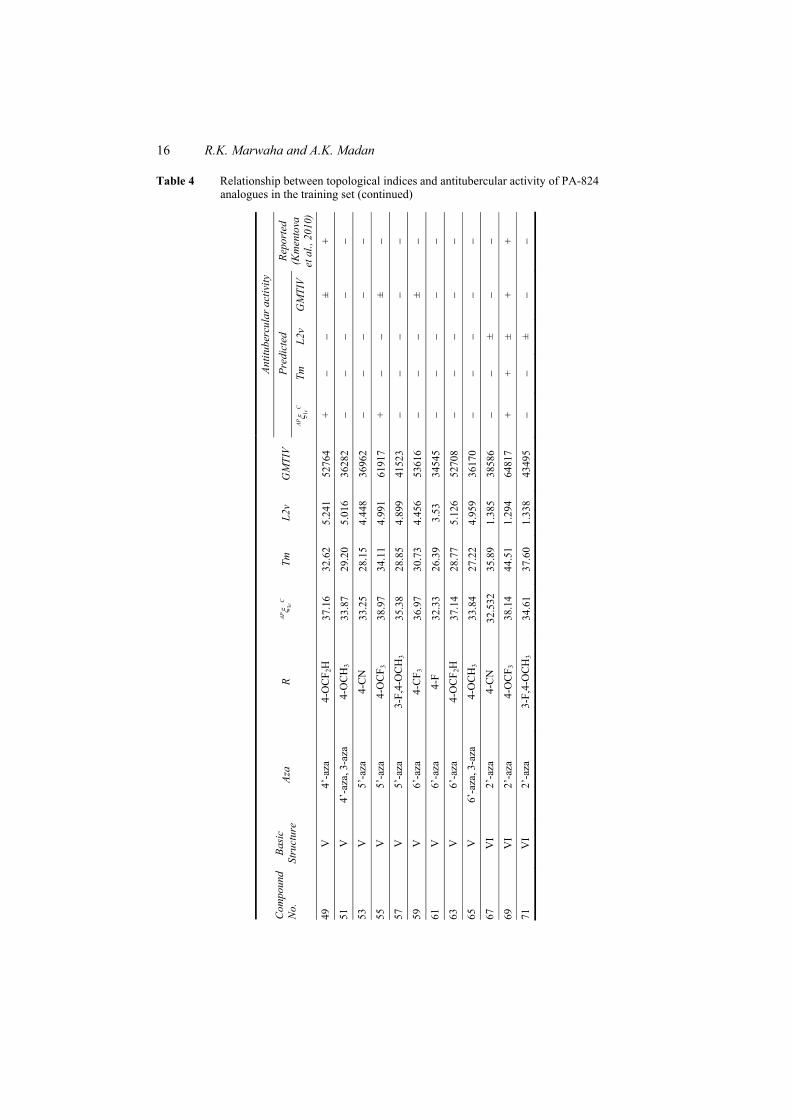
16 R.K. Marwaha and A.K. Madan
Table 4 Relationship between topological indices and antitubercular activity of PA-824 analogues in the training set (continued)
Ant
itube
rcul
ar a
ctiv
ity
Pre
dict
ed
Com
poun
d N
o.
Bas
ic
Stru
ctur
e A
za
R
1A
PC c
Tm
L
2v
GM
TIV
1A
PC c
Tm
L
2v
GM
TIV
Rep
orte
d(K
men
tova
et
al.,
201
0)
49
V
4’-a
za
4-O
CF
2H
37.1
6 32
.62
5.24
1 52
764
+
± +
51
V
4’-a
za, 3
-aza
4-
OC
H3
33.8
7 29
.20
5.01
6 36
282
53
V
5’-a
za
4-C
N
33.2
5 28
.15
4.44
8 36
962
55
V
5’-a
za
4-O
CF
3 38
.97
34.1
1 4.
991
6191
7 +
±
57
V
5’-a
za
3-F,
4-O
CH
3 35
.38
28.8
5 4.
899
4152
3
59
V
6’-a
za
4-C
F3
36.9
7 30
.73
4.45
6 53
616
±
61
V
6’-a
za
4-F
32
.33
26.3
9 3.
53
3454
5
63
V
6’-a
za
4-O
CF
2H
37.1
4 28
.77
5.12
6 52
708
65
V
6’-a
za, 3
-aza
4-
OC
H3
33.8
4 27
.22
4.95
9 36
170
67
VI
2’-a
za
4-C
N
32.5
32
35.8
9 1.
385
3858
6
±
69
VI
2’-a
za
4-O
CF
3 38
.14
44.5
1 1.
294
6481
7 +
+
±
+
+
71
VI
2’-a
za
3-F,
4-O
CH
3 34
.61
37.6
0 1.
338
4349
5
±

Fourth generation detour matrix-based topological descriptors 17
Table 4 Relationship between topological indices and antitubercular activity of PA-824 analogues in the training set (continued)
Ant
itube
rcul
ar a
ctiv
ity
Pre
dict
ed
Com
poun
d N
o.
Bas
ic
Stru
ctur
e A
za
R
1A
PC c
Tm
L
2v
GM
TIV
1A
PC c
Tm
L
2v
GM
TIV
Rep
orte
d(K
men
tova
et
al.,
201
0)
73
VI
2’-a
za
3-C
l,4-O
CF
3 40
.54
45.5
1 1.
544
6653
4.8
+
+
+
+
+
75
VI
2’-a
za
3-F,
4-O
CF
3 39
.81
44.9
1 1.
333
7300
6 +
+
±
+
+
77
VI
2’-a
za, 2
-aza
3-
F
32.1
9 32
.47
1.38
1 36
943
±
79
VI
2’-a
za, 3
-aza
4-
CF
3 36
.46
41.5
4 1.
361
5793
6
± ±
±
81
VI
2’-a
za, 3
-aza
5-
F
32.2
5 33
.26
1.28
37
119
83
VI
2’-a
za, 4
-aza
2-
F
32.8
3 31
.03
1.08
6 36
639
85
VI
3’-a
za
4-C
F3
36.1
7 41
.45
1.41
4 56
216
+
± ±
± +
87
VI
3’-a
za
4-F
31
.65
33.7
6 1.
407
3617
3
±
+
89
VI
3’-a
za
4-O
CF
2H
36.3
9 40
.57
1.63
5 55
200
+
± +
±
+
91
VI
3’-a
za
2-C
l,4-O
CF
3 41
.16
42.7
1 1.
583
6645
8 +
+
+
+
+
93
VI
3’-a
za
2-F,
4-O
CF
3 39
.92
43.2
4 1.
376
7261
8 +
+
±
+
+
95
VI
3’-a
za
3-O
CF
3,4-
Cl
41.0
6 40
.76
2.20
5 64
125.
6 +
±
+

18 R.K. Marwaha and A.K. Madan
Table 4 Relationship between topological indices and antitubercular activity of PA-824 analogues in the training set (continued)
Ant
itube
rcul
ar a
ctiv
ity
Pre
dict
ed
Com
poun
d N
o.
Bas
ic
Stru
ctur
e A
za
R
1A
PC c
Tm
L
2v
GM
TIV
1A
PC c
Tm
L2v
GM
TIV
Rep
orte
d(K
men
tova
et
al.,
201
0)
97
VI
3’-a
za, 3
-aza
4-
F
31.9
3 33
.73
1.40
7 37
799
±
99
VII
-
4-C
F3
36.1
6 41
.62
1.30
4 57
624
+
+
± ±
+
101
VII
-
4-F
31.6
3 33
.80
1.28
7 37
287
103
VII
-
4- O
CF 2
H
36.3
5 41
.26
1.21
5 56
600
+
±
±
105
VII
-
4-C
F3
36.4
6 41
.57
1.26
1 59
384
±
±
107
VII
I -
4-C
F3
36.3
6 41
.09
1.47
3 57
632
+
± +
±
+
109
VII
I -
4-O
CF
3 38
.33
42.7
4 1.
809
6637
9 +
+
+
+
+
111
VII
I -
4-C
F3
36.6
6 41
.21
1.44
8 59
392
±
± ±
113
IX
- 4-
F 31
.83
33.4
5 1.
327
3723
1
±
115
IX
- 4-
OC
F 2H
36
.54
40.3
4 1.
263
5657
6
±
117
X
- 4-
CF
3 36
.37
41.2
2 1.
326
5765
2 +
±
± ±
+
119
X
- 4-
OC
F3
38.3
4 43
.56
1.26
2 66
387
± +
+
+
121
X
- 4-
CF
3 36
.67
41.2
7 1.
294
5940
8
± ±
±
Not
es:
, A
ctiv
e an
alog
ues;
, I
nact
ive
Ana
logu
es; ±
Tra
nsit
iona
l ana
logu
es w
here
act
ivit
y co
uld
not b
e sp
ecif
ical
ly a
ssig
ned.

Fourth generation detour matrix-based topological descriptors 19
Table 5 Relationship between topological indices and antitubercular activity of PA-824 analogues in the test set
Ant
itub
ercu
lar
acti
vity
Pre
dict
ed
Com
poun
d N
o.
Bas
ic
Stru
ctur
e A
za
R
1A
PC c
Tm
L2v
GM
TIV
1A
PC c
Tm
L2v
G
MT
IV
Rep
orte
d (K
men
tova
et
al.,
2010
2 I
C
F3
35.8
5 41
.749
1.
37
5478
8 +
+
±
± +
4 II
3-
aza
--
31.6
1 22
.384
3.
29
2640
8
6 II
3-
aza
4-O
CH
3 34
.39
24.0
04
5.05
33
238
8 II
4-
aza
--
31.6
0 22
.417
3.
17
2656
4
10
III
2-az
a 4-
CF 3
37
.01
34.7
16
3.80
53
624
±
12
III
3-az
a --
30
.81
27.1
69
2.96
27
684
14
III
3-az
a 4-
F 32
.32
29.2
46
3.02
34
873
16
III
3-az
a 4-
OC
H2P
h 44
.47
43.1
31
6.35
60
490
+
+
±
+
18
IV
2-az
a --
30
.15
30.9
23
1.34
28
804
±
20
IV
2-az
a 4-
CF
3,C
l 39
.75
41.0
8 1.
60
5795
2.3
+
± +
±
+
22
IV
2-az
a 3-
F 31
.89
32.9
2 1.
38
3583
3
±
24
IV
2-az
a 4-
OC
F2H
36
.34
40.6
39
1.58
55
404
+
± +
±
+

20 R.K. Marwaha and A.K. Madan
Table 5 Relationship between topological indices and antitubercular activity of PA-824 analogues in the test set (continued)
Ant
itub
ercu
lar
activ
ity
Pre
dict
ed
Com
poun
d N
o.
Bas
ic
Stru
ctur
e A
za
R
1A
PC c
Tm
L2v
GM
TIV
1A
PC c
Tm
L2v
GM
TIV
Rep
orte
d (K
men
tova
et
al.,
2010
26
IV
3-az
a --
30
.14
30.9
65
1.32
1 28
960
±
28
IV
3-az
a 4-
CN
32
.51
35.9
72
1.31
7 39
066
±
30
IV
3-az
a 5-
F 31
.95
33.1
71
1.33
36
005
±
32
IV
3-az
a 4-
OC
F 2H
36
.35
40.7
41
1.57
55
512
+
± +
±
+
34
IV
3-az
a 4-
OC
H2P
h 43
.57
53.6
65
1.69
63
390
+
+
+
+
+
36
IV
4-az
a 2-
F 32
.52
31.6
5 1.
48
3553
7
+
38
V
2’-a
za
4-C
F 3
36.8
6 38
.91
1.87
53
432
±
40
V
2’-a
za
4-F
32.2
4 27
.53
4.13
34
433
42
V
2’-a
za
4-O
CF 2
H
37.0
4 32
.838
5.
29
5253
2
44
V
2’-a
za, 3
-aza
4-
OC
H3
33.7
4 28
.996
5.
21
3605
0
46
V
4’-a
za
4-C
N
33.2
6 28
.156
4.
69
3701
8
48
V
4’-a
za
4-O
CF 3
38
.99
34.1
73
5.24
61
929
+
+

Fourth generation detour matrix-based topological descriptors 21
Table 5 Relationship between topological indices and antitubercular activity of PA-824 analogues in the test set (continued)
Ant
itub
ercu
lar
activ
ity
Pre
dict
ed
Com
poun
d N
o.
Bas
ic
Stru
ctur
e A
za
R
1A
PC c
Tm
L2v
G
MTI
V
1A
PC c
Tm
L2
v G
MT
IV
Rep
orte
d (K
men
tova
et
al.,
2010
50
V
4’-a
za
3-F,
4-O
CH
3 35
.39
28.8
36
5.15
41
567
+
+
52
V
5’-a
za
4-C
F 3
36.9
8 30
.405
4.
57
5364
0
±
54
V
5’-a
za
4-F
32.3
4 27
.349
3.
85
3460
5
56
V
5’-a
za
4-O
CF 2
H
37.1
5 33
.357
4.
01
5273
6
58
V
5’-a
za, 3
-aza
4-
OC
H3
33.8
4 30
.835
3.
91
3622
6
60
V
6’-a
za
4-C
N
33.2
4 27
.62
4.31
36
906
62
V
6’-a
za
4-O
CF 3
38
.97
30.4
48
5.24
61
905
+
±
64
V
6’-a
za
3-F,
4-O
CH
3 35
.38
28.8
09
5.01
41
479
66
VI
2’-a
za
4-C
F 3
36.1
7 41
.614
1.
41
5619
2 +
+
±
± +
68
VI
2’-a
za
4-F
31.6
4 33
.878
1.
37
3611
3
±
70
VI
2’-a
za
4-O
CF 2
H
36.3
5 41
.338
1.
29
5517
2 +
±
± ±
+
72
VI
2’-a
za
2-C
l,4-O
CF
3 41
.13
42.8
34
1.08
66
449.
6 +
+
+

22 R.K. Marwaha and A.K. Madan
Table 5 Relationship between topological indices and antitubercular activity of PA-824 analogues in the test set (continued)
Ant
itub
ercu
lar
activ
ity
Pre
dict
ed
Com
poun
d N
o.
Bas
ic
Stru
ctur
e A
za
R
1A
PC c
Tm
L2
v G
MT
IV
1A
PC c
Tm
L2v
GM
TIV
Rep
orte
d (K
men
tova
et
al.,
2010
74
VI
2’-a
za
2-F
,4-O
CF
3 39
.90
43.5
09
1.08
72
622
+
+
+
+
76
VI
2’-a
za
3-O
CF
3,4-
Cl
41.0
5 42
.392
1.
81
6411
7.1
+
+
+
+
78
VI
2’-a
za, 2
-aza
4-
CF
3 36
.50
41.4
47
1.4
5782
8
± ±
±
80
VI
2’-a
za, 3
-aza
4-
F
31.9
2 33
.798
1.
28
3774
3
82
VI
2’-a
za, 3
-aza
4-
OC
H3
33.1
1 36
.16
1.65
37
850
+
84
VI
2’-a
za, 4
-aza
3-
F
32.2
6 32
.751
1.
41
3726
3
±
86
VI
3’-a
za
4-C
N
32.5
4 35
.76
1.39
38
642
±
88
VI
3’-a
za
4-O
CF
3 38
.14
43.6
66
1.64
64
829
+
+
+
+
+
90
VI
3’-a
za
3-F
,4-O
CH
3 34
.6
37.5
65
1.61
43
539
+
+
92
VI
3’-a
za
3-C
l,4-O
CF 3
40
.55
45.2
97
1.72
66
543.
3 +
+
+
+
+
94
VI
3’-a
za
3-F
,4-O
CF
3 39
.82
44.3
75
1.65
73
002
+
+
+
+
+
96
VI
3’-a
za, 3
-aza
4-
CF
3 36
.47
41.4
89
1.39
57
956
±
± ±

Fourth generation detour matrix-based topological descriptors 23
Table 5 Relationship between topological indices and antitubercular activity of PA-824 analogues in the test set (continued)
Ant
itub
ercu
lar
acti
vity
Pre
dict
ed
Com
poun
d N
o.
Bas
ic
Stru
ctur
e A
za
R
1A
PC c
Tm
L2v
GM
TIV
1A
PC c
Tm
L2v
G
MT
IV
Rep
orte
d (K
men
tova
et
al.,
2010
98
VI
3’-a
za, 3
-aza
4-
OC
H3
33.1
1 36
.185
1.
33
3790
6
±
100
VII
--
4-
CN
32
.52
35.8
14
1.28
39
794
102
VII
--
4-
OC
F 3
38.1
3 44
.486
1.
21
6637
1 +
+
+
+
104
VII
--
3-
F, 4
-OC
H3
34.6
0 37
.471
1.
25
4474
9
106
VII
--
4-
OC
H3
33.1
0 36
.038
1.
52
3904
2
+
108
VII
I --
4-
F 31
.83
33.4
13
1.42
37
295
±
+
110
VII
I --
4-
OC
F2H
36
.55
39.7
15
1.79
56
608
+
±
112
IX
--
4-C
F 3
36.3
5 41
.089
1.
32
5760
4 +
±
± ±
114
IX
--
4-O
CF 3
38
.33
43.4
11
1.26
66
363
+
+
+
116
IX
--
4-C
F 3
36.6
5 41
.096
1.
28
5936
8
±
±
118
X
--
4-F
31.8
4 33
.5
1.33
37
351
±
120
X
--
4- O
CF
2H
36.5
5 40
.409
1.
27
5663
2
±
Not
es:
, A
ctiv
e an
alog
ues;
, I
nact
ive
Ana
logu
es; ±
Tra
nsit
iona
l ana
logu
es w
here
act
ivity
cou
ld n
ot b
e sp
ecif
ical
ly a
ssig
ned.

24 R.K. Marwaha and A.K. Madan
Table 6 MAA based topological models for antitubercular activity of PA-824 analogues in the training set
Number of analogues
falling in the range
Average MIC (M)* Model
Index
Nature of range in proposed
model Index value
Total Correct
Overall accuracy ofprediction
(%) MABA LORA
Clog P Values
Lower Inactive 35.38 30 25 1.26 12.40 1.77
Lower active > 35.38–< 36.46 8 7 0.05 2.89 2.74
Upper Inactive 36.46 – < 37.16 10 9 81.96 0.40 13.1 2.18 1AP C
c
Upper Active 37.16 13 9 0.04 1.97 3.19
Inactive < 40.573 40 33 1.12 12.00 2.05
Transitional 40.573 – 41.573 10 N.A 86.27 0.18 6.99 2.11 Tm
Active > 41.573 11 11 0.04 1.90 3.21
Lower Inactive 1.287 8 7 1.05 11.16 1.24
Transitional > 1.287– 1.448 23 N.A 89.47 0.30 6.47 2.25
Active > 1.448 – 1.809 8 7 0.04 0.18 3.00 L2v
Upper Inactive > 1.809 22 20 1.24 1.28 2.41
Inactive < 52764 32 27 1.20 12.69 1.81
Transitional 52764 – 61917 20 N.A 85.36 0.32 6.71 2.53 GMTIV
Active > 61917 9 8 0.04 0.75 3.31
Table 7 MAA based topological models for antitubercular activity of PA-824 analogues in the test set
Number of analogues
falling in the range
Average MIC (µM)* Model
Index
Nature of range in proposed
model Index value
Total Correct
Overall accuracy of prediction
(%) MABA LORA
Clog P Values
1AP C
c
Lower Inactive Lower active
Upper Inactive Upper Active
< 35.38 > 35.38– < 36.46> 36.46 – < 37.16
> 37.16
30071013
28 06 10 10
90.0
1.380.050.310.05
10.98 2.41 6.56 4.66
1.68 3.01 2.4 3.43
Tm
Inactive Transitional
Active
< 40.573 > 40.573 – < 41.573 > 41.573
400812
37 NA 10
90.38
1.120.190.05
9.64 6.41 4.80
1.88 2.64 3.45
L2v
Lower Inactive Transitional
Active Upper Inactive
< 1.287 > 1.287– < 1.448> 1.448 – < 1.809
> 1.809
9 171222
7 NA 8 19
79.06
0.250.310.051.81
8.79 5.32 4.94
12.06
1.68 2.17 3.22 2.23
GMTIV Inactive
Transitional Active
< 52764 > 52764 – < 61917
> 61917
331710
31 NA 8
90.69 1.280.210.05
10.39 5.50 5.32
1.72 2.91 3.19

Fourth generation detour matrix-based topological descriptors 25
Table 8 Confusion matrix for antitubercular activity of PA- 824 analogues and recognition rate of models based on MAA in the training set
Number of compoundsPredicted Model Ranges
Active Inactive
Sensitivity (%)
Specificity (%)
Overall Accuracy of Prediction
MCC
Active 16 05 1
AP Cc
Inactive 06 34 76.2 85 81.96 0.60
Active 11 00 Tm
Inactive 07 33 100 82.5 86.27 0.71
Active 14 02 L2v
Inactive 02 20 87.5 90.9 89.47 0.78
Active 08 01 GMTIV
Inactive 05 27 88.9 84.4 85.36 0.65
Table 9 Confusion matrix for antitubercular activity of PA-824 analogues recognition rate of models based on MAA in test set
Number of compoundsPredicted Model Ranges
Active Inactive
Sensitivity (%)
Specificity (%)
Overall Accuracy of Prediction
MCC
Active 16 04 1
AP Cc
Inactive 02 38 80 95 90.0 0.77
Active 10 02 Tm
Inactive 03 37 83.3 92.5 90.38 0.74
Active 08 04 L2v
Inactive 05 26 66.7 83.9 79.06 0.49
Active 08 02 GMTIV
Inactive 02 31 80 93.9 90.69 73.9
Table 10 Inter-correlation matrix for the four descriptors selected for MAA
A1 A4 A20 A26
A1 1 0.895 0.208 0.641
A4 1 –0.105 0.804
A20 1 –0.553
A26 1

26 R.K. Marwaha and A.K. Madan
Figure 3 Average MIC (μM) values of correctly predicted analogues in various ranges of the proposed MAA based models in the training set
Augmented path eccentric connectivity index - 1
Total size index/weighted by atomic masses
2nd component size directional WHIM index/weighted by atomic van der Waals volume (L2v)
Gutman MTI by valence vertex degrees (GMTIV)
Figure 4 Average MIC (μM) values of correctly predicted analogues in various ranges of the proposed MAA based models in the test set
Augmented path eccentric connectivity index - 1
Total size index/weighted by atomic masses
2nd component size directional WHIM index/weighted by atomic van der Waals volume (L2v)
Gutman MTI by valence vertex degrees (GMTIV)

Fourth generation detour matrix-based topological descriptors 27
ClogP is an important parameter representing lipophilicity of the compounds and affecting their biological activity. Highly lipophilic compounds may have the ability to penetrate the exceptionally lipophilic cell wall of Mycobacterium tuberculosis but their poor aqueous solubility limit their oral bioavailability reducing their potential use as TB drugs (Kmentova et al., 2010). As observed from Tables 6 and 7 average ClogP values of the active compounds were found to be higher than the corresponding inactive ranges in both the training and validation sets.
The compounds which are active in MABA assay, have lower MIC values in LORA assay also, whereas compounds which are inactive in MABA assay show higher MIC values in LORA assay also.
Proposed models can be used by either resorting to reverse engineering or through screening. One can resort to reverse engineering to generate probable structures of compounds which fall in the active range. However this method will necessitate thorough knowledge of mathematics so as to facilitate generation of structures. Alternatively, the proposed models can be used as filter to retain structures with index values falling in the active ranges and discarding all other structures falling under inactive or transitional ranges. This method will offer a viable and a very simple approach.
4 Conclusion
Topochemical versions of proposed augmented path eccentric connectivity indices were successfully utilised for development of models for prediction of antitubercular activity of analogues of an active compound PA-824 through decision tree, random forest and moving average analysis. One of the proposed descriptors (in part - 1 of the manuscript) was identified as one of the most important descriptors by the decision tree. All the proposed models exhibited high accuracy of prediction. High values of MCC simply indicate robustness of the proposed models.These models offer vast potential for providing lead structures for the development of potent antitubercular agents derived from PA-824.
References
Baldi, P., Bruank, S., Chauvin, Y., Andersen, C.A.F. and Nielsen, H. (2000) ‘Assessing the accuracy of prediction algorithms for classification: an overview’, Bioinformatics, Vol. 16, pp.412–424.
Basak, S.C., Gute, B.D. and Balaban, A.T. (2004) ‘Interrelationship of major topological indices evidenced by clustering’, Croat. Chem. Acta., Vol. 77, pp.331–344.
Breiman, L. (2001) ‘Random forests’, Machine Learning, Vol. 45, pp.5–32.
Bruce, C.L., Melville, J.L., Pickett, S.D. and Hirst, J.D. (2007) ‘Contemporary QSAR classifiers compared’, J. Chem. Inf. Model., Vol. 47, pp.219–227.
Burden, F.R. (1989) ‘Molecular identification number for substructure searches’, J. Chem. Inf. Comput. Sci., Vol. 29, pp.225–227.
Burden, F.R. (1997) ‘A chemically intuitive molecular index based on the eigenvalues of a modified adjacency matrix’, Quant. Struct. Act. Relat., Vol. 16, pp.309–314.
Carugo, O. (2007) ‘Detailed estimation of bioinformatics prediction reliability through the fragmented prediction performance plots’, BMC Bioinformatics, Vol. 8, No. 380. Available online at: http://www.biomedcentral.com/1471-2105/8/380 (accessed on 23 March 2012).

28 R.K. Marwaha and A.K. Madan
Cho, S.H., Warit, S., Wan, B., Hwang, C.H., Pauli, G.F. and Franzblau, S.G. (2007) ‘Low-oxygen-recovery assay for high-throughput screening of compounds against non-replicating Mycobacterium tuberculosis’, Antimicrob. Agents Chemother., Vol. 51, pp.1380–1385.
Cyril, G. (1997) ‘Note on free lunches and cross validation’, Neural Computation, Vol. 9, pp.1245–1249.
Devillers, J. and Balaban, A.T. (1999) Topological Indices and Related Descriptors in QSAR and QSPR, Gordon and Breach Science Publishers, Amsterdam.
Diudea, M.V., Florescn, M.S. and Khadikar, P.V. (2006) Molecular Topology and its Applications, EFICON Press, Bucarest.
Duchowicz, P.R., Castro, E.A. and Fernandez, F.M. (2008) ‘Application of a novel ranking approach in QSPR-QSAR’, J. Math. Chem., Vol. 43, pp.620–636.
Dureja, H., Gupta, S. and Madan, A.K. (2008) ‘Topological models for prediction of pharmacokinetic parameters of cephalosporins using random forest, decision tree and moving average analysis’, Sci. Pharm., Vol. 76, pp.377–394.
Dureja, H. and Madan, A.K. (2006) ‘Models for the prediction of h5-HT2A receptor antagonistic activity of arylindoles: computational approach using topochemical descriptors’, J. Mol. Graph. Mod., Vol. 25, pp.373–379.
Falzari, K., Zhu, Z., Pan, D., Liu, H., Hongmanee, P. and Franzblau, S.G. (2005) ‘In vitro and in vivo activities of macrolide derivatives against Mycobacterium tuberculosis’, Antimicrob. Agents Chemother., Vol. 49, pp.1447–1454.
FDA (2004) Challenge and Opportunity on the Critical Path to New Medical Products, Food and Drug Administration, U.S. Department of Health and Human Services.
Ginsberg, M.A. (2010) ‘Tuberculosis drug development: progress, challenges, and the road ahead’, Tuberculosis, Vol. 90, pp.162–167.
Goyal, R.K., Dureja, H., Singh, G. and Madan, A.K.(2010) ‘Models for antitubercular activity of 5’-0-[(N-Acyl)sulfamoyl]adenosines’, Sci. Pharm., Vol. 78, pp.791–820.
Gozalbes, R., Doucet, J.P. and Derouin, F. (2002) ‘Application of topological descriptors in QSAR and drug design: history and new trends’, Curr. Drug Targets Infect. Disord., Vol. 2, No. 1, pp.93–102.
Granitto, P.M., Gasperi, F., Biasioli, F., Trainotti, E. and Furlanello, C. (2007) ‘Modern data mining tools in descriptive sensory analysis: a case study with a Random forest approach’, Food Quality and Preference, Vol. 18, pp.681–689.
Gupta, S. and Aires-de-Sousa, J. (2007) ‘Comparing the chemical spaces of metabolites and available chemicals: models of metabolite-likeness’, Mol. Divers., Vol. 11, pp.23–36.
Gupta, S., Singh, M. and Madan, A.K. (2001) ‘Predicting anti-HIV activity: computational approach using novel topological indices’, J. Comput. Aided Mol. Des., Vol. 15, pp.671–675.
Han, L., Wang, Y. and Bryant, S.H. (2008) ‘Developing and validating predictive decision tree models from mining chemical structural fingerprints and high throughoutput data in PubChem’, BMC Bioinformatics, Vol. 9, No. 401. Available online at: http://www.biomedcentral.com/1471-2105/9/401 (accessed on 25 March 2012).
Haydel, S.E. (2010) ‘Extensively drug-resistant tuberculosis: a sign of the times and an impetus for antimicrobial discovery’, Pharmaceuticals, Vol. 3, pp.2268–2290.
Hollas, B., Gutman, I. and Trinajstic, N. (2005) ‘On reducing correlation between topological indices’, Croat. Chem. Acta., Vol. 78, pp.489–492.
Ivanciuc, O., Ivanciuc, T., Klein, D.J., Seitz, W.A. and Balaban, A.T. (2001) ‘Wiener index extension by counting even/odd graph distances’, J. Chem. Inf. Comput. Sci., Vol. 41, No. 3, pp.536–549.
Kapetanovic, I.M. (2008) ‘Computer-aided drug discovery and development (CADDD): in silico chemico-biological approach’, Chem. Biol. Interact., Vol. 171, pp.165–176.

Fourth generation detour matrix-based topological descriptors 29
Khunt, R.C., Khedkar, V.M., Chawda, R.S., Chauhan, N.A., Parikh, A.R. and Coutinho, E.C. (2012) ‘Synthesis, antitubercular evaluation and 3D-QSAR study of N-phenyl-3- (4-fluorophenyl)-4-substituted pyrazole derivatives’, Bioorg. Med. Chem. Lett., Vol. 22, No. 1, pp.666–678.
King, R.B. (1983) Chemical Applications of Topology and Graph Theory, Elsevier, Amsterdam.
Kmentova, I., Sutherland, H.S., Palmer, B.D., Blaser, A., Franzblau, S.G., Wan, B., Wang, Y., Ma, Z., Denny, W.A. and Thompson, A.M. (2010) ‘Synthesis and structure-activity relationships of aza and diazabiphenyl analogues of antitubercular drug (6S)-2-Nitro- {[4-(trifluoromethoxy)benzyl]oxy}-6,7-dihydro-5H-imidazo[2,1-b][1,3]oxazine (PA-824)’, J. Med. Chem., Vol. 53, No. 23, pp.8421–8439.
Koul, A., Arnoult, E., Lounis, N., Guillemont, J. and Andries, K. (2011) ‘The challenge of new drug discovery for tuberculosis’, Nature, Vol. 469, pp.483–490.
Kovalishyn, V., Aires-de-Sousa, J., Ventura, C., Leitao, R.E. and Martins, F. (2011) ‘QSAR modeling of antitubercular activity of diverse organic compounds’, Chemometrics and Intelligent Laboratory Systems, Vol. 107, No. 1, pp.69–74.
Lamanna, C., Bellini, M., Padova, A., Westerberg, G. and Maccari, L. (2008) ‘Straight forward recursive partitioning model for discarding insoluble compounds in the drug discovery process’, J. Med. Chem., Vol. 51, pp.2891–2897.
Madan, A.K. and Dureja, H. (2010) ‘Eccentricity based descriptors for QSAR/QSPR’, in Gutman, I. and Furtula, B. (Eds): Novel Molecular Structure Descriptors – Theory and Applications II, University of Kragujevac, Kragujevac, pp.91–138.
Magnuson, V.R., Harriss, D.K. and Basah, S.C. (1983) Studies in Physical and Theoretical Chemistry, (King, R.B., ed.), Elsevier, Amsterdam, The Netherlands, pp.178–191.
Marwaha, R.K., Jangra, H., Das, K.C., Bharatam, P.V. and Madan, A.K. (2012) ‘Fourth generation detour matrix based topological indices for QSAR/QSPR: Part-1: development and evaluation’, Int. J. Computational Biology and Drug Design, Vol. 5, Nos. 3/4, pp.335–360.
Matthews, B.W. (1975) ‘Comparison of the predicted and observed secondary structure of T4 phase lysozyme’, Biochim. Biophys. Acta., Vol. 405, pp.442–451.
McGee, P. (2005) ‘Modelling success with in silico tools’, Drug Discov. Today, Vol. 8, pp.23–28.
Meng, Y.A., Yu, Y., Cupples, L.A., Farrer, L.A. and Lunetta, K.L. (2009) ‘Performance of random forest when SNPs are in linkage disequilibrium’, BMC Bioinformatics, Vol. 10, No. 78. Available online at: http://www.biomedcentral.com.
Myles, A.J., Feudale, R.N., Liu, Y., Woody, N.A. and Brown, S.D. (2004) ‘An introduction to decision tree modeling’, J. Chemometrics, Vol. 18, pp.275–285.
Nadine, S., Christine, J., Claudia, A. and Michael, C.H. (2008) ‘Gradual in silico filtering for drug like substances’, J. Chem. Inf. Model, Vol. 48, pp.613–628.
Nikolic, S., Kovacevic, G., Milicevic, A. and Trinajstic, N. (2003) ‘The Zagreb indices 30 years after’, Croat. Chem. Acta., Vol. 76, pp.113–124.
Ray, S. and Roy, P.P. (2012) ‘A QSAR study of biphenyl analogues of 2-Nitroimidazo-[2, 1-b] [1, 3] - oxazines as antitubercular agents using genetic function approximation’, Med. Chem., Vol. 8, No. 4, pp.717–726.
Rowland, J.L. and Niederweis, M. (2012) ‘Resistance mechanisms of Mycobacterium tuberculosis against phagosomal copper overload’, Tuberculosis, Vol. 92, No. 3, pp.202–210.
Roy, K. and Mitra, I. (2011) ‘On various metrics used for validation of predictive QSAR models with applications in virtual screening and focused library design’, Combinatorial Chemistry & High Throughput Screening, Vol. 14, pp.450–474.
Singh, M., Wadhwa, P.K. and Kaur, S. (2008) ‘Predicting protein function using decision tree’, World Acad. Sci. Eng. Technol., Vol. 39, pp.350–353.
Svetnik, V., Liaw, A., Tong, C., Culberson, J.C., Sheridan, R.P. and Feuston, B.P. (2003) ‘Random forest: a classification and regression tool for compound classification and QSAR modeling’, J. Chem. Inf. Comput. Sci., Vol. 43, No. 6, pp.1947–1958.

30 R.K. Marwaha and A.K. Madan
Tetko, I.V., Gasteiger, J., Todeschini, R., Mauri, A., Livingstone, D., Ertl, P., Palyulin, V.A., Radchenko, E.V., Zefirov, N.S., Makarenko, A.S., Tanchuk, V.Y. and Prokopenko, V.V. (2005) ‘Virtual computational chemistry laboratory – design and description’, J. Comput. Aided Mol. Des., Vol. 19, pp.453–463.
Thengyai, S., Maitarat, P., Hannongbua, S., Suwanborirux, K. and Plubrukarn, A. (2010) ‘Probing the structural requirements for antitubercular activity of scalarane derivatives using 2D-QSAR and CoMFA approaches’, Monatsh Chem., Vol. 141, pp.621–629.
Todeschini, R. and Consonni, V. (2000) Handbook of Molecular Descriptors: Methods and Principles in Medicinal Chemistry, Wiley VCH, Germany.
Todeschini, R. and Gramatica, P. (1997a) ‘3D-modelling and prediction by WHIM descriptors. Part 5. Theory development and chemical meaning of WHIM descriptors’, Quant. Struct. Act. Relat., Vol. 16, pp.113–119.
Todeschini, R. and Gramatica, P. (1997b) ‘The whim theory: new 3D molecular descriptors for QSAR in environmental modelling’, SAR & QSAR Environ. Res., Vol. 7, pp.89–115.
Todeschini, R. and Consonni, V. (2009) Molecular Descriptors for Chemoinformatics, Wiley VCH, Weinheim (Federal Republic of Germany).
Todeschini, R. and Gramatica, P. (1998) ‘New 3D molecular descriptors: the WHIM theory and QSAR applications’, in Kubinyi, H., Folkers, G. and Martin, Y.C. (Eds): 3D QSAR in Drug Design, Vol. 2, Kluwer/Escom, Dordrecht, The Netherlands, pp.355–380.
Todeschini, R., Gramatica, P. (1997c) ‘3D-modelling and prediction by WHIM descriptors. Part 6. Application of WHIM descriptors in QSAR studies’, Quant. Struct. Act. Relat., Vol. 16, pp.120–125.
Todeschini, R., Gramatica, P., Marengo, E. and Provenzani, R. (1995) ‘Weighted holistic invariant molecular descriptors. Part 2. Theory development and application on modelling physico-chemical properties of poly aromatic hydrocarbons’, Chemom. Intell. Lab. Syst., Vol. 27, pp.221–229.
Todeschini, R. and Lasagni, M. (1994) ‘New molecular descriptors for 2D and 3D structures’, J. Chemom., Vol. 8, pp.263–272.
Tomioka, H. and Namba, K. (2006) ‘Development of antituberculous drugs: current status and future prospects’, Kekkaku, Vol. 81, No. 12, pp.753–774.
Tong, W., Welsh, W.J., Shi, L., Fang, H. and Perkins, R. (2003) ‘Structure-activity relationship approaches and applications’, Environ. Toxicol. Chem., Vol. 22, pp.1680–1695.
Trinajstic, N., Nikolic, S., Basak, S.C. and Lukovits, I. (2001) ‘Distance indices and their hypercounterparts: intercorrelation and use in the structure-property modeling’, SAR QSAR Environ. Res., Vol. 12, pp.31–54.
World Health Organization (2009) Guidelines for Surveillance of Drug Resistance in Tuberculosis, 4th ed., WH0/HTM/TB/2009.422, Geneva, Switzerland.
Zhang, Y. (2005) ‘The magic bullets and tuberculosis drug targets’, Annu. Rev. Pharmacol. Toxicol., Vol. 45, pp.529–564.