Fourth Five-Year Review Report for Groveland Wells ...
68
FOURTH FIVE-YEAR REVIEW REPORT FOR GROVELAND WELLS SUPERFUND SITE ESSEX COUNTY, MASSACHUSETTS JUNE 2020 Prepared by U.S. Environmental Protection Agency Region 1 Boston, Massachusetts --------------------------------- ----------------------------------- Bryan Olson, Division Director Date Superfund & Emergency Management Division Director
Transcript of Fourth Five-Year Review Report for Groveland Wells ...

FOURTH FIVE-YEAR REVIEW REPORT FOR
GROVELAND WELLS SUPERFUND SITE
ESSEX COUNTY, MASSACHUSETTS
JUNE 2020
Prepared by
U.S. Environmental Protection Agency
Region 1
Boston, Massachusetts
--------------------------------- -----------------------------------
Bryan Olson, Division Director Date
Superfund & Emergency Management Division Director

2
Table of Contents LIST OF ABBREVIATIONS & ACRONYMS .........................................................................................................4 I. INTRODUCTION...................................................................................................................................................6
Site Background .....................................................................................................................................................6 FIVE-YEAR REVIEW SUMMARY FORM ........................................................................................................7
II. RESPONSE ACTION SUMMARY ......................................................................................................................9 Basis for Taking Action .........................................................................................................................................9 Response Actions .................................................................................................................................................10 Status of Implementation .....................................................................................................................................13 Systems Operations/Operation and Maintenance (O&M) ...................................................................................17
III. PROGRESS SINCE THE PREVIOUS REVIEW ..............................................................................................17 IV. FIVE-YEAR REVIEW PROCESS ....................................................................................................................18
Community Notification, Community Involvement and Site Interviews ............................................................18 Data Review .........................................................................................................................................................19 Site Inspection ......................................................................................................................................................25
V. TECHNICAL ASSESSMENT ............................................................................................................................25 QUESTION A: Is the remedy functioning as intended by the decision documents? .........................................25 QUESTION B: Are the exposure assumptions, toxicity data, cleanup levels and remedial action objectives
(RAOs) used at the time of the remedy selection still valid? ...............................................................................26 QUESTION C: Has any other information come to light that could call into question the protectiveness of the
remedy? ................................................................................................................................................................28 VI. ISSUES/RECOMMENDATIONS .....................................................................................................................29 VII. PROTECTIVENESS STATEMENT ................................................................................................................29 VIII. NEXT REVIEW ..............................................................................................................................................30 APPENDIX A – REFERENCE LIST ................................................................................................................... A-1 APPENDIX B – SITE CHRONOLOGY ...............................................................................................................B-1 APPENDIX C – SITE MAPS ................................................................................................................................C-1 APPENDIX D – DATA TABLES ........................................................................................................................ D-1 APPENDIX E – PRESS RELEASE ....................................................................................................................... E-1 APPENDIX F – INTERVIEW FORMS ................................................................................................................ F-1 APPENDIX G – SITE INSPECTION CHECKLIST ............................................................................................ G-1 APPENDIX H – SITE INSPECTION PHOTOS .................................................................................................. H-1 APPENDIX I – DETAILED ARARS REVIEW TABLES .................................................................................... I-1 APPENDIX J – SCREENING-LEVEL RISK REVIEW ........................................................................................ J-1
Tables
Table 1: Contaminants of Concern (COCs), by Media ..............................................................................................9 Table 2: Interim Groundwater Cleanup Levels ........................................................................................................12 Table 3: Soil Cleanup Goals .....................................................................................................................................13 Table 4: Summary of Planned and/or Implemented Institutional Controls (ICs) .....................................................15 Table 5: Protectiveness Determinations/Statements from the 2015 FYR Report ....................................................17 Table 6: Status of Recommendations from the 2015 FYR Report ...........................................................................18 Table 7: Maximum Concentrations of TCE, Cis-1,2-DCE and Vinyl Chloride.......................................................20 Table 8: 2018 PFAS Sampling ................................................................................. Error! Bookmark not defined. Table B-1: Site Chronology ....................................................................................................................................B-1 Table D-1: Summary Statistics for 2018 ............................................................................................................... D-1 Table D-2: TCE and cis-1,2-DCE from 2009-2018 .............................................................................................. D-2 Table I-1: Review of OU1 Groundwater IGCLs ..................................................................................................... I-1 Table J-1: Screening-Level Tapwater Risk Review ................................................................................................ J-1 Table J-2: Screening-Level Residential Risk Review of Soil Cleanup Levels........................................................ J-2
3
Table J-3: Screening-Level Residential Risk Review of 2011 Soil Confirmation Sampling .................................. J-2 Table J-4: Screening-Level Commercial/Industrial Risk Review of 2011 Soil Confirmation Sampling ................ J-2 Table J-5: Residential Screening-Level Vapor Intrusion Risk Evaluation of Shallow Groundwater Results ......... J-4 Table J-6: Commercial/Industrial Screening-Level Vapor Intrusion Risk Evaluation of Shallow Groundwater
Results ..................................................................................................................................................................... J-4
Figures
Figure 1: Site Vicinity Map ........................................................................................................................................8 Figure 2: Institutional Control Map ..........................................................................................................................16 Figure 3: Overburden TCE Plume ............................................................................................................................22 Figure 4: Bedrock TCE Plume .................................................................................................................................23 Figure 5: TCE and 1,2-DCE Concentrations at Bedrock Well EW-M3 ...................................................................24 Figure C-1: Source Area Layout ............................................................................................................................C-1

4
LIST OF ABBREVIATIONS & ACRONYMS
ARAR Applicable or Relevant and Appropriate Requirement
CERCLA Comprehensive Environmental Response, Compensation, and Liability Act
CFR Code of Federal Regulations
COC Contaminant of Concern
DCE Dichloroethylene
EPA United States Environmental Protection Agency
EPC Exposure Point Concentration
ERH Electrical Resistance Heating/In-situ Thermal Treatment
ESD Explanation of Significant Differences
FS Feasibility Study
FYR Five-Year Review
gpm Gallons per Minute
GRC Groveland Resources Corporation
GWTF Groundwater Treatment Facility
HA Health Advisory
HB Hazard Based
HQ Hazard Quotient
IC Institutional Control
IGCL Interim Groundwater Cleanup Level
ISTT In-situ Thermal Treatment/Electrical Resistive Heating
MassDEP Massachusetts Department of Environmental Protection
MCL Maximum Contaminant Level
MCLG Maximum Contaminant Level Goal
µg/kg Micrograms per Kilogram
mg/kg Milligram per Kilogram
µg/L Micrograms per Liter
MMCL Massachusetts Maximum Contaminant Level
MNA Monitored Natural Attenuation
MOM Management of Migration
NCP National Oil and Hazardous Substances Pollution Contingency Plan
ng/L Nanogram per Liter
NPL National Priorities List
O&M Operation and Maintenance
OU Operable Unit
ORSG Office of Research and Standards Guideline
PCE Tetrachloroethylene
PFAS Per- and Polyfluoroalkyl Substances
PFBS Perfluorobutanesulfonic acid
PFDA Perfluorodecanoic acid
PFHpA Perfluoroheptanoic acid
PFHxS Perfluorohexanesulfonic acid
PFNA Perfluorononanoic acid
PFOA Perfluorooctanoic acid
PFOS Perfluorooctanesulfonic acid
ppb Part per Billion
PPRTV Provisional Peer Reviewed Toxicity Value
ppt Part per Trillion
RAO Remedial Action Objective
RfD Reference Dose
RI Remedial Investigation
ROD Record of Decision

5
RPM Remedial Project Manager
RSL Regional Screening Level
SAM Site Assessment Manager
SVE Soil Vapor Extraction
TCE Trichloroethylene
UCL95 Upper 95th confidence limit on the mean
UST Underground Storage Tank
UU/UE Unlimited Use and Unrestricted Exposure
VI Vapor Intrusion
VISL Vapor Intrusion Screening Level
VOC Volatile Organic Compound

6
I. INTRODUCTION
The purpose of a five-year review (FYR) is to evaluate the implementation and performance of a remedy to
determine if the remedy is and will continue to be protective of human health and the environment. The methods,
findings and conclusions of reviews are documented in FYR reports such as this one. In addition, FYR reports
identify issues found during the review, if any, and document recommendations to address them.
The U.S. Environmental Protection Agency (EPA) is preparing this FYR pursuant to the Comprehensive
Environmental Response, Compensation, and Liability Act (CERCLA) Section 121, consistent with the National
Contingency Plan (NCP) (40 Code of Federal Regulations (CFR) Section 300.430(f)(4)(ii)) and considering EPA
policy.
This is the fourth FYR for the Groveland Wells Superfund site (the Site). The triggering action for this policy
review is the completion date of the previous FYR. The FYR has been prepared because hazardous substances,
pollutants or contaminants remain at the Site above levels that allow for unlimited use and unrestricted exposure
(UU/UE). The Site consists of two operable units (OUs), which are both addressed in this FYR. OU1
(Management of Migration) encompasses an 850-acre study area that includes the aquifer that recharges
Groveland Municipal Well Station Nos. 1 and 2 (two town wells that were adversely impacted by the site
contaminants). OU2 (Source Control) is limited to the original release area and the immediately surrounding
property.
EPA remedial project manager (RPM) Derrick Golden led the FYR. Participants included Mandy Liao (EPA Site
Assessment Manager (SAM)), Massachusetts Department of Environmental Protection (MassDEP) project
manager Janet Waldron, and Johnny Zimmerman-Ward and Kirby Webster (EPA FYR support contractor, Skeo).
The review began on 12/16/2019. Appendix A provides a list of the site-related resources used to prepare this
FYR Report. Appendix B provides the Site’s chronology of events.
Site Background
The approximately 850-acre Site is located in Groveland, Essex County, Massachusetts, in an area with
residential, commercial and industrial uses (Figure 1). From 1963 to 2001, metal and plastic parts manufacturing
took place on the Valley Manufactured Products Company, Inc. (Valley) property, located at 64 Washington
Street in the southwestern portion of the Site. On-site processes included machining, degreasing and finishing of
metal parts that used solvents, caustic soda and acid solutions for cleaning. Several subsurface disposal systems
were used on the property and Groveland Resources Corporation (GRC) reportedly installed six underground
storage tanks (USTs) for storage of cutting oils, solvents and mineral spirits on the southern part of the Valley
property. GRC was another company that the responsible party owned and operated. From 1963 to 1983,
trichloroethylene (TCE), methylene chloride, and other solvents were used in the vapor degreasing operations.
On-site operations/disposal practices resulted in the contamination of groundwater and soil with metals and
volatile organic compounds (VOCs). GRC and Valley are entities responsible for the release of the contaminants
at the Site.
The Site is located in the Johnson Creek drainage basin. Johnson Creek originates south of the Site and flows in a
northerly direction through Mill Pond. Mill Pond is located about 450 feet northeast of the Valley property. Site
groundwater occurs in two interconnected zones, the overburden and the underlying bedrock. The two zones are
also referred to as the stratified drift aquifer, which are used to supply the area’s drinking water. Groundwater
generally flows to the north through the Site toward the Merrimack River. The overall groundwater flow pattern is
from the higher elevations located to the south, east and west, toward the valley that forms much of the Site, then
north following the trend of the valley toward its outlet. Two Town of Groveland (Town) drinking water supply
wells, Groveland Municipal Well Station Nos. 1 and 2, were impacted with site contamination. The wells were
taken offline and a treatment system was added to Station No. 1. A new drinking water well, Station No. 3, was
installed outside of the Johnson Creek watershed. Station No. 2 was permanently taken offline in 1979.

7
In approximately 2001, Valley ceased operations at the facility. Currently, the manufacturing building on the
Valley property is unused and in disrepair. East of the manufacturing building, the groundwater treatment facility
is being decommissioned by MassDEP under EPA oversight. The clean groundwater treatment facility building
will then be transitioned to the Roman Catholic Archdiocese of Boston (property owner).
FIVE-YEAR REVIEW SUMMARY FORM
SITE IDENTIFICATION
Site Name: Groveland Wells
EPA ID: MAD980732317
Region: 1 State: MA City/County: Groveland/Essex
SITE STATUS
NPL Status: Final
Multiple OUs?
Yes
Has the Site achieved construction completion?
Yes
REVIEW STATUS
Lead agency: EPA
Author name: Derrick Golden, with additional support provided by Skeo
Author affiliation: EPA Region 1
Review period: 12/16/2019 - 6/1/2020
Date of site inspection: 1/9/2020
Type of review: Policy
Review number: 4
Triggering action date: 6/29/2015
Due date (five years after triggering action date): 6/29/2020

8
Figure 1: Site Vicinity Map
Disclaimer: This map and any boundary lines within the map are approximate and subject to change. The map is not a survey. The map is for informational
purposes only regarding EPA’s response actions at the Site.

9
II. RESPONSE ACTION SUMMARY
Basis for Taking Action
TCE was the major contaminant released at the Valley property. In 1973, 500 gallons of TCE were reportedly
released into the soil underneath the concrete slab from an UST. A total of 3,000 gallons of contaminants are
estimated to have been discharged to the environment from several surface and subsurface sources, including the
loading dock drainage system, the Brite Dip disposal system (consists of a concrete distribution box, associated
drains and piping and a leach field located outside the building’s southeast corner), the USTs, and from routine
operation practices (Figure C-1). These releases migrated to groundwater beneath the Valley property and
eventually contaminated the overburden aquifer that supplies the Town’s drinking water. In 1982, EPA
determined that the groundwater contamination at the Site constituted a threat to public health and the
environment. EPA placed the Site on the Superfund program’s National Priorities List (NPL) in December 1982.
In 1983, EPA and MassDEP inspected and sampled the subsurface disposal systems on the Valley property and
found elevated concentrations of TCE and some metals. MassDEP and Valley entered into a consent agreement in
1983 that was intended to bring plant discharges into compliance with state and federal regulations. Valley
implemented changes to the subsurface disposal system and practices.
Valley completed a remedial investigation (RI) (1985) and feasibility study (FS) (1986), but EPA determined that
it was inadequate and did not provide enough information to serve as the basis for selection of a remedy. Valley’s
consultant performed a supplemental RI in 1988, after substantial development and negotiation of a detailed work
plan with EPA. EPA contractors oversaw the supplemental RI and prepared an endangerment assessment (1987)
and an endangerment assessment amendment (1988). In 1991, an EPA contractor also prepared a supplemental
RI/FS.
Surface soil at the Valley property was not found to be contaminated, but subsurface soil was found to be
contaminated with VOCs (Table 1). The greatest potential risks were attributed to the ingestion of contaminated
groundwater, which exceeded EPA risk management criteria for all areas of the plume. It was determined that
contaminated groundwater represented a possible future threat if Station No. 1 were to increase its pumping rate,
or if additional drinking water wells were placed in the aquifer. However, risk and hazard estimates for the surface
water, sediment and fish tissue exposure pathways did not exceed EPA risk management criteria. Risks to the
ecological community of the Johnson Creek watershed from site contaminants were also considered minimal.
Table 1: Contaminants of Concern (COCs), by Media
COC Subsurface Soil Groundwater
Antimony X
Arsenic X
Barium X
Beryllium X
Cadmium X
Chromium X
1,2-Dichloroethylene (DCE) X X
Methylene chloride X
Tetrachloroethylene (PCE) X
1,1,1-Trichloroethane X

10
COC Subsurface Soil Groundwater
TCE X X
Notes:
X = a COC in media
Blank = not a COC in media
Response Actions
In July 1985, EPA approved an initial remedial measure to rehabilitate Station No. 1 by using granular activated
carbon treatment to remove VOCs from the groundwater. In 1987, EPA completed installation of the treatment
system. Station No. 1 was used as a supplemental supply to Station No. 3 and Station No. 2 was permanently shut
down by the Town. The granular activated carbon treatment system was turned off in 1994; VOCs had not been
detected at Station No. 1 since 1989. In 2008, the Drinking Water Section of MassDEP’s, Northeast Region
Office, approved the Groveland Water Department’s request to remove the GAC treatment system at Station No.
1.
In December 1986, through EPA’s Superfund Innovative Technology Evaluation (SITE) Program, the Valley
property was nominated for a demonstration of the Terra-Vac, Inc. soil vapor extraction (SVE) system. The
Responsible Parties (RP’s) funded, operated and maintained the system until they ceased operations in 2001.
During its operation, the SVE system removed an estimated 1,300 pounds of VOCs from the unsaturated soil at
the property.
The EPA 1988 Record of Decision for OU2 (Source Control), required the RP’s to construct and operate a
groundwater extraction and air stripping treatment system to intercept and treat the VOC plume at Mill Pond. The
system began operating in April 1988. It consisted of two extraction wells, G1 and G2, and an air-stripping unit
installed at the north end of Mill Pond. Treated water was discharged to Johnson Creek immediately downstream
of the pond. The average flow from the system ranged from 31 gallons per minute (gpm) to 75 gpm. The system
operated until 2000 when it was replaced by a groundwater extraction and treatment system constructed by EPA
for OU1.
EPA selected the OU1 (Management of Migration) remedy in the Site’s 1991 Record of Decision (ROD) and
modified it in the Site’s 1996 Explanation of Significant Differences (ESD). Remedial action objectives (RAOs)
from the 1991 ROD included:
• Prevent ingestion of groundwater contamination in excess of relevant and appropriate drinking water
standards [maximum contaminant levels (MCLs)/maximum contaminant level goals
(MCLGs)/Massachusetts drinking water standards (MMCLs)] or, in their absence, an excess cancer risk
level of 10-6, for each carcinogenic compound. Also, prevent ingestion of groundwater contaminated in
excess of a total excess cancer risk level for all carcinogenic compounds of 10-4 to 10-6.
• Prevent ingestion of groundwater contaminated in excess of relevant and appropriate drinking water
standards for each non-carcinogenic compound and a total hazard index greater than unity (1) for non-
carcinogenic compounds having the same target endpoint of toxicity.
• Restore the groundwater aquifer to relevant and appropriate drinking water standards
(MCLs/MCLGs/MMCLs) or, in their absence, the more stringent of an excess cancer risk of 10-6, for each
carcinogenic compound or a hazard quotient of unity for each non-carcinogenic compound. Also, restore
the aquifer to the more stringent of (1) a total excess cancer risk of 10-4 to 10-6 or (2) a hazard index not to
exceed an acceptable range for non-carcinogenic compounds having the same target endpoint of toxicity.
Major remedial components from the 1991 ROD and 1996 ESD are listed below.
• Establishment of interim groundwater cleanup levels (IGCLs) for COCs identified in the risk assessment
as posing unacceptable risk to public health or the environment (Table 2).
• Installation of a groundwater extraction and treatment system at the property adjacent to the Valley
property on Washington Street (Archdiocese of Boston property).

11
• Natural attenuation and periodic groundwater monitoring for the less-concentrated portions of
contaminated groundwater found north of Mill Pond (1996 ESD).
• Construction of treatment units to remove inorganics and treatment units to destroy organic contaminants
via ultraviolet oxidation technology.
• Extraction and treatment of contaminated groundwater.
• Discharge of treated water to Johnson Creek.
• Establishment of institutional controls to prohibit use of groundwater in the contaminated area until
cleanup levels have been achieved.
• When groundwater Applicable or Relevant and Appropriate Requirement (ARARs) have been attained,
performance of a risk assessment to determine whether the remedial action is protective.
EPA selected the OU2 (Source Control) remedy in the Site’s 1988 ROD and modified it in the Site’s 1996 and
2007 ESDs. The 1988 ROD identified the following RAOs:
• Prevent ingestion of groundwater contaminated in excess of relevant and appropriate drinking water
standards (MCLs/MCLGs) or, in their absence, an excess cancer risk level of 10-6 for each carcinogenic
compound. Also, to prevent ingestion of groundwater contaminated in excess of a total excess cancer risk
level for all carcinogenic compounds of 10-4 to 10-7.
• Prevent ingestion of groundwater contaminated in excess of relevant and appropriate drinking water
standards for each noncarcinogenic compound and a total hazard index greater than unity (1) for all
noncarcinogenic compounds.
• Prevent migration of contaminants in soils and groundwater that would result in groundwater
contamination in excess of relevant and appropriate drinking water standards and surface water
contamination in excess of relevant and appropriate ambient water quality criteria for the protection of
aquatic life.
• Remediate inorganic contamination to the extent that such remediation is incidental to organics
remediation, and to evaluate attainment of the applicable or relevant and appropriate requirements of
federal and state environmental regulations.
Major remedial components from the 1988 ROD and 1996 and 2007 ESDs are listed below.1
• Installation, operation and maintenance of a SVE system and in-situ thermal treatment (ISTT) to meet
site-specific soil cleanup goals (Table 3).
• Installation, operation and maintenance of a groundwater recovery/re-circulation system.
• Extract water and pipe it to the management of migration groundwater treatment facility.
• Treatment of air emissions from the aeration process by carbon adsorption.
• Groundwater monitoring.
• Sealing or disconnecting all drains and lines to the acid bath finishing process disposal system.
• Incidental treatment of inorganic compounds and other contaminants will be provided as necessary in
order to efficiently operate the VOC contaminant treatment system and to meet applicable discharge
permit requirements.
1 While not part of the selected remedy, it was anticipated that EPA would review closure of the USTs under the UST
program and closure of the septic systems under Resource Conservation and Recovery Act.

12
Table 2: Interim Groundwater Cleanup Levels2
Groundwater COC 1991 ROD Cleanup Level (µg/L) Basis
Noncarcinogenic COCs
Acetone 700 MMCL
Antimony 3 MCL
Arsenic 50 MCL
Barium 1,000 MCL
Beryllium 1 MCL
Cadmium 5 MCL
Chlorobenzene 100 MCL
Chromium (VI) 50 MCL
1,1-Dichloroethane 5 MMCL
1,1-DCE 7 MCL
1,2-DCE(c) 70 MCL
Mercury 2 MCL
Methylene chloride 5 MCL
Nickel 100 MCL
Selenium 10 MCL
Silver 50 MMCL
PCE 5 MCL
Toluene 1,000 MCL
1,1,1-trichloroethane 200 MCL
Vanadium 240 HB
Carcinogenic COCs
Arsenic 50 MCL
Benzene 5 MCL
Beryllium 1 MCL
1,1-DCE 7 MCL
Lead 15 Policya
Methylene chloride 5 MCL
PCE 5 MCL
2 The 1991 ROD stated that “While these interim cleanup levels are consistent with ARARs (and suitable criteria to be
considered) for groundwater, a cumulative risk that could be posed by these compounds may exceed EPA’s goals for
remedial action. Consequently, these levels are considered interim cleanup levels for groundwater. When all groundwater
ARARs identified in the ROD, and newly promulgated ARARs and modified ARARs which call into question the
protectiveness of the remedy, have been attained, a risk assessment will be performed on residual groundwater contamination
to determine whether the remedial action is protective. Remedial actions shall continue until protectiveness concentrations of
residual contamination have been achieved or until the remedy is otherwise deemed protective. These protective residual
levels shall constitute the final cleanup levels for this Management of Migration ROD and shall be considered performance
standards for remedial action. If final cleanup levels differ significantly from interim cleanup levels, EPA will reevaluate the
selected remedy and take appropriate action to ensure that the cleanup levels are attained.”

13
Groundwater COC 1991 ROD Cleanup Level (µg/L) Basis
TCE 5 MCL
Vinyl chloride 2 MCL
Notes:
a. Superfund Policy Memo from Henry Longest, Director, Office of Emergency and Remedial Response to Patrick Tobin,
Director, Waste Management Division, Region IV, Cleanup Level for Lead in Groundwater, June 1990.
MMCL = Massachusetts MCL
µg/L = micrograms per liter
HB = hazard based
Source: Table 23 of the 1991 ROD.
Table 3: Soil Cleanup Goals
Contaminant 1988 ROD Cleanup Goal
(µg/kg)a
2007 ESD Soil Cleanup
Levels (µg/kg)
TCE 6.3 77
Vinyl chloride 1.14 11
Methylene chloride 0.44 22
PCE 18.2 56
1,1-DCE 4.6 45
Trans-1,2-DCE 41.3 626
Toluene 6,000 22,753
1,1,1-trichloroethane 302 1,388
Cis-1,2-DCE --b 418
Notes:
a. Protective of groundwater (MCLs), direct contact exposure (i.e., the incidental ingestion,
dermal contact and inhalation of dust released from the soil) and for the subsurface
vapor intrusion pathway (i.e., the inhalation of contaminated air).
b. The 1988 ROD did not include a soil cleanup goal for cis-1,2-DCE.
µg/kg = micrograms per kilogram
Source: Table VI-3 of the 1988 ROD; Table 1 and Table 2 of the 2007 ESD; Appendix A,
Table 3 of the 2007 ESD.
Status of Implementation
Sealing or Disconnecting All Drains and Lines to the Acid Bath Finishing Process Disposal System (OU2)
In 2006, EPA removed the six USTs remaining in the southern portion of the Valley property and removed the
Brite Dip leach field and disconnected the discharge lines, as called for in the 1988 OU2 ROD. The USTs were
dismantled, decontaminated and taken off site for disposal. The Brite Dip leach field remedy included removal,
decontamination and off-site disposal of all pipes, collars and concrete boxes. The discharge line and other drains
inside the Valley building were reported to have been previously plugged.
SVE/ISTT for the Source Area (OU2)
Contractors for Valley/GRC designed a full-scale SVE system and a groundwater extraction, treatment and
reinjection system to be installed on the property. The SVE system began operating in 1992 and was permanently
shut down in spring 2002 as a result of Valley terminating its business operations. After SVE operations ceased,
EPA performed a comprehensive source area re-evaluation from 2004 to 2006. It concluded that the SVE system
had been minimally successful in removing VOCs from the source area and that significant source area
contamination remained.

14
Following the 2007 ESD, construction of the ISTT system began in March 2010. The ISTT system operated from
August 2010 through February 2011, at which time soil concentrations in the source area had been significantly
reduced by the ISTT system. Remaining elevated concentrations of TCE were localized in two relatively small
areas in the vadose zone on the south end of the Valley building. Based on confirmation groundwater sampling
results, EPA determined the remaining TCE in the vadose zone did not appear to affect groundwater.
Source Area (OU2) and Management of Migration (OU1) Groundwater Extraction and Treatment Systems
In 1994, during design work for the OU2 remedy, results from on-site hydrogeological studies indicated that
maximum yields from the aquifer beneath the Valley/GRC property would be low. Therefore, it was more cost
effective to pipe the water to the treatment facility to be constructed for remediation of groundwater (OU1). As a
result, EPA decided to pursue a combined remedy for groundwater from both OUs that involved extraction and
treatment in a combined facility, using the technology of ultraviolet oxidation to destroy the VOCs.
Construction of a combined groundwater treatment facility and extraction/discharge system for groundwater from
both OUs finished in 2000.
2013 Optimization Review
In January 2013, EPA performed an optimization review. EPA concluded that, through continuous operation of
the groundwater treatment facility and the performance of ISTT, COC concentrations (primarily TCE and cis-1,2-
DCE) in source area soil and groundwater and in downgradient groundwater had been significantly reduced. The
Optimization Review Report provided several recommendations including shutdown criteria for extraction wells
EW-S1 through EW-S4.
Monthly groundwater sampling was performed in select source area and downgradient monitoring wells from
June 2013 through April 2014. Results from monthly sampling events indicated that COC concentrations
remained relatively steady and there was no notable increase of COC concentrations.
In December 2013, EPA issued a Technical Memorandum, RE: Decision Framework for Pump and Treat
Shutdown Based on Optimization Review Groveland Wells Numbers 1 and 2 Superfund Site, which established
criteria for stopping extraction and treatment operations. MassDEP, with approval from EPA, stopped extraction
and treatment operations in April 2014.
The Site continues to undergo remediation through the process of natural attenuation for groundwater, as
described in the 1996 ESD for OU1. Natural attenuation includes monitoring for parameters that indicate whether
conditions are suitable for degradation as well as measuring concentrations of contaminants that remain in
groundwater.
Institutional Control (IC) Review
The 1991 ROD required the establishment of institutional controls to prohibit use of groundwater in the
contaminated area until cleanup levels have been achieved. Groundwater institutional controls were implemented
in July and August 2014 to prohibit use of groundwater from the contaminated area in the form of Grants of
Environmental Restrictions and Easements (Table 4, Figure 2). Institutional controls also restrict residential and
agricultural use and activities that would affect the implementation, integrity or protectiveness of the selected
remedy. The institutional controls are available for review on EPA’s website for the Groveland Wells Superfund
Site at:
https://cumulis.epa.gov/supercpad/SiteProfiles/index.cfm?fuseaction=second.redevelop&id=0100750#Limits.
The Site is located in the town of Groveland Aquifer Protection District. The source area where institutional
controls are in place is located in Zone 3 while the groundwater plume extends into Zone 2. The town of
Groveland bylaws require special permitting for groundwater withdrawal out of Zone 2 (Figure 2). 3
3 Located at:
https://www.grovelandma.com/sites/grovelandma/files/uploads/zoning_bylaws_2018_adopted_at_town_meeting_-
_april_30_2018.pdf

15
Table 4: Summary of Planned and/or Implemented Institutional Controls (ICs)
Media, Engineered
Controls, and Areas
That Do Not
Support UU/UE
Based on Current
Conditions
ICs
Needed
ICs Called
for in the
Decision
Documents
Impacted
Parcel(s)a
IC
Objective
Title of IC Instrument
Implemented and Date
(or planned)
Groundwater Yes Yes
32-030-0
Prohibit use of
groundwater from the
contaminated area
until cleanup levels
have been achieved.
Grant of Environmental
Restriction and Easement
Instrument Number
4014070100606
Book 33384, Page 331b
39-031-0
Grant of Environmental
Restriction and Easement
Southern Essex District
Registry 554225 (44222)c
40-008-0
Grant of Environmental
Restriction and Easement
Instrument Number
201480600268
Book 33461, Page 328d
Parcels
above plume
in Zone 2
Groveland Aquifer
Protection District Zone 2
Notes:
a. Parcels identified from:
http://massgis.maps.arcgis.com/apps/OnePane/basicviewer/index.html?appid=47689963e7bb4007961676ad9fc56ae9
(accessed 2/18/2020).
b. Online at: https://semspub.epa.gov/src/document/01/563919
c. Online at: https://semspub.epa.gov/src/document/01/588531
d. Online at: https://semspub.epa.gov/src/document/01/563920 and https://semspub.epa.gov/src/document/01/591648

16
Figure 2: Institutional Control Map
Disclaimer: This map and any boundary lines within the map are approximate and subject to change. The map is not a survey. The map is for informational purposes only regarding EPA’s response actions at the
Site.

17
Systems Operations/Operation and Maintenance (O&M)
EPA was responsible for the operation of the long-term response action from 2000 through 2011. Following this
approximately 10-year period, the responsibility transferred to MassDEP. The groundwater treatment facility
ceased operations in 2014 and therefore did not operate during this current FYR period from 2015 to 2020.
MassDEP is in the process of decommissioning the groundwater treatment facility. MassDEP conducts long-term
monitoring of groundwater for natural attenuation parameters and VOCs. The 2005 FYR states that “Several
rounds of groundwater monitoring for metals were conducted prior to construction of the GWTF [groundwater
treatment facility], but analysis for metals was discontinued when data showed that metals concentrations were
below primary drinking water standards.” Sampling was conducted quarterly through 2017. Beginning in 2018,
two sentinel wells are sampled quarterly, and a comprehensive event is conducted annually.
Surface water samples were collected from Mill Pond in the spring of 2000, prior to groundwater treatment
facility startup, and during the spring of 2001, 2002 and 2003. Samples were analyzed for VOCs and metals. The
purpose of the sampling was to monitor the impact of the groundwater treatment facility discharge on Mill Pond.
Results showed no significant difference in the level of contaminants or change in water quality in Mill Pond
following startup of the groundwater treatment facility or after three years of operation. Surface water sampling
was discontinued in 2004 because the treatment plant discharge had no adverse effects during the first three years
of operation.
III. PROGRESS SINCE THE PREVIOUS REVIEW DG
This section includes the protectiveness determinations and statements from the previous FYR Report as well as
the recommendations from the previous FYR Report and the status of those recommendations.
Table 5: Protectiveness Determinations/Statements from the 2015 FYR Report
OU # Protectiveness
Determination Protectiveness Statement
1 Short-term Protective
The remedy at OU1 MOM [management of migration]
currently protects human health and the environment because
ICs have been implemented, the MassDEP has increased the
routine groundwater sampling frequency since GWTF
shutdown in April 2014, and groundwater sampling results
from sentinel monitoring wells have not detected COCs above
laboratory reporting limits. However, in order for the remedy
to be protective in the long term, the Town of Groveland needs
to notify EPA and MassDEP if the Town of Groveland plans
to increase pumping rates from municipal well number 1 or
install a new drinking water supply well in this aquifer.
MassDEP and their Drinking Water Program and EPA will
review any proposed increase of pumping from the Towns
drinking water supply in this aquifer.
2 Protective
The remedy at OU2 Source Control is protective of human
health and the environment because the ERH [electrical
resistance heating] remedy was completed, ICs have been
implemented, and the MassDEP has increased the routine
groundwater sampling frequency since GWTF shutdown in
April 2014. The ISTT system effectively reduced contaminant
concentrations in Source Area soil and groundwater.
Groundwater sampling should continue until contaminant
concentrations in the Source Area achieve cleanup goals.

18
OU # Protectiveness
Determination Protectiveness Statement
Sitewide Short-term Protective
The current remedy is considered protective in the short term
because ICs have been implemented, the MassDEP has
increased the routine groundwater sampling frequency since
GWTF shutdown in April 2014, and groundwater sampling
results from sentinel monitoring wells have not detected COCs
above laboratory reporting limits. However, in order for the
remedy to be protective in the long term groundwater
sampling results should continue to be evaluated for potential
COC impacts to the Town of Groveland drinking water supply
and if the Town of Groveland plans to increase pumping rates
they must notify the State and EPA, and evaluate the effects of
any proposed change in water supply pumping rates or any
proposed new water supply well. Long-term protectiveness
will be achieved once the MOM remedy achieves cleanup or
protective levels in the groundwater. Institutional controls
have been implemented to prevent exposure to contaminants
until groundwater cleanup standards are achieved.
Table 6: Status of Recommendations from the 2015 FYR Report
OU # Issue Recommendations Current
Status
Current Implementation Status
Description
Completion
Date (if
applicable)
1 The Town of Groveland
has expressed interest
in installing a new
municipal water supply
well in the aquifer off
Center Street.
Additional pumping in
the aquifer may impact
the groundwater
contaminant plume,
drawing it into the
municipal well(s) or
closer to downgradient
residences.
Continue to require
the Town of
Groveland to
evaluate all potential
impacts of additional
aquifer pumping
prior to implementing
any changes.
Ongoing The Town continues to look for
additional options for drinking water
well locations. The Town is currently
not evaluating drinking water well
options in the area of the Site. If a
drinking water well were to be
installed in the aquifer off Center
Street in the future, the Town of
Groveland would need to evaluate all
potential impacts of additional
aquifer pumping prior to
implementing any changes.
N/A
IV. FIVE-YEAR REVIEW PROCESS
Community Notification, Community Involvement and Site Interviews
A press release was made available by online posting on 3/13/2020 at https://www.epa.gov/newsreleases/epa-
begins-reviews-nine-massachusetts-superfund-site-cleanups-year (Appendix E). It stated that the FYR was
underway and invited the public to submit any comments to the EPA. No comments or questions were received
concerning this FYR. The results of the review and the report will be made available at the Site’s information
repository, Langley-Adams Library, located at 185 Main Street in Groveland, Massachusetts, on-line and at the
EPA Records Center in Boston, MA.
During the FYR process, interviews were conducted to document any perceived problems or successes with the
remedy that has been implemented to date. The interviews are summarized below. Completed interview forms are
included in Appendix F.

19
Janet Waldron, MassDEP project manager, said that the project has gone quite well once the source of
contamination was mostly eliminated. The only concern that she is aware of is the Valley building itself. It has
been condemned by the local fire department and the roof is falling in. She said that the potential for a future
municipal well downgradient of the source area could be a concern if the well were to be located in bedrock.
There is still bedrock contamination found at the Site and the bedrock has not been well defined. MassDEP’s
contractor feels that, overall, the project is a Superfund success story. Concentrations of TCE in the source area
continue to exhibit a downward trend when compared to concentrations prior to and immediately following the
ISTT. There have not been any unexpected O&M difficulties or opportunities to optimize O&M activities.
Colin Stokes, the Groveland Water & Sewer Superintendent, said that he has not had much interaction with the
project since he has been in the role of superintendent. He said he feels well informed about site activities and the
progress of the cleanup. He said that the Town is looking at additional well locations but not in the area of the
Valley property. On March, 5, 2020, representatives from EPA met with the town and MA Senator Bruce Tarr, at
the Site. The purpose of the Site visit was to discuss the possible reuse of the Valley property and walk around
the exterior of the Valley building. There were no signs of trespassing, no evidence of homeless activity, and no
signs of unauthorized access to the interior of the building. However, two portions of the pitched roof have
collapsed into the interior of the building and portions of the cinder block wall are deteriorating.
Data Review
This section summarizes data collected during this FYR period. Groundwater monitoring is conducted in
accordance with the 2015 Field Sampling Plan/Quality Assurance Project Plan. Groundwater sampling monitors
the current remedy of natural attenuation and shows the extent of the groundwater plume. During this review
period, sampling for emerging contaminants, 1,4-dioxane and per- and polyfluoroalkyl substances (PFAS), has
been conducted.
TCE, cis-1,2-DCE and vinyl chloride are the only COCs that exceeded the IGCLs during this review period.
It is unclear from the data collected since the shutdown of the groundwater treatment facility whether the remedy
of natural attenuation will be effective in all areas of the plume to attain RAOs. More years of data may need to be
collected to evaluate if natural attenuation is likely to attain RAOs in a reasonable time period.
Constituents have not been detected above the IGCLs in sentinel groundwater wells 3R and 1094, which are
located downgradient of the plume and upgradient from the Groveland drinking water wells. This demonstrates
that the town well is protected.
Source Area and Downgradient Wells
Groundwater monitoring is conducted at the source area and downgradient of the source area to the north. During
this review period, quarterly groundwater monitoring was conducted for all VOCs through 2017. Beginning in
2018, sampling was reduced to an annual comprehensive monitoring event conducted in the fall with quarterly
groundwater monitoring for sentinel wells.
In general, TCE concentrations in the source area continue to exhibit a downward trend when compared to
concentrations prior to and immediately following completion of ISTT in 2011 and groundwater treatment facility
shutdown in April 2014. The only contaminants that continue to exceed IGCLs are TCE, cis-1,2-DCE and vinyl
chloride. Table 7 shows maximum concentrations of these contaminants during this review period.
4 Well 3R is shown in Figure 3. Well 109 is in the same location, but not shown on Figure 3 because of the extent.

20
Table 7: Maximum Concentrations of TCE, Cis-1,2-DCE and Vinyl Chloride
Contaminant IGCL
(µg/L)
2015 Maximum
Concentration
(µg/L)
2016 Maximum
Concentration
(µg/L)
2017 Maximum
Concentration
(µg/L)
2018 Maximum
Concentration
(µg/L)
TCE 5 52 (TW-24) 37 (TW-24) 39 (TW-24) 16 (EW-S1, EW-
S4, EW-S5)
Cis-1,2-DCE 70 420 (EW-M3) 420 (EW-M3) 390 (EW-M3) 410 (EW-M3)
Vinyl chloride 2 6.1 (ERT-9) 4.4 (ERT-9) 7.1 (ERT-9) 3.1 (ERT-9)
Notes:
Bold = concentration exceeds IGCL
Source: 2015-2016 Annual Report Table 6-1 and 6-2; 2017 Annual Report Table 6-1 and 6-2; 2018 Annual Report
Table 6-1.
TCE
The TCE overburden groundwater plume has been reduced significantly since cleanup began (see Figure 3).
During groundwater treatment facility operation, the overburden TCE plume was reduced in size by about 95%,
from 36 acres in 2000 to 1.8 acres in 2013. Following shutdown of the groundwater treatment facility in 2014, the
plume expanded to approximately 4.59 acres in fall 2015 and has decreased slightly to about 4.21 acres based on
fall 2017 and fall 2018 data.
In 2018, of the 35 wells sampled, 17 wells exceeded the 5 µg/L TCE IGCL. Figure 4 shows the approximate
location of the current TCE plume in the bedrock in 2018. The bedrock TCE plume in fall 2018 extends from the
source area north to just beyond bedrock monitoring well ERT-9 and bedrock extraction well EW-M3. This is
consistent with groundwater flow direction and generally consistent with the estimated limits of the plume prior to
groundwater treatment facility shutdown, except that the plume appears to extend a short distance beyond
extraction well EW-M3, which may have previously captured contaminant flow at the northeast extent of the
plume.
Cis-1,2-DCE
One (EW-M3) of the 35 wells sampled in 2018 exceeded the 70 µg/L cis-1,2-DCE IGCL. Figure 5 shows a trend
of TCE and cis-1,2-DCE in EW-M3. It is located downgradient of the source area. . This well has exceeded the
IGCL for TCE and cis-1,2-DCE since July 2014. The 2015 FYR suggested that the pumping at EW-S4 caused
significant contaminant dilution in the samples collected during pumping. Post shutdown samples are collected
using passive diffusion samples and likely represent the undiluted groundwater present under non-pumping
conditions. The 2018 Annual Report says that the values indicate that some contaminated groundwater was likely
migrating in the bedrock beneath Mill Pond. Continued long-term monitoring at the Site will provide a better
understanding of contaminated groundwater flow through bedrock in the areas downgradient of the source area.
Given the consistent concentrations of cis-1,2-DCE observed in this well during this review period, more years of
data may need to be collected to evaluate if natural attenuation is likely to attain RAOs in a reasonable time
period.
Downgradient bedrock well 108 has remained stable with respect to TCE and cis-1,2-DCE concentrations during
this time period (Table D-2).
Vinyl chloride
Vinyl chloride exceeded the 2 µg/L IGCL at one well in 2018 with a concentration of 3.1 µg/L at ERT-09 (Table
D-1).
PFAS
The fall 2018 groundwater sampling event included analyses for PFAS to evaluate whether and to what degree
they are present on site. Table 8 shows the results of PFAS sampling at the Site. PFAS are present on site below
EPA groundwater screening levels. In 2018, PFAS was not detected in the sentinel groundwater monitoring wells.

21
Table 8: 2018 PFAS Sampling
Well EPA Screening Level
Values (ppt)
PFAS (ng/L)
RW-03 40 4.8 (PFOA)
2.4 (PFOS)
RW-05 40 5.6 (PFOA)
5.0 (PFOS)
RW-10B 40 3.8 (PFHxA)
5.2 (PFOA)
ME-10D 40 4.9 (PFHxA)
2.5 (PFHpA)
7.9 (PFOA)
2.1 (PFOS)
3R 40 None detected
109 40 None detected
Source: Table 6-4 of the 2018 Annual Groundwater Monitoring Report for
the Site, prepared for MassDEP.
1,4-Dioxane
1,4-Dioxane was not detected during this review period. Detection limits ranged from 0.5 to 250 µg/L. In 2018,
1,4-dioxane detection limits in the sentinel wells was 0.5 µg/L. EPA has not established an MCL for 1,4-dioxane
in drinking water, EPA’s tapwater regional screening level (RSL) is 0.46 µg/L based on a 1 x 10⁻⁶ cancer risk and
57 µg/L based on noncarcinogenic hazard of 1.
Monitoring of Natural Attenuation Parameters
The annual reports summarize fall 2015, 2016 and 2017 analyses for natural attenuation parameters to evaluate
whether and to what degree natural attenuation of contaminants is occurring within the contaminant plume. The
reports say that the results of the screening process indicate that the potential for natural biodegradation is highly
variable across the Site. The 2017 Annual Report summarizes that there is evidence to suggest that anaerobic
degradation of TCE is occurring in some limited downgradient areas of the Site. The source area and the area
immediately downgradient do not currently exhibit favorable conditions for natural anaerobic reduction of
contaminants. The report says that this may be in part caused by the ISTT conducted in the source area in 2010
and 2011, which likely killed off resident populations of bacteria present prior to treatment and decreased the
natural organic content in source area soils. Natural attenuation parameters were not collected or evaluated in the
2018 Annual Report.

22
Figure 3: Overburden TCE Plume5
Disclaimer: This map and any boundary lines within the map are approximate and subject to change. The map is not a survey. The map is for informational purposes only regarding EPA’s response actions at the Site.
5 Figure 8-8 of the 2018 Annual Monitoring Report.

23
Figure 4: Bedrock TCE Plume6
6 Figure 6-2 of the 2018 Annual Monitoring Report.

24
Figure 5: TCE and 1,2-DCE Concentrations at Bedrock Well EW-M37
7 Figure 8-7 of the 2018 Annual Monitoring Report.
25
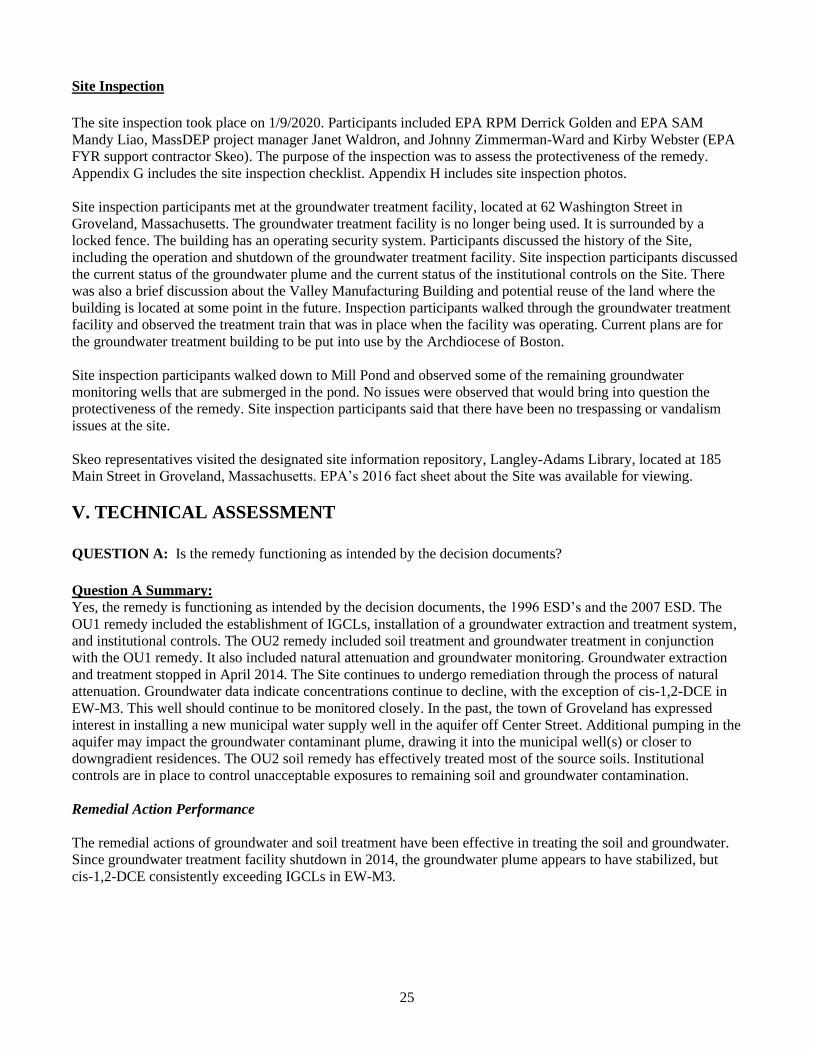
Site Inspection
The site inspection took place on 1/9/2020. Participants included EPA RPM Derrick Golden and EPA SAM
Mandy Liao, MassDEP project manager Janet Waldron, and Johnny Zimmerman-Ward and Kirby Webster (EPA
FYR support contractor Skeo). The purpose of the inspection was to assess the protectiveness of the remedy.
Appendix G includes the site inspection checklist. Appendix H includes site inspection photos.
Site inspection participants met at the groundwater treatment facility, located at 62 Washington Street in
Groveland, Massachusetts. The groundwater treatment facility is no longer being used. It is surrounded by a
locked fence. The building has an operating security system. Participants discussed the history of the Site,
including the operation and shutdown of the groundwater treatment facility. Site inspection participants discussed
the current status of the groundwater plume and the current status of the institutional controls on the Site. There
was also a brief discussion about the Valley Manufacturing Building and potential reuse of the land where the
building is located at some point in the future. Inspection participants walked through the groundwater treatment
facility and observed the treatment train that was in place when the facility was operating. Current plans are for
the groundwater treatment building to be put into use by the Archdiocese of Boston.
Site inspection participants walked down to Mill Pond and observed some of the remaining groundwater
monitoring wells that are submerged in the pond. No issues were observed that would bring into question the
protectiveness of the remedy. Site inspection participants said that there have been no trespassing or vandalism
issues at the site.
Skeo representatives visited the designated site information repository, Langley-Adams Library, located at 185
Main Street in Groveland, Massachusetts. EPA’s 2016 fact sheet about the Site was available for viewing.
V. TECHNICAL ASSESSMENT
QUESTION A: Is the remedy functioning as intended by the decision documents?
Question A Summary:
Yes, the remedy is functioning as intended by the decision documents, the 1996 ESD’s and the 2007 ESD. The
OU1 remedy included the establishment of IGCLs, installation of a groundwater extraction and treatment system,
and institutional controls. The OU2 remedy included soil treatment and groundwater treatment in conjunction
with the OU1 remedy. It also included natural attenuation and groundwater monitoring. Groundwater extraction
and treatment stopped in April 2014. The Site continues to undergo remediation through the process of natural
attenuation. Groundwater data indicate concentrations continue to decline, with the exception of cis-1,2-DCE in
EW-M3. This well should continue to be monitored closely. In the past, the town of Groveland has expressed
interest in installing a new municipal water supply well in the aquifer off Center Street. Additional pumping in the
aquifer may impact the groundwater contaminant plume, drawing it into the municipal well(s) or closer to
downgradient residences. The OU2 soil remedy has effectively treated most of the source soils. Institutional
controls are in place to control unacceptable exposures to remaining soil and groundwater contamination.
Remedial Action Performance
The remedial actions of groundwater and soil treatment have been effective in treating the soil and groundwater.
Since groundwater treatment facility shutdown in 2014, the groundwater plume appears to have stabilized, but
cis-1,2-DCE consistently exceeding IGCLs in EW-M3.

26
System Operations/O&M
Current O&M activities indicate procedures are working in a manner that will continue to maintain the
effectiveness of the remedy. In 2018, groundwater sampling was reduced from quarterly to annual. Sentinel wells
continue to be monitored quarterly.
Implementation of Institutional Controls and Other Measures
The Site is located in the town of Groveland Aquifer Protection District. The groundwater plume extends into the
area where the town of Groveland bylaws require special permitting for groundwater withdrawal. Institutional
controls, in the form of Grants of Environmental Restrictions and Easement, have been put in place on three site
properties: 46 Washington Street, 64 Washington Street and 114 Center Street. In order to ensure compliance with
Institutional Controls in place at the Site, the public should refer to the IC section of the Groveland Wells
Superfund Site Profile Page at
https://cumulis.epa.gov/supercpad/SiteProfiles/index.cfm?fuseaction=second.redevelop&id=0100750#Limits.
The information contains the actual IC legal instruments in place at the Site that are necessary to ensure that the
Site remains protective of human health, and a form by which the public may request additional assistance.
QUESTION B: Are the exposure assumptions, toxicity data, cleanup levels and remedial action objectives
(RAOs) used at the time of the remedy selection still valid?
Question B Summary:
No. There have been changes in toxicity values, exposure assumptions, exposure pathways and methods of
evaluating risk, potential standards, and TBCs since the 1988 and 1991 RODs and subsequent ESDs were issued
as discussed below. The changes as described below are not expected to alter the protectiveness of the remedy
because of availability of public water and ICs in place preventing use of Site-impacted groundwater.
Changes in Standards and TBCs
While there have been some changes in groundwater standards, none of the changes could call into question the
protectiveness of the remedy (Appendix I). In addition, there are currently no completed exposure pathways. At
such time that interim groundwater cleanup levels have been attained, the 1991 OU1 ROD indicates that a risk
evaluation will be performed to determine whether the remedial action is protective.
Appendix J provides a screening level risk review of soil cleanup goals. The cleanup levels used at the time of the
remedy are still valid.
PFAS:
In May 2016, EPA issued final lifetime drinking water HA for PFOA and PFOS. The EPA HA for PFOA and
PFOS is 70 nanogram per liter (ng/L) or part per trillion (ppt) individually or combined. See also EPA’s
Interim Recommendations to Address Groundwater Contaminated with Perfluorooctanoic Acid and
Pefluorooctanesulfonate [OSWER DIRECTIVE 9283.1-47, Dec. 19, 2019]
In June 2019, MassDEP established an Office of Research and Standards Guideline (ORSG) level for drinking
water that extended the EPA advisory to include PFOS, PFOA, perfluorononanoic acid (PFNA),
perfluorohexane sulfonic acid (PFHxS), and perfluoroheptanoic acid (PFHpA). The ORSG level is 70 ng/L
(ppt) and applies to the total summed level of all five compounds. MassDEP has proposed an MMCL of 20
ng/L (ppt) for these five compounds plus PFDA; public comment closed in February 2020.

27
1,4 Dioxane:
Using 2013 updated IRIS toxicity information and the standard Superfund risk assessment approach, EPA’s
carcinogenic risk range of 10-6 to 10-4 for 1,4-dioxane equates to a concentration range of 0.46 to 46 micrograms
per liter (µg/L) (parts per billion (ppb)).
Changes in Toxicity and Other Contaminant Characteristics
• 2016 PFOA/PFOS non-cancer toxicity values
In May 2016, EPA issued final lifetime drinking water health advisories for PFOA and PFOS, which identified a
chronic oral reference dose (RfD) of 2 x 10⁻⁵ mg/kg-day for PFOA and PFOS (USEPA, 2016). These RfD values
should be used when evaluating potential risks from ingestion of contaminated groundwater at Superfund sites
where PFOA and PFOS might be present based on site history. Potential estimated health risks from PFOA and
PFOS, if identified, would likely increase total site risks due to groundwater exposure. Further evaluation of
potential risks from exposure to PFOA and PFOS in other media at the Site might be needed based on site
conditions and may also affect total site risks.
• 2014 Perfluorobutanesulfonic Acid (PFBS) non-cancer toxicity value
PFBS has a chronic oral RfD of 2E-02 mg/kg-day based on an EPA Provisional Peer Reviewed Toxicity Value
(PPRTV) (USEPA, 2014a). This RfD value should be used when evaluating potential risks from ingestion of
contaminated groundwater at Superfund sites where PFBS might be present based on-site history. Potential
estimated health risks from PFBS, if identified, would likely increase total site risks due to groundwater exposure.
Further evaluation of potential risks from exposure to PFBS in other media at the Site might be needed based on
Site conditions and can also affect total site risks.
PFAS at the Groveland NPL Site:
The fall 2018 groundwater sampling event included analyses for PFAS to evaluate whether and to what degree it
is present on site. PFAS is present on site below EPA’s groundwater screening level of 40 ppt. PFAS is not
present in the sentinel wells and detections of PFAS do not impact the protectiveness of the remedy because
public water is available and ICs are in place preventing exposure to groundwater.
Changes in Risk Assessment Methods
• 2014 OSWER Directive Determining Groundwater Exposure Point Concentrations, Supplemental
Guidance
In 2014, EPA finalized a Directive to determine groundwater exposure point concentrations (EPCs)
https://cfpub.epa.gov/ncea/risk/recordisplay.cfm?deid=236917. This Directive provides recommendations to
develop groundwater EPCs. The recommendations to calculate the 95% upper confidence limit of the arithmetic
mean concentration for each contaminant from wells within the core/center of the plume, using the statistical
software ProUCL, could result in lower groundwater EPCs than the maximum concentrations routinely used for
EPCs as past practice in risk assessment, leading to changes in groundwater risk screening and evaluation. In
general, this approach could result in slightly lower risk or higher screening levels (Reference: EPA. 2014.
Human Health Evaluation Manual, Supplemental Guidance: Update of Standard Default Exposure Factors.
OSWER Directive 9200.1- 120. February 6, 2014.)

28
Changes in Exposure Pathways
• 2014 OSWER Directive on the Update of Standard Default Exposure Factors
In 2014, EPA finalized a Directive to update standard default exposure factors and frequently asked questions
associated with these updates. https://www.epa.gov/sites/production/files/2015-
11/documents/oswer_directive_9200.1-120_exposurefactors_corrected2.pdf. Many of these exposure factors
differ from those used in the risk assessment(s) supporting the ROD(s). These changes in general would result in a
slight decrease of the risk estimates for most chemicals. (Reference: USEPA. 2014. Human Health Evaluation
Manual, Supplemental Guidance: Update of Standard Default Exposure Factors. OSWER Directive 9200.1-120.
February 6, 2014.)
• 2018 EPA VISL Calculator
In February 2018, EPA launched an online Vapor Intrusion Screening Level (VISL) calculator, which can be used
to obtain risk-based screening level concentrations for groundwater, sub-slab soil gas, and indoor air. The VISL
calculator uses the same database as the RSLs for toxicity values and physiochemical parameters and is
automatically updated during the semi-annual RSL updates. Please see the User’s Guide for further details on how
to use the VISL calculator. https://www.epa.gov/vaporintrusion/vapor-intrusion-screening-level-calculator.
Vapor intrusion (VI) was not identified as an exposure pathway in the original risk assessment; however, has
since been identified as a potential exposure concern if a residential or commercial/industrial building were to be
built above the most contaminated portion of the groundwater plume. Appendix J includes a VI screening for the
groundwater data collected in 2018. The screening results indicate that a complete VI pathway would not result
in unacceptable risks for a commercial/industrial worker; however unacceptable risks for a future resident could
occur if a VI pathway were to become complete. A Grant of Environmental Restrictions and Easement currently
restricts residential and agricultural use of this property. If land use were to change at the Site, additional lines of
evidence may be needed to determine if the vapor intrusion pathway is a complete exposure pathway.
Expected Progress Toward Meeting RAOs
The remedy has been progressing as expected toward meeting RAOs. The only RAO that has not yet been met is
to restore the groundwater quality to meet federal and state drinking water standards or goals, as well as other
ARARs and/or protective levels. It is unclear from data collected since shutdown of the groundwater treatment
facility whether the remedy of natural attenuation will be effective in all areas of the plume to attain RAOs. More
years of data may need to be collected to evaluate if natural attenuation is likely to attain RAOs in a reasonable
time period.
QUESTION C: Has any other information come to light that could call into question the protectiveness of the
remedy?
No other information has come to light that could call into question the protectiveness of the remedy.

29
VI. ISSUES/RECOMMENDATIONS
Issues/Recommendations
OU(s) without Issues/Recommendations Identified in the FYR:
OU2
Issues and Recommendations Identified in the FYR:
OU(s): 1 Issue Category: Other
Issue: The town of Groveland may be interested in installing a new municipal
water supply well in the Center Street aquifer. Additional pumping in the aquifer
may impact the groundwater contaminant plume, drawing it into the municipal
well(s) or closer to downgradient residences.
Recommendation: Continue to require the town of Groveland to evaluate all
potential impacts of additional aquifer pumping prior to implementing any
changes.
Affect Current
Protectiveness
Affect Future
Protectiveness
Party
Responsible
Oversight Party Milestone Date
No Yes Other EPA/State 6/30/2023
VII. PROTECTIVENESS STATEMENT
Protectiveness Statement
Operable Unit:
1
Protectiveness Determination:
Short-term Protective
Protectiveness Statement:
The remedy at OU1 currently protects human health and the environment because there are no completed
exposure pathways to remaining contaminated groundwater. However, in order for the remedy to be
protective in the long term, the following action needs to be taken: continue to require the town of
Groveland to evaluate all potential impacts of additional aquifer pumping prior to implementing any
changes to ensure protectiveness.
Protectiveness Statement
Operable Unit:
2
Protectiveness Determination:
Protective
Protectiveness Statement:
The remedy at OU2 is protective of human health and the environment. Remedial components for OU2
have been completed and RAOs have been met for this OU.

30
Sitewide Protectiveness Statement
Protectiveness Determination:
Short-term Protective
Protectiveness Statement:
The remedy at the Site currently protects human health and the environment because there are no
completed exposure pathways to remaining contamination. However, in order for the remedy to be
protective in the long term, the following action needs to be taken: continue to require the town of
Groveland to evaluate all potential impacts of additional aquifer pumping prior to implementing any
changes to ensure protectiveness.
VIII. NEXT REVIEW
The next FYR Report for the Groveland Wells Superfund site is required five years from the completion date of
this review, in June of 2025.

A-1
APPENDIX A – REFERENCE LIST
2015-2016 Data Evaluation Report. Groveland Wells Superfund Site. Long Term Groundwater Monitoring.
Prepared for Massachusetts Department of Environmental Protection by Nobis Engineering. May 3, 2017.
2017 Data Evaluation Report. Groveland Wells Superfund Site. Long Term Groundwater Monitoring. Prepared
for Massachusetts Department of Environmental Protection by Nobis Engineering, Inc. February 2018.
2018 Groundwater Data Evaluation Report. Groveland Wells Superfund Site. Long Term Groundwater
Monitoring. Prepared for Massachusetts Department of Environmental Protection by Nobis Group. February
2019.
Data Evaluation Report for Remedial Action. Spring 2003 Monitoring Round. Groveland Wells Nos. 1 and 2
Superfund Site Operable Unit No. 1. Groveland, Massachusetts. Prepared by Metcalf & Eddy. December 2003.
Declaration for the Record of Decision. Groveland Wells Nos. 1 & 2, Operable Unit 1. Groveland, Massachusetts.
EPA Region 1. September 30, 1991.
Explanation of Significant Differences (ESD). Groveland Wells Nos. 1 & 2 Superfund Site. Source
Control/Operable Unit II. U.S. Environmental Protection Agency. Region 1 – New England. September 2007.
Federal Reserve Notice on the 2016 Health Advisories for PFOA and PFOS. Ground Water and Drinking Water.
U.S. EPA. May 25, 2016.
Final Explanation of Significant Differences. Management of Migration Operable Unit. Groveland Wells Nos. 1
& 2 Site. U.S. EPA Office of Site Remediation and Restoration. November 15, 1996.
Final Explanation of Significant Differences. Source Control Operable Unit. Groveland Wells Nos. 1 & 2 Site.
U.S. EPA Office of Site Remediation and Restoration. November 15, 1996.
Five-Year Review Report for Groveland Wells Nos. 1 & 2 Superfund Site. Groveland, Essex County,
Massachusetts. Prepared by: United States Environmental Protection Agency, Region 1, Boston, Massachusetts.
June 2005.
Optimization Review. Groveland Wells Number 1 and 2 Superfund Site. Town of Groveland, Essex County,
Massachusetts. United States Environmental Protection Agency. Office of Solid Waste and Emergency Response.
January 2013.
Remedial Action. Volume I – Text, Tables, and Figures. Groveland Wells Superfund Site – Operable Unit 2.
Prepared by Nobis Engineering, Inc. for US Environmental Protection Agency Region 1. September 2011.
Second Five-Year Review Report for Groveland Wells Numbers 1 and 2. Groveland, Massachusetts. Prepared by
The United States Environmental Protection Agency, Region 1, New England, Boston, Massachusetts. June 2010.
Superfund Record of Decision, Groveland Wells, MA. First Remedial Action. U.S. Environmental Protection
Agency. September 30, 1988.
Technical Memorandum. Decision Framework for Pump and Treat (P&T) Shutdown Based on Optimization
Review Groveland Wells Number 1 and 2 Superfund Site. EPA ERT. December 12, 2013.
Third Five-Year Review Report for Groveland Wells Numbers 1 and 2 Superfund Site. Groveland,
Massachusetts. U.S. Environmental Protection Agency, Region 1, Boston, Massachusetts. June 29, 2015.

B-1
APPENDIX B – SITE CHRONOLOGY
Table B-1: Site Chronology
Event Date
GRC leased property at 64 Washington Street in Groveland to house a
metal products manufacturing plant
May 1963
GRC began metal products manufacturing operations May 1963
Groveland municipal well Station No. 1 put into operation 1965
GRC purchased property at 64 Washington Street in Groveland November 1966
Groveland municipal well Station No. 2 put into operation 1973
TCE detected in Station No. 1; well was shut down May 1979
Valley Manufactured Products acquired GRC’s manufacturing operations August 1979
TCE detected in Station No. 2; Groveland municipal well Station No. 3
put into operation
September 1979
Station No. 2 permanently shut down October 1979
EPA added the Site to the NPL December 1982
Valley completed OU1 RI 1985
Valley completed OU1 FS August 1986
MassDEP issued amendment to 1984 consent order requiring
Valley/GRC to construct a groundwater interceptor treatment unit north
of Mill Pond
1986
Activated carbon treatment system installed and Station No. 1 reactivated 1987
EPA issued consent order to Valley and GRC to conduct a supplemental
RI
September 1987
Pilot study conducted of soil vapor vacuum extraction system at OU2 Late 1987 – Early 1988
Valley/GRC installed Mill Pond groundwater extraction/treatment
system
April 1988
Valley/GRC subcontractor completed the Final Phase I Supplemental RI
Report
July 1988
EPA subcontractors completed the supplemental FS for the Valley
property
August 1988
EPA signed the OU2 ROD September 1988
EPA subcontractor completed supplemental OU1 RI Report February 1991
EPA subcontractor completed the supplemental OU1 FS July 1991
EPA signed the OU1 ROD September 1991
EPA issued an Administrative Order to Valley/GRC to remediate soil
and groundwater at OU2
March 1992
EPA issued an Administrative Order to Valley/GRC to remediate
groundwater contamination that had migrated beyond the Valley property
May 1992
Valley/GRC informed EPA that they could not comply with the
Administrative Order to remediate OU1
June 1992
EPA issued a Notice of Failure to Comply to Valley/GRC for failure to
initiate work to remediate OU1
August 1992
EPA approved the SVE and groundwater treatment system design for the
Valley property
August 1992
Valley/GRC informed EPA that they could not continue to comply with
the Administrative Order for remediation of OU2
October 1992
EPA issued a Notice of Failure to Comply to Valley/GRC for failure to
continue OU2 remedial work
November 1992
EPA learned that the SVE system had been constructed and was in
operation
December 1992
EPA issued a Second Notice of Failure to Comply to Valley/GRC for
failure to submit monthly progress reports on the SVE system
January 1993
Town took activated carbon treatment system at Station No. 1 offline,
with approval from MassDEP, because TCE contamination had not been
detected in the influent water since 1989
May 1994

B-2
Event Date
Valley/GRC began routine submission of monthly progress reports to
EPA
June 1994
EPA approved the 100% design for the OU1 groundwater extraction and
treatment system
January 1995
EPA put construction of the OU1 groundwater extraction and treatment
facility on hold because of budget constraints
Spring 1995
EPA conducted sampling of 22 monitoring wells and determined that the
plume had decreased in extent
March 1996
EPA issued ESDs for OU1 and OU2, modifying the remedies to treat
groundwater from both OUs in a combined facility
August 1996
EPA approved the final design for the combined facility April 1997
Mobilization and site clearing began for the combined facility April 1999
New groundwater extraction and treatment system started up and Mill
Pond system was shut down
April 2000
Routine O&M activities for groundwater extraction and treatment system
began
May 2000
Remedial action subcontractor submitted Operational and Functional
Completion Report and certification to EPA
September 2000
Operational and Functional Completion Report and certification
submitted to EPA and revised to address MassDEP comments
March 2001
Valley ceases manufacturing operations 2001
SVE system shut down and abandoned by responsible parties April 2002
Remedial System Evaluation Report completed for the groundwater
treatment facility
September 2002
EPA initiated source area re-evaluation April 2004
EPA issued Site’s first FYR Report June 26, 2005
EPA performed chemical oxidation pilot study as part of the source area
re-evaluation
2006
EPA removed six USTs and the Brite Dip system leaching field from
Valley property
August 2006
EPA source area re-evaluation completed; report recommended using
thermal treatment technologies to treat residual contamination in the
source area
September 2006
EPA issued an ESD outlining the enhancement of the existing SVE
system with a thermal treatment system; the ESD was also written to
address the recalculation of the soil cleanup levels originally specified in
the 1988 ROD
September 2007
EPA and Valley GRC entered into a Consent Decree stating Valley/GRC
will pay the government 100% of the net sale or net lease proceeds from
the property
January 2008
Construction of the enhanced OU2 source control remedial action began
with site clearing and surveying
April 2009
Construction of the ISTT system began March 2010
EPA issued Site’s second FYR Report June 29, 2010
ISTT construction completed and ISTT system startup in source area August 2010
Completion of ISTT remediation of source area soil and overburden
groundwater
February 2011
Completion of confirmatory soil and groundwater sampling for OU2
remedial action
August 2011
MassDEP shut down the groundwater treatment facility with concurrence
from EPA
April 2014
The EPA issued the Site’s third FYR Report June 29, 2015
EPA begins the fourth FYR Report December 2019
MassDEP dismantles and auctions the groundwater treatment system
equipment
January 2020

C-1
APPENDIX C – SITE MAPS
Figure C-1: Source Area Layout8
8 Figure 1-2 from the OU2 Final Remedial Action Report.

D-1
APPENDIX D – DATA TABLES
Table D-1: Summary Statistics for 20189
9 Table 6-1 from the 2018 Final Data Evaluation Report. Nobis Engineering.

D-2
Table D-2: TCE and cis-1,2-DCE from 2009-201810
10 Table 6-2 and 6-3 from the 2018 Final Data Evaluation Report. Nobis Engineering.

D-3

D-4
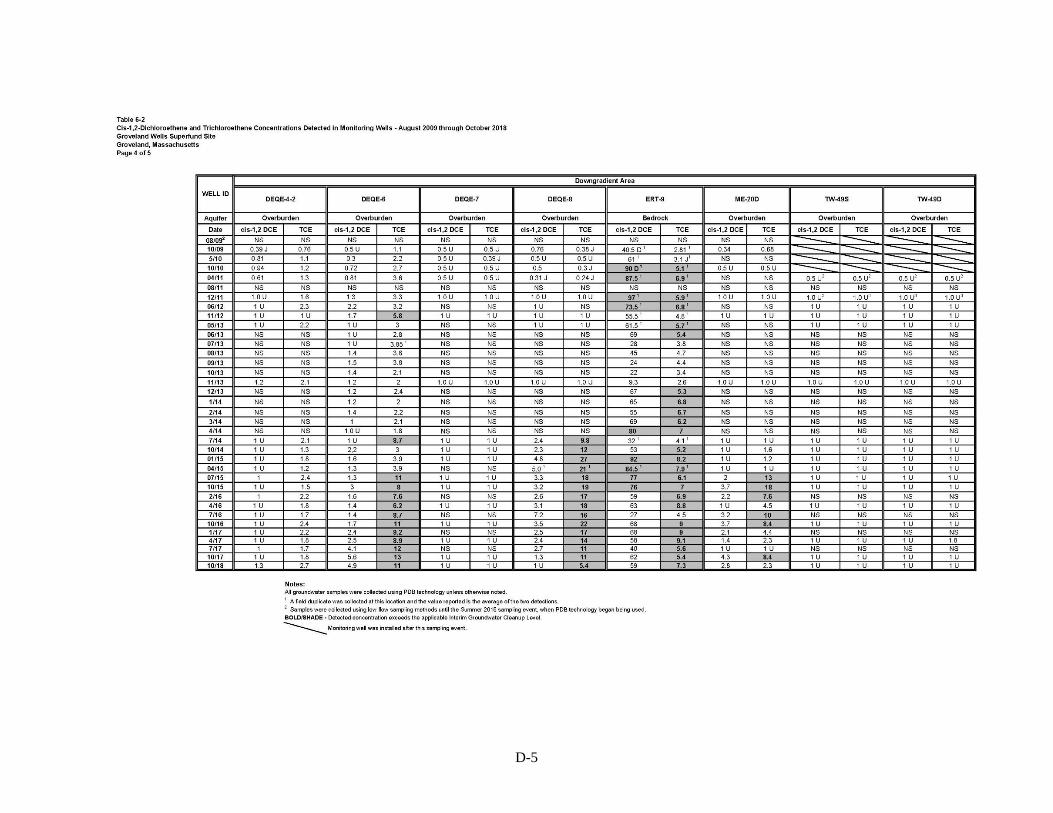
D-5

D-6

D-7

D-8

E-1
APPENDIX E – PRESS RELEASE

E-2

F-1
APPENDIX F – INTERVIEW FORMS
GROVELAND WELLS SUPERFUND SITE
FIVE-YEAR REVIEW INTERVIEW FORM
Site Name: Groveland Wells
EPA ID: MAD980732317
Interviewer name: NA Interviewer affiliation:
Subject name: Janet Waldron Subject affiliation: MassDEP
Subject contact information: 617-556-1156
Interview date: 2/20/2020 Interview time:
Interview location:
Interview format (circle one): In Person Phone Mail Email Other:
Interview category: State Agency
1. What is your overall impression of the project? (general sentiment)
The project has gone quite well once the source of contamination was mostly eliminated.
2. Are you aware of any community concerns or complaints related to the Superfund site (e.g., odor, noise,
health, etc.)?
The only concern I am aware of is the Valley building itself. The building has been condemned by the local
Fire Department. The roof is falling in.
3. Do you feel well informed about site activities and progress of the cleanup?
Yes.
4. Are there any areas of known or suspected contamination at the site that you feel are not being adequately
addressed by the remedial actions?
No.
5. Are you aware of any changes in land use in the vicinity of the site?
No.
6. Are you aware of trespassers entering the property, and if yes, how often and in what type of activities do they
engage?
No.
7. Are you aware of the Institutional Controls (ICs) associated with the site, which prohibit certain activities (no
residential use, no extraction of groundwater, no disturbance of the remedy) at: 46, 62 & 64 Washington
Streets?
Yes.
8. Do you have any other comments, questions or concerns regarding the site?
The potential for a future municipal well downgradient of the source area could be a concern if the well were
to be located in bedrock. There is still bedrock contamination found at the Site, and the bedrock itself has not
been well defined (no modeling, investigation of fractures, etc.).
9. Do you consent to have your name included along with your responses to this questionnaire in the FYR
report?
Yes.

F-2
GROVELAND WELLS SUPERFUND SITE
FIVE-YEAR REVIEW INTERVIEW FORM
Site Name: Groveland Wells
EPA ID: MAD980732317
Subject name: Subject affiliation: MassDEP Contractor
Subject contact information: P:978-703-6014 Email: [email protected]
Interview date: 1/15/2020 Interview time:0830
Interview location: NA
Interview format (circle one): In Person Phone Mail Email Other:
Interview category: O&M Contractor
1. What is your overall impression of the project, including cleanup, maintenance and reuse activities
(as appropriate)?
A: Overall, I think the project is a Superfund success story. Source Area in-situ thermal treatment
(ISTT) performed in 2010 through 2011 significantly reduced concentrations of VOCs to a level that
permitted the shutdown of the groundwater treatment facility (GWTF).
2. What is your assessment of the current performance of the remedy in place at the Site?
A: Nobis has been performing long term groundwater monitoring at the Site since the completion of
the Source Area ISTT in 2011. Concentrations of VOCs in groundwater have remained steady
during that time and the Site has transitioned from active pump and treat to long term groundwater
monitoring remedy. Our ongoing evaluation of groundwater sampling results indicates that the
current remedy is protective of human health and the environment.
3. What are the findings from the monitoring data? What are the key trends in contaminant levels that
are being documented over time at the Site?
A: Overall, TCE concentrations in source area monitoring wells and extraction wells during the most
recent sampling event (Fall 2019) were generally comparable to the concentrations observed in
2018. In general, TCE concentrations in the source area continue to exhibit a downward trend when
compared to concentrations prior to and immediately following ISTT.
TCE and cis-1,2-DCE concentrations in most downgradient monitoring and extraction wells
remained relatively consistent in 2019. TCE concentrations at extraction well EW-S4 increased
sharply (from near the MCL of 5 µg/L to 42 µg/L) when the extraction wells were shut down in
April 2014. Since 2014, TCE concentrations at EW-S4 have remained relatively stable fluctuating
generally between 16 and 36 µg/L. Similar to EW-S4, TCE concentrations at EW-S5 increased
significantly after extraction well shutdown. TCE concentrations were below the MCL during 2016
sampling events, but slightly increased above the MCL in Spring and Fall 2017 and continued to
exceed the MCL in Fall 2018 and Fall 2019. Bedrock extraction well EW-M3 exhibits a similar
trend to that observed at EW-S4 and EW-S5, with a significant increase in TCE and cis-1,2-DCE
following extraction well shutdown in 2014. TCE and cis-1,2-DCE concentrations exceeded the

F-3
MCL and remained relatively consistent throughout the 2015, 2016, 2017, 2018, and 2019
monitoring periods.
TCE is the primary COC that is consistently detected above the MCL in Source Area and
downgradient monitoring wells (overburden and bedrock) since completion of ISTT in 2011. The
overburden TCE plume (TCE concentrations above the MCL, 5 µg/L) extends from the Source Area
north-northeast to the northern portion of Mill Pond, just north of monitoring well DEQE-6. This is
consistent with the groundwater flow direction. The 2019 data indicate that the plume extent has
expanded slightly since GWTF shutdown but has remained relatively consistent since 2015.
The bedrock TCE plume extends from the source area north to just before bedrock monitoring well
ERT-9 and bedrock extraction well EW-M3. This is consistent with groundwater flow direction and
generally consistent with the estimated limits of the plume prior to GWTF shutdown, with the
exception that the plume appears to extend a short distance beyond extraction well EW-M3, which
may have previously captured contaminant flow at the northeast extent of the plume. There is
uncertainty in extent of the TCE plume in bedrock, particularly around EW-M3, because of the
inadequate number and distribution of bedrock wells near and downgradient of Mill Pond, the
absence of nearby wells directly downgradient from EW-M3, and lack of information about the
location and orientation of bedrock fractures through which the contaminant plume may be
migrating. However, based on the relatively low concentrations of TCE in bedrock wells ERT-9 and
EW-M3 and the non-detect or extremely low TCE concentrations detected in bedrock wells 108,
TW-49R, and 103, it appears that the TCE plume dissipates long before reaching the Town water
supply wells or other potential receptors.
The current extent of TCE above the MCL has been reduced significantly when compared to plume
extents in 2000; however, it appears to have expanded slightly since 2013, prior to GWTF shutdown.
The overburden TCE plume was reduced in size by approximately 95%, from 36 acres in 2000 to 1.8
acres in 2013 during GWTF operation. Following shutdown of the GWTF in 2014, the plume
expanded to approximately 4.59 acres in Fall 2015 and decreased slightly to approximately 4.21
acres based on Fall 2017 and Fall 2018 data. With a TCE concentration of 4.9 µg/l at ERT-9 in Fall
2019, the plume decreased slightly to approximately 3.96 acres in Fall 2019.
4. Is there a continuous on-site O&M presence? If so, please describe staff responsibilities and
activities. Alternatively, please describe staff responsibilities and the frequency of site inspections
and activities if there is not a continuous on-site O&M presence.
A: There is no continuous O&M presence at the Site. Nobis performs monthly inspections at the site
and procures subcontractor services to perform routine landscaping maintenance (mowing and
nuisance vegetation removal) and snow removal activities.
5. Have there been any significant changes in site O&M requirements, maintenance schedules or
sampling routines since start-up or in the last five years? If so, do they affect the protectiveness or
effectiveness of the remedy? Please describe changes and impacts.
A: There have been no significant changes to the Site O&M requirements since the last five year
review.
6. Have there been unexpected O&M difficulties or costs at the Site since start-up or in the last five
years? If so, please provide details.

F-4
A: No.
7. Have there been opportunities to optimize O&M activities or sampling efforts? Please describe
changes and any resulting or desired cost savings or improved efficiencies.
A: No. Cost savings measures have been implemented to reduce costs associated with building
maintenance. Nobis is currently supporting MassDEP with efforts to remove old equipment and
supplies from the GWTF building and preparing to transition the building back to the Roman
Catholic Archdiocese of Boston.
8. Do you have any comments, suggestions or recommendations regarding O&M activities and
schedules at the Site?
A: No, O&M activities at the Site have been reduced to the extent feasible.
9. Do you consent to have your name included along with your responses to this questionnaire in the
FYR report?

F-5
GROVELAND WELLS SUPERFUND SITE
FIVE-YEAR REVIEW INTERVIEW FORM
Site Name: Groveland Wells
EPA ID: MAD980732317
Interviewer name: Kirby Webster Interviewer affiliation: EPA Contractor
Subject name: Colin Stokes Subject affiliation: Water and Sewer
Department
Interview date: 1/31/2020 Interview time: 10:45 a.m.
Interview format (circle one): In Person Phone Mail Email Other:
Interview category: Local Government
1. What is your overall impression of the project? (general sentiment)
It has been shut down since I have been in the role as superintendent, so I have not had much interaction,
if any, with it.
2. Are you aware of any community concerns or complaints related to the Superfund site (e.g., odor,
noise, health, etc.)?
I know that the roof is collapsing on the Valley Screw building. I believe the Selectman are in talks with
EPA and various other people about what is going on with the Site.
3. Do you feel well informed about site activities and progress of the cleanup?
Yes.
4. Are there any areas of known or suspected contamination at the Site that you feel are not being
adequately addressed by the remedial actions?
Not that I am aware of.
5. Are you aware of any changes in land use in the vicinity of the Site?
Not that I am aware of.
6. Are you aware of trespassers entering the property, and if yes, how often and in what type of activities
do they engage?
Not to my knowledge.
7. Are you aware of the Institutional Controls (ICs) associated with the site, which prohibit certain
activities (no residential use, no extraction of groundwater, no disturbance of the remedy) at: 46, 62 &
64 Washington Streets?
No.
8. Do you have any other comments, questions or concerns regarding the site?
Not at this time.

F-6
9. Are there any immediate plans to install additional drinking water wells in the vicinity of the Site
and/or plans to increase the withdrawal rate of the existing Town drinking water well No. 1?
No. We are looking at additional well locations but not in that area.
10. Do you consent to have your name included along with your responses to this questionnaire in the
FYR Report?
Yes.

G-1
APPENDIX G – SITE INSPECTION CHECKLIST
FIVE-YEAR REVIEW SITE INSPECTION CHECKLIST
I. SITE INFORMATION
Site Name: Groveland Wells Date of Inspection: 01/09/2020
Location and Region: Groveland, MA 1 EPA ID: MAD980732317
Agency, Office or Company Leading the Five-Year
Review: EPA Weather/Temperature: 27 degrees Fahrenheit/Sunny
Remedy Includes: (Check all that apply)
Landfill cover/containment Monitored natural attenuation
Access controls Groundwater containment
Institutional controls Vertical barrier walls
Groundwater pump and treatment
Surface water collection and treatment
Other: SVE, ISTT
Attachments: Inspection team roster attached Site map attached
II. INTERVIEWS (check all that apply)
1. O&M Site Manager Janet Waldron
Name
MassDEP Project Manager
Title
02/20/2020
Date
Interviewed at site at office by phone Phone:
Problems, suggestions Report attached:
2. O&M Staff Not included
Name
Mass DEP contractor
Title
01/15/2020
Date
Interviewed at site at office by phone Phone:
Problems/suggestions Report attached:
3. Local Regulatory Authorities and Response Agencies (i.e., state and tribal offices, emergency
response office, police department, office of public health or environmental health, zoning office,
recorder of deeds, or other city and county offices). Fill in all that apply.
Agency Water and Sewer Department
Contact Colin Stokes
Name
Superintendent
Title
01/31/2020
Date
Phone No.
Problems/suggestions Report attached:
Agency
Contact Name
Title
Date
Phone No.
Problems/suggestions Report attached:
Agency
Contact
Name
Title
Date
Phone No.
Problems/suggestions Report attached:
Agency
Contact
Name
Title
Date
Phone No.
Problems/suggestions Report attached:
Agency
Contact
Name
Title
Date
Phone No.
Problems/suggestions Report attached:

G-2
4. Other Interviews (optional) Report attached:
III. ON-SITE DOCUMENTS AND RECORDS VERIFIED (check all that apply)
1. O&M Documents
O&M manual Readily available Up to date N/A
As-built drawings Readily available Up to date N/A
Maintenance logs Readily available Up to date N/A
Remarks:
2. Site-Specific Health and Safety Plan Readily available Up to date N/A
Contingency plan/emergency response plan
Readily available Up to date N/A
Remarks:
3. O&M and OSHA Training Records Readily available Up to date N/A
Remarks:
4. Permits and Service Agreements
Air discharge permit Readily available Up to date N/A
Effluent discharge Readily available Up to date N/A
Waste disposal, POTW Readily available Up to date N/A
Other permits: Readily available Up to date N/A
Remarks:
5. Gas Generation Records Readily available Up to date N/A
Remarks:
6. Settlement Monument Records Readily available Up to date N/A
Remarks:
7. Groundwater Monitoring Records Readily available Up to date N/A
Remarks:
8. Leachate Extraction Records Readily available Up to date N/A
Remarks:
9. Discharge Compliance Records
Air Readily available Up to date N/A
Water (effluent) Readily available Up to date N/A
Remarks:
10. Daily Access/Security Logs Readily available Up to date N/A
Remarks:
IV. O&M COSTS

G-3
1. O&M Organization
State in-house Contractor for state
PRP in-house Contractor for PRP
Federal facility in-house Contractor for Federal facility
2. O&M Cost Records
Readily available Up to date
Funding mechanism/agreement in place Unavailable
Original O&M cost estimate: Breakdown attached
Total annual cost by year for review period if available
From:
Date
To:
Date
Total cost
Breakdown attached
From:
Date
To:
Date
Total cost
Breakdown attached
From:
Date
To:
Date
Total cost
Breakdown attached
From:
Date
To:
Date
Total cost
Breakdown attached
From:
Date
To:
Date
Total cost
Breakdown attached
3. Unanticipated or Unusually High O&M Costs during Review Period
Describe costs and reasons:
V. ACCESS AND INSTITUTIONAL CONTROLS Applicable N/A
A. Fencing
1. Fencing Damaged Location shown on site map Gates secured N/A
Remarks:
B. Other Access Restrictions
1. Signs and Other Security Measures Location shown on site map N/A
Remarks:
C. Institutional Controls (ICs)
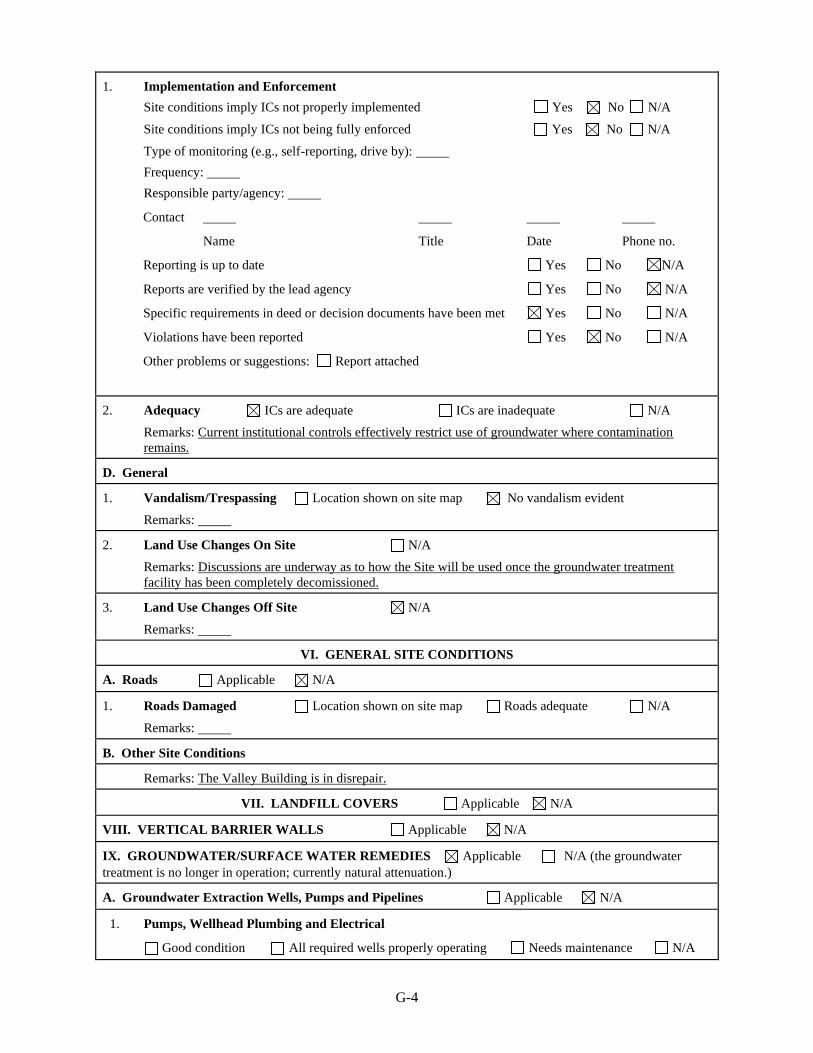
G-4
1. Implementation and Enforcement
Site conditions imply ICs not properly implemented Yes No N/A
Site conditions imply ICs not being fully enforced Yes No N/A
Type of monitoring (e.g., self-reporting, drive by):
Frequency:
Responsible party/agency:
Contact
Name Title Date Phone no.
Reporting is up to date Yes No N/A
Reports are verified by the lead agency Yes No N/A
Specific requirements in deed or decision documents have been met Yes No N/A
Violations have been reported Yes No N/A
Other problems or suggestions: Report attached
2. Adequacy ICs are adequate ICs are inadequate N/A
Remarks: Current institutional controls effectively restrict use of groundwater where contamination
remains.
D. General
1. Vandalism/Trespassing Location shown on site map No vandalism evident
Remarks:
2. Land Use Changes On Site N/A
Remarks: Discussions are underway as to how the Site will be used once the groundwater treatment
facility has been completely decomissioned.
3. Land Use Changes Off Site N/A
Remarks:
VI. GENERAL SITE CONDITIONS
A. Roads Applicable N/A
1. Roads Damaged Location shown on site map Roads adequate N/A
Remarks:
B. Other Site Conditions
Remarks: The Valley Building is in disrepair.
VII. LANDFILL COVERS Applicable N/A
VIII. VERTICAL BARRIER WALLS Applicable N/A
IX. GROUNDWATER/SURFACE WATER REMEDIES Applicable N/A (the groundwater
treatment is no longer in operation; currently natural attenuation.)
A. Groundwater Extraction Wells, Pumps and Pipelines Applicable N/A
1. Pumps, Wellhead Plumbing and Electrical
Good condition All required wells properly operating Needs maintenance N/A

G-5
Remarks:
2. Extraction System Pipelines, Valves, Valve Boxes and Other Appurtenances
Good condition Needs maintenance
Remarks:
3. Spare Parts and Equipment
Readily available Good condition Requires upgrade Needs to be provided
Remarks:
B. Surface Water Collection Structures, Pumps and Pipelines Applicable N/A
1. Collection Structures, Pumps and Electrical
Good condition Needs maintenance
Remarks:
2. Surface Water Collection System Pipelines, Valves, Valve Boxes and Other Appurtenances
Good condition Needs maintenance
Remarks:
3. Spare Parts and Equipment
Readily available Good condition Requires upgrade Needs to be provided
Remarks:
C. Treatment System Applicable N/A
1. Treatment Train (check components that apply)
Metals removal Oil/water separation Bioremediation
Air stripping Carbon adsorbers
Filters:
Additive (e.g., chelation agent, flocculent):
Others:
Good condition Needs maintenance
Sampling ports properly marked and functional
Sampling/maintenance log displayed and up to date
Equipment properly identified
Quantity of groundwater treated annually:
Quantity of surface water treated annually:
Remarks:
2. Electrical Enclosures and Panels (properly rated and functional)
N/A Good condition Needs maintenance
Remarks:
3. Tanks, Vaults, Storage Vessels
N/A Good condition Proper secondary containment Needs maintenance
Remarks:

G-6
4. Discharge Structure and Appurtenances
N/A Good condition Needs maintenance
Remarks:
5. Treatment Building(s)
N/A Good condition (esp. roof and doorways) Needs repair
Chemicals and equipment properly stored
Remarks:
6. Monitoring Wells (pump and treatment remedy)
Properly secured/locked Functioning Routinely sampled Good condition
All required wells located Needs maintenance N/A
Remarks:
D. Monitoring Data
1. Monitoring Data
Is routinely submitted on time Is of acceptable quality
2. Monitoring Data Suggests:
Groundwater plume is effectively contained Contaminant concentrations are declining
E. Monitored Natural Attenuation
1. Monitoring Wells (natural attenuation remedy)
Properly secured/locked Functioning Routinely sampled Good condition
All required wells located Needs maintenance N/A
Remarks: During the site inspection, Mill Pond was flooded and overtook some monitoring wells.
X. OTHER REMEDIES
If there are remedies applied at the site and not covered above, attach an inspection sheet describing the physical
nature and condition of any facility associated with the remedy. An example would be soil vapor extraction.
XI. OVERALL OBSERVATIONS
A. Implementation of the Remedy
Describe issues and observations relating to whether the remedy is effective and functioning as designed.
Begin with a brief statement of what the remedy is designed to accomplish (e.g., to contain contaminant
plume, minimize infiltration and gas emissions).
EPA conducted an optimization study for the Site and developed an exit strategy in 2013 to complete
cleanup actions. The conclusions of the optimization and exit strategy were that active groundwater
extraction and treatment activities could cease because the cleanup removed the mass of residual TCE
contamination in the source area soil. EPA transitioned from active groundwater treatment to natural
attenuation. MassDEP and EPA are decommissioning the groundwater treatment facility.
B. Adequacy of O&M
Describe issues and observations related to the implementation and scope of O&M procedures. In
particular, discuss their relationship to the current and long-term protectiveness of the remedy.
Currently only natural attenuation is taking place, which only requires groundwater monitoring, which is
performed regularly.
C. Early Indicators of Potential Remedy Problems
Describe issues and observations such as unexpected changes in the cost or scope of O&M or a high
frequency of unscheduled repairs that suggest that the protectiveness of the remedy may be compromised
in the future.
None.
D. Opportunities for Optimization

G-7
Describe possible opportunities for optimization in monitoring tasks or the operation of the remedy.
None.

H-1
APPENDIX H – SITE INSPECTION PHOTOS
Signage at entrance of fenced groundwater treatment facility building
Groundwater treatment facility building

H-2
Interior of groundwater treatment facility building
Signage on fence between groundwater treatment facility building and Mill Pond

H-3
Mill Pond
Monitoring well in Mill Pond, which is higher than normal

H-4
Fenced extraction well near Mill Pond
Northern end of Valley Manufacturing Building
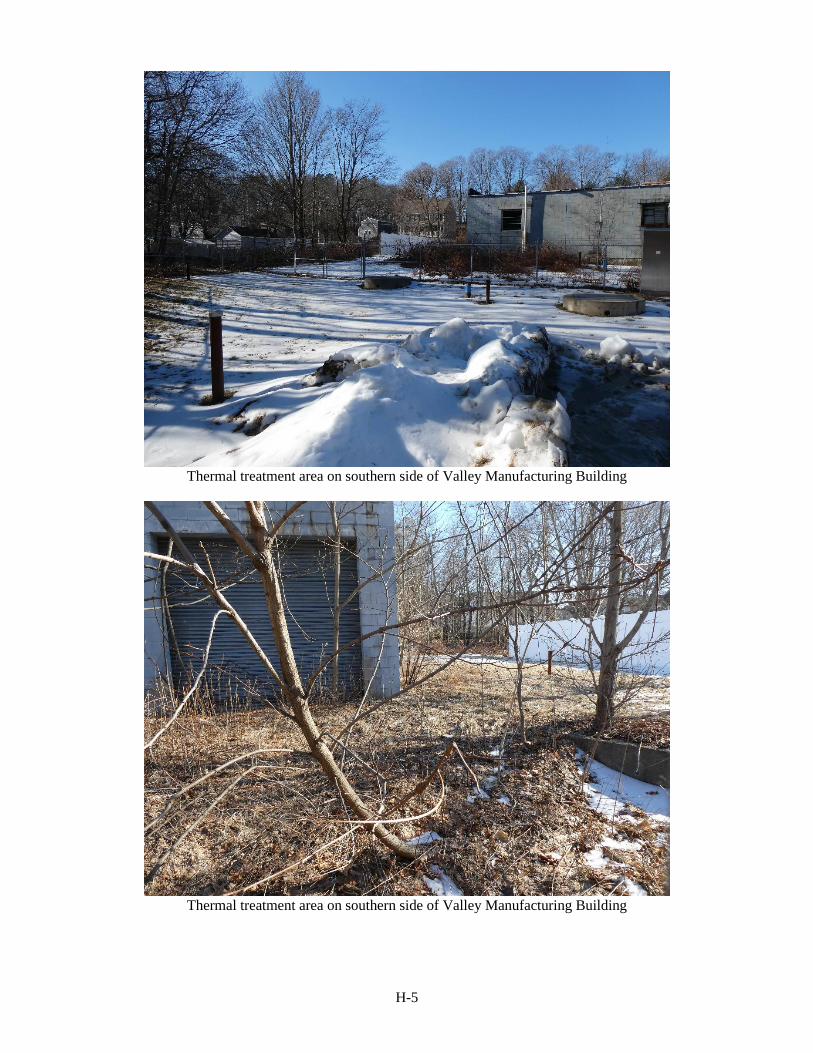
H-5
Thermal treatment area on southern side of Valley Manufacturing Building
Thermal treatment area on southern side of Valley Manufacturing Building

I-1
APPENDIX I – DETAILED ARARS REVIEW TABLES
CERCLA Section 121(d)(1) requires that Superfund remedial actions attain “a degree of cleanup of
hazardous substance, pollutants, and contaminants released into the environment and control of further
release at a minimum which assures protection of human health and the environment.” The remedial
action must achieve a level of cleanup that at least attains those requirements that are legally applicable
or relevant and appropriate. In performing the FYR for compliance with ARARs, only those ARARs
that address the protectiveness of the remedy are reviewed.
Groundwater
The 1991 ROD identified interim groundwater cleanup goals for all COCs identified in the baseline risk
assessment found to pose an unacceptable risk to either public health or the environment. Interim
cleanup levels were set based on state and federal ARARs, if available. Many of the COCs have
established federal drinking water MCLs or MMCLs. In the absence of an MCL or MMCL, other
suitable criteria were selected such as federal health-based levels or state guidance levels known as
Office of Research and Standards guidance levels. Table I-1 compares 1991 IGCL’s to current
standards. The current standard is more stringent for arsenic. Arsenic sampling was discontinued along
with other metal sampling prior to the construction of the groundwater treatment facility. Contaminants
with hazard-based remedial goals are reviewed in Appendix J.
Table I-1: Review of OU1 Groundwater IGCLs
Groundwater COC 1991 IGCL
(µg/L)a
2020
Standarde
(µg/L)
ARAR Change
Noncarcinogenic COCs
Acetone 700b 6,300f Less stringent
Antimony 3 6 Less stringent
Arsenic 50 10 More stringent
Barium 1,000 2,000 Less stringent
Beryllium 1 4 Less stringent
Cadmium 5 5 None
Chlorobenzene 100 100 None
Chromium (VI) 50 100g Less stringent
1,1-Dichloroethane 5b 70f Less stringent
1,1-DCE 7 7 No change
1,2-DCE(c) 70 70 No change
Mercury 2 2 No change
Methylene chloride 5 5 No change
Nickel 100 No current MCL
Selenium 10 50 Less stringent
Silver 50b 100f Less stringent
PCE 5 5 No change
Toluene 1,000 1,000 No change
1,1,1-Trichloroethane 200 200 No change
Vanadiumc NA NA No change
Carcinogenic COCs
Arsenic 50 10 More stringent
Benzene 5 5 No change
Beryllium 1 4 Less stringent
1,1-DCE 7 7 No change
Lead 15d 15h No change
Methylene chloride 5 5 No change
PCE 5 5 No change

I-2
Groundwater COC 1991 IGCL
(µg/L)a
2020
Standarde
(µg/L)
ARAR Change
TCE 5 5 No change
Vinyl chloride 2 2 No change
Notes:
a. The 1991 ROD selected ICGLs based on the federal MCL unless otherwise noted.
b. The 1991 ROD selected the IGCL as the MMCL.
c. IGCL hazard based (noncarcinogen).
d. IGCL policy based.
e. National Primary Drinking Water Standards, available at https://www.epa.gov/ground-water-and-drinking-
water/national-primary-drinking-water-regulations (accessed 2/5/2020).
f. MMCLs, Office of Research and Standards guidance levels, and secondary MCLs, available at
https://www.mass.gov/guides/drinking-water-standards-and-guidelines (accessed 2/5/2020).
g. For total chromium, which includes contributions from chromium III and chromium VI.
h. Action Level.
NA – an ARAR has not been established for this COC; the 1991 ROD established a health-based value as the IGCL,
which is reviewed further in Appendix J.
Soil
The 1988 ROD identified the MCLs established in the Safe Drinking Water Act (40 CFR 141. – 141.16)
and the Massachusetts groundwater quality standards (314 CMR 6.00) as the chemical-specific ARARs
as a basis for the soil cleanup goals, which were determined to be relevant and appropriate to
remediation of the Site. The 2007 ESD updated the soil cleanup levels based on site-specific data and
EPA guidance. These levels are reviewed in Appendix J.

J-1
APPENDIX J – SCREENING-LEVEL RISK REVIEW
Groundwater
The IGCL in the 1991 AROD for vanadium was a health-based value since an MCL or MMCL had not been
established. Since toxicity values have changed since the 1991 ROD was signed, this FYR compared the
vanadium cleanup goal to EPA’s tapwater RSL. Table J-1 shows that the noncancer Hazard Quotient (HQ)
slightly exceeds 1, however, sampling for metals was discontinued. The vanadium IGCL remains valid because
data in the 2005 FYR shows that groundwater samples collected and analyzed for vanadium between 2000 and
2005 were all below detection limits, with the exception of one sample. Detection limits ranged from less than 1
µg/L to less than 5 µg/L, and the one detection in 2003 was 6 µg/L. Both the detection limits and the one
detection are below the tap water RSL of 86 µg/L.
Table J-1: Screening-Level Tapwater Risk Review
COC 1991 AROD IGCL
(µg/L)
Tapwater RSLa
(µg/L) Cancer Riskb Noncancer
HQc 1 x 10⁻⁶ Risk HQ = 1.0
Vanadium 240 -- 86d -- 3
Notes:
a. Current EPA RSLs, dated 2019, are available at https://www.epa.gov/risk/regional-screening-levels-rsls-
generic-tables (accessed 3/13/2020).
b. The cancer risks were calculated using the following equation, based on the fact that RSLs are derived based
on 1 x 10⁻⁶ risk: cancer risk = (cleanup level ÷ cancer-based RSL) × 10-6.
c. The noncancer HQ was calculated using the following equation: HQ = cleanup level ÷ noncancer-based RSL.
d. EPA has not established a toxicity value for vanadium but derived an RSL based on the toxicity of vanadium
pentoxide and by factoring out the molecular weight of the oxide ion to adjust the toxicity.
-- = not applicable; toxicity criteria not established.
Bold - HQ > 1
µg/L = micrograms per Liter
Soil
The 2007 ESD identified recalculated soil cleanup levels based on protection of groundwater. Given that current
conversations surrounding the Site reference site reuse, this FYR compared the recalculated soil cleanup levels to
EPA’s current RSLs for residential use. Table J-2 provides a screening-level residential risk review of the soil
cleanup levels. It shows that the cleanup levels result in a cancer risk within EPA’s acceptable risk range and a
HQ of less than 1. According to the 2015 FYR, two of the 44 confirmation samples collected in 2011 exceeded
the soil cleanup goals. The screening level risk review of these two samples show that the individual samples are
equivalent to a HQ of 1 or slightly above the HQ of 1 (Table J-3). This evaluation is very conservative as there
were 44 samples collected within the treatment area, many of which were lower detections. Exposure generally
occurs as an average exposure across an area. Thus, according to risk assessment guidance, an exposure point
concentration was averaged by generating an upper 95th confidence limit on the mean (UCL95) using EPA’s
ProUCL software. A UCL95 was calculated on the confirmation samples from 0-11 feet as presented in the 2011
OU2 remedial action report (Figure 7-3). Also to be conservative, a UCL95 was calculated on all confirmation
samples from 0 - 45 feet (Figure 7-3, 7-4 and 7-5). When considering an average exposure scenario the screening-
level cancer risks for both UCL95 concentrations are within EPA’s risk management range and below the target
noncancer HQ of 1 for both residential (Table J-4) and commercial/industrial exposures (Table J-4). A Grant of
Environmental Restriction currently restricts this parcel to commercial and industrial use, which may be more
restrictive than necessary for this area.

J-2
Table J-2: Screening-Level Residential Risk Review of Soil Cleanup Levels
COC
2007 ESD
Soil Cleanup Level
(mg/kg)
Residential RSLa
(mg/kg) Cancer Riskb Noncancer
HQc 1 x 10⁻⁶ Risk HQ = 1.0
TCE 0.077 0.94 4.1 8 x 10⁻⁸ 0.02
Vinyl chloride 0.011 0.059 70 2 x 10⁻⁷ 0.0002
Methylene chloride 0.022 57 350 4 x 10⁻¹⁰ 0.00006
Tetrachloroethene 0.056 24 81 2 x 10⁻⁹ 0.0007
1,1-DCE 0.045 -- 230 -- 0.0002
Trans-1,2-DCE 0.626 -- 1,600 -- 0.0004
Toluene 22.753 -- 4,900 -- 0.005
1,1,1-Trichloroethane 1.388 -- 8,100 -- 0.0002
Cis-1,2-DCE 0.418 -- 160 -- 0.003
Notes:
a. Current EPA RSLs, dated 2019, are available at https://www.epa.gov/risk/regional-screening-levels-rsls-
generic-tables (accessed 2/5/2020).
b. The cancer risks were calculated using the following equation, based on the fact that RSLs are derived based
on 1 x 10⁻⁶ risk: cancer risk = (cleanup level ÷ cancer-based RSL) × 10-6.
c. The noncancer HQ was calculated using the following equation: HQ = cleanup level ÷ noncancer-based RSL.
-- = not applicable; toxicity criteria not established.
mg/kg = milligrams per kilogram
Table J-3: Screening-Level Residential Risk Review of 2011 Soil Confirmation Sampling
COC 2011 Confirmation Sampling Exceeding 2007
ESD Cleanup Level (mg/kg)
Residential RSLa
(mg/kg) Cancer
Riskb
Noncancer
HQc 1 x 10⁻⁶
Risk HQ = 1.0
TCE
7 (CSB-13, 3-5ft sample) 0.94 4.1
7 x 10⁻⁶ 2
5.6 (CSB-10, 23-25 ft sample) 6 x 10⁻⁶ 1
UCL95 of 2.4 (confirmation samples 0-45 ft) 0.94 4.1 3 x 10⁻⁶ 0.6
UCL95 of 1.5 (confirmation samples 0-11 ft) 0.94 4.1 2 x 10⁻⁶ 0.4
Notes:
a. Current EPA RSLs, dated 2019, are available at https://www.epa.gov/risk/regional-screening-levels-rsls-generic-tables
(accessed 2/5/2020).
b. The cancer risks were calculated using the following equation, based on the fact that RSLs are derived based on 1 x
10-6 risk: cancer risk = (cleanup level ÷ cancer-based RSL) × 10-6.
c. The noncancer HQ was calculated using the following equation: HQ = cleanup level ÷ noncancer-based RSL.
-- = not applicable; toxicity criteria not established.
Table J-4: Screening-Level Commercial/Industrial Risk Review of 2011 Soil Confirmation Sampling
COC
2011 Confirmation Sampling Exceeding
2007 ESD Cleanup Level
(mg/kg)
Commercial/Industrial
RSLa
(mg/kg)
Cancer
Riskb
Noncancer
HQc
1 x 10⁻⁶ Risk HQ = 1.0
TCE
7 (CSB-13, 3-5ft sample) 6 19
1 x 10⁻⁶ 0.4
5.6 (CSB-10, 23-25 ft sample) 9 x 10⁻⁷ 0.3
UCL95 of 2.4 (confirmation samples 0-45 ft) 6 19 4 x 10⁻⁷ 0.1
UCL95 of 1.5 (confirmation samples 0-11 ft) 6 19 3 x 10⁻⁷ 0.08

J-3
COC
2011 Confirmation Sampling Exceeding
2007 ESD Cleanup Level
(mg/kg)
Commercial/Industrial
RSLa
(mg/kg)
Cancer
Riskb
Noncancer
HQc
1 x 10⁻⁶ Risk HQ = 1.0
Notes:
a. Current EPA RSLs, dated 2019, are available at https://www.epa.gov/risk/regional-screening-levels-rsls-generic-tables
(accessed 2/5/2020).
b. The cancer risks were calculated using the following equation, based on the fact that RSLs are derived based on 1 x
10-6 risk: cancer risk = (cleanup level ÷ cancer-based RSL) × 10-6.
c. The noncancer HQ was calculated using the following equation: HQ = cleanup level ÷ noncancer-based RSL.
-- = not applicable; toxicity criteria not established.

J-4
Vapor Intrusion
In considering reuse for the property, the vapor intrusion pathway is an exposure pathway of concern due to the
presence of volatile COCs in the groundwater. Table J-5 provides a VISL assessment for residential or
unrestricted use. Per vapor intrusion guidance, groundwater wells monitoring the most shallow zone (e.g.,
overburden wells) within 100 feet of a building are considered for the evaluation. Groundwater monitoring well
EW-S1 is the well that had the most contamination in 2018. Detected concentrations of VOCs were included in
the VISL. Table J-5 indicates that if a residential building were to be built at this location while concentrations of
TCE remain at their current state, additional study would be necessary to ensure the vapor intrusion pathway is
not a completed exposure pathway. Table J-6 indicates that current TCE concentrations do not pose a vapor
intrusion concern for commercial/industrial use.
Table J-5: Residential Screening-Level Vapor Intrusion Risk Evaluation of Shallow Groundwater Results
COC Groundwater Concentration
(µg/L)a Cancer Riska Non-cancer HQa
TCE 16 (EW-S1) 1 x 10⁻⁵ 3
Cis-1,2-DCE 14 (EW-S1) NA NA
Cumulative Total 1 x 10⁻⁵ 3
Notes:
a. Risk and hazard quotient calculated using EPA’s November 2019 VISL calculator
(https://www.epa.gov/vaporintrusion/vapor-intrusion-screening-level-calculator) assuming a
commercial/industrial exposure and default groundwater temperature of 25 degrees Celsius, accessed
2/27/2020.
NA = not applicable
Source: 2018 Groundwater Data Evaluation Report, Appendix B-4, February 2019.
Table J-6: Commercial/Industrial Screening-Level Vapor Intrusion Risk Evaluation of Shallow
Groundwater Results
COC Groundwater Concentration
(µg/L)a Cancer Riska Non-cancer HQa
TCE 16 (EW-S1) 2 x 10⁻⁶ 0.7
Cis-1,2-DCE 14 (EW-S1) NA NA
Cumulative Total 2 x 10⁻⁶ 0.7
Notes:
b. Risk and hazard quotient calculated using EPA’s November 2019 VISL calculator
(https://www.epa.gov/vaporintrusion/vapor-intrusion-screening-level-calculator) assuming a
commercial/industrial exposure and default groundwater temperature of 25 degrees Celsius, accessed
2/27/2020.
NA = not applicable
Source: 2018 Groundwater Data Evaluation Report, Appendix B-4, February 2019.