
Four Wheel Electric Vehicle Behavior Using Fuel … Wheel Electric Vehicle Behavior Using Fuel Cell...
13
International Journal on Electrical Engineering and Informatics - Volume 9, Number 3, September 2017 Four Wheel Electric Vehicle Behavior Using Fuel Cell Supply Moving on Mountain Region Condition Abdelfatah Nasri and Brahim Gasbaoui Bechar University, B.P 417 Bechar (08000), Algeria [email protected] Abstract: Autonomy is one of a most problems for commercialized electric vehicles. Especially that uses four wheels for motions. The weakest point for this kind is the battery energy management system, to solve this problem a Proton Exchange Membrane Fuel Cell is used. The PEMFC autonomy depends on storage state of fuel, in this work we focuses the relationship between mountain slope road effect and PEMFC power consumption behavior. In this study, the variation of the slope angle during trajectory is made and the behavior of PEMCF energy is presented in each steps. Simulations are carried on Matlab software. The proposed energy system develops the autonomy and gives more positive signs on stability for this vehicle moving on slope road condition with different road angles, the fuel cell response is quickest compared with lithium battery moving in the same condition. Keywords: PEMFC, slope angle, four wheel, autonomy, electric vehicle. 1. Introduction The fuel cells are fuel-flexible, scalable, and modular, they remain excellent candidates for a wide range of electric vehicle applications from small electric scooter to an electric bus. Fuel cells are currently being demonstrated on land, in the sea, and in the air[1,2].The objective of uses Proton Exchange Membrane Fuel Cells (PEMFC) powered by hydrogen is to build a zero emission electric vehicle, suitable for use in widely populated areas [1,2,3] . PEM fuel cell is very important for power system, because it facilitates the understanding of the involved phenomena.PEM fuel cells were invented in the 1960s for military applications, after that it have been used since the 1970s in submarines. The first model was used for vehicular applications. Engelhard developed a fuel-cell-powered forklift about 1969. Many models have been proposed to simulate fuel cells in the literature, which have generally each the own specificities and utilities, following the studied phenomena [3,4]. The Direct Torque Control strategy (DTC) is one of the main technologies control for power propulsion system such as four wheel electric vehicle which need robust control. This kind of control have many more performances due to its simple structure and ability to achieve fast response of flux and torque. Those performances attracted growing interest in the recent years. DTC-SVM can improve effectively the torque ripple, and system’s robustness. DTC-SVM method give high performance in modern driving vehicular technologies for AC motors and improve the system robustness, evidently reduce the torque and flux ripple, and effectively improve the dynamical performance [6,7]. The Buck- Boost converter is used to enssure the energy required for the EV and the propulsion system. The aim object of this paper is to understand the behavior of PEM fuel cell controlled by DC- DC converter for 4WDEV slope road regions. For this reason the paper plan work is organized as follows: Section I present an overview on fuel cell. Section II shows the modeling of electric vehicle load and principle components of PEMFC. Section III shows direct torque control based space vector modulation with schema. Section IV gives simulation results and their discussions. Finally, the conclusion is drawn in the end of paper. Received: October 2nd, 2016. Accepted: September 13rd, 2017 DOI: 10.15676/ijeei.2017.9.3.4 469
Transcript of Four Wheel Electric Vehicle Behavior Using Fuel … Wheel Electric Vehicle Behavior Using Fuel Cell...

International Journal on Electrical Engineering and Informatics - Volume 9, Number 3, September 2017
Four Wheel Electric Vehicle Behavior Using Fuel Cell Supply Moving on
Mountain Region Condition
Abdelfatah Nasri and Brahim Gasbaoui
Bechar University, B.P 417 Bechar (08000), Algeria
Abstract: Autonomy is one of a most problems for commercialized electric vehicles. Especially
that uses four wheels for motions. The weakest point for this kind is the battery energy
management system, to solve this problem a Proton Exchange Membrane Fuel Cell is used. The
PEMFC autonomy depends on storage state of fuel, in this work we focuses the relationship
between mountain slope road effect and PEMFC power consumption behavior. In this study, the
variation of the slope angle during trajectory is made and the behavior of PEMCF energy is
presented in each steps. Simulations are carried on Matlab software. The proposed energy system
develops the autonomy and gives more positive signs on stability for this vehicle moving on
slope road condition with different road angles, the fuel cell response is quickest compared with
lithium battery moving in the same condition.
Keywords: PEMFC, slope angle, four wheel, autonomy, electric vehicle.
1. Introduction
The fuel cells are fuel-flexible, scalable, and modular, they remain excellent candidates for a
wide range of electric vehicle applications from small electric scooter to an electric bus. Fuel
cells are currently being demonstrated on land, in the sea, and in the air[1,2].The objective of
uses Proton Exchange Membrane Fuel Cells (PEMFC) powered by hydrogen is to build a zero
emission electric vehicle, suitable for use in widely populated areas [1,2,3] . PEM fuel cell is
very important for power system, because it facilitates the understanding of the involved
phenomena.PEM fuel cells were invented in the 1960s for military applications, after that it have
been used since the 1970s in submarines. The first model was used for vehicular applications.
Engelhard developed a fuel-cell-powered forklift about 1969. Many models have been proposed
to simulate fuel cells in the literature, which have generally each the own specificities and
utilities, following the studied phenomena [3,4]. The Direct Torque Control strategy (DTC) is
one of the main technologies control for power propulsion system such as four wheel electric
vehicle which need robust control. This kind of control have many more performances due to its
simple structure and ability to achieve fast response of flux and torque. Those performances
attracted growing interest in the recent years. DTC-SVM can improve effectively the torque
ripple, and system’s robustness. DTC-SVM method give high performance in modern driving
vehicular technologies for AC motors and improve the system robustness, evidently reduce the
torque and flux ripple, and effectively improve the dynamical performance [6,7]. The Buck-
Boost converter is used to enssure the energy required for the EV and the propulsion system.
The aim object of this paper is to understand the behavior of PEM fuel cell controlled by DC-
DC converter for 4WDEV slope road regions.
For this reason the paper plan work is organized as follows:
Section I present an overview on fuel cell.
Section II shows the modeling of electric vehicle load and principle components of PEMFC.
Section III shows direct torque control based space vector modulation with schema.
Section IV gives simulation results and their discussions.
Finally, the conclusion is drawn in the end of paper.
Received: October 2nd, 2016. Accepted: September 13rd, 2017
DOI: 10.15676/ijeei.2017.9.3.4
469

2. Electric vehicle as mechanical Load
The most forces act on vehicle as mechanical load are resistant forces as it shown in Figure
1. The forces opposite to the vehicle motion are: the tire force, aerodynamic force and the slope
force that depends on the road slope angle [1,2 3].The total resistive force is the sum of all
resistance forces given by :
slopeaerotirer FFFF (1)
βMgvCAρmgfF dfairrr sin+2
1+= 2
The vehicle mechanical load parameters are listed in appendix.
Figure 1. The vehicle resistant forces moving on slope
The vehicle studied in this work consist of four wheels induction motor vehicle, this kind of
car use technology of in-wheel motors by means each wheel is integrated on induction motor
of lorey somer product [4] , this method permit to reduce motion losses , the four wheel drive
is used for urban traffic. The speed reference of each motor is computed using an electronic
differential [1,4,6]. The motor are supplied using Fuel cells controller by Buck boost DC-DC
converter. The detailed control schema of the EV is shown in Figure 8. The control strategy this
propulsion system use DTC-SVM method for torque and current estimation [6,9].
3. Fuel cell model
The first fuel cell presented by Allis Chalmers built consist of an alkaline fuel cell produced
20 horsepower for demonstrated a tractor o, ne year latter, Pratt & Whitney delivered the first of
an estimated 200 fuel cell auxiliary power units for space applications. In 1967 latter Union
Carbide delivered a fuel cell for scooter army application [4]. By principle hydrogen PEMFC
produce energy via chemical reaction [1,2,3]
energyelectricalheatOHOH t 222 21 (2)
Based on this reaction and in order to get an electric current, hydrogen oxidation and oxygen
reduction are separated by a membrane, this last one conduct protons from the anode to the
cathode side. The semi reactions on both anode and cathode are:
anodeeHH 222
cathodeOeO 22 24 (3)
When protons are transported through the membrane, electrons are carried by an electric
circuit and electrical energy is produced. Modelling of this system is getting more and more
important as powerful fuel cell stacks and take into account all factors to be integrated into smart
power systems. In [2,3,5,6] Jeferson M. Corrêa introduced a model for the PEMFC. The model
is based on simulating the relationship between produced voltage and partial pressure of
hydrogen, oxygen, and current. The output voltage of a one cell can be defined as the result of
the following expression [1,2,3,5,6], figure 2 explain in easy way fuel cell scheme:
concohmactNenstFC VVVEV = (4)
Faero
Ftire
Fslope
mg β
Fte
Abdelfatah Nasri, et al.
470

Figure 2. Basic PEM fuel cell shemas.
4. Direct torque control based on space vector modulation (SVM-DTC) of one wheel motor
Classical DTC has some disadvantages; the most important of them is the high ripple torque.
In this method two controller are employed to regulate the flux amplitude and torque
respectively as it depicted in Figure 3. This make the torque and the magnitude of flux under
control, by generating the voltage pulse for inverter command. The SVM principle is based on the
switching between two adjacent active vectors and two zero vectors during one period. It uses the
space vector concept to compute the duty cycle of the switches[6,7,8,9].In this model no decoupling
mechanism is required. Due to the structure of the inverter, the DC bus voltage is fixed, therefore
the speed of voltage space vectors are not under control, but we can adjust the speed by means
of inserting the zero voltage vectors to control the electromagnetic torque generated by the
induction motor. The selection of vectors is also changed. It is not based on the region of the flux
linkage, but on the error vector between the expected and the estimated flux linkage [6,7,8,9]
Figure 3. Control schema Bloc Fuel cell DTC-SVM of one wheel-motor
Four Wheel Electric Vehicle Behavior Using Fuel Cell Supply Moving
471

Figure 4. The Fuel cell electric vehicle wheels control shemas.
5. Buck Boost DC-DC Converter for four wheel electric vehicle
DC-DC Buck boosts converters find applications in places where the energy ources is
charging, regenerative braking, and backup power are required. The power flow in a bidirectional
converter is usually from a low voltage end such as battery or a super capacitor to a high voltage
side and is referred to as boost operation [6,5,10]. Figure 5 show the electric vehicle propulsion
chain using an DC-DC Buck boosts converters [5,6,10].
Figure 5. The buck boost DC-DC converter used for electric vehicle supply
6. Simulation Results
In order to analyze the driving wheel system, simulations were carried on MATLAB using
the model of figure 4. The following results were given using various slope angle (5%,10% and
15%) and it’s divided into two principle phases. The first one: describe the performance test of
4WDEV controlled by DTC-SVM in various seniors. Second phase: shows the slope angle effect
on the PEMFC behavior of during all trajectories.
A. Direct torque control scheme with space vector modulation.
The topology studied in this work consists of three phases: the first one is the moving on
slope road with an angle of 5 %, in the second the slope road became 10 % one when the speed
still constant of 80 Km/h and finally the vehicle is moving up on up the slope road of 15% under
the same reference speed, the specified road topology is shown in Figure 6, when the different
phase road constraints are described in the table 1.
converter DC-DCBoost Buck
C
D
L
switchC
inputV outputV
ControlConverter
supplyvehicle
PEMFC
Abdelfatah Nasri, et al.
472

Table 1.Driving road phases constraints
Phases Slope road angle [%] Vehicle Speed[km/h]
Phase 1 5 80
Phase 2 10 80
Phase 3 15 80
Figure 6. Specified driving road topology.
Figure 7. Variation of vehicle speeds in different phases.
Figure 8. Variation of vehicle speed and traveled distance in different phases.
0 1 2 3 4 5 60
10
20
30
40
50
60
70
80
90
100
Time [s]
Veh
icle
spe
ed
[km
/h]
Right front wheel speed
Left front wheel speed
Right rear wheel speed
Left rear wheel speed
Vehicle speed
Phase1 Phase 2 Phase 3
0 1 2 3 4 5 60
50
100
150
200
250
300
350
400
450
Time [s]
Dis
tanc
e T
rave
led
[m]
Distance Traveled [m]
Phase1 Phase 3Phase 2
Four Wheel Electric Vehicle Behavior Using Fuel Cell Supply Moving
473

Figure 7 shows the variation of vehicle linear speed in different stages. Figure 8, present a
simple evaluation of distance traveled during time. The total distance traveled by the vehicle
over than 420 meters.
Figure 9. Variation of phase current of the right and left motor in different phases.
Figure 10. Variation of driving forces of the front motors in different cases.
Figure 11. Vehicle resistive torques variation in different phases
0 1 2 3 4 5 6-60
-40
-20
0
20
40
60
80
100
120
140
Time [s]
Pha
se c
urre
nt[A
]
Front motor right
Front motor left
Phase1 Phase 2 Phase 3
0 1 2 3 4 5 6-200
0
200
400
600
800
1000
1200
Time [s]
Dri
ving
for
ces
[N]
Front Motor right
Front Motor left
Phase1 Phase 2 Phase 3
0 1 2 3 4 5 6
-100
0
100
200
300
400
500
600
700
Time [s]
Veh
icle
tor
que
[Nm
]
Aerodynamics torque
Rolling torque
Slope torque
Vehicle torque
Phase1 Phase 2 Phase 3
Abdelfatah Nasri, et al.
474

Figures 9 and 10 explain the variation of phase current and driving force respectively. In the
first step (5%)and to reach 80 Km/h, the 4WDEV demand a current of 22.85 A for each motor
which explain the driving force of 163.10 N. In second phase (10%) the current and driving
forces demand increase too by means that the vehicle developed efforts became double and
developed driving forces as it shown in figs 9 and 10 respectively. The last phases explain the
effect of the slope of 15% on four wheels drive developed efforts. The driving wheels forces
increase and the current demand undergo triple of the current demand in the first case, the
PEMFC use 80 % of his power to satisfy the motorization demand under the slopped road
condition which can interpreted physically the augmentation of the globally vehicle resistive
torque illustrate in table 2. In the other hand the linear speeds of the four induction motors stay
the same and the road drop does not influence the torque control of each wheels. The results are
listed in table 2, Figure 11, shows the variation of vehicle torque in different cases.
Table 2. Values of phase current driving force of the right motor in different phases.
Phases Phase 1 Phase 2 Phase 3
Slope angle % 5 10 15
Current of the right motor [A] 22.85 35.29 51.66
Driving force of the right motor [N] 163.10 286.20 444.70
According to the formulas (1), and table 3, the variation of resistive vehicle torques in
different cases as it depicted in table 3. , the vehicle resistive torque was 168.4 N.m in the first
case when the power propulsion system resistive one became 331.60 Nm in the second phases
(phases 2) , the back and front driving wheels develop more and more efforts to satisfy the
traction chain demand which impose an resistive torque equal to 535.00 N.m in the third phase
.The result prove that the traction chain under acceleration demand develop the double effort
comparing with the first phase case’s by means that the vehicle needs the half of its energy
developed in the second phase's compared with the first acceleration phase , table 3. give more
detail for variation of globally vehicle resistive torque compared to nominal motor torque in
different phases.
Table 3.Variation of vehicle torque in different Phases.
Phases 1 2 3
Slope angle % 5 10 15
the Vehicle resistive torque [N.m] 168.40 331.60 535.00
the globally vehicle resistive torque Percent
compared with nominal motor torque of
392.46Nm 42.91 % 84.50 % 136.34 %
B. Power electronics and Fuel cell behavior analysis
The PEMFC is able to supply sufficient power to the 4WDEV in different angle slope
(5%,10%,15%), which means that the peak power of the PEMFC must be greater than or at least
equal to the peak power of the four electric motors. The PEMFC must store sufficient energy to
maintain their consumption of air and fuel to economical level during driving. Figures 12, Figure
13, Figure 14, and Figure 15 describes the changes in the PEMFC storage voltage, current, power
efficiency respectively in different slope references.
Four Wheel Electric Vehicle Behavior Using Fuel Cell Supply Moving
475

Figure 12. Variation of PEMFC voltage in different phases.
Figure 13. Variation of PEMFC current in different phases.
Figure 14. Evaluation of PEMFC efficiency in all trajectory.
0 1 2 3 4 5 6320
330
340
350
360
370
380
390
400
410
420
Time [s]
PE
MF
C V
olta
ge[V
]
PEMFC Voltage
Phase1 Phase 2 Phase 3
0 1 2 3 4 5 60
20
40
60
80
100
120
140
160
180
200
Time [s]
Cur
ren
PE
MF
C [
A]
Current PEMFC
Phase1 Phase 2 Phase 3
0 1 2 3 4 5 60
10
20
30
40
50
60
70
80
Time [s]
Sta
ck E
ffic
ienc
y P
EM
FC
[%
]
Efficiency PEMFC
Phase1 Phase 2 Phase 3
Abdelfatah Nasri, et al.
476

Figure 15. Variation of PEMFC power in different topologies consideration.
Figure 16. Uses of H2 and O2 in different phases.
It is interesting to manage the power distribution in the electrical traction under different
slope as it described in Figure 15. The PEMFC provides about 12.89 Kw in the first phase. In
the second phase (phase 2:) the demanded power PEMFC increased too which explain by air and
fuel consumption. In third phase the PEMFC continue to produce energy to over go the third
slope of 15%, it seems that the generating power depend only on road state and the fuel/air state
in the PEMFC as it shown in Figure 16 and Figure 17,18. Figure 19 which describe utilization
of Air and Fuel in different slope trajectory. The data results are summarized in tables 4 and 5.
Table 4. Values of PEMFC power in different phases
Phase Phase 1 Phase 2 Phase 3
Slope angle % 5 10 15
PEMFC power [kw] 12.89 26.13 43.77
Percentage of the PEMFC compared
with globally PEMFC power [%] 15.99 32.41 54.30
0 1 2 3 4 5 60
1
2
3
4
5
6x 10
4
Time [s]
Pow
er P
EM
FC
[w
]
PEMFC power
Phase1 Phase 2 Phase 3
0 1 2 3 4 5 60
10
20
30
40
50
60
70
80
90
100
Time [s]
Uti
liza
tion
(%
)
H2
O2
Phase1 Phase 2 Phase 3
Four Wheel Electric Vehicle Behavior Using Fuel Cell Supply Moving
477

Figure 17. Evaluation in PEMFC power depending on the slope angle.
Table 5. Values of PEMFC stack consumption for air and fuel respectively.
Phase Phase 1 Phase 2 Phase 3
Slope angle % 5 10 15
Stack consumption of Air [lpm] 108.20 225.30 391.40
Stack consumption of Fuel [lpm] 45.54 93.66 163
It i's appear clearly that when the 4WDEV is moving on slope angle of 5% the PEMFC air
consumption is 108.20 lpm and the PEMFC fuel consumption is 45.54 lpm, in the second phases
the consumption of air and fuel is almost the double. In the last phase the fuel consumption is
163 lpm and the air consumption is 391.40 lm, is almost the triple compared to the first cases.
We can say that when the slope angle increase the hydrogen reserve decrease according to the
slope degree. in this situation the autonomy value is affected too.
Figure 18. Consumption of the fuel and air for PEMFC in different phases.
It’s appear clearly that the temperature change did not affect the performance of the PEMFC,
for against the change of pressure caused a sharp decrease in PEMFC efficiency. This allows us
to say that the temperature effect is very important on PEMFC performances. It is very
interesting to discuss Nerst voltage. The temperature variation decrease the Nerst voltage and
when the pressure increase the Nerst voltage decrees against the Nerst voltage remains constant
equal to 1.172 V (Without variation).
5 6 7 8 9 10 11 12 13 14 1510
15
20
25
30
35
40
45
[%]
PE
MF
C [
Kw
]
0 1 2 3 4 5 60
100
200
300
400
500
600
Time [s]
Sta
ck c
onsu
mpt
ion
[lpm
]
Air
Fuel
Phase1 Phase 2
Phase 3
Abdelfatah Nasri, et al.
478
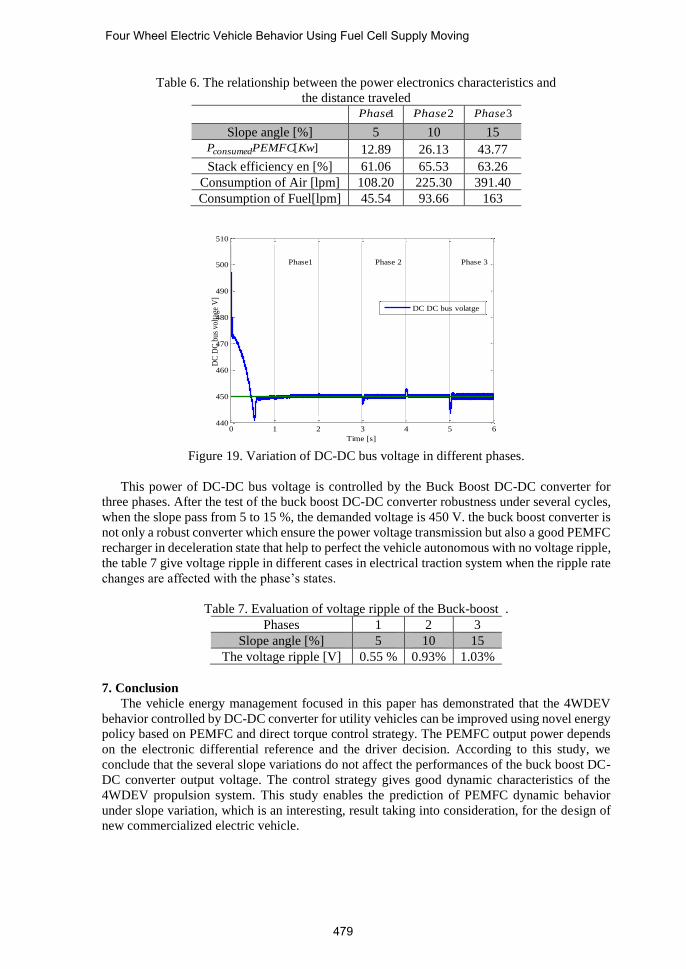
Table 6. The relationship between the power electronics characteristics and
the distance traveled
1Phase 2Phase 3Phase
Slope angle [%] 5 10 15 ][KwPEMFCPconsumed 12.89 26.13 43.77
Stack efficiency en [%] 61.06 65.53 63.26
Consumption of Air [lpm] 108.20 225.30 391.40
Consumption of Fuel[lpm] 45.54 93.66 163
Figure 19. Variation of DC-DC bus voltage in different phases.
This power of DC-DC bus voltage is controlled by the Buck Boost DC-DC converter for
three phases. After the test of the buck boost DC-DC converter robustness under several cycles,
when the slope pass from 5 to 15 %, the demanded voltage is 450 V. the buck boost converter is
not only a robust converter which ensure the power voltage transmission but also a good PEMFC
recharger in deceleration state that help to perfect the vehicle autonomous with no voltage ripple,
the table 7 give voltage ripple in different cases in electrical traction system when the ripple rate
changes are affected with the phase’s states.
Table 7. Evaluation of voltage ripple of the Buck-boost .
Phases 1 2 3
Slope angle [%] 5 10 15
The voltage ripple [V] 0.55 % 0.93% 1.03%
7. Conclusion
The vehicle energy management focused in this paper has demonstrated that the 4WDEV
behavior controlled by DC-DC converter for utility vehicles can be improved using novel energy
policy based on PEMFC and direct torque control strategy. The PEMFC output power depends
on the electronic differential reference and the driver decision. According to this study, we
conclude that the several slope variations do not affect the performances of the buck boost DC-
DC converter output voltage. The control strategy gives good dynamic characteristics of the
4WDEV propulsion system. This study enables the prediction of PEMFC dynamic behavior
under slope variation, which is an interesting, result taking into consideration, for the design of
new commercialized electric vehicle.
0 1 2 3 4 5 6440
450
460
470
480
490
500
510
Time [s]
DC
DC
bus
vol
tage
V]
DC DC bus volatge
Phase1 Phase 2 Phase 3
Four Wheel Electric Vehicle Behavior Using Fuel Cell Supply Moving
479

8. References
[1]. Abd El Monem AA, Azmy Ahmed M. Mahmoud SA. Dynamic modelling of proton
exchange membrane fuel cells for electric vehicle applications engineering research journal
(ERJ), vol. 35(3) Minoufiya University, Faculty of Eng., Shebin El-Kom, Egypt,July 2012.
p. 205–14.
[2]. Del Real AJ, Arce A, Bordons C. Development and experimental validation of a PEM fuel
cell dynamic model, Journal of Power Sources,2007,173: 310–324.
[3]. Alin C. Fărcaşa, Petru Dobrab, Adaptive control of membrane conductivity of PEM fuel
cell, Procedia Technology 12 ( 2014 ) 42 – 49.
[4]. J. Larminie, J.Lowry, “Electric Vehicle Technology Explained”, Edited by John Wiley and
John Lowry, England, 2003.
[5]. Q.Zhang, Y.Yin, “Analysis and Evaluation of Bidirectional DC/DC Converter”, Journal of
Power Technology, vol. 1, no. 4, pp. 331–338, 2003.
[6]. H.J.Chill, L.W. Lin, “A Bidirectional DC-DC Converter for Fuel Cell Electric Vehicle
Driving System”, IEEE Trans. Power Electron, vol. 21, pp. 950–958, 2006.
[7]. A. Gupta, A. M. Khambadkone“A space vector pwm scheme for multilevel inverters based
on two-level space vector pwm,” IEEE Transaction on Industrial Electronics, Vol. 53,
October 2006.
[8]. T. G. Habetler, F. Profumo, M.Pastorelli, L. Tolbert “Direct torque control of induction
machines using space vector modulation,” IEEE Transaction on Industry Applications,
Vol. 28, no. 5, pp. 1045-1053, septembre/October 1992.
[9]. SUN Dan, HE Yi-kang. “Space vector modulated based constant switching frequency
direct torque control for permanent magnet synchronous motor”. Proceedings of the CSEE,
2005, 25(12): 112- 116.
[10]. Dimas Anto Asfani, et al., “Design of High Ratio DC-DC Converter Applied to PV-Grid
Connected Electric Vehicle Charging Station” International Journal on Electrical
Engineering and Informatics - Volume 7, Number 3, September 2015.
Abdelfatah NASRI was born in 1978 at Bechar-Algeria, he's received the
electrical engineering diploma from Bechar Center University-Algeria in 2002,
and the Master degree from the University of Sciences and Technology of Oran
(USTO), Algeria in 2006. Currently he is an assistant professor at Bechar
University. From 2007 right now he's preparing his Phd degree in electric
vehicle propulsion system control.
Brahim GASBAOUI received the electrical engineering diploma from the
University Ibn-Khaldoun of TIARET (UIT), in 1993 and the MS degree in
2008 from Bechar University - Algeria, and the Ph.D. degree from the Faculty
of the Sciences and the Technology of the Bechar University Currently he is a
Professor of electrical engineering at Bechar University. His research interests
include power electronics robust control for electric vehicle and propulsion
system, power electronics, antilock brake systems, anti-skid control for electric
vehicles drive.
Abdelfatah Nasri, et al.
480

Appendix
Parameters of the electric vehicle mechanical load
elements name value elements name value
r tire radius 0.32m air Air density 1.2Kg/m3
m total mass 1300Kg dC aerodynamic coefficient 0.32
rf rolling resistance 0.01 fA frontal surface area 2.60 m2
g gravity v vehicle speed 80Km/h
road slope angle
Four Wheel Electric Vehicle Behavior Using Fuel Cell Supply Moving
481