FOUNTAIN HILLS UNIFIED SCHOOL DISTRICT NO. 98
164
FOUNTAIN HILLS UNIFIED SCHOOL DISTRICT NO. 98 Comprehensive Annual Financial Report Fiscal Year Ended June 30, 2018 16000 East Palisades Boulevard ƒ Fountain Hills, Arizona 85268
Transcript of FOUNTAIN HILLS UNIFIED SCHOOL DISTRICT NO. 98
FOUNTAIN HILLS UNIFIED SCHOOL DISTRICT NO. 98
Comprehensive Annual Financial Report
Fiscal Year Ended June 30, 2018
16000 East Palisades Boulevard ƒ Fountain Hills, Arizona 85268


FOUNTAIN HILLS UNIFIED SCHOOL DISTRICT NO. 98
FOUNTAIN HILLS, ARIZONA
COMPREHENSIVE ANNUAL FINANCIAL REPORT FOR THE FISCAL YEAR ENDED JUNE 30, 2018
Issued by: Business and Support Services Department


TABLE OF CONTENTS
I. INTRODUCTORY SECTION Page Letter of Transmittal i District’s List of Principal Officials vii Organizational Chart viii II. FINANCIAL SECTION Independent Auditors’ Report 1 A. Management’s Discussion & Analysis 7
B. Basic Financial Statements
Government-wide Financial Statements Statement of Net Position 17 Statement of Activities 18 Fund Financial Statements Governmental Fund Financial Statements Balance Sheet 22 Reconciliation of the Balance Sheet to the Statement of Net Position 25 Statement of Revenues, Expenditures and Changes in Fund Balances 26
Reconciliation of the Statement of Revenues, Expenditures, and Changes in Fund Balances of Governmental Funds to the Statement of Activities 28
Fiduciary Fund Financial Statements Statement of Fiduciary Net Position 31 Notes to Financial Statements 1. Nature of Operations and Summary of Significant Accounting Policies 35 2. Fund Balance Classifications 42 3. Cash and Investments 43 4. Receivables 44 5. Capital Assets 45 6. Long-Term Liabilities 46 7. Interfund Receivables, Payables, and Transfers 47 8. Contingent Liabilities 48 9. Pensions and Other Postemployment Benefits 48 10. Risk Management 54 11. Deficit Fund Balances 54 12. Restatement 54

C. Required Supplementary Information
Pension/OPEB Information Schedule of the District’s Proportionate Share of the Net Pension/OPEB Liability Cost-Sharing Pension Plan 57 Schedule of District’s Pension/OPEB Contributions 58 Budgetary Schedules
Schedule of Revenues, Expenditures, and Changes in Fund Balance – Budget and Actual - General Fund 59
Notes to the General Fund Budget and Actual 61 Title I Fund – Budget and Actual 63 Special Education Grants 64
D. Other Supplementary Information Schedule of Revenues, Expenditures and Changes in Find Balances Budget and Actual – Capital Project Funds 66 Budgetary Comparison Schedule-Other Major Government Funds Schedule of Revenues, Expenditures and Changes in Fund Balances- Budget and Actual-Debt Service Fund 68
Combining Statements-All Non-Major Governmental Funds-By Fund Type 70 Combining Balance Sheet Combining Statement of Revenues, Expenditures and Changes in Fund Balance – All Non-Major Governmental Funds – By Fund Type 71
Combining Balance Sheet-Non-Major Special Revenue Funds 74 Combining Statement of Revenues, Expenditures and Changes in Fund Balances- Non-Major Special Revenue Funds 78 Combining Schedule of Revenues, Expenditures and Changes in Fund Balances- Budget and Actual-Non-Major Special Revenue Funds 82 Combining Balance Sheet-Non-Major Capital Projects Funds 84 Combining Statement of Revenues, Expenditures and Changes in Fund Balances- Non-Major Capital Projects Funds 108 Combining Schedule of Revenues, Expenditures and Changes in Fund Balances- Budget and Actual-Non-Major Capital Projects Funds 112 Combining Statement of Fiduciary Net Position – Agency Funds 119 Combining Statement of Changes in Fiduciary Net Position – Agency Funds 120

III. STATISTICAL SECTION Table Page Net Position by Component 1 122 Expenses, Program Revenues, and Net (Expense) Revenue 2 124 General Revenues and Changes in Net Position 3 126 Fund Balances, Governmental Funds 4 128 Governmental Funds Revenues 5 130 Governmental Funds Expenditures and Debt Service Ratio 6 132 Other Financing Sources and Uses and Net Changes in Fund Balances – Governmental Funds 7 134 Property Tax Levies and Collections 8 137 Outstanding Debt by Type 9 138 IV. COMPLIANCE SECTION
Independent Auditors’ Report on Internal Control over Financial Reporting and on Compliance and Other Matters Based on an Audit of Financial Statements Performed in Accordance with Government Auditing Standards 143


INTRODUCTORY SECTION


January �4, 2019
Citizens and Governing Board Fountain Hills Unified School District No. 98 16000 East Palisades Boulevard Fountain Hills, Arizona 85268
State law mandates that school districts required to undergo an annual single audit publish a complete set of financial statements presented in conformity with accounting principles generally accepted in the United States of America and audited in accordance with auditing standards generally accepted in the United States by a certified public accounting firm licensed in the State of Arizona. Pursuant to that requirement, we hereby issue the comprehensive annual financial report of the Fountain Hills Unified School District No. 98 (District) for the fiscal year ended June 30, 2018.
This report consists of management’s representations concerning the finances of the District. Consequently, management assumes full responsibility for the completeness and reliability of all of the information presented in this report. To provide a reasonable basis for making these representations, management of the District has established a comprehensive internal control framework that is designed both to protect the District’s assets from loss, theft, or misuse and to compile sufficient reliable information for the preparation of the District’s financial statements in conformity with accounting principles generally accepted in the United States of America. Because the cost of internal controls should not outweigh their benefits, the District’s comprehensive framework of internal controls has been designed to provide reasonable rather than absolute assurance that the financial statements will be free of material misstatement. As management, we assert that, to the best of our knowledge and belief, this financial report is complete and reliable in all material respects.
The District’s financial statements have been audited by Henry & Horne, LLP, a certified public accounting firm. The goal of the independent audit was to provide reasonable assurance that the financial statements of the District for the fiscal year ended June 30, 2018, are free of material misstatement. The independent audit involved examining, on a test basis, evidence supporting the amounts and disclosures in the financial statements; assessing the accounting principles used and significant estimates made by management; and evaluating the overall financial statement presentation. The independent auditors concluded, based upon the audit, that there was a reasonable basis for rendering an unmodified opinion that the District’s financial statements for the fiscal year ended June 30, 2017, are fairly presented in conformity with accounting principles generally accepted in the United States of America. The independent auditor’s report is presented as the first component of the financial section of this report.
The independent audit of the financial statements of the District was part of a broader, federally mandated Single Audit as required by the provisions of the Single Audit Act Amendments of 1996 and U.S. Office of Management and Budget Circular A-133, Audits of States, Local Governments and Non-Profit Organizations designed to meet the special needs of federal grantor agencies. The standards governing Single Audit engagements require the independent auditor to report not only on the fair presentation of the financial statements, but also on the District’s internal controls and compliance with legal requirements, with special emphasis on internal controls and legal requirements involving the administration of Federal awards. These reports are available in a separately issued Single Audit Reporting Package.
L
Accounting principles generally accepted in the United States of America require that management provide a narrative introduction, overview, and analysis to accompany the basic financial statements in the form of Management’s Discussion and Analysis (MD&A). This letter of transmittal is designed to complement the MD&A and should be read in conjunction with it. The District’s MD&A can be found immediately following the report of the independent auditors.
PROFILE OF THE DISTRICT
The District is one of 58 public school districts located in Maricopa County, Arizona. It provides a program of public education from kindergarten through grade 12, with an estimated current enrollment of 1,380.
The District’s Governing Board is organized under Section 15-321 of the Arizona Revised Statutes (A.R.S.). Management of the District is independent of other state or local governments. The County Treasurer collects taxes for the District, but exercises no control over its expenditures/expenses.
The membership of the Governing Board consists of five members elected by the public. Under existing statutes, the Governing Board’s duties and powers include, but are not limited to, the acquisition, maintenance and disposition of school property; the development and adoption of a school program; and the establishment, organization and operation of schools. The Board also has broad financial responsibilities, including the approval of the annual budget, and the establishment of a system of accounting and budgetary controls.
The financial reporting entity consists of a primary government and its component units. A component unit is a legally separate entity that must be included in the reporting entity in conformity with generally accepted accounting principles. The District is a primary government because it is a special-purpose government that has a separately elected governing body, is legally separate, and is fiscally independent of other state or local governments. Furthermore, there are no component units combined with the District for financial statement presentation purposes, and the District is not included in any other governmental reporting entity. Consequently, the District’s financial statements include only the funds of those organizational entities for which its elected governing board is financially accountable. The District’s major operations include education, student transportation, construction and maintenance of District facilities, food services, bookstore, and athletic functions.
The District was founded in 1970 and encompasses approximately 24 square miles. The District is situated in the central portion of Maricopa County, Arizona in the east sector of the greater Phoenix metropolitan area. The estimated population within the District is 23,031.
The District has three schools with a fiscal year 2017-18 average daily membership of 1358, a decrease of 6 percent over the previous school year. About 155 employees work in the District. The District has a sizable tax base of above-average income and housing values.
While residential building has been sluggish due to economic factors, the tax base remains stable and above average for the community. The Town of Fountain Hills was founded in 1970 and incorporated in 1989. Fountain Hills had a 1990 population of 10,030 and a 2016 estimated population of 24,482, an increase of 144%. The District has experienced a decline in student population over the past several years. The apparent major
LL

cause behind the shift in student generation in Fountain Hills District appears to be the aging of the existing population and the shift toward older home buyers, both with and without children.
The annual expenditure budget serves as the foundation for the District’s financial planning and control. The objective of these budgetary controls is to ensure compliance with legal provisions embodied in the annual expenditure budget approved by the District’s Governing Board.
The expenditure budget is prepared by fund for all Governmental Funds, and includes function and object code details for the General Fund and some Special Revenue and Capital Projects Funds. The legal level of budgetary control (that is, the level at which expenditures cannot exceed the appropriated amount) is established at the individual fund level for all funds. Funds that are not required to legally adopt a budget may have over-expenditures of budgeted funds. The budget for these funds is simply an estimate and does not prevent the District from exceeding the budget as long as the necessary revenue is earned. The District is not required to prepare an annual budget of revenue; therefore, a deficit budgeted fund balance may be presented. However, this does not affect the District’s ability to expend monies.
FACTORS AFFECTING FINANCIAL CONDITION
The information presented in the financial statements is perhaps best understood when it is considered from the broader perspective of the specific environment within which the District operates.
Local Economy. Maricopa County is located in the south-central portion of Arizona and encompasses an area of approximately 9,203 square miles. Its 2010 Census population was estimated at 3,817,117 and is expected to reach 6 million by 2028. It is by far Arizona’s most populous county, encompassing well more than half of the state’s residents. Maricopa County for some time enjoyed an unemployment rate that was somewhat lower than the national average. The county seat is Phoenix, which is Arizona’s largest city and capital.
Service is still the largest employment sector in the County, partly fueled by the tourist industry. The County has excellent accommodations, diverse cultural and recreational activities, and a favorable climate attracting millions to the area annually. Wholesale and retail trade is the second largest employment category, employing over a quarter million people
Manufacturing consisting primarily of high technology companies is the third largest employer. Other factors aiding economic growth include major expansions of the international airport serving the area, a favorable business climate and the presence of a well-developed and expanding transportation infrastructure.
Phoenix was home to seventeen Fortune 1000 companies in 2018. Technology based companies include GoDaddy, Benchmark Electronics, Microchip Technology, Amkor Technology, ON Semiconductor, Avnet and Insight Enterprises. Real estate development includes Meritage Homes and Taylor Morrison Homes. Service and consumer oriented corporations include Pinnacle West Capital, Sprouts Farmers Market, Magellan Health, Republic Services, and Knight-Swift Transportation. Manufacturing companies First Solar, Carlisle, and global mining corporation Freeport-McMoran complete the list for 2018.
LLL

The largest non-government employer is Banner Health with over 39,000 employees. Intel has one of their largest sites here, employing about 11,000 employees and 3 chip manufacturing fabrication facilities. The military has a significant presence in Phoenix with Luke Air Force Base located in the western suburbs. In addition, the metropolitan area provides excellent educational and training opportunities through seven community colleges, four private colleges and graduate schools, and one state university.
Long-term Financial Planning. The district has been experiencing a decrease in average daily membership over the past eight years. At the current time, with no large scale new development projects on the horizon, no significant enrollment increase is projected for the near future. In August 2011, to address projected declining enrollment, the District closed the original Four Peaks Elementary School site which served as an intermediate school for grades 3 through 5. Following the closure of this site, third-grade students were transferred to McDowell Mountain Elementary and fourth and fifth grades were relocated to the Fountain Hills Middle School site. While sharing one site, Four Peaks Elementary and Fountain Hills Middle School were two distinct schools. The closure of the school saved the District approximately $127,000 in M&O costs. The Four Peaks building is being properly and adequately maintained and transitioned to become an East Valley Institute of Technology (EVIT) campus beginning in August 2017. The District estimates that it can accommodate up to 1000 additional students at the other three sites in the event of new student growth. For the 2017-18 school year, Four Peaks Elementary and the middle school were formally merged into a single entity school with the name of Fountain Hills Middle School.
AWARDS AND ACKNOWLEDGMENTS
Awards. The Association of School Business Officials International (ASBO) awarded a Certificate of Excellence in Financial Reporting to the District for its comprehensive annual financial report for the fiscal year ended June 30, 2014. This was the seventh year that the District has received this prestigious award. In addition, the Government Finance Officers Association (GFOA) awarded a Certificate of Achievement for Excellence in Financial Reporting to the District for its comprehensive annual financial report for the fiscal year ended June 30, 2013. In order to be awarded these certificates, the District published an easily readable and efficiently organized comprehensive annual financial report. This report satisfied both accounting principles generally accepted in the United States of America and applicable legal requirements.
These certificates are valid for a period of one year only. We believe that our current comprehensive annual financial report continues to meet the programs’ requirements and we are submitting it to ASBO and GFOA to determine its eligibility for the fiscal year ended June 30, 2018 certificates.
LY

Y


FOUNTAIN HILLS UNIFIED SCHOOL DISTRICT NO. 98
LIST OF PRINCIPAL OFFICIALS
GOVERNING BOARD
Edith Stock President
Jill Reed Judith Rutkowski Vice President Member
Dr. C.T. Wright Dr. Wendy Barnard Member Member
ADMINISTRATIVE STAFF
Dr. Robert Allen Superintendent
YLL

Fountain Hills Unified School District #98 District Organization Chart
2017-2018
FHUSD Governing Board Edith Stock, President Jill Reed, Vice President Dr. C.T. Wright Judith Rutkowski Dr. Wendy Barnard
Superintendent
Director Transportation
Assistant Superintendent for Business Operations
Executive Director of Human Resources and Student Services
Principals McDowell Mountain Elem.
School Fountain Hills Middle School Fountain Hills High School
COMMUNITY
Executive Assistant Network Admin.
Student Services Specialist
2017-2018
Director Food Service
Facilities Plant Foremen
Accounts Payable
Purchasing/ Receptionist
Payroll
System Analyst
I.T. Specialist
Special Education and Related
Services
Human Resources
YLLL

FINANCIAL SECTION


INDEPENDENT AUDITORS' REPORT
To the Governing Board Fountain Hills Unified School District No. 98 Fountain Hills, AZ
Report on the Financial Statements
We have audited the accompanying financial statements of the governmental activities, each major fund, and the aggregate remaining fund information of Fountain Hills Unified School District No. 98 (District) as of and for the year ended June 30, 2018, and related notes to the financial statements, which collectively comprise the District’s basic financial statements, as listed in the table of contents.
Management’s Responsibility for the Financial Statements
Management is responsible for the preparation and fair presentation of these financial statements in accordance with accounting principles generally accepted in the United States of America; this includes the design, implementation, and maintenance of internal control relevant to the preparation and fair presentation of financial statements that are free from material misstatement, whether due to fraud or error.
Auditors’ Responsibility
Our responsibility is to express opinions on these financial statements based on our audit. We conducted our audit in accordance with auditing standards generally accepted in the United States of America and the standards applicable to financial audits contained in Government Auditing Standards, issued by the Comptroller General of the United States. Those standards require that we plan and perform the audit to obtain reasonable assurance about whether the financial statements are free from material misstatement.
An audit involves performing procedures to obtain audit evidence about the amounts and disclosures in the financial statements. The procedures selected depend on the auditors’ judgment, including the assessment of the risks of material misstatement of the financial statements, whether due to fraud or error. In making those risk assessments, the auditor considers internal control relevant to the entity’s preparation and fair presentation of the financial statements in order to design audit procedures that are appropriate in the circumstances, but not for the purpose of expressing an opinion on the effectiveness of the entity’s internal control. Accordingly, we express no such opinion. An audit also includes evaluating the appropriateness of accounting policies used and the reasonableness of significant accounting estimates made by management, as well as evaluating the overall presentation of the financial statements.
We believe that the audit evidence we have obtained is sufficient and appropriate to provide a basis for our audit opinions.
Tempe • Scottsdale • Casa Grande www.hhcpa.com
Opinions In our opinion, the financial statements referred to above present fairly, in all material respects, the respective financial position of the governmental activities, each major fund, and the aggregate remaining fund information of Fountain Hills Unified School District No. 98 as of June 30, 2018, and the respective changes in its financial position for the year then ended in accordance with accounting principles generally accepted in the United States of America. Emphasis of Matter Change in Accounting Principle As discussed in Note 1 to the financial statements, the Governmental Accounting Standards Board (GASB) issued Statement No. 75, Accounting and Financial Reporting for Postemployment Benefits Other than Pensions, as amended by GASB Statement No. 85, Omnibus 2017, that could have a material impact on the financial statements. For the Fountain Hills Unified School District No, 98, GASB Statement No. 75 has had a material effect on the District’s financial statements and disclosures. Our opinion is not modified with respect to this matter. Other Matters Required Supplementary Information Accounting principles generally accepted in the United States of America require that the management's discussion and analysis, pension and OPEB information and budgetary schedules, as listed in the table of contents, are presented to supplement the basic financial statements. Such information, although not a part of the basic financial statements, is required by the Governmental Accounting Standards Board, who considers it to be an essential part of financial reporting for placing the basic financial statements in an appropriate operational, economic, or historical context. We have applied certain limited procedures to the required supplementary information in accordance with auditing standards generally accepted in the United States of America, which consisted of inquiries of management about the methods of preparing the information and comparing the information for consistency with management's responses to our inquiries, the basic financial statements, and other knowledge we obtained during our audit of the basic financial statements. We do not express an opinion or provide any assurance on the information because the limited procedures do not provide us with sufficient evidence to express an opinion or provide any assurance. Other Information Our audit was conducted for the purpose of forming opinions on the financial statements that collectively comprise the Fountain Hills Unified School District No. 98 basic financial statements. The introductory section, other supplementary information, and statistical section are presented for purposes of additional analysis and are not a required part of the basic financial statements.

The other supplementary information is the responsibility of management and was derived from and relate directly to the underlying accounting and other records used to prepare the basic financial statements. Such information has been subjected to the auditing procedures applied in the audit of the basic financial statements and certain additional procedures, including comparing and reconciling such information directly to the underlying accounting and other records used to prepare the basic financial statements or to the basic financial statements themselves, and other additional procedures in accordance with auditing standards generally accepted in the United States of America. In our opinion, the supplementary information is fairly stated in all material respects in relation to the basic financial statements as a whole. The introductory and statistical sections have not been subjected to the auditing procedures applied in the audit of the basic financial statements and, accordingly, we do not express an opinion or provide any assurance on them. Other Reporting Required by Government Auditing Standards In accordance with Government Auditing Standards, we have also issued our report dated January 24, 2019, on our consideration of the District’s internal control over financial reporting and on our tests of its compliance with certain provisions of laws, regulations, contracts, and grant agreements and other matters. The purpose of that report is to describe the scope of our testing of internal control over financial reporting and compliance and the results of that testing, and not to provide an opinion on internal control over financial reporting or on compliance. That report is an integral part of an audit performed in accordance with Government Auditing Standards in considering the District’s internal control over financial reporting and compliance.
Casa Grande, Arizona January 24, 2019


FINANCIAL SECTION
MANAGEMENT’S DISCUSSION AND ANALYSIS


MANAGEMENT’S DISCUSSION AND ANALYSIS For The Year Ended June 30, 2018
As management of the Fountain Hills Unified School District No. 98 (District), we offer readers of the District's financial statements this narrative overview and analysis of the financial activities of the District for the current fiscal year.
FINANCIAL HIGHLIGHTS
x The District's total net position of governmental activities increased $852,636 from theprior fiscal year.
x General revenues accounted for $12.5 million in revenue, or 85 percent of all current fiscalyear revenues. Program specific revenues in the form of charges for services andgrants and contributions accounted for $2.2 million or 15 percent of total current fiscalyear revenues.
x The District had approximately $13.9 million in expenses related to governmentalactivities.
x Among major funds, the General Fund had $9.0 million in current fiscal year revenues,which primarily consisted of state aid and property taxes, and had $9.5 million inexpenditures. The General Fund's fund balance decrease of $2.7 million was primarilydue to an decrease in property tax revenue and an increase in support service expenditures.
OVERVIEW OF FINANCIAL STATEMENTS
This discussion and analysis are intended to serve as an introduction to the District's basic financial statements. The District's basic financial statements comprise three components: 1) government-wide financial statements, 2) fund financial statements, and 3) notes to the financial statements.
Government-wide financial statements. The government-wide financial statements are designed to provide readers with a broad overview of the District's finances, in a manner similar to a private-sector business. The accrual basis of accounting is used for the government-wide financial statements.
The statement of net position presents information on all of the District's assets and liabilities, with the difference between the two reported as net position. Over time, increases or decreases in net position may serve as a useful indicator of whether the financial position of the District is improving or deteriorating.
The statement of activities presents information showing how the District's net position changed during the most recent fiscal year. All changes in net position are reported as soon as the underlying event giving rise to the change occurs, regardless of the timing of related cash flows. Thus, revenues and expenses are reported in this statement for some items that will only result in cash flows in future fiscal periods (e.g., uncollected taxes and earned but unused compensated absences).
7

The government-wide financial statements outline functions of the District that are principally supported by property taxes and intergovernmental revenues. The governmental activities of the District include instruction, support services, operation and maintenance of plant services, student transportation services, operation of non-instructional services, and interest on long-term debt. Fund financial statements. A fund is a grouping of related accounts that is used to maintain control over resources that have been segregated for specific activities or objectives. The District uses fund accounting to ensure and demonstrate compliance with finance-related legal requirements. Governmental funds. Governmental funds are used to account for essentially the same functions reported as governmental activities in the government-wide financial statements. However, unlike the government-wide financial statements, governmental fund financial statements use the modified accrual basis of accounting and focus on near-term inflows of spendable resources, as well as on balances of spendable resources available at the end of the fiscal year. Such information may be useful in evaluating the District's near-term financing requirements. Because the focus of governmental funds is narrower than that of the government-wide financial statements, it is useful to compare the information presented for governmental funds with similar information presented for governmental activities in the government-wide financial statements. By doing so, readers may better understand the long-term impact of the District's near-term financing decisions. Both the governmental fund balance sheet and the governmental fund statement of revenues, expenditures and changes in fund balances provide a reconciliation to facilitate this comparison between governmental funds and governmental activities. Information is presented separately in the governmental fund balance sheet and in the governmental fund statement of revenues, expenditures and changes in fund balances for the General, Title I, Special Education Grants, Unrestricted Capital Outlay, Bond Building and Debt Service Funds, all of which are considered to be major funds. Data from the other governmental funds are combined into a single, aggregated presentation. Notes to the financial statements. The notes provide additional information that is essential to a full understanding of the data provided in the government-wide and fund financial statements. The notes to the financial statements can be found immediately following the basic financial statements. Other information. In addition to the basic financial statements and accompanying notes, this report also presents certain required supplementary information concerning the District's budget process. The District adopts an annual expenditure budget for all governmental funds. A schedule of revenues, expenditures and changes in fund balances - budget and actual has been provided for the General Fund as required supplementary information.
8

GOVERNMENT-WIDE FINANCIAL ANALYSIS
Net position may serve over time as a useful indicator of a government's financial position. In the case of the District, assets exceeded liabilities by $28.6 million at the current fiscal year end.
The largest portion of the District’s net position reflects its investment in capital assets (e.g., land and improvements; buildings and improvements; and vehicles, furniture, and equipment). The District uses these capital assets to provide services to its students; consequently, these assets are not available for future spending.
The following table presents a summary of the District’s net position for the fiscal years ended June 30, 2018 and June 30, 2017:
June 30, 2018 June 30, 2017
Current Assets 10,002,819$ 10,963,544$ Capital assets, net 42,456,587 43,818,865 Total assets, net 52,459,406 54,782,409
Deferred outflows of resources 1,259,450 1,986,391
Current liabilities 2,260,400 2,653,938 Long-term liabilities 21,418,598 23,597,452 Total liabilities 23,678,998 26,251,390
Deferred inflows of resources 1,534,993 2,868,301
Net position: Net investment in capital assets 30,537,965 30,567,808 Restricted 4,552,848 4,677,340 Unrestricted (6,585,948) (7,596,039)
Total net position 28,504,865$ 27,649,109$
The District’s financial position is the product of several financial transactions including the net result of activities, and the deprecation of capital assets. The largest portion of the net position reflects the District’s investment in capital assets. The net investment in capital assets increased as a result of payments made on debt related to capital asset acquisition.
The District reported $4.6 million in restricted net position represents the accumulation of assets that are subject to external restrictions. The majority of the accumulated assets are restricted for capital improvements.
Unrestricted net position increased $1.0 million which is largely due to the District reducing expenditures from the prior fiscal year.
9

Changes in net position. The District’s total revenues for the current fiscal year were $14.7 million. The total cost of all programs and services was $13.9 million. The following table presents a summary of the changes in net position for the fiscal years ended June 30, 2018 and June 30, 2017:
June 30, 2018 June 30, 2017Revenues: Program Revenues: Charges for services 344,998$ 472,084$ Operating grants and contributions 1,602,343 1,855,188 Capital grants and contributions 232,317 50,299 General Revenues: Property taxes 8,668,749 11,188,516 Unrestricted federal aid 623,576 29,767 Unrestricted state aid 2,872,663 3,092,445 Investment income 100,348 44,861 Miscellaneous 275,683 609,829 Total revenues 14,720,677 17,342,989
Expenses: Instruction 7,077,129 8,026,034 Support services - students and staff 1,160,198 1,217,458 Support services - administration 1,947,647 1,733,521 Operation and maintainance of plant services 1,999,971 2,063,955 Student transportation services 909,787 956,193 Operation of non-instructional services 402,629 383,077 Interest of long-term debt 370,680 418,480 Total expenses 13,868,041 14,798,718 Change in net position 852,636 2,544,271 Net position, beginning of year 27,649,109 25,104,838
Net posistion, end of year 28,504,865$ 27,649,109$
T he net cost is the financial burden that was placed on the State and District's taxpayers by each of the functions presented on the Statement of Net Position. Total revenues decreased $2.6 million from the prior year. This is largely due to a decrease in property tax revenue of $2.5 million. Overall expenses decreased by $930,677 from the prior year. The following table presents the cost of the District’s major functional activities. The table also shows each function’s net cost (total cost less charges for services generated by the activities and intergovernmental aid provided for specific programs). The net cost shows the financial burden that was placed on the State and District’s taxpayers by each of these functions.
Total Net(Expense)/ Total Net(Expense)/Expenses Revenue Expenses Revenue
Instruction 7,077,129$ (5,376,935)$ 8,026,034$ (6,084,164)$ Support services - students and staff 1,160,198 (1,160,198) 1,217,458 (1,217,458) Support services - administration 1,947,647 (1,947,647) 1,733,521 (1,733,521) Operation and maintainance of plant services 1,999,971 (1,777,299) 2,063,955 (1,996,459) Student transportation services 909,787 (909,787) 956,193 (956,193) Operation of non-instructional services 402,629 (145,837) 383,077 (14,872) Interest of long-term debt 370,680 (370,680) 418,480 (418,480) Total expenses 13,868,041$ (11,688,383)$ 14,798,718$ (12,421,147)$
Year ended June 30, 2018 Year ended June 30, 2017
10

Federal and State grants, charges for services, and other contributions were used to finance $2.2 million of the Districts $13.9 in expenses. The net costs of the District’s activities of $11.7 million was financed by general revenue, which are made up of mainly property taxes of $8.7 million and state aid which is made up of $2.9 million.
FINANCIAL ANALYSIS OF THE DISTRICT'S FUNDS
As noted earlier, the District uses fund accounting to ensure and demonstrate compliance with finance-related legal requirements.
Governmental funds. The focus of the District’s governmental funds is to provide information on near-term inflows, outflows, and balances of spendable resources. Such information is useful in assessing the District’s financing requirements. In particular, unassigned fund balance may serve as a useful measure of the District’s net resources available for spending at the end of the fiscal year.
The financial performance of the District as a whole is reflected in its governmental funds. As the District completed the year, its governmental funds reported a combined fund balance of $6.� million.
The General Fund is the principal operating fund of the District. The decrease in fund balance of $2.5 million to $2.0 million as of fiscal year end was a result of a decrease in property taxes exceeding the reduction of expenditures.
The Title I Grant Fund had an increase in fund balance due to increase in grant revenue for the current year.
The Special Education Grant fund had a decrease in fund balance of $233,800 which was due to a decrease in grant revenues for the fiscal year.
The Unrestricted Capital Outlay Fund had $902,544 in current fiscal year revenues, which primarily consisted of property taxes, and had $754,746 in expenditures. The Unrestricted Capital Outlay Fund's fund balance increased from $1.6 million at the prior fiscal year end to $1.8 million at the end of the current fiscal year was primarily due to a decrease in expenditures.
The Bond Building Fund had a decrease in fund balance of $536,070. The decrease is due the District utilizing bond proceeds issued in the prior year.
The Debt Service Fund had an increase in fund balance of $48,864. This is a result of property tax revenues exceeding bond payments principal and interest payments for the fiscal year.
11

BUDGET HIGHLIGHTS
Over the course of the year, the District revised the General Fund annual expenditure budget. The difference between the original budget and the final amended budget was $199,013 increase, or 1.6 percent and was a result of increased state funding made during the year.
Significant variances for the final amended budget and actual revenues resulted from the District not being required by the State of Arizona to prepare a revenue budget. A schedule showing the original and final budget amounts compared to the District's actual financial activity for the General Fund is provided in this report as required supplementary information. There were no significant variances between the final amended budget and actual expenditures.
CAPITAL ASSETS AND DEBT ADMINISTRATION
Capital Assets. As of year-�end, the District had invested $42.5 million in capital assets, including school buildings, athletic facilities, buses and other vehicles, computers, and other equipment. Additions to the capital assets for the current year were $1.1 million. A majority of the increase was related to the purchase of new school buses and school improvements.
Additional information on the District's capital assets can be found in Note 5.
ECONOMIC FACTORS AND NEXT YEAR'S BUDGET AND RATES
Many factors were considered by the District’s administration during the process of developing the fiscal year 2018-19 budget. Among them:
x Fiscal year 2017-18 budget balance carry forward.
x Changes in student population
x Changes in funding at the state level.
Also considered in the development of the budget is the local economy and inflation of the surrounding area.
Budgeted expenditures in the General Fund increased 1.4% in fiscal year 2018-19. increased teacher salaries is the primary reason for the increase. State aid and property taxes are expected to be the primary funding sources.
CONTACTING THE DISTRICT'S FINANCIAL MANAGEMENT
This financial report is designed to provide our citizens, taxpayers, and investors and creditors with a general overview of the District's finances and to demonstrate the District's accountability for the resources i t receives. If you have questions abou t t h i s report or need additional information, contact the Business and Support Services Department, Fountain Hills Unified School District No. 98, 16000 East Palisades Boulevard, Fountain Hills, Arizona 85268.
12

FINANCIAL SECTION
BASIC FINANCIAL STATEMENTS


GOVERNMENT – WIDE FINANCIAL STATEMENTS


FOUNTAIN HILLS UNIFIED SCHOOL DISTRICT NO. 98STATEMENT OF NET POSITION
GovernmentalActivities
AssetsCash and investments 7,699,629$ Property taxes receivable 1,550,675 Due from other governments 717,042 Net OPEB Asset 35,473 Capital assets:
Nondepreciable capital assets 2,860,836 Other capital assets (net of accumulated depreciation) 39,595,751 Total assets 52,459,406
Deferred Outflows of ResourcesDeferred outflows related to pensions 531,954 Deferred employer contributions to pensions 727,496
Total deferred outflows of resources 1,259,450
LiabilitiesAccounts payable 480,553 Accrued payroll and employee benefits 116,862 Accrued interest 198,500 Noncurrent liabilities:
Due within one year:Compensated absences 64,485 Bonds payable 1,400,000
Due in more than one year:Compensated absences 365,417 Bonds payable 10,518,622 Net OPEB liability 24,048 Net pension liability 10,510,511
Total liabilities 23,678,998
Deferred Inflows of ResourcesDeferred inflows related to pensions 1,534,993
Net PositionNet Investment in capital assets 30,537,965 Restricted for:
Voter approved initiatives 625,619 Federal and state projects 188,592 Food service 54,909 Joint technical education 257,975 Extracurricular activities 506,454 Other local initiatives 144,021 Debt service 178,560 Capital outlay 2,596,718
Unrestricted (deficit) (6,585,948)
Total net position 28,504,865$
June 30, 2018
17See accompanying notes.
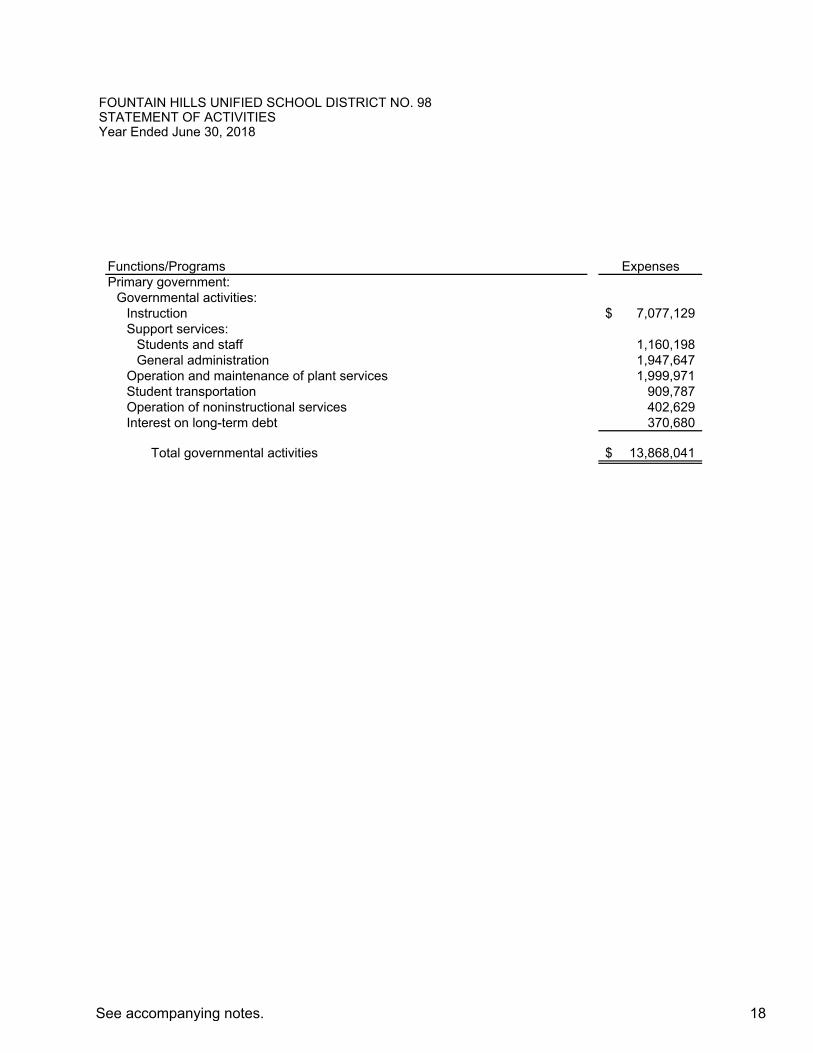
Functions/Programs ExpensesPrimary government:
Governmental activities:Instruction 7,077,129$ Support services:
Students and staff 1,160,198 General administration 1,947,647
Operation and maintenance of plant services 1,999,971 Student transportation 909,787 Operation of noninstructional services 402,629 Interest on long-term debt 370,680
Total governmental activities 13,868,041$
STATEMENT OF ACTIVITIESFOUNTAIN HILLS UNIFIED SCHOOL DISTRICT NO. 98
Year Ended June 30, 2018
18See accompanying notes.

Net (Expense) Revenue andChanges in
Program Revenues Net PositionOperating Capital
Charges for Grants and Grants and GovernmentalServices Contributions Contributions Activities
56,760$ 1,602,343$ 41,091$ (5,376,935)$
- - - (1,160,198) - - - (1,947,647)
31,446 - 191,226 (1,777,299) - - - (909,787)
256,792 - - (145,837) - - - (370,680)
344,998$ 1,602,343$ 232,317$ (11,688,383)
General revenues:Taxes:
Property taxes, levied for general purposes 5,998,078 Property taxes, levied for debt services 1,829,604 Property taxes, levied for capital outlay 841,067
Investment earnings 100,348 Unrestricted state aid 2,872,663 Unrestricted federal aid 623,576 Miscellaneous 275,683
Total general revenues 12,541,019
Change in net position 852,636
Net position, beginning of year 27,649,109 Restatement 3,120
Net position, beginning of year - restated 27,652,229
Net position, end of year 28,504,865$
19


FINANCIAL SECTION
GOVERNMENTAL FUND FINANCIAL STATEMENTS

GeneralFund Title I
ASSETSCash and cash equivalents 1,330,489$ -$ Receivables Property taxes 1,253,765 - Due from other funds 389,563 - Due from other governments 112,332 60,686
Total assets 3,086,149$ 60,686$
LIABILITIES Accounts payable 111,182$ -$ Accrued payroll and employee benefits 109,746 - Matured interest payable - - Due to other funds - 41,042 Matured bonds payable - - Total liabilities 220,928 41,042
DEFERRED INFLOW OF RESOURCES Deferred revenue - property taxes 819,172 - Deferred revenue - intergovernmental - 60,686 Total deferred inflows of resources 819,172 60,686
FUND BALANCES Restricted
Voter approved initiatives - - Federal and state projects - - Food service - - Joint technical education - - Extracurricular activities - - Other local initiatives - - Debt service - - Capital outlay 103,874 -
Assigned - - Unassigned 1,942,175 (41,042) Total fund balances 2,046,049 (41,042)
Total liabilities, deferred inflow of resources and fund balance 3,086,149$ 60,686$
June 30, 2018GOVERNMENTAL FUNDSBALANCE SHEETFOUNTAIN HILLS UNIFIED SCHOOL DISTRICT NO. 98
22See accompanying notes.

Special Unrestricted TotalEducation Capital Bond Debt Nonmajor Governmental
Grants Outlay Building Service Funds Funds
-$ 1,863,522$ 822,327$ 1,660,865$ 2,022,426$ 7,699,629$
- 160,066 - 136,844 - 1,550,675 - - - - - 389,563
233,800 - - - 310,224 717,042
233,800$ 2,023,588$ 822,327$ 1,797,709$ 2,332,650$ 10,356,909$
-$ 202,846$ 155,072$ -$ 11,453$ 480,553$ 3,355 - - - 3,761 116,862
- - - 198,500 - 198,500 230,445 - - - 118,076 389,563
- - - 1,400,000 - 1,400,000 233,800 202,846 155,072 1,598,500 133,290 2,585,478
- 15,296 - 20,649 - 855,117 233,800 - - 130,170 424,656 233,800 15,296 - 20,649 130,170 1,279,773
- - - - 625,619 625,619 - - - - 188,592 188,592 - - - - 54,909 54,909 - - - - 257,975 257,975 - - - - 506,454 506,454 - - - - 144,021 144,021 - - - 178,560 - 178,560 - 1,805,446 667,255 - 20,143 2,596,718 - - - - 296,736 296,736
(233,800) - - - (25,259) 1,642,074 (233,800) 1,805,446 667,255 178,560 2,069,190 6,491,658
233,800$ 2,023,588$ 822,327$ 1,797,709$ 2,332,650$ 10,356,909$
23

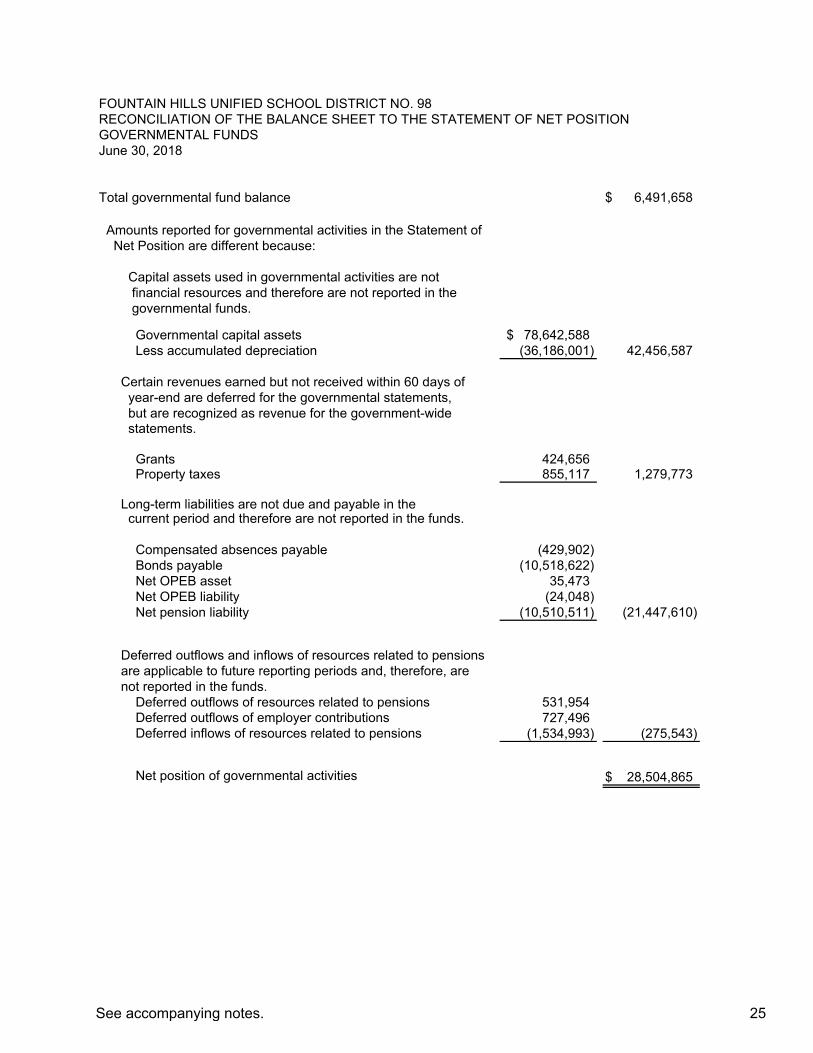
Total governmental fund balance 6,491,658$
Amounts reported for governmental activities in the Statement ofNet Position are different because:
Capital assets used in governmental activities are not financial resources and therefore are not reported in the governmental funds.
Governmental capital assets 78,642,588$ Less accumulated depreciation (36,186,001) 42,456,587
Certain revenues earned but not received within 60 days ofyear-end are deferred for the governmental statements, but are recognized as revenue for the government-widestatements.
Grants 424,656Property taxes 855,117 1,279,773
Long-term liabilities are not due and payable in thecurrent period and therefore are not reported in the funds.
Compensated absences payable (429,902) Bonds payable (10,518,622) Net OPEB asset 35,473 Net OPEB liability (24,048) Net pension liability (10,510,511) (21,447,610)
Deferred outflows and inflows of resources related to pensionsare applicable to future reporting periods and, therefore, arenot reported in the funds.
Deferred outflows of resources related to pensions 531,954Deferred outflows of employer contributions 727,496Deferred inflows of resources related to pensions (1,534,993) (275,543)
Net position of governmental activities 28,504,865$
FOUNTAIN HILLS UNIFIED SCHOOL DISTRICT NO. 98RECONCILIATION OF THE BALANCE SHEET TO THE STATEMENT OF NET POSITIONGOVERNMENTAL FUNDSJune 30, 2018
25See accompanying notes.

GeneralFund Title I
REVENUES Property taxes 5,991,393$ -$ Intergovernmental grants and aid:
Federal 315,156 44,669 State 2,075,647 - Other local 625,805 - Total revenues 9,008,001 44,669
EXPENDITURESCurrent:Instruction 4,368,654 67,729 Support services:
Students and staff 993,736 - General administration 1,956,882 -
Operation and maintenance of plant 1,480,348 - Student transportation 733,380 - Operation of noninstructional services - - Debt service:
Principal - - Interest and other charges - -
Capital outlay - - Total expenditures 9,533,000 67,729
Excess (deficiency) of revenues over expenditures (524,999) (23,060)
OTHER FINANCING SOURCES (USES)Transfers in 28,152 - Transfers out - (5,000)
Total other financing sources and uses 28,152 (5,000)
Net change in fund balances (496,847) (28,060)
Fund balances, beginning of year 2,542,896 (12,982)
Fund balances, end of year 2,046,049$ (41,042)$
FOUNTAIN HILLS UNIFIED SCHOOL DISTRICT NO. 98STATEMENT OF REVENUES, EXPENDITURES, AND CHANGES IN FUND BALANCEGOVERNMENTAL FUNDSYear Ended June 30, 2018
26See accompanying notes.
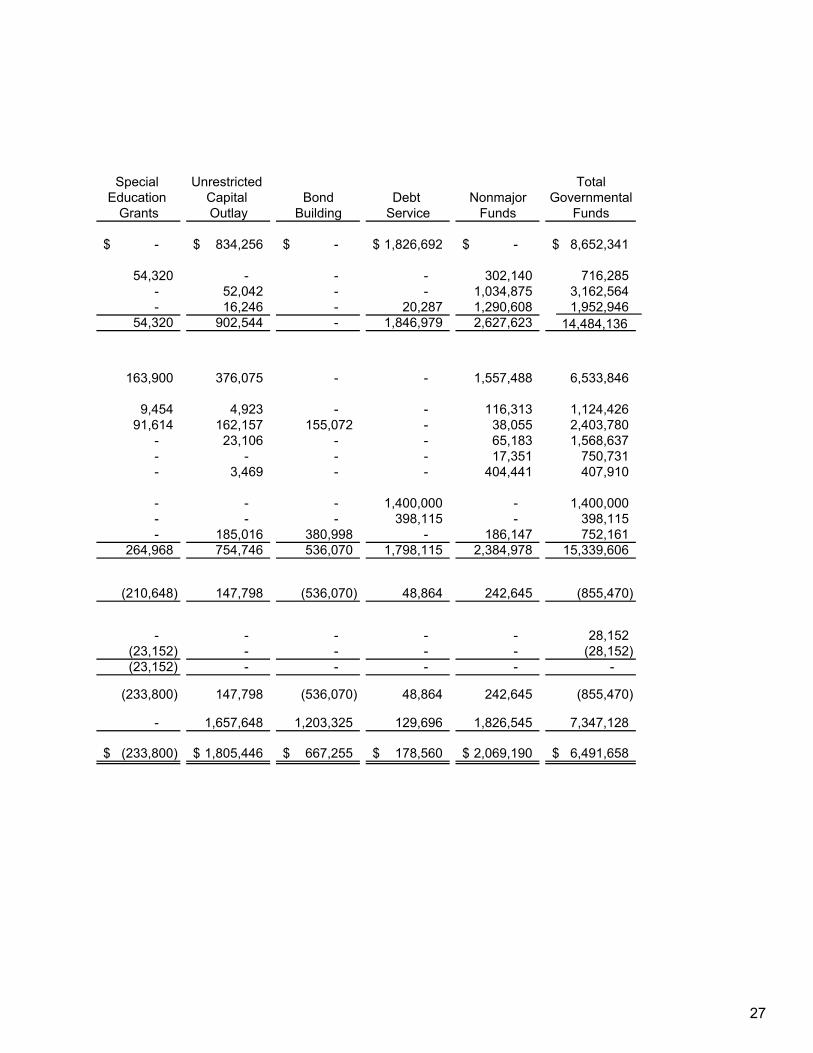
Special Unrestricted TotalEducation Capital Bond Debt Nonmajor Governmental
Grants Outlay Building Service Funds Funds
-$ 834,256$ -$ 1,826,692$ -$ 8,652,341$
54,320 - - - 302,140 716,285 - 52,042 - - 1,034,875 3,162,564 - 16,246 - 20,287 1,290,608 1,952,946
54,320 902,544 - 1,846,979 2,627,623 14,484,136
163,900 376,075 - - 1,557,488 6,533,846
9,454 4,923 - - 116,313 1,124,426 91,614 162,157 155,072 - 38,055 2,403,780
- 23,106 - - 65,183 1,568,637 - - - - 17,351 750,731 - 3,469 - - 404,441 407,910
- - - 1,400,000 - 1,400,000 - - - 398,115 - 398,115 - 185,016 380,998 - 186,147 752,161
264,968 754,746 536,070 1,798,115 2,384,978 15,339,606
(210,648) 147,798 (536,070) 48,864 242,645 (855,470)
- - - - - 28,152 (23,152) - - - - (28,152)(23,152) - - - - -
(233,800) 147,798 (536,070) 48,864 242,645 (855,470)
- 1,657,648 1,203,325 129,696 1,826,545 7,347,128
(233,800)$ 1,805,446$ 667,255$ 178,560$ 2,069,190$ 6,491,658$
27

Net change in fund balances—total governmental funds (855,470)$
Amounts reported for governmental activities in the Statement ofActivities are different because:
Governmental funds report capital outlays as expenditures.However, in the Statement of Activities the cost of those assetsis allocated over their estimated useful lives as depreciationexpense.
Expenditures for capitalized assets 841,706$ Current year depreciation (2,203,984) (1,362,278)
District pension/OPEB contributions are reported as expendituresin the governmental funds when made. However, they are reportedas deferred outflows of resources in the Statement of Net Positionbecause the reported net pension/OPEB asset/(liability) is measureda year before the District's report date. pension/OPEB expense,which is the change in the net pension/OPEB asset/(liability)adjusted changes in deferred outflows and inflows of resourcesrelated to pension/OPEBs, in reported in the Statement of Activities
District pension/OPEB contributions 727,495Pension/OPEB expense 570,453 1,297,948
Revenues in the Statement of Activities that do not provide current financial resources are not reported as revenues in the funds and revenues received in the current year that were accrued in theStatement of Activities in prior years are reported as revenuesin the funds.
Grants 220,133 Property taxes 16,408 236,541
Repayment of long-term debt are expenditures in the governmental funds, but the repayment reduces long-term liabilities in the Statement of Net Position.
Debt principal retirement 1,400,000Amortization of bond premiums 27,435
Compensated absences expenses reported in the Statement of Activities do not require the use of current financial resources and therefore are not reported as expenditures in governmental funds. 108,460Change in net position of governmental activities 852,636$
FOUNTAIN HILLS UNIFIED SCHOOL DISTRICT NO. 98RECONCILIATION OF THE STATEMENT OF REVENUES,
TO THE STATEMENT OF ACTIVITIESYear Ended June 30, 2018
EXPENDITURES, AND CHANGES IN FUND BALANCES OF GOVERNMENTAL FUNDS
28See accompanying notes.

FINANCIAL SECTION
FIDUCIARY FUND FINANCIAL STATEMENTS


StudentActivities
AssetsCash and cash equivalents 4,008$
Total Assets 4,008$
LiabilitiesDue to students 4,008$
Total liabilities 4,008$
FOUNTAIN HILLS UNIFIED SCHOOL DISTRICT NO. 98STATEMENT OF FIDUCIARY NET POSITIONFIDUCIARY FUNDSYear Ended June 30, 2018
31See accompanying notes.


FINANCIAL SECTION
NOTES TO FINANCIAL STATEMENTS


FOUNTAIN HILLS UNIFIED SCHOOL DISTRICT NO. 98 NOTES TO THE FINANCIAL STATEMENTS June 30, 2018
NOTE 1 NATURE OF OPERATIONS AND SUMMARY OF SIGNIFICANT ACCOUNTING POLICIES
The financial statements of the Fountain Hills Unified School District No. 98 (the “District”) have been prepared in conformity with accounting principles generally accepted in the United States of America as applied to government units. The Governmental Accounting Standards Board (GASB) is the accepted standard-setting body for establishing governmental accounting and financial reporting principles.
The more significant of the District’s accounting policies are described below.
Reporting Entity
The Governing Board is organized under Section 15-321 of the Arizona Revised Statutes (A.R.S.). Management of the District is independent of other state or local governments. The County Treasurer collects taxes for the District, but exercises no control over its expenditures/expenses.
The membership of the Governing Board consists of three members elected by the public. Under existing statutes, the Governing Board's duties and powers include, but are not limited to, the acquisition, maintenance and disposition of school property; the development and adoption of a school program; and the establishment, organization and operation of schools.
The Board also has broad financial responsibilities, including the approval of the annual budget, and the establishment of a system of accounting and budgetary controls.
The District is a primary government because it is a special-purpose government that has a separately elected governing body, is legally separate, and is fiscally independent of other state or local governments. Furthermore, there are no component units combined with the District for financial statement presentation purposes, and the District is not included in any other governmental reporting entity. Consequently, the District's financial statements include only the funds of those organizational entities for which its elected governing board is financially accountable. The District's major operations include education, student transportation, construction and maintenance of District facilities, food services, bookstore, and athletic functions.
Government-Wide and Fund Financial Statements
The government-wide financial statements (i.e., the statement of net assets and the statement of activities) present financial information about the District as a whole. The reported information includes all of the nonfiduciary activities of the District. For the most part, the effect of internal activity has been removed from these statements. These statements are to distinguish between the governmental and business-type activities of the District.
35

FOUNTAIN HILLS UNIFIED SCHOOL DISTRICT NO. 98 NOTES TO THE FINANCIAL STATEMENTS June 30, 2018
NOTE 1 NATURE OF OPERATIONS AND SUMMARY OF SIGNIFICANT ACCOUNTING POLICIES (Continued)
Government-Wide and Fund Financial Statements (Continued)
Governmental activities normally are supported by taxes and intergovernmental revenues, and are reported separately from business-type activities, which rely to a significant extent on fees and charges for support. The District does not have any business-type activities.
The statement of activities demonstrates the degree to which the direct expenses of a given function or segment are offset by program revenues. Direct expenses are those that are clearly identifiable with a specific function or segment. Program revenues include 1) charges to customers or applicants who purchase, use, or directly benefit from goods, services, or privileges provided by a given function or segment and 2) grants and contributions that are restricted to meeting the operational or capital requirements of a particular function or segment. Taxes, unrestricted Federal, State, and County aid, and other items not included among program revenues are reported instead as general revenues.
Separate financial statements are provided for governmental funds and fiduciary funds, even though the latter are excluded from the government-wide financial statements. Major individual governmental funds are reported as separate columns in the fund financial statements.
Basis of Accounting
Government-Wide Financial Statements - The government-wide financial statements are reported using the economic resources measurement focus and the accrual basis of accounting. Revenues are recorded when earned and expenses are recorded when a liability is incurred, regardless of the timing of related cash flows. Property taxes are recognized as revenues in the year for which they are levied. Grants and similar items are recognized as revenue as soon as all eligibility requirements imposed by the grantor or provider have been met. As a general rule, the effect of internal activity has been eliminated from the government-wide financial statements; however, the effects of interfund services provided and used between functions are reported as expenses and program revenues at amounts approximating their external exchange value.
Fund Financial Statements - Governmental fund financial statements are reported using the current financial resources measurement focus and the modified accrual basis of accounting. Revenues are recognized as soon as they are both measurable and available. Revenues are considered to be available when they are collectible within the current period or soon enough thereafter to pay liabilities of the current period. For this purpose, the District considers revenues to be available if they are collected within 60 days of the end of the current fiscal period. Expenditures generally are recorded when a liability is incurred, as under accrual accounting. However, debt service resources are provided during the current year for payment of long-term debt principal and interest due early in the following year (not to exceed one month) and, therefore, the expenditures and related liabilities have been recognized. Compensated absences are recorded only when payment is due.
36

FOUNTAIN HILLS UNIFIED SCHOOL DISTRICT NO. 98 NOTES TO THE FINANCIAL STATEMENTS June 30, 2018
NOTE 1 NATURE OF OPERATIONS AND SUMMARY OF SIGNIFICANT ACCOUNTING POLICIES (Continued)
Basis of Accounting (Continued)
Property taxes, State and County aid, tuition, and investment income associated with the current fiscal period are all considered to be susceptible to accrual and have been recognized as revenues of the current fiscal period. Food services and miscellaneous revenues are not susceptible to accrual because generally they are not measurable until received in cash. Grants and similar awards are recognized as revenue as soon as all eligibility requirements imposed by the grantor or provider have been met. Deferred revenues arise when resources are received by the District before it has legal claim to them, as when grant monies are received prior to meeting all eligibility requirements imposed by the provider.
Delinquent property taxes and other receivables that will not be collected within the available period have been reported as deferred revenue on the governmental fund financial statements.
The focus of governmental fund financial statements is on major funds rather than reporting funds by type. Each major fund is presented in a separate column. Non-major funds are aggregated and presented in a single column. Fiduciary funds are reported by fund type.
The District reports the following major governmental funds:
General Fund - The General Fund is the District's primary operating fund. It accounts for all resources used to finance District maintenance and operation except those required to be accounted for in other funds.
Title I Grant Fund – The Title I Grant Fund accounts for financial assistance received for the purpose of improving the teaching and learning of children failing, or most at-risk of failing; to meet challenging State academic standards.
Special Education Grant Fund – The Special Education Grant Fund accounts for the supplemental financial assistance received to provide a free, appropriate public education to disabled children.
Unrestricted Capital Outlay Fund – The Unrestricted Capital Outlay Fund accounts for transactions relating to the acquisition of capital items.
Bond Building Fund – The Bond Building Fund accounts for proceeds from District bond issues that are expended on the acquisition or lease of sites; construction or renovations of school buildings; supplying school buildings with furniture, equipment and technology; improving school grounds; or purchasing pupil transportation vehicles.
Debt Service – The Debt Service Fund is used to account for the accumulation of resources for, and the payment of, long-term debt principal, interest, and related costs.
37

FOUNTAIN HILLS UNIFIED SCHOOL DISTRICT NO. 98 NOTES TO THE FINANCIAL STATEMENTS June 30, 2018
NOTE 1 NATURE OF OPERATIONS AND SUMMARY OF SIGNIFICANT ACCOUNTING POLICIES (Continued)
Basis of Accounting (Continued)
Additionally, the District reports the following fund type:
Fiduciary Funds – The Fiduciary Funds are Agency Funds which account for resources held by the District on behalf of others. This fund type includes the Student Activities Fund which accounts for monies raised by students to finance student clubs and organizations held by the District as agent.
Cash and Cash Equivalents
A.R.S. require the District to deposit all cash with the County Treasurer, except as discussed below. Cash with the County Treasurer is pooled for investment purposes, except for cash of the Debt Service and Bond Building Funds that may be invested separately. Interest earned from investments purchased with pooled monies is allocated to each of the District’s funds based on their average balances. As required by statute, interest earnings of the Bond Building Fund are recorded initially in that fund, but then transferred to the Debt Service Fund. All investments are stated at fair value.
Statute authorizes the District to separately invest monies of the Bond Building and Debt Service Funds in the State Treasurer’s investment pools; obligations issued and guaranteed by the United States or any of its agencies or instrumentalities; specified state and local government bonds and notes; and interest bearing savings accounts or certificates of deposit.
Statute authorizes the District to deposit monies of the Auxiliary Operations and Student Activities Funds in bank accounts. Monies in these funds may also be invested. In addition, statute authorizes the District to maintain various bank accounts such as clearing accounts to temporarily deposit receipts before they are transmitted to the County Treasurer; revolving accounts to pay minor disbursements; and withholdings accounts for taxes and employee insurance programs. Some of these bank accounts may be interest bearing.
Statute does not include any requirements for credit risk, concentration of credit risk, interest rate risk, or foreign currency risk. Statute requires collateral for deposits of Bond Building and Debt Service Funds monies in interest bearing savings accounts and certificates of deposit at 102 percent of all deposits not covered by federal depository insurance.
Investments
Investment income is composed of interest, dividends, and net changes in the fair value of applicable investments. Investment income is included in other local revenue in the fund financial statements.
38

FOUNTAIN HILLS UNIFIED SCHOOL DISTRICT NO. 98 NOTES TO THE FINANCIAL STATEMENTS June 30, 2018
NOTE 1 NATURE OF OPERATIONS AND SUMMARY OF SIGNIFICANT ACCOUNTING POLICIES (Continued)
Receivables and Payables
Activity between funds that is representative of lending/borrowing arrangements outstanding at the end of the fiscal year is referred to as either "due to/from other funds" (i.e., the current portion of interfund loans) or "advances to/from other funds" (i.e., the non-current portion of interfund loans). All other outstanding balances between funds are reported as "due to/from other funds."
All receivables, including property taxes receivable, are shown net of an allowance for uncollectibles.
Property Tax Calendar
Property tax levies are obtained by applying tax rates against either the primary assessed valuation or the secondary assessed valuation. Primary and secondary valuation categories are composed of the exact same properties. However, the primary category limits the increase in property values to 10% from the previous year, while there is no limit to the increase in property values for secondary valuation. Override and debt service tax rates are applied to the secondary assessed valuation and all other tax rates are applied to the primary assessed valuation.
The County levies real property taxes on or before the third Monday in August, which become due and payable in two equal installments. The first installment is due on the first day of October and becomes delinquent after the first business day of November. The second installment is due on the first day of March of the next year and becomes delinquent after the first business day of May. The billings are considered past due after these dates, at which time the applicable property is subject to penalties and interest.
The County also levies various personal property taxes during the year, which are due the second Monday of the month following receipt of the tax notice, and become delinquent 30 days thereafter.
Pursuant to A.R.S., a lien against assessed real and personal property attaches on the first day of January preceding assessment and levy; however according to case law, an enforceable legal claim to the asset does not arise.
Prepaid Items
Certain payments to vendors reflect costs applicable to future accounting periods and are recorded as prepaid items in both the government-wide and fund financial statements. Prepaid items are recorded as expenses when consumed on the government-wide financial statements and as expenditures when purchased on the fund financial statements.
39
FOUNTAIN HILLS UNIFIED SCHOOL DISTRICT NO. 98 NOTES TO THE FINANCIAL STATEMENTS June 30, 2018
NOTE 1 NATURE OF OPERATIONS AND SUMMARY OF SIGNIFICANT ACCOUNTING POLICIES (Continued)
Property and Equipment
Capital assets, which include land and improvements; buildings and improvements; vehicles, furniture, and equipment; and construction in progress, are reported in the government-wide financial statements.
Capital assets are defined by the District as assets with an initial, individual cost in excess of $5,000 and an estimated useful life of more than one year. Such assets are recorded at historical cost, or estimated historical cost if actual historical cost is not available. Donated capital assets are recorded at acquisition value at the date of donation.
Depreciation has been provided using the straight-line method over the following estimated useful lives:
Land Improvements 20 years Building & Improvements 7 to 50 years Vehicles, Furniture & Equipment 5 to 20 years
Expense for additions and betterments that extend the useful lives of property and equipment are capitalized at cost and depreciated over the estimated remaining useful lives of the related assets. Expense for repairs and maintenance are charged to expense as incurred. Gains and losses on sales and retirements are reflected in income during the year of actual sale or retirement.
Deferred Outflows/Inflows of Resources
In addition to assets, the statement of financial position may report a separate section for deferred outflows of resources. This separate financial statement element, deferred outflows of resources, represents a consumption of net position that applies to a future period and so will not be recognized as an outflow of resources (expense/expenditure) until then.
In addition to liabilities, the statement of financial position may report a separate section for deferred inflows of resources. This separate financial statement element, deferred inflows of resources, represents an acquisition of net position that applies to a future period and so will not be recognized as an inflow of resources (revenue) until that time.
40

FOUNTAIN HILLS UNIFIED SCHOOL DISTRICT NO. 98 NOTES TO THE FINANCIAL STATEMENTS June 30, 2018
NOTE 1 NATURE OF OPERATIONS AND SUMMARY OF SIGNIFICANT ACCOUNTING POLICIES (Continued)
Postemployment Benefits
For purposes of measuring the net pension and other postemployment benefits (OPEB) asset and liabilities, deferred outflows of resources and deferred inflows of resources related to pensions and OPEB, and pension and OPEB expense, information about the plans’ fiduciary net position and additions to/deductions from the plans’ fiduciary net position have been determined on the same basis as they are reported by the plan. For this purpose, benefit payments (including refunds of employee contributions) are recognized when due and payable in accordance with the benefit terms. Investments are reported at fair value.
Compensated Absences
The District's employee vacation and sick leave policies generally provide for granting vacation and sick leave with pay. Accrued sick leave is earned by all employees at a rate of one day for every month worked. All twelve-month permanent employees earn vacation; however, only 240 hours may be carried forward into any new fiscal year. The current and long-term liabilities, including related benefits, for accumulated vacation and sick leave are reported on the government-wide financial statements. A liability for these amounts is reported in governmental funds only if they have matured, for example, as a result of employee leave, resignations and retirements. Generally, resources from the General Fund are used to pay for compensated absences.
Long-term Obligations
In the government-wide financial statements, long-term debt and other long-term obligations are reported as liabilities on the statement of net position. Bond premiums and discounts, as well as the difference between the reacquisition price and the net carrying amount of the old debt, are deferred and amortized over the life of the bonds using the straight-line method over the term of the related debt.
Interfund Activity
Flows of cash from one fund to another without a requirement for repayment are reported as interfund transfers. lnterfund transfers between governmental funds are eliminated in the Statement of Activities. Interfund transfers in the fund financial statements are reported as other financing sources/uses in governmental funds.
41

FOUNTAIN HILLS UNIFIED SCHOOL DISTRICT NO. 98 NOTES TO THE FINANCIAL STATEMENTS June 30, 2018
NOTE 1 NATURE OF OPERATIONS AND SUMMARY OF SIGNIFICANT ACCOUNTING POLICIES (Continued)
Use of Estimates
The preparation of financial statements in conformity with accounting principles generally accepted in the United States of America requires management to make estimates and assumptions that affect the reported amounts of assets and liabilities and disclosure of contingent assets and liabilities at the date of the financial statements and the reported amounts of revenues and expenses during the reporting period. Actual results could differ from those estimates.
Change in Accounting Principle – Implementation of New GASB Pronouncements
For the year ended June 30, 2018, the District implemented the provisions of GASB Statement No. 75, Accounting and Financial Reporting for Postemployment Benefits Other than Pensions, as amended by GASB Statement No. 85, Omnibus 2017. GASB Statement No. 75 established standards for measuring and recognizing net assets or liabilities, deferred outflows of resources, deferred inflows of resources, and expenses/expenditures related to other postemployment benefits (OPEB) provided through defined benefit OPEB plans. In addition, Statement No. 75 requires disclosure of information related to OPEB.
NOTE 2 FUND BALANCE CLASSIFICATIONS
Fund balances of the governmental funds are reported separately within classifications based on a hierarchy of the constraints placed on the use of those resources. The classifications are based on the relative strength of the constraints that control how the specific amounts can be spent. The classifications are nonspendable, restricted, and unrestricted, which includes committed, assigned, and unassigned fund balance classifications.
Nonspendable. - The nonspendable fund balance classification includes amounts that cannot be spent because they are not in spendable form, or legally or contractually required to be maintained intact.
Restricted - Fund balance is reported as restricted when constraints placed on the use of resources are either externally imposed by creditors (such as through debt covenants), grantors, contributors, or laws or regulations of other governments or is imposed by law through constitutional provisions or enabling legislation.
Committed - The committed fund balance classification includes amounts that can be used only for the specific purposes imposed by formal action of the Governing Board. Those committed amounts cannot be used for any other purpose unless the Governing Board removes or changes the specified use by taking the same type of action it employed to previously commit those amounts. The District does not have a formal policy or procedures for the utilization of committed fund balance, accordingly, no committed fund balance amounts are reported.
42

FOUNTAIN HILLS UNIFIED SCHOOL DISTRICT NO. 98 NOTES TO THE FINANCIAL STATEMENTS June 30, 2018
NOTE 2 FUND BALANCE CLASSIFICATIONS (Continued)
Assigned - Amounts in the assigned fund balance classification are intended to be used by the District for specific purposes but do not meet the criteria to be classified as restricted or committed. In governmental funds other than the General Fund, assigned fund balance represents the remaining amount that is not restricted or committed. In the General Fund, assigned amounts represent intended uses established by the Governing Board or a management official delegated that authority by the formal Governing Board action. The District does not have a formal policy for the utilization of assigned fund balance, accordingly, no assigned fund balance amounts are reported.
Unassigned - Unassigned fund balance is the residual classification for the General Fund and includes all spendable amounts not contained in the other classifications. In other governmental funds, the unassigned classification is used only to report a deficit balance resulting from overspending for specific purposes for which amounts had been restricted, committed, or assigned.
The District applies restricted resources first when expenditures are incurred for purposes for which either restricted or unrestricted (committed, assigned, and unassigned) amounts are available. Similarly, within unrestricted fund balance, committed amounts are reduced first followed by assigned, and then unassigned amounts when expenditures are incurred for purposes for which amounts in any of the unrestricted fund balance classifications could be used.
NOTE 3 CASH AND INVESTMENTS
Arizona Revised Statutes require the District to deposit all cash with the County Treasurer, except as discussed below. Cash with the County Treasurer is pooled for investment purposes, except for cash in the bond building and debt service funds, which may be invested separately.
Statute authorizes the District to separately invest monies of the bond building and debt service funds in the State Treasurer’s investment pool, obligations issued or guaranteed by the United States or any of its agencies or instrumentalities, specified state or local government bonds and notes, and interest-bearing savings accounts or certificates of deposit.
Statute authorize the District to deposit monies of the auxiliary operations and student activities funds in bank accounts. The District may also invest these monies. In addition, statute authorizes the District to maintain various bank accounts such as clearing accounts to temporarily deposit receipts before they are transmitted to the County Treasurer, revolving accounts to pay minor disbursements, and withholding accounts for taxes and employee insurance programs. Some of the bank accounts may be interest bearing.
Statutes require collateral for deposits as 102% of all deposits not covered by federal depository insurance. Statute does not include any requirements for credit risk, concentration of credit risk, interest rate risk, or foreign currency risk.
43

FOUNTAIN HILLS UNIFIED SCHOOL DISTRICT NO. 98 NOTES TO THE FINANCIAL STATEMENTS June 30, 2018
NOTE 3 CASH AND INVESTMENTS (Continued)
Deposits – At June 30, 2018, the carrying amount of the District’s deposits was $565,956, and the bank balance was $575,720. The bank balance was insured under the federal depositary insurance.
Interest Rate Risk - The District does not have a formal investment policy that limits investment maturities as a means of managing its exposure to fair value losses arising from increasing interest rates.
Credit Risk - The District has no investment policy that would further limit its investment choices. As of year-end, the District's investment in the County Treasurer's investment pool did not receive a credit quality rating from a national rating agency.
Custodial Credit Risk- Investments - The District's investment in the County Treasurer's investment pool represents a proportionate interest in the pool's portfolio; however, the District's portion is not identified with specific investments and is not subject to custodial credit risk.
Investments - The District’s investments at June 30, 2018 consisted of $7,133,673 invested with the County Treasurer’s investment pool. Investment in the County Treasurer’s pool is valued using the District’s proportionate participation in the pool because the pool’s structure does not provide for shares. The State Board of Investment provides oversight for the State Treasurer’s investment pool. No comparable oversight is provided for the County Treasurer’s investment pool.
NOTE 4 RECEIVABLES
Receivable balances, net of allowance for uncollectibles, have been disaggregated by type and presented separately in the financial statements with the exception of due from governmental entities. Due from governmental entities, net of allowance for uncollectibles, as of year-end for the District's individual major funds and non-major governmental funds in the aggregate, were reported as follows:
Special Unrestricted Debt Non-MajorDue from other General Title I Education Capital Outlay Service Governmentalgovernments: Fund Fund Fund Fund Fund Fund TotalProperty tax
assessments 1,253,765$ -$ -$ 160,066$ 136,844$ -$ 1,550,675$ Due from other
government 112,332 60,686 233,800 - - 310,224 717,042
1,366,097 60,686 233,800 160,066 136,844 310,224 2,267,717 Total receivables 1,366,097$ 60,686$ 233,800$ 160,066$ 136,844$ 310,224$ 2,267,717$
44

FOUNTAIN HILLS UNIFIED SCHOOL DISTRICT NO. 98 NOTES TO THE FINANCIAL STATEMENTS June 30, 2018
NOTE 5 CAPITAL ASSETS
Capital asset activity for the year ended June 30, 2018 is as follows:
Beginning EndingGovernmental Activities Balance Increases Decreases BalanceCapital assets, not being depreciated: Land 2,860,836$ -$ -$ 2,860,836$ Construction in progress 238,013 - (238,013) - Total capital assets not being depreciated 3,098,849 - (238,013) 2,860,836 Capital assets, being depreciated: Land improvements 4,509,940 5,322 - 4,515,262 Buildings and improvements 64,349,916 991,195 - 65,341,111 Vehicles, furniture and equipment 5,888,333 83,202 (46,156) 5,925,379 Total capital assets being depreciated 74,748,189 1,079,719 (46,156) 75,781,752 Less accumulated depreciation for: Land improvements (1,744,726) (216,961) - (1,961,687) Buildings and improvements (27,665,867) (1,662,952) - (29,328,819) Vehicles, furniture and equipment (4,617,580) (324,071) 46,156 (4,895,495) Total accumulated depreciation (34,028,173) (2,203,984) 46,156 (36,186,001) Total capital assets, being depreciated, net 40,720,016 (1,124,265) - 39,595,751 Governmental activities capital assets, net 43,818,865$ (1,124,265)$ (238,013)$ 42,456,587$
Depreciation expense was charged to governmental functions as follows.
Governmental activities: Instruction 1,485,731$ Support services- students and staff 8,182 Support services - general administration 27,309 Operation and maintenance of plant services 447,817 Student transportation 232,160 Operation of noninstructional services 2,785
Total depreciation expense 2,203,984$
45

FOUNTAIN HILLS UNIFIED SCHOOL DISTRICT NO. 98 NOTES TO THE FINANCIAL STATEMENTS June 30, 2018
NOTE 6 LONG-TERM LIABILITIES
Long-term liability activity for the year ended June 30, 2018, was as follows:
Beginning Ending Due WithinBalance Additions Reductions Balance One Year
Governmental activities:Compensated absences 538,362$ 120,224$ 228,684$ 429,902$ 64,485$ Bonds payable 12,975,000 - 1,305,000 11,670,000 1,400,000 Premiums 276,057 - 27,435 248,622 - Net OPEB liability - 24,048 - 24,048 - Net pension liability 11,193,787 - 683,276 10,510,511 - Governmental activities long-term liabilities 24,983,206$ 144,272$ 2,244,395$ 22,883,083$ 1,464,485$
School Improvement Bonds - The District’s bonded debt consists of various issues of school improvement bonds that are generally noncallable with interest payable semiannually. Bond proceeds pay for constructing school improvements and purchase pupil transportation vehicles. The District repays school improvement bonds from taxes on the net secondary assessed valuation of the taxable property in the District.
During 2008, the District issued School Improvement Bonds, Project of 2007, Series A (2008) totaling $8,000,000 to construct various school improvements, purchase pupil transportation vehicles, and pay the costs incurred in connection with the issuance of the bonds.
During 2009, the District issued School Improvement Bonds, Project of 2007, Series B (2009) totaling $4,000,000 to construct various school improvements, purchase pupil transportation vehicles, and pay the costs incurred in connections with the issuance of the bonds.
During 2014, the District issued School Improvement Bonds, Project of 2013, Series A (2014) totaling $4,000,000 to construct and make certain school improvements, purchase pupil transportation vehicles, and pay the costs incurred in connection with the issuance of the bonds.
During 2015, the District issued School Improvement Bonds, Project of 2013, Series B (2015) totaling $4,000,000 to construct and make certain school improvements, purchase pupil transportation vehicles, and pay the costs incurred in connection with the issuance of the bonds.
46
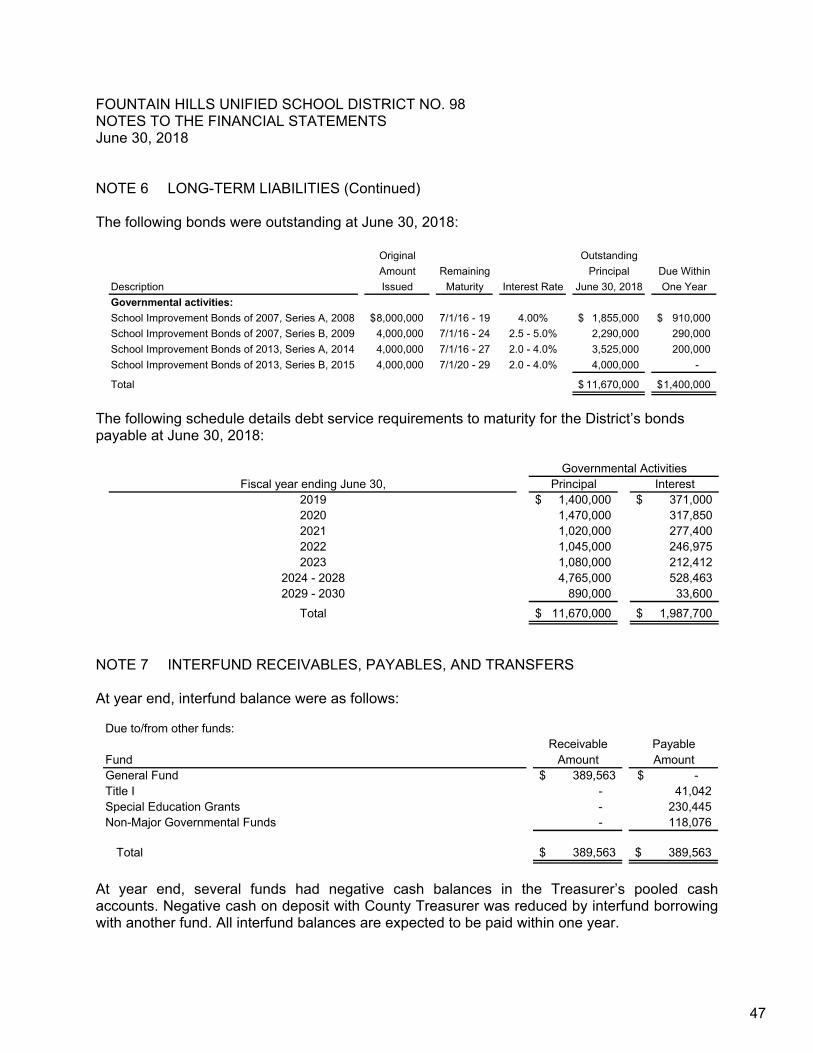
FOUNTAIN HILLS UNIFIED SCHOOL DISTRICT NO. 98 NOTES TO THE FINANCIAL STATEMENTS June 30, 2018
NOTE 6 LONG-TERM LIABILITIES (Continued)
The following bonds were outstanding at June 30, 2018:
Original OutstandingAmount Remaining Principal Due Within
Description Issued Maturity Interest Rate June 30, 2018 One YearGovernmental activities:School Improvement Bonds of 2007, Series A, 2008 8,000,000$ 7/1/16 - 19 4.00% 1,855,000$ 910,000$ School Improvement Bonds of 2007, Series B, 2009 4,000,000 7/1/16 - 24 2.5 - 5.0% 2,290,000 290,000 School Improvement Bonds of 2013, Series A, 2014 4,000,000 7/1/16 - 27 2.0 - 4.0% 3,525,000 200,000 School Improvement Bonds of 2013, Series B, 2015 4,000,000 7/1/20 - 29 2.0 - 4.0% 4,000,000 -
Total 11,670,000$ 1,400,000$
The following schedule details debt service requirements to maturity for the District’s bonds payable at June 30, 2018:
Fiscal year ending June 30, Principal Interest2019 1,400,000$ 371,000$ 2020 1,470,000 317,850 2021 1,020,000 277,400 2022 1,045,000 246,975 2023 1,080,000 212,412
2024 - 2028 4,765,000 528,463 2029 - 2030 890,000 33,600
Total 11,670,000$ 1,987,700$
Governmental Activities
NOTE 7 INTERFUND RECEIVABLES, PAYABLES, AND TRANSFERS
At year end, interfund balance were as follows:
Due to/from other funds:Receivable Payable
Fund Amount AmountGeneral Fund 389,563$ -$ Title I - 41,042 Special Education Grants - 230,445 Non-Major Governmental Funds - 118,076
Total 389,563$ 389,563$
At year end, several funds had negative cash balances in the Treasurer’s pooled cash accounts. Negative cash on deposit with County Treasurer was reduced by interfund borrowing with another fund. All interfund balances are expected to be paid within one year.
47

FOUNTAIN HILLS UNIFIED SCHOOL DISTRICT NO. 98 NOTES TO THE FINANCIAL STATEMENTS June 30, 2018
NOTE 7 INTERFUND RECEIVABLES, PAYABLES, AND TRANSFERS (Continued)
Interfund transfers:Transfers Transfers
Fund Out InGeneral Fund -$ 28,512$ Title I 5,000 - Special Education Grants 23,152 -
Total 28,152$ 28,512$
Transfers between funds are used to record indirect costs related to grants.
NOTE 8 CONTINGENT LIABILITIES
Compliance - Amounts received or receivable from grantor agencies are subject to audit and adjustment by grantor agencies, principally the federal government. Any disallowed claims, including amounts already collected, may constitute a liability of the applicable funds. The amount, if any, of expenditures/expenses that may be disallowed by the grantor cannot be determined at this time, although the District expects such amounts, if any, to be immaterial.
NOTE 9 PENSIONS AND OTHER POSTEMPLOYMENT BENEFITS
Plan Description – Qualifying District employees participate in the Arizona State Retirement System (ASRS). The ASRS administers a cost-sharing multiple-employer defined benefit pension plan, a cost-sharing multiple-employer defined benefit health insurance premium benefit (OPEB) plan, and a cost-sharing multiple-employer defined benefit long-term disability (OPEB) plan. The Arizona State Retirement System Board governs the ASRS according to the provisions of A.R.S. Title 38, Chapter 5, Articles 2 and 2.1. The ASRS issues a publicly available financial report that includes its financial statements and required supplementary information. The report is available on its Web site at www.azasrs.gov.
48

FOUNTAIN HILLS UNIFIED SCHOOL DISTRICT NO. 98 NOTES TO THE FINANCIAL STATEMENTS June 30, 2018 NOTE 9 PENSIONS AND OTHER POSTEMPLOYMENT BENEFITS (Continued) Benefits Provided - The ASRS provides retirement, health insurance premium supplement, long-term disability, and survivor benefits. State statute establishes benefits terms. Retirement benefits are calculated on the basis of age, average monthly compensation, and service credit as follows:
RetirementInitial membership date:
Before July 1, 2011 On or after July 1, 2011Sum of years and age equals 80 30 years, age 55
10 years, age 62 25 years, age 605 years, age 50* 10 years, age 62
and any years, age 65 5 years, age 50*any years, age 65
*with actuarially reduced benefits.
Benefit percent per year of service 2.1% to 2.3% 2.1% to 2.3%
Years of service and age required to receive benefit
Highest 36 consecutive months of last 120 months
Final average salary is based on
Highest 60 consecutive months of last 120 months
Retirement benefits for members who joined the ASRS prior to September 13, 2013, are subject to automatic cost-of-living adjustments based on excess investment earning. Members with a membership date on or after September 13, 2013, are not eligible for cost-of-living adjustments. Survivor benefits are payable upon a member’s death. For retired members, the survivor benefit is determined by the retirement benefit option chosen. For all other members, the beneficiary is entitled to the member’s account balance that includes the member’s contributions and employer’s contributions, plus interest earned. Health insurance premium benefits are available to retired or disabled members with 5 years of credited service. The benefits are payable only with respect to allowable health insurance premiums for which the member is responsible. For members with 10 or more years of service, benefits range from $150 per month to $260 per month depending on the age of the member and dependents. For members with 5 to 9 years of service, the benefits are the same dollar amounts as above multiplied by a vesting fraction based on completed years of service. Active members are eligible for a monthly long-term disability benefit equal to two-thirds of monthly earnings. Members receiving benefits continue to earn service credit up to their normal retirement dates. Members with long-term disability commencement dates after June 30, 1999, are limited to 30 years of service or the service on record as of the effective disability date if their service is greater than 30 years.
49

FOUNTAIN HILLS UNIFIED SCHOOL DISTRICT NO. 98 NOTES TO THE FINANCIAL STATEMENTS June 30, 2018 NOTE 9 PENSIONS AND OTHER POSTEMPLOYMENT BENEFITS (Continued) Contributions - In accordance with state statutes, annual actuarial valuations determine active member and employer contribution requirements. The combined active member and employer contribution rates are expected to finance the costs of benefits employees earn during the year, with an additional amount to finance any unfunded accrued liability. For the year ended June 30, 2018, statute required active ASRS members to contribute at the actuarially determined rate of 11.5 percent (11.34 percent for retirement and 0.16 percent for long-term disability) of the members’ annual covered payroll, and statute required the District to contribute at the actuarially determined rate of 11.5 percent (10.9 percent for retirement, 0.44 percent for health insurance premium benefit, and 0.16 percent for long-term disability) of the active members’ annual covered payroll. In addition, the District was required by statute to contribute at the actuarially determined rate of 9.49 percent (9.26 percent for retirement, 0.1 percent for health insurance premium benefit, and 0.13 percent for long-term disability) of annual covered payroll of retired members who worked for the District in positions that an employee who contributes to the ASRS would typically fill. The District’s contributions to the pension, health insurance premium benefit, and long-term disability plans plan for the year ended June 30, 2018 were $689,540, $27,835, and $10,122, respectively. During fiscal year 2018, the District paid for pension and OPEB contributions as follows: 82 percent from the general fund, 1 percent from Title 1, 3 percent from the special education grants, and 14 percent from other non-major funds. Liability – At June 30, 2018, the District reported the following asset and liabilities for its proportionate share of the ASRS’ net pension/OPEB asset or liability.
Net pension/OPEB (asset) liability
Pension 10,510,511$ Health insurance premium benefit (35,473) Long-term disability 24,048
The net asset and net liabilities were measured as of June 30, 2017. The total liability used to calculate the net asset or net liability was determined using update procedures to roll forward the total liability from an actuarial valuation as of June 30, 2016, to the measurement date of June 30, 2017. The total pension liability as of June 30, 2017, reflects a change in actuarial assumption related to changes in loads for future potential permanent benefit increases.
50

FOUNTAIN HILLS UNIFIED SCHOOL DISTRICT NO. 98 NOTES TO THE FINANCIAL STATEMENTS June 30, 2018 NOTE 9 PENSIONS AND OTHER POSTEMPLOYMENT BENEFITS (Continued) The District’s proportion of the net asset or net liability was based on the District’s actual contributions to the plan relative to the total of all participating employers’ contributions for the year ended June 30, 2017, and the change from its proportions measured as of June 30, 2016, were:
Proportion June 30, 2017
%Increase (decrease) from
June 30, 2016Pension 0.06747% (0.00188) Health insurance premium benefit 0.06516% - Long-term disability 0.06634% -
The net asset and net liabilities measured as of June 30, 2018, will reflect changes of actuarial assumptions based on the results of an actuarial experience study for the 5-year period ended June 30, 2016. The change in the District’s net asset and net liabilities as a result of these changes is not known. Expense - For the year ended June 30, 2018, the District recognized the following pension and OPEB expense.
Pension/OPEB expense
Pension expense (601,621)$ Health insurance premium benefit 20,748 Long-term disability 12,829
Deferred outflows/inflows of resources - At June 30, 2018, the District reported deferred outflows of resources and deferred inflows of resources related to pensions and OPEB from the following sources:
Deferred Deferred Deferred Deferred Deferred DeferredOutflows of Inflows of Outflows of Inflows of Outflows of Inflows ofResources Resources Resources Resources Resources Resources
Differences between expected andactual experience -$ 315,163$ -$ -$ -$ -$
Changes of assumptions or other inputs 456,496 314,283 - - - - Net difference between projected and actual
earnings on pension plan investments 75,458 - - 39,941 - 3,597 Changes in proportion and differences
between District contributions and 44 proportionate share of contributions - 861,962 - - - 3
District contributions subsequent to the measurement date 689,540 - 27,835 - 10,122 -
Total 1,221,494$ 1,491,408$ 27,835$ 39,985$ 10,122$ 3,600$
PensionHealth insurance premium benefit Long-term disability
51

FOUNTAIN HILLS UNIFIED SCHOOL DISTRICT NO. 98 NOTES TO THE FINANCIAL STATEMENTS June 30, 2018
NOTE 9 PENSIONS AND OTHER POSTEMPLOYMENT BENEFITS (Continued)
The amounts reported as deferred outflows of resources related to ASRS pensions and OPEB resulting from district contributions subsequent to the measurement date will be recognized as an increase of the net asset or a reduction of the net liability in the year ending June 30, 2019. Other amounts reported as deferred outflows of resources and deferred inflows of resources related to ASRS pensions and OPEB will be recognized in expenses as follows:
PensionHealth insurance premium benefit
Long-term disability
2019 (1,070,227)$ (9,994)$ (900)$ 2020 242,929 (9,994) (900) 2021 109,617 (9,994) (900) 2022 (241,773) (9,994) (899) 2023 - (8) - Thereafter - - -
Year ending June 30
Actuarial Assumptions - The significant actuarial assumptions used to measure the total pension liability are as follows:
Actuarial valuation date June 30, 2016Actuarial roll forward date June 20, 2017Actuarial cost method Entry age normalAsset valuation Fair valueInvestment rate of return 8%Projected salary increases 3 - 6.75% for pensions/not applicable for OPEBInflation 3%Permanent benefit increase Included for pensions/not appliable for OPEBMortality rates 1994 GAM Scale BB
Actuarial assumptions used in the June 30, 2016, valuation were based on the results of an actuarial experience study for the 5-year period ended June 30, 2012.
52

FOUNTAIN HILLS UNIFIED SCHOOL DISTRICT NO. 98 NOTES TO THE FINANCIAL STATEMENTS June 30, 2018 NOTE 9 PENSIONS AND OTHER POSTEMPLOYMENT BENEFITS (Continued) The long-term expected rate of return on ASRS plan investments was determined to be 8.7 percent using a building-block method in which best-estimate ranges of expected future real rates of return (expected returns, net of plan investment expense and inflation) are developed for each major asset class. These ranges are combined to produce the long-term expected rate of return by weighting the expected future real rates of return by the target asset allocation percentage and by adding expected inflation. The target allocation and best estimates of arithmetic real rates of return for each major asset class are summarized in the following table:
Long-TermTarget Expected Real
Asset Class Allocation Rate of ReturnEquity 58% 6.73%Fixed Income 25% 3.70%Real estate 10% 4.25%Commodities 2% 3.84%Multi-asset class 5% 3.41%
Total 100%
Discount Rate - The discount rate used to measure the ASRS total pension/OPEB liability was 8 percent, which is less than the long-term expected rate of return of 8.7 percent. The projection of cash flows used to determine the discount rate assumed that contributions from participating employers will be made based on the actuarially determined rates based on the ASRS Board’s funding policy, which establishes the contractually required rate under Arizona statute. Based on those assumptions, the plans’ fiduciary net position was projected to be available to make all projected future benefit payments of current plan members. Therefore, the long-term expected rate of return on plan investments was applied to all periods of projected benefit payments to determine the total pension/OPEB liability. Sensitivity of District’s Proportionate Share of the ASRS Net Pension Liability/OPEB (asset) liability to Changes in the Discount Rate - The following table presents the District’s proportionate share of the net pension/OPEB (asset) liability calculated using the discount rate of 8 percent, as well as what the District’s proportionate share of the net pension/OPEB (asset) liability would be if it were calculated using a discount rate that is 1 percentage point lower (7 percent) or 1 percentage point higher (9 percent) than the current rate:
Current 1% Decrease Discount Rate 1% increase
District's proportionate share of the (7%) (8%) (9%)
Net pension liability 13,490,423$ 10,510,511$ 8,020,539$ Net health insurance premium benefit liability (asset) 58,911 (35,473) (115,683) Net long-term disability liability 28,754 24,047 20,056
Plan Fiduciary Net Position - Detailed information about the plans’ fiduciary net position is available in the separately issued ASRS financial report.
53

FOUNTAIN HILLS UNIFIED SCHOOL DISTRICT NO. 98 NOTES TO THE FINANCIAL STATEMENTS June 30, 2018
NOTE 10 RISK MANAGEMENT
The District is exposed to various risks of loss related to torts, theft, destruction of assets, error and omissions, injuries to employees, and other losses. The District carries commercial insurance for risks of loss, including workers’ compensation, and employee health insurance. Settled claims resulting from these risks have not exceeded commercial insurance coverage in any of the past three years.
NOTE 11 DEFICIT FUND BALANCES
The deficit in the Title I Fund arose due to the District not receiving reimbursements within the period of availability. The District has amounts recorded as deferred revenue that will be reimbursed from the Arizona Department of Education (ADE) after the grant completion reports have been filed and approved.
The District also had several non-major funds with deficit balances which is also the result of untimely reporting requirements being met. The District is working on completing the necessary information in order to obtain reimbursement for these expenditures.
NOTE 12 RESTATEMENT
For the year ending June 30, 2017, Fountain Hills Unified School District No. 98 adopted GASB Statement No. 75 Accounting and Financial Reporting for Postemployment Benefits Other than Pensions, as amended by GASB Statement No. 85, Omnibus 2017. As a result, the effect on fiscal year 2017 is as follows:
Governmental activities
Net Position as previously reported at June 30, 2017 27,649,109$
Prior period adjustmentimplementation of GASB 75;
Net OPEB liability(measurement date as of June 30, 2016) (42,681)
Deferred outflows - districtcontributions made during fiscal year 2017 45,801
Total prior period adjustment 3,120 Net position as restated,
July 1, 2017 27,652,229$
54
REQUIRED SUPPLEMENTARY INFORMATION


FOUNTAIN HILLS UNIFIED SCHOOL DISTRICT NO. 98, ARIZONAREQUIRED SUPPLEMENTARY INFORMATIONSCHEDULE OF THE DISTRICT'S PROPORTIONATE SHARE OF THE NET PENSION/OPEB LIABILITYCOST-SHARING PLAN
ASRS - Pension
20142018 2017 2016 through
(2017) (2016) (2015) 2009
District's proportion of the net pension liability 0.067472% 0.069355% 0.078926% Information District's proportionate share of the net not available pension liability 10,510,511$ 11,193,787$ 12,293,844$ District's covered payroll 6,542,978 6,654,433 7,663,539 District's proportionate share of the net pension
liability as a percentage of its covered payroll 160.64% 168.22% 160.42%Plan fiduciary net position as a percentage of
the total pension liability 69.92% 67.06% 68.35%
ASRS - Health insurance premium benefit
20172018 through
(2017) 2009
District's proportion of the net OPEB (asset) 0.065160% Information District's proportionate share of the net not available OPEB (asset) (35,473)$ District's covered payroll 6,542,978 District's proportionate share of the net OPEB (asset)
as a percentage of its covered payroll -0.54%Plan fiduciary net position as a percentage of
the total OPEB liability 103.57%
ASRS - Long-term disability
20172018 through
(2017) 2009
District's proportion of the net OPEB liability 0.066340% Information District's proportionate share of the net not available OPEB liability 24,047$ District's covered payroll 6,542,978 District's proportionate share of the net OPEB liability
as a percentage of its covered payroll 0.37%Plan fiduciary net position as a percentage of
the total OPEB liability 84.44%
Reporting Fiscal Year(Measurement Date)
Reporting Fiscal Year(Measurement Date)
June 30, 2018
(Measurement Date)Reporting Fiscal Year
57
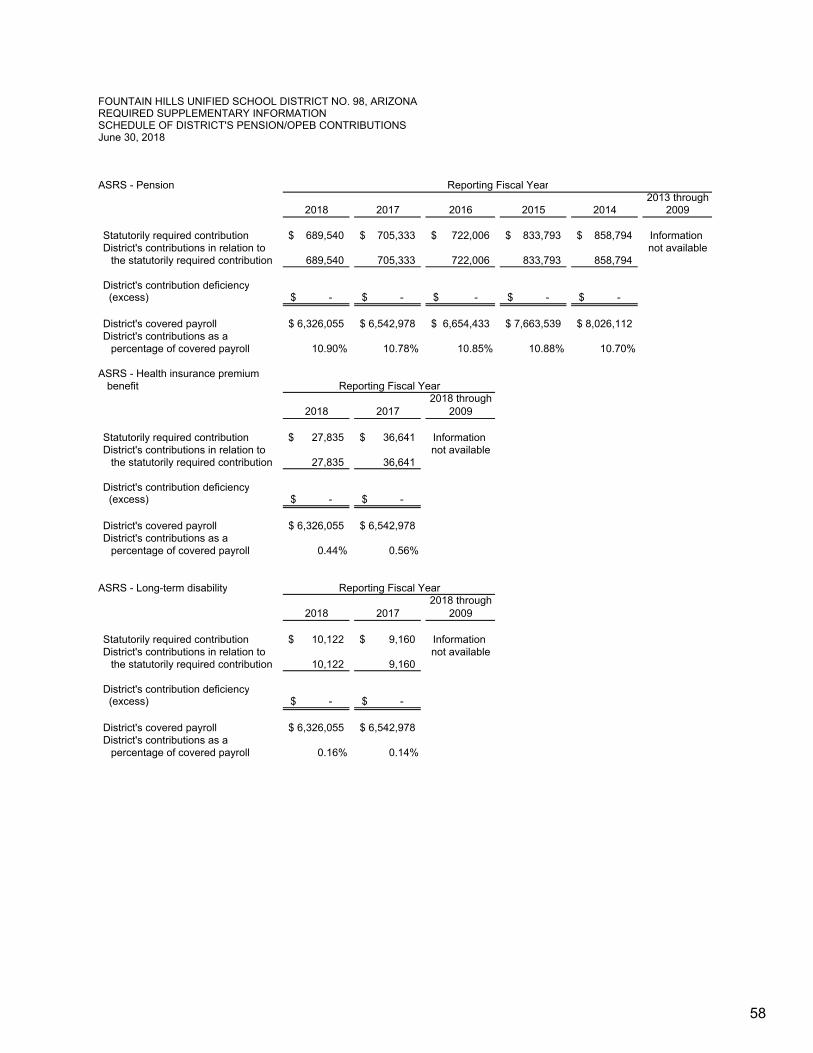
FOUNTAIN HILLS UNIFIED SCHOOL DISTRICT NO. 98, ARIZONAREQUIRED SUPPLEMENTARY INFORMATIONSCHEDULE OF DISTRICT'S PENSION/OPEB CONTRIBUTIONS
ASRS - Pension2013 through
2018 2017 2016 2015 2014 2009
Statutorily required contribution 689,540$ 705,333$ 722,006$ 833,793$ 858,794$ Information District's contributions in relation to not available
the statutorily required contribution 689,540 705,333 722,006 833,793 858,794
District's contribution deficiency (excess) -$ -$ -$ -$ -$
District's covered payroll 6,326,055$ 6,542,978$ 6,654,433$ 7,663,539$ 8,026,112$ District's contributions as a
percentage of covered payroll 10.90% 10.78% 10.85% 10.88% 10.70%
ASRS - Health insurance premium benefit
2018 through2018 2017 2009
Statutorily required contribution 27,835$ 36,641$ Information District's contributions in relation to not available
the statutorily required contribution 27,835 36,641
District's contribution deficiency (excess) -$ -$
District's covered payroll 6,326,055$ 6,542,978$ District's contributions as a
percentage of covered payroll 0.44% 0.56%
ASRS - Long-term disability2018 through
2018 2017 2009
Statutorily required contribution 10,122$ 9,160$ Information District's contributions in relation to not available
the statutorily required contribution 10,122 9,160
District's contribution deficiency (excess) -$ -$
District's covered payroll 6,326,055$ 6,542,978$ District's contributions as a
percentage of covered payroll 0.16% 0.14%
Reporting Fiscal Year
June 30, 2018
Reporting Fiscal Year
Reporting Fiscal Year
58

FOUNTAIN HILLS UNIFIED SCHOOL DISTRICT NO. 98GENERAL FUNDSCHEDULE OF REVENUES, EXPENDITURES, AND CHANGES IN FUND BALANCE - BUDGET
AND ACTUALYear Ended June 30, 2018
Variance withNon-GAAP Final Budget
Budgeted Amounts Actual PositveOriginal Final Amounts (Negative)
REVENUES Property taxes -$ -$ 5,991,393$ 5,991,393$ Intergovernmental grants and aid: State - - 2,075,647 2,075,647 Other local - - 37,322 37,322 Total revenues - - 8,104,362 8,104,362
EXPENDITURES:Current:
Instruction 4,318,374 4,379,271 4,092,956 286,315 Support services: Students and staff 1,013,661 1,098,640 989,850 108,790 General administration 2,107,804 2,147,763 1,922,003 225,760 Operation and maintenance of plant 1,578,660 1,751,110 1,477,480 273,630 Student transportation 756,240 743,507 731,166 12,341 Operation of noninstructional services 22,080 24,000 - 24,000
Total expenditures 9,796,819 10,144,291 9,213,455 930,836
Net change in fund balances (9,796,819) (10,144,291) (1,109,093) 9,035,198
Fund balance, beginning of year - - (1,868,473) (1,868,473)
Fund balance, end of year (9,796,819)$ (10,144,291)$ (2,977,566)$ 7,166,725$
59See accompanying notes to the required supplementary information.


FOUNTAIN HILLS UNIFIED SCHOOL DISTRICT NO. 98 NOTES TO THE REQUIRED SUPPLEMENTARY INFORMATION June 30, 2018
NOTE 1 BUDGETING AND BUDGETARY CONTROL
The District adopts an annual operating budget for expenditures for all governmental fund types. The Governing Board presents a proposed budget to the Superintendent of Public Instruction and County School Superintendent on or by July 5. The Governing Board legally adopts the final budget by July 15, after a public hearing has been held. Once adopted, the budget can be increased or decreased only for specific reasons set forth in Arizona Revised Statutes.
Budgetary control over expenditures is exercised at the fund level. However, the General Fund is budgeted within three subsections titled regular education programs, special education programs, and pupil transportation, any of which may be overexpended with the prior approval of the Governing Board at a public meeting, providing the expenditures for all subsections do not exceed the General Fund's total budget.
The District budget is prepared on a basis consistent with accounting principles generally accepted in the United States of America, except for the following item.
x Certain activities reported in the General Fund are budgeted in separate funds inaccordance with Arizona Revised Statutes but are included in the General Fund asrequired by GASB 54, Fund Balance Reporting and Governmental Fund TypeDefinitions.
The following schedule reconciles expenditures and fund balances at year end.
Total Fund BalancesExpenditures End of Year
Statement of Revenues, Expenditures and Changes in Fund Balances - Governmental Funds 9,533,000$ 2,046,049$ Activity budgeted as special revenue funds (319,545) (5,023,615) Schedule of Revenues, Expenditures and Changes in Fund Balances - Budget & Actual - General Fund 9,213,455$ (2,977,566)$
61


FOUNTAIN HILLS UNIFIED SCHOOL DISTRICT NO. 98TITLE I FUNDSCHEDULE OF REVENUES, EXPENDITURES, AND CHANGES IN FUND BALANCE - BUDGET
AND ACTUALYear Ended June 30, 2018
Variance withFinal Budget
Budgeted Amounts Actual PositveOriginal Final Amounts (Negative)
REVENUES Intergovernmental grants and aid: Federal -$ -$ 44,669$ 44,669.00$ Total revenues - - 44,669 44,669
EXPENDITURES:Current:
Instruction 175,000 165,616 67,729 97,887 Total expenditures 175,000 165,616 67,729 97,887
Excess (deficiency) of revenues over expenditures (175,000) (165,616) (23,060) 142,556
OTHER FINANCING SOURCES (USES): Transfers out - - (5,000) 5,000
Net change in fund balances (175,000) (165,616) (28,060) 147,556
Fund balance, beginning of year - - (12,982) (12,982)
Fund balance, end of year (175,000)$ (165,616)$ (41,042)$ 124,574$
63

FOUNTAIN HILLS UNIFIED SCHOOL DISTRICT NO. 98SPECIAL EDUCATION GRANTSSCHEDULE OF REVENUES, EXPENDITURES, AND CHANGES IN FUND BALANCE - BUDGET
AND ACTUALYear Ended June 30, 2018
Variance withFinal Budget
Budgeted Amounts Actual PositveOriginal Final Amounts (Negative)
REVENUES Intergovernmental grants and aid: Federal -$ -$ 54,320$ 54,320$ Total revenues - - 54,320 54,320
EXPENDITURES:Current:
Instruction 167,013 173,705 163,900 9,805 Support services: Students and staff 9,634 10,020 9,454 566 General administration 93,354 97,095 91,614 5,481
Total expenditures 270,000 280,819 264,968 15,851
Excess (deficiency) of revenues over expenditures (270,000) (280,819) (210,648) 70,171
OTHER FINANCING SOURCES (USES): Transfers out - - (23,152) (23,152)
Net change in fund balances (270,000) (280,819) (233,800) 47,019
Fund balance, beginning of year - - - -
Fund balance, end of year (270,000)$ (280,819)$ (233,800)$ 47,019$
64

OTHER SUPPLEMENTARY INFORMATION
MAJOR FUND - SCHEDULE OF REVENUES, EXPENDITURES AND CHANGES IN FUND BALANCES – BUDGET TO ACTUAL

FOUNTAIN HILLS UNIFIED SCHOOL DISTRICT NO. 98MAJOR CAPITAL PROJECT FUNDS
SCHEDULE OF REVENUES, EXPENDITURES AND CHANGES IN FUND BALANCES - BUDGET AND ACTUAL
Year Ended June 30, 2018
Budget Actual VarianceREVENUES Property taxes -$ 834,256$ 834,256$ Intergovernmental grants and aid:
State - 52,042 52,042 Maricopa County - 16,246 16,246 Total revenues - 902,544 902,544
EXPENDITURESCurrent:Instruction 1,773,680 376,075 1,397,605 Students and staff 130,000 4,923 125,077 General administration 150,000 162,157 (12,157)
Student transportation 2,500 - 2,500 Operation of noninstructional services 12,500 3,469 9,031
Capital outlay 100,000 185,016 (85,016) Total expenditures 2,268,680 754,746 1,513,934
Net change in fund balances (2,268,680) 147,798 2,416,478
Fund balances, beginning of year - 1,657,648 1,657,648
Fund balances, end of year (2,268,680)$ 1,805,446$ 4,074,126$
Unrestricted Capital Outlay
66

Budget Actual Variance
-$ -$ -$
- - - - - - - - -
- - - - - - - 155,072 (155,072) - - - - - -
2,691,338 380,998 2,310,340 2,691,338 536,070 2,155,268
(2,691,338) (536,070) 2,155,268
- 1,203,325 1,203,325
(2,691,338)$ 667,255$ 3,358,593$
Bond Building
67

FOUNTAIN HILLS UNIFIED SCHOOL DISTRICT NO. 98DEBT SERVICESCHEDULE OF REVENUES, EXPENDITURES AND CHANGES IN FUND BALANCES -
BUDGET AND ACTUALYear Ended June 30, 2018
Variance withFinal Budget
Budgeted Amounts Actual PositveOriginal Final Amounts (Negative)
REVENUES Property taxes -$ -$ 1,826,692$ 1,826,692$ Intergovernmental grants and aid: Maricopa County - - 20,287 20,287 Total revenues - - 1,846,979 1,846,979
EXPENDITURES:Current:
Debt service: Principal 1,261,321 1,261,321 1,400,000 (138,679) Interest and other charges 358,679 358,679 398,115 (39,436)
Total expenditures 1,620,000 1,620,000 1,798,115 (178,115) Net change in fund balances (1,620,000) (1,620,000) 48,864 1,668,864
Fund balance, beginning of year - - 129,696 129,696
Fund balance, end of year (1,620,000)$ (1,620,000)$ 178,560$ 1,798,560$
68

OTHER SUPPLEMENTARY INFORMATION
COMBINBING AND INDIVIDUAL FUND FINANCIAL STATEMENTS AND SCHEDULES

COMBINING BALANCE SHEET ALL NON-MAJOR GOVERNMENTAL FUNDS - BY FUND TYPE
TotalSpecial Capital Non-majorRevenue Projects Funds
ASSETSCash and cash equivalents 2,002,569$ 19,857$ 2,022,426$ Due from other governments 216,941 93,283 310,224 Total assets 2,219,510$ 113,140$ 2,332,650$
LIABILITIES Accounts payable 11,453$ -$ 11,453$ Accrued payroll and employee benefits 3,761 - 3,761 Due to other funds 25,079 92,997 118,076 Total liabilities 40,293 92,997 133,290
DEFERRED INFLOW OF RESOURCES Deferred revenue - intergovernmental 130,170 - 130,170 Total deferred inflow of resources 130,170 - 130,170
FUND BALANCES Restricted
Voter approved initiatives 625,619 - 625,619 Federal and state projects 188,592 - 188,592 Food service 54,909 - 54,909 Joint technical education 257,975 - 257,975 Extracurricular activities 506,454 - 506,454 Other local initiatives 144,021 - 144,021 Capital outlay - 20,143 20,143
Assigned 296,736 - 296,736 Unassigned (25,259) - (25,259) Total fund balances 2,049,047 20,143 2,069,190
Total liabilities, deferred inflow of resources and fund balance 2,219,510$ 113,140$ 2,332,650$
FOUNTAIN HILLS UNIFIED SCHOOL DISTRICT NO. 98
June 30, 2018
70

COMBINING STATEMENT OF REVENUES, EXPENDITURES AND CHANGE IN FUND BALANCE
TotalSpecial Capital Non-majorRevenue Projects Funds
REVENUES Intergovernmental grants and aid:
Federal 302,140$ -$ 302,140$ State 843,649 191,226 1,034,875 Total revenues 2,436,017 191,606 2,627,623
EXPENDITURESCurrent:Instruction 1,557,488 - 1,557,488 Support services:Students and staff 116,313 - 116,313 General administration 38,055 - 38,055
Operation and maintenance of plant 54,782 10,401 65,183 Student transportation 17,351 - 17,351 Operation of noninstructional services 404,441 - 404,441
Capital outlay 5,322 180,825 186,147 Total expenditures 2,193,752 191,226 2,384,978
Net change in fund balances 242,265 380 242,645
Fund balances, beginning of year 1,806,782 19,763 1,826,545
Fund balances, end of year 2,049,047$ 20,143$ 2,069,190$
FOUNTAIN HILLS UNIFIED SCHOOL DISTRICT NO. 98
ALL NON-MAJOR GOVERNMENTAL FUNDS - BY FUND TYPEYear Ended June 30, 2018
71
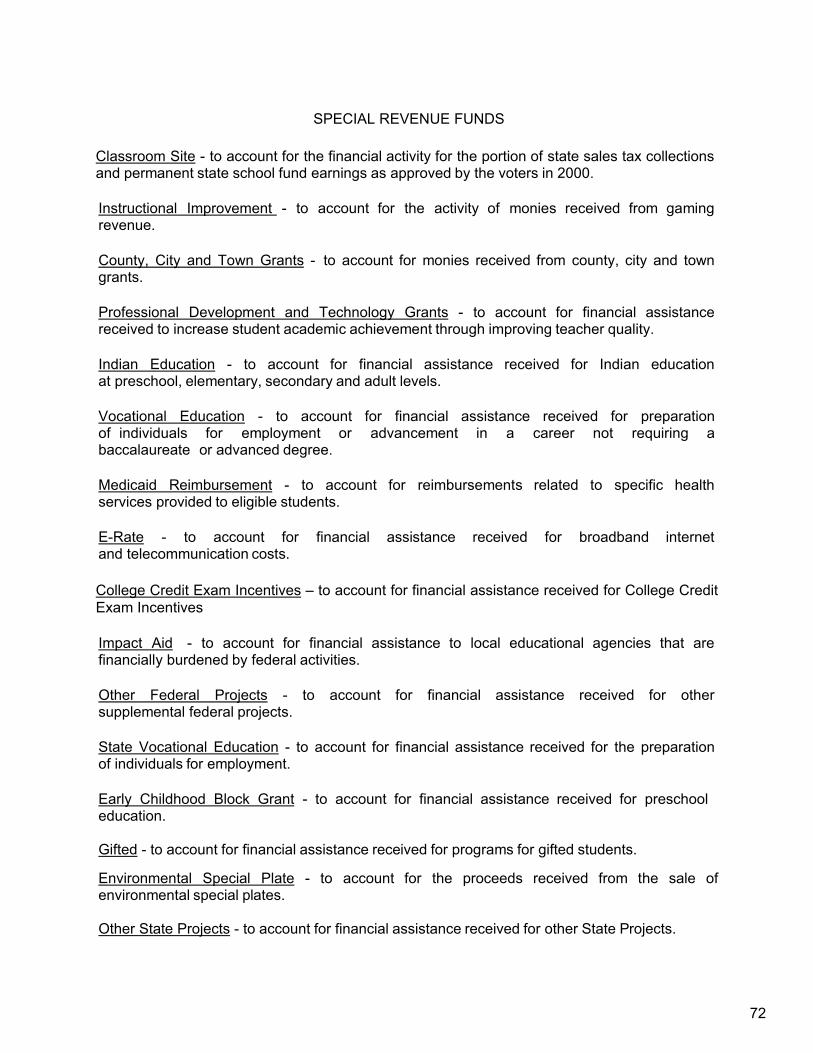
SPECIAL REVENUE FUNDS
Classroom Site - to account for the financial activity for the portion of state sales tax collections and permanent state school fund earnings as approved by the voters in 2000.
Instructional Improvement - to account for the activity of monies received from gaming revenue.
County, City and Town Grants - to account for monies received from county, city and town grants.
Professional Development and Technology Grants - to account for financial assistance received to increase student academic achievement through improving teacher quality.
Indian Education - to account for financial assistance received for Indian education at preschool, elementary, secondary and adult levels.
Vocational Education - to account for financial assistance received for preparation of individuals for employment or advancement in a career not requiring a baccalaureate or advanced degree.
Medicaid Reimbursement - to account for reimbursements related to specific health services provided to eligible students.
E-Rate - to account for financial assistance received for broadband internetand telecommunication costs.
College Credit Exam Incentives – to account for financial assistance received for College Credit Exam Incentives
Impact Aid - to account for financial assistance to local educational agencies that are financially burdened by federal activities.
Other Federal Projects - to account for financial assistance received for other supplemental federal projects.
State Vocational Education - to account for financial assistance received for the preparation of individuals for employment.
Early Childhood Block Grant - to account for financial assistance received for preschool education.
Gifted - to account for financial assistance received for programs for gifted students.
Environmental Special Plate - to account for the proceeds received from the sale of environmental special plates.
Other State Projects - to account for financial assistance received for other State Projects.
72

School Plant - to account for proceeds from the sale or lease of school property.
Food Service - to account for the financial activity of school activities that have as their purpose the preparation and serving of regular and incidental meals and snacks in connection with school functions.
Civic Center - to account for monies received from the rental of school facilities for civic activities.
Community School - to account for activity related to academic and skill development for all citizens.
Auxiliary Operations - to account for activity arising from bookstore, athletic and miscellaneous District related operations.
Extracurricular Activities Fees Tax Credit - to account for activity related to monies collected in support of extracurricular activities to be taken as a tax credit by the tax payer in accordance with A.R.S. §43-1089.01.
Gifts and Donations - to account for activity related to gifts, donations, bequests and private grants made to the District.
Career and Technical Education and Vocational Education Projects - to account for activity related to the production and subsequent sale of items produced in an instructional program by career and technical and vocational education pupils.
Insurance Proceeds - to account for the monies received from insurance claims.
Textbooks - to account for monies received from students to replace or repair lost or damaged textbooks.
Litigation Recovery - to account for monies received for and derived from litigation.
Indirect Costs - to account for monies received from Federal projects for administrative costs. Teacherage - to account for the operations of District housing facilities provided for employees of the District exclusively on Indian and Federal lands.
Advertisement - to account for monies received from the sale of advertising.
Joint Technical Education - to account for monies received from Joint Technical Education Districts for vocational education programs.
73

FOUNTAIN HILLS UNIFIED SCHOOL DISTRICT NO. 98COMBINING BALANCE SHEETNON-MAJOR SPECIAL REVENUE FUNDSJune 30, 2018
County, City Professional Classroom Instructional and Town Development Indian
Site Improvement Grants & Technology Education ASSETS Cash and cash equivalents 510,344$ 32,744$ 143,936$ -$ 78,249$ Due from other governments 59,021 27,750 104,911 25,259 -
Total assets 569,365$ 60,494$ 248,847$ 25,259$ 78,249$
LIABILITIES Accounts payable 4,115$ 125$ -$ 180$ -$ Accrued payroll and employee benefits - - - - - Due to other funds - - - 25,079 - Total liabilities 4,115 125 - 25,259 -
DEFERRED INFLOW OF RESOURCES Deferred revenue - intergovernmental - - 104,911 25,259 - Total deferred inflow of resources - - 104,911 25,259 -
FUND BALANCES Restricted
Voter approved initiatives 565,250 60,369 - - - Federal and state projects - - - - 78,249 Food service - - - - - Joint technical education - - - - - Extracurricular activities - - - - - Other local initiatives - - 143,936 - -
Assigned - - - - - Unassigned - - - (25,259) - Total fund balances 565,250 60,369 143,936 (25,259) 78,249
Total liabilities, deferred inflow of resources and fund balance 569,365$ 60,494$ 248,847$ 25,259$ 78,249$
74

CollegeVocational Credit ExamEducation E-Rate Incentives
-$ 62,107$ 18,000$ - - -
-$ 62,107$ 18,000$
-$ -$ -$
- - - - - - - - -
- - - - - -
- - - - 62,107 18,000 - - - - - - - - - - - - - - - - - - - 62,107 18,000
-$ 62,107$ 18,000$
(Continued)
75

FOUNTAIN HILLS UNIFIED SCHOOL DISTRICT NO. 98COMBINING BALANCE SHEETNON-MAJOR SPECIAL REVENUE FUNDS June 30, 2018
Other ExtracurricularState Food Community Activities Fees
Projects Service Civic Center School Tax Credit ASSETS Cash and cash equivalents 30,236$ 54,977$ 156,884$ 21,367$ 511,093$ Due from other governments - - - - -
Total assets 30,236$ 54,977$ 156,884$ 21,367$ 511,093$
LIABILITIES Accounts payable -$ 68$ -$ 1,598$ 1,428$ Accrued payroll and employee benefits - - 550 - 3,211 Due to other funds - - - - - Total liabilities - 68 550 1,598 4,639
DEFERRED INFLOW OF RESOURCES Deferred revenue - - - - - - Total deferred inflow of resources - - - - -
FUND BALANCES Restricted
Voter approved initiatives - - - - - Federal and state projects 30,236 - - - - Food service - 54,909 - - - Joint technical education - - - - - Extracurricular activities - - - - 506,454 Other local initiatives - - - - -
Assigned - - 156,334 19,769 - Unassigned - - - - - Total fund balances 30,236 54,909 156,334 19,769 506,454
Total liabilities, deferred inflow of resources and fund balance 30,236$ 54,977$ 156,884$ 21,367$ 511,093$
76

Career, Technical and Joint
Gifts and Vocational TechnicalDonations Education Textbooks Teacherage Education Totals
101,538$ 2,291$ 23,034$ 85$ 255,684$ 2,002,569$ - - - - - 216,941
101,538$ 2,291$ 23,034$ 85$ 255,684$ 2,219,510$
3,939$ -$ -$ -$ -$ 11,453$
- - - - - 3,761 - - - - - 25,079
3,939 - - - - 40,293
- - - - - 130,170 - - - - - 130,170
- - - - - 625,619 - - - - - 188,592 - - - - - 54,909 - 2,291 - - 255,684 257,975 - - - - - 506,454 - - - 85 - 144,021
97,599 - 23,034 - - 296,736 - - - - - (25,259)
97,599 2,291 23,034 85 255,684 2,049,047
101,538$ 2,291$ 23,034$ 85$ 255,684$ 2,219,510$
(Concluded)
77

FOUNTAIN HILLS UNIFIED SCHOOL DISTRICT NO. 98COMBINING STATEMENT OF REVENUES, EXPENDITURES AND CHANGE IN FUND BALANCENON-MAJOR SPECIAL REVENUE FUNDS Year Ended June 30, 2018
County, City Professional Classroom Instructional and Town Development Indian
Site Improvement Grants & Technology EducationREVENUESIntergovernmental grants and aid: Federal -$ -$ -$ 27,006$ 38,250$ State 708,253 64,471 - - - Other local 7,397 - 87,395 639 Total revenues 715,650 64,471 87,395 27,006 38,889
EXPENDITURESCurrent:Instruction 578,929 52,078 - - 38,250 Support Services:Students and staff 52,624 2,609 - - - General administration - - - 32,141 - Operation and maintenance of plant - - - - - Student transportation - - 17,351 - - Operation of noninstructional services - - - - - Capital Outlay - - - - - Total expenditures 631,553 54,687 17,351 32,141 38,250
Net change in fund balances 84,097 9,784 70,044 (5,135) 639
Fund balances, beginning of year 481,153 50,585 73,892 (20,124) 77,610
Fund balances, end of year 565,250$ 60,369$ 143,936$ (25,259)$ 78,249$
78

CollegeVocational Credit ExamEducation E-Rate Incentives
-$ 41,091$ -$ - - 18,000 - 993 - - 42,084 18,000
1,174 - -
- - - - - - - 36,782 - - - - - - - - - -
1,174 36,782 -
(1,174) 5,302 18,000
1,174 56,805 -
-$ 62,107$ 18,000$
(Continued)
79

FOUNTAIN HILLS UNIFIED SCHOOL DISTRICT NO. 98COMBINING STATEMENT OF REVENUES, EXPENDITURES AND CHANGE IN FUND BALANCENON-MAJOR SPECIAL REVENUE FUNDS Year Ended June 30, 2018
Other ExtracurricularState Food Community Activities Fees
Projects Service Civic Center School Tax CreditREVENUESIntergovernmental grants and aid: Federal -$ 195,793$ -$ -$ -$ State 52,925 - - - - Other local 318 149,119 16,481 83,397 657,738 Total revenues 53,243 344,912 16,481 83,397 657,738
EXPENDITURESCurrent:Instruction 22,401 - 6,578 40,067 692,227 Support Services:Students and staff 4,798 - - - - General administration - - 1,325 136 700 Operation and maintenance of plant - - 18,000 - - Student transportation - - - - - Operation of noninstructional services - 341,613 15,913 30,921 15,994 Capital Outlay - - - - - Total expenditures 27,199 341,613 41,816 71,124 708,921
Net change in fund balances 26,044 3,299 (25,335) 12,273 (51,183)
Fund balances, beginning of year 4,192 51,610 181,669 7,496 557,637
Fund balances, end of year 30,236$ 54,909$ 156,334$ 19,769$ 506,454$
80

Career,Technical and Joint
Gifts and Vocational TechnicalDonations Education Textbooks Teacherage Education Totals
-$ -$ -$ -$ -$ 302,140$ - - - - - 843,649
237,923 - 197 - 48,631 1,290,228 237,923 - 197 - 48,631 2,436,017
125,784 - - - - 1,557,488
56,282 - - - - 116,313 3,753 - - - - 38,055
- - - - - 54,782 - - - - - 17,351 - - - - - 404,441
5,322 - - - - 5,322 191,141 - - - - 2,193,752
46,782 - 197 - 48,631 242,265
50,817 2,291 22,837 85 207,053 1,806,782
97,599$ 2,291$ 23,034$ 85$ 255,684$ 2,049,047$
(Concluded)
81


121��0$-25�63(&,$/�5(9(18(�)81'6�%8'*(7�72�$&78$/�6&+('8/(6�

COMBINING SCHEDULE OF REVENUES, EXPENDITURES AND CHANGE IN FUND BALANCE
Budget Actual VarianceREVENUESIntergovernmental grants and aid: Federal -$ -$ -$ State - 708,253 708,253 Other Local - 7,397 7,397 Total revenues - 715,650 715,650
EXPENDITURESCurrent:Instruction 962,798 578,929 383,869 Support Services:Students and staff 87,517 52,624 34,893 General administration - - - Operation and maintenance of plant - - - Student transportation - - - Operation of noninstructional services - - - Capital Outlay - - - Total expenditures 1,050,315 631,553 418,762
Excess (deficiency) of revenues over expenditures (1,050,315) 84,097 1,134,412
OTHER FINANCING SOURCES (USES)Transfers in - - Total other financing sources and uses - - -
Net change in fund balances (1,050,315) 84,097 1,134,412
Fund balances, beginning of year - 481,153 481,153
Fund balances, end of year (1,050,315)$ 565,250$ 1,615,565$
FOUNTAIN HILLS UNIFIED SCHOOL DISTRICT NO. 98
NON-MAJOR SPECIAL REVENUE FUNDS BUDGET TO ACTUAL Year Ended June 30, 2018
Classroom Site
84

Budget Actual Variance Budget Actual Variance
-$ -$ -$ -$ -$ -$ - 64,471 64,471 - - - - - - - 87,395 87,395 - 64,471 64,471 - 87,395 87,395
57,138 52,078 5,060 - - -
2,862 2,609 253 - - - - - - - - - - - - - - - - - - 85,000 17,351 67,649 - - - - - - - - - - - -
60,000 54,687 5,313 85,000 17,351 67,649
(60,000) 9,784 69,784 (85,000) 70,044 155,044
- - - - - - - - - - - -
(60,000) 9,784 69,784 (85,000) 70,044 155,044
- 50,585 50,585 - 73,892 73,892
(60,000)$ 60,369$ 120,369$ (85,000)$ 143,936$ 228,936$
(Continued)
County, City and Town Grants Instructional Improvement
85

COMBINING SCHEDULE OF REVENUES, EXPENDITURES AND CHANGE IN FUND BALANCENON-MAJOR SPECIAL REVENUE FUNDS BUDGET TO ACTUAL
Budget Actual VarianceREVENUES
Intergovernmental grants and aid: Federal -$ 27,006$ 27,006$ State - - - Other Local - - - Total revenues - 27,006 27,006
EXPENDITURESCurrent:Instruction - - - Support Services:Students and staff - - - General administration 35,912 32,141 3,771 Operation and maintenance of plant - - - Student transportation - - - Operation of noninstructional services - - - Capital Outlay - - - Total expenditures 35,912 32,141 3,771
Excess (deficiency) of revenues over expenditures (35,912) (5,135) 30,777
OTHER FINANCING SOURCES (USES)Transfers in - - - Total other financing sources and uses - - -
Net change in fund balances (35,912) (5,135) 30,777
Fund balances, beginning of year - (20,124) (20,124)
Fund balances, end of year (35,912)$ (25,259)$ 10,653$
Professional Development & Technology
FOUNTAIN HILLS UNIFIED SCHOOL DISTRICT NO. 98
Year Ended June 30, 2018
86

Budget Actual Variance
-$ 38,250$ 38,250$ - - - - 639 639 - 38,889 38,889
60,000 38,250 21,750
- - - - - - - - - - - - - - - - - -
60,000 38,250 21,750
(60,000) 639 60,639
- - - - - -
(60,000) 639 60,639
- 77,610 77,610
(60,000)$ 78,249$ 138,249$
(Continued)
Indian Education
87

COMBINING SCHEDULE OF REVENUES, EXPENDITURES AND CHANGE IN FUND BALANCENON-MAJOR SPECIAL REVENUE FUNDS BUDGET TO ACTUAL
Budget Actual VarianceREVENUES
Intergovernmental grants and aid: Federal -$ -$ -$ State - - - Other Local - - - Total revenues - - -
EXPENDITURESCurrent:Instruction - 1,174 (1,174) Support Services:Students and staff - - - General administration - - - Operation and maintenance of plant - - - Student transportation - - - Operation of noninstructional services - - - Capital Outlay - - - Total expenditures - 1,174 (1,174)
Excess (deficiency) of revenues over expenditures - (1,174) (1,174)
OTHER FINANCING SOURCES (USES)Transfers in - - - Total other financing sources and uses - - -
Net change in fund balances - (1,174) (1,174)
Fund balances, beginning of year - 1,174 1,174
Fund balances, end of year -$ -$ -$
Vocational Education
FOUNTAIN HILLS UNIFIED SCHOOL DISTRICT NO. 98
Year Ended June 30, 2018
88

Budget Actual Variance Budget Actual Variance
-$ 41,091$ 41,091$ -$ -$ -$ - - - - - - - 993 993 - - - - 42,084 42,084 - - -
- - - - - -
- - - 6,052 - 6,052 - - - - - -
40,000 36,782 3,218 - - - - - - - - - - - - - - - - - - - - -
40,000 36,782 3,218 6,052 - 6,052
(40,000) 5,302 45,302 (6,052) - 6,052
- - - - - - - - - - - -
(40,000) 5,302 45,302 (6,052) - 6,052
- 56,805 56,805 - - -
(40,000)$ 62,107$ 102,107$ (6,052)$ -$ 6,052$
(Continued)
Other Federal ProjectsE-Rate
89

FOUNTAIN HILLS UNIFIED SCHOOL DISTRICT NO. 98COMBINING SCHEDULE OF REVENUES, EXPENDITURES AND CHANGE IN FUND BALANCENON-MAJOR SPECIAL REVENUE FUNDS BUDGET TO ACTUAL
Budget Actual VarianceREVENUES
Intergovernmental grants and aid: Federal -$ -$ -$ State - 18,000 18,000 Other Local - - - Total revenues - 18,000 18,000
EXPENDITURESCurrent:Instruction - - - Support Services: - Students and staff - - - General administration - - - Operation and maintenance of plant - - - Student transportation - - - Operation of noninstructional services - - - Capital Outlay - - - Total expenditures - - -
Excess (deficiency) of revenues over expenditures - 18,000 18,000
OTHER FINANCING SOURCES (USES)Transfers in - - - Total other financing sources and uses - - -
Net change in fund balances - 18,000 18,000
Fund balances, beginning of year - - -
Fund balances, end of year -$ 18,000$ 18,000$
College Credit Exam Incentives
Year Ended June 30, 2018
90

Budget Actual Variance
-$ -$ -$ - 52,925 52,925 - 318 318 - 53,243 53,243
- 22,401 (22,401)
- 4,798 (4,798) - - - - - - - - - - - - - - - - 27,199 (27,199)
- 26,044 26,044
- - - - - -
- 26,044 26,044
- 4,192 4,192
-$ 30,236$ 30,236$
(Continued)
Other State Projects
91
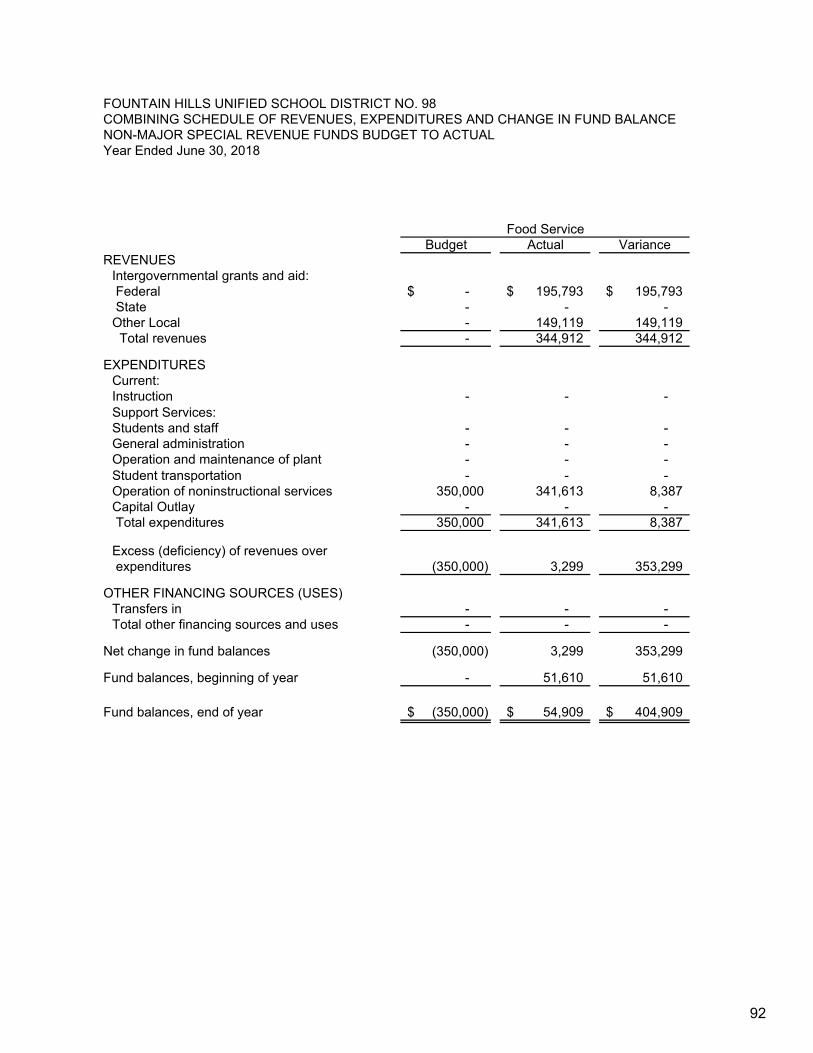
COMBINING SCHEDULE OF REVENUES, EXPENDITURES AND CHANGE IN FUND BALANCE
Budget Actual VarianceREVENUES
Intergovernmental grants and aid: Federal -$ 195,793$ 195,793$ State - - - Other Local - 149,119 149,119 Total revenues - 344,912 344,912
EXPENDITURESCurrent:Instruction - - - Support Services:Students and staff - - - General administration - - - Operation and maintenance of plant - - - Student transportation - - - Operation of noninstructional services 350,000 341,613 8,387 Capital Outlay - - - Total expenditures 350,000 341,613 8,387
Excess (deficiency) of revenues over expenditures (350,000) 3,299 353,299
OTHER FINANCING SOURCES (USES)Transfers in - - - Total other financing sources and uses - - -
Net change in fund balances (350,000) 3,299 353,299
Fund balances, beginning of year - 51,610 51,610
Fund balances, end of year (350,000)$ 54,909$ 404,909$
Food Service
FOUNTAIN HILLS UNIFIED SCHOOL DISTRICT NO. 98
NON-MAJOR SPECIAL REVENUE FUNDS BUDGET TO ACTUAL Year Ended June 30, 2018
92

Budget Actual Variance Budget Actual Variance
-$ -$ -$ -$ -$ -$ - - - - - - - 16,481 16,481 - 83,397 83,397 - 16,481 16,481 - 83,397 83,397
29,102 6,578 22,524 28,167 40,067 (11,900)
- - - - - - 5,862 1,325 4,537 96 136 (40)
79,634.59 18,000 61,635 - - - - - - - - -
70,401 15,913 54,488 21,737 30,921 (9,184) - - - - - -
185,000 41,816 143,184 50,000 71,124 (21,124)
(185,000) (25,335) 159,665 (50,000) 12,273 62,273
- - - - - - - - - - - -
(185,000) (25,335) 159,665 (50,000) 12,273 62,273
- 181,669 181,669 - 7,496 7,496
(185,000)$ 156,334$ 341,334$ (50,000)$ 19,769$ 69,769$
(Continued)
Civic Center Community School
93

COMBINING SCHEDULE OF REVENUES, EXPENDITURES AND CHANGE IN FUND BALANCE
Budget Actual VarianceREVENUES
Intergovernmental grants and aid: Federal -$ -$ -$ State - - - Other Local - 657,738 657,738 Total revenues - 657,738 657,738
EXPENDITURESCurrent:Instruction 585,871 692,227 (106,356) Support Services:Students and staff - - - General administration 592 700 (108) Operation and maintenance of plant - - - Student transportation - - - Operation of noninstructional services 13,537 15,994 (2,457) Capital Outlay - - - Total expenditures 600,000 708,921 (108,921)
Excess (deficiency) of revenues over expenditures (600,000) (51,183) 548,817
OTHER FINANCING SOURCES (USES)Transfers in - - - Total other financing sources and uses - - -
Net change in fund balances (600,000) (51,183) 548,817
Fund balances, beginning of year - 557,637 557,637
Fund balances, end of year (600,000)$ 506,454$ 1,106,454$
Extracurricular Activities Fees Tax Credit
FOUNTAIN HILLS UNIFIED SCHOOL DISTRICT NO. 98
NON-MAJOR SPECIAL REVENUE FUNDS BUDGET TO ACTUAL Year Ended June 30, 2018
94

Budget Actual Variance Budget Actual Variance
-$ -$ -$ -$ -$ -$ - - - - - - - 237,923 237,923 - - - - 237,923 237,923 - - -
131,614 125,784 5,830 - - -
58,891 56,282 2,609 2,300 - 2,300 3,927 3,753 174 - - -
- - - - - - - - - - - - - - - - - - - 5,322 (5,322) - - -
194,431 191,141 3,290 2,300 - 2,300
(194,431) 46,782 241,213 (2,300) - 2,300
- - - - - - - - - - - -
(194,431) 46,782 241,213 (2,300) - 2,300
- 50,817 50,817 - 2,291 2,291
(194,431)$ 97,599$ 292,030$ (2,300)$ 2,291$ 4,591$
(Continued)
Gifts and Donations Career, Technical and Vocational Education
95

COMBINING SCHEDULE OF REVENUES, EXPENDITURES AND CHANGE IN FUND BALANCE
Budget Actual VarianceREVENUES
Intergovernmental grants and aid: Federal -$ -$ -$ State - - - Other Local - 197 197 Total revenues - 197 197
EXPENDITURESCurrent:Instruction - - - Support Services:Students and staff - - - General administration - - - Operation and maintenance of plant 25,000 - 25,000 Student transportation - - - Operation of noninstructional services - - - Capital Outlay - - - Total expenditures 25,000 - 25,000
Excess (deficiency) of revenues over expenditures (25,000) 197 25,197
OTHER FINANCING SOURCES (USES)Transfers in - - - Total other financing sources and uses - - -
Net change in fund balances (25,000) 197 25,197
Fund balances, beginning of year - 22,837 22,837
Fund balances, end of year (25,000)$ 23,034$ 48,034$
Textbooks
FOUNTAIN HILLS UNIFIED SCHOOL DISTRICT NO. 98
NON-MAJOR SPECIAL REVENUE FUNDS BUDGET TO ACTUAL Year Ended June 30, 2018
96
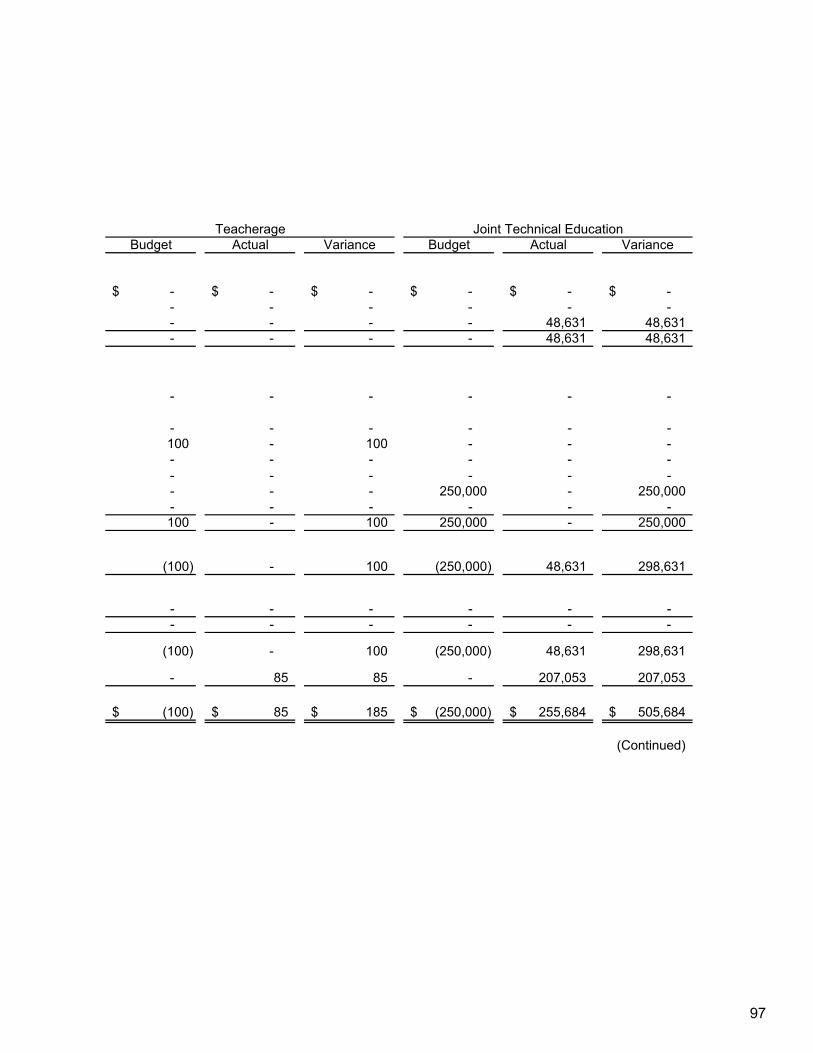
Budget Actual Variance Budget Actual Variance
-$ -$ -$ -$ -$ -$ - - - - - - - - - - 48,631 48,631 - - - - 48,631 48,631
- - - - - -
- - - - - - 100 - 100 - - - - - - - - - - - - - - - - - - 250,000 - 250,000 - - - - - - 100 - 100 250,000 - 250,000
(100) - 100 (250,000) 48,631 298,631
- - - - - - - - - - - -
(100) - 100 (250,000) 48,631 298,631
- 85 85 - 207,053 207,053
(100)$ 85$ 185$ (250,000)$ 255,684$ 505,684$
(Continued)
Teacherage Joint Technical Education
97

COMBINING SCHEDULE OF REVENUES, EXPENDITURES AND CHANGE IN FUND BALANCE
Budget Actual VarianceREVENUES
Intergovernmental grants and aid: Federal -$ 74,034$ 74,034$ State - - - Other Local - 351 351 Total revenues - 74,385 74,385
EXPENDITURESCurrent:Instruction 27,815 12,331 15,484 Support Services:Students and staff 8,766 3,886 4,880 General administration 4,426 1,962 2,464 Operation and maintenance of plant - - - Student transportation 4,994 2,214 2,780 Operation of noninstructional services - - - Capital Outlay - - - Total expenditures 46,000 20,393 25,607
Excess (deficiency) of revenues over expenditures (46,000) 53,992 99,992
OTHER FINANCING SOURCES (USES)Transfers in - - - Total other financing sources and uses - - -
Net change in fund balances (46,000) 53,992 99,992
Fund balances, beginning of year - 38,943 38,943
Fund balances, end of year (46,000)$ 92,935$ 138,935$
Medicaid
FOUNTAIN HILLS UNIFIED SCHOOL DISTRICT NO. 98
NON-MAJOR SPECIAL REVENUE FUNDS BUDGET TO ACTUAL Year Ended June 30, 2018
98

Budget Actual Variance
-$ 241,122$ 241,122$ - - - - 312,220 312,220 - 553,342 553,342
18,551 2,787 15,764
- - - 199,385 29,954 169,431
19,090 2,868 16,222 - - - - - - - - -
237,027 35,609 201,418
(237,027) 517,733 754,760
- - - - - -
(237,027) 517,733 754,760
- 237,488 237,488
(237,027)$ 755,221$ 992,248$
(Continued)
Impact Aid
99

COMBINING SCHEDULE OF REVENUES, EXPENDITURES AND CHANGE IN FUND BALANCE
Budget Actual VarianceREVENUES
Intergovernmental grants and aid: Federal -$ -$ -$ State - - - Other Local - 1,053 1,053 Total revenues - 1,053 1,053
EXPENDITURESCurrent:Instruction - - - Support Services:Students and staff - - - General administration - - - Operation and maintenance of plant - - - Student transportation - - - Operation of noninstructional services 50,000 - 50,000 Capital Outlay - - - Total expenditures 50,000 - 50,000
Excess (deficiency) of revenues over expenditures (50,000) 1,053 51,053
OTHER FINANCING SOURCES (USES)Transfers in - - - Total other financing sources and uses - - -
Net change in fund balances (50,000) 1,053 51,053
Fund balances, beginning of year - 102,821 102,821
Fund balances, end of year (50,000)$ 103,874$ 153,874$
School Plant
FOUNTAIN HILLS UNIFIED SCHOOL DISTRICT NO. 98
NON-MAJOR SPECIAL REVENUE FUNDS BUDGET TO ACTUAL Year Ended June 30, 2018
100

Budget Actual Variance
-$ -$ -$ - - - - 274,815 274,815 - 274,815 274,815
300,000 260,580 39,420
- - - - - - - - - - - - - - - - - -
300,000 260,580 39,420
(300,000) 14,235 314,235
- - - - - -
(300,000) 14,235 314,235
- 197,532 197,532
(300,000)$ 211,767$ 511,767$
(Continued)
Auxiliary Operations
101

COMBINING SCHEDULE OF REVENUES, EXPENDITURES AND CHANGE IN FUND BALANCE
Budget Actual VarianceREVENUES
Intergovernmental grants and aid: Federal -$ -$ -$ State - - - Other Local - - - Total revenues - - -
EXPENDITURESCurrent:Instruction - - - Support Services:Students and staff 36,000 - 36,000 General administration - - - Operation and maintenance of plant - - - Student transportation - - - Operation of noninstructional services - - - Capital Outlay - - - Total expenditures 36,000 - 36,000
Excess (deficiency) of revenues over expenditures (36,000) - 36,000
OTHER FINANCING SOURCES (USES)Transfers in - - - Total other financing sources and uses - - -
Net change in fund balances (36,000) - 36,000
Fund balances, beginning of year - 36,330 36,330
Fund balances, end of year (36,000)$ 36,330$ 72,330$
Insurance Proceeds
FOUNTAIN HILLS UNIFIED SCHOOL DISTRICT NO. 98
NON-MAJOR SPECIAL REVENUE FUNDS BUDGET TO ACTUAL Year Ended June 30, 2018
102

Budget Actual Variance Budget Actual Variance
-$ -$ -$ -$ -$ -$ - - - - - - - - - - - - - - - - - -
- - - - - -
- - - - - - - - - 30,000 2,963 27,037 - - - - - - - - - - - -
24,000 - 24,000 - - - - - - - - -
24,000 - 24,000 30,000 2,963 27,037
(24,000) - 24,000 (30,000) (2,963) 27,037
- - - - 28,152 28,152 - - - - 28,152 (28,152)
(24,000) - 24,000 (30,000) 25,189 55,189
- 24,525 24,525 - 36,762 36,762
(24,000)$ 24,525$ 48,525$ (30,000)$ 61,951$ 91,951$
(Continued)
Indirect CostsLitigation Recovery
103

FOUNTAIN HILLS UNIFIED SCHOOL DISTRICT NO. 98COMBINING SCHEDULE OF REVENUES, EXPENDITURES AND CHANGE IN FUND BALANCENON-MAJOR SPECIAL REVENUE FUNDS BUDGET TO ACTUAL Year Ended June 30, 2018
Budget Actual VarianceREVENUES
Intergovernmental grants and aid: Federal -$ -$ -$ State - - - Other Local - - - Total revenues - - -
EXPENDITURESCurrent:Instruction - - Support Services:Students and staff - - - General administration - - - Operation and maintenance of plant - - - Student transportation - - - Operation of noninstructional services 5,000 - 5,000 Capital Outlay - - - Total expenditures 5,000 - 5,000
Excess (deficiency) of revenues over expenditures (5,000) - 5,000
OTHER FINANCING SOURCES (USES)Transfers in - - - Total other financing sources and uses - - -
Net change in fund balances (5,000) - 5,000
Fund balances, beginning of year - - -
Fund balances, end of year (5,000)$ -$ 5,000$
Unemployment Insurance
104

Budget Actual Variance Budget Actual Variance
-$ -$ -$ -$ -$ -$ - - - - - - - 44 44 - - - - 44 44 - - -
- - - - - -
- - - - - - 20 - 20 5 - 5
- - - - - - - - - - - - - - - - - - - - - - - - 20 - 20 5 - 5
(20) 44 64 (5) - 5
- - - - - - - - - - - -
(20) 44 64 (5) - 5
- 19 19 - 3 3
(20)$ 63$ 83$ (5)$ 3$ 8$
(Continued)
Insurance Refund Advertisement
105

FOUNTAIN HILLS UNIFIED SCHOOL DISTRICT NO. 98COMBINING SCHEDULE OF REVENUES, EXPENDITURES AND CHANGE IN FUND BALANCENON-MAJOR SPECIAL REVENUE FUNDS BUDGET TO ACTUAL Year Ended June 30, 2018
Non-GAAPBudget Actual Variance
REVENUESIntergovernmental grants and aid: Federal -$ 617,296$ 617,296$ State - 843,649 843,649 Other Local - 1,878,711 1,878,711 Total revenues - 3,339,656 3,339,656
EXPENDITURESCurrent:Instruction 2,201,055 1,833,186 367,869 Support Services:Students and staff 202,388 120,199 82,189 General administration 280,325 72,934 207,391 Operation and maintenance of plant 163,725 57,650 106,075 Student transportation 89,994 19,565 70,429 Operation of noninstructional services 784,675 404,441 380,234 Capital Outlay - 5,322 (5,322) Total expenditures 3,722,162 2,513,297 1,208,865
Excess (deficiency) of revenues over expenditures (3,722,162) 826,359 4,548,521
OTHER FINANCING SOURCES (USES)Transfers in - 28,152 28,152 Total other financing sources and uses - 28,152 28,152
Net change in fund balances (3,722,162) 854,511 4,576,673
Fund balances, beginning of year - 2,481,205 2,481,205
Fund balances, end of year (3,722,162)$ 3,335,716$ 7,057,878$
(Concluded)
Total
106

CAPITAL PROJECTS FUNDS
Adjacent Ways - to account for monies received to finance improvements of public ways adjacent to school property.
School Plant – Special Construction - to account for proceeds from the sale of school property to be used for the purchase of school sites for construction, improvement, or furnishing or school buildings as approved by school district electors.
Gifts and Donations - Construction - to account for gifts and donations to be expended for capital acquisitions.
Energy and Water Savings - to account for capital investment monies, energy-related rebate or grant monies, and monies from other funding sources, to fund energy or water saving capital projects in school facilities.
Emergency Deficiencies Correction - to account for monies received from the School Facilities Board to correct emergency deficiencies.
Building Renewal Funds – to account for building renewal grant monies received from School Facilities Board for Capital Projects.
New School Facilities - to account for monies received from the School Facilities Board to be used for constructing new school facilities and purchasing land for new school sites.
107

COMBINING BALANCE SHEET NON-MAJOR CAPITAL PROJECTS FUNDS
School Plant - Gifts &Adjacent Special Donations - Energy and
Ways Construction Construction Water Savings ASSETS Cash and cash equivalents 2,858$ 2,989$ 706$ 9,954$ Due from other governments - - - -
Total assets 2,858 2,989 706 9,954
LIABILITIES Due to other funds - - - - Total liabilities - - - -
FUND BALANCES Restricted
Capital outlay 2,858 2,989 706 9,954 Total fund balances 2,858 2,989 706 9,954
Total liabilities, deferred inflow of resources and fund balance 2,858$ 2,989$ 706$ 9,954$
FOUNTAIN HILLS UNIFIED SCHOOL DISTRICT NO. 98
June 30, 2018
108

Emergency Building NewDeficiency Renewal School Correction Funds Facilities Totals
320$ -$ 3,030$ 19,857$ - 93,283 - 93,283
320 93,283 3,030 113,140
- 92,997 - 92,997 - 92,997 - 92,997
320 286 3,030 20,143 320 286 3,030 20,143
320$ 93,283$ 3,030$ 113,140$
109

FOUNTAIN HILLS UNIFIED SCHOOL DISTRICT NO. 98COMBINING STATEMENT OF REVENUES, EXPENDITURES AND
CHANGE IN FUND BALANCE
School Plant - Gifts &Adjacent Special Donations - Energy and
Ways Construction Construction Water SavingsREVENUES Intergovernmental grants and aid:
State -$ -$ -$ -$ Other local 30 - - - Total revenues 30 - - -
EXPENDITURESCurrent:Operation and maintenance of plant - - - - Capital outlay - - - - Total expenditures - - - -
Net change in fund balances 30 - - -
Fund balances, beginning of year 2,828 2,989 706 9,954
Fund balances, end of year 2,858$ 2,989$ 706$ 9,954$
NON-MAJOR CAPITAL PROJECTS FUNDSYear Ended June 30, 2018
110

Emergency Building NewDeficiency Renewal School Correction Funds Facilities Totals
-$ 191,226$ -$ 191,226$ 4 286 60 380 4 191,512 60 191,606
- 10,401 - 10,401 - 180,825 - 180,825 - 191,226 - 191,226
4 286 60 380
316 - 2,970 19,763
320$ 286$ 3,030$ 20,143$
111

COMBINING SCHEDULE OF REVENUES, EXPENDITURES AND CHANGE IN FUND BALANCE
Budget Actual VarianceREVENUES Intergovernmental grants and aid:
State -$ -$ -$ Maricopa County - 30 30 Total revenues - 30 30
EXPENDITURESCurrent:Operation and maintenance of plant - - - Capital outlay - - - Total expenditures - - -
Net change in fund balances - 30 30
Fund balances, beginning of year - 2,828 2,828 Fund balances, end of year -$ 2,858$ 2,858$
FOUNTAIN HILLS UNIFIED SCHOOL DISTRICT NO. 98
ALL CAPITAL PROJECTS FUNDS BUDGET TO ACTUAL Year Ended June 30, 2018
Adjacent Ways
112

FOUNTAIN HILLS UNIFIED SCHOOL DISTRICT NO. 98COMBINING SCHEDULES OF REVENUES, EXPENDITURES AND CHANGE IN FUND BALANCEALL CAPITAL PROJECTS FUNDS BUDGET TO ACTUAL Year Ended June 30, 2018
Budget Actual Variance Budget Actual VarianceREVENUES
State -$ -$ -$ -$ -$ -$ Maricopa County - - - - - - Total revenues - - - - - -
EXPENDITURES
Operation and maintenance of plant - - - - - - Capital outlay - - - 700 - 700
Total expenditures - - - - - -
Net change in fund balances - - - - - -
Fund balances, beginning of year - 2,989 2,989 - 706 706 Fund balances, end of year -$ 2,989$ 2,989$ -$ 706$ 706$
(Contiuned)
Gifts & Donations - ConstructionSchool Plant - Special Construction
113
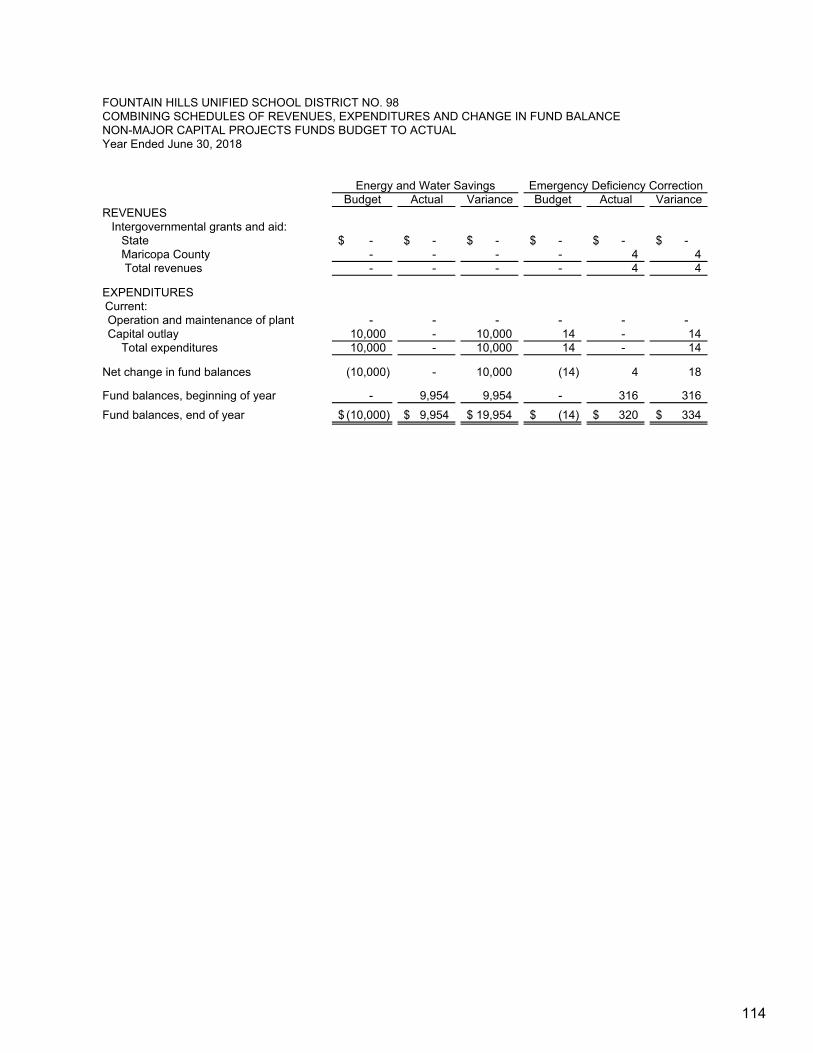
FOUNTAIN HILLS UNIFIED SCHOOL DISTRICT NO. 98COMBINING SCHEDULES OF REVENUES, EXPENDITURES AND CHANGE IN FUND BALANCENON-MAJOR CAPITAL PROJECTS FUNDS BUDGET TO ACTUALYear Ended June 30, 2018
Budget Actual Variance Budget Actual VarianceREVENUES Intergovernmental grants and aid:
State -$ -$ -$ -$ -$ -$ Maricopa County - - - - 4 4 Total revenues - - - - 4 4
EXPENDITURESCurrent:Operation and maintenance of plant - - - - - - Capital outlay 10,000 - 10,000 14 - 14
Total expenditures 10,000 - 10,000 14 - 14
Net change in fund balances (10,000) - 10,000 (14) 4 18
Fund balances, beginning of year - 9,954 9,954 - 316 316 Fund balances, end of year (10,000)$ 9,954$ 19,954$ (14)$ 320$ 334$
Emergency Deficiency CorrectionEnergy and Water Savings
114
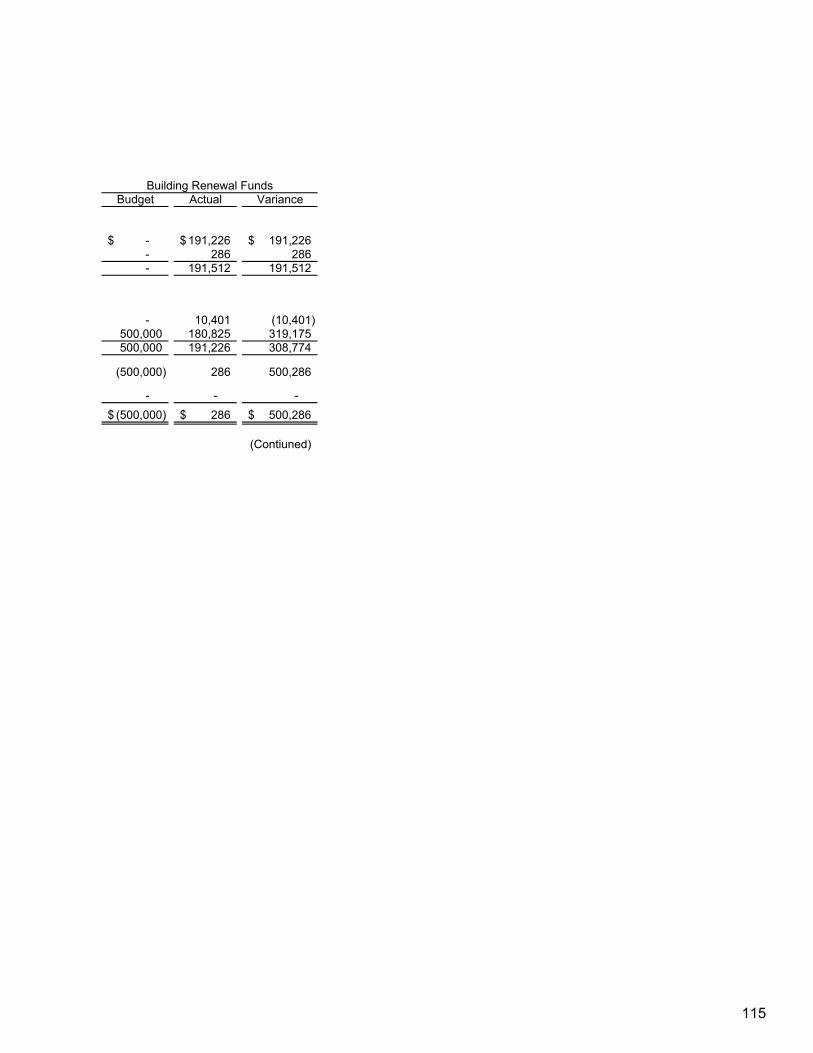
Budget Actual Variance
-$ 191,226$ 191,226$ - 286 286 - 191,512 191,512
- 10,401 (10,401) 500,000 180,825 319,175 500,000 191,226 308,774
(500,000) 286 500,286
- - - (500,000)$ 286$ 500,286$
(Contiuned)
Building Renewal Funds
115

FOUNTAIN HILLS UNIFIED SCHOOL DISTRICT NO. 98COMBINING SCHEDULES OF REVENUES, EXPENDITURES AND CHANGE IN FUND BALANCENON-MAJOR CAPITAL PROJECTS FUNDS BUDGET TO ACTUALYear Ended June 30, 2018
Budget Actual Variance Budget Actual VarianceREVENUES Intergovernmental grants and aid: -
State -$ -$ -$ -$ 191,226$ 191,226$ Maricopa County - 60 60 - 380 380 Total revenues - 60 60 - 191,606 191,606
EXPENDITURESCurrent:Operation and maintenance of plant - - - - 10,401 (10,401) Capital outlay - - - 510,714 180,825 329,889 Total expenditures - - - 510,714 191,226 319,488
Net change in fund balances - 60 60 (510,714) 380 511,094
Fund balances, beginning of year - 2,970 2,970 - 19,763 19,763 Fund balances, end of year -$ 3,030$ 3,030$ (14)$ 20,143$ 20,157$
(Concluded)
New School Facilities Total
116

AGENCY FUNDS
Student Activities – to account for monies raised by students to finance student clubs and organizations but held by District as an agent.
117


COMBINING STATEMENT OF FIDUCIARY NET POSITIONAGENCY FUNDS
StudentActivities
ASSETS Cash and investments 4,008$
Total assets 4,008$
LIABILITIES Due to student groups 4,008$
Total liabilities 4,008$
FOUNTAIN HILLS UNIFIED SCHOOL DISTRICT NO. 98
June 30, 2018
119

FOUNTAIN HILLS UNIFIED SCHOOL DISTRICT NO. 98COMBINING STATEMENT OF CHANGES IN FIDUCIARY NET POSITION AGENCY FUNDS
Beginning Ending Balances Additions Deductions Balance
STUDENT ACTIVITIES Assets
Cash and investments 5,403$ 1,038$ 2,433$ 4,008$
Total assets 5,403$ 1,038$ 2,433$ 4,008$
Liabilities Due to student groups 5,403$ 1,038$ 2,433$ 4,008$
Total liabilities 5,403$ 1,038$ 2,433$ 4,008$
June 30, 2018
120

STATISTICAL SECTION
The statistical section presents financial statement trends as well as detailed financial and operational information not available elsewhere in the report. The statistical section is intended to enhance the reader’s understanding of the information presented in the financial statements, notes to the financial statements, and other supplementary information presented in this report. The statistical section is comprised of the five categories of statistical information presented below.
Financial Trends
These schedules contain information on financial trends to help the reader understand how the District’s financial position and financial activities have changed over time.
Revenue Capacity
These schedules contain information to help the reader assess the factors affecting the District’s ability to generate revenue.
Debt Capacity
These schedules present information to help the reader evaluate the District’s current levels of outstanding debt as well as assess the District’s ability to make debt payments and/or issue additional debt in the future.
Demographic and Economic Information
These schedules present various demographic and economic indicators to help the reader understand the environment in which the District’s financial activities take place and to help make comparisons with other school districts.
Operating Information
These schedules contain information about the District’s operations and various resources to help the reader draw conclusions as to how the District’s financial information relates to the services provided by the District.
121

2018 2017 2016 2015Governmental activities Net investment in Capital Assets 30,537,965$ 30,567,808$ 30,590,493$ 29,937,583$ Restricted 4,552,848 4,677,340 5,340,577 5,668,052 Unrestricted (6,585,948) (7,596,039) (10,826,232) (11,112,615)
Total governmental activities net assets 28,504,865$ 27,649,109$ 25,104,838$ $ 24,493,020
Source: The source of this information is the District's financial records.
FOUNTAIN HILLS UNIFIED SCHOOL DISTRICT NO. 98Schedule 1
June 30
(accrual basis of accounting)Last Ten Fiscal Years
Net Position by Component
122
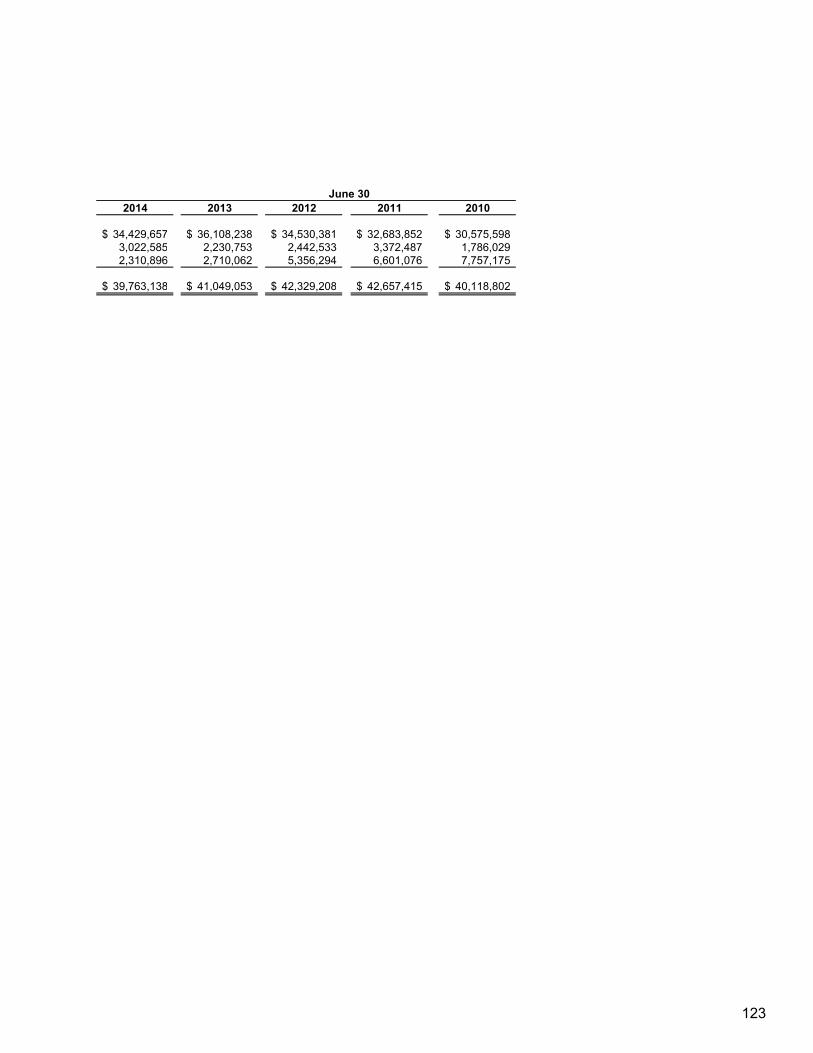
2014 2013 2012 2011 2010
34,429,657$ 36,108,238$ 34,530,381$ 32,683,852$ 30,575,598$ 3,022,585 2,230,753 2,442,533 3,372,487 1,786,0292,310,896 2,710,062 5,356,294 6,601,076 7,757,175
39,763,138$ 41,049,053$ 42,329,208$ 42,657,415$ 40,118,802$
June 30
123

2018 2017 2016 2015Governmental Activities:Expenses Instruction 7,077,129$ 8,026,034$ 7,957,479$ 9,537,930$ Support services - students and staff 1,160,198 1,217,458 1,295,990 1,365,657 Support services - administration 1,947,647 1,733,521 2,383,025 2,008,673 Operation and maintenance of plant services 1,999,971 2,063,955 2,354,074 1,373,345 Student transportation services 909,787 956,193 893,237 1,202,065 Operation of non-instructional services 402,629 383,077 382,185 476,025 Interest on long-term debt 370,680 418,480 474,642 521,993Total expenses 13,868,041 14,798,718 15,740,632 16,485,688
Program Revenues Charges for services: Instruction 56,760 46,637 27,766 68,679 Operation of non-instructional services 31,446 57,242 86,065 90,626 Other activities 256,792 368,205 371,222 362,511 Operating grants and contributions 1,602,343 1,855,188 2,589,815 2,156,906 Capital grants and contributions 232,317 50,299 118,918 41,809Total program revenues 2,179,658 2,377,571 3,193,786 2,720,531
Net (Expense)/Revenue (11,688,383)$ (12,421,147)$ (12,546,846)$ (13,765,157)$
Source: The source of this information is the District's financial records.
FOUNTAIN HILLS UNIFIED SCHOOL DISTRICT NO. 98Schedule 2
June 30
(accrual basis of accounting)Last Ten Fiscal Years
Expenses, Program Revenues, and Net (Expense) Revenue
124

2014 2013 2012 2011 2010 2009
10,149,629$ 9,350,093$ 9,774,011$ 9,727,853$ 10,027,280$ 10,822,596$ 1,626,784 1,490,928 1,664,082 1,712,491 1,952,176 2,177,7991,835,211 2,036,906 2,336,976 2,315,699 2,992,595 2,807,9482,057,009 1,986,453 2,024,988 1,970,975 2,262,389 2,136,8021,256,992 1,226,353 1,074,499 1,381,756 1,175,198 989,212
562,063 572,707 936,036 1,017,268 1,048,688 1,187,267326,472 372,191 497,207 655,206 859,962 979,629
17,814,160 17,035,631 18,307,799 18,781,248 20,318,288 21,101,253
672,591 693,587 515,035 511,191 731,825 452,512234,824 281,894 620,541 623,289 573,068 629,28154,580 57,246 90,894 83,199 99,143 85,900
1,343,039 1,679,864 1,997,032 1,698,520 1,506,220 1,441,96078,105 11,971 60,685 173,726 75,830 115,330
2,383,139 2,724,562 3,284,187 3,089,925 2,986,086 2,724,983
(15,431,021)$ (14,311,069)$ (15,023,612)$ (15,691,323)$ (17,332,202)$ (18,376,270)$
June 30
125

2018 2017 2016 2015
Net (Expense)/Revenue (11,688,383)$ (12,421,147)$ (12,546,846)$ (13,765,157)$
General Revenues: Taxes: Property taxes, levied for general purposes 5,998,078 8,737,855 7,259,894 6,422,709 Property taxes, levied for debt service 1,829,604 1,737,761 1,593,661 1,723,838 Property taxes, levied for capital outlay 841,067 712,900 723,369 926,113 Investment income 100,348 44,861 61,345 15,190 Unrestricted county aid - Unrestricted state aid 2,872,663 3,092,445 2,878,094 2,982,585 Unrestricted federal aid 623,576 29,767 276,631 377,681 Other 275,683 609,829 365,688 3,310 Total general revenues 12,541,019 14,965,418 13,158,682 12,451,426
Changes in Net Position 852,636$ 2,544,271$ 611,836$ (1,313,731)$
Source: The source of this information is the District's financial records.
General Revenues and Changes in Net PositionFOUNTAIN HILLS UNIFIED SCHOOL DISTRICT NO. 98
Schedule 3
Note: The Arizona State Legislature suspended county equalization payments to school districts for fiscal years 2006-07 throug
June 30
(accrual basis of accounting)Last Ten Fiscal Years
126

2014 2013 2012 2011 2010 2009
(15,431,021)$ (14,311,069)$ (15,023,612)$ (15,691,323)$ (17,332,202)$ (18,376,270)$
8,815,782 7,980,894 7,713,596 9,271,957 10,821,977 10,747,435 1,347,162 1,274,523 3,151,545 4,435,123 4,536,270 4,427,532
763,891 743,029 717,527 764,491 1,110,921 1,054,771 14,741 23,413 28,881 72,248 99,969 287,635
- - - - - - 3,081,828 2,780,906 3,049,134 3,490,649 3,299,960 4,661,746
485,263 228,149 34,722 195,468 493,919 127,006 - - - - - -
14,508,667 13,030,914 14,695,405 18,229,936 20,363,016 21,306,125
(922,354)$ (1,280,155)$ (328,207)$ 2,538,613$ 3,030,814$ 2,929,855$
June 30
gh 2008-09
127

2018 2017 2016 2015
General Fund Reserved -$ -$ -$ Unreserved - - - Restricted 103,874 102,821 - - Assigned - - - Unassigned 1,942,175 2,440,075 551,826 561,691
Total general fund 2,046,049$ 2,542,896$ 551,826$ 561,691$
All Other Governmental Funds Unreserved, reported in: Special revenue funds -$ -$ -$ -$ Capital projects funds - - - - Debt service funds - - - - Restricted 4,448,974 4,574,519 5,314,327 6,581,865 Assigned 296,736 262,819 604,071 312,549 Unassigned (300,101) (33,106) (461,031) (800,109)
Total all other governmental funds 4,445,609$ 4,804,232$ 5,457,367$ 6,094,305$
Source: The source of this information is the District's financial records.
FOUNTAIN HILLS UNIFIED SCHOOL DISTRICT NO. 98Schedule 4
Note: The provisions of the Governmental Accounting Standards Board (GASB) Statement No. 54 were adopted in fiscalyear 2011. The standard replaces the previous reserved and unreserved fund balance categories with the following five fundbalance classifications: nonspendable, restricted, committed, assigned, and unassigned fund balance.
June 30
(modified accrual basis of accounting)Last Ten Fiscal Years
Fund Balances, Governmental Funds
128
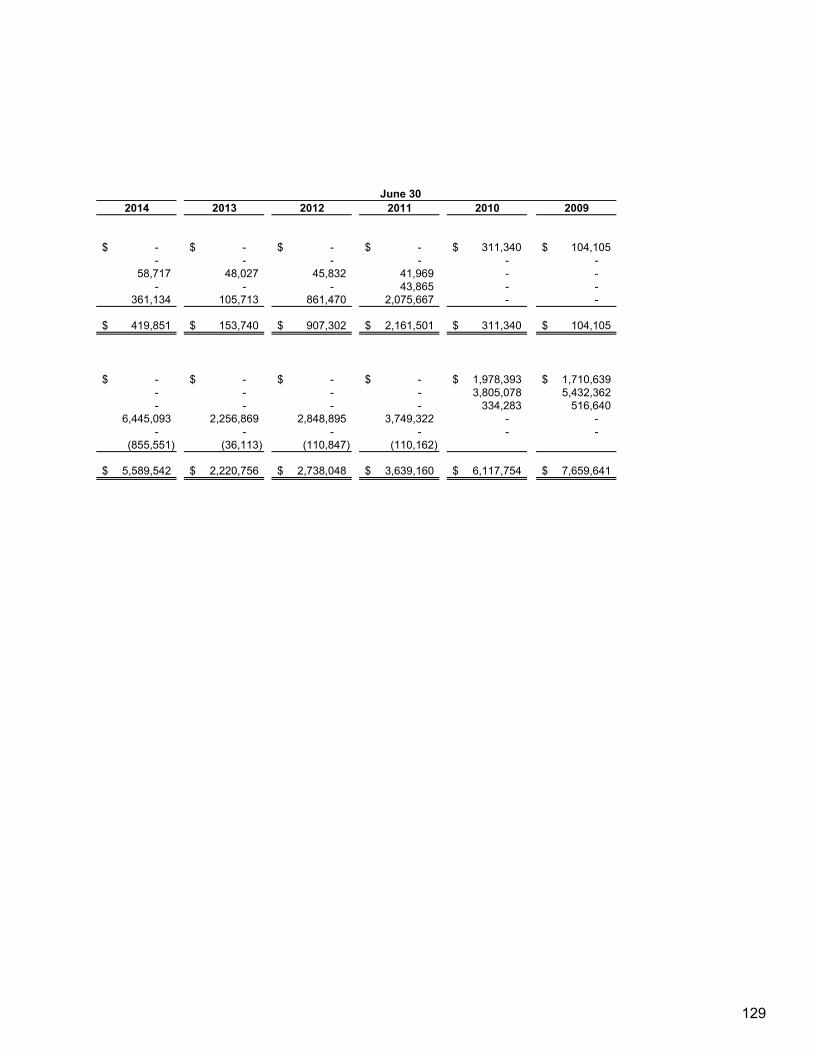
2014 2013 2012 2011 2010 2009
-$ -$ -$ -$ 311,340$ 104,105$ - - - - - -
58,717 48,027 45,832 41,969 - - - - - 43,865 - -
361,134 105,713 861,470 2,075,667 - -
419,851$ 153,740$ 907,302$ 2,161,501$ 311,340$ 104,105$
-$ -$ -$ -$ 1,978,393$ 1,710,639$ - - - - 3,805,078 5,432,362 - - - - 334,283 516,640
6,445,093 2,256,869 2,848,895 3,749,322 - - - - - - - -
(855,551) (36,113) (110,847) (110,162)
5,589,542$ 2,220,756$ 2,738,048$ 3,639,160$ 6,117,754$ 7,659,641$
June 30
129

2018 2017 2016 2015Federal grants
Federal grants 279,370$ 918,994$ 523,227$ 812,116$ State Fiscal Stabilization (ARRA) - - - Impact Aid 241,122 - 243,599 337,697 National School Lunch Program 195,793 179,259 181,482 165,411
Total federal sources 716,285 1,098,253 948,308 1,315,224
State sources:State equalization assistance 2,023,692 2,368,694 2,044,693 2,230,219 State grants 70,925 99,128 301,402 239,528 School Facilities Board - - - Other revenues 1,067,947 708,671 1,006,928 655,948
Total state sources 3,162,564 3,176,493 3,353,023 3,125,695
Local sources:Property taxes 8,652,341 10,986,339 9,590,172 10,418,553 Food service sales 149,119 161,261 188,792 170,835 Investment income 100,348 44,861 36,620 14,416 Other revenues 1,703,479 2,070,602 1,973,214 1,609,943
Total local sources 10,605,287 13,263,063 11,788,798 12,213,747
Total revenues 14,484,136$ 17,537,809$ 16,090,129$ 16,654,666$
Source: The source of this information is the District's financial records.
Governmental Funds RevenuesFOUNTAIN HILLS UNIFIED SCHOOL DISTRICT NO. 98
Schedule 5
June 30
Note: The Arizona State Legislature suspended county equalization payments to school districts for fiscal years 2006-07 through 2008-09.
(modified accrual basis of accounting)Last Ten Fiscal Years
130
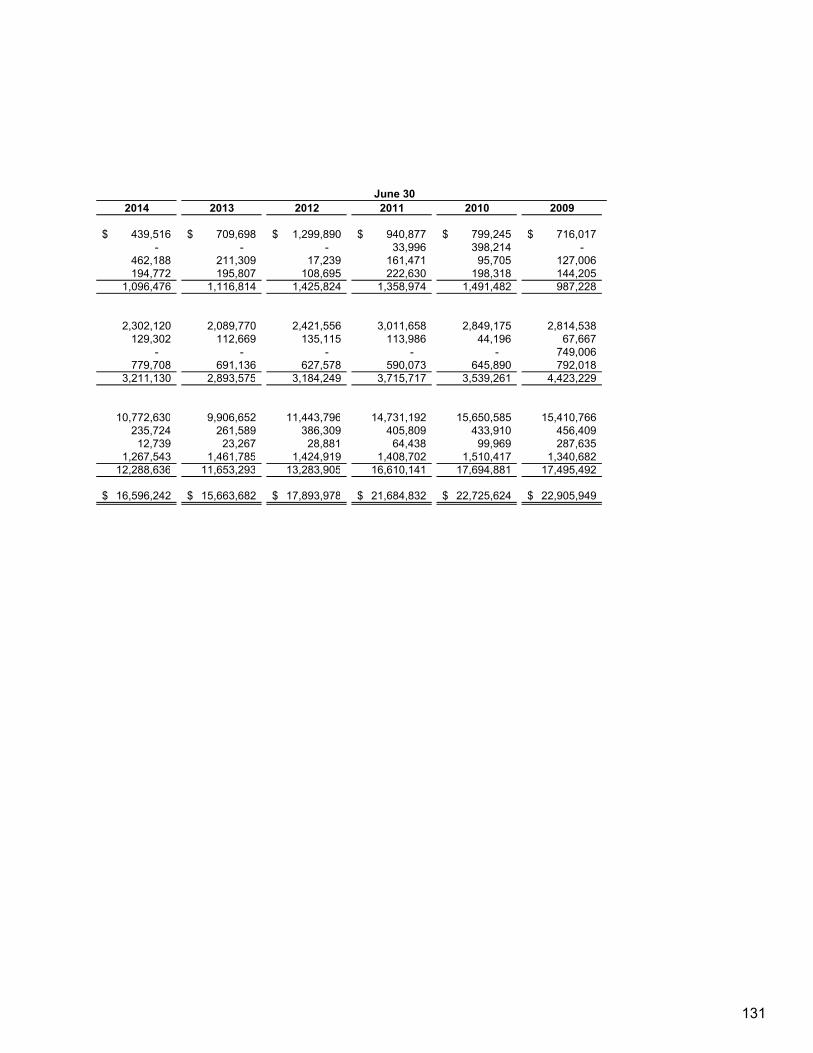
2014 2013 2012 2011 2010 2009
439,516$ 709,698$ 1,299,890$ 940,877$ 799,245$ 716,017$ - - - 33,996 398,214 -
462,188 211,309 17,239 161,471 95,705 127,006 194,772 195,807 108,695 222,630 198,318 144,205
1,096,476 1,116,814 1,425,824 1,358,974 1,491,482 987,228
2,302,120 2,089,770 2,421,556 3,011,658 2,849,175 2,814,538 129,302 112,669 135,115 113,986 44,196 67,667
- - - - - 749,006 779,708 691,136 627,578 590,073 645,890 792,018
3,211,130 2,893,575 3,184,249 3,715,717 3,539,261 4,423,229
10,772,630 9,906,652 11,443,796 14,731,192 15,650,585 15,410,766 235,724 261,589 386,309 405,809 433,910 456,409 12,739 23,267 28,881 64,438 99,969 287,635
1,267,543 1,461,785 1,424,919 1,408,702 1,510,417 1,340,682 12,288,636 11,653,293 13,283,905 16,610,141 17,694,881 17,495,492
16,596,242$ 15,663,682$ 17,893,978$ 21,684,832$ 22,725,624$ 22,905,949$
June 30
131

2018 2017 2016 2015Expenditures:
Current:Instruction 6,533,846$ 6,960,355$ 6,570,575$ 8,041,291$ Support services - students and staff 1,124,426 1,014,011 1,038,161 1,052,918 Support services - administration 2,403,780 2,163,085 2,587,598 2,349,971 Operation and maintenance of plant services 1,568,637 1,632,250 1,718,495 1,821,204 Student transportation services 750,731 779,135 803,061 1,009,788 Operation of non-instructional services 407,910 381,823 378,437 473,166
Capital outlay 752,161 1,545,896 1,905,430 3,617,739 Debt service-
Judgments against the destrict - - - Interest and fiscal charges 398,115 445,915 500,175 452,814 Principal retirement 1,400,000 1,305,000 1,235,000 1,265,000 Bond issuance costs - - 93,900
Total expenditures 15,339,606$ 16,227,470$ 16,736,932$ 20,177,791$
Expenditures for capitalized assets 841,706$ 1,279,108$ 1,212,609$ 4,259,637$
Debt service as a percentage of noncapital expenditures 13% 12% 11% 11%
Source: The source of this information is the District's financial records.
Schedule 6
June 30
FOUNTAIN HILLS UNIFIED SCHOOL DISTRICT NO. 98Governmental Funds Expenditures and Debt Service Ratio
Last Ten Fiscal Years(modified accrual basis of accounting)
132

2014 2013 2012 2011 2010 2009
7,613,402$ 7,764,568$ 8,046,444$ 7,941,507$ 8,104,162$ 8,995,535$ 1,552,803 1,491,151 1,688,013 1,702,859 1,984,488 2,050,770 1,802,596 1,714,256 1,818,992 1,954,639 2,074,221 1,973,051 1,829,988 1,891,430 1,913,674 1,839,400 2,049,252 2,107,072
804,486 962,268 904,842 897,422 860,468 789,892 546,669 570,836 934,165 1,015,397 1,000,242 1,167,955
1,185,798 1,167,836 1,155,952 2,696,835 3,167,481 7,557,022
- - - - - 90,170 340,690 372,191 497,207 655,206 859,962 976,811
1,030,000 1,000,000 3,090,000 3,610,000 3,960,000 3,870,000 90,400 - - - - 84,000
16,796,832$ 16,934,536$ 20,049,289$ 22,313,265$ 24,060,276$ 29,662,278$
642,642$ 721,949$ 575,818$ 1,849,892$ 1,658,909$ 6,246,707$
8% 8% 18% 21% 22% 21%
June 30
133

2018 2017 2016 2015
Excess (deficiecy) of revenues overexpenditures (855,470)$ 1,337,935$ (646,803)$ (3,523,125)$
Other financing sources (uses):General obligation bonds issued - - 4,000,000
Premium on sale of bonds - - 169,728 Transfers in 28,152 80,332 34,948 186,907
Transfers out (28,152) (80,332) (34,948) (186,907) Total other financing sources (uses) - - - 4,169,728
Changes in fund balalnces (855,470)$ 1,337,935$ (646,803)$ 646,603$
Source: The source of this information is the District's financial records.
June 30
Other Financing Sources and Uses and Net Changes in Fund Balances-Governmental FundsFOUNTAIN HILLS UNIFIED SCHOOL DISTRICT NO. 98
Schedule 7
Last Ten Fiscal Years
134

2014 2013 2012 2011 2010 2009
(200,590)$ (1,270,854)$ (2,155,311)$ (628,433)$ (1,334,652)$ (6,756,329)$
4,000,000 - - - - 4,000,000 199,048 - - - - 94,681 553,861 18,114 2,248 10,989 28,547 127,610
(553,861) (18,114) (2,248) (10,989) (28,547) (127,610) 4,199,048 - - - - 4,094,681
3,998,458$ (1,270,854)$ (2,155,311)$ (628,433)$ (1,334,652)$ (2,661,648)$
June 30
135


FiscalYear Taxes Levied Collections in
Ended for the Percentage Subsequent PercentageJune 30 Fiscal Year Amount of Levy Fiscal Years Amount of Levy
2018 11,324,889$ 10,525,943$ 92.95% -$ 10,525,943$ 92.95%2017 12,699,865$ 11,750,018$ 92.52% 916,066$ 12,666,084$ 99.73%2016 11,685,480$ 11,514,037$ 98.53% 137,848$ 11,651,885$ 99.71%2015 12,614,183$ 11,669,394$ 92.51% 943,607$ 12,613,001$ 99.99%2014 12,895,832$ 11,904,832$ 92.32% 990,666$ 12,895,498$ 100.00%2013 11,886,869$ 11,005,892$ 92.59% 880,756$ 11,886,648$ 100.00%2012 13,669,803$ 12,616,790$ 92.30% 806,455$ 13,423,245$ 98.20%2011 17,530,970$ 16,636,868$ 94.90% 892,644$ 17,529,512$ 99.99%2010 18,612,029$ 16,132,676$ 86.68% 1,451,762$ 17,584,438$ 94.48%2009 18,414,302$ 16,820,534$ 91.34% 1,363,294$ 18,183,828$ 98.75%
Source: The source of this information is the 2018 Maricopa County Treasurer's recordsNote: 1) Amounts collected are on a cash basis
Collected within theFiscal Year of the Levy
Collected to the end ofthe current fiscal year
2) Unsecured personal property taxes are not included in this schedule because the dates of themonthly rolls vary each year. On the average, 90% of unsecured property taxes are collected within90 days after the due date.
Schedule 8FOUNTAIN HILLS UNIFIED SCHOOL DISTRICT NO. 98
Property Tax Levies and CollectionsLast Ten Fiscal Years
137

Less: Percentage ofGeneral Amounts Estimated
Fiscal Obligation Restricted Actual Value PerYear Bonds for Principal Total (Full Cash Value) Capita
2018 11,918,622$ 11,918,622$ 0.36 % 485 2017 13,251,057$ -$ 13,251,057$ 0.36 % 589 2016 14,513,492$ -$ 14,513,492$ 0.36 % 607 2015 15,475,000$ 231,205$ 15,243,795$ 0.36 % 647 2014 12,505,000$ 242,679$ 12,262,321$ 0.33 % 528 2013 9,505,000$ 117,829$ 9,387,171$ 0.25 % 408 2012 12,595,000$ 167,979$ 12,427,021$ 0.27 % 553 2011 16,205,000$ 546,971$ 15,658,029$ 0.28 % 619 2010 20,165,000$ 3,960,000$ 16,205,000$ 0.25 % 697 2009 24,035,000$ 3,870,000$ 20,165,000$ 0.40 % 865
Source: The source of this information is the District's financial records.
Schedule 9FOUNTAIN HILLS UNIFIED SCHOOL DISTRICT NO. 98
Outstanding Debt by TypeLast Ten Fiscal Years
General Obligation Bonds
138

Percentage ofEstimated Percentage of
Capital Actual Value Per PersonalLeases Total (Full Cash Value) Capita Income
11,918,622$ 0.37 % 485 0.04 %13,251,057$ 0.37 % 589 0.08 %14,513,492$ 0.37 % 607 0.09 %15,475,000$ 0.37 % 656 0.01 %
- 12,505,000$ 0.34 % 538 0.01 %- 9,505,000$ 0.25 % 413 0.01 %- 12,595,000$ 0.27 % 5,640 0.01 %- 16,205,000$ 0.29 % 867 0.01 %- 20,165,000$ 0.31 % 1,031 0.01 %- 24,035,000$ 0.48 % 1,017 0.02 %
Total Outstanding Debt
139

REPORT ON INTERNAL CONTROL AND COMPLIANCE


INDEPENDENT AUDITORS’ REPORT ON INTERNAL CONTROL OVER FINANCIAL REPORTING AND ON COMPLIANCE AND OTHER MATTERS BASED ON AN AUDIT OF
FINANCIAL STATEMENTS PERFORMED IN ACCORDANCE WITH GOVERNMENT AUDITING STANDARDS
Governing Board Fountain Hills Unified School District No. 98 Fountain Hills, Arizona
We have audited, in accordance with the auditing standards generally accepted in the United States of America and the standards applicable to financial audits contained in Government Auditing Standards issued by the Comptroller General of the United States, the financial statements of the governmental activities, each major fund, and the aggregate remaining fund information of Fountain Hills Unified School District No. 98, (District) as of and for the year ended June 30, 2018, and the related notes to the financial statements, which collectively comprise of the District’s basic financial statements and have issued our report thereon dated January 24, 2019.
Internal Control Over Financial Reporting
In planning and performing our audit of the financial statements, we considered the District’s internal control over financial reporting (internal control) to determine the audit procedures that are appropriate in the circumstances for the purpose of expressing our opinions on the financial statements, but not for the purpose of expressing an opinion on the effectiveness of the District’s internal control. Accordingly, we do not express an opinion on the effectiveness of the District’s internal control.
A deficiency in internal control exists when the design or operation of a control does not allow management or employees, in the normal course of performing their assigned functions, to prevent, or detect and correct, misstatements on a timely basis. A material weakness is a deficiency, or a combination of deficiencies, in internal control, such that there is a reasonable possibility that a material misstatement of the entity’s financial statements will not be prevented, or detected and corrected on a timely basis. A significant deficiency is a deficiency, or a combination of deficiencies, in internal control that is less severe than a material weakness, yet important enough to merit attention by those charged with governance.
Our consideration of internal control was for the limited purpose described in the first paragraph of this section and was not designed to identify all deficiencies in internal control that might be material weaknesses or, significant deficiencies. Given these limitations, during our audit we did not identify any deficiencies in internal control that we consider to be material weaknesses. However, material weaknesses may exist that have not been identified.
Tempe • Scottsdale • Casa Grande www.hhcpa.com
Compliance and Other Matters
As part of obtaining reasonable assurance about whether the District’s financial statements are free from material misstatement, we performed tests of its compliance with certain provisions of laws, regulations, contracts, and grant agreements, noncompliance with which could have a direct and material effect on the determination of financial statement amounts. However, providing an opinion on compliance with those provisions was not an objective of our audit, and accordingly, we do not express such an opinion. The results of our tests disclosed no instances of noncompliance or other matters that are required to be reported under Government Auditing Standards.
Purpose of this Report
The purpose of this report is solely to describe the scope of our testing of internal control and compliance and the results of that testing, and not to provide an opinion on the effectiveness of the entity’s internal control or on compliance. This report is an integral part of an audit performed in accordance with Government Auditing Standards in considering the entity’s internal control and compliance. Accordingly, this communication is not suitable for any other purpose.
Casa Grande, Arizona January 24, 2019