
Founder-CEOs, Investment Decisions, and Stock...
29
JOURNAL OF FINANCIAL AND QUANTITATIVE ANALYSIS Vol. 44, No. 2,'Apr. 2009, pp. 439-466 COPYRIGHT 2009, MICHAEL G. FOSTER SCHOOL OF BUSINESS, UNIVERSITY OF WASHINGTON, SEATTLE, WA 98195 doi:10.1017/S0022109009090139 Founder-CEOs, Investment Decisions, and Stock Market Performance Rüdiger Fahlenbrach* Abstract Eleven percent of the largest public U.S. tirms are headed by the CEO who founded the firm. Founder-CEO firms differ systematically from successor-CEO firms with respect to firm valuation, investment behavior, and stock market performance. Founder-CEO firms invest more in research and development, have higher capital expenditures, and make more focused mergers and acquisitions. An equal-weighted investment strategy that had invested in founder-CEO firms from 1993 to 2002 would have earned a benchmark-adjusted return of 8.3% annually. The excess retum is robust; after controlling for a wide variety of firm characteristics, CEO characteristics, and industry affiliation, the abnormal return is still 4.4% annually. The implications of the investment behavior and stock market performance of founder-CEO firms are disctissed. I. Introduction Eleven percent of the largest public U.S. firms are still headed by a founder. Do these "founder-CEOs" differ from "successor-CEOs"? If so, does this or- ganizational difference translate into differences in firm behavior, valuation, and performance? Recent research suggests that firms in which the founding family contin- ues to be involved in management have a higher valuation than other firms (e.g., Adams, Almeida, and Ferreira (2009), Anderson and Reeb (2003), Palia and Ravid (2003), and Villalonga and Amit (2006)). Using a novel data set, I demon- strate that founder-CEO firms not only have a higher valuation but also better stock market performance, and that they make different investment decisions. 'Fahlenbrach, [email protected]. Fisher College of Business, Ohio State University, 2100 Neil Avenue, Columbus, OH 43210. I thank Heitor Almeida, John Core, David Denis, Paul Gompers, Gary Gorton, Jeff Jaffe, Craig MacKinlay, Robert Marquez, Andrew Metrick, Vinay Nair, Juliette Pamet, Krishna Ramaswamy, Patrik Sandâs, Günter Strobl, René Stulz, Geoffrey Täte, Ayako Ya- suda, Karen Wruck, and seminar participants at Amsterdam University, Dartmouth, ESSEC, Harvard Business School, HEC Lausanne, HEC Montreal, Ohio State University, University of California at Irvine, University of North Carolina at Chapel Hill, arid University of Utah for helpful comments and suggestions. Financial support from NSF grant SES-0136791 and from a Wharton research grant is gratefully acknowledged. I thank Nicholas Chang, Jen DIugosz, Ashton Hawk, Allison Loewenstein, Vanesa del valle Broussard, and Morgen Peck for their excellent research assistance. 439
Transcript of Founder-CEOs, Investment Decisions, and Stock...
JOURNAL OF FINANCIAL AND QUANTITATIVE ANALYSIS Vol. 44, No. 2,'Apr. 2009, pp. 439-466COPYRIGHT 2009, MICHAEL G. FOSTER SCHOOL OF BUSINESS, UNIVERSITY OF WASHINGTON, SEATTLE, WA 98195doi:10.1017/S0022109009090139
Founder-CEOs, Investment Decisions, andStock Market Performance
Rüdiger Fahlenbrach*
Abstract
Eleven percent of the largest public U.S. tirms are headed by the CEO who founded thefirm. Founder-CEO firms differ systematically from successor-CEO firms with respect tofirm valuation, investment behavior, and stock market performance. Founder-CEO firmsinvest more in research and development, have higher capital expenditures, and make morefocused mergers and acquisitions. An equal-weighted investment strategy that had investedin founder-CEO firms from 1993 to 2002 would have earned a benchmark-adjusted returnof 8.3% annually. The excess retum is robust; after controlling for a wide variety of firmcharacteristics, CEO characteristics, and industry affiliation, the abnormal return is still4.4% annually. The implications of the investment behavior and stock market performanceof founder-CEO firms are disctissed.
I. Introduction
Eleven percent of the largest public U.S. firms are still headed by a founder.Do these "founder-CEOs" differ from "successor-CEOs"? If so, does this or-ganizational difference translate into differences in firm behavior, valuation, andperformance?
Recent research suggests that firms in which the founding family contin-ues to be involved in management have a higher valuation than other firms (e.g.,Adams, Almeida, and Ferreira (2009), Anderson and Reeb (2003), Palia andRavid (2003), and Villalonga and Amit (2006)). Using a novel data set, I demon-strate that founder-CEO firms not only have a higher valuation but also betterstock market performance, and that they make different investment decisions.
'Fahlenbrach, [email protected]. Fisher College of Business, Ohio State University, 2100 NeilAvenue, Columbus, OH 43210. I thank Heitor Almeida, John Core, David Denis, Paul Gompers,Gary Gorton, Jeff Jaffe, Craig MacKinlay, Robert Marquez, Andrew Metrick, Vinay Nair, JuliettePamet, Krishna Ramaswamy, Patrik Sandâs, Günter Strobl, René Stulz, Geoffrey Täte, Ayako Ya-suda, Karen Wruck, and seminar participants at Amsterdam University, Dartmouth, ESSEC, HarvardBusiness School, HEC Lausanne, HEC Montreal, Ohio State University, University of California atIrvine, University of North Carolina at Chapel Hill, arid University of Utah for helpful comments andsuggestions. Financial support from NSF grant SES-0136791 and from a Wharton research grant isgratefully acknowledged. I thank Nicholas Chang, Jen DIugosz, Ashton Hawk, Allison Loewenstein,Vanesa del valle Broussard, and Morgen Peck for their excellent research assistance.
439
440 Journal of Financial and Quantitative Analysis
Founder-CEOs differ from successor-CEOs in several aspects. Founder CEOsare less likely to be removed from office than other CEOs. Founder-CEOs oftenconsider their firm as their life's achievement. This intrinsic motivation and long-term approach encourages founderrCEOs to pursue the optimal shareholder-valuemaximizing strategy instead of concentrating on short-term actions or "enjoyingthe quiet life." Founder-CEOs mayihave more organization-specific skills. Thanksto their equity stake and their entrepreneur status, founder-CEOs are likely tohave more influence and decision-making power. Thé considerable equity stakesfounders hold can potentially reduce the principal-agent problem, Founder-CEOsmay also have a different attitude toward risk than successor-CEOs, leading todifferent investment decisions.' Moreover, founder-CEOs have shaped their orga-nizations from inception, and thus the impact of differences in managerial char-acteristics on corporate behavior and performance should be particularly strongin founder-CEO firms.
To carry out my analysis, I construct a sample of 2,327 large, publicly listedU.S. firms during the 1992-2002 period (14,000 firm-years) and identify 361 sam-ple firms that were run by the original founder or cofounder of the firm during1,468 firm-years,
I find that a value-weighted (equal-weighted) investment strategy that boughtfounder-CEO firms would have earned an abnormal return of 10.7% (8,3%) an-nually in excess of a benchmark pur-factor model. The excess return remainssizable at 4.4% annually when I control for tenure, fractional CEO ownership.industry, and firm age, and when I include all of the firm characteristics identifiedby Brennan, Chordia, and Subrahmanyam (1998), The strong stock market resultsfor founder-CEO firms are surprising. If having a founder-CEO was consistentlybeneficial for firms, it is not obvi ous why the market would not have fully in-corporated the founder-CEO effect into stock prices. I therefore discuss severalpossible explanations of the excess stock market performance, such as unexpect-edly positive accounting performance or shareholders' fear of expropriation atthe beginning of the sample period, but find little evidence that could justify themagnitude of the reported excess retums.
The investment behavior of founder-CEO firms differs from the investmentbehavior of firms that have successor CEOs. They invest more in research anddevelopment (R&D), have higher capital expenditures (CAPEX), and make morefocused mergers and acquisitions (¡M&A). The economic effect is large; founder-CEO firms spend up to 22% more on R&D and up to 38% more on CAPEXthan nonfounder firms. More investments or acquisitions are not necessarily
'See, e,g,. Stein (1989) (short-term actions), Bertrand and Mullainathan (2003),("the quiet life").Fama and Jensen (1983) (organization-specific skills), Shleifer and Vishny (1997) and Burkhart,Panunzi, and Shleifer (2003) (influence on successions), Adams et al, (2005) (decision-makingpower), and Begley and Boyd (1987), Kililstrom and Laffont (1979), and McClelland (1965) (atti-tudes toward risk), A considerable amount' of research in the management and small business litera-ture discusses additional characteristics of entrepreneurs and their impact on the firm (for an overview,see Low and MacMillan (1988) and Shane |and Venkataraman (2000); other examples include Begley(1995), Daily and Dalton (1992), Evans and Leighton (1989), Reuber and Fischer (1999), and Willard,Krueger, and Feeser (1992)),
" Fahlenbrach 441
value-increasing; they could, for example, also indicate an overinvestment prob-lem in firms with entrenched founder-CEOs. I study the market reactions to M&Aannouncements of founder-CEO firms and find no evidence that the market reactsnegatively to merger announcements.
The relation between performance and investment behavior and founder-CEO status is potentially endogenous. For example, good expected futureperformance could potentially lead the founder to stay put, or unobservable firmcharacteristics could cause both the different investment decisions and thefounder-CEO status. In the valuation and investment regressions, I therefore usean instrumental variables (TVs) approach. I instrument founder status with an in-dicator variable that is equal to one if, at the time of tbe IPO, the firm bears tbename of one of its founders and an indicator variable that is equal to one if thefirm incorporated prior to 1940.
My paper is related to the literature that seeks to understand tbe performanceconsequences of organizational forms with strong family ownership. Andersonand Reeb (2003) find that S&P 500 family firms have a bigher firm valuation,measured by Tobin's Q, and a bigher return on assets (ROAs). Villalonga andAmit (2006) study ownership, control, and management of family Fortune 500companies and also find that family firms have a higher firm valuation, but theeffects are concentrated in firms in which the founder has an active involyement,Adams et al. (2009), Morck, Sbleifer, and Visbny (1988), and Palia and Ravid(2003) find systematic differences between founder-CEO and nonfounder-CEOfirms with respect to firm valuation, and Adams et al. (2009) sbow that the causal-ity is likely to run from founder-CEOs to valuation. My paper is different fromthe above in that my main focus is on tbe stock market performance and invest-ment behavior of these founder-CEO firms and on offering a possible explanationof the valuation effect, Jayaraman, Khorana, Nelling, and Covin (2000) study thestock market performance of 47 large publicly traded founder-CEO firms duringtbe period 1980-1991 and do not find an overall effect of founder-CEOs, Differ-ences in sample size, sample period, and econometric metbodology may explainwby I obtain different results.
My paper is also related to research tbat studies wbether managers matter forfirms' financial decision making. Bertrand and Mullainathan (2003), Bertrand andSchoar (2003), Chevalier and Ellison (1999), and Malmendier and Täte (2005)investigate whether and how managerial characteristics affect corporate behav-ior and performance. Data constraints usually limit the managerial characteristicsthat can be examined in large cross-sectional studies, and measures such as educa-tional background, test scores, or age cohort are conjectured to proxy for manage-rial characteristics such as knowledge, ability, or risk-taking behavior. I contributeto this literature by using founder-CEO status as a uniquely quantifiable aspect ofcorporate management.
The remainder of the paper is organized as follows. Section II deals withsample selection and the choice and construction of the IVs and offers summarystatistics of the data. Section III presents tbe valuation and stock market results.Section IV deals with tbe investment behavior of founder-CEOs and how it relatesto the characteristics of entrepreneurs. Section V discusses tbe implications oftheinvestment and stock market results, andSection VI concludes.
442 Journal of Financial and Quantitative Analysis
II. Data
A. Data Sources
My initial sample consists of firms that are listed in any of the five In-vestor Responsibility Research Center (IRRC) publications (Rosenbaum ( 1990),(1993), (1995), (1998), and (2000)1) and that have filed proxy statements with theSEC between July 1992 and June 2002. The IRRC's sample is drawn from theS&P 500 and the annual lists of the largest corporations in Fortune, Forbes, andBusinessWeek, and it has been used in many governance studies (e.g., Gompers,Ishii, and Metrick (2003), Cremers and Nair (2005)).
I obtain information on the firms' CEOs from two sources. S&P's Execu-Comp database provides information on CEO identity, characteristics, and com-pensation for 11,968 firm-year observations, or 86% of the sample. I retrieve theremaining CEO information by looking up proxy statements of the respectivefirms, which yields an additional 1 913 firm-years. My total raw sample contains13,881 firm-years, representing 2,327 unique firms and 3,633 unique CEOs.
To identify founder-CEOs, I read the proxy section on key executive person-nel for each firm-CEO combination in the database. To qualify as founder-CEO,a CEO must either be a founder or a member of the group that founded the com-pany. A CEO who took over the company through a management or leveragedbuyout or a CEO who belongs to the second or older generation of a family firmdoes not qualify as a founder-CEOJ When the proxy does not provide informationabout the CEO's employment history from which I can infer whether he foundedthe firm, I use the Hoover's report on the company's history. For the rare casesin which Hoover's does not mention the company's founder, I use a Dow JonesInteractive Service news search to verify the founder status of the CEO.'
Panel A of Table 1 summarizes the founder classification of my samplecompanies by firms, CEOs, and firm-years. I identify 372 CEOs as founder- orcofounder-CEOs. There are fewer founder-CEO firms, because 11 companieswere led subsequently by two different cofounders (e.g.. Bed, Bath & Beyond'sLeonard Feinstein and Warren Eisenberg). I classify 1,468 firm-years as observa-tions in which the current CEO is either the founder or cofounder of the company(10.6% of the total firm-years). All summary statistics and the sample descriptionare based on these numbers. Panel B of Table 1 divides the firm-years by fiscalyear. The percentage of founder firm-years does not vary much across calendaryears 1992-1997 but is higher for 1998-2000. The IRRC added several smaller
^Some of the founder classifications require more subjective assessments. Berkshire Hathawayis such an example. Warren Buffett founded the Buffett Partnership in 1956 and bought BerkshireHathaway, a textile company, nine years later. He dissolved the Buffett partnership in 1969 but usedthe Berkshire Hathaway name to continue to acquire companies.^Since Warren Buffet fundamentallytransformed Berkshire Hathaway from a textile to a holdings and investment company, I classify himas a founder. Another example is the Loews Corp. Larry and Bob Tisch founded Tisch Hotels in the late1940s and in 1960 gained control of MGM's Loew's Theaters. The Tisch Brothers demolished mostof the Loew's center city theaters and sold off the land to developers. It was not until 1971 that theychanged the name of their by-then diversified conglomerate holding company to Loews. I thereforeclassify them as founders of Loews. Fewer .than 10 firms have such a subjective classification, and allresults hold when I remove these firms from my sample.

Fahlenbrach 443
companies to its list of tracked firms, and about 20% of these companies areheaded by a founder-CEO,-'
TABLE 1
Sample of Firms and Frequency of Founder-CEO Observations
Table 1 describes simple summary statistics for the frequency of founder-CEO observations for a sampie of 13,881 firm-years from 1992 to 2002, The sampie is described in Section II. Founder-CEOs are CEOs who cculd.be classified aseither the founder or cofounder of the firm in any of the sampie years. Panei A presents the number of firms, firm-yearobservations, and CEOs. Panel B presents the time-series distribution of founder-CEOs. Panei C presents the frequencyof firms whose name at the IPO contains a personal name related to one of the founders, by decade of incorporation.Statistically significant differences at the 1%, 5%, and 10% ievels between the incidence of personal names in Panei C areindicated by " " , " , and *, respectively.
Total No, of Founder-CEOs Frequency [%]
Panel A. Full Sample (1992-2001)
FirmsCEOs .Firm-years
2,3273,633
13,881
Panet B. Firm-Years by Fiscal Year-End Groups
Fiscai Year
1992199319941995 .199619971998199920002001
Totai
1,1291,3221,3031,3541,3251,3361,7671,6911,5131,141
361372
1,468
No, Of Founder-CEOs
108132120127119133224216169120
Panel C. Firm-Years by Decade of Incorporation and Frequency of Firms with Personai Name
Year ofIncorporation
1940 or prior1941-19501951-19601961-19701971-19801981-19901991-2000
NonfounderFirms
No. of Obs. % Personai
752136197298273248
52
41.039.019.310.47.34.89.6
Founder-CEOFirms
No. of Obs,
19
2562
127132
15
% Personai
100.066.740.030.631.515.913.3 .
15.510.210.6
Frequency [%]
9.610.09.29.49.0
10.012.712.811.210.5
p-Vaiue forDifference
0,230.09'0.02"
<0.01 —< 0 , 0 1 ' "<o.or"
0,68
Financial information for the sample firms is obtained from Compustat, andmarket value and stock returns are obtained from the monthly Center for Re-search in Security Prices (CRSP) files. Following the recommendation of Kahleand Walkling (1996), I obtain SIC codes from Compustat, I also retrieve informa-tion on the governance index of Gompers et al, (2003) from the IRRC database,I use the Securities Data Company (SDC) platinum database to identify all com-pleted corporate M&As during the sample period. The institutional holdings datacome from SEC Form 13F quarterly filings, provided by Thomson Financial,
B. Choice and Construction of Instrumental Variables
In all but the stock market return regressions, I instrument founder-CEOstatus. The founder-CEO status is potentially endogenous because past success
^I have reestimated the principal regressions by removing these smaller firms from the sample andfind quantitatively and qualitatively similar results for the impact of founder-CEOs,

444 Journal of Financial and Quantitative Analysis
and the anticipation of future success and attractive investment opportunities canmake it more likely for the founder-CEO to remain in office. Such an endogenoussetting makes a causal interpretation of a founder-CEO effect on performance andinvestment hehavior more challenging and needs to be taken into account usingappropriate IV techniques.
A valid IV needs to fulfill two conditions. First, the instrument needs tobe exogenous in the principal equation of interest. Second, the coefficient of theinstrument must be nonzero in a linear projection of the endogenous variable ontoall explanatory variables. I instrument founder-CEO status using two variables.The first instrument ("personal name") is an indicator variable that is one if thefirm name at the initial public offering is related to the personal name of thefounder.'' The instrument satisfies the first condition: There is no reason to suspectthat the name of a corporation at the IPO is related to its current performanceand investment decisions. Concerning the second condition, I expect a positivecorrelation between the instrument and founder-CEO status: It seems more likelythat the corporation bears the name, or is related to the name, of the founder(s) ofthe firm at the IPO if the founder is still present at the IPO.
The second instrument ("early incorporation") is an indicator variable that isequal to one if the firm incorporated prior to 1940. This instrument is a coarseproxy for the "dead founders" instrument; of Adams et al. (2009). They con-vincingly argue that the fraction of dead founders is a good instrument: It isnegatively correlated with having a founder-CEO, and it appears uncorrelatedwith performance beyond the control variables of the second-stage regression.The early incorporation instrument assumes that for firms incorporated prior to1940, all founders are dead, and for firms incorporated after 1940, all founders arealive. This approximation is necessary due to the large number of firms (2,327) inmy database.^ In all linear projections of founder-CEO status on the instrumentsand all other explanatory variables (the first-stage regressions), the coefficientsof "personal name" and "early incorporation" are, consistent with the intuition,positive for "personal name" and negative for "early incorporation" and are bothhighly statistically significant.
""The firm name at the IPO stems from the CRSP database, which tracks historical names. Threeexamples show the general procedure of classifying the name of the firm as a personal name related tothe founder of the firm: Dell Computer Corp., P&G, and Ann Taylor. The most straightforward case ofa personal name is the first example, Dell Computer Corp. Michael Dell, founder of the firm, chose hislast name as part of the firm's name. Whenever a firm's name contains an abbreviation such as P&G,the second example, I searched Hoover's, Factiva, and the company's Web site to determine whetherthe abbreviation stood for a personal name related to the founder or for a product or technology.Hoover's states, "Candle maker William [|rocter and soap maker James Gamble merged their smallCincinnati businesses in 1837, creating The Procter & Gamble Company (P&G)." Therefore P&Gwould be classified as a personal name. The third example, Ann Taylor, would not be classified as afirm with a personal name related to the founder, although the founder chose the name. Consider thefollowing information from Hoover's: "Ann Taylor Stores started out in 1954 as a shop on ChapelStreet in New Haven, Connecticut. Founder Robert Liebeskind targeted women who would later becalled "preppie," using the conservative (and fictitious) Ann Taylor name."
'Adams et al. (2009) carefully study the history of 258 out of the 321 firms in their sample toidentify all founders and whether they are dead or alive. For 63 firms incorporated prior to 1930, theydo not collect data and assume all founders are dead.
Fahlenbrach 445
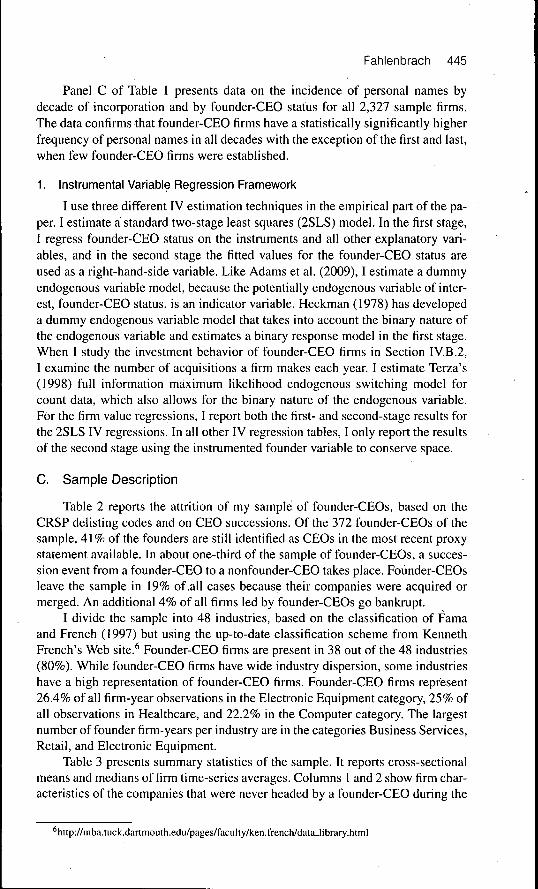
Panel C of Table 1 presents data on the incidence of personal names bydecade of incorporation and by founder-CEO status for all 2,327 sample firms.The data confirms that founder-CEO firms have a statistically significantly higherfrequency of personal names in all decades with the exception of the first and last,when few founder-CEO firms were established.
1, Instrumental Variable Regression Framework
I use three different IV estimation techniques in the empirical part of the pa-per. I estimate a standard two-stage least squares (2SLS) model. In the first stage,I regress founder-CEO status on the instruments and all other explanatory vari-ables, and in the second stage the fitted values for the founder-CEO status areused as a right-hand-side variable. Like Adams et al. (2009), I estimate a dummyendogenous variable model, because the potentially endogenous variable of inter-est, founder-CEO status, is an indicator variable. Heckman (1978) has developeda dummy endogenous variable model that takes into account the binary nature ofthe endogenous variable and estimates a binary response model in the first stage.When I study the investment behavior of founder-CEO firms in Section IV,B.2,I examine the number of acquisitions a firm makes each year. I estimate Terza's(1998) full information maximum likelihood endogenous switching model forcount data, which also allows for the binary nature of the endogenous variable.For the firm value regressions, I report both the first- and second-stage results forthe 2SLS IV regressions. In all other IV regression tables, I only report the resultsof the second stage using the instrumented founder variable to conserve space.
C, Sample Description
Table 2 reports the attrition of my sample of founder-CEOs, based on theCRSP delisting codes and on CEO successions. Of the 372 founder-CEOs of thesample, 41% of the founders are still identified as CEOs in the most recent proxystatement available. In about one-third of the sample of founder-CEOs, a succes-sion event from a founder-CEO to a nonfounder-CEO takes place. Founder-CEOsleave the sample in 19% of,all cases because their companies were acquired ormerged. An additional 4% of all firms led by founder-CEOs go bankrupt,
I divide the sample into 48 industries, based on the classification of Famaand French (1997) but using the up-to-date classification scheme from KennethFrench's Web site.* Founder-CEO firms are present in 38 out of the 48 industries(80%), While founder-CEO firms have wide industry dispersion, some industrieshave a high representation of founder-CEO firms. Founder-CEO firms represent26,4% of all firm-year observations in the Electronic Equipment category, 25% ofall observations in Healthcare, and 22,2% in the Computer category. The largestnumber of founder firm-years per industry are in the categories Business Services,Retail, and Electronic Equipment.
Table 3 presents summary statistics of the sample. It reports cross-sectionalmeans and medians of firm time-series averages. Columns 1 and 2 show firm char-acteristics of the companies that were never headed by a founder-CEO during the
*http://mba,tuck,dartmouth,edu/pages/faculty/ken,french/data-library,html

446 Journal of Financial and Quantitative Analysis
TABLE 2
Sample Attrition of Founder-CEOs
Founder-CEOs are CEOs who could be classified as|either Ihe founder or cofounder of the firm in any of the sample years.Remaining in Sample signifies that the founder-CEO, is still heading the firm at the end of the sample period. Successiondocuments a succession from a founder-CEO to either another oofounder or a nonfounder-CEO. Mergeä or Acquiredsignifies that the founder-CEO firm left the sample due to an acquisition or merger during the sample period, and Delistedby Exchange signifies a delisting of the founder-CE0 firm due to a violation of listing.requirements or bankruptcy.
Event
Remaining in SampleSuccession to NonfounderMerged cr AcquiredDelisted by ExchangeSuccession to Cofounder
Total
Founder-CEO
Number of Observations
153123711411
372
Frequency [%]
41.1333.0619.093.762.96
100.00
entire sample period, and columns 3 and 4 show the means and medians of firmcharacteristics for founder-CEO firms. I use a nonparametric Wiicoxon rank sumtest to test the equality of mediansnonfounder subsamples. With the
of the firm characteristics for the founder andexception of ROA and market capitalization.
all medians of the firm characteristics of Table 3 are statistically different forfounder-CEO and nonfounder-CEO firms at less than the 5% level.
While my database contains approximately four to eight times as many firmsand significantly more smaller firms than previous studies (e.g., Anderson andReeb (2003), Villalonga and Amit (2006)), my sample firms are still large firms:Nonfounder-CEO firms have a mean (median) market value of $4,4 billion ($ 1billion) and mean (median) total assets of $8.3 billion ($1.4 billion). Founder-CEO firms are smaller than the average nonfounder firm, both in terms of totalassets and net sales. Founder-CEO firms have a different capital structure: Themean and median financial leverage, measured as long-term debt over total assets,is smaller for founder-CEO firms than for nonfounder-CEO firms,^
Differences in two ratios between founder-CEO firms and their nonfoundercounterparts suggest that founder-CEO firms are more growth oriented: Theyhave a higher ratio of CAPEX to assets and a higher ratio of R&D expenditures toassets. Some of these differences might be explained by the fact that nonfounder-CEO firms are older than founder-CEO firms: The median nonfounder-CEO firmwas incorporated 42 years ago, compared with an average time since incorpora-tion of 20 years for the founder-CEO firms.
Founder-CEO firms, not controlling for other factors, seem to be. valuedhigher and perform better. They have on average a 42% higher Tobin's Q thannonfounder firms, and both the mean and median annualized one- and three-yearstock market returns of founder-CEO firms exceed those of the other firms, How-ever, stock returns of founder-CEO firms are more volatile than the returns ofnonfounder-CEO firms.
'Anderson, Mansi, and Reeb (2003) find that S&P 500 family firms have more leverage than non-family firms. Table 3 shows the unconditional means and medians for leverage, and founder firmsare significantly smaller than nonfounder firms in my larger and more heterogenous sample of 2,300firms. Once I control for size, founder-CEO firms do not have less leverage than nonfounder firms.

Fahlenbrach 447
TABLE 3
Firm and CEO Characteristics
Table 3 presents summary statistics of sample firm and CEO cfiaracteristics. The sample period is 1992-2001. Tfie totalsample consists of the largest publicly listed U.S. firms, a total of 2,327 unique firms. The table contains cross-sectionalmeans and medians of firm time-series averages. Founder firms are (irms that in any of the sample years were headed bya CEO who was the original founder or cofounder of the firm. For Ihe calculation of columns 3 and 4, only the years in whichthe founder was CEO of the firm were included in the time series. A statistically significant difference in medians betweenfounder-CEO and nonfounder-CEO firms at the 1 % and 5% significance levels is indicated by " and *, respectively (baseda nonparametric Wilooxon test).
Other Firms Founder Firms1,966) (N = 361)
Panel A. Firm Characteristics
fvlarket value [MM$]Assets—Total [f«lM$]Net sales [MMS]Common equity [M(vl$lFirm age [years]Long-term debt/AssetsCAPEX/AssetsR&D/AssetsNo R&D reported [%]Cash flow [%]
Panel 8. Valuation and Performance
Proxy for Tobin's 0Return on assets [%]One-year stock relurn [%]Three-year stock return [%]Volatility t%]
Panei C. CEO Characteristics
CEO ageCEO tenure [years]CEO stock ownership [%]CEO owns > 25% [%]Equity payffotal pay [%]
Founder-CEOs on average are slightly older and have a substantially longertenure than hired CEOs (16.4 years vs. 6.4 years). Founder-CEOs still hold asubstantial fraction of the equity of their firms. The mean (median) stock owner-
,ship of founder-CEOs is 11.1% (6.7%), while nonfounder-CEOs have a mean(median) ownership of 2.1% (0.4%). Of all founder-CEOs, 13.6% hold more than25% of the outstanding shares of their firms. Founder-CEOs receive a smallershare of their annual total compensation (salary, bonus, option grants, restrictedstock grants, and other annual payments) in equity-based compensation thannonfounder-CEOs, although the percentage difference of 3.5% is small, consider-ing the large difference in shares owned.
III. Founder-CEOs, Valuation, and Stock Performance
In this section, I examine differences in performance and firm valuation be-tween firms led by founder-CEOs and by nonfounder-CEOs. In Section III.A,I study firm valuation. In Section III.B, I study the difference in stock returns andfactor loadings between sample firms that are still run by their founder-CEOs andfirms that are run by nonfounder-CEOs.
Mean
4,377.908,257.433,351.831,374.45
53.600.220.060.05
50.57^ 6.75
1.763.418.63
10.4538.40
55.126.362,141.85
38.96
fvledian
1,037.011,359.591,045.47
445.5542.250.200.050.02
—7.53
1.323.65
10.2211.5833.50
55.504.750,36
_37.67
Mean
3,819.842,154.791,462.27
802.4922.140.190.070.07
40.057,41
2.503.70
13.2015.1549,78
57.1616.3811,1313.5635.50
fvledian
. 845.60660.59"618.89"299.71"
20.00"0,12"0.06"0.04-
—8.15-
1.79"4.21
14.47"16.15"46.22"
56.50"14.25"6 .71"
_35.88-

448 Journal of Financial and Quantitative Analysis
A. Firm Valuation
Firm value is measured by a proxy for Tobin's Q, I approximate Q by theratio of the market value of assets to the book value of assets. The market value iscalculated as the sum of the book value of assets and the market value of commonstock less the book value of common stock and deferred taxes. The market valueof equity is measured at the end ofjthe current calendar year, and the accountingvariables are measured in the current fiscal year. The variable measuring the in-fluence of the founder-CEO is an indicator variable that is one if the CEO of thefirm could be classified as founder at the beginning of the fiscal year, and zerootherwise.
My large sample of founders contains 123 succession events and allows meto use—besides the IV models—an additional regression setup that can controlfor unobserved, firm-specific characteristics, an advantage over previous studieswith smaller samples: I estimate a firm-fixed effects model that identifies the co-efficient of the founder dummy uniçiuely through firms in which the CEO changesfrom founder to nonfounder.
In the IV and treatment effect models, founder-CEO status is instrumentedwith "personal name" and "early incorporation," The log of sales is used to con-trol for size, I follow Shin and Stulz (2000) and include the log of firm age asof December of year t. Daines (2001) finds that Q is different for Delaware andnon-Delaware firms, so I also include a Delaware dummy as a control, Morck andYang (2002) show that S&P 500 inclusion has a positive impact on Q, which in-creased during the 1990s, In separate regressions, I also control for CEO-specificcharacteristics such as ownership, CEO age, and CEO tenure. Both regressionsinclude year atid the 48 Fama and French (1997) industry dummies, and stan-dard errors are corrected using the Huber-White-Sandwich estimator that takesfirm-level clustering into account (Rogers (1993), Petersen (2009)),
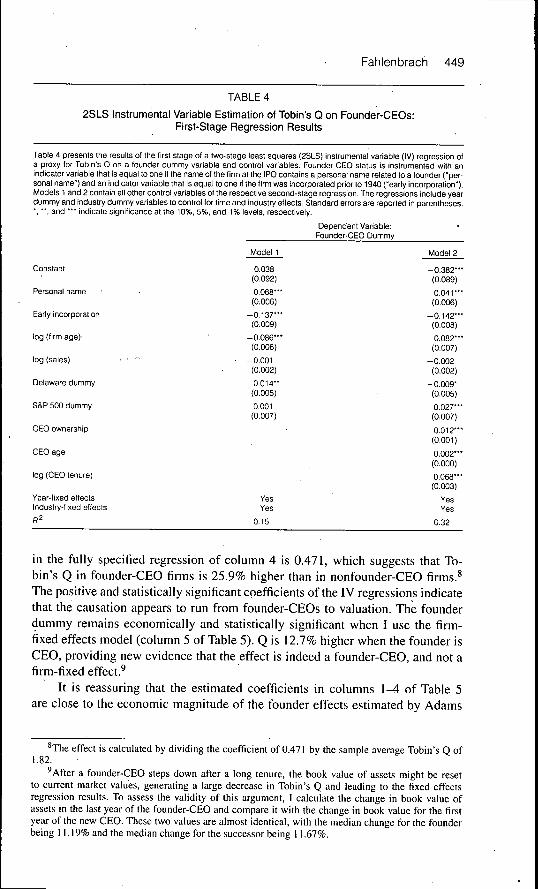
Table 4 presents the first-stage results of the 2SLS IV regression of firm val-uation on founder-CEO status and explanatory variables. The coefficients of thetwo IVs are consistent with my expectations. If the firm name at the IPO is relatedto the personal name of a founder. it is statistically significantly more likely thatthe firm has a founder-CEO during my sample period. If the firm incorporatedprior to 1940, it is more,likely thaü the founders are dead. Indeed, the coefficienton the indicator variable "early incorporation" is strongly negatively significant.The R^ of the first-stage regression varies between 15% and 32%, depending onwhether personal characteristics ofithe CEO such as age, ownership, or tenure areincluded in the regression specification.
Columns 1 and 2 of Table 5 show the results of the second stage of the 2SLSIV regressions. The instrumented founder-CEO coefficient in column 1 is signif-icantly positive. The inclusion of CEO-specific characteristics in column 2 doesnot change the significance of the results, Founder-CEOs continue to have a size-able positive and statistically significant impact on firm value as measured by Q,which is consistent with the results of Adams et al, (2009), Anderson and Reeb(2003), and Palia and Ravid (2003), Columns 3 and 4 of Table 5 show the resultsof the endogenous treatment effects model, Founder-CEO status has a positive co-efficient that is highly statistically and economically significant. The coefficient
Fahlenbrach 449
TABLE 4
2SLS Instrumental Variable Estimation of Tobin's Q on Founder-CEOs:First-Stage Regression Results
Table 4 presents the results of the first stage of a two-stage least squares (2SLS) instrumental variable (IV) regression ofa proxy (or Tobin's Q on a founder dummy variable and control variabies. Founder-CEO status is instrumented with anindicator variabie that is equai to one if the name of the firm at the IPO contains a personal name related to a founder ("per-sonal name") and an indicator variable that is equal to one if the firm was incorporated prior to 1940 ("early incorporation").Models 1 and 2 contain all other control variables of the respective second-stage regression. The regressions include yeardummy and industry dummy variables to control for time and industry effects. Standard errors are reported in parentheses.•, --, and - - indicate significance at the 10%, 5%, and 1% levels, respectiveiy.
Constant
Personal name
Early incorporation
log (firm age)
log (saies)
Delaware dummy
S&P 500 dummy
CEO ownership
CEO age
log (CEO tenure)
Year-fixed effectsIndustry-fixed effects
f^odel 1
0.038(0.092)
0.068—(0.006)
-0.137—(0.009)
-0.086—(0.006)
-0.001(0.002)
- 0 . 0 1 4 "(0.005)
0.001(0.007)
YesYes
0.15
Dependent Variable:Founder-CEO Dummy
Model 2
-0 .382" -(0.089)
0.041 —(0.006)
-0.142—(0.008)
-0 .082" -(0.007)
-0.002(0.002)
-0.009-(0.005)
0.027—(0:007)
0.012—(0.001)
0.002—(0.000)
0.068—(0.003)
YesYes
0.32
in the fully specified regression of column 4 is 0.471, which suggests that To-bin's Q in founder-CEO firms is 25.9% higher than in nonfounder-CEO firms.^The positive and statistically significant coefficients of the IV regressions indicatethat the causation appears to run from founder-CEOs to valuation. The founderdummy remains economically and statistically significant when I use the firm-fixed effects model (column 5 of Table 5). Q is 12.7% higher when the founder isCEO, providing new evidence that the effect is indeed a founder-CEO, and not afirm-fixed effect.'
It is reassuring that the estimated coefficients in columns 1 ^ of Table 5are close to the economic magnitude of the founder effects estimated by Adams
*The effect is calculated by dividing the coefficient of 0.471 by the satnple average Tobin's Q of1.82.
'After a founder-CEO steps down after a long tenure, the book value of assets might be resetto current market values, generating a large decrease in Tobin's Q and leading to the fixed effectsregression results. To assess the validity of this argument, I calculate the change in book value ofassets in the last year of the founder-CEO and compare it with the change in book value for the firstyear of the new CEO. These two values are almost identical, with the median change for the founderbeing 11.19% and the median change for the successor being 11.67%.

450 Journal of Financial and Quantitative Analysis
et al. (2009). Also, both papers reach similar conclusions about the direction ofcausality—from founders to valuation—although they are estimated using differ-ent samples and time periods.
TABLE 5
Tobin's Q and Founder-CEOs
Table 5 presents the results of regressions of a proxy for Tobin's Q on a founder dummy variable and control yariabies. Incolumns 1 and 2, results from tfie second stage of a]two-stage ieast squares (2SLS) instrumental yariable (IV) regressionare reported, Coiumns 3 and 4 report tfie results from tfie seoond stage of an endogenous treatment effects modei. Incolumns 1-4, founder-CEO status is instrumented wjtfi an indicator variable tfiat is equai to one if tfie name of tfie firm attfie iPO contains a personai name reiated to a founder ("personai name") and an indicator variabie tfiat is equal to one iftfie firm vïas incorporated prior to 1940 ("eariy incorporation"). Column 5 reports tfie resuits of a firm-fixed effects model,in whicfi tfie founder-CEO variable is identified tfiroJgfi firms in wfiich tfie CEO cfianges from founder to successor, O isapproximated as tfie ratio of the market value of assets to the book yalue of assets, less tfie industry's median 0 (using the48 Fama-French (1997) industries). The market valué is calculated as the sum of the book value of assets and the marketvalue of common stock less the book value of common stock and deferred taxes. The market vaiue of equity is measuredat the end of the current calendar year, and the accounting variables are measured in the current fiscal year. The founderdummy variable is one if the CEO could be classified]as founder or cofounder of the firm at the beginning of the fiscal year,and zero otherwise. The regressions of columns 1-5 include year dummy variables to controi for time effects, Tfie standarderrors of the coefficients iri columns 1-5 are corrected for sériai correlation on a firm level and for heteroskedasticity usingthe Huber-White-Sandwich estimator. Standard errors are reported in parentheses, ', " , and '•• indicate significance atthe 10%, 5%, and 1% levels, respectively.
IVRegression
Founder dummy(instrumented)
Founder dummy
log (firm age)
log (sales)
Deiaware dummy
S&P 500 dummy
CEO ownership
CEO age
iog (CEO tenure)
Year-fixed effectsIndustry-fixed effectsFirm-fixed effects
0,984"(0,410)
-0,109(0,099)
-0,120—(0,023)
0,107-(0,054)
0,641 —(0,077)
YesYesNo
0,21
1,245"(0,483)
-0 ,252"(0,101)
4o,1O2-"(0,024)
0,114"(0,057)
0,623"-(0,084)
0,006(0,007)
0,021 —(0,004)
0,035(0,044)
YesYesNo
0,21
0,475"(0,127)
- 0 , 2 2 2 "(0,053)
- 0 , 0 9 2 "(0,025)
0,039(0,056)
0,564"(0,075)
TreatmentEffects
0,471 —(0,134)
-0,210—(0,056)
-0,078—(0,026) ,
0,049(0,059)
0,559—(0,078)
FixedEffects
0,318—(0,092)
-0,234—(0,035)
YesYesNo
0,002(0,004)
-0,019—(0,004)
0,092—(0,025)
YesYesNo
0,004(0,004)
-0 ,006"(0,002)
0,028(0,019)
YesNo
Yes
0,03
B. Stock Market Returns
1. Portfolio Construction
The Securities Exchange Act of 1934 (Reg. §240.14a) requires a firm tosend to its shareholders a proxy statement that provides material facts concern-ing matters on which the shareholders will vote, as well as data on the last fiscalyear's five highest paid officers and their compensation. Each proxy statementmust contain the date on which the document was filed with the SEC; therefore,by studying a proxy statement, one can determine when the statement was madepublicly available. Proxy statements are usually filed three months after the endof the fiscal year and one to two months before the annual meeting. The executive

Fahlenbrach 451
compensation information in S&P's ExecuComp database is collected from proxystatements, and the proxy filing date is reported as part ofthe ExecuComp databasein the field SRCDATE,
Each July, starting in 1993 and up to 2002,1 form a portfolio by buying allfirms whose proxy statements were filed between July of year í - 1 and Juneof year t, and whose CEO could be identified as a founder. The portfolio is up-dated annually. If a firm is delisted in any month between July and June, I includethe delisting return from CRSP for the respective firm. In some cases, firms filetheir proxy statements in July of year t — 1 and in the following year in June, Insuch cases, I discard the July t — 1 observation to avoid duplicating the same firmin the founder portfolio. The investment strategy I use is fully implementable:At the time the portfolio is constructed, the classification into founder-CEO andnonfounder-CEO firms is based upon publicly available information. In addition,this investment strategy is very conservative. If founder-CEO firms have higherreturns, the investment strategy can likely be improved by updating the portfo-lio more frequently and by removing from the founder sample all firms whosefounder-CEO has stepped down. With my current investment strategy, a founder-CEO might have stepped down in August of year í — 1, yet that firm would stillbe classified as a founder-CEO firm from July t until June t+ I.
The following additional data requirements reduce the original sample sizeby 4,9%, I exclude 473 firm-years (3,4%) from the sample due to missing Com-pustat and CRSP data, I remove all ExecuComp firms that are missing the proxyfiling date, and I do not use firms that filed their proxies before June 1992 and af-ter July 2002, These two steps remove 85 firm-years (0,6%) from my sample. Theavoidance of double-counting reduces the sample size by 132 firm-years. My finalsample—the one I use in all return regressions—consists of 13,192 firm-years, ofwhich 1,409 (10,7%) are classified as founder firm-years. It contains 2,270 firms,
2, Empirical Results
An equal-weighted (value-weighted) investment in the founder-CEO port-folio in July 1993 with one rebalancing period per year would have yielded anaverage annual raw return of 16,34% (13,87%) in December 2002, while theequal-weighted (value-weighted) market return over the same period was 9,99%(8,48%),
One possible explanation for this performance difference is that several eq-uity characteristics of founder-CEO firms differ from those of other firms, namely,their exposure to the market factor, market capitalization, book-to-market ratio,and immediate past returns—all characteristics that have been shown to be sig-nificant in forecasting future returns (see, e,g,, Banz (1981), Eama and Erench(1992), and Jegadeesh and Titman (1993)), To analyze whether these differencesin characteristics can explain the differences in returns, I estimate a four-factormodel that consists of the three Fama-French factors (Fama and French (1993))and a momentum factor (Carhart ( 1997)), I do not engage in the ongoing debateabout whether these factors are proxies for risk; I simply view the model as amethod of performance attribution and interpret the estimated intercept coeffi-cient as the abnormal return in excess of what could have been achieved by aninvestment in these factors.

452 Journal of Finanoial and Quantitative Analysis
The founder-CEO sample contains some of the largest and most success-ful firms of the 1990s, including Berkshire Hathaway, Charles Schwab, Comcast,Computer Associates International, Dell, Home Depot, Microsoft, Oracle, Sun,and Toys "R" Us. I thus estimate both value- and equal-weighted return regres-sions to see whether the results are primarily driven by a few large firms.
The first two rows of Table 6 show that a value-weighted portfolio of founder-CEO firms yields a monthly alpha' of 89 basis points (bps), which corresponds toan annual rate of 10.68%. An equal-weighted investment in the founder-CEOportfolio yields a monthly alpha of 69 bps, or an annual rate of 8.28%. This resultdemonstrates that the excess performance is not driven by the success of a fewlarge firms. It is interesting to note that the factor loadings of the book-to-marketfactor (HML) are significant for both the value- and equal-weighted portfolios butthat they change sign. The value-weighted portfolio invests more in growth firms,whereas the equal-weighted portfolio is geared toward a value investment style.Panel B of Table 6 shows the results of a four-factor return regression on a portfo-lio of all nonfounder-CEO firms. Both the value- and equal-weighted alpha of thenonfounder-CEO portfolio are economically small and statistically indistinguish-able from zero.
TABLE 6
Performance-Attribution Regressions for the Founder Portfolio (July 1993-December 2002)
iTable 6 reports estimates from a regression based on a four-factor model lor a portfolio of firms in which the founder orcofounder is stili the CEO. Both vaiue- and equai-wèighted monthly return regressions are estimated. The portfolio is reseteach Juiy. The dependent variabie is the monthly return in excess of the T-bili rate from either a vaiue- or equal-weightedinvestment in the founder-CEO portfoiio. The four [factors are defined in Fama and French (1993) and Carhart (1997).The factors are the returns to zero-investment portfolios designed to capture market (RMRF), size (SMB), book-to-market(HML), and momentum (Momentum) effects, respectively. Fama and French (1993) and.parhart (1997) provide details onhow to construct these factors. Standard errors are in parentheses. ' and " indicate significance at the 5% and 1% levels.respectively.
Panel A. Founder-CEO Portfolio
Value-weighted
Equal-weighted
Panel B. Nonfounder-CEO Portfolio
Value-weighted
Equal-weighted
MonthlyAlpha (%)
0.890'*(0.280)
0.690"(0.166)
0.051(0.056)
0.123(0.121)
RMRF
1.043"(0.075)
1.153"(0.044)
0.969"(0.015)
1.058"(0.032)
SMB
-0.190-(0.074)
0.573"(0.044)
- 0 . 1 4 2 "(0.015)
0.401"(0.032)
HML
- 0 . 7 1 3 ". (0.096)
0.226"(0.057)
0.168"(0.019)
0.648"(0.042)
Momentum
-0.074(0.039)
- 0 . 1 9 9 "(0.023)
-0.015(0.008)
- 0 . 1 2 2 "(0.017)
Adj.
0.851
0.928
0.982
0.926
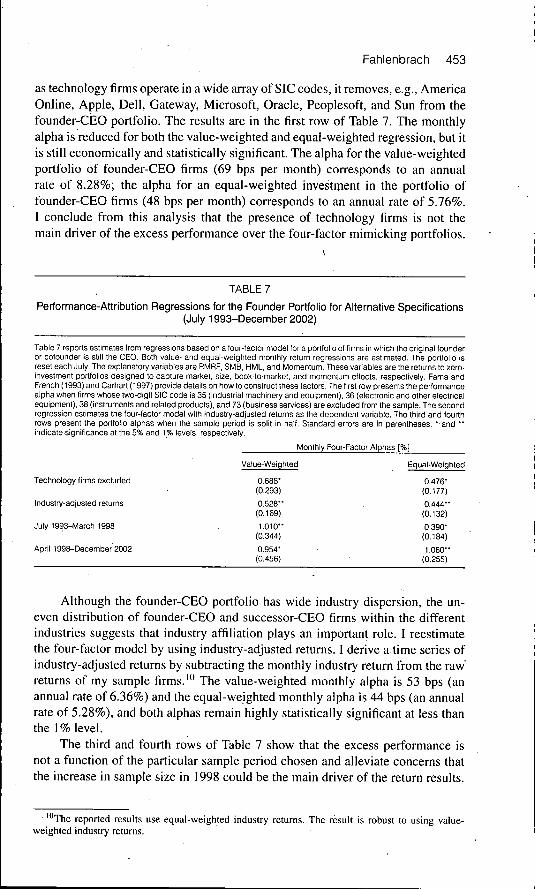
Table 7 presents the alphas of four-factor model regressions when using al-ternative specifications that control for various sample characteristics. The firstcharacteristic I control for is the presence of technology firms, which did extra-ordinarily well in the 1990s, the period from which the majority of my firm-years are taken, and which are overrepresented among founder-CEO firms. 1repeat the analysis of Table 6 but follow Anderson and Reeb (2003) and excludefirms whose two-digit SIC code is either 35 (industrial machinery and equip-ment), 36 (electronic and other electrical equipment), 38 (instruments and re-lated products), or 73 (business services). While the filter is an approximation.
Fahlenbrach 453
as technology firms operate in a wide array of SIC codes, it removes, e,g,, AmericaOnline, Apple, Dell, Gateway, Microsoft, Oracle, Peoplesoft, and Sun from thefounder-CEO portfolio. The results are in the first row of Table 7, The monthlyalpha is reduced for both the value-weighted and equal-weighted regression, but itis still economically and statistically significant. The alpha for the value-weightedportfolio of founder-CEO firms (69 bps per month) corresponds to an annualrate of 8.28%; the alpha for an equal-weighted investment in the portfolio offounder-CEO firms (48 bps per month) corresponds to an annual rate of 5,76%,I conclude from this analysis that the presence of technology firms is not themain driver of the excess performance over the four-factor mimicking portfolios.
TABLE 7
Performance-Attribution Regressions for the Founder Portfolio for Alternative Specifications(July 1993-December 2002)
Table 7 reports estimates from regressions based on a four-factor modei for a portfoiio of firms in wfiich tfie original founderor cofounder is stiil the CEO, Both vaiue- and equai-weighted monthly return regressions are estimated. The portfoiio isreset each Juiy, The expianatory variabies are RfviRF, SiVIB, HML, and Momentum. These variabies are the returns to zero-investment portfoiios designed to oapture market, size, book-to-market, and momentum effects, respectively. Fama andFrench (1993) and Carhart (1997) provide details on how to construct these factors. The first row presents the performahceaipha vihen firms whose two-digit SiC code is 35 (industrial machinery and equipment), 36 (electronic and other eiectrioaiequipment), 38 (instruments and reiated products), and 73 (business services) are excluded from the sampie. The secondregression estimates the four-factor modei with industry-adjusted returns as the dependent variable. The third and fourthrows present the portfolio alphas when the sample period is split in haif. Standard errors are in parentheses. '• and "indicate significance at the 5% and 1% levéis, respectively.
Monthly Four-Factor Alphas [%]
Value-Weighted Equal-Weighted
Technology firms excluded 0,688* 0.476"(0,293) (0.177)
Industry-adjusted returns 0,528" 0.444"(0,169) (0,132)
Juiy 1993-March 1998 . 1.010" 0.390'(0.344) (0,184)
April 1998-December 2002 0.954' 1,060"(0.456) • (0.255)
Although the founder-CEO portfolio has wide industry dispersion, the un-even distribution of founder-CEO and successor-CEO firms within the differentindustries suggests that industry affiliation plays an important role, I reestimatethe four-factor model by using industry-adjusted returns, I derive a time series ofindustry-adjusted returns by subtracting the monthly industry return from the raw'returns of my sample firms,'" The value-weighted monthly alpha is 53 bps (anannual rate of 6,36%) and the equal-weighted monthly alpha is 44 bps (an annualrate of 5,28%), and both alphas remain highly statistically significant at less thanthe 1% level.
The third and fourth rows of Table 7 show that the excess performance isnot a function of the particular sample period chosen and alleviate concerns thatthe increase in sample size in 1998 could be the main driver of the return results.
"Ttie reported results use equal-weigtited industry returns. The result is robust to using value-weighted industry returns.

454 Journal of Financial and Quantitative Analysis
When 1 divide the sample itito two periods of equal length, the value-weightedand equal-weighted portfolios show positive and statistically significant excessperformance both in the early and late sample periods. The later subperiod has aconsiderably higher equal-weighted alpha but a stable value-weighted alpha com-pared to the earlier sample period'. The IRRC started coverage of some smallerfirms in February 1998. These sm'all founder-CEO firms did well during 1998-2002, moving the alpha of the equal-weighted regression, but they are too smallto influence the value-weighted regressions.
To control for a variety of equity characteristics other than exposure to themarket, size, book-to-market ratio, and momentum, I also conduct cross-sectionalFama-MacBeth (1973) regressions. I use the extensive list of characteristics inBrennan et al. (1998), as well as institutional ownership (Gompers and Metrick(2001)), inclusion in the S&P 5o'p (Morck and Yang (2002)), an index of thestrength of shareholder rights (Gompers et al. (2003)), and CEO ownership. Foreach month in the sample period,' I estimate an equal-weighted cross-sectionalregression of the industry-adjusted return on a vector of explanatory control vari-ables and the founder dummy and then calculate the mean and time-series stan-dard deviation of the 118 monthly (March 1993-December 2002) coefficients.
For each firm, the founder dummy variable is updated during the month fol-lowing the proxy filing date. CEO tenure is the number of months since the CEOtook office. CEO ownership is measured as the percentage of common equity heldby the CEO at the end of the prior fiscal year. Institutional ownership is measuredas shares held by institutions (aggregated over all five types collected by Thom-son Financial) divided by total shares outstanding. I use the most recent quarteras of the end of month í — 1, with shares outstanding measured on the same date.I include a dummy variable indicating membership in the S&P 500 as of the endof month í — 1. All other explanatory variables are calculated as described inBrennan etal. (1998).
Table 8 reports the results. The first model includes control variablesdesigned to compare the Fama-MacBeth (1973) results to the four-factor regres-sions. The coefficient on the founder dummy has a value of 36 bps and is statisti-cally significant at the 2% level. The parameter value is close to the correspondingalpha of 44 bps in the industry-adjusted, equal-weighted four-factor regression ofTable 7.
The second model uses all explanatory variables as controls. The coefficientof the founder dummy is economically and statistically significant, at 37 bpsmonthly (an annual rate of 4.44%). During the sample period, among the otherfirm characteristics, only size and one of the momentum factors (the compoundedgross return from month - 7 to —12) are positive and statistically significant.
In summary, the coefficient on the founder dummy remains economicallyand statistically significant in the Fama-MacBeth (1973) regressions. Founder-CEO firms outperform other firms in a statistically and economically signifi-cant way. As an additional robustness check, I have formed long-short portfoliosmatched through two-way sorts by key characteristics (e.g., firm age and size.firm age and CEO tenure) where I go long the founder portfolio and short thematched nonfounder portfolio. The returns to these portfolios are strongly posi-tively significant.

Fahlenbrach 455
TABLE 8
Fama-MacBeth MonVn by Month Regressions of Stock Returnson Founder Dummy and Control Variables
Table 8 presents the average coefficients and time-series standard errors for 118 cross-sectionai regressions for eachmonth from fiflarch 1993 to December 2002, The dependent variabie is the industry-adjusted stocl< return for month (,industry adjustment is done by subtracting the appropriate Fama-French (1997) industry return each month from eachfirm's stocl< return. Firms are assigned to be founder-CEO firms if the CEO mentioned in the annuai proxy statement isidentifiable as founder or cofounder of the firm. For each firm, the founder dummy variable is updated in the month follov fingthe proxy fiiing date. Book equity is the book value of common equity plus baiance-sheet deferred taxes and is caiculatedfor each firm's latest fiscal year ending in caiendar year ( — 1, The book-to-market ratio is calculated using market equity inDecember of year t — 1, Market vaiue is measured in month ( — 1, Firm age is the number of months passed since the firmwas first listed on a U,S, exchange. Return x.y is the compounded gross return for months í - y to t - x, CEO tenure is themonths passed since the CEO took office, CEO ownership is the number of shares heid by the CEO divided by the numberof shares outstanding, G-score is the sharehoider rights index of Gompers et ai, (2003), Price is the ciosing price of thestock at the end of month t - 2, Nasdaq volume (NYSE-AMEX volume) is the doilar voiume of trading in month t - 2 forstocks that trade on the Nasdaq (NYSE and AMEX), It is approximated as stock price at the end of month I — 2, multipiiedby share volume in month ( - 2, For New York Stock Exchange (NYSE) and American Stock Exchange (AMEX) stocks,Nasdaq voiume equals zero. For Nasdaq stocks, NYSE-AMEX voiume equals zero. Dividend yieid is the ratio of dividendsin the previous fiscai year (Compustat item 21) to market capitalization measured at calendar year end, Nasdaq dummyis a dummy variable equal to one if the firm traded on the Nasdaq-Stock Market at the beginning of month (, and zerootherwise, S&P 500 is a dummy variable indicating membership in the SSP 500 as of the end of month ( - 1, institutionalownership is measured as shares held by institutions divided by totai shares outstanding, I use the most recent quarteras of the end of month í — 1, with shares outstanding measured on the same date, in the regressions, the values of theaccounting variabies are matched with industry-adjusted returns from July ol year ( to June of year t + ^. Standard errorsare reported in parentheses, ' and " indicate significance at the 5% and t% levéis, respectively.
Model 1 Model 2
Intercept , 0,22 -0,94(1,12) (1,21)
Founder dummy 0,36' 0,37'(0,14) • (0,17)
log (book-to-market) 0,09 , 0,09(0,08) (0,07)
log (market value) 0,00 0,38*(0,07) (0,17)
Return 2J3 0,54 0,63(0,63) (0,58)
Return 4.6 0,52 0,72(0,49) (0,48)
Return 7.12 1,02" 1,07"(0,33) (0,30)
iog (firm age) (in months) -0 ,06(0,08)
log (CEO tenure) (in months) 0,04(0,04)
CEO ownership -1,18(0,85)
G-soore • 0,00(0,01)
Price • , -0,26(0,14)
NYSE-AMEX volume -0,25(0,15)
Nasdaq volume —0,26(0,16)
Dividend yieid -0 ,90(1,84)
, Nasdaq dummy 0,59(0,97)
S&P 500 -0,17(0,17)
Institutional ownership 0,06(0,34)
456 Journal of Financial and Quantitative Analysis
IV. Characteristics of Entrepreneurs and InvestmentBehavior
The performance and valuation results are strongly significant after control-ling for managerial ownership, suggesting a role of the founder-CEO beyond anincentive alignment through his equity stake, I now examine the investment be-havior and M&A activities of founder-CEO firms and discuss how the findingsare related to characteristics commonly attributed to founders.
Two traits of entrepreneurs that potentially relate to investment behaviorare attitude toward risk and the handling of ambiguous situations. For example,Sarasvathy, Simon, and Lave (1998) find that entrepreneurs and bankers manageand perceive risks very differently. Budner (1962) defines intolerance for ambigu-ity as "a tendency to perceive ambiguous situations as sources of threat," and inBegley and Boyd (1987), entrepreneurs handle ambiguous situations better thanbankers do.
The productivity surge during my sample period ofthe 1990s generated newopportunities that founder-CEOs may have been more willing to seize, I study thishypothesis by examining whether founder-CEOs make different expenditure andM&A decisions than nonfounder-CEOs,
A, Research and Development and Capital Expenditures
I study whether firms have
Table 9 shows the results offixed effects models that include
different expenditure patterns by examiningCAPEX and R&D expenditures, relative to the total assets of the firm.
IVs, endogenous treatment effects, and firm-both firm-specific and CEO-specific control
variables. The R&D regressions only include firm-year observations for whichCompustat reports data (6,300 observations). Both R&D and CAPEX are scaledby the average of contemporaneous and lagged book value of assets,"
Throughout all three specifications, the coefficient of R&D is statisticallysignificant at the 1% level. The effect of founder-CEOs appears economicallylarge. Firms with founder-CEOs spend up to 5,4% more on R&D than nonfounderfirms. When I control for unobservable firm-specific characteristics in the firm-fixed effects regressions and measure the effect of founder-CEOs only againsttheir successors in the same firm, founders spend 1,2 percentage points more onR&D, Relative to the sample mean of 5,3%, this corresponds to 22,6% moreexpenditures for R&D,
The average founder-CEO firm has higher CAPEX than nonfounder firms.The increase in CAPEX is robust through all three specifications. Relative to theaverage CAPEX of 6,2% in the sample, the firm-fixed effects coefficient (column 6of Table 9) corresponds to 38% higher CAPEX,
Overall, founder-CEO firms seem to have higher discretionary expenditures.The large coefficients of the firm-fixed effects regressions for both R&D andCAPEX suggest that it is indeed a founder-CEO effect driving the results of R&D
' ' The results are robust to scaling by lagged book value of assets, lagged sales, or lagged properties,plant, and equipment.

Fahlenbrach 457
TABLE 9
R&D and Capital Expenditures
Table 9 presents the results of regressions of research and deveiopment and capital expenditures Oh a founder indicatorvariable and control variabies. Coiumns 1 and 2 report the resuits cf the second stage of a two-stage least squares (2St_S)instrumental variable (IV) regression, and coiumns 3 and 4 report the results of the second stage of a two-stage endogenoustreatment effects model. Founder-CEO status is instrumented with an indicator variable that is equal to one if the nameof the firm at tfie iPO contains a personai name reiated to the founder and an indicator variable equal to one if the firmincorporated prior to 1940. Columns 5.and 6 report the results of a firm-fixed effects model, in which the founder-CEOvariabie is identified through firms in whicfi the CEO changes from founder to successor. CAPEX is capitai expendituresdivided by the average of current and past year's assets. R&D ratio is R&D expenditures divided by the average of currentand past year's assets. The founder dummy variabie is one if the CEO could be classified as founder or cofounder of thefirm at the beginning of the fiscal year, and zero othen«ise. Regressions in coiumns 1-4 include year and 48 Fama-French(1997) industry dummy variabies to controi for time and industry, and the standard errors of the coefficients are correctedfor serial correlation on a firm level and for heteroskedasticity using the Huber-White-Sandwich estimator. Standard errorsare reported in parentheses. ', " , and " * indicate significance at the 10%, 5%, and 1% ieveis, respectiveiy.
Constant
Founder dummy(instrumented)
Founder dummy
log (sales)
0
CEO ownership
CEO age
log (tenure)
Year-fixed effectsindustry-fixed effectsFirm-fixed effects
R 2
IV Hi
R&D
0.188*"(0.026)
0,054***(0,020)
-0.009***(0,002)
0,004***(0,001)
-0,001***(0,000)
-0,001***(0,000)
-0,004(0,003)
YesYesNo
0,351
îgressions
CAPEX
0,241*(0,140)
0,155***(0,034)
-0,005**(0,002)
0,030***(0,002)
-0,002***(0,000)
-0,002***(0,000)
-0,002(0,003)
YesYesNo
0,285
Treatment Effects
R&D
0,142***(0,021)
0,017***(0,006)
-0,010***(0,002)
0,004***(0,001)
-0,001***(0,000)
-0,001***(0,000)
0,001(0,002)
YesYesNo
CAPEX
0,222**(0,106)
0,043***(0,010)
-0,007***(0,002)
0,032***(0.002)
0,000(0,001)
-0,002***(0,001)
0,008***• (0,002)
YesYesNo
-
Fixed Effeots
R&D
0,105***(0,017)
0,011***(0,003)
-0,009***(0,002)
0,001***(0,003)
-0,001(0,001)
-0,001(0,002)
YesNoYes
0,154
CAPEX
0,126**(0,055)
0,024*(0,013)
0,009*(0,005)
0.029***(0.002)
-0,001(0,001)
-0,001***(0,000)
YesNoYes
0,137
and CAPEX, and not merely a growth firm effect. Furthermore, the use of IVtechniques alleviates concerns that the founder only stays as CEO if the firm isdoing well and can afford to grow rapidly.
B, Mergers and Acquisitions
I study the completed U.S corporate M&A activities of founder-CEO andnonfounder-CEO firms during the sample period. The M&A activities of founder-CEO firms may be different from those of nonfounder CEOs for at least tworeasons.
A manager's risk preferences may be associated with takeover decisions(e,g,, Amihud and Lev (1981), May (1995)), For example. May (1995) studies theacquisition behavior of different groups of CEOs and finds evidence that diversi-fying merger activity is infiuenced by managerial objectives and preferences. Thepreviously mentioned literature suggests that founders have higher risk-bearingcapacities than nonfounders, Founder-CEO firnis may therefore be less prone tomaking potentially value-destroying diversifying acquisitions, Jensen (1993) hasconjectured that an executive can use acquisition activity not to buy targets that are

458 Journal of Financial and Quantitative Analysis
Strategie and enhance the firm's value but rather to waste corporate resources andto build an empire, Founder-CEOs might be less prone to such inefficient empirebuilding because they have a higher equity stake and a longer planning horizon.However, if founder-CEOs choose to empire build, they may succeed more often
sample firms of private, public,
have in their firm, I examine the number of ac-of the total annual acquisitions relative to
due to the powerful position theyquisitions per year as well as thefirm size to test these hypotheses,
1 , Deal Characteristics
I use the SDC Platinum database to identify all completed acquisitions byand subsidiary targets from January 1992 to
December 2002,Table 10 shows summary statistics of the data. The 2,327 sample firms make
a total of 8,138 acquisitions during the sample period, Nonfounder-CEO firms un-dertake 7,070, and founder-CEO ifirms undertake 1,068 acquisitions, SDC reportscomplete transaction data for approximately 47% of all acquisitions, I classifyan acquisition as nondiversifyinglif the target's main business line is operating inthe same Fama-French (1997) industry as the acquirer's, Nonfounder-CEO firmsmade 3,765 nondi versify ing acquisitions, which corresponds to 53,3% of all ac-quisitions they made. The univariate statistics show that founder-CEO firms un-dertook more nondiversifying acquisitions (60,9% of all activity). The majority ofall target companies are private companies for both nonfounder- and founder-CEOfirms, followed by subsidiary and public targets. The incidence of private targetsis, at 60,2%, significantly higher for founder-CEO firms than for nonfounder-CEO firms (48,9%), At the same time, the incidence of public targets is signifi-cantly lower for founder-CEO firms. Given that Moeller, Schlingemann, and Stulz(2004) and Masulis, Wang, and Xie (2007) find, on average, positive acquirer an-nouncement returns for private targets and negative returns for public targets, thefrequencies of Table 10 can be interpreted as suggestive evidence for better ac-quisitions by founder-CEO firms'.
Panel B of Table 10 shows the statistics for all M&As for which SDCprovides details on transaction price and method of payment. The statistics ondiversifying acquisitions and type of target are similar to the overall sample,Nonfounder-CEO firms tend to make more cash-only acquisitions, and the over-all percentage of cash in deals is significantly higher for nonfounder-CEO firms(61,6%) than for founder-CEO firms (56,4%).
2, Acquisition Count and Acquisition Ratios
I use two measures to identify acquisition activity. Following Gompers et al,(2003), I count the number of acquisitions per firm-year (acquisition count). Togauge the acquisition activity in relation to the size of the firm, I also calculate anacquisition ratio as the sum of the prices of all acquisitions in each calendar year,divided by the firms' average market capitalization for the first day and last day ofthe year. The latter statistic requires recorded transaction prices and thus uses only3,280 and 502 observations for nonfounder-CEO firms and founder-CEO firms,respectively. The mean transaction volume by firm-year is $596 million (median$65 million).

Fahlenbrach 459
TABLE 10
Mergers and Acquisitions: Summary Statistics
Panel A of Table 10 presents the number and characteristics of all completed mergers and acquisitions (f\/l&As) of private,pubiic, and subsidiary targets made by sampie firms during the sampie period. Panei B presents the number and charac-teristics of M&As for which a transaction price and method of payment were recorded by SDC. The first two coiumnsprovide statistics for nonfounder-CEO firm-years, the last two columns present statistics for founder-CEO firm-years.'* and * indicate statistically significant difference in the means for founder- and nonfounder firms at the 1% and 5%levels, respectively.
Panel A. Ali Mergers and Acquisitions
Total number of acquisitionsTotal number of acquisitions with transaction prices
Nondiversifying acquisitionsDiversifying acquisitions
Private targetPublic targetSubsidiary target
Panel B. MSAs with Recorded Transaction Prices
Total number of acquisitions .
Nondiversifying acquisitionsDiversifying acquisitions
Private targetPubiic targetSubsidiary target
Cash-only acquisitions
Average % paid with cashAverage % paid with stockAverage % paid differentiy
NonfoundeiFirm-Years
No. of Obs. % of Total
7,0703,280
3,7653,305
3,4591.2572.354
3,280
1,9061.374
. 1,228930
1,122
1,567
61.56%33.63%
• 4.79%
100.0046.39
53.2546.75
48.9217.7833.30
100.00
58.1141.89
37.4428.3534.21
47.77
FounderFirm-Years
No. Of Obs. % of Total
1,068502
650418
643145280
502
320182
247107148
212
100.0047.00
60.86"39.14"
60.21"13.58"26.22"
100.00
63.75-36.25-
49.20"21.31"29.48-
42.23-
56.44%"38.87%"
4.69%
Table 11 summarizes the results of regressions for both the acquisition countand the acquisition ratio. For the acquisition count, I estimate a full informationmaximum likelihood endogenous switching model for count data (Terza (1998))to address the issue of endogeneity of founder-CEO status: In this model, thedummy variable for the treatment group (founder-CEO) is instrumented with"personal name" and "early incorporation." Columns 1-3 of Table 11 present theresults for the acquisition count on the instrumented founder dummy, the naturallogarithm of Q, the natural logarithm of market capitalization, firm age, and op-erating cash flow, all measured in December t - I. Andrade and Stafford (2004)document that there is industry clustering for acquiring firms during the 1970-1994 period. Therefore, I include the 48 Fama-French industry dummies and yeardummies in the regression.
Columns 4-6 of Table 11 present the results of IV Tobit regressions of theacquisition ratio on the same explanatory variables and instruments. I estimatea Tobit regression because 53% of the sample firm-years have a value of zerodollars for the dependent variable.
Column 1 of Table 11 demonstrates that larger, older firms with higher mar-ket values acquire more firms per year. Firms that are headed by founder-CEOsmake more acquisitions per year than nonfounder-CEO firms after controllingfor CEO characteristics. CEO ownership enters the regression with a negativeeffect, and CEO tenure has a positive effect. Columns 2 and 3 split the sampleinto nondiversifying and diversifying acquisitions and show a clear pattern:

460 Journal of Financial and Quantitative Analysis
TABLE 11
Mergers and Acquisition Activity of Sample Firms (1992-2002)
The first three columns present results from a pooled time-series Poisson regression that ailows for endogenous treatmenteffects. The dependent variable Is the number of acquisitions per firm per year, the dependent variabies include the naturallogarithms of book-to-market ratio, firm age, and market capitalization, as well as cash flow, shares ovined by the CEO,CEO age, and CEO tenure, all measured in December í — 1, Founder-CEO status is instrumented with an indicator variablethat is equal to one if the name of the firm at the IPJO contains a personal name related to the founder and an indicatorvariabie equal to one if the firm incorporated prior to 1940, Additionally, I include year and the 48 Fama-French industrydummy variabies to control for time and industry clustering (not reported). The first column reports the overall results, andthe second and third coiumns spiit the sample into diversifying and nohdiversifying acquisitions. The fourth through sixthcolumns present the results of an instrumental variable Tobit regression of the acquisition ratio on the samé explanatoryvariabies, using the same instruments for founder-(ÎEO status. Acquisition ratio is defined as the sum of the value of allcorporate acquisitions during a year scaied by thé average of market value at the beginning and end of the year theacquisition occurred. Standard errors are reported iri parentheses, *, " , and • " indicate significance at the 10%, 5%, and1 % levels, respectiveiy.
ntercept
Founder dummy(instrumented)
og(O)
og (Market cap)
og (Firm age)
Cash flow
CEO age
CEO ownership [%]
CEO tenure
Year-fixed effectsndustry-fixed effects
Founder-CEOs
All
- 2 , 2 6 * "(0,61)
0,22-(0,13)
0,12"(0,05)
0,23"*(0,03)
0,03(0,07)
0,45(0,31)
- 0 , 0 2 " *(0,00)
-0,014**(0,005)
0,07**(0,04)
YesYes
make c(
AcquisitionlCount
Diver
-3,13*(0,87)
0,02(0,21)
0,12*(0,06)
0,28*(0,04)
0,02(0,08)
0,39(0,40)
-o,oid(0,007)
-0,006(0,007)
0,05(0,04:
YesYes
insiderab
Non-Diver,
-3,17**(0,72)
0,38***(0,12)
0,12*(0,06)
0,18***(0,03)
0,04(0,07)
0,49(0,39)
-0,02***(0,01)
-0,020***(0,005)
0,09**(0,04)
YesYes
)lv more non
All
-0,39(0,27)
0,28(0,31)
0,02(0,01)
0,01(0,01)
-0,02(0,04)
-0,01(0,09)
-0,004***(0,001)
-0,006(0,004)
-0,005(0,025)
YesYes
diversifvi
Acquisition Ratio
Diver,
-0,67**(0,25)
0,37(0,31)
0,02(0,01)
0,013**(0,006)
0,05(0,04)
0,01(0,07)
-0,004**(0,001)
-0,008*(0,004)
-0,02(0,02)
YesYes
ne acGuisitio
Non-Diver,
-2,17***(0,41)
0,22(0,39)
0,02(0,02)
0,02*(0,01)
-0,07(0,05)
-0,02(0,12)
-0,003*(0,002)
-0,003(0,005)
0,03(0,03)
YesYes
IS thannonfounder-CEOs (i.e., they invest in firms that are in the same industry).'^ Thisresult is consistent with the conjectures of Fama and Jensen (1983) aboutorganization-specific skills of entrepreneurs and the evidence of May (1995), whoshows that entrepreneurs are specialists who acquire firms that correspond to theirspecific skill set.
Columns 4-6 of Table 11 show the results of an IV Tobit regression of rela-tive acquisition size on explanatory variables and founder status. The results sug-gest that founder-CEOs are not different from other firms' CEOs with respectto the overall acquisition dollar volume relative to the market valuation. Firmcharacteristics, with the exception of size, do not seem to infiuence firms' dollaracquisition activity relative to their market valuations.
Columns 1-3 of Table 11 show that founders make more acquisitions peryear, and columns 4-6 demonstrate that the aggregate value of these acquisitions
'^The results of columns 1-3 of Table 11 hold when 1 condition on having price and type of pay-ment information available before I count the number of acquisitions.

Fahlenbrach 461
is not different from those made by other CEOs, Overall, it can therefore be con-cluded that the average value per acquisition is smaller for founder-CEO firms.
Taken together, the results of Table 11 demonstrate that founder-CEO firmsare active in the acquisition market, but that they buy targets that are operating intheir industry of knowledge and that are smaller in size.
V. Discussion of Empirical Results
,A, Discussioti of Founder-CEO Firms' Stock Returtis
At first glance, the strong stock market results of founder-CEO firms arepuzzling, Founder-CEO status is easily observable. If a founder-CEO consistentlymattered for the success of a firm, founder-CEO status should be fully incorpo-rated into share prices. But then, one would not expect any excess performance offounder-CEO firms, I now discuss several possible explanations of the observedexcess stock market performance.
In the stock return regressions, I do not instrument founder-CEO status. Yet,if high current valuations were to cause founders to stay put and if firms withhigh current valuations had different expected returns than firms with low currentvaluations, then founder-CEO firms may have different returns than other com-parable firms for reasons unrelated to the founder. In other words, founder-CEOstatus would not be entirely exogenous in the stock return regressions,'^ I findthat founder-CEO firms have a higher stock market performance than comparablefirms. This finding is inconsistent with the above explanation because the empir-ical literature has found that high valuation firms typically have lower expectedreturns (e,g,, because of t;he value premium or overvaluation). In addition, evi-dence in Table 5 indicates that the direction of causality runs from founder-CEOsto valuation.
My stock market return results are consistent with the idea that the marketfeared that founder-CEOs would expropriate outside shareholders, but overesti-mated the costs at the beginning of the sample period. However, such an expla-nation is inconsistent with the firm valuation results: Founder-CEO firms werepersistently valued higher than nonfounder-CEO firms.
The positive stock market returns could potentially be explained by the inar-ket's continuous surprise over a better-than-expected accounting performance byfounder-CEO firms, I examine two measures of accounting performance: returnon assets (ROA) and operating cash fiow (OCF), I follow Holthausen andLarcker (1996) in the definition of both variables, I use an industry and perfor-mance matched benchmark, as suggested by Barber and Lyon (1996), Holthausenand Larcker (1996), and Larcker (2003), to detect any abnormal performance.This test asks whether an outside observer would be able to detect a better per-formance of a founder-CEO firm in year t if he had matched a founder-CEO firmto a rionfounder-CEO firm with similar accounting performance in year í — LI do not find any evidence of an abnormal accounting performance, using the two
ttiank an anonymous referee for pointing this out to me.

462 Journal of Financial and Quantitative Analysis
measures described above. The market's surprise over good accounting perfor-mance is not a driving factor of the stock market performance results.'"*
An alternative explanation is ¡that founder-CEOs have a different attitude to-ward risk and tend to pursue active growth strategies. These strategies may haveworked well during my sample period of a particularly strong economic expan-sion, but they may hurt firms during other time periods. Investors may thereforedemand a risk premium for an investment in founder-CEO firms. When I includeproxies for the investment activities of founder-CEO firms in the Fama-MacBethregressions of Table 8, the excess performance is reduced by 5 bps but remainspositive and significant.
Overall, the stock market results appear robust to a variety o'f potential expla-nations. There is some evidence that the stock market results are correlated withthe investment decisions of founder-CEOs. It would be interesting to see whetherthe stock market results are a particularity of my sample period, in which theeconomy was mostly in an expansion, or whether they also hold for other periodsthat include recessions.
B. Discussion of Founder-CEO Firms' Investment Behavior
I find that founder-CEO firms invest more in CAPEX and R&D and makemore but smaller nondiversifying acquisitions. These results are consistent withthe results of other studies linking CEO characteristics to firm decision making(e.g., Bertrand and Schoar (2003J). One possible interpretation of the results ofTables 9 and 11 is that these higher expenditures and strategic acquisitions in thecore business lead to the increases in firm valuation reported in Table 5.
It is important to note, however, that more investments or acquisitions are notnecessarily value-increasing. Investments are an input in the production processand not an outcome variable. For example, large new investments in negative netpresent value (NPV) projects are value-destroying, Founder-CEOs may be moresusceptible to an overinvestment problem, perhaps because they meet less resis-tance to investing in poor projects or to undertaking negative NPV acquisitionsdue to their dominant position within the organization. An alternative link be-tween firm valuation and investments could therefore be that more investmentslead to a lower firm valuation and that the stronger valuation of founder-CEOfirms comes from those firms in which founders employ fewer resources moreefficiently.
To shed some light on the issue of whether founder-CEOs that invest moremake good or bad investment decisions, I look at the announcement retums tothe acquisitions made by founder-CEOs. In unreported regressions, I calculateretums to the announcements of' acquisitions by sample firms, separated byfounder-CEO status. The announcement return is measured as a cumulativemarket-model-adjusted abnormal stock return around initial acquisition announce-ments. I use five-day cumulative abnormal returns around the announcement date,and the CRSP value-weighted retum as market retum. The results are very simi-lar using equally-weighted market retums and a shorter [—1,1] or longer [—3,3]
'""A table containing the results is available from the author.

Fahlenbrach 463
event window. The market reaction to founder-CEO firms announcing acqui-sitions is positive; both the mean and median cumulative abnormal return ispositive and statistically significantly different from zero. When I estimate multi-variate regressions of announcement returns following the framework of Moelleret al, (2004) and Masulis et al, (2007), I find that the overall market reactionto founder-CEO-announced acquisitions is positive but insignificant. For a sub-group of acquisitions (cash-only), the market reaction is positive and statisticallysignificant,'^
Overall, I conclude that one part of the investment activity of founders, ac-quisition activity, does not appear to be value-destroying. This suggests that in-vestment decisions of founders could indeed have a positive association with thehigher valuation for founder firms. In future work, it would be interesting to es-tablish an even closer link between all investment decisions and valuation.
VI. Conclusion
Eleven percent of the largest public U,S, firms are led by founder-CEOs,I document that founder-CEO firms differ systematically from successor-CEOfirms, Founder-CEO firms not only have a higher firm valuation than nonfounder-CEO firms, but also a higher stock market performance. Furthermore, they under-,take more acquisitions in their core business and invest more in R&D and capitalexpenditures.
Villalonga and Amit (2006) demonstrated that the previously identifiedhigher valuation of family firms (e,g,, Anderson and Reeb (2003)) appears tobe mostly driven by family firms with founder involvement. Merely a large own-ership stake by descendants of a founding family does not appear to influencevaluation. The results of Adams, Almeida, and Ferreira (2009) and this paper con-firm this finding and establish that causality appears to run from founder-CEOs tohigher valuation. In addition, my results contribute to our understanding of whatmakes firms with founder-CEOs special. The investment behavior of founder-CEOs is consistent with the characteristics ascribed to founder-CEOs in the liter-ature and suggests that founder-CEOs have a large impact on the decisions takenby their organizations.
I provide some evidence that the larger investment expenditures of founder-CEO firms do not correspond to an overinvestment by founder-CEOs, but that theyare used to undertake positive NPV projects. Therefore, one possible explanationof the higher valuation of founder-CEO firms is that during the 1990s, founder-CEOs successfully embraced an expanded investment opportunity set.
An equal-weighted (value-weighted) investment strategy that invested infounder-CEO firms during 1993-2002 would have earned an abnormal return of8.3% (10.7%) annually in excess of what could have been achieved by a passiveinvestment in the four factors described in Fama and French (1993) and Carhart(1997), The excess return is persistent after the removal of technology firms andoccurs in both the earlier and later sample period. I study several explanations
'^The results of these regressions are available from the author.

464 Journal of Financial and Quantitative Analysis
of this surprising result but do not find evidence that could rationalize the excessstock market performance.
Is the excess stock market performance of founder-CEO firms a particu-larity of my sample period of overall exceptional stock market performance?To what extent is the excess performance related to the investment behavior offounder-CEOs, and does it differ in different economic scenarios? Answers tothese questions could shed further light on the surprising stock performance re-sults of founder-CEO firms.
References
Adams, R. B.; H. Almeida; and D. Ferreini. "Powerful CEOs and Their Impact on Corporate Perfor-mance." Review of Financial Studies, 1¿ (2005), 1403-1432.
Adams, R. B.; H. Almeida; and D. Ferreirai "Understanding the Relationship between Founder-CEOsand Firm Performance." Journal of Empirical Finance, 16 (2009), 136-150.
Amihud, Y., and B. Lev. "Risk Reduction as Managerial Motive for Conglomerate Mergers." BellJournal of Economics, 12 ( 1981 ), 605-617.
Anderson, R. C; S. A. Mansi; and D. M. Reeb. "Founding Family Ownership and the Agency Cost ofDebt." Journal of Financial Economics} 68 (2003), 263-285.
Anderson, R. C , and D. M. Reeb. "Founding-Family Ownership and Firm Performance: Evidencefrom the S&P 500." Journal of Finance] 58 (2003), 1301-1328.
Andrade, G., and E. Stafford. "Investigating the Economic Role of Mergers." Journal of Corporatefmonee, 10(2004), 1-36. |
Banz, R. W. "The Relation between Returri and Market Value of Common Stocks." Journal of Finan-cial Economics, 9 ( 1981 ), 3-18.
Barber, B. M., and J. D. Lyon. "Detecting Abnormal Operating Performance; The Empirical Powerand Specification of Test Statistics." Joi mal of Financial Economics, 41 (1996), 359-399.
Begley, T. M. "Using Founder Status, Age of the Firm, and Company Growth Rate as the Basis for Dis-tinguishing Entrepreneurs from Managers of Smaller Businesses." Journal of Business Venturing10(1995), 249-263. |
Begley, T. M., and D. P. Boyd. "Psychological Characteristics Associated with Performance in Entre-preneurial Firms and Smaller Businesses." Journal of Business Venturing, 2 (1987), 79-93.
Bertrand, M., and S. Mullainathan. "Enjoying the Quiet Life? Corporate Governance and ManagerialPreferences." Journal of Political Economy, 111 (2003) , 1043-1075.
Bertrand, M., and A. Schoar. "Managing] with Style: The Effect of Managers on Firm Policies."Quarterly Journal of Economics, 118 (2003), 1169-1208.
Brennan, M. J.; T. Chordia; and A. Subrahmanyam. "Alternative Factor Specifications, Security Char-acteristics, and the Cross-Section of Expected Stock Returns." Journal of Financial Economics,49(1998), 345-373.
Budner, S. "Intolerance of Ambiguity as a Personality Variable." Journal of Personality, 30 (1962),29-50. I
Burkhart, M.; F. Panunzi; and A. Shleifer. "Family Firmst Journal of Finance, 58 (2003), 2167-2201.Carhart, M. "On Persistence in Mutual Fund Performance." Journal of Finance, 52 (1997), 57-82.Chevalier, J., and G. Ellison. "Are Some Mutual Fund Managers Better Than Others? Cross-Sectional
Patterns in Behavior and Performance."|youma/ of Finance, 54 (1999), 875-899.Cremers, K. J. M., and V. B. Nair. "Governance Mechanisms and Equity Prices." Journal of Finance,
60 (2005), 2859-2894. |Daily, C. M., and D. R. Dalton. "Financial Performance of Founder-Managed Versus Professionally
Managed Small Corporations." Journal\of Small Business Management, 30 (1992), 25-34.Daines, R. "Does Delaware Law Improve Firm Value?" Journal of Financial Economics, 62 (2001),
525-558. IEvans, D. S., and L. S. Leighton. "Some Empirical Aspects of Entrepreneurship." American Economic
«eview, 79(1989), 519-535.Fama, E. F., and K. R. French. "The Cross Section of Expected Stock Returns." Journal of Finance,
47(1992), 427^66. |Fama, E. F., and K. R. French. "Common Risk Factors in the Returns on Stocks and Bonds." Journal
of Financial Economics, 33 (1993), 3-56.Fama, E. F., and K. R. French. "Industry Costs of Equity." Journal of Financial Economics, 43 ( 1997),
153-194.

Fahlenbrach 465
Fama, E, E, and M, C, Jensen, "Separation of Ownership and Control," Journal of Law and Eco-nomics, 26 (1983), 301-326,
Fama, E, F,, and J, D, MacBeth, "Risk, Return, and Equilibrium: Empirical Tests," Journal of PoliticalEconomy, 81(1973), 607-636,
Gompers, P, A,; J, L, Ishii; and A, Metrick, "Corporate Governance and Equity Prices," QuarterlyJoumal of Economics, 118(2003), 107-155,
Gompers, P A,, and A, Metrick, "Institutional Investors and Equity Prices," Quarterly Journal ofEconomics, 114 (2001), 229-259,
Heckman, J, J, "Dummy Endogenous Variables in a Simultaneous Equations System " Econometrica46(1978), 931-959,
Holthausen, R, W,, and D, F, Larcker, "The Financial Performance of Reverse Leveraged Buyouts,"Journal of Financial Economics, 42 (1996), 293-332,
Jayaraman, N,; A, Khorana; E, Nelling; and J, Covin, "CEO Founder Status and Firm FinancialPerformance," Strategic Management Journal, 21 (2000), 1215-1224,
Jegadeesh, N,, and S, Titman, "Returns to Buying Winners and Selling Losers: Implications for StockMarket Efficiency," Journal of Finance, 48 (1993), 65-91,
Jensen, M, C, "The Modem Industrial Revolution, Exit, and the Failure of Internal Control Systems "Journal of Finance, 48 (1993), 831-880,
Kahle, K, M,, and R, A, Walkling, "The Impact of Industry Classifications on Financial Research,"Journal of Financial and Quantitative Analysis, 31 (1996), 309-335,
Kihistrom, R, E,, and J, Laffont, "A General Equilibrium Entrepreneurial Theory of Firm FormationBased on Risk Aversion," Journal of Political Economy, 87 ( 1979), 719-748,
Larcker, D, F, "Discussion of 'Are Executive Stocks Options Associated with Future Earnings?'"Journal of Accounting and Economics, 36 (2003), 91-103,
Low, M, B,, and I, C, MacMillan, "Entrepreneurship: Past Research and Future Challenges " Journalof Management, \4 i\988), 139-161,
Malmendier, U„ and G, Täte, "CEO Overconfidence and Corporate Investment," Journal of Finance60(2005), 2661-2700,
Masulis, R, W,; C, Wang; and F Xie, "Corporate Governance and Acquirer Returns," Journal ofFwönce, 62(2007), 1851-1889, . '
May, D, O, "Do Managerial Motives Influence Firm Risk Reduction Strategies?" Journal of Finance50(1995), 1291-1308,
McClelland, D, C, "N Achievement and Entrepreneurship: A Longitudinal Study," Journal of Person-ality and Social Psychology, I (1965), 389-392,
Moeller, S, B,; F P Schlingemann; and R, M, Stulz, "Firm Size and the Gains from Acquisitions,"Journal of Financial Economics, 73 (2004), 201-228,
Morck, R, K,; A, Shleifer; and R, W, Vishny, "Management Ownership and Market Valuation: AnEmpirical Ana\ysis" Journal of Financial Economics, 20(1988), 293-315,
Morck, R, K,, and F Yang, "The Mysterious Growing Value of the S&P 500 Membership," WorkingPaper, University of Alberta (2002),
Palia, D„ and S, A, Ravid, "The Role of Founders in Large Companies: Entrenchment or ValuableHuman Capital?" Working Paper, Rutgers University (2003),
Petersen, M, A, "Estimating Standard Errors in Finance Panel Data Sets: Comparing Approaches,"Review of Financial Studies, 22 (2009), 435-480,
Reuber, A, R,, and E, Fischer, "Understanding the Consequences of Founders' Experience," Joumalof Small Business Management, 37 ( 1999), 30-45,
Rogers, W, "sgl7: Regression Standard Errors in Clustered Samples," STATA Technical Bulletin13 (1993), 19-23,
Rosenbaum, V, Corporate Takeover Defenses. Washington, DC: Investor Responsibility ResearchCenter Inc, (1990, 1993, 1995, 1998, 2000),
Sarasvathy, D, K,; H, A, Simon; and L, Lave, "Perceiving and Managing Business Risks: Differencesbetween Entrepreneurs and Bankers," Journal of Economic Behavior and Organization, 33 ( 1998),
Shane, S,, and S, Venkataraman, "The Promise of Entrepreneurship as a Field of Research," Academyof Management Review, 25 (2000), 217-226,
Shin, H,, and R, M, Stulz, "Firm Value, Risk, and Growth Opportunities," NBER Working Paper No7808(2000), ^ V •
Shleifer, A,, and R, W, Vishny, "A' Survey of Corporate Governance," Journal of Finance 52 (1997)737-783, J ' \ J,
Stein, J, C, "Efficient Capital Markets, Inefficient Firms: A Model of Myopic Corporate Behavior"Quarterly! Joumal of Economics, 104 (1989), 655-669,

466 Journal of Financial and Quantitative Analysis
Terza, J. V, "Estimating Count Data Models with Endogenous Switching: Sample Selection and En-dogenous Treatment Effects," Journal of Econometrics, 84 (1998), 129-154.
Villalonga, B,, and R, Amit, "How Do Family Ownership, Control, and Management Affect FirmValue?" Journal of Financial Economics, 80 (2006), 385-417,
Willard, G, E,; D, A, Krueger; and H. R, Feeser, "In Order to Grow, Must the Founder Go: A Com-parison of Performance between Founder and Non-Founder Managed High-Growth ManufacturingFirms," Journal of Business Venturing, 7 (1992), 181-194,