Foundation of the New Botlek Lifting Bridge in the Netherlands · geotechnical laboratory tests by...
12
Foundation of the New Botlek Lifting Bridge in the Netherlands Dipl.-Ing. Andreas WIESINGER VCE Vienna Consulting Engineers ZT GmbH, Wien Ir. J.A. (Abjan) JACOBSE GEO2 Engineering B.V., on behalf of A-Lanes A15 / Ballast Nedam Engineering, Netherlands Dipl.-Ing. Dr.techn. Fritz KOPF VCE Vienna Consulting Engineers ZT GmbH, Wien ABSTRACT The new Botlek twin lifting bridge is one of the largest lifting bridges in the world and is currently under construction as part of the new extended Motorway A15 from Vaanplein to Maasvlakte in the harbour of Rotterdam and part of the respective DBFM project. The bridge crosses the river Oude Maas and will replace the existing adjacent Botlek Bridge. This article focuses on the geotechnical and structural design of the massive pier foundations, the soil-structure interaction and the handling of the interface between geotechnical and structural design. Since the lifting mechanism of the bridge only allows for limited movements of the piers (especially rotations) it was of great importance to find a solution for the foundation which is able to limit the deformations of the piers to the required minimum. From the economic point of view a simple solution with a short construction time had to be developed. Finally, the design process led to a shallow foundation which rests on sand layers of medium density. At a depth of approximately 16 m below the foundation there is a relatively soft clay layer with varying thickness. The sensitivity of the structure against deformations required extensive settlement calculations in order to accurately predict the settlements. Deterministic 3D FEM calculations were performed for the soil deformation analysis. In order to take the effect of soil heterogeneity on the deformation behaviour of the bridge piers into account, a probabilistic model was developed. An extensive soil investigation was performed for the determination of the soil parameters. Furthermore a sophisticated settlement monitoring system was installed during construction of the heavy bridge foundation to monitor settlements and to compare and calibrate the theoretical geotechnical modelling. 1. INTRODUCTION The new bridge consists of two independently lifting steel decks, each with a span of approximately 92 m, a width of approximately 50 m and a lifting weight of about 5,000 tonnes. The vertical clearance of the bridge over the water level is 14.60 m under traffic and 45.60 m in lifted position (see Fig. 1 and 2).
Transcript of Foundation of the New Botlek Lifting Bridge in the Netherlands · geotechnical laboratory tests by...

Foundation of the New Botlek Lifting Bridge in the Netherlands
Dipl.-Ing. Andreas WIESINGER VCE Vienna Consulting Engineers ZT GmbH, Wien
Ir. J.A. (Abjan) JACOBSE GEO2 Engineering B.V., on behalf of A-Lanes A15 / Ballast Nedam Engineering, Netherlands
Dipl.-Ing. Dr.techn. Fritz KOPF VCE Vienna Consulting Engineers ZT GmbH, Wien
ABSTRACT
The new Botlek twin lifting bridge is one of the largest lifting bridges in the world and is currently under construction as part of the new extended Motorway A15 from Vaanplein to Maasvlakte in the harbour of Rotterdam and part of the respective DBFM project. The bridge crosses the river Oude Maas and will replace the existing adjacent Botlek Bridge. This article focuses on the geotechnical and structural design of the massive pier foundations, the soil-structure interaction and the handling of the interface between geotechnical and structural design. Since the lifting mechanism of the bridge only allows for limited movements of the piers (especially rotations) it was of great importance to find a solution for the foundation which is able to limit the deformations of the piers to the required minimum. From the economic point of view a simple solution with a short construction time had to be developed. Finally, the design process led to a shallow foundation which rests on sand layers of medium density. At a depth of approximately 16 m below the foundation there is a relatively soft clay layer with varying thickness. The sensitivity of the structure against deformations required extensive settlement calculations in order to accurately predict the settlements. Deterministic 3D FEM calculations were performed for the soil deformation analysis. In order to take the effect of soil heterogeneity on the deformation behaviour of the bridge piers into account, a probabilistic model was developed. An extensive soil investigation was performed for the determination of the soil parameters. Furthermore a sophisticated settlement monitoring system was installed during construction of the heavy bridge foundation to monitor settlements and to compare and calibrate the theoretical geotechnical modelling.
1. INTRODUCTION
The new bridge consists of two independently lifting steel decks, each with a span of approximately 92 m, a width of approximately 50 m and a lifting weight of about 5,000 tonnes. The vertical clearance of the bridge over the water level is 14.60 m under traffic and 45.60 m in lifted position (see Fig. 1 and 2).

Fig. 1 New Botlek Bridge, open position – image Quist Wintermans Architekten
Fig. 2 New Botlek Bridge, closed position – image Quist Wintermans Architekten
The bridge superstructure consists of three steel trusses with transverse beams and an orthotropic deck. The two steel structures rest on three massive concrete piers, which have a total height of 85.65 m including the lifting towers. In addition to the steel decks three approach bridge structures rest on the two outside piers. The piers consist of the following elements:
the 17 m high and approx. 60 m long foundation between -20.00 and -3.00 NAP (Normaal Amsterdams Peil), executed as light reinforced underwater concrete,
the “pier cap” between -3.00 and +10.50 NAP, executed as massive reinforced concrete part,
the two lifting towers between +10.50 and +65.65 NAP, executed in reinforced concrete and
the so-called “hollow box”, a connecting room between the two lifting towers where predominantly technical equipment of the bridge is accommodated, executed as reinforced concrete frame.
The individual components of the structure are illustrated in Fig. 3.
Fig. 3 Major bridge system elements

For the lifting of the bridge 4 x 16 pieces of lifting cables with a diameter of 90 mm each are required per structure. They run from the ends of the end-crossbeams on the side of the steel deck over cable sheaves (diameter 3.6 m) at the tower heads and are connected with the counterweights on the other side. The counterweights are approx. 46 m long prestressed beams made of heavyweight concrete. During the integral design process a fully balanced lifting system was developed. The lifting weight of 5,000 tonnes per span is equal to the counterweight to optimise the structural elements, the mechanical and electrical equipment, the energy consumption for operation and the maintenance activities. A lifting time of max 90 seconds has to be considered for the 31 m lifting height.
2. INTERFACE GEOTECHNICAL DESIGN/STRUCTURAL DESIGN
2.1. General Information
The competences between the geotechnical designer and the structural designer were distributed in the calculation of the bridge piers as follows:
Competence of the geotechnical designer (A-Lanes A15):
Execution of all relevant geotechnical analyses
Definition of the geotechnical boundary conditions for the different calculations in structural design input for structural design
Competence of the structural designer (VCE):
Calculation of the loads on the level of the foundation contact area for all relevant load combinations as basis for the geotechnical analyses input for geotechnical calculations
Execution of all relevant analyses for the whole pier
The definition of the boundary conditions was an essential component in the calculation of the bridge piers. The structural designer was provided with several geotechnical conditions by the geotechnical designer for the calculation of the stresses and deformations in the individual elements of the piers.
2.2. Soil Springs for the Calculation of the Stresses in the Foundation (Underwater
Concrete)
The soil springs were determined according to NEN 6744 by the geotechnical engineer. The foundation contact area was subdivided into 9 rectangular areas with different stiffnesses (Fig. 4). The stiffnesses of the individual zones were additionally increased or reduced by different factors in order to consider the inhomogeneity of the subsoil and therefore determine the most unfavourable stresses in the underwater concrete block. The stresses in the underwater concrete were calculated with a three-dimensional FE-model by using volume elements - see Fig. 5.

Fig. 4 Vertical bedding springs in the foundation contact area (example)
Fig. 5 Model on the calculation of stresses in underwater concrete
2.3. Soil Springs for the Calculation of the Lifting Towers and the Deformation
Calculations
As the local stresses in the foundation are not relevant for the design of the lifting towers and the determination of the tower deformations, the calculation was not carried out at the total system of the pier including foundation. The massive foundation (pier cap and underwater concrete) was instead replaced with a rigid coupling between tower base and the centre of the foundation contact area – see Fig. 6. Thus the area bedding had to be replaced with an individual spring in the centre of the foundation contact area. The rotational stiffness of this spring has great importance for the tower calculation and a realistic determination of the horizontal deformations, which ensue from a pier rotation. The torsion spring stiffness for the individual spring could be calculated and implemented into the tower model by applying a unit moment at the three-dimensional geotechnical model and determining the resulting rotation. Rotation stiffness also depends on the origin of the load creating the rotation. Consequently the ground reacts with greater stiffness if a temporarily acting variable load is applied (e.g. constant wind load, braking load from traffic) than if there is a static load. The ground reacts even more stiffly in case of dynamic impacts (e.g. gusts of wind). As it is not possible to use different spring stiffnesses for different load cases in one and the same calculation model, this fact was considered in the calculation by calculating with the torsion spring for static loads and by reducing the loads from variable impacts with a corresponding factor.

Fig. 6 Calculation model tower 30 Fig. 7 Reinforcement in the underwater concrete
3. DESIGN OF THE FOUNDATION
The foundation is a shallow foundation made of underwater concrete (UWC). The foundation rests on sand layers of medium density. The underwater concrete is a lightly reinforced massive concrete structure. Reinforcement is only applied in the upper outer part of the UWC to control the crack development of the young concrete and at the bottom and the widening sections of the footing (see Fig. 7). Several different bedding patterns and bedding values were considered in the FEM Model of the UWC, see chapter 2 and [VCE ZT GmbH, 2012]. The compressive stress level in the UWC is very low and amounts to about 10 % of the concrete design strength only (C20/25 XA1). The environmental impact conditions (e.g. temperature) for the UWC are highly constant compared to the reinforced pier cap above the water table.
4. GEOTECHNICAL CALCULATIONS
4.1. General Information
During the design process it was recognised that deformations of the foundation have a large influence on the design and construction of the superstructure, especially for the mechanical and structural design. Due to the large ratio between the height of the pylons and the width of the foundation, a small rotation of the foundation base results in a large deflection of the pylon heads. This effect has a significant influence on the design of the superstructure. In order to determine safe tolerances, which have to be taken into account by the other design disciplines, a thorough deformation analysis was performed. The first step in the deformation analysis was to perform ‘best estimate’ deformation calculations. In the early design stages analytical 2D settlement calculations were performed.

In the detailed design phase additional 3D FEM calculations were realised. The software program Plaxis was used for these calculations. The results of the deterministic deformation analysis were used to calculate best estimate values including:
Settlements and residual settlements of the piers for every stage and different components
Rotations and residual rotations of the piers for every stage and different components
Modules of subgrade reaction for the design of the underwater concrete
Rotational subsoil stiffness of the piers due to quasi-static wind loads
In general, soil deformations are difficult to be accurately predicted, since various uncertainties can prevail. See for instance Fig. 8 where the thickness of the deep (Kedichem) clay layer is plotted over the footprint of the main bridge piers. The variation is based on factual data from CPTs and boreholes with interpolation between these data.
Fig. 8 Thickness of Kedichem clay layer [m]
To get a better understanding with regard to subsoil uncertainties, a sensitivity analysis with the 3D FEM model was performed. The influence of variations in the OCR (overconsolidation ratio), (virgin) stiffness and the thickness of the deep Kedichem clay layer between the soil investigation points were considered. The sensitivity analysis with the 3D FEM results in a better understanding of the range of settlements which could be expected. However, the variation of soil properties within one homogeneous soil layer is hardly taken into account in standard 3D FEM calculations. Since this effect can have a large influence on the rotations of the foundation and control measures are very limited, a practical stochastic subsoil model was set up to take this effect into account. The results of this model were used to calculate safe design values for settlements and rotations.
4.2. Soil Investigation and Parameter Determination
An extensive soil investigation was performed for the determination of the soil parameters. A relatively dense grid of Cone Penetration Tests (CPTs) with a mutual distance of about 15 m was executed up to a depth of about 3 times the foundation width. In addition, a number of boreholes were drilled and undisturbed samples were taken at regular intervals for geotechnical laboratory tests by means of light percussion drilling in combination with thin-

walled samples. The soil stratigraphy is determined from the CPTs and borehole logs, see Tab. 1.
Tab 1. General soil stratigraphy
Top of layer [m NAP]
Soil description Soil layer
-7 to -14 SAND, clayey cover layer
-14 to -20 SAND, (medium) dense 1st sand layer
-33 to -39 CLAY, stiff deep clay layer
-34 to -42 SAND, (medium) dense 2nd sand layer
-60 Max. investigation depth
The thickness of the deep clay layer varies strongly. At some locations the thickness is about 4 m, whereas this layer was not encountered at other locations.
4.3. Deterministic Deformation Analysis
In the deterministic Plaxis calculations the Hardening Soil (HS) model is used for the deep clay layer. Aspects of this model include:
Stress dependent stiffness of the soil
Plastic straining due to primary deviatoric loading
Plastic straining due to primary compression
Elastic unloading/reloading
Failure according to the MC criterion
The Hardening Soil model does not take creep effects into account. However, from the laboratory tests it turned out that about 80 % of the settlements are primary and only 20 % of the settlements are related to secondary compression. Therefore the choice was made to consider the creep effect separately, instead of applying a soft soil creep model. Soft soil creep models are especially useful if the influence of creep is more pronounced. The Hardening Soil Small-Strain Stiffness (HSSmall) model is used for the sand layers underneath the foundation surface. This model is similar to the HS model, but additionally takes the higher stiffness of the soil at small strain levels into account. The Hardening Soil (HS) model is also used for the clayey sand layer above the foundation layer. The serviceability limit state (SLS) foundation pressures for the different main piers are in the range between 500 to 700 kPa. The calculated ‘best estimate’ final settlements of the foundation footings range from 0.10 to 0.25 m. Maximum values in the order of 1/1000 were calculated for the rotations. These calculated rotations are mainly the result of the bending moment loads, rather than of soil heterogeneity. From the sensitivity analysis it was concluded that the variation in calculated average settlement was about 25 % for the different subsoil scenarios. The variation in the calculated rotations was small. The calculated absolute rotations of the piers were still in the range of 1/1000.
4.4. Probabilistic Deformation Analysis
As mentioned above, since this effect can have a large influence on the rotations of the foundation, a practical stochastic subsoil model was set up to take this effect into account.

With this probabilistic model it was possible to determine the probability of exceedance of a certain design rotation and to perform a quantitative risk analysis, regarding the effects of foundation rotations. The model is schematically presented in Fig. 9.
Fig. 9 Description of the probabilistic model
A lognormal distribution was used for the PDF (probability density function) of the settlements. The standard deviation was determined on the assumption of 30 % inaccuracy of the settlement calculations. That means that there is a probability of about 5 % that the settlements will be 30 % larger than the calculated average settlements. This is a generally applied rule of thumb in the Netherlands and corresponds to a coefficient of variation of about 0.18. The expected values of the settlements were determined with an advanced 3D FEM model. The values of the soil springs are spatially correlated. This effect was captured by the use of an exponential spatial correlation function [3]:
/ (Eq. 1)
In which: ρ = correlation coefficient between the stiffness of two springs [-] d = distance between two springs [m] Lc = horizontal correlation length [m] Since not enough data was available to determine the correlation length, a conservative estimate was made based on values known from literature. The correlation length generally ranges between 20 and 100 m [Jacobse, Nehal, Rijneveld & Bouwmeester, 2013]. Due to the relatively heterogenic subsoil a value of 20 m was used. This also turned out to be a governing value for the calculated rotation.
Step 4: Create n correlated realisations of a set of spring values
Step 5: Determine the rotation of the foundation block for every set of spring values
Step 6: Estimate the probability of exceedance of a certain rotation
Monte Carlo simulation
Step 1: Create a model for the soil-structure interaction. In this case: infinitely stiff foundation block, supported by linear elastic (stochastic) springs
Soil-structure interaction model
Step 2: Determine expected values of the settlements under the foundation surface with an advanced 3D FEM model
Step 3: Determine the parameters for the PDF of the settlements and corresponding spring values for the soil-structure model
Geotechnical input
4.4.1. Monte Carlo Simulation
1E6 simulations were performed for the Monte Carlo simulation. In this way probabilities as small as 1E-3 could be calculated with a relative error of about 5 %, which was acceptable for this study. A set of spring values was generated for every simulation. With the soil-structure interaction model the equilibrium rotation and (average) settlement was calculated for every set of springs. The probability of exceedance for a certain rotation can be estimated by:
/ (Eq. 2)
In which: P(θ>θr) = exceedance probability of rotation θ [-] nf = number of simulations for which the calculated rotation is larger than the
reference rotation [-] n = total number of simulations [-]
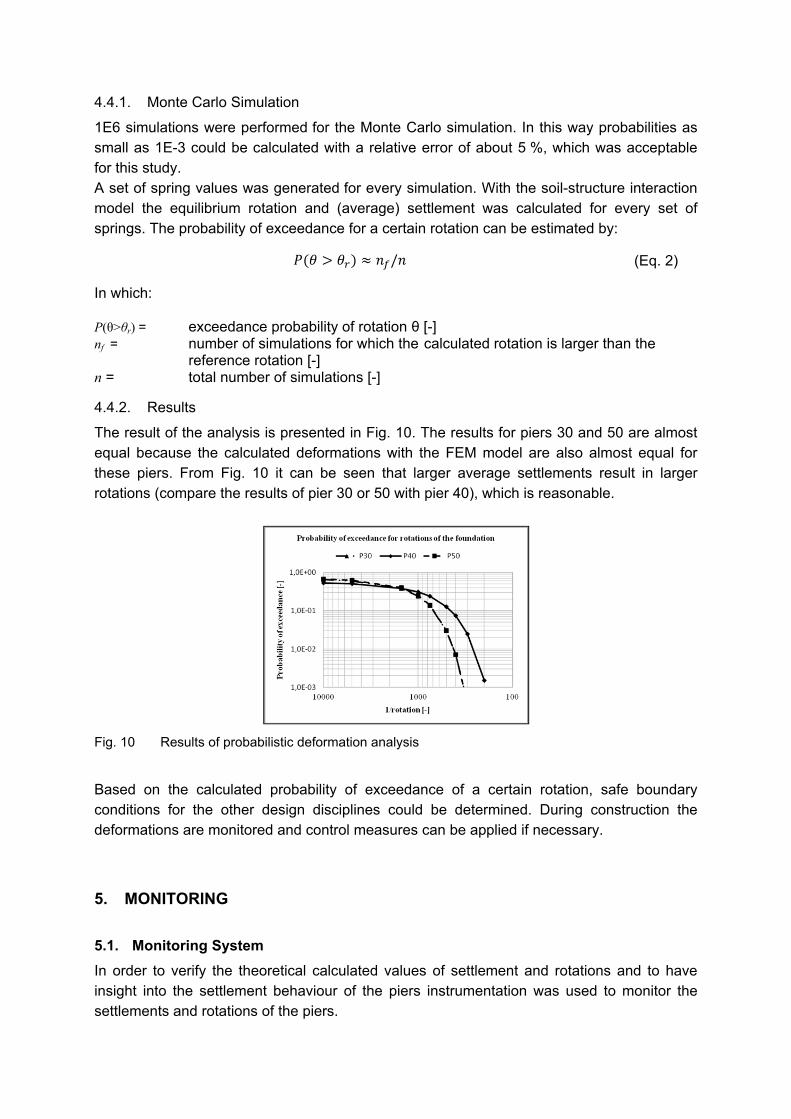
4.4.2. Results
The result of the analysis is presented in Fig. 10. The results for piers 30 and 50 are almost equal because the calculated deformations with the FEM model are also almost equal for these piers. From Fig. 10 it can be seen that larger average settlements result in larger rotations (compare the results of pier 30 or 50 with pier 40), which is reasonable.
Fig. 10 Results of probabilistic deformation analysis
Based on the calculated probability of exceedance of a certain rotation, safe boundary conditions for the other design disciplines could be determined. During construction the deformations are monitored and control measures can be applied if necessary.
5. MONITORING
5.1. Monitoring System
In order to verify the theoretical calculated values of settlement and rotations and to have insight into the settlement behaviour of the piers instrumentation was used to monitor the settlements and rotations of the piers.

The instrumentation consists of different types of monitoring systems. The following types are used to monitor the deformations of the Botlek Bridge:
Deformation monitoring with a total station system Prisms are installed on different construction objects to monitor the horizontal and vertical deformations of the new piers. Since the piers are developed from an excavation inside a building pit to a tower of 80 m height it was not possible to monitor the same points for the total construction. Initially about 20 points were installed on the sheet piles of the building pit, and before the sheet piles became invisible, the points were taken over by prims on the concrete parts at a higher level with an overlap in time. The total deformation of the pier from the start of pouring the underwater concrete is determined by summing up the contributions of the different prisms. The prisms where monitored by two (coupled) total stations located onshore at a distance of about 100 m.
Rotation measurement In order to have a good insight into the rotations, additionally rotation measuring tools are installed at a level of NAP+5 m. For each pier three precision inclination sensors are installed with an accuracy of approx. 0.005 mrad (1/12000).
Extensometers At the north-east, north-west, south-east and south-west side of the building pit extensometers (4 in total per pier) are installed. These are located in the subsoil below the foundation level and measure the relative deformation between different depths below the foundation level. Anchors are placed in four depths. As only the relative deformations are measured, a fixed point should be assumed. In this case the lowest measuring point (at NAP -45 m) is used as a fixed point. The extensometers were placed to have a better understanding what the contribution of different layers is on the total settlement of the piers. And in case of deviations of the settlement values the theoretical model can be updated with back calculated settlement parameters.
5.2. Monitoring results
In this section the results of the monitoring of the vertical deformations (status June 2014) are described and compared to the calculated settlements. As described, a complicating factor for the interpretation of the monitoring results is the fact that no continuous measurement of the x-y-z measurements is available. The total settlement is therefore calculated by the sum of the governing settlements for the different systems. For each pier the measured and expected settlements are plotted as function of the average applied loads at foundation level. The applied loads are derived from the measured volumes of cast concrete. Due to the different measurements a possible upper and lower bound value is derived for the measured settlements. Based on the measured values a prediction is given for the residual settlement, an average value, as well as upper and lower bound values. The theoretical calculated values of the DE design are also shown. In Fig. 11 the measured and expected settlements of pier 30 are plotted. The current settlement is about 60 to 70 mm. In Fig. 12 the measured and expected settlements of pier 40 are plotted. The current settlement is about 45 to 55 mm. In Fig. 13 the measured and expected settlements of pier 50 are plotted. The current settlement is about 45 to 55 mm.

Fig. 11 Measured and prognosticated settlements of pier 30
Fig. 12 Measured and prognosticated settlements of pier 40
Fig. 13 Measured and prognosticated settlements of pier 50

Based on the monitoring data the expected residual settlements are within the boundaries calculated in the detail engineering design (DE design). For pier 30 the measured settlements are about 75 % of the calculated values in DE design. For piers 40 and 50 the measured settlements are much smaller compared to the calculated values in DE design, that is about 30-40 % of the calculated values in DE design.
The calculated best estimate rotations in DE design were negligible. However, it was recognised that rotation might occur and upper bounds for the rotation were determined. The rotations determined from the deformation measurements are smaller compared to the rotation measurements. However, even if the measurement of the rotational instrumentation is considered, the expected residual rotations are within the boundaries calculated in the DE design.
6. SUMMARY/CONCLUSIONS
The foundation design of one of the largest vertical lifting bridges in the world required a close cooperation between all design disciplines involved. Due to the limited deformation capacity of the lifting mechanism (in particular in longitudinal bridge direction) a realistic prediction of the pier deformation was of utmost importance. Due to the limited control measures for exceedance of deformations, safe design values are determined for the possible deformations, based on a simplified stochastic subsoil model. The geotechnical and structural calculations were performed with different software tools. Therefore it was important to define a clear interface between these models. To connect the two advanced models, a simple concept of linear elastic soil springs was used. As the behaviour of the soil depends on the size of the load, the depth influence, the direction of the load (only vertical / bending moment) and the type of the load (dynamic / (quasi-)static) different sets of springs were used to get a realistic response in the structural model. The calculation results show that the local tower deformations (bending) due to bridge loads and climatic impacts are minor compared to the horizontal deformations caused by a global rotation of the piers due to settlements. The deformation calculations are verified by a deformation monitoring system on site. In general the measured deformations are smaller than the calculated deformations, vertical settlements as well as pier rotations (status June 2014).
LITERATURE
VCE ZT GmbH. (2012): Structural Analysis, Substructure pier 30, -20.00 / -1.00 NAP, A-Lanes_A15_DE_3631_2100_DREP_0001_05 A-LANES A15 (2012): Internal Memo; Vertical, rotational, short-term and dynamic soil
stiffness main piers Botlek lifting bridge, A-Lanes_A15_OCOR_10594_02 Jacobse J.A, R.S. Nehal, B. Rijneveld & D. Bouwmeester (2013): Probabilistic Settlement
Analysis for the Botlek Lifting Bridge Design. Proceedings of the 18th International Conference on Soil Mechanics and Geotechnical Engineering, Paris
Brinkgreve R.B.J., Engin E. and Swolfs W.M. (2011): Plaxis 3D 2011, Manual, Plaxis BV, Delft.
NEN-EN 1997-1:2005: Eurocode 7: Geotechnisch ontwerp Deel 1: Algemene regels, Nederlands Normalisatie-instituut, Delft.