
Foundation GPC Part 3 – Gel Permeation Chromatography Instrumentation.
71
Foundation GPC Part 3 – Gel Permeation Chromatography Instrumentation
-
Upload
shauna-hunt -
Category
Documents
-
view
237 -
download
2
Transcript of Foundation GPC Part 3 – Gel Permeation Chromatography Instrumentation.

Foundation GPC Part 3 – Gel Permeation Chromatography
Instrumentation

2
Introduction
This presentation introduces the equipment used in gel permeation chromatography (GPC)
The role of each device shall be discussed, including troubleshooting information
The idea of integrated GPC systems shall be presented

3
Pump: delivers flow down the column
Injection valve: Allows us to inject our samples
GPC column set: Performs the separation
Detector: detects the material leaving the columns
Optional extras: autosamplers, degassers, etc.
Components of a GPC System

4
Pump
Required to maintain a constant, steady liquid flow through the columns
Isocratic pump (single channel)
Pulseless or low pulse flow required to ensure good detector baselines
Typically a reciprocating dual piston pump
Fairly inexpensive, reliable and suitable for use in a number of solvents
Service typically includes replacement of worn check valves and piston seals

5
Flow rate strongly affects resolution
Every column has an optimum flow rate, as in all LC systems
However in GPC the mass transfer effect is much more prominent
Effect of Flow Rate on Resolution

6
A measure of the efficiency of a chromatographic system is the plate count
Column is divided into a number of theoretical plates
Plates are defined as the smallest cross-sectional slice in which the mobile and stationary phases are in equilibrium
The smaller the width (known as height) of the plate, the quicker the system comes to equilibrium and the greater the efficiency
Plate counts controlled by the Van Deemter relationship
Flow Rate and Efficiency

7
Eluent : THF
Columns : PLgel 100Å
Test probe : ODCB
Optimum flow rate for small molecule separations is around 1.0ml/min

8
Eluent : THF
Column : PLgel 10um MIXED-B
For high MW samples, high flow rate should be avoided, reduced flow rate may be required to improve resolution
9
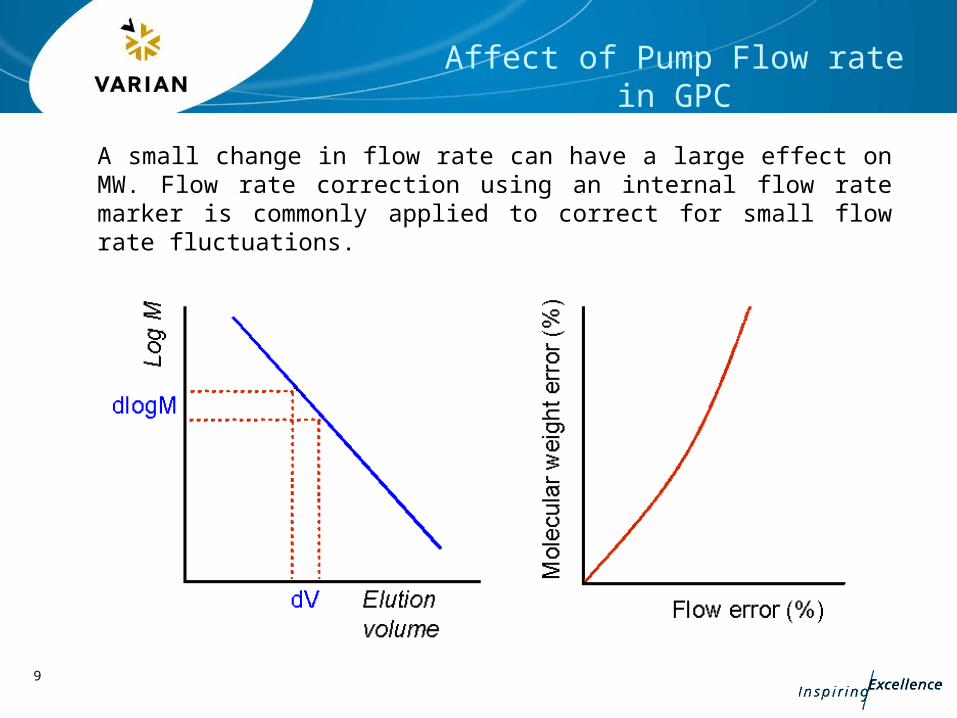
Affect of Pump Flow rate in GPC
A small change in flow rate can have a large effect on MW. Flow rate correction using an internal flow rate marker is commonly applied to correct for small flow rate fluctuations.
10
Increasing retention times - Lab temperature changes may result in retention time changes
Overcome by thermostatting the columns
Insufficient equilibration time for the column may give unstable retention behavior
Allow at least 2 GPC column volumes through the column(s)
Decreasing retention times - Usually a result of the flow rate speeding up
Check the pump and reset the flow if necessary
Pump Issues - Variable Retention Time

11
Usually a result of the flow rate slowing down
Check for the presence of bubbles in pump head
Retention beyond total permeation volume will be observed if there are specific interactions between the sample and the with stationary phase
Interactions can be Inhibited by adding modifiers to mobile phase
Adsorption of sample can occur if you are using a poor solvent, for instance analysing polystyrenes in DMF
Change eluent so that samples, standards and solvent are of similar polarity
Increasing Retention Times

12
Pressure increasing – Can be caused by build-up of particulates in the sample
can be avoided by filtering the samples and mobile phase
With certain solvents, solvent freezing in GPC tubing can cause pressure problems
For these solvents e.g. TCB elevate the temperature of the system
Pressure falling - Can be caused by pump cavitation
Make sure you thoroughly degas solvents
If the pressure is low it could be due to insufficient flow to column
Clear any blocked solvent lines Loosen cap of eluent reservoir to prevent pressure problems
Pump Pressure Variations

13
A high pressure will result if the flow rate is too high
Check pump flow rate independently by measuring with flow with stopwatch
High pressure will also result if the column has a blockage
Filter samples to avoid this problem Use a guard column to improve the column lifetime
High pressure may be due to a blocked inlet frit on the column
Reverse flow through column to clear any blockage Replace frit to repair the column
High Pressure

14
Fluctuation will be caused by a leaking check-valve or pump seal
Replace or clean the check-valve
A bubble in pump head will also cause fluctuations
Remove the bubble by purging the pump head Degas solvents thoroughly to avoid bubble build-up
Insufficient liquid flow to pump will cause pressure problems
Mobile phase inlet may be blocked - remove and clean it! Elevate reservoir above pump head to help siphoning
Pressure Fluctuation
15
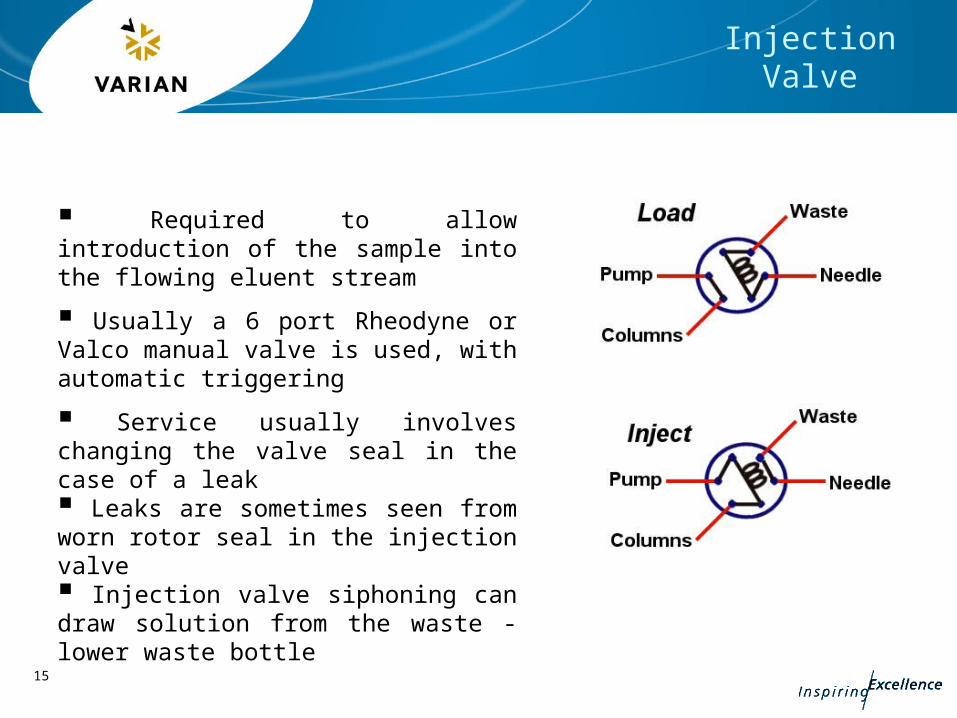
Injection Valve
Required to allow introduction of the sample into the flowing eluent stream
Usually a 6 port Rheodyne or Valco manual valve is used, with automatic triggering
Service usually involves changing the valve seal in the case of a leak Leaks are sometimes seen from worn rotor seal in the injection valve Injection valve siphoning can draw solution from the waste - lower waste bottle

16
Injection Volume
GPC columns have a relatively large volume (typically 300x7.5mm)
Injection volumes for GPC can therefore be higher than for HPLC
As a rule of thumb, 50ul per 300x7.5mm column length will have little effect on band broadening
Minimise injection volume for high efficiency separations (e.g. 3um columns) to avoid band broadening which will decrease resolution

17
Effect of Concentration on Peak Shape and Resolution
Column : PLgel 10um MIXED-B
300x7.5mm
Eluent : THF
Flow rate : 1.0ml/min
Detector : UV
Polystyrene standards
1. 8,500,000 4. 34,500
2. 1,130,000 5. 5,100
3. 170,000 6. 580
0.05% 0.10%
0.15% 0.20%

18
Effect of Injector Loop Size on Resolution
Column : PLgel 3µm MIXED-E
300x7.5mm
Eluent : THF
Flow rate : 1.0 ml/min
Sample : Epikote 1001
epoxy resin
20µl loop
200µl loop
Injection loop is a major contribution to system dead volume, use reduced injection volume and increase concentration to maintain sensitivity

19
Columns
The columns perform the separation
The choice and care of columns is critical to good chromatography
Columns will be the focus of the next presentation

20
Smaller particle size leads to greater efficiency and resolution
Smaller particle size also leads to shear degradation
Therefore only use 3um particle sizes for very low molecular weight separations
High molecular weight separations require large particle sizes
Effect of Particle Size on Resolution
21
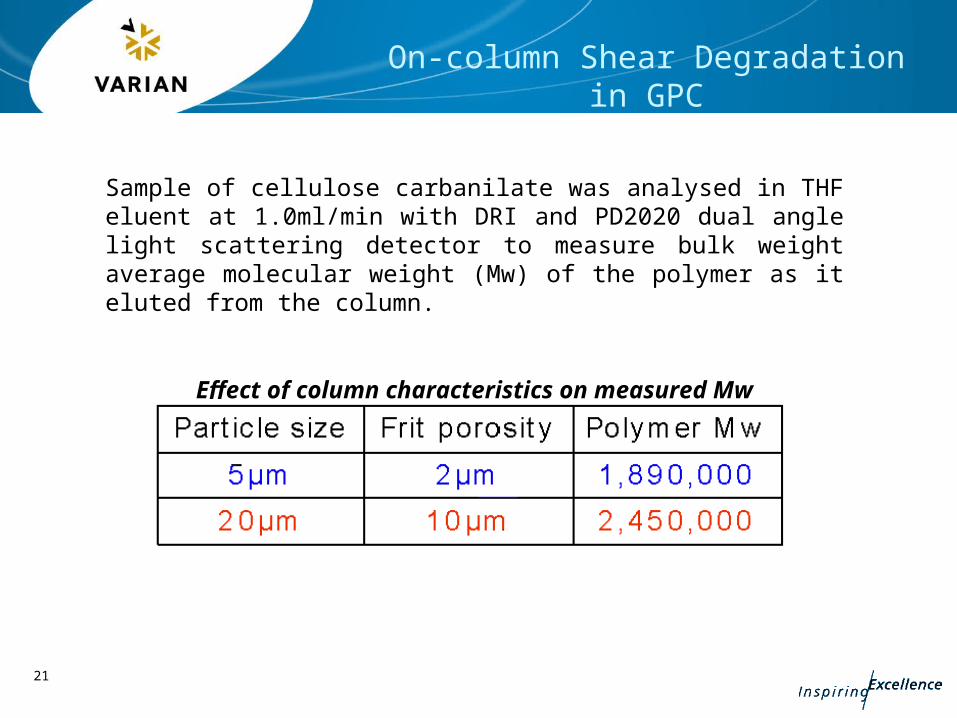
On-column Shear Degradation in GPC
Sample of cellulose carbanilate was analysed in THF eluent at 1.0ml/min with DRI and PD2020 dual angle light scattering detector to measure bulk weight average molecular weight (Mw) of the polymer as it eluted from the column.
Effect of column characteristics on measured Mw

22
Effect of Length on Resolution
Eluent: THF (stabilized)FlowRate: 1.0ml/minDetector: UVSamples : PL EasiCal PS-1 calibrants, two injections
1 x PLgel Column
Mp valuesInjection 1 Injection 21. 7500000 6. 25600002. 841700 7. 3200003. 148000 8. 595004. 28500 9. 108505. 293010. 580
3 x PLgel Column

23
Resolution Rs = 2(V1-V2)
(W1+W2)
Elution Volumes of peaks 1 and 2 are V1 and V2
Peak Widths of peaks 1 and 2 are W1 and W2
Specific Resolution per Molecular Weight Decade
Rsp =0.25 D
Where D = slope of calibrationSigma = peak variance (related
to peak width)
Resolution in GPC

24
Columns can be degraded by attack of polymeric materials by mobile phase
Use THF & TCB stabilised with antioxidant.
Shorter lifetime are observed with high temperature using small particle columns
Switch to larger particle size to reduce problem
Deterioration can also occur due to contaminant build-up on the column
This can be avoided by using guard column which can be discarded
Poor Column Lifetime

25
Column Ovens
Ovens are used to heat and maintain the temperature in a GPC separation
They come in a range of specifications, from low temperature all the way up to very high temperatures
Temperature can be important in GPC
Some GPC experiments are impossible without working at elevated temperature

26
Why use Elevated Temperature?
GPC applications employing elevated temperature generally fall into two categories :
1. To reduce solvent viscosity for improved chromatography
2. To achieve and maintain sample solubility

27
Effect of Temperature on Separations in Polar Solvents
Column : PLgel 5um MIXED-C300x7.5mm
Eluent : DMFFlow rate : 1.0ml/min
PEO/PEG standards
990,000 252,000
86,000 18,000
4,800 200
Increased temperature :
Reduced operating pressure
Improved resolution, particularly at high MW

28
Effect of Temperature on Column Pressure
Column PLgel 5um MIXED-D
300x7.5mm
Eluent Toluene
Flow rate 1.0ml/min
Column pressure falls as temperature increases due to reduced viscosity

29
Typical Range of Solvents used in GPC
A wide range of solvents are used in GPC with very varied viscosities
Elevated temperature helps to reduce the viscosity of these solvents improving column lifetime

30
Most common caused by loose connections between columns and detectors
Check all the connectors and tighten if necessary If the leak persists, disassemble and replace the leaking connector
Internal Detector Leak can be seen in the detector, injection valve or pump
Often due to solvent spillage near the instruments solvent sensor Can be due to failed detector seal or cracked cell – these must be replaced Leaks are sometimes seen from worn rotor seal in the injection valve Injection valve siphoning can draw solution from the waste - lower waste bottle Pump purge valve failure will cause leaks – tighten the valve or replace Pump seal and gasket failure will result in leaks - these must be replaced
Leaking can be seen in from the column end-fittings
The end-fitting may be loose - tighten as necessary The frit & spreader in the column may need to be replaced
Leaks in a GPC System

31
Concentration Detectors for GPC
There are several concentration detectors that are used in conventional GPC
Differential refractive index (DRI)
UV
Infra-red
Evaporative light scattering (ELSD)
We will look at these in turn
32
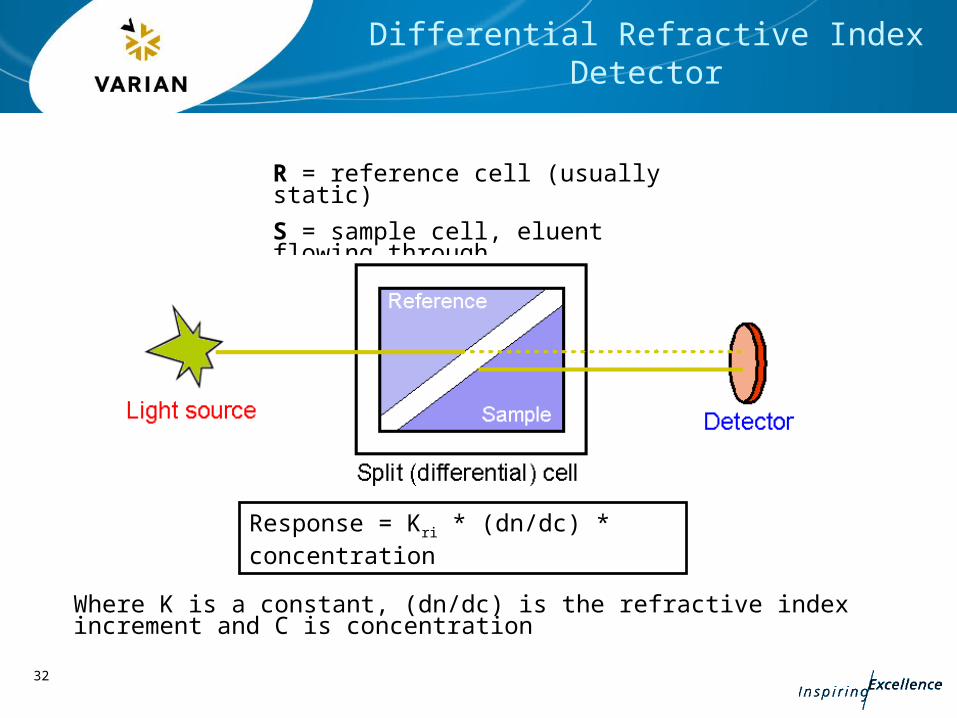
Differential Refractive Index Detector
R = reference cell (usually static)
S = sample cell, eluent flowing through
Response = Kri * (dn/dc) * concentration
Where K is a constant, (dn/dc) is the refractive index increment and C is concentration

33
Eluent Selection with DRI Detectors
Polydimethylsiloxane (PDMS) is soluble in several common GPC solvents.
PDMS has a refractive index of 1.407 and therefore it is isorefractive with THF and no DRI signal is recorded.
Toluene (n=1.496) and chloroform (n=1.444) give good DRI signals and are therefore preferred solvents for GPC of PDMS polymers when DRI is the detector of choice.
Columns: PLgel 5µm 104Å+ 500ÅFlow Rate: 1.0ml/minDetector: DRI

34
Linear Hydrocarbons
Peak HC MW RI
1 C12H26 170 1.4216
2 C16H34 226 1.4340
3 C22H46 310
4 C32H66 450 1.4550
Columns 2 x PLgel 5um 50Å 300x7.5mmEluent THFFlow rate 1.0ml/minSolutes Linear hydrocarbons, all prepared at equal concentration
Low MW dn/dc Effects
1
2
3
4
Refractive index of a homologous series changes rapidly below a MW of around 1000.

35
Differential Refractive Index Detector
The most commonly used detector in GPC, "Universal" detector
Monitors difference in refractive index of eluent stream as solutes emerge from column with respect to a static reference cell filled with the pure solvent
Can give positive and negative peaks
Must have sizeable difference in refractive index of solvent and solutes
Extremely sensitive to pressure and temperature fluctuations
Modest sensitivity, unsuitable for low solute concentrations
Non-destructive to sample
Easy to use
Approximately linear response with concentration
36
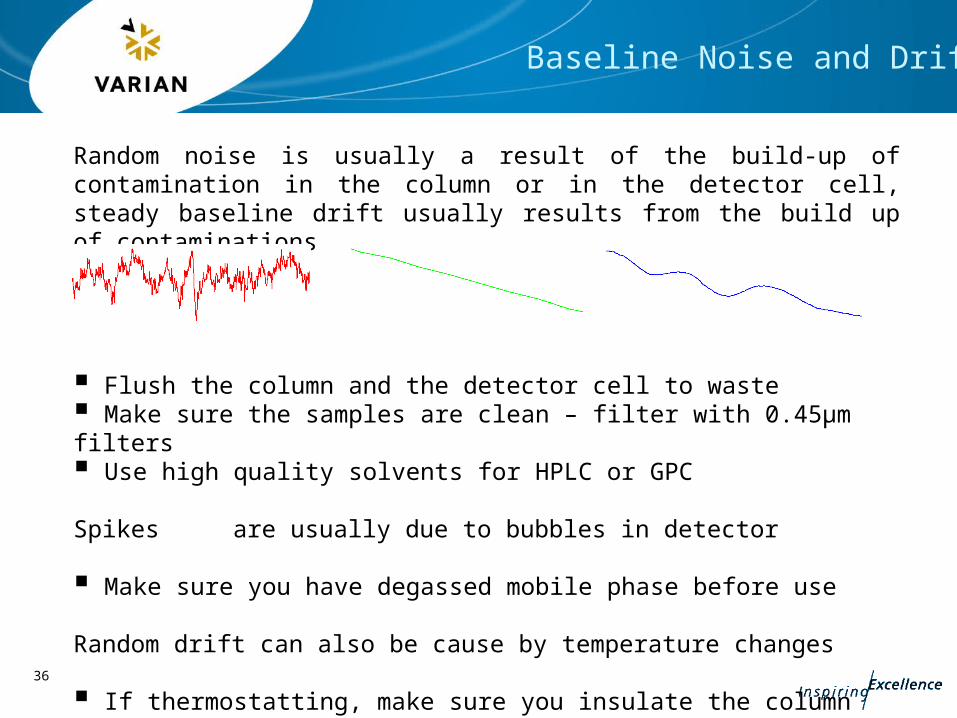
Random noise is usually a result of the build-up of contamination in the column or in the detector cell, steady baseline drift usually results from the build up of contaminations
Flush the column and the detector cell to waste Make sure the samples are clean – filter with 0.45µm filters Use high quality solvents for HPLC or GPC
Spikes are usually due to bubbles in detector
Make sure you have degassed mobile phase before use
Random drift can also be cause by temperature changes
If thermostatting, make sure you insulate the column and tubing
Baseline Noise and Drift

37
Usually caused by the column settling down
Make sure you allow sufficient time for column to equilibrate
Can be caused by the detector equilibrating
Allow time to reach stability - very common for RI detectors Ensure detector is not in a draught or direct sunlight
Baseline variations can also be cause by RI Reference cell contents decaying or degrading, especially at temperature
Regularly flush the reference cell with mobile phase
Baseline Drift at Start of Operation
38
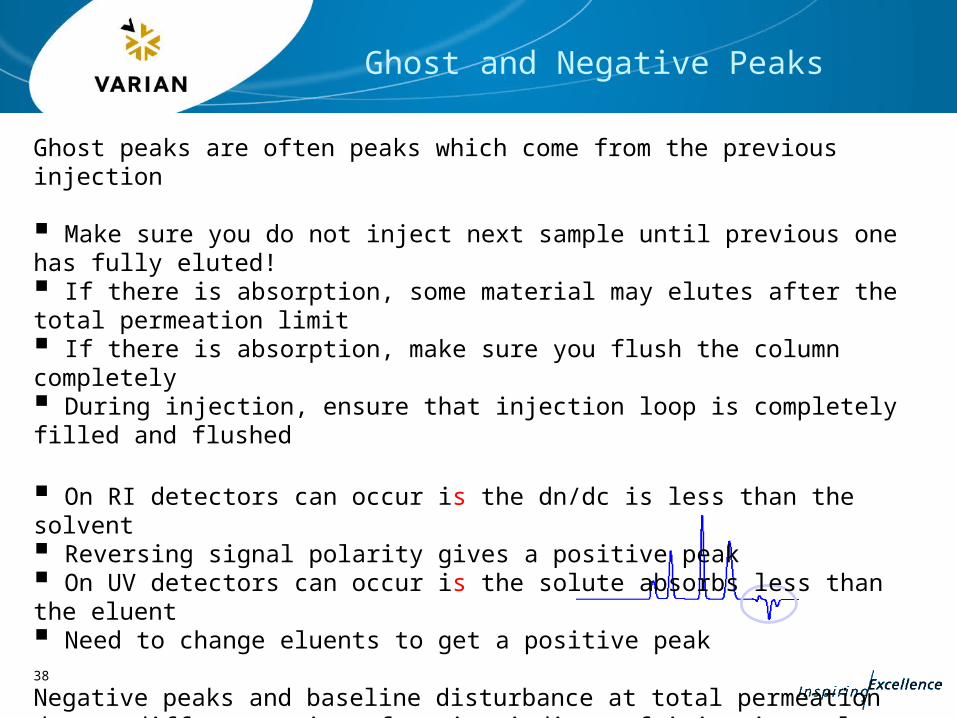
Ghost peaks are often peaks which come from the previous injection
Make sure you do not inject next sample until previous one has fully eluted! If there is absorption, some material may elutes after the total permeation limit If there is absorption, make sure you flush the column completely During injection, ensure that injection loop is completely filled and flushed
On RI detectors can occur is the dn/dc is less than the solvent Reversing signal polarity gives a positive peak On UV detectors can occur is the solute absorbs less than the eluent Need to change eluents to get a positive peak
Negative peaks and baseline disturbance at total permeation due to differences in refractive indices of injection solvent and eluent
Cannot be avoided, but it helps if the samples are prepared in the mobile phase
Ghost and Negative Peaks

39
UV Detectors
Relies on UV absorbing groups being present in solute
Very sensitive detector with small cell volumes and therefore low system dispersion
Good linearity
Insensitive to temperature and pressure fluctuations
Many polymers do not have chromaphores
Many solvents or solvent additives absorb UV and either prevent use or cause decrease in sensitivity.
Sometimes used in conjunction with RI for copolymer analysis when only one of the monomers has UV chromaphore.
40
Infrared Detectors
Relies on infrared absorbing groups in solute
Sensitivity low to moderate
Cell volumes tend to be much larger than other detectors and time constants longer
Many solvents absorb IR and either prevent use or decrease sensitivity
Insensitive to temperature fluctuations
Niche market for polyolefin analysis at high temperature but with moderate sensitivity
Can be used with RI for copolymer analysis
Note : GPC-FTIR using special flow cell (e.g. the PL-HTGPC/FTIR interface) or eluent collection device (e.g. Lab Connections) has great potential for identification of solutes by measuring complete FTIR spectrum as a function of elution time.

41
The PL-HTGPC/FTIR Interface
Consists of heated cell, transfer line and temperature control box
Can be heated to 175°C
Designed for use with Varian, Perkin Elmer, Nicolet and Bruker spectrometers

42
Evaporative Light Scattering Detector
Monitors changes in eluent stream by evaporation of solvent and using simple light scattering mechanism to detect solute particles
Economical detector with high temperature capability
Insensitive to temperature and compositional changes
Always gives positive signal response
Requires difference in volatility of solute and solvent
Generally higher sensitivity than RI
Loss of volatile low molecular weight solutes can occur

43
Varian 380-LC Evaporative Light Scattering Detector

44
ELS Instrument Concept

45
Light Scattering Detection
Response dependent on particle size
Mechanism principally reflection/refraction
Ideally nebulisation should form uniform droplet size

46
Linearity of Response
GPC analysis using THF at 1ml/min
Lowest column loading 1.0µg on column, or 100µl of 0.01mg/ml solution

47
12
3
4
5
Columns 2 x PLgel 5um MIXED-C 300x7.5mm
Eluent THF
Flow rate 1.0ml/min
Loading 0.1%, 20ul
Mp values
1. 7,500,000
2. 841,700
3. 148,000
4. 28,500
5. 2,930
Sensitivity of DRI Versus ELS
ELS is essentially independent of dn/dc, improvement in sensitivity will depend on a number of solute parameters

48
Consequence of Non-linearity
Non-linearity results in loss of response for low concentration peak tails
Distribution narrower than that calculated by DRI, polydispersity low

49
DRI
ELS 1000
Polymer Blends in THF, DRI Versus ELS
Samples
Polystyrene
Polydimethylsiloxane
Blend
Columns 2 x PLgel 5um MIXED-C
300x7.5mm
Eluent THF
Loading 0.2%, 20ul
Detectors DRI at 1V FSD
ELS1000 at 10V FSD

50
Polymer Blends in Toluene, DRI Versus ELS
Samples
Polystyrene
Polydimethylsiloxane
Blend
Columns 2 x PLgel 5um MIXED-C
300x7.5mm
Eluent Toluene
Loading 0.2%, 20ul
Detectors DRI at 1V FSD
ELS1000 at 10V FSD

51
Analysis of Natural Rubber, DRI Versus ELS
Zoom on additive region ELS
Columns 3 x PLgel 10um MIXED-B
300x7.5mm
Eluent Toluene
Loading ~0.2%, 200ul
Detectors DRI at 1V FSD
ELS1000 at 10V FSD

52
Styrene Butadiene Rubber (SBR) Analysis
This application illustrates the high sensitivity of the PL-ELS1000, permitting the polymers to be analysed at low loadings using narrow bore SEC columns.
Columns 2 x PLgel 20um MiniMIX-A 250x4.6mm
Eluent THF
Flow rate 0.3ml/min
Loading 1mg/ml, 100µlOil extended SBR
General grade SBR

53
Polymer Additive Analysis Using the ELS
These additives are used as stabilisers and antioxidants in polymer formulations. Not all of them have a UV chromophore and when extracted from polymers they are usually present in very small quantities. The universality and high sensitivity of the ELS makes it ideal for this type of application.
Columns 2 x PLgel 5um 50Å
Eluent THF + 0.1% diethanolamine
Chimasorb 944
Irgafos 168
Irganox 1010
Tinuvin 622
Tinuvin 770
Tinuvin 327

54
GPC Using Polar Organic Solvents
Columns PLgel 10um MIXED-B 300x7.5mm
Eluent DMSO
Detectors PL ELS 1000Must use volatile salts as modifiers for polar organic eluents (e.g. ammonium acetate)
Pullulan Mw=404,000
Pullulan Mw=22,800

55
Columns 2 x PLgel 10um MIXED-B 300x7.5mm
Eluent TCB
Flow rate 1.0ml/min
Temperature 160°C
Detectors PL-ELS 1000
High Temperature GPC
NBS 1475 polyethylene
MISS OUT SLIDENo lONGER SOLD

56
PVP/PVA Copolymer (Kollidon VA64)
Volatile salts must be used with evaporative light scattering detection
Columns 2 x PL aquagel-OH MIXED 8um 300x7.5mm
Eluent 1. 70% 0.2M NaNO3, 0.01M NaH2PO4, pH7, 30% methanol
2. 70% 0.1M ammonium formate, 30% methanol
Flow rate 1.0 ml/min
Detector 1. DRI
2. ELS 1000
57
Summary of ELS
Responds to compounds with no UV chromaphore
Positive response for all non-volatile solutes
Stable baseline, no drift with eluent or ambient temperature changes
High sensitivity, ideal for low dn/dc polymer/solvent combinations
No interference from spurious peaks around total permeation
Fast setup and equilibration
Evaporative light scattering detection can offer some significant advantages in GPC applications when compared to the more widely used differential refractometer or alternative UV detector :

58
Often seen if the sample loading on the column is too large
Reduce the size of the injection loop or the concentration
Can also be caused by a blocked or partially blocked frit
Need to replace the frit in the column Stop the frit clogging by using an in-line solvent filter of about 2µm
A void or channel in the column will also cause split peaks
Unfortunately you will need to replace column!
Can be caused by a partially blocked or damaged flowpath in the injector
Need to replace the rotor seal in the injector
Split peak may be due to a single peak with interfering components
Need to prepare a fresh solution!
Split Peaks

59
Tailing can result from excessive dead volumes
Make sure the tubing length is minimised, Make sure the injection seal is tight and there are no leaks Ensure that the connector fittings are properly seated
Tailing can result from degradation of column
Repair or replace the column!
Interaction of sample with surface of stationary phase can cause tailing
Overcome with using mobile phase additives Amines or salts to can be used in organic GPC
Peak Tailing

60
Large dead volumes will contribute significantly to peak broadening
Always use LDV end fittings and connectors Minimise lengths and diameters of tubing wherever possible
Broadening will result if the eluent is too viscous
May need to increase operational temperature
Broadening may result if the detector cell volume is too large
If possible, use a smaller cell volume
Broadening will result if the column is not performing
Repair or replace the column
Peak Broadening

61
Effects of Band Broadening
Modern high performance GPC columns have minimised the effect of band broadening in the separation. However poor system design with large amounts of dead volume can still cause loss of resolution. System dead volume should be minimised, especially when using very high efficiency columns.

62
The sample will not be observed if it is injected at a concentration below the minimum detectable level
Increase concentration or sample volume to get a good response
Sometimes a small peak will be observed for the first few sample injections due to adsorption of sample onto the column
Condition column with concentrated sample will reduce effect
Injecting an underfilled injection loop will give small peaks Ensure at least 3 times the sample loop volume is injected
Poor Detector Sensitivity
63
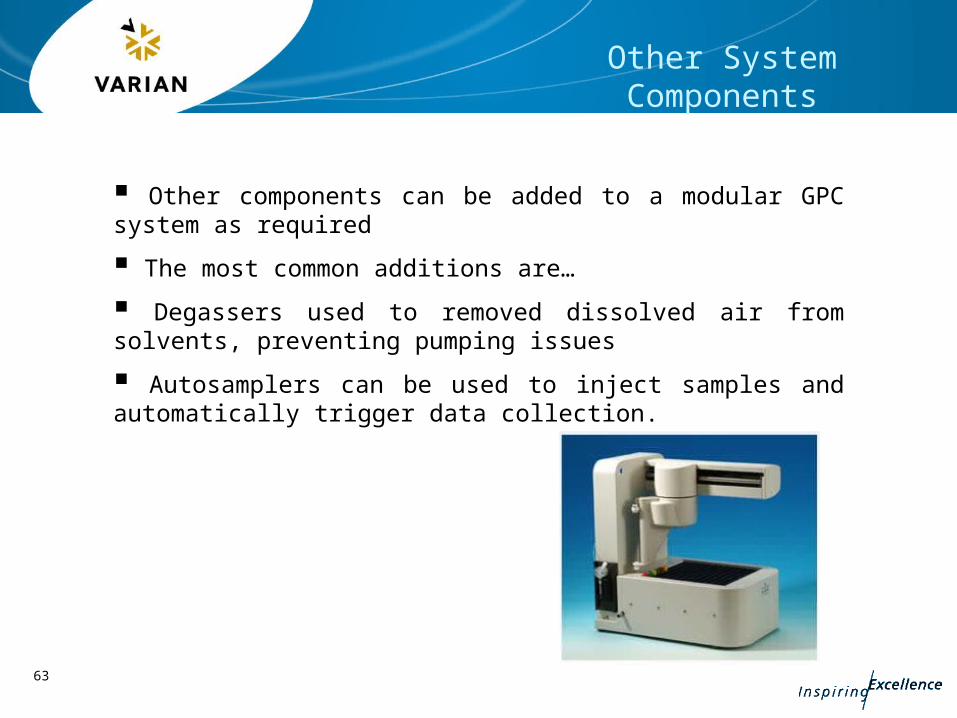
Other System Components
Other components can be added to a modular GPC system as required
The most common additions are…
Degassers used to removed dissolved air from solvents, preventing pumping issues
Autosamplers can be used to inject samples and automatically trigger data collection.

64
Integrated GPC Systems
Integrated GPC systems include pump, injection valve, oven and detectors in a single system, often with additional systems
They have several advantages over a modular (‘separates') system
They often provide an adequate temperature range for GPC applications
They reduce system dead volume by minimising connecting tubing between system components
The presence of a controlled temperature environment that contains all components leads to no localised variations in temperature
The systems have improved communications between components, system intelligence provides high performance, high degree of automation and comprehensive safety features

65
Example - The PL-GPC 50 Plus
Integrated system for GPC analysis up to 50°C
Standard instrument fitted with a DRI detector
Can accommodate other detector options
Fully software controlled

66
Raw data chromatograms
Molecular weight distributions
Inj no. Mn Mw Peak area
1 17,289 76,818 333851
2 16,988 77,434 335496
3 17,248 77,514 332616
4 17,251 77,052 335635
5 17,348 76,520 334212
6 17,487 77,728 333511
7 16,898 77,578 335642
8 17,457 77,288 334923
Mean 17,302 77,241 334485
s.d. 220 687 1048
% var 1.3 0.5 0.3
Reproducibility on the PL-GPC 50 Plus

67
Example - PL-GPC220 Integrated GPC

68
Components of the PL-GPC220 Integrated GPC System
PUMP AND DEGASSER

69
HTGPC Analysis of Crystalline Polymers
Adequate temperature capability (30-220°C)
Consistency of solvent delivery in continuous use
High temperature autosampler/injection system
DRI performance (sensitivity and stability)
Additional system requirements for these difficult applications

70
PL-GPC220 Autosampler
40 vial position carousel
2ml glass vials with crimped aluminium caps
Sample maybe slowly stirred prior to injection
Two zone heating, minimised risk of sample degradation

71
PL-GPC220 DRI Sensitivity
Columns 3 x PLgel 10um MIXED-B 300x7.5mm
Flow rate 1.0 ml/minInjection 200ulTest probes Polystyrene standards
Many polymer/solvent combinations in HTGPC offer very low dn/dc so DRI sensitivity is an important issue