Vesic 1973 Stiffness of fine-grained soil at very small strains
Upload
duonghuongCategory
view
223download
1
\
Transportation Research Record 884
based on the results of the pile test program and subsurface data. In general, there were two main considerations. One was to estimate the necessar y penetration to develop the design ultimate capacity and the other was to develop a driving resistance to satisfy the dynamic pile-driving formula that, in this case, was the WEAP program.
The pile penetration was based on the exploration data and the pile load test results. The estimated pile tip elevations were selected to have the tips in sand with a minimum of about 15 ft of sand below the pile tip to reduce the pile group settlement.
The driving criteria were based on the continuous driving resistance, considering the freeze factor. Tests and previous experience in the area indicated that the freeze factor for concrete piles was about 2 to more than 5 •
For the steel pipe piles, the specified pile penetrations were about 30 and 50 ft into the glacial deposits for the east channel (site C) and west channel (site D) piers, respectively.
Hammers other than those used in the pile test program were permitted. However, it was required that those hammers be calibrated by using the dynamic pile analyzer.
CONSTRUCTION PILE INSTALLATION
The test pile program was accomplished after the conceptual design of the West Seattle Freeway Bridge replacement project was developed but prior to the final design. Based on the results obtained from the test pile program, the final pile penetrations for the concrete and steel piles were reduced by about 10-25 percent from the preliminary estimated lengths prior to the load test program. This resulted in a reduced cost for the project. During the bidding process, the geotechnical report, which included the pile test data and results, was made available to all prospective contractors. The pile test data eliminated many questions concerning pile hammer selections and pile dr ivability. This may have contributed, in part, to the fact that the bid prices were less than the engineer's estimated costs for every project contract.
CONCLUSIONS
A comprehensive pile load test program was accomplished during the initial design stage of this very large project. The information thus gained was very beneficial in the final design and the preparation of contract specifications. It is also believed to have had an impact on the four contract bid prices, which were all below the engineer's estimate.
37
Static empirical methods supplemented with local pile experience proved satisfactory for estimating pile penetrations and pile capacities. However, instrumentation data indicate that the apparent frictional resistances and end-bearing capacities are different from those calculated from empirical formulas.
The WEAP program was very useful in selecting pile-driving hammers that successfully drove the 24-in concrete and 24- and 36-in steel piles to the required penetration and desir·ed capacities with the driving stresses below the ultimate stress of the pile material. The pile analyzer was used extensively and was useful in the overall understanding of pile driving. It was used to evaluate hammer performance and energy delivered to the pile as well as to estimate capacity and provide soil constants for wave-equation analysis for that particular pile and hammer. The pile analyzer was particularly well suited to evaluate the performance of diesel hammers.
ACKNa<iLEDGMENT
we would like to acknowledge B. wasell of the Seattle Engineering Department and T. Mahoney and B. Currie of Anderson, Bjornstad, Kane, and Jacobson for their assistance and cooperation during this project. We also wish to thank R. Cheney and R. Chassie of the Federal Highway Administration for providing helpful suggestions and comments on the test pile specifications. The assistance of many members of the staff of Shannon & Wilson, Inc., is gratefully acknowledged.
REFERENCES
1. A.S. Vesic. Design of Pile Foundations. NCHRP, Synthesis of Highway Practice 42, 1977.
2. G.G. Meyerhof. Bearing Capacity and Settlement of Pile Foundations. Journal of the Geotechnical Engineering Division , ASCE, Vol. 102, No. GT3, March 1976, pp. 195-228.
3. L.C. Reese and S.J. Wright. Drilled Shaft Design and Construction Guidelines Manual. FHWA, Implementation Package 77-21, Vol. l, 1977, p. 39.
4. M. Bozozuk, G.H. Keenan, and P.H. Pheeney. Analysis of Load Tests on Instrumented Steel Test Piles in Compressible Silty Soil. ASTM, Special Tech. Publ. 670, 1979, pp. 153-180.
5. A.H. Hunter and M.T . Davisson. Measurement of Pile Load Transfer. ASTM, Special Tech. Publ. 444, 1969, pp. 106-117.
Notice: The Transportation R esearch Board does not endorse products or manufacturers. Trade and manufacturers ' names appear in this paper because they are considered essential to its object.
Foundation Design and Evaluation for Winnemuca Viaduct
G. G. GOBLE, DAVID COCHRAN, AND FLOYD MARCUCCI
In preparation for the construction of Interstate 80 through Winnemucca , Nevada, a pile load test program was performed on candidate pile types to assist in the selection of a foundation design. Six pile types were statically tested at each site. Dynamic tests were also conducted, both at the end of driving and on restrike, and Casa method static-capacity predictions were made. The results of this program are reported. Treated-timber piles were selected in the design; they had allowable stresses of 1200 psi. The actual
stresses in the foundation piles are reviewed and reported. Also, driving records for one foundation group are presented to illustrate the effect of group behavior on driving resistance.
The initial planning for the section of Interstate 80 through Winnemucca, Nevada, called for twin

38
viaduct structures more than 4000 ft long. The structures were to span three crossings of the Humbolt River and two city streets. Preliminary foundation recommendations called for 55-ton design load steel H-piles. Because of the large amount of piling required to support the structure, a preliminary full-scale pile load test program was conducted to examine combinations of pile length and type in the hope that improved economy would result. Six different types of piles were driven and load tested at three different locations along the proposed route for the structure. As part of the same test program contract, two locations were tested in Lovelock, Nevada, in preparation for future bridge construction. The results of the Lovelock tests will not be discussed here, since bridge construction there has not yet started.
By rechanneling parts of the Humbolt River to avoid intersection with the I-80 alignment, the design length of the Winnemucca structure was reduced to about 900 ft after the load test program was completed. The layout of the structure and surrounding area is shown in Figure 1. With the reduced length of structure, only two of the load test sites were relevant to the design of the foundation piles. The locations of these load test sites are shown in Figure 1.
Based on the results of the preliminary test program, nouglas fir timber piles, which were approximately 50 ft long, were selected with a design load of 70 tons. Alternatively, the contractor was permitted to use 12-in 2 precast, pres tressed concretei 14-in monotubei or Raymond step taper. The winning contractor chose to use timber piles in the structure. Because of the higher-than-usual design loads, a review of the preliminary test program, the structural design, and the driving experience will be of interest.
SOIL CONDITIONS
The site is located in a large east-west trending intermontane basin that was occupied during the glacial period by an arm of old Lake Lahonton. From the original ground surface to depths that vary from about 5 to 20 ft, the soil along the viaduct align-
Figure 1. Site plan.
1-80 WINNEMUCCA VIADUCT
Transportation Research Record 884
ment consists primarily of clayey silts and silty clays. This material is relatively firm above the water table and soft to very soft below it. The groundwater surface fluctuates seasonally with the surface of the adjacent Humbolt River. Below these layers of silts and clays, to a depth of about 60 to 70 ft, the soil consists chiefly of slightly compact, medium to very coarse sand and gravel.
Five borings are available from near the structure and preliminary pile load test sites. The boring locations are shown in Figure 1. The borings were made by both 2.875-in wet-rotary and 8-in hollow-stem auger methods. Split-spoon samples were obtained at regular intervals in each of the borings by using the standard penetration test (SPT), according to ASTM 1586. Two of the boring logs obtained at the pile test sites that are representative of the area are given in Figures 2 and 3,
PRELIMINARY PILE TEST PROGRAM
At the test sites presented here, six pile types were tested. They were steel H-sections, treated timber, 12-in 2 prestressed concrete, monotube, Raymond step taper, and 12-in-diameter closed-end steel pipe. The details of the piles are given in Table 1, and they are shown in place relative to the soil profile in Figures 2 and 3. Anchor piles were of untreated timber, and the general arrangement of the load test setup is shown in Figure 4. This arrangement was attractive in that it was possible to perform three static load tests at the same time. At each site, the timber anchor piles were driven first and then followed by the static test piles. All of the test piles were driven by a DELMAG D-30 hammer, which is rated by the manufacturer at 54 140 ft-lbf. The driving records for the test piles are shown in Figures 5, 6, and 7. All of the test piles drove quite easilyi the maximum blow count for all of the test piles was ·about 80 blows/ ft for the monotube at site 4.
Two static-load tests were performed on each test pile. The first test was the 48-h American Association of State Highway and Transportation Officials (AASHTO) test. In this test, the pile was loaded in 10-ton increments at a rate of one increment every
= . T •11 I Piia Ar•• 5
• SOIL BORINO
100 200 300
seal • : 1•,;,200'

Transportation Research Record 884
10 min until a load of twice the anticipated design load was reached. The settlement was read before and after the application of each load increment. The load was then maintained for 48 h and the settlement read once each hour. Unloading proceeded in the reverse of the loading procedure. The second load test was the modified Texas quick test. In
Figure 2. Soil profile, test pile at site 4.
10
20
0
"' .,, --< ::c
6
l 1
--., -SROW/I SL! GHTL Y CLAYEY SILT-SCATTERED COARSE SAND . ~ '
@ ~~~~ ~~~~/~~~iu~Li~H~6~R~~A~~~Ds!~6 • , PEA GRAVEL
39
this test, the load was applied in increments of 5 tons every 2.5 min. Pile top settlements were read before and after each application of each load increment. Loading was continued until plunging failure or 200 tons, which is the capacity of the testing system.
The test results were evaluated by using two
TP6-4 TPl-4 TP2-4 TP3-4 TP 4-4 TP 5-4 12" x 12" TIMBER MONOTUBE STEP-TAPER 12"PIPE HP10x57 PRESTRESSED
CONCRETE ,___ 1-,- -
17 16
:: ·· : ARK GREY MIXED SANDY SILT ,SILTY CLAY, ;".~: AND CLAYEY SILT 1 - ;;, , .. ~ ~ ;2 ~ .. -~·: "' '° '°
18 -~:• -BROWN I SH GRAY MED. TO VERY COARSE SAtlD
30
40 ~··4·. AND GRAVEL
17 -BROllrl SL! GHTL Y SIL TY SAND AND GRAVEL 50
19
: .;" -50 :.:- ·.
60
~;_: -GRn-BROWN SAND MD GRAVEL WITll
44 - ~'-~ SL! GHT CLAY BIN DER - -~ -
70
~ ,. . ,
". ': ~ -
80
50 £·!. -DEHSE TO VERY DENSE CLAYEY SAND AND GRAVEL 90 ..
~~:: 100 ~
Figure 3. Soll profile, test plle at site 5.
0 "' "' .,, .,, --<
--< :z I ' TP6-5
< ;:::' ~
~
TP!-5 TP2-5 TP3-5 TP4-5 TPS-5 12" x 12" TIMBER MONOTUBE STEP-TAPER 12"PIPE HP10x57 PRESTRESSED
CONCRETE
-DARK BROWtl CLAYEY SILT -- -~ >---~
~· -DARK GREEN VERY ff IE TO MEDI UM CLEAN SA~:O-' INTERBEDED SILT
0 ·-'t.-" ... -DARK GREEN COARSE TO VERY COARSE SAtlD-9 ~ SCATTERED GRAVEL
0 ----.._SOFT GREEN! SH-GRAY SILT
:•-.? 1 ~ ~1 ;;, - ;;,
18 .. , -::, N
-SLIGHTLY COMPACT ,MEDIUM TO VERY COARSE SAllD U">
I
~ U">
~ " 0 19- ·- .. WI TH SCATTERED GRAVEL ... ' ~ =
26 7 I I -~)- 1 --COMPACT MEDIUM TO
I 0 VERY COf\RSE SAND WITH I
1
~ /~' SCATTERED GRAVEL 1 0 32Tf· . ~ . -coMPACT FHIE TO VcRY COARSE SILTY SAND -0
27 , .. - ! AND GRAVEL
,_ -.. ;;i '
4
6
0 . ' :_-Ii ,_
8
56 ; I • -DENSE VERY FINE TO VERY COARSE SILTY SAND
0 ~ ; A~D GRAVEL : 1;
0 ~ ~ • 9 . ~ 0 •• .... 10

40
different procedures to define the ultimate capacity. The procedure used by the Nevada State Highway Department is the double tangent method. In this procedure, the ultimate capacity is defined as the load at the intersection of tangents drawn to the load test curve at its beginning and end. The
Table 1. Test pile details.
rile No.
TPl-4
TPl-5
TP2-4
TP2-5
TP3-4 TP3-5 TP4-4
TP4-5
TPS-4 TPS-5 TP6-4 TP6-5
Figure 4. Load test setup.
e•
Pile Type
Timber
Timber
Monotube
Monotube
Step taper Step taper Pipe
Pipe
HP 10x57 HP 10x57 Prestressed concrete Prestressed concrete
... TEST PILE TYP .
l
Driven Length (ft)
57
45
27 40 15 40 70 54 11 57 45.5 12.5 73 72 68 58
TIMBER REACTION PILES TYP.110' ± LONO
Figure 5. Driving records for timber and monotube piles.
.... -• ~ -c ~ • !: • c
0
10
30
40
:. 110
eo
70
TP2-ll Monotube
TP2-4
TPl- 4 .\ . . .. .. :' Monotub7 T1111ber__/ . .- ' ·.: .
............. -: ..... .. :.::·: .. : .:-; · . . . . .
Blow1/lt
:~:.
.:~
:::
Transportation Research Record 884
other procedure, which is the Davisson method (1), has been used in evaluating data obtained in the Case piling research project. Static load test curves from site 5 are shown in Figures 8-13. All six piles at site 4 carried the full 200-ton capacity of the static testing system, so the results
Cross-Section Description
14.7-in-diameter butt 7.3-in-diameter tip 14-in-diameter butt I 0-in-diameter tip 18-in ND-type N7 gage top 18-in butt-type J7 gage 18-in ND-type NS gage top 18-in butt-type J7 gage 9-in tip, I-in steps each 8 ft I I-in tip, I-in steps each 8 ft 12.75-in outside diameter, 0.5-in wall top 12.75-in outside diameter, 0.4375-in wall 12.75-in outside diameter, 0.5-in wall top 12.75-in outside diameter, 0.4375-in wall
12xl2 in 12xl2in
~~. _;;
' ' •:.. "":,' 38x2411
;:?. "' ~
' !,.,• ·~)
':' ......
1 l w· 27x 114 7· •11. 11t 12'
·'.·:· TIMBER: REACTION PILE
~ TEST PILE
'~:
·~--·
l ' -0
••-o
11•-o
a·-o
Figure 6. Driving records for pipe and step-taper piles.
0
10
20
.... - 30 - TP3-ll -c Step Taper 0
~ 40
• c • IL 50
eo
70
80 0 10 20 30 50
Blowe/It
eo

Transportation Research Record 884
Figure 7. Driving records for prestressed and H-piles.
~ ~ -.... c 0 ~
~ ~ .. c .. IL
0 .
10
20
30
40
60
60
70
'~ I
cl
'
TP6-5
~ ...... <
TPl-6 Pre•tr•••ed concr•t•
~.
:--TPi-4 : HP10xl57
80 HP10~x_5~7_.._~-~~~-~~~~ 0 10 20 30 40 110 eo
Blow a/It
Figure 8. Timber pile static load test.
200 Pll• No .. :TP 1-5 Piie Type :Tl111b•r
180 E111b•dd•d Length:
180 Extrapolated~.
48t 140
1341 ,- - · ·· · ,.. • I c ' ! 120 ' I "O I • 100 0 ...
--- 46 hour teat "O ao • I -----quick teat
I Q. Q. ao I
<If.
40
' 20 I I I
' 0.2 0.4 0.6 o.a 1.0 1.2 1.4 Piie Butt Settlement(lnchea)
45'
are not tabulated and the load test curves are not presented. The results of the evaluation of the tests at site 5 are given in Table 2.
An extensive dynamic test program was also performed at site 5. Measurements of force and acceleration at the pile top were made during the driving of the test piles. After completion of the static load tests, several of the piles were res truck with several different hammers, and again pile top force and acceleration were measured.
A procedure for determining static pile capacity during impact driving was developed at the Case Institute of Technology beginning in 1964 (2). This procedure, known as the Case method, requires the measurement of force and acceleration at the pile top during the hammer blow. These measurements have become quite routine. The capability to measure impact s~esses and hammer energy transferred to the pile have been useful secondary developments. A
Figure 9. Monotube pile static load test.
,.. • c 0 .... "O
• 0 ... "O
~ Q. Q. <If.
20
180
180 I
I 140
120
100
80
60
40
20
4
'• ,'1 / /
I I
I ' I I I
I
' ' I I I
I
Piie No. : TP2-5 Piie Type: Monotube Embedded Length: 56'
---48 hour teat
----Quick teat
0 ,_ ...... "T""_.....-~-.---.--..--"T""~-. 0 0.2 0.4 0.8 0.8 1.0 1.2 1.4
Piie· Butt Settlement(lnchea)
Figure 10. Step·taper pile static load test.
200
180
,.. 1 80 • c 0 14 ~ .... "O .. 0 ... "O .. Q. a.
<If.
" ,, JI , '
I I I ' , I , I
I I ' I , I
I
Pll• No. : TPS-5 Pll• Type: 8te11 Taper E111bedd•d Length: 54'
---48 hour' teat
---- quick t•at
0.2 0.4 0.8 0.8 1.0 1.2 1.4
Piie Bult 8ettle111ent (Inch••>
41
pile-driving analyzer can per form these computations in the field. One such device was used during the driving of the test piles at Winnemucca site 5. More compact, versatile, and reliable pile analyzers have been constructed since the time of the Nevada tests.
During dynamic testing, the records of force and acceleration were also recorded on analog magnetic tape. This record could then be reanalyzed in the laboratory, and Case method capacity and energy delivered to the pile top could be recalculated. Energy delivered to the pile top is calculated from the following relation:
t ' E(t') = f F(t}v(t}dt
0 (!)
where F is the measured force at the pile top and v is the associated velocity, both given as a function of time (t). The maximum value of delivered energy

42
(ENTHRU) is a common measure of the performance of the hammer and driving system.
A second method of capacity determination was developed during the Case project. This method,
Figure 11 . Pile static load test, 12.76-in pipe.
200
1110
HIO
- 140 • c : 120
... ~ 100 ... ; eo A
: 80
40
20
Piie No. : TP4-5"' Piie Type: 12 3/4" Pipe
Embedded Length: 58'
* unable to maintain 140 ton loa d due to plunging !allure
- - 48 hou r t e at
0.2 o.4 0 .8 0.8 1.0 1.2 1 .4 l'lle· llutt Settlement (Inell••>
Figure 12. H·pile static load test.
200
180
180
- 14 0 .. c: ~ 120 ..., ... • 100 0 ... ... 80 .! .. .. 80
oC
40
20
Piie No. : TP5-5
Piie Type: HP 10x57 Embedded Length: 72'
---48 hour teet
0 . 2 0.4 0 .6 0.8 1 .0 1.2 1.4 Piie Butt Settlement (Inch••>
Transportation Research Record 884
known as the Case pile wave analysis program (CAPWAPl, treats the pile as elastic by usinq the Smith model (3). Soil resistance parameters are calculated from the measured force and acceleration input. An elastic dynamic analysis is required, so a substantial computational capability must be used. CAPWAP cannot be done easily in the field and real-time results cannot be obtained.
The results of the tests are summarized in Table 2. Piles 2-5 and 3-5 were not tested dynamically either during driving or restriking. Pile 2, the monotube, was driven at a later date, and measurements could not be made. Dynamic measurements were made at the top of the Raymond step-taper mandrel. However, they were very noisy due to the reflections from the mandrel joints and they could not be satisfa~tor ily processed. Both of these piles were filled with concrete prior to static load testing • Restrike testing was not successful due to difficulties in determination of the composite elastic modulus,
It can be seen from Table 2 that the agreement between the Case method capacity and the static load test results was good. It should be evaluated by comparing it with the Davisson capacity for which it was developed. Res trike capacities should be used to compare it with the static load test results, since there was a strenqth qain with time. The Case mP.thod results for the timber pile were 16 percent higher than the Davisson capacity. The other results were in error by smaller amounts. In fact, it
Figure 13. Prestressed concrete pile static load test.
-• c ! ..., ... • 0 ... ... ~ a. a. oC
1110
110
140
120
100
110
8 0
4 0
2 0
Piie No . : TP8-5 Piie Type: Preetreeeed
Concret• Embedded Length: 88'
--- 48 hour te et
Of-~..--'-~-.--~~~~-~~-.--.--. 0 0.2 0.4 0.8 0.8 1.0 1.2 1.4
I'll• Butt Sett1e111ent<tnche1)
Table 2. Capacity test results for site 5. Test Results, Static Capacity (tons)
Pile Double Pile Type Tangent Davisson
1-5 Timber 1-5 Timber 134" 146' 2-5 Monotube 3-5 Step taper
129b 117b 4-5 Pipe 4-5 Pipe 5-5 H 5-5 H 9oh 93b 6-5 Pre stressed 6-5 Pre stressed 200+• 200+•
Note: CAPWAP =Case pHe wave a na lysis program. DToxas q\.I ck test . hAASHl 'O lost.
Time of Dynamic Test
End of driving Restrike End of driving End of driving End of driving Res trike End of driving Restrike End of driving Restrike
Dynamic Capacity (tons) Blow Count Case (blows/ ft) Method CAPWAP WEAP
19 144 149 160 44 170 NA 220 38 NA NA 212 32 NA NA 220 20 104 100 190 27 130 151 220 12 88 115 110 17 93 96 160 41 139 NA 260
120 301 NA 460
Transportation Research Record 884
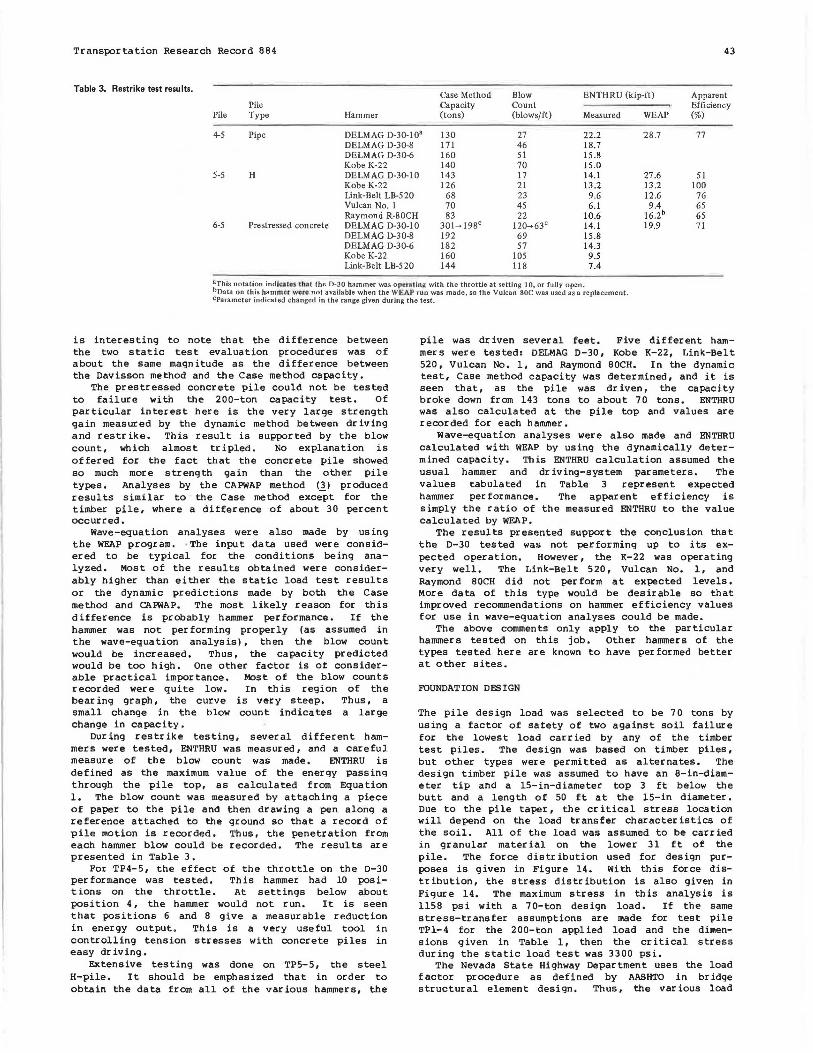
Table 3. Restrike test results.
Pile Pile Type
Case Method Capacity
Hammer (tons)
Blow Count (blows/ft)
ENTHRU (kip-ft)
Measured WEAP
43
Apparent Efficiency (%)
4-5 Pipe DELMAG D-30-10' 130 27 22.2 18.7 15.8 15.0 14.1 13 .2
'28.7 77 DELMAG D-30-8 171 46 DELMAG D-30-6 160 51 Kobe K-22 140 70
5-5 H DELMAG D-30-10 143 17 27 .6 13.2 12 .6
51 Kobe K-22 126 21 Link-Belt LB-520 68 23 Vulcan No. I 70 45 Raymond R-80CH 83 22
6-5 Prestressed concrete DELMAG D-30-10 301-198c 120-63c
9.6 6.1
10.6 14.1 15 .8 14.3
9.4 16.2b 19.9
100 76 65 65 71
DELMAG D-30-8 192 DELMAG D-30-6 182 Kobe K-22 160 Link-Belt LB-520 144
69 57
105 118
9.5 7.4
aThis notation indla te.s thmt the D-30 hammer was opc: l'•ling with the throttJe at setting 10, or fully open . hoata on this hammer were not available when the WEAP run was made, so the Vulcan 80C was used as a replacement. CParameter indicated changed in the range given during the test.
is interesting to note that the difference between the two static test evaluation procedures was of about the same magnitude as the difference between the Davisson method and the Case method capacity.
The prestressed concrete pile could not be tested to failure with the 200-ton capacity test. Of particular interest here is the very large strength gain measured by the dynamic method between driving and restrike. This result is supported by the blow count, which almost tripled. No explanation is offered for the fact that the concrete pile showed so much more strength gain than the other pile types. Analyses by the CAPWAP method (_1) produced results similar to the Case method except for the timber pile, where a difference of about 30 percent occurred.
Wave-equation analyses were also made by using the WEAP program. The input data used were considered to be typical for the conditions being analyzed. Most of the results obtained were considerably higher than either the static load test results or the dynamic predictions made by both the Case method and CAPWAP. The most likely reason for this difference is probably hammer performance. If the hammer was not per forming properly (as assumed in the wave-equation analysis), then the blow count would be increased. Thus, the capacity predicted would be too high. One other factor is of considerable practical importance. Most of the blow counts recorded were quite low. In this region of the bearing graph, the curve is very steep. Thus, a small change in the blow count indicates a large change in capacity.
During res trike testing, several different hammers were tested, ENTHRU was measured, and a careful measure of the blow count was made. ENTHRU is defined as the maximum value of the energy passing through the pile top, as calculated from Equation 1. The blow count was measured by attaching a piece of paper to the pile and then drawing a pen alonq a reference attached to the ground so that a record of pile motion is recorded. Thus, the penetration from each hammer blow could be recorded. The results are presented in Table 3.
For TP4-5, the effect of the throttle on the D-30 performance was tested. This hammer had 10 positions on the throttle. At settings below about position 4, the hammer would not run. It is seen that positions 6 and 8 give a measurable reduction in energy output . This is a very useful tool in controlling tension stresses with concrete piles in easy driving.
Extensive testing was done on TP5-5, the steel H-pile. It should be emphasized that in order to obtain the data from all of the various hammers, the
pile was driven several feet. Five different hammers were tested: DELMAG D-30, Kobe K-22, Link-Belt 520, Vulcan No. 1, and Raymond BOCH. In the dynamic test, Case method capacity was determined, and it is seen that, as the pile was driven, the capacity broke down from 143 tons to about 70 tons. ENTHRU was also calculated at the pile top and values are recorded for each hammer.
wave-equation analyses were also made and ENTHRU calculated with WEAP by using the dynamically determined capacity . This ENTHRU calculation assumed the usual hammer and driving-system parameters. The values tabulated in Table 3 represent expected hammer performance. The apparent efficiency is simply the ratio of the measured ENTHRU to the value calculated by WEAP.
The results presented support the conclusion that the D-30 tested was not performing up to its expected operation. However, the K-22 was operating very well. The Link-Belt 520, Vulcan No. 1, and Raymond BOCH did not perform at expected levels. More data of this type would be desirable so that improved recommendations on hammer efficiency values for use in wave-equation analyses could be made.
The above comments only apply to the particular hammers tested on this job. Other hammers of the types tested here are known to have per formed better at other sites.
FOUNDATION DESIGN
The pile design load was selected to be 7 0 tons by using a factor of safety of two against soil failure for the lowest load carried by any of the timber test piles. The design was based on timber piles, but other types were permitted as alternates. The design timber pile was assumed to have an 8-in-diameter tip and a 15-in-diameter top 3 ft below the butt and a length of 50 ft at the 15-in diameter. Due to the pile taper, the critical stress location will depend on the load transfer character is tics of the soil. All of the load was assumed to be carried in granular material on the lower 31 ft of the pile. The force distribution used for design purposes is given in Figure 14. With this force distribution, the stress distribution is also given in Figure 14. The maximum stress in this analysis is 1158 psi with a 70-ton design load. If the same stress-transfer assumptions are made for test pile TPl-4 for the 200-ton applied load and the dimensions given in Table 1, then the critical stress during the static load test was 3300 psi.
The Nevada State Highway Department uses the load factor procedure as defined by AASHTO in bridge structural element design. Thus, the various load

44
Figure 14. Force and stress distribution in design pile.
"' -a. • 0
5
10
Hi
20
25
30
35
40
46
110
Piie Load
20 40 80 80 100120 140
Piie Load (kips)
. 2 .4 .8 . 8 1.0 1.2 1.4
Piie Sire .. (kel)
contributions for each load condition are carried down the structure and combined according to accepted procedures for the strength design of each element. In foundation design, pile react i ons are calculated for the factored loads in order to design the pile cap. However, since piles are designed by using working stresses, work i ng loads must also be carried to the piles. They are also combined according to the AASHTO working stress procedures, and critical conditions are calculated. Because pile design is based on ultimate strength concepts that have a rather arbitrarily selected factor of safety, a great deal of rationality would be added to the procedure if load factor methods were extended to include pile design.
The structure consisted of precast, prestressed box sections erected in a simply supported configuration in spans up to 100 ft. After erection of the precast sections, they were made continuous in three span units by placement of a cast-in-place deck with negative-moment reinforcement over the piers. The structure was analyzed as continuous for live loads. The piers had a wide single column configuration with a single footing under each pier. Thus, eccentric live loads arising from traffic in a single lane induce substantial moments to the footing, and live load effects can be substantial.
Individual pile groups under the piers r anged in size from 18 to 26 piles. All of the pile groups had some piles loaded to very near the design load under some load conditions. Controlling conditions were either the dead plus live load combination (AJISHTO group I) or the dead plus live plus temperature combination (AASHTO group IV). The highest dead loads were about 45 tons on one pile group. Because dead load was concentr ically applied, all of the piles in the group were equally loaded. This gives a critical pile stress of 740 psi (assuming the same load transfer ratios as given in Figure 14).
CONSTRUCTION
The production piles were driven with a Kobe K-22 open-end diesel hammer, which is rated at 41 300 ft-lbf, Three static test p i les were driven and tested, Two were driven to 25 blows/ft and the
Transportation Research Record 884
Figure 15. Driving resistances for pier 1 OW.
. .. ·' ..,
. 0
·' ...
. .. I ..,
I 4'-4.5" I 4'-4 .11" I 4'-4.ll" I 4'-4.11" J . . . ... '·• ,. . . , Q (!;) Q Q CI;) Cf) <:;;) Q (!;)
GD ®
~Order' of Driving
~Blow Count (In blow• per foot)
(drewlng not to ec a la)
third to 8 7 blows/ft . All piles were loaded to 200 tons by using the Texas quick test defined earlier. One of the piles failed by soil failure at a defined failure load of 164 tons, while the other two carried 200 tons without failure. The driving criterion was defined to be 25 blows/ft with a prescribed minimum tip elevation. In the driving of the production piles, blow counts much higher than the specified minimum occurred prior to reaching minimum penetration. The difficulty was probably due to the densification of the granular material due to driving of the pile group. Some prebor ing was permitted to achieve the specified tip elevation.
It is interesting to examine the driving record for a foundation where no preboring was done. In Figure 15, the final blow count is shown together with the order of driving for one pier. All piles were driven to the same tip elevation. Except for pile 10, where the blow count is somewhat higher than would be expected, the driving resistance is reasonably consistent with what would be anticipated.
About 500 timber piles were driven for the structure. A total of six piles were damaged during driving and had to be replaced. Damage was either visually detected or was noted by a sharp decrease in blow count. The structure (as of August 1981) has been complete for about two years. It is not yet' open to traffic, but it has been used by the contractor for trucks hauling base material for the completion of the roadway. These loads are probably equal to the operating loads that the structure will carry. The structure is ~erforming well, based on a visual inspection.
CONCLUSIONS
Based on the data obtained in the preliminary test program and the results of the production driving, the following conclusions are justified:
1. The use of design stresses of 1200 psi in treated Douglas fir has proved to be successful and should be continued. With these design stresses, good quality construction-control procedures must be followed.
2. Timber piles can be successfully driven with

Transportation Research Record 884
large open-end diesel hammers. Difficulties during production driving were practically nonexistent.
3. Dynamic-capacity predictions agreed well with the static load test results.
4. Measured hammer performance was poorer than predicted in most cases. Thus, construction control by using dynamic measurements or static load tests is necessary as design loads are increased.
5. A preliminary test program of the type conducted here can be expected to save large amounts of money.
REFERENCES
1. M.T. Davisson. High Capacity Piles. In Proc., Soil Mechanics Lecture Ser ies--Innovation in Foundation Construction, Soil and Mechanics
45
Division, ASCE (Illinois Section), 1973. 2. G.G. Goble, G. Likins, and F. Rausche. Bearing
Capacity of Piles from Dynamic Measurements, Final Report. Ohio Department of Transportation, Columbus, and Department of Solid Mechanics, Case Western Reserve Univ., Cleveland, Rept. OHIODOT-05-75, March 1975.
3. F. Rausche, F. Moses, and G.G. Goble. Soil Resistance Predictions from Pile Dynamics. Journal of the Soil Mechanics and Foundations Division, ASCE, Vol. 98, No. SM9, Proc. Paper 9220, Sept. 1972.
Notice: The Transportation Resrorch Board does not endorse products or manufacturers. Trade and manufacturers' names appear in this paper because they are considered essential to its object.
Pile Selection and Design: Lock and Dam
No. 26 (Replacement)
BRUCE H. MOORE
Lock and Dam No. 26 is a major navigation structure on the Mississippi River some 25 miles north of St. Louis, Missouri. At the site there is a large, unbalanced horizontal water load of 24 ft. The soils at the site are sands, gravels, cobbles, boulders, and clay tills that are 80 ft thick. The history of, and logic for, the selection of piling on this project is presented. The soil and foundation information available at each stage of design is outlined. The interrelation of capacity determination by testing or by computational methods is discussed . The design process is analyzed and a critique is furnished. An evaluation of pile test extent and timing by using decision-analysis techniques is recommended.
Large projects generally have long histories. The size and related logistics are principal contributors to this lengthy process. Response to conflicting interests, reviewing agencies, and differing engineering advice also provides interruptions. The intent of this paper is to follow the selection of pile type and design capacity through the intermittent stages of a large project with a view toward improving this selection process.
GENERAL
Existing Locks and Dam No. 26 is located on the Mississippi River at Alton, Illinois (Figure 1). The existing structure consists of semigravity locks 110 ft wide by 600 and 360 ft long; the walls are supported principally on vertical 35-ft-long timber piling. The dam portion includes 32 tainter gate bays that are 40 ft wide and are also supported on short vertical wood piling. The soils at the site consist of alluvial sands and gravels grading coarser with depth to limestone bedrock at 65 ft below the base of the structure. The zone of pile embedment is composed of fine to medium sands with variable density. The riverward lock wall has displaced horizontally more than 10 in, and other lock walls have displaced varying distances up to 6 in. Early construction problems, notably the failure of the third-stage cofferdam, are related by White and Prentis (.!,). Extensive scouring of the
river bottom attended this failure. The construction of the riverward auxiliary lock was done in sands placed in this area by dredging shortly before pile installation. The piles were jetted and then seated by driving an additional 5 ft or to refusal. There has been no observed failure of the piles themselves. Drill cores and diver examination of the piling show strong, firm timbers. The problem appears to be inadequate lateral support from the soil and pile system when subjected to a large number of load repetitions. This deficiency is present even though when this structure was designed in the early 1930s a full-scale pile testing program was instituted. The effects of cyclic loads were evaluated through numerous repetitions of a horizontal load on single- and multiple-pile monoliths. The tests were performed within the main lock area, not the auxiliary lock. The tests were reported by the principal engineer, S.B. Feagin (2).
The replacement lock and dam- are located about two miles downstream from the present structure (Figure 1). Foundation support and lock chamber shape and size are the principal features altered for the new structure. The present concept for the replacement structure consists of a single 110xl200-ft U-frame lock and nine 110-ft-wide tainter gate bays for the dam. These configurations are shown in Figure 2 (section) and Figure 3 (plan).
Several stages of design can be recognized in the development of these configurations. The U.S. Army Corps of Engineers labels these as survey, general, and detailed stages. Most engineers use similar labels for steps within their practice . Survey involves the evaluation of several major alternative structures and sites by using limited available information and experience. General and detailed, as the names imply, involve increasing amounts of basic information and refinement of design features.
The following discussions relate the amount of information available and the procedures used to establish pile type and predict capacity at each


![51-883 SINGLE REGULATED 51-884 DOUBLE REGULATED883-884].pdf · 2014-07-14 · 12.5 GALLON SS (NON-ASME) 51-883 SINGLE REGULATED 51-884 DOUBLE REGULATED STAINLESS STEEL AIR AGITATED](https://static.fdocuments.in/doc/165x107/5f3d31ad85cece1df0713cad/51-883-single-regulated-51-884-double-883-884pdf-2014-07-14-125-gallon-ss.jpg)


