Fostering happiness among public transit users: Analyzing...
166
1 Fostering happiness among public transit users: Analyzing customer satisfaction surveys through non-traditional approaches Emily Grisé School of Urban Planning McGill University March 7, 2019 A thesis submitted to McGill University in partial fulfillment of the requirements of the degree of: PhD in Urban Planning © Copyright Emily Grisé, 2019.
Transcript of Fostering happiness among public transit users: Analyzing...

1
Fostering happiness among public transit users:
Analyzing customer satisfaction surveys through
non-traditional approaches
Emily Grisé
School of Urban Planning
McGill University
March 7, 2019
A thesis submitted to McGill University
in partial fulfillment of the requirements of the degree of:
PhD in Urban Planning
© Copyright Emily Grisé, 2019.

i
ACKOWLEDGMENTS
The completion of my PhD has been quite an experience, and there are many acknowledgements
that I would like to make to recognize the support I have received during this journey. First, I wish
to acknowledge my supervisor Professor Ahmed El-Geneidy, as with his continuous support I am
thrilled to be completing my PhD with such a level of pride in the work I generated as well as to
graduate in such a timely manner. His devotion to students is unlike any professor I have met and
has certainly made a profound impact on my personal and professional development. I am very
thankful to have had the opportunity to be a part of the Transportation Research at McGill (TRAM)
group, which Ahmed has made considerable efforts to foster a sense of community and a lab
environment where students receive the needed encouragement and support to succeed.
Second, I wish to thank the members of my PhD committee, Professor Madhav Badami,
Professor David Wachsmuth, and Professor Nancy Ross, for their support, guidance and invaluable
feedback. It was truly a pleasure to work with each of you! Additionally, I want to acknowledge
the hard work of Gladys Chan and Paula Domingues, who were very helpful during my studies,
as well as always providing a friendly face within the department. Lastly, thank you to the
remaining faculty members within the School of Urban Planning for their support and helpful
feedback. And of course, thanks to EMF staff, especially Shawn McCollum and Tony Fonsi, who
were always available to help with all sorts of computer issues.
Third, I must acknowledge that this research was supported by the Social Sciences and
Humanities Research Council of Canada, McGill Engineering Doctoral Awards, and a Schulich
Research Fellowship. I also wish to knowledge additional support I am thankful for receiving
during my studies, including the Transportation Association of Canada Foundation Scholarship
and the Graduate Excellence Scholarship. Additionally, my research was made possible by the

ii
following public transit agencies who shared their data for research purposes: Transport for
London, GO Transit, and Translink. I also wish to acknowledge the team that I worked with to
develop the McGill Travel Survey, in which I was able to add questions of interest for my
dissertation: Marie-Pier Veillette, Robbin Deboosere and Professir Kevin Manaugh.
Fourth, I wish to acknowledge my colleagues who I had the pleasure of working with over
the past few years. In particular, Dea van Lierop for being a friend, helpful resource, mentor, and
a pleasure to work with, and Geneviève Boisjoly; I am thankful for our friendship during the PhD
and our many collaborations over the years, and hopefully many more going forward. To the
students whom I worked with in TRAM over the years and my fellow PhD students, many thanks
for being wonderful co-workers and friends. Lastly, to all my colleagues that I have met at various
conferences or transport-related events, I am grateful for the network that I have developed and I
look forward to many future collaborations.
Lastly, I would like to thank my family for their continued support and encouragement.
And I would like to thank my partner Marek Brys who was by my side during this long journey.
His patience, eagerness to help, and words of encouragement were invaluable during the
completion of my dissertation. And of course, my dog Bart, I thank you for lying beside me through
hours of writing and for doing an excellent job at keeping me calm through some very long days
and nights.
Many others also share credit for making this dissertation possible, and I apologize to those
temporarily forgotten and not mentioned above.

iii
ABSTRACT
Customer satisfaction surveys are one of the most heavily utilized tools within the public transit
industry to gain insight into the perceptions, attitudes and behaviours of customers. The efficacy
of policies and service improvement strategies derived from satisfaction data are presently limited
by the methodologies that are used to analyze this data. The overarching goal of this dissertation
is to expand the understanding of public transit customer satisfaction through incorporating
personal, spatial and contextual factors. This research goal will be achieved through answering the
following research question: How can customer satisfaction data be effectively analyzed and
utilized to generate targeted service quality improvements? This dissertation consists of four
research objectives which are as follows:
1. To show differences in perceptions of service quality across different socioeconomic
neighbourhoods in a highly competitive and well-monitored transit market;
2. To develop a transit market segmentation approach that includes personal, spatial and
contextual factors;
3. To understand the extent to which transfers influence trip satisfaction;
4. To expand our understanding of how public transit performance measures can be
integrated into satisfaction analyses to better predict overall satisfaction.
The four research objectives each correspond to an analysis chapter comprising this manuscript-
based dissertation. These chapters build on one another, and collectively aim to advance existing
methods of analyzing customer satisfaction data for better knowledge of the transit market.
The first two chapters of this dissertation present spatial methods of analyzing customer
satisfaction data. Chapter two examines satisfaction with bus service across neighbourhoods of
varying socio-economic status in London, UK. This spatial method allows agencies to identify
areas for improvement at a more disaggregate level than previous research. The third chapter
presents a new market segmentation approach that incorporates spatial and contextual factors that
have not previously been incorporated into the practice of segmenting the transit market. This new
method is demonstrated using a sample of commuter rail users in the Greater Toronto and
Hamilton Area, Canada.
The remaining two chapters demonstrate how contextual and operational data can be
incorporated into satisfaction analyses. Chapter four explores the relationship between transferring

iv
and trip satisfaction using a survey of transit commuters to McGill University. In Chapter 5,
satisfaction levels among users of a local and a limited-stop bus service in Vancouver, Canada are
studied, while controlling for operational characteristics describing the service these users
experienced, such as crowding and on-time performance.
A concluding chapter consolidates the findings of the previous chapters and presents policy
and research implications to support a better understanding of customer satisfaction. More
specifically, this dissertation contributes to the knowledge in the following four ways:
Identifies important shortcomings regarding how customer satisfaction data is
analyzed;
Develops reproducible methodologies to both integrate spatial data into the analysis of
satisfaction levels, as well as to apply spatial analysis techniques to examine
satisfaction with service at a local scale (i.e. the route or neighbourhood level);
Demonstrates how detailed trip data can be applied to understand how specific service
characteristics influence satisfaction levels;
Shows how transit performance data can be integrated into satisfaction analyses to
provide a more complete understanding of passenger satisfaction levels.
As customers are the most important judges of service quality, this dissertation demonstrates how
transit agencies can more effectively analyze customer perceptions of service as stated in
satisfaction surveys and generate policies for service improvements that will have the strongest
impact on riders.

v
RÉSUMÉ
Les enquêtes de satisfaction des usagers sont un des outils les plus utilisés dans le secteur des
transports en commun pour mieux comprendre les perceptions, les attitudes et les comportements
des voyageurs. L'efficacité des politiques et des stratégies d'amélioration du service conçues à
partir des données de satisfaction est actuellement limitée par les méthodologies utilisées pour
analyser ces données. L'objectif général de cette thèse est d’obtenir une meilleure compréhension
de la satisfaction des usagers des transports en commun en intégrant des facteurs personnels,
spatiaux et contextuels. L’objectif de cette étude vise à répondre à la question suivante : Comment
analyser et utiliser efficacement les données relatives à la satisfaction des usagers pour développer
des améliorations ciblées de la qualité du service? Cette thèse s’articule autour des quatre objectifs
suivants :
1. Dévoiler les différences de perception relatives à la qualité du service entre des quartiers
avec différents profils socio-économiques, dans un secteur très concurrentiel et étroitement
réglementé ;
2. Développer une approche de segmentation du marché des transports en commun intégrant
des facteurs personnels, spatiaux et contextuels ;
3. Comprendre dans quelle mesure les correspondances influencent le niveau de satisfaction
du trajet ;
4. Obtenir une meilleure compréhension de la façon dont les mesures de performance des
transports en commun peuvent être intégrées à l’analyse de la satisfaction des usagers pour
aider à mieux comprendre la satisfaction globale.
Les quatre objectifs de recherche correspondent chacun à un chapitre d'analyse de la présente thèse.
Ces chapitres se complètent et visent collectivement à améliorer les méthodes d’analyse des
données relatives à la satisfaction des usagers actuellement en vigueur afin de permettre une
meilleure connaissance du secteur des transports en commun.
Les deux premiers chapitres de ce mémoire présentent des méthodes d'analyse spatiale
des données relatives à la satisfaction des usagers. Le deuxième chapitre examine la satisfaction à
l’égard du service de bus dans des quartiers aux profils socio-économiques variés, à Londres, au
Royaume-Uni. Cette méthode spatiale permet aux agences d'identifier les éléments à améliorer à
un niveau plus désagrégé que les études précédentes. Le troisième chapitre présente une nouvelle

vi
approche de segmentation du marché qui intègre des facteurs spatiaux et contextuels qui n’avaient
pas été incorporés auparavant dans la segmentation des usages des transports en commun. Cette
nouvelle méthode est illustrée à l'aide d'un échantillon des usagers du transport ferroviaire dans la
région du Grand Toronto et de Hamilton, au Canada.
Les deux chapitres suivants montrent comment il est possible d’intégrer des données
contextuelles et opérationnelles dans les analyses de satisfaction. Le quatrième chapitre explore la
relation entre les correspondances et la satisfaction du trajet en utilisant une enquête sur les
voyageurs qui utilisent le transport en commun pour se rendre à l’Université McGill. Dans le
chapitre 5, les niveaux de satisfaction des utilisateurs d’un service d’autobus local et d’un service
de bus express à arrêts limités à Vancouver, au Canada sont étudiés, tout en contrôlant les
caractéristiques opérationnelles décrivant le service que ces utilisateurs ont connu, telles que la
congestion et la ponctualité.
Le chapitre final regroupe les faits saillants des chapitres précédents et présente leurs
implications en termes de politiques et de recherche pour permettre une meilleure compréhension
de la satisfaction des usagers. Plus précisément, ce mémoire apporte de nouveaux éléments par
rapport aux connaissances préexistantes qui s’articulent autour des quatre points suivants:
Identifie des lacunes importantes dans la manière dont les données relatives à la
satisfaction des usagers sont actuellement analysées ;
Développe des méthodologies reproductibles pour intégrer les données spatiales dans
l’analyse des niveaux de satisfaction, ainsi que pour appliquer des techniques d’analyse
spatiale visant à examiner le niveau de satisfaction à l’égard du service à l’échelle locale
(c.-à-d. au niveau du trajet ou du quartier) ;
Démontre comment les données détaillées sur les trajets peuvent être utilisées pour
comprendre l’influence des caractéristiques spécifiques de service sur les niveaux de
satisfaction ;
Montre comment les données relatives à la performance du transport en commun peuvent
être intégrées aux analyses de satisfaction pour permettre une compréhension plus
complète des niveaux de satisfaction des usagers.
Dans la mesure où les usagers sont les meilleurs juges de la qualité du service, cette thèse montre
comment les agences de transport en commun peuvent analyser plus efficacement les perceptions

vii
des usagers vis-à-vis du service telles qu’exprimées dans les enquêtes de satisfaction afin
d’élaborer des politiques d'amélioration du service qui auront le plus d’impact sur les usagers.

viii
TABLE OF CONTENTS
ACKOWLEDGMENTS .................................................................................................................. i
ABSTRACT…………….. ............................................................................................................. iii
RÉSUMÉ………………… .................................................. ……………………………………..v
TABLE OF CONTENTS ............................................................................................................. viii
AUTHOR CONTRIBUTIONS .................................................................................................... xiii
PUBLICATION DETAILS AND PERMISSION ....................................................................... xiv
DISCLAIMER……………. ......................................................................................................... xv
CHAPTER 1: INTRODUCTION ................................................................................................... 1
1.1 Overview of chapter ......................................................................................................... 1
1.2 Understanding todays’ urban public transit market ......................................................... 2
1.3 Customer satisfaction in the transport literature .............................................................. 3
1.4 Defining customer loyalty ................................................................................................ 7
1.5 Customer satisfaction analysis techniques ....................................................................... 9
1.5.1 Determining the relative importance of various service attributes ........................... 9
1.5.2 Market segmentation ............................................................................................... 14
1.6 Research gaps ................................................................................................................. 19
1.7 Research objectives ........................................................................................................ 20
1.8 Dissertation structure and overview of chapters ............................................................ 21
CHAPTER 2: EVALUATING THE RELATIONSHIP BETWEEN SOCIALLY
(DIS)ADVANTAGED NEIGHBOURHOODS AND CUSTOMER SATISFACTION OF BUS
SERVICE IN LONDON, U.K. ..................................................................................................... 24
2.1 CHAPTER OVERVIEW ............................................................................................... 24
2.2 INTRODUCTION .......................................................................................................... 25
2.3 LITERATURE REVIEW ............................................................................................... 26
2.4 ANALYSIS .................................................................................................................... 29
2.4.1 Study area and survey overview ............................................................................. 29

ix
2.4.2 Social deprivation indicator .................................................................................... 31
2.4.3 Route level analysis ................................................................................................ 34
2.4.4 Factor analysis ........................................................................................................ 36
2.4.5 Individual Level Analysis ....................................................................................... 39
2.4.6 Multi-level regression models................................................................................. 42
2.5 DISCUSSION AND CONCLUSIONS .......................................................................... 50
CHAPTER 3: WHERE IS THE HAPPY TRANSIT RIDER? EVALUATING SATISFACTION
WITH REGIONAL RAIL SERVICE USING A SPATIAL SEGMENTATION APPROACH . 53
3.1 CHAPTER OVERVIEW ............................................................................................... 53
3.2 INTRODUCTION .......................................................................................................... 54
3.3 LITERATURE REVIEW ............................................................................................... 56
3.4 DATA ............................................................................................................................. 59
3.5 ANALYSIS .................................................................................................................... 63
3.5.1 Factor analysis ........................................................................................................ 64
3.5.2 Cluster analysis ....................................................................................................... 66
3.6 DISCUSSION AND CONCLUSIONS .......................................................................... 77
CHAPTER 4: TRANSFERRING MATTERS: AN ANALYSIS OF THE INFLUENCE OF
TRANSFERS ON TRIP SATISFACTION .................................................................................. 82
4.1 OVERVIEW OF CHAPTER ......................................................................................... 82
4.2 INTRODUCTION .......................................................................................................... 83
4.3 LITERATURE REVIEW ............................................................................................... 84
4.4 BACKGROUND AND DATA ...................................................................................... 87
4.5 METHODOLOGY ......................................................................................................... 90
4.6 RESULTS....................................................................................................................... 93
4.6.1 Descriptive statistics ............................................................................................... 93
4.6.2 Regression analysis ................................................................................................. 95

x
4.7 DISCUSSION OF RESULTS ...................................................................................... 100
4.8 CONCLUSIONS .......................................................................................................... 104
CHAPTER 5: ASSESSING OPERATION AND CUSTOMER PERCEPTION
CHARACTERISTICS OF HIGH FREQUENCY LOCAL AND LIMITED-STOP BUS
SERVICE IN VANCOUVER, CANADA ................................................................................. 107
5.1 CHAPTER OVERVIEW ............................................................................................. 107
5.2 INTRODUCTION ........................................................................................................ 108
5.3 LITERATURE REVIEW ............................................................................................. 109
5.4 STUDY CONTEXT ..................................................................................................... 112
5.5 ANALYSIS .................................................................................................................. 115
5.5.1 Operations data ..................................................................................................... 115
5.5.2 Customer satisfaction data .................................................................................... 116
5.5.3 Linking the two sources of data ............................................................................ 119
5.5.4 Overall satisfaction model .................................................................................... 120
5.6 DISCUSSION AND CONCLUSIONS ........................................................................ 123
CHAPTER 6: CONCLUSION .................................................................................................... 127
6.1 SUMMARY OF CHAPTERS ...................................................................................... 127
6.2 THEORETICAL AND METHODOLOGICAL CONTRIBUTIONS ......................... 130
6.3 FUTURE RESEARCH ................................................................................................ 134
6.4 CONCLUDING REMARKS ....................................................................................... 136
REFERENCES…………………………………………………………………………………138

xi
INDEX OF FIGURES
Figure 1: Hypothetical bivariate model of customer satisfaction ...................................................... 11
Figure 2: Hypothetical multiple regression analysis ......................................................................... 12
Figure 3: Hypothetical structural equation model ............................................................................. 13
Figure 4: Research overview and chapter objectives ........................................................................ 21
Figure 5: Average overall satisfaction of each bus route and level of neighbourhood social deprivation
of bus routes ............................................................................................................................... 34
Figure 6: Plot of the relationship between average overall bus route satisfaction and the social
deprivation indicator (statistically significant at 99% level) ...................................................... 35
Figure 7: Plot of the relationship between average overall bus route satisfaction and each variable of
the social deprivation indicator (statistical significance observed at the 99% confidence level for
income deprivation, immigration and unemployment, while median income was significant at
the 90% confidence level). ......................................................................................................... 35
Figure 8: Scatterplots of the relationship between the level of social deprivation of each bus route and
each factor component ................................................................................................................ 39
Figure 9: GO Transit train system map ............................................................................................. 60
Figure 10: Clusters derived from principle component analysis ....................................................... 67
Figure 11: Home location of users in clusters 1 - 4 ........................................................................... 67
Figure 12: Home location of users in clusters 5 -7, and an overview map of all users segmented by
cluster ......................................................................................................................................... 68
Figure 13: Summary of recommended policies and their expected impact on each cluster (hatching
symbology represents clusters with high proportion of low income individuals) ...................... 79
Figure 14: Map of the location of McGill University relative to the Montreal public transit network
.................................................................................................................................................... 89
Figure 15: Context map for routes 99 B-Line and 9 in Vancouver, Canada ................................... 114
Figure 16: Conceptual model of customer satisfaction and its determinants commonly used in market
segmentation studies ................................................................................................................. 133

xii
INDEX OF TABLES
Table 1: Average score for survey questions among different groups ......................................... 36
Table 2: Results from the Principle Component Analysis ............................................................ 38
Table 3: Average values of overall satisfaction and factor components by social deprivation
quintile ................................................................................................................................... 40
Table 4: Examining differences in the mean values among social deprivation quintiles using the
Tukey Test ............................................................................................................................. 41
Table 5: Description of multi-level model variables .................................................................... 44
Table 6: Multi-level logistic regression of overall satisfaction (7 and above) ............................. 45
Table 7: Multi-Level linear regression with each factor variable as the dependent variable ....... 49
Table 8: Results from the Principle Component Analysis ............................................................ 65
Table 9: Description of variables and summary statistics ............................................................ 92
Table 10: Evaluating satisfaction levels and trip characteristics by number of transfers and mode-
specific transfers .................................................................................................................... 94
Table 11: Statistical significance of difference in mean satisfaction levels of trips according to
number of transfers and mode-specific transfers, using a Chi-square test ............................ 95
Table 12: Satisfaction with last trip model ................................................................................... 98
Table 13: Satisfaction with last trip with mode-specific controls............................................... 100
Table 14: Descriptive statistics of operational characteristics of both routes ............................. 115
Table 15: Summary statistics of survey variables comparing Route 99 and 9 users .................. 118
Table 16: Predicting satisfaction with transit service ................................................................. 122

xiii
AUTHOR CONTRIBUTIONS
This dissertation consists of four manuscripts that have been submitted to peer-reviewed journals.
All manuscripts were completed with a co-author; details of author contribution are given below.
Chapter 2 “Evaluating the relationship between socially (dis)advantaged neighbourhoods and
customer satisfaction of bus service in London, U.K.” by Emily Grisé and Ahmed El-Geneidy.
Ahmed El-Geneidy contributed intellectually and provided comments and edits to the manuscript.
Emily Grisé was the primary author of the manuscript. She performed the analysis, interpretation
of the results and writing.
Chapter 3 “Where is the happy transit rider? Evaluating satisfaction with regional rail service
using a spatial segmentation approach” by Emily Grisé and Ahmed El-Geneidy. Ahmed El-
Geneidy contributed intellectually and provided comments and edits to the manuscript. Emily
Grisé was the primary author of the manuscript. She performed all of the analysis, interpretation
of the results and writing.
Chapter 4 “Transferring matters: An analysis of the influence of transfers on trip satisfaction” by
Emily Grisé and Ahmed El-Geneidy. Ahmed El-Geneidy contributed intellectually and provided
comments and edits to the manuscript. Emily Grisé was the primary author of the manuscript. She
performed all statistical analyses, interpretation of the results and writing of the manuscript.
Chapter 5 “Assessing operation and customer perception characteristics of high frequency local
and limited-stop bus service in Vancouver, Canada” by Emily Grisé and Ahmed El-Geneidy.
Ahmed El-Geneidy contributed intellectually and provided comments and edits to the manuscript.
Emily Grisé was the primary author of the manuscript. She performed all of the data manipulation
and statistical analysis, interpretation of the results and writing.

xiv
PUBLICATION DETAILS AND PERMISSION
Chapter 2 “Evaluating the relationship between socially (dis) advantaged neighbourhoods and
customer satisfaction of bus service in London, UK” is published in the Journal of Transport
Geography, Volume 58: 166-175, 2017 and is included with permission from Elsevier.
Chapter 3 “Where is the happy transit rider? Evaluating satisfaction with regional rail service
using a spatial segmentation approach” is published in Transportation Research Part A: Policy
and Practice, Volume 114, Part A: 84-96, 2018 and is included with permission from Elsevier.
Chapter 4 “Transferring matters: An analysis of the influence of transfers on trip satisfaction” has
been accepted for publication in the Transportation Research Record: Journal of the
Transportation Research Board.
Chapter 5 “Assessing operation and customer perception characteristics of high frequency local
and limited-stop bus service in Vancouver, Canada” is currently under review for publication in
the Journal of Public Transport: Planning and Operations.

xv
DISCLAIMER
While the research and analysis included in Chapters two, three, and five of this dissertation are
based on data obtained from the following public transit agencies TransLink (Vancouver, Canada),
Transport for London (London, United Kingdom), and Metrolinx (Toronto, Canada), the opinions
expressed in this dissertation do not represent the views of these agencies.

1
CHAPTER 1: INTRODUCTION
1.1 OVERVIEW OF CHAPTER
This dissertation proposes new non-traditional approaches to evaluate customer satisfaction data
collected by various public transit agencies. Public transit agencies around the world regularly
collect customer satisfaction data and generate reports that are commonly limited to summary
statistics on average satisfaction levels. The efficacy of policies and service improvement
strategies that are derived from data collected in customer satisfaction surveys are limited by the
methodologies that are used to analyze this data as well as the conceptualization of how satisfaction
data can be applied in practice to inform decision making. This dissertation will thoroughly explore
and critique previous research on customer satisfaction and propose new methods and techniques
for improving analyses generated from customer satisfaction data to derive better transport policies
and interventions.
This introductory chapter will begin by framing this dissertation in the context of today’s
urban public transit market, which is then followed by a discussion of three main themes:
Customer satisfaction in the transport literature
Customer satisfaction and its relation to customer loyalty
Customer satisfaction analysis techniques
The chapter will also discuss the gaps in knowledge that this dissertation aims to address, then
presents the overarching design of the research, including the principal goal of the dissertation,
and the main objectives and research questions. Lastly, this chapter concludes with a detailed
description of the subsequent chapters included in the dissertation.

2
1.2 UNDERSTANDING TODAYS’ URBAN PUBLIC TRANSIT MARKET
An affordable and efficient urban public transit system is essential to the economic development
of a city and the quality of life of its residents. In most major North American cities, during the
1990s and 2000s, public transit ridership had steadily increased in most cities (American Public
Transportation Association, 2010; El-Geneidy, Hourdos, & Horning, 2009) and then more
recently, many cities have seen their transit ridership plateau, if not decrease (Boisjoly et al., 2018;
Curry, 2016; Fitzsimmons, 2017; Levinson, 2017; Linton, 2016; Nelson & Weikel, 2016). Reasons
for declining ridership trends are related both to factors internal to an agency as well as external
factors. Internal factors include infrastructure owned and operated by transit agency, operations or
service delivery, and fare policies. External factors include, but are not limited to, gas prices,
economic vitality, modal competition (for example Uber, bicycle sharing or scooter-sharing), and
car ownership. Traditionally, modal competition was largely attributed to private automobile,
however in today’s transport market emerging transport technologies are likely influencing public
transit ridership, however the strength of this impact on ridership, and the direction of this
association remains relatively unknown due to a lack of available data on ridership (Henao &
Marshall, 2017; Shaheen, Totte, & Stocker, 2018).
Recent research has brought to light the importance of investing in transit operations as a
means of promoting growth in ridership, while limiting fare increases (Boisjoly et al., 2018).
Investments in operations can include improving coverage across the region, increasing service
frequency, and expanding hours of service. Although not studied in the above-mentioned article,
growth in public transit patronage can result from service reliability improvements, while it can
decay due to unreliable service (Bates, Polak, Jones, & Cook, 2001; Noland & Polak, 2002). In
response to the importance of reliability on customer satisfaction and retention, on-time
performance is a widely-used measure among transit agencies to monitor service reliability (Diab,

3
Badami, & El-Geneidy, 2015). In addition to an agency’s internal measurements of performance,
incorporating perceptions of customers is increasingly prevalent among transit agencies when
evaluating performance, as customers are the most important judges of service quality (Berry,
Zeithaml, & Parasuraman, 1990) and retaining satisfied customers is becoming a priority for
various agencies around the world due to various political and environmental reasons. Customer
satisfaction is a subjectively measured quality of service indicator, which is perceived as an
important determinant of a users’ future travel demand (Prioni & Hensher, 2000).
Ensuring rider satisfaction in today’s rapidly changing and highly competitive transport
market has led several public transit agencies to adopt marketing strategies from other fields. While
the main focus of public transit agencies is not to make a profit, fare revenue is a significant
component of the operating budget of transit agencies (Transit Cooperative Research Program,
1998), thus staying competitive in the transport market is critical for the financial viability of transit
agencies. Today, various public transit agencies are trying to apply market-oriented strategies to
learn more about the markets they serve and to better understand satisfaction and loyalty among
users.
1.3 CUSTOMER SATISFACTION IN THE TRANSPORT LITERATURE
The concept of satisfaction with travel originated from customer satisfaction research, which has
been a popular field of study in domains such as marketing (Fornell, Johnson, Anderson, Cha, &
Bryant, 1996). Given that trip satisfaction can be considered a type of customer satisfaction, it
often results from a commuter’s reaction to his or her experience with the service and to what
extent it meets their needs and/or expectations (Grigoroudis & Siskos, 2009), which can vary
depending on an individual’s attitudes, personality, and predispositions (Beirão & Cabral, 2007).
High customer satisfaction results when service performance meets or exceeds the customers’

4
expectations or desired quality of service. Delivering quality service means conforming to
customer expectations on a consistent basis (Lewis & Booms, 1983). While quality of service in
public transit reflects the passengers’ perception of transit performance, there is an underlying
assumption that there is a direct link between the actual service provided by the transit agency and
the customer’s perception of it (Friman & Fellesson, 2009).
Service quality is an elusive concept for agencies to measure. Perceived service quality,
and whether or not the service experienced by a user met their expectations, is a difficult concept
for agencies to measure, as a result of the three unique characteristics of service: intangibility,
heterogeneity (or nonstandardization), and inseparability (Parasuraman, Zeithaml, & Berry, 1985;
Zeithaml, 1981). The intangible nature of most services means that performance specifications or
indicators to monitor for uniform quality can rarely be set. In other words, there are many
characteristics of service quality that are intangible in nature, such as safety and comfort, which
are difficult for agencies to monitor and deliver consistently for users. Services are heterogeneous,
particularly those with a high dependency on personnel labour, resulting in service performance
that is highly variable, from day to day and operator to operator. Finally, delivery of service and
user participation in service are inseparable, meaning that participation of the individual, for
example arriving for the train on time, can impact the users’ experience of the service. The
complexity of service quality, and the series of observed and unobserved variables underlying it,
have resulted in a considerable number of studies presenting different techniques for developing a
stronger understanding of customers’ perceptions of service quality. These different methods are
discussed in further detail later in this chapter.
Understanding passenger perceptions of service and what makes a satisfied public transit
user has been the subject of a considerable amount of research (Andreassen, 1995; Friman, 2004;

5
Tyrinopoulos & Antoniou, 2008). Analysis of customer satisfaction data, often collected through
surveys, has been applied to identify the relative importance of service attributes, and their
influence on a users’ overall assessment of the service (de Oña, de Oña, Eboli, & Mazzulla, 2013;
Eboli & Mazzulla, 2015; Hensher, Stopher, & Bullock, 2003). van Lierop, Badami, and El-
Geneidy (2017) conducted a thorough review of customer satisfaction and loyalty literature to
identify which service attributes most commonly affect satisfaction in public transit. Before
discussing these identified service attributes, it is interesting to note the authors’ observation
regarding the overwhelming focus of the literature on satisfaction of bus users. The authors
postulate that this trend is a result of the low desirability of bus travel relative to rail. Nevertheless,
bus service is typically an integral part of the urban public transit network, or in some cases the
only mode of public transit available in smaller regions, and therefore satisfaction of bus service
is imperative for achieving ridership targets.
In van Lierop, Badami, and El-Geneidy’s (2017) review of the literature, the authors found
that the following attributes were most commonly found to influence customer satisfaction (listed
in order of most frequently identified in the literature): on-board cleanliness and comfort, the
behaviour and attitudes of the personnel, safety, punctuality and frequency of the service. On-
board cleanliness and comfort fall under the category of on-board experience. At its most basic
meaning, on-board experience is related to the comfort of the seats inside transit vehicles and the
cleanliness of vehicles (Lee, Jin, & Ji, 2009; Tyrinopoulos & Antoniou, 2008), but also includes
interactions with bus drivers and other personnel (Mouwen, 2015). Other elements of on-board
experience that have been found to impact satisfaction include perceptions of personal safety
during the trip (de Oña et al., 2013; Mouwen, 2015), in-vehicle crowding (Imaz, Habib, Shalaby,

6
& Idris, 2015), availability of seating (Mouwen, 2015), the ease of boarding and alighting1 the bus
(Verbich & El-Geneidy, 2016b), and on-board information (Weinstein, 2000). In terms of service
frequency, travel speed and on-time performance were found to be the most important
determinants of overall satisfaction in a robust study of bus, light rail, metro and commuter rail
services across different urban contexts in the Netherlands (Mouwen, 2015). This finding is echoed
by other studies indicating that satisfaction with frequency of service and on-time performance are
closely linked with overall satisfaction levels (de Oña et al., 2013; Tyrinopoulos & Antoniou,
2008; Weinstein, 2000).
Knowledge of the importance of service attributes to customers provides transit agencies
with an understanding of the key levers that can be used to sustain and/or increase satisfaction.
Improvements in passengers’ satisfaction are generally believed to result in numerous benefits.
These include: lower price elasticity2; lower employee turnover, since customers affect the
satisfaction of front-line personnel; reduction of failure costs, such as handling customer
complaints; and higher levels of consumer loyalty (Transportation Research Board, 1999). A
common definition of loyalty is a customer’s intention to use the service again in the future based
on previous experiences (ibid). While the concept of satisfaction has been well-established over
time, more recently there has been growing interest in better understanding what derives customer
loyalty (van Lierop et al., 2017). The next section of this review will discuss the concept of
customer loyalty in further detail and will provide an overview on how it is conceptualized and
evaluated in public transit research.
1 Commonly used term in the literature referring to customers exiting the bus 2 Low price elasticity in this context would mean that fare increases would have relativity little effect on
transit use, whereas high price elasticity would indicate a high level of sensitivity among users to fare
changes

7
1.4 DEFINING CUSTOMER LOYALTY
Increasing market share is a common goal among all transit agencies but is a significant challenge
for reasons such as competition from the private automobile or emerging modes of transport such
as shared economies (Uber, Lyft, Bicycle Sharing, Scooter sharing). Market research strategies,
tools and methods can help practitioners and planners learn more about the markets they serve
(Transportation Research Board, 1998). Growth in ridership is likely to come from two sources:
new riders, and increased frequency from existing users, while maintaining long-term rider
retention. Traditionally, marketing strategies have focused on attracting new riders to the system,
while devoting fewer resources towards retaining existing users (Webb, 2010). However, critics
of this strategy argue that it can be considered an underutilization of resources (Webb, 2010), since
the cost associated with acquiring new customers is generally much greater than retaining existing
ones (Transportation Research Board, 1998), and therefore resources should be dedicated towards
customer retention. Shifting the focus from attracting new riders to the system to increasing
retention and frequency of use among existing users requires an understanding of what derives
customer loyalty.
Allen (2004) contends there are three unified components related to a customer’s level of
loyalty: (i) intent to repurchase that product in the future (in this case, intent to continue to use
transit), (ii) likelihood to recommend the product (in this case, the transit service), and (iii) overall
customer satisfaction. For example, a person may use transit for their daily commute as they have
limited access to parking at their work, and if they are satisfied with the quality of service, they
may start using transit for other trip purposes and encourage friends or family to join them.
Furthermore, loyal customers are more likely to be understanding in the event of a service delay

8
or disruption compared to an irregular user. An irregular user who has a negative experience with
transit is more likely to defect3 and choose an alternative mode of transport in the future.
The operational definition of customer loyalty presented by Allen (2004), as well as other
researchers (Transportation Research Board, 1999; van Lierop & El-Geneidy, 2016a), in which a
loyal customer is defined by their intent of future use, willingness to recommend transit, and
overall satisfaction ratings, has generated a lively debate. Webb (2010) describes how there are
plenty of scenarios in which this logic does not hold, such as a satisfied user switches to a mode
that better suits their needs. Conversely, Fornell (1992) describes a situation in which a dissatisfied
customer remains loyal as a result of a lack of viable transport alternatives. For these reasons,
Webb (2010), considers “customer satisfaction to be a driver of customer loyalty, rather than part
of customer loyalty itself” (p.27). For this reason, many authors have accepted the operational
definition of loyalty based on (i) a customer’s intent to continue to use transit in the future, and (ii)
whether or not a transit user will recommend the service to others (Fornell, 1992; Minser & Webb,
2010; Wen, Lan, & Cheng, 2005; Zhao, Webb, & Shah, 2014). However, van Lierop and El-
Geneidy (2016a) claim there is an underlying assumption in the literature that transit riders will
continue to use transit in the future and will recommend the service to others when they are
satisfied with the service quality, which is evident among studies which concluded that customer
satisfaction positively influences customer loyalty (Minser & Webb, 2010; Zhao et al., 2014).
In sum, adopting either definition of loyalty places satisfaction with service quality as a
critical element for retaining transit riders. As public transit agencies worldwide face ongoing
challenges such as modal competition, novel strategies need to be developed in order to satisfy the
3 The event where someone is unsatisfied with the transit service and chooses a different travel mode or
simply switches modes of transport due to convivence offered by another mode is commonly referred to as
defect in the literature

9
needs of transit riders to ensure that riders remain loyal to the transit network. To do so, a range of
marketing strategies to understand and identify which aspects of public transit service strongly
influence customer satisfaction and loyalty are present in the literature and in practice. The
following section will discuss these various techniques for measuring satisfaction levels that are
prevalent in the literature.
1.5 CUSTOMER SATISFACTION ANALYSIS TECHNIQUES
1.5.1 Determining the relative importance of various service attributes
Customer satisfaction surveys are regarded as an effective means of understanding transit
ridership, and are therefore more frequently used by transit agencies to understand problems and
recommend improvements (van Lierop & El-Geneidy, 2015). Results of customer satisfaction
surveys can help transit agencies choose from a long list of service attributes to focus their
organization’s attention and resources according to how important each service characteristic is to
their customers. Therefore, a key goal within customer satisfaction studies is to determine which
service attributes drive customer satisfaction by determining the relative importance of various
service elements.
It is common practice for surveys to begin by asking respondents to rate their overall
satisfaction, typically on a Likert scale, which is generally followed by a range of questions
covering satisfaction levels with specific service attributes to obtain a comprehensive
understanding of how passengers perceive specific aspects of the service. While it can be clearly
identified which service aspects customers are unsatisfied with, ascertaining which attributes have
the highest influence on the global assessment of the service is less straightforward. Methods to
obtain importance ratings among service attributes is an important stream of research in customer
satisfaction.

10
The two overarching approaches to estimate the relative importance of various service
characteristics among transit customers are stated importance and derived importance. Stated
importance involves directly asking customers to rate each attribute on an importance scale,
whereas measuring derived importance requires statistically testing the strength of the relationship
between satisfaction with specific attributes and overall satisfaction. When comparing these
methods, the stated importance survey method is simpler and more intuitive. However, Weinstein
(2000) suggests there are several drawbacks associated with the stated importance method. First,
this method requires respondents to rate the level of importance and satisfaction for each service
attribute, significantly increasing the number of survey questions, which can impact the survey
drop-off rate and/or depress the response rate of the survey. Second, this method can yield
insufficient differentiation among mean importance ratings, as customers often state high
importance across all service attributes, even those which they had previously given little
consideration to. Furthermore, attributes may be rated as important, even though they have little
influence on a respondent’s overall satisfaction level.
de Oña, de Oña, and Calvo (2012) compared stated importance values with derived
importance values and discovered that respondents stated all service attributes with high
importance. However, deriving importance values yielded significantly lower importance among
select variables and differences in importance levels were distinguishable. Thus, derived
importance ratings appear to more accurately determine the importance of variables according to
users. The authors used a classification and regression tree (CART) method, which provides results
with “if-then” rules. For example, if frequency and space are perceived as poor and punctuality is
not good, then the overall evaluation of service will be poor. Although less commonly used in the
public transit literature, the main advantage of this method is that it does not require a pre-defined

11
underlying relationship between the dependent and independent variables presumed to affect
customer satisfaction.
The different types of statistical analyses employed for assessing the relative importance
among service attributes can vary considerably in complexity (Stuart, Mednick, & Bockman,
2000). The bivariate model (Figure 1) is the least complex and measures the strength of the
relationship between two variables, such as service frequency and customer satisfaction. Results
of this model provide a simple correlation between the two values. However, the main weakness
of this method is that it does not allow for the impact of more than one variable to be considered
at a time, and can provide an overly simplistic view of causality (Stuart et al., 2000).
Figure 1: Hypothetical bivariate model of customer satisfaction
A potential improvement on the bivariate model is multiple regression analysis, which
models the impact of different variables simultaneously, permitting more than one variable to have
direct association with another (Figure 2). This technique can be used to explain relationships
between variables included in the model. Multiple regression analysis is commonly preceded by a
factor analysis, which extracts a small number of factors or dimensions from a larger set of
intercorrelated variables. Factor analysis is often used in studies working with large survey data
(for example: Anable, 2005; Figler, Sriraj, Welch, & Yavuz, 2011; Tyrinopoulos & Antoniou,
2008), as it helps researchers to evaluate and identify patterns of how different variables relate to
one another, and therefore reduces the number of variables analyzed. The derived factors are then
used in a regression analysis to predict overall satisfaction and determine the relative importance

12
of each factor within the model. This step is imperative when working with satisfaction data, as
co-linearity among independent variables is often present and can bias model results.
Figure 2: Hypothetical multiple regression analysis
Weinstein (2000) compared the two methods above, using customer satisfaction data from
the San Francisco Bay Area. The simple bivariate-correlation approach offered key advantages
over the factor-regression analysis, for reasons related to the derivation of factors included in the
regression model. Specifically, the loss of detail of specific attributes within a factor that might be
of high interest to the transit agency and the exclusion of attributes that did not neatly factor with
other variables were identified as weaknesses of this approach. However, as mentioned previously,
bivariate analyses can be misleading as a result of the complex nature of customer satisfaction.
An important weakness of both the bivariate and multiple regression method is the need to
identify dependent and independent variables, meaning that no variables can be both dependent
and independent. Customer satisfaction is likely derived by a complex set of relationships where
some variables influence each other, which can in turn affect other measures (Stuart et al., 2000).
A more complex statistical model, structural equation model (SEM), is commonly used to evaluate
customer satisfaction. SEM can be used to examine a network of interrelated variables, where both
direct and indirect influences can be evaluated, allowing select variables to be both dependent and

13
independent. For example, as shown in Figure 3, satisfaction is hypothesized to be both an
independent and dependent variable. This means that service frequency, waiting time and
perceived value all influence satisfaction, and in turn satisfaction influences loyalty. This
conceptualization of satisfaction as a driver of loyalty has been discovered in previous SEM studies
(Lai & Chen, 2011; Minser & Webb, 2010; Zhao et al., 2014).
Figure 3: Hypothetical structural equation model
A structural model is constructed according to hypothesized relationships postulated from
previous literature and theory. For statistically significant findings, the strength of the relationship
indicates their importance. As Stuart et al. (2000) suggest, these findings can assist planners or
transit agencies to understand the expected impacts on satisfaction levels after implementing
different service improvements to estimate their potential return on investment. SEM is a complex
method that is less intuitive to interpret and communicate, however it is an important technique
for developing a better understanding of customer satisfaction and loyalty.
A study conducted by van Lierop and El-Geneidy (2016a) built upon the SEM technique
by combining it with a market segmentation analysis (a technique that will be discussed in detail
in the following section). The authors identified a gap common among SEM research in public
transit, namely that transit users in the study sample are treated as a homogenous group.

14
Accordingly, the authors segmented their sample of users according to car access and income
levels, before attempting to understand causes of satisfaction and loyalty. They identified three
categories of transit users: captive riders, choice riders and captive-by-choice riders. The authors
found differences in the relative influence of variables between the distinct groups of transit users,
indicating that factors influencing loyalty differ between these groups. This study exemplifies the
importance of acknowledging that users within the transit market are heterogenous, and
accordingly, system improvement strategies will impact groups of users differently as it is
implausible to expect that a single service or product will have universal appeal (Peter & Olson,
1999). The efficacy of calculating derived importance values to prioritize service improvements is
likely hindered by treating the transit market as one homogenous group, suggesting the need for
methods to segment the market prior to conducting analysis.
1.5.2 Market segmentation
The heterogeneity among individuals, the differences among attitudes towards transit, as well as
personal desires, requires the use of segmentation analyses that account for travelers’ attitudes and
behaviours (Beirão & Cabral, 2007). Segmentation has emerged as a key marketing tool. It is the
process of partitioning markets into groups of existing or potential customers with various
similarities who are likely to exhibit similar purchase behaviour (Weinstein, 2004). In the context
of transport planning, segmentation analyses are employed by transit agencies to identify different
types of users or non-users who have similar characteristics, and the resulting segments can serve
as a base for future marketing strategies. Many alternative methods for segmenting the transit
market exist and are continuously being expanded upon. Commonly used approaches to segment
the market stem from the consumer behaviour field, and are related to factors which impact

15
decision making, including demographics, benefits, motivations or needs, or purchasing habits
(Weinstein, 2004).
Two key approaches to market segmentation include: (i) a priori, whereby groups are
selected from a population in advance based on characteristics of interest (e.g. socio-demographic
characteristics or frequency of car use), and (ii) post hoc, whereby empirical investigation using
some form of multivariate statistical analysis (e.g. K-means cluster analysis) is used to identify
segments. The former segmentation method is driven by theory or assumptions that pre-defined
segments (e.g. women, seniors, irregular commuters, etc.) have different needs (dell’Olio, Ibeas,
& Cecín, 2010; Susilo & Cats, 2014; Tyrinopoulos & Antoniou, 2008; Verbich & El-Geneidy,
2016b). After the segments are identified, predictive methods such as regression analysis are often
used to describe the relationships between segment membership and sets of independent variables.
In the latter approach, cluster analyses are performed with the intent to uncover how a combination
of variables combine to identify unique segments from the sample population. Selection of these
variables is driven by previous research and the objective at hand, and may include attitudinal,
behavioural, or socio-demographic characteristics. What really separates this segmentation
approach from the former approach is that the segments are determined by the data, not the
researcher.
A classic example in the transport literature of an a priori segmentation of transit users is
the captive and choice rider dichotomy. This segmentation has been widely accepted in both
academic literature and professional transport planning practice (Beimborn, Greenwald, & Jin,
2003; Krizek & El-Geneidy, 2007; Polzin, Chu, & Rey, 2000; Zhao et al., 2014). Captive riders
are typically defined as individuals who have low income and either do not drive or do not have
access to a car, and therefore transit is their primary and only mode of transport. Choice users do

16
have access to alternative modes of transport but for certain purposes choose to take transit. The
proportion of choice and captive riders that comprise the ridership of a transit system can vary
significantly across regions, and choice riders have been found to outnumber captive riders in
American cities, including Chicago and Portland, that provide a variety of reliable transit services
(Krizek & El-Geneidy, 2007).
Losses in transit ridership are often attributed to choice riders, as these users are more
sensitive to service factors such as fare levels and service quality, and negative experiences with
transit can encourage choice riders to choose alternative mobility options that are available to them
(Krizek & El-Geneidy, 2007). On the other hand, captive riders are often perceived by transit
agencies as a key source of base ridership (Polzin et al., 2000). As a consequence, efforts are
commonly focused on increasing the retention of choice riders and attracting new riders to the
system, as it is assumed that these captive riders will always use transit despite the quality of the
service provided (Beimborn et al., 2003). However, this is a short-sighted policy, as captive users
will potentially transition away from transit captivity, either with age and life-cycle changes or by
acquiring the resources to purchase an automobile.
Two notable studies have expanded the dichotomy of captive and choice riders, using post
hoc segmentation techniques. Jacques, Manaugh, and El-Geneidy (2013) considered factors such
as the trip practicality (ratio between the travel time of transit compared to driving), trip
satisfaction, travel time, age, and whether this mode is used seasonally or year-round. The selection
of these variables is intended to allow for inference regarding some reasons behind an individual’s
mode choice for their daily commute to work or school. This yielded four segments:
‘convenience,’ which describes choice riders, ‘true captivity,’ which describes captive riders, and
‘utilitarian’ and ‘dedication’, which are neither clearly captive or choice riders. While captive and

17
choice riders were identified in this study, a better understanding of the reasons and motivations
underlying these users and subsequent policies targeted towards each group can be achieved
through more detailed data used to segment the market. More recently, van Lierop and El-Geneidy
(2017a) clustered transit users in Montreal and Vancouver according to socioeconomic details,
travel behaviour, opinions about transit, and satisfaction levels. This yielded multiple clusters,
which were then categorized as choice or captive users based on income and car access. However,
the authors identified a new group of transit users, ‘captive by choice riders,’ to reflect users who
are captive to transit because they do not have access to a car, but their income level does not
appear to be a barrier to car ownership compared to captive users. These findings allude to the
notion that important underlying factors impact decisions to take transit and are likely influential
for understanding satisfaction levels.
While the studies discussed above were conducted with specific objectives related to
understanding customer satisfaction, there is a considerable body of literature on market
segmentation techniques to understand travel behaviour that should be carefully considered for
better understanding satisfaction. The categorization of users according to socio-demographic
characteristics, transport use, and automobile ownership has been found to oversimplify the market
(Anable, 2005). Psychological factors, such as perceptions, attitudes and habits, have shown to be
important factors for understanding travel behavior (Fujii & Kitamura, 2003). Attitude-based
market segments are useful for identifying the potential ‘mode switchers’, as policy interventions
can be responsive to the different motivations and constraints of the subgroups (Anable, 2005).
While it is generally accepted that improvements in transit service quality and coverage will have
positive impacts on ridership, these improvements are not going to change the behaviour of all car
drivers (Jensen, 1999). Researchers such as Anable (2005) and Shiftan, Outwater, and Zhou (2008)

18
suggest that transit agencies and policy makers should focus efforts on segments of the market
who either (i) already use transit occasionally, to encourage them to use transit more frequently,
or (ii) express a willingness to reduce their car travel to begin to use transit. In sum, to promote
alternatives to the car, it is important not only to identify the socioeconomic and demographic
variables that could affect the decision-making processes of travelers, but also to understand the
psychological factors that influence mode choice and the individual’s willingness and ability to
change (Beirão & Cabral, 2008).
The real value of market segmentation for transit agencies lies in its ability to be translated
into achievable strategies to increase satisfaction levels among different groups. The present
technique of segmenting the transit market, whether post hoc or a priori, to the best of my
knowledge has yet to include auxiliary data into the segmentation of transit users related to where
users live or what transit services they most frequently use. Most previous studies relied on
analyzing the surveys and deriving the segmentations solely depending on the collected data with
little if no attention is given to local context or service levels being experienced by individuals. An
individual’s geographic location can help agencies understand how well the public transit network
is presently serving that individual, or what other transport options may be influencing their
decision to use transit or select an alternative means of travel. Furthermore, after identifying
distinct groups of users, without knowledge of what parts of the transit network these riders
regularly use, interventions for improved service quality targeted at these groups are likely to be
ineffective or must be implemented at a network level which would require extensive resources.
Lastly, it is important to acknowledge that the segmentation exercise is limited by the
availability and quality of data on the study population. Therefore, satisfaction surveys conducted
by transit agencies and various researchers should carefully consider these questions in the survey
19
design process. Survey design is an important element of customer satisfaction research and
warrants a discussion of the literature that has alluded to improving satisfaction surveys to better
understand the transit market.
1.6 RESEARCH GAPS
With increased understanding of the importance of satisfaction for future transit use, this
dissertation aims to build on the current practice of measuring customer satisfaction, by addressing
present gaps in the literature, lack of geographical context and lack actual service quality when
analyzing surveys. Incorporating spatial components to analysis of customer satisfaction surveys
can allow agencies to recommend targeted polices. This dissertation will present novel methods
for transit agencies to apply when analyzing their satisfaction data spatially to develop policies for
service improvements at a local scale, for example in a neighbourhood with a high proportion of
dissatisfied riders or along a transit corridor where high proportions of low income individuals are
dependent on transit service.
Researchers have suggested the importance of linking performance measures to customer
satisfaction ratings, due to the potential to better understand how customers react to the service
they experience. Despite the potential of such analyses, linking customer satisfaction data to transit
performance data has rarely been demonstrated either in the literature or in practice, due to the
complexity of linking these two datasets. In addition to this, there is also a lack of satisfaction
literature that has attempted to evaluate how satisfaction ratings are affected by trip characteristics,
such as number of transfers or service frequency and speed. The lack of knowledge regarding the
influence of trip characteristics and performance on customer satisfaction is an important gap in
our current understanding of public transit market.

20
1.7 RESEARCH OBJECTIVES
The overarching goal of this dissertation is: To expand the understanding of public transit
customer satisfaction through incorporating personal, spatial and contextual factors. This
research goal will be achieved through answering the research question that is driving this
dissertation: How can customer satisfaction data be effectively analyzed and utilized to generate
targeted service quality improvements? To answer this research question, four research
objectives have been identified, each corresponding to an analysis chapter comprising this
dissertation. The first two objectives of this study aim to better understand public transit customer
satisfaction through incorporating spatial factors into the analysis of customer satisfaction.
These two objectives are as follows:
1. To show differences in perceptions of service quality across different socioeconomic
neighbourhoods in a highly competitive and well-monitored transit market;
2. To develop a transit market segmentation approach that includes personal, spatial and
contextual factors.
The remaining two research objectives demonstrate the integration of contextual and
operational variables in understanding satisfaction:
3. To understand the extent to which transfers influence trip satisfaction;
4. To expand our understanding of how public transit performance measures can be integrated
into customer satisfaction analyses to better predict overall satisfaction.
Lastly, this research is conducted at a variety of levels of analysis, thus presenting insights into
customer satisfaction at multiple scales. The first level being the system level, the second level
is across a location, and the third is the route level. Figure 4 presents the overall structure of the
dissertation, including the research objective for each chapter, the sources of data used in each
chapter, key methods applied and the level of analysis.

21
Figure 4: Research overview and chapter objectives
1.8 DISSERTATION STRUCTURE AND OVERVIEW OF CHAPTERS
This doctoral thesis is structured according to McGill University’s guidelines for a manuscript-
based dissertation. It is comprised of four manuscripts that address the research objectives and
questions outlined in the previous section. Each chapter begins with a brief overview of the
research, and each manuscript contains an introduction, literature review, overview of
methodology, analysis, and conclusion. These four manuscripts are followed by a concluding
chapter, which consolidates the findings of the four manuscripts and discusses the knowledge
contributions of this research and directions for future research. Below, a brief introduction of each
chapter will commence.
Chapter 2 of this dissertation presents a spatial analysis of data from a large-scale
customer satisfaction survey collected by Transport for London, with the objective of examining

22
satisfaction with bus service across neighbourhoods of varying levels of socio-economic status. A
series of spatial and statistical analyses are conducted in order to model the relationship between
satisfaction and socio-economic status of the area in which a bus route operates. Based on the
model results, the study concludes by suggesting recommendations for the monitoring of service
quality that have potential for reducing inequalities in service delivery across a public transit
network. Furthermore, this method can be reproduced by public transit agencies wishing to identify
neighbourhoods or areas across a region where customers are noticeably less satisfied with overall
service quality, or with certain service attributes, relative to other regions.
In Chapter 3, a second methodology designed to use customer satisfaction data spatially
is presented. This chapter builds off the present method of segmenting the public transit market,
by incorporating spatial and contextual factors into the exercise of identifying different groups of
riders present in the transport market. To demonstrate this new market segmentation approach,
customer satisfaction survey data collected by Metrolinx of commuter train users in the Greater
Toronto and Hamilton Area is applied. The study findings demonstrate that by introducing spatial
data into the segmentation of transit riders, policies can be developed in a way that transit agencies
can effectively prioritize targeted service improvements at a local scale. Applying satisfaction data
in this way is particularly important, as transit agencies have limited resources available for these
sorts of service improvements.
Following the demonstration of spatial methods of analyzing satisfaction data, the
following two empirical studies aim to reveal the value of including operations and contextual
variables regarding the type of service experienced and service performance into the understanding
of trip satisfaction. Chapter 4 investigates the impact of transferring on trip satisfaction. For this
analysis, data collected from the McGill Transport Study was applied, as this survey uniquely

23
captured4 respondents who used any public transit mode that was available in Montreal at the time
of the survey: bus, metro and commuter rail. The survey was designed to ask each commuter about
their overall trip satisfaction, and satisfaction with various service attributes, as well as to provide
details regarding the transit mode(s) used to complete their trip as well as the number of routes
taken on each mode. This study demonstrates how collecting trip details that are not traditionally
asked in satisfaction surveys, such as mode(s) taken, is beneficial for agencies to better understand
what is influencing riders’ satisfaction.
Chapter 5 demonstrates how automatically collected operations data can be utilized in the
analysis of customer satisfaction. This chapter presents a case study of a high-frequency bus
corridor in Vancouver, Canada, where both a local bus service and a limited-stop bus service
operate in parallel to serve the high passenger demand. Satisfaction levels among local and limited-
stop bus users are evaluated while controlling for the service characteristics these users have
experienced. This study demonstrates how operations data can provide greater insight into how
customers perceive the quality of service that they experience.
Finally, Chapter 6 summarizes the findings of each manuscript and contextualizes them
within the overall goal of this research. This chapter concludes by discussing the policy relevance
of this research to public transit agencies, how this research contributes to the knowledge of
customer satisfaction and concludes by offering directions for future research.
4 This is unique because for example in Montreal, the Société de transport de Montréal would collect customer
satisfaction surveys focusing on their customer’s use of the bus and metro, while Exo would collect satisfaction
surveys on their commuter rail and regional bus riders. Thus, limiting the knowledge of a commuters’ full transit trip
if each respective survey only considers the transit service that it operates.

24
CHAPTER 2: EVALUATING THE RELATIONSHIP BETWEEN SOCIALLY
(DIS)ADVANTAGED NEIGHBOURHOODS AND CUSTOMER
SATISFACTION OF BUS SERVICE IN LONDON, U.K.
2.1 CHAPTER OVERVIEW
Ensuring that public transit users are satisfied with the service they experience is a common goal
among public transit agencies worldwide. Customer satisfaction surveys are predominantly used
to monitor customer perceptions of service quality and to determine the relative influence of
service attributes on a customer’s overall assessment of the service. While knowledge of these
studies has brought light to the key drivers of satisfaction and loyalty, an important application of
satisfaction data remains relatively unexplored in the literature. This application being the use of
spatial methods to analyze satisfaction data, with the goal of linking satisfaction measures with
service delivery. Therefore, this chapter presents a new method to spatially evaluate customer
satisfaction survey data through examining satisfaction with bus service across neighbourhoods of
varying levels of socio-economic status (SES). Using customer satisfaction survey data collected
by Transport for London between 2010 and 2015, multi-level regression modeling is used to
estimate the relationship between overall satisfaction and social deprivation of the area in which
bus routes were operating. The results indicate lower levels of satisfaction along routes serving
low SES neighbourhoods, which appears to be attributed to (1) low satisfaction with service
characteristics related to an individual’s experience and quality of the bus and (2) conditions of
the bus stop and shelter. Findings from this empirical analysis show the importance of including
cleanliness and bus internal quality as one of the performance indicators when contracting bus
services, to ensure that all customers receive the same quality of service in the region regardless
of their SES.

25
2.2 INTRODUCTION
An affordable and efficient urban public transit system is essential to the economic development
of a city and the social quality of life of its residents. The success of a public transit agency largely
depends on the number of satisfied passengers using the system who will continue to use it in the
future (de Oña et al., 2013). As a means of attracting and retaining ridership levels, public transit
agencies have placed increasing importance on improving service quality (de Oña et al., 2013).
Service quality is related to a series of attributes describing the public transit service, such as
reliability, accessibility, safety and travel time. While most public transit agencies have internal
measurements of performance such as operating efficiency, on-time performance and service
quality, the customer’s point of view is particularly relevant for evaluating performance (Eboli &
Mazzulla, 2011), as customers are the most important judges of service quality (Berry et al., 1990).
Nevertheless it is important to note that some disconnect might exist between customers’
perceptions of service and agencies' service delivery (Diab et al., 2015).
To monitor customer perceptions of public transit service quality, customer satisfaction
surveys are used to understand passengers’ perceptions about each attribute characterizing the
service, and their relative influence on the global assessment of service (de Oña et al., 2013). In
order to design appropriate transport strategies that can improve customer satisfactions with
service quality, considerable research has been conducted to identify which attributes have the
strongest influence on the overall assessment of service quality (de Oña et al., 2013; Eboli &
Mazzulla, 2015; Hensher et al., 2003).
High levels of customer satisfaction do not necessarily mean that the public transit network
is an objectively better system, rather satisfaction is a relative concept that is based on expectations
(Friman & Fellesson, 2009). Moreover, variations in satisfaction with bus service in a region can
be used to assess differences in the levels of service being delivered to every neighborhood

26
especially in regions where multiple transit operators are providing these services. This study
presents a new method to spatially evaluate customer satisfaction survey data through examining
satisfaction with bus service across neighbourhoods of varying levels of socio-economic status
(SES). The central question driving this research is whether there are discernable differences in
the quality of bus service provided in areas of higher and lower SES in the Greater London Area,
UK. This study evaluates the relationship between levels of customer satisfaction among users of
bus service and the level of social deprivation of the neighbourhood the route is serving, using data
collected from a large-scale bus customer satisfaction survey conducted by Transport for London
(TfL). Results of this study are intended to provide planners, engineers and policy makers with a
better understanding of how public transit customers perceive service across a network (spatially)
in order to identify areas of improvement to ensure that quality service is experienced by all
customers across all neighborhoods in a region. To our knowledge, this is the first paper to spatially
model customer satisfaction among bus users and combine that with an equity analysis at a
neighborhood level to provide guidance for a better public policy.
The paper begins with a review of the relevant literature related to indicators of service
quality and customer satisfaction. The next section introduces the study area and data used. This
is followed by an exploratory analysis of the relationship between social deprivation and overall
satisfaction and satisfaction with factors of relevant service attributes which are derived using
Principle Component Analysis. Next, multi-level regression models are constructed to predict
satisfaction. Lastly, the paper concludes with a discussion of the findings.
2.3 LITERATURE REVIEW
The rising cost of providing a high quality public transit service generates conflicting goals for
public transit agencies who must balance economic efficiency and ridership targets with service

27
need and equity (Murray & Davis, 2001), which can be viewed as opposing public transit goals.
Walker (2008) classifies these opposing goals as first a largely economically driven goal for
increased patronage and second a goal for increased equitable outcomes, or increased social
inclusion, by increasing coverage of service for existing public transit users regardless of the
implications for ridership or profitability of the service. Equity in public transit research is largely
related to the distibution of transport supply, and the corresponding benefits that the transport
system offers to different populations (Jones & Lucas, 2012). There have been several studies
assessing the distribution of public transit service in a region (Foth, Manaugh, & El-Geneidy, 2013;
Legrain, Buliung, & El-Geneidy, 2016; Martens, Golub, & Robinson, 2012). These studies use
accessibility as a performance measure, referring to the ease of reaching destinations with public
transit (Hansen, 1959). While these studies evaluate equity from the public transit provision side,
there appears to be a gap in the literature related to assessing the quality of service provided across
a region, particularly the assessment of customer perceptions of service being provided across a
network.
Customer satisfaction is a subjectively measured quality of service indicator, which is
perceived as an important determinant of a users’ travel demand (Prioni & Hensher, 2000).
Customer satisfaction generally results from a commuter’s reaction to his or her experience with
the service and to what extent it meets their needs and/or expectations (Grigoroudis & Siskos,
2009). Improvements in passengers’ satisfaction is generally associated with higher levels of
consumer loyalty (S. O. Olsen, 2007), where loyal customers are more likely to continue to use
the service. A customer’s satisfaction with public transit is derived from a range of factors, from
objective performance characteristics to personal characteristics including socio-demographics,
personal preferences and habits (Diab et al., 2015). Understanding passengers’ perception of

28
service and what makes a satisfied public transit user has been the subject of a considerable amount
of research (Andreassen, 1995; Friman, 2004; Tyrinopoulos & Antoniou, 2008). Furthermore,
analysis of customer satisfaction data has been applied to identify the relative importance of service
attributes, and their influence on a users’ overall assessment of the service (de Oña et al., 2013;
Eboli & Mazzulla, 2015; Hensher et al., 2003). However, research indicates that the perception of
quality and the relative importance of service attributes vary among groups of users (dell’Olio et
al., 2010).
Acknowledging that there are different groups who use transit is important in
understanding the causes of satisfaction and how individual needs and expectations vary (Beirão
& Cabral, 2007; Bordagaray, dell'Olio, Ibeas, & Cecín, 2014; dell’Olio et al., 2010). This finding
has given way for studies to examine customer satisfaction data among different types of users.
van Lierop and El-Geneidy (2016b) used a transit market segmentation approach to examine the
causes of satisfaction and loyalty for each segment of riders, to derive specific strategies for each
type of transit user. Tyrinopoulos and Antoniou (2008) segmented respondents by their sex to
evaluate differences among perceptions and the relative importance of service attributes between
these groups. (De Ona, de Oña, Eboli, & Mazzulla, 2015) applied a classification and regression
tree approach to analyze satisfaction data of a suburban rail service among categorized types of
users (i.e. the day of travel, frequency of use, and time of travel during the day), and found
preferences and importance of service aspects to vary among these different groups of users.
Lastly, Verbich and El-Geneidy (2016a) modeled satisfaction of public transit passengers with
various encumberments or physical disabilities, to understand how these users value different
service attributes of the bus compared to other types of users. Despite the recent work being
conducted on different groups of public transit users, the literature available on customer
29
perceptions of service among segmented populations remains limited. Furthermore, to the author’s
knowledge, no studies have attempted to spatially explore the variation in customer satisfaction
levels. This study presents a new method of examining data from a large-scale customer
satisfaction survey, to understand how passengers perceive the quality of public transit service
across a bus network that is serving different neighborhoods with high variation in socioeconomic
status.
2.4 ANALYSIS
2.4.1 Study area and survey overview
Public transit service in the Greater London, UK area is provided by Transport for London (TfL),
and is managed by London Buses. TfL manages one of the worlds’ largest bus networks, with over
675 bus routes, and is ranked as the top city in the world for its size, frequency, reliability and
accessibility (Begg, 2013). London Buses are operated under contracts with private operators,
where contracts are awarded on a competitive basis. Minimum performance standards with respect
to the quality of service are set, and contract payments are related to the mileage operated and
service reliability, while contracts can be terminated as a result of poor performance (Transport
for London, 2015). Furthermore, London Buses have been conducting customer satisfaction
surveys since 1997 in order to monitor customer satisfaction with the quality of services provided
and to identify areas for improvement (Transport for London, 2015). Surveys are conducted
through face-to-face interviews with passengers alighting from buses. After a person alights the
bus they are approached by a TfL representative who conducts the survey with them. Survey
questions are related to the bus journey that a person just made, and include questions related to
the presence of a bus shelter available at the bus stop they boarded at, their journey time in minutes
and type of fare payment used. Customers are then asked a series of satisfaction questions, ranging

30
from their overall satisfaction with their bus journey to satisfaction with specific elements of their
journey, such as information provided on the bus, safety and security, service reliability and
waiting time. For customers that were unsatisfied with an element of their trip (rating of 6 or less),
interviewers were instructed to ask follow-up questions regarding their low satisfaction with that
service attribute. Furthermore, survey respondents were asked for a range of personal
characteristics, such as their gender, ethnicity, age and familiarity with that particular bus trip.
The initial dataset consisted of 65,506 survey responses collected between 2010 and 2015.
We included only respondents within the ages of 20 and 64 years old, which reduced the dataset
to 48,344 responses. We then limited responses to individuals who were taking the bus for a
commuting purpose (categorized as to/from work, employer’s business or education and personal
business), which reduced the dataset to 28,619 responses. Responses were limited to adults
commuting for the purpose of work or education as these trips represent the majority of the users
and to focus the analysis on individuals with regular travel behavior, other groups not included
have special needs and require a different approach in analysis. Further, we removed respondents
who specified a disability, or riders who were encumbered with any of the following items on their
bus trip: suitcase/heavy luggage and/or large awkward item, shopping bags and/or shopping
trolley, or a small child/baby in arms and/or a baby buggy/pushchair/pram. ‘Disabled riders’ and
‘encumbered riders’ were excluded from this analysis as a previous study found that riders with
encumbrances or disabilities value different features of the bus service when compared to other
groups of riders (Verbich & El-Geneidy, 2016a). Finally, 17,516 individual responses remained
for further analysis after the removal of surveys with missing responses to questions of interest.
The relationship between customer satisfaction and social deprivation was first explored
by evaluating the average overall satisfaction scores and the social deprivation indicator of each

31
route. Overall satisfaction was evaluated by asking survey respondents: “Thinking about this
particular bus journey you have just made, starting at the bus stop, how satisfied are you on a scale
of 0 to 10 (where 10 is extremely satisfied and 0 is extremely dissatisfied) with the overall service
you experienced today?” These surveys were conducted between the years 2010 and 2015, and
were administered by trained interviewers as intercept interviews as passengers alighted a bus
operating in the Greater London Area. Average satisfaction for each bus route was calculated from
individual survey responses, if more than 30 complete survey responses were available for that
route to ensure stability in the variance between responses at the route level. This resulted in 198
routes with which to evaluate average satisfaction at the route level. Next, we develop an indicator
of the level of social deprivation for the neighbourhood the route serves.
2.4.2 Social deprivation indicator
The indicator was developed to measure the level of social deprivation of the area in which every
bus route operated. The indicator is comprised of the following four demographic variables and
data sources:
Percent of the population born outside of the United Kingdom (Census, 2011)
Percent of residents that are unemployed and actively seeking work, excluding students
(Census 2011)
Total median annual household income (Greater London Authority, 2011)
Percent of the population living in deprived households reliant on means tested benefits
(Department for Communities and Local Government, 2011)
These variables have commonly been used to identify socially vulnerable populations in the UK
(Church, Frost, & Sullivan, 2000; Wu & Hine, 2003). For this study, the variables were selected
to best identify neighbourhoods with high proportions of individuals of higher social disadvantage

32
in the UK. However, through the application of aggregate census data, it is important to cautiously
interpret the findings, as not everyone who is socially deprived necessarily lives in an area
classified as more socially deprived, or similarly not everyone who lives in a more socially
deprived area is deprived (Townsend, Phillimore, & Beattie, 1998).
In order to generate an index from these four variables, each of the variables was
standardized, equally weighted and summed to create the social deprivation indicator value, which
was similar to a method employed by (El-Geneidy et al., 2016; Foth et al., 2013; Sánchez-
Cantalejo, Ocana-Riola, & Fernández-Ajuria, 2008). Note, median income was inverted to capture
the relation between social deprivation and income. The unit of analysis is the Middle Super Output
Area (MSOA) level (equivalent to North American census tract), which are generally comprised
of a population between 5,000 and 15,000, representing between 2,000 and 6,000 households
(Office for National Statistics, 2015). There are 982 MSOA units within the Greater London Area.
Using the data described above for each MSOA, the social deprivation indicator was calculated
for each MSOA. Using this approach, we identified socially disadvantaged areas that are
predominantly characterized by foreign-born residents, high unemployment, low income, and
households dependent on social assistance.
To determine the level of social deprivation associated with each bus route, a network of
all TfL bus routes was created within a Geographic Information System and the bus routes were
intersected with the MSOAs. In most cases the bus route intersected multiple MSOAs, so in that
case a weighted average of each MSOAs’ deprivation indicator was used based on the proportional
length of the route segment within the MSOA to the total route length. Although London has
become more socially segregated at the micro scale (Hamnett, 2003) and variation in social

33
deprivation may exist along the bus route, applying a weighted average provides an estimate of
the overall SES of the neighbourhood the route is serving.
After calculating the social deprivation indicator of each route, we mapped the average
overall satisfaction and provided a visual comparison with the route-level social indicator, as
shown in Figure 5. By examining Figure 5, a pattern appears to emerge between social deprivation
and route-level satisfaction. Namely, a strong inverse relationship between overall customer
satisfaction and social deprivation can be seen in Eastern London, specifically adjacent to the River
Thames. North of the River Thames, we see bus routes with low overall satisfaction, which are
operating in boroughs of higher social deprivation, while we see an opposite relationship in eastern
boroughs located south of the River Thames. To ascertain the inverse relationship between route-
level satisfaction and social deprivation, we applied further statistical methods that are presented
and discussed below.

34
Figure 5: Average overall satisfaction of each bus route and level of neighbourhood social
deprivation of bus routes
2.4.3 Route level analysis
A scatterplot of the relationship between average route satisfaction and social deprivation is
displayed in Figure 6, while four scatterplots present the relationship between average overall route
satisfaction and each of the variables that comprise the social deprivation indicator in Figure 7.
The main finding from these plots is that route-level satisfaction decreases in more socially
deprived neighborhoods.

35
Figure 6: Plot of the relationship between average overall bus route satisfaction and the social
deprivation indicator (statistically significant at 99% level)
Figure 7: Plot of the relationship between average overall bus route satisfaction and each variable
of the social deprivation indicator (statistical significance observed at the 99% confidence level
for income deprivation, immigration and unemployment, while median income was significant at
the 90% confidence level).

36
Table 1 reports the mean value of satisfaction among every route serving certain socioeconomic
neighborhoods.
Table 1: Average score for survey questions among different groups
Survey Question Social Deprivation Quintile
Least deprived (1) Most deprived (5)
1 2 3 4 5 Average
Satisfaction with bus stop and shelter where you caught your bus
Personal safety 8.4 8.4 8.4 8.3 8.3 8.3
Information provided 8 8 8 8 8 8.0
Freedom from litter 8.2 8 8 7.9 7.8 8.0
Cleanliness 8.3 8.3 8.2 8.1 8.1 8.2
State of repair 8.4 8.3 8.3 8.2 8.2 8.3
Satisfaction with the bus you have just travelled on
Information provided (exterior of bus) 8.5 8.4 8.4 8.3 8.4 8.4
Information provided (interior of bus) 8.3 8.2 8.1 8.1 8.1 8.2
Cleanliness (exterior) 8.4 8.4 8.3 8.2 8.2 8.3
Cleanliness (interior) 8.2 8 7.9 7.8 7.7 7.9
State of repair (bus exterior) 8.5 8.4 8.4 8.3 8.3 8.4
State of repair (bus interior) 8.4 8.3 8.2 8.1 8.1 8.2
Comfort 8.2 8.1 8.1 8.1 8 8.1
Personal safety 8.7 8.6 8.6 8.5 8.5 8.6
Driver's behaviour and attitude 8.6 8.5 8.5 8.4 8.5 8.5
Length of time waited for the bus 8 7.9 7.9 7.8 7.7 7.9
Length of journey time 8.4 8.3 8.3 8.2 8.2 8.3
Ease of getting on and off the bus 8.6 8.6 8.5 8.4 8.4 8.5
Level of crowding 8.1 8 7.9 7.9 7.7 7.9
Smoothness and freedom from jolting 8.2 8.1 8.1 8 8.1 8.1
Reliability* 7.8 7.9 7.8 7.8 7.7 7.8
*Respondents were asked to reflect on this and recent journeys on that bus
2.4.4 Factor analysis
In addition to evaluating overall customer satisfaction, other survey questions related to different
attributes of the service were considered in this analysis, such as comfort, safety, service reliability
and travel time. Given the volume of questions related to satisfaction of various service
characteristics that were asked, and the relatively high correlation among the responses, Principle

37
Component Analysis (PCA) was used to derive factors of related responses, which was a similar
approach to previous studies using large survey data (Figler et al., 2011; Tyrinopoulos & Antoniou,
2008; Verbich & El-Geneidy, 2016a). By means of the PCA, three component factors were
identified from 17,516 survey responses. Table 2 presents the three factor components, including
the questions that comprise each component, the factor loadings of each question and the given
name of each factor component. Similar to the interpretation of a correlation coefficient, a factor
loading that is closer in value to 1 indicates a stronger relationship between the attribute and the
factor variable as a whole (Figler et al., 2011).
The first component deals with satisfaction questions related to the quality and cleanliness
of the bus (interior and exterior of bus) and on-board comfort and safety. The second component
focuses on satisfaction with waiting and journey time, reliability, crowding and driver’s behaviour.
The third component pertains to the appearance, safety and information provided at the bus stop
and/or shelter.
Figure 8 displays the relationship between social deprivation and average satisfaction with
each factor component, at the route level. Statistically significant and negative relationships are
observed between social deprivation and satisfaction with the on-board experience and interior of
the bus (Factor 1) and satisfaction with the bus stop and shelter (Factor 3), at the 99% confidence
level. However, no significant relationship is observed between satisfaction with the performance
and service quality of the trip (Factor 2) and social deprivation. Put simply, the discrepancy of
route-level satisfaction appears to be attributed to lower levels of satisfaction with service features
related to the vehicles and bus stop facilities in more socially deprived neighbourhoods. Next, we
further explore this relationship, by disaggregating users’ satisfaction and evaluating individual
responses regarding satisfaction of the route the user took.

38
Table 2: Results from the Principle Component Analysis
Component Survey Question Loading
1. 1. Satisfaction with the
on-board experience
and interior of the bus
Satisfaction with the state of repair of the inside of the bus .738
Satisfaction with the cleanliness and freedom from litter
inside the bus .729
Satisfaction with the cleanliness and freedom from graffiti of
the outside of the bus .642
Satisfaction with the information provided on the outside of
the bus .637
Satisfaction with your level of comfort inside the bus .589
Satisfaction with your personal safety during the bus journey .576
Satisfaction with the notices and other information provided
inside the bus .560
Satisfaction with ease of getting on and off the bus .518
2. Satisfaction with the
performance and
service quality of the
trip
Satisfaction with length of time waited .715
Satisfaction with reliability of present and recent trips on
current bus route .699
Satisfaction with the length of time for the bus journey .654
Satisfaction with the level of crowding inside the bus .592
Satisfaction with the smoothness and freedom from jolting
during your journey .562
Satisfaction with driver's behaviour and attitude towards you .506
3. Satisfaction with the
bus stop and shelter
Satisfaction with the cleanliness and freedom from litter at
the stop/shelter .764
Satisfaction with the freedom from graffiti at the stop/shelter .732
Satisfaction with the state of repair at the stop/shelter .693
Satisfaction with personal safety at the stop/shelter .589
Satisfaction with the information provided at the Stop/shelter .516

39
Figure 8: Scatterplots of the relationship between the level of social deprivation of each bus route
and each factor component
2.4.5 Individual Level Analysis
Individual satisfaction responses were evaluated to more accurately estimate variation in customer
satisfaction levels across the bus network. This resulted in 17,516 unique responses from 461 bus
routes. To evaluate variation among user satisfaction of each route, we segmented the routes by
quintiles based on the social deprivation indicator of the route the user alighted from, where each
quintile contains 20% of the bus routes in the data. Using the segmented responses by deprivation
quintile, averages of overall satisfaction and satisfaction with each factor component were
computed and are presented in Table 3. The differences in the mean values between quintiles were

40
evaluated to determine statistical significance of observed differences and are presented in Table
4. The level of significance between means was calculated using a one-way ANOVA with post
hoc Tukey test.
The average overall satisfaction of all routes is 8.13 out of 10, however by examining the
mean values of each social deprivation quintile, average overall satisfaction is highest among
routes in the least socially deprived quintiles. Noting the statistically significant differences, the
mean overall satisfaction of quintile 5 (the most deprived) is lower than quintile 1 (the least
deprived) by 0.19. Furthermore, quintile 5 is 0.13 and 0.12 lower than quintiles 2 and 3,
respectively.
Table 3: Average values of overall satisfaction and factor components by social deprivation
quintile
Least Deprived (1) -- Most Deprived (5)
Variable Variable Description Average 1 2 3 4 5
Average overall
bus route
satisfaction
Satisfaction with the
overall service you
experienced today
8.131 8.233 8.165 8.160 8.088 8.039
Factor 1 Satisfaction with the
on-board experience
and interior of the bus
0.001 0.114 0.037 0.012 -0.060 -0.060
Factor 2 Satisfaction with the
performance and
service quality of the
trip
0.000 0.042 0.005 -0.008 -0.013 -0.007
Factor 3 Satisfaction with the
bus stop and shelter
0.000 0.059 0.036 0.006 -0.033 -0.049

41
Table 4: Examining differences in the mean values among social deprivation quintiles using the
Tukey Test
Average overall
satisfaction
Satisfaction with
the on-board
experience and
interior of the bus
Satisfaction with
the performance
and service
quality of the trip
Satisfaction with
the bus stop and
shelter
Deprivation
Quintiles Difference
P-
Value Difference
P-
Value Difference
P-
Value Difference
P-
Value
5-1 -0.194** 0.000 -0.174** 0.000 -0.049 0.381 -0.109** 0.001
5-2 -0.126* 0.014 -0.097** 0.000 -0.012 0.988 -0.085** 0.003
5-3 -0.121* 0.016 -0.071* 0.017 0.001 1.000 -0.055 0.118
5-4 -0.049 0.732 0.000 1.000 0.006 0.999 -0.016 0.958
**Significant difference at 99% confidence level
*Significant difference at the 95% confidence level
With regards to the relationship between satisfaction with each factor and social
deprivation, we find that factors 1 and 3 (on-board experience and interior of the bus and quality
of the bus stop and shelter) react similarly to overall satisfaction. Differences among mean values
for satisfaction with the on-board experience and interior of the bus revealed statistically
significant lower mean values of 0.17, 0.10 and 0.07 in quintiles 1, 2 and 3 compared to quintile
5. Similarly, comparing mean values for satisfaction with the bus stop and shelter among quintiles
to quintile 5 revealed statistically significant lower mean values of quintiles 1 and 2, which on
average were lower by 0.11 and 0.09. These findings potentially suggest a discrepancy in the
quality of buses operating in more deprived neighbourhoods, as well as inequalities in the
maintenance or state of repair of stops and shelters in more deprived areas. Satisfaction with the
performance and service quality of the trip however, revealed no differences among the social
deprivation quintiles. The findings presented so far seem to suggest that the lower assessment of
overall satisfaction is observed in more socially deprived quintiles and can be attributed to the
lower satisfaction of service characteristics related to the on-board experience and interior of the
bus and the satisfaction with the bus stops and shelters.

42
2.4.6 Multi-level regression models
Multi-level regression modeling was employed to analyze how customer satisfaction varies as a
function of various route characteristics and neighbourhood SES. A multi-level approach was
chosen for this analysis, since an individual’s satisfaction of each bus route is of interest, multi-
level modeling allows us to control and isolate the average variation in satisfaction between routes.
In other words, the multi-level model allows us to differentiate between the variation that is caused
within the route from the variation between routes. A likelihood ratio test (LR test) is used to assess
the appropriateness of the use of multi-level regression for the analysis. The LR test was
statistically significant, which validated the importance of considering that satisfaction varies
across different routes.
Four multi-level regression models were used. First, a logit model was developed to model
overall satisfaction using a binary variable of whether an individual was satisfied with their trip.
A user was considered as satisfied with their trip if they rated the overall service as a seven and
above out of ten, while six and below was considered dissatisfied with the overall trip. This cut-
off for satisfaction was selected as interviewers were instructed to ask follow-up questions to
determine the reasons for a respondent’s dissatisfaction. The remaining three models were
estimated using a linear multi-level mixed-effects model, to predict satisfaction with each factor
component. The four models include the same control variables, which are presented and described
in Table 5.
Table 6 presents the odds ratios and 95% confidence intervals for the multi-level logit
model, which determines the probability of an individual being satisfied overall with their bus trip.
As expected, there was a statistically significant difference in overall satisfaction between the most
and least socially deprived quintiles. The odds of users of a bus route in the most deprived quintile

43
being satisfied overall with the service decreases by 21% compared to quintile 1 (least deprived
group), when controlling for other variables. This finding indicates that after controlling for
relevant characteristics related to the bus trip as well as personal characteristics, passengers’ using
bus routes operating in an area with high social deprivation are more likely to be dissatisfied with
their trip compared to those using routes going through the least deprived areas.
Additional variables were found to play a role in predicting whether an individual is
satisfied with their bus trip. Namely, the odds of an individual being satisfied with their bus trip
are predicted to be 2.29 times higher for an individual who was seated during their trip compared
to users who had to stand. Furthermore, individuals who made a short trip (under 30 minutes) are
predicted to be 2.29 times more likely to be satisfied with their trip overall than individuals whose
trip was longer than 60 minutes, while keeping all other variables constant at their mean. Finally,
the odds of an individual being satisfied with their trip during peak hours are predicted to be 17%
lower than individuals whose trip occurred during an off-peak time. These variables behave in
line with a previous study of determinants of satisfaction among bus users (Beirão & Cabral, 2007).

44
Table 5: Description of multi-level model variables
Variable Name Description
Model Dependent Variables
Model 1: Overall Satisfaction Dummy variable that equals 1 if a rider stated their satisfaction with the overall service was 7 or above,
otherwise 0.
Model 2: Satisfaction with the on-board
experience and interior of the bus
Factor loading for satisfaction with the on-board experience and interior of the bus
Model 3: Satisfaction with the
performance and service quality of the
trip
Factor loading for satisfaction with the performance and service quality of the trip
Model 4: Satisfaction with the bus stop
and shelter
Factor loading for satisfaction with the bus stop and shelter
Social Deprivation Indicator
Quantile 5 Dummy variable of 1 if route is segmented in quantile 5 (20% most socially deprived routes), 0 otherwise.
Quantile 4 Dummy variable of 1 if route is segmented in quantile 4, 0 otherwise.
Quantile 3 Dummy variable of 1 if route is segmented in quantile 3, 0 otherwise.
Quantile 2 Dummy variable of 1 if route is segmented in quantile 2, 0 otherwise.
Quantile 1 Dummy variable of 1 if route is segmented in quantile 1 (20% least socially deprived routes), 0 otherwise.
Bus Trip Characteristics
Seat (Dummy) Dummy variable that equals 1 if a rider had a seat, and 0 otherwise.
Short trip (<30 minutes) Dummy variable that equals 1 if a users' trip took less than 30 minutes, and 0 otherwise.
Medium trip (30-60 mins) Dummy variable that equals 1 if a users' trip took between 30-60 minutes, and 0 otherwise.
Long trip (>60 mins) Dummy variable that equals 1 if a users' trip took longer than 60 minutes, and 0 otherwise.
Peak hour trip Dummy variable that equals 1 if a users' trip took place during a peak hour (6:30 to 9:29 and 16:00 to 18:59),
and 0 otherwise.
Route length (km) The length of the route in km.
Personal Characteristics
Sex Dummy variable that equals 1 if a user identified their sex as being male, and 0 otherwise.
Age Categorical age of a user.
White Dummy variable that equals 1 if a user identified their ethnicity as being white, and 0 otherwise.
Asian Dummy variable that equals 1 if a user identified their ethnicity as being Asian, and 0 otherwise.
Black Dummy variable that equals 1 if a user identified their ethnicity as being black, and 0 otherwise.

45
Table 6: Multi-level logistic regression of overall satisfaction (7 and above)
The intra-class correlation coefficient (ICC) of this logit model showed that approximately
1.2% of the total variance of overall satisfaction was explained from variation between the bus
routes. The low ICC coefficient indicates that the variation observed among satisfaction is not
resulting from high correlation between routes, rather it is explained by the independent variables
included in the model.
Odds Ratio 95% Confidence interval
Social Deprivation Quintile
Quintile 5 (Top 20%
socially deprived) 0.79* 0.65 0.96
Quintile 4 0.90 0.74 1.08
Quintile 3 0.95 0.79 1.14
Quintile 2 0.94 0.78 1.14
(ref= Quintile 1) Bus Trip Characteristics
Seat (Dummy) 2.29** 1.96 2.67
Short trip (<30 minutes) 2.29** 1.61 3.27
Medium trip (30-60 mins) 0.95 0.66 1.38
(ref= Long trip (>60 mins)) Peak hour trip
(reference= non-peak
trip) 0.83** 0.76 0.91
Route length (km) 1.01 1.00 1.03
Personal Characteristics
Sex (ref= female) 1.10 1.00 1.21
Age 1.02 0.98 1.06
Ethnicity (ref= mixed)
White 1.18 0.88 1.58
Asian 0.77 0.58 1.04
Black 0.78 0.58 1.05
Random-effects parameters Estimate 95% Conf. int
Sd (constant) 0.0084 0.0048 .0015
Sd (residual) 0.98 0.96 1.00
Intraclass correlation 1.2% ** Statistically significant at the 99% confidence level
* Statistically significant at the 95% confidence level N=17,516

46
Table 7 presents the results of the three multi-level linear models of each factor component
(groups of satisfaction questions). Regarding the first model evaluating satisfaction with the
experience and ride quality, we see that the three most socially deprived quintiles are least likely
to be satisfied with the on-board experience and interior of the bus compared to quintile 1, when
controlling for other variables. Interestingly, the only other variables with statistical significance
in this model were the variables describing whether an individual had a seat during their trip, and
an individual’s ethnicity. Individuals with a seat during their bus trip are predicted to be more
satisfied with their experience and quality of the bus. This model also revealed that in comparison
to an individual of mixed ethnicity, a rider who is Asian is predicted to have lower satisfaction
with the on-board experience and interior of the bus when compared to a rider of mixed ethnicity.
Next, we consider satisfaction with the performance and service quality of the trip. We find
that neighbourhood social deprivation is not a significant predictor of an individual’s satisfaction
with service features related to ride quality, when controlling for other variables. This finding
indicates that individuals assessed the characteristics of their trip related to the driver behaviour,
level of crowding, length of time waited, journey time and reliability uniformly despite the level
the of social deprivation of the neighbourhood of which the bus trip occurred. Rather, satisfaction
with the performance and service quality of the trip was estimated to be higher among individuals
who had a seat during their trip as well as individuals whose trip duration was under 30 minutes.
Furthermore, passengers are expected to be less satisfied with the service quality during peak
hours. This finding warrants additional attention to the quality of service during peak times to
better serve passengers during peak hour trips. Lastly, in regards to personal characteristics, the
model reveals a higher satisfaction value with the performance and service quality of the trip for
each increase in age interval. Also, as seen in the previous model, individuals of Asian ethnicity

47
were found to be less satisfied with characteristics of the performance and service quality of the
trip, when compared to an individual of mixed ethnicity. The predicted lower satisfaction among
Asian riders may potentially be indicative of differences in expectations among service quality
between different ethnicities.
Results of the final regression model, reveal statistically significant differences between
social deprivation quintiles and satisfaction with the bus stop and shelter. Compared to bus routes
operating in the least socially deprived regions of London, lower levels of satisfaction with the bus
stop and shelter are expected in bus routes serving the two most socially deprived quintiles, when
other variables are controlled for. Similar to the result for the satisfaction with the on-board
experience and interior of the bus, the statistically lower satisfaction with these factor components
likely explains the discrepancy of quality with buses and bus stop facilities in areas of higher social
deprivation. An unexpected negative association between whether an individual had a seat during
their trip and the length of the trip was observed in this model. Contrary to the other models and
the hypothesized direction of the relationship, an individual who had a seat during their trip is
likely to be less satisfied with the bus stop and shelter, and individuals whose trip was under 60
minutes were less satisfied than an individual whose trip duration was over 60 minutes.
Furthermore, satisfaction with the bus stop and shelter is predicted to be lower for longer bus
routes. Finally, individuals who stated their ethnicity as white were likely to be more satisfied with
the bus stop facilities than individuals who stated their ethnicity as mixed.
The intra-class correlation coefficients (ICC) of these multi-level linear models show that
approximately 2.1% of the total variance of satisfaction with the on-board experience and interior
of the bus, 1.6% % of the total variance of satisfaction with performance and service quality of the
trip, and 0.8% of the total variance of satisfaction with the bus stop and shelter was explained from

48
variation between the bus routes. Similar to the first multi-level model, the low ICC coefficient
indicates that variation among satisfaction is explained by the predictor variables in the model.

49
Table 7: Multi-Level linear regression with each factor variable as the dependent variable
FACTOR 1 - Satisfaction with
the on-board experience and
interior of the bus
FACTOR 2 - Satisfaction with
the performance and service
quality of the trip
FACTOR 3 - Satisfaction with
the bus stop and shelter
Coefficient 95% Conf. int Coefficient 95% Conf int. Coefficient 95% Conf. int
Social Deprivation Quintile
Quintile 5 (Top 20%
socially deprived) -0.14** -0.21 -0.06 -0.02 -0.10 0.05 -0.08* -0.14 -0.01
Quintile 4 -0.15** -0.22 -0.08 -0.04 -0.11 0.03 -0.07* -0.13 -0.01
Quintile 3 -0.11* -0.18 -0.03 -0.03 -0.10 0.04 -0.04 -0.10 0.03
Quintile 2 -0.06 -0.13 0.02 -0.03 -0.10 0.04 -0.02 0.09 0.04
(ref= Quintile 1) Bus Trip Characteristics Seat (Dummy) 0.19** 0.13 0.25 0.43** 0.37 0.49 -0.09** -0.15 -0.03
Short trip (<30 mins) 0.06 -0.08 0.20 0.44** 0.30 0.58 -0.21** -0.35 -0.06
Medium trip (30-60 mins) 0.03 -0.12 0.18 0.05 -0.10 0.20 -0.23** -0.38 -0.08
(ref= Long trip) Peak hour trip (ref=non-
peak) 0.02 -0.01 0.05 -0.13** -0.16 -0.10 -0.01 -0.04 0.02
Route length (km) 0.00 -0.01 0.01 0.00 0.00 0.01 -0.01* -0.01 0.00
Personal Characteristics Sex (ref= female) 0.00 -0.03 0.03 -0.01 -0.04 0.02 0.01 -0.02 0.04
Age 0.00 -0.01 0.01 0.03** 0.02 0.04 0.00 -0.01 0.02
Ethnicity (ref= mixed) -0.12 0.07 0.09 0.28
White 0.06 -0.03 0.15 -0.02 -0.24 -0.05 0.19** -0.06 0.13
Asian -0.10* -0.19 0.00 -0.15** -0.13 0.06 0.03 -0.05 0.15
Black -0.07 -0.17 0.02 -0.03 -0.10 0.05 0.05 -0.14 -0.01
Random-effects parameters
Sd (constant) 0.021 0.016 0.029 0.16 0.01 0.23 0.01 0.00 0.15
Sd (residual) 0.97 0.95 0.99 0.95 0.93 0.97 0.98 0.96 1.00
Intraclass correlation 2.1% 1.6% 0.8%
** Statistically significant at the 99% confidence level
* Statistically significant at the 95% confidence level N=17,516

50
2.5 DISCUSSION AND CONCLUSIONS
This study has presented a new method for evaluating customer satisfaction survey data. Using a
spatial analytical approach, passengers’ perception of service was evaluated across the network of
London Buses to determine whether passengers perceived the same quality of service across
neighbourhood levels of SES. By segmenting routes according to level of neighbourhood social
deprivation, the findings indicate that mean values of overall satisfaction were highest in the least
deprived neighbourhoods and lowest in areas with higher social deprivation. The observed
discrepancies in customer perceptions of service in lower SES areas appears to be explained mostly
by lower satisfaction with service features related to an individual’s experience and perception of
the quality of facilities and vehicles operating in these areas.
The multi-level regression model of overall satisfaction employed in this study found that
the level of SES is a statistically significant predictor of whether an individual was satisfied with
their most recent trip, after controlling for characteristics of the bus trip and personal
characteristics. In a trial to better understand the reasoning for such lower level of satisfaction we
modeled the level of satisfaction with different service components. Modeling satisfaction with
each factor component revealed that lower SES neighbourhoods were predicted to be less satisfied
with the factors comprising attributes related to the on-board experience and interior of the bus,
and the bus stop and/or shelter, while controlling for other factors. However, the model results of
the factor component pertaining to the performance and service quality of the trip revealed no
significant differences among quintile groups, indicating a consistent assessment of service
attributes such as journey time, waiting time, reliability, level of crowding and smoothness of the
trip across neighbourhood SES levels. Most transit agencies regard reliability as a key factor in
building customer satisfaction (Diab et al., 2015), largely since growth in public transit patronage
can result from service reliability improvements, while it can decay due to unreliable service (Bates

51
et al., 2001; Noland & Polak, 2002). However, transit riders generally perceive out-of-vehicle
travel time (i.e. transferring and waiting for vehicles) to be more onerous than time spent in-vehicle
(Guo & Wilson, 2004a; Stradling, Anable, & Carreno, 2007), and accordingly, impact satisfaction.
For that reason, transport agencies often aim to design stops and shelters with various amenities to
reduce the burden of waiting and transferring (Iseki & Taylor, 2010). Therefore, it is important
not to overlook customers’ perceptions of service related to waiting conditions. Moreover,
individuals with positive perceptions of safety, comfort, appearance and convenience of bus
service have been shown to be more loyal customers (Figler et al., 2011). Discrepancies in service
features related to the bus vehicles and waiting conditions must be addressed for greater
satisfaction and retention of public transit users in lower SES neighbourhoods, especially because
an individual’s experience with public transit largely determines their transport behavior
(Thøgersen, 2006).
The fact that London Buses are operated under contracts with various private operators
appears to be an effective means of providing a reliable transit service across different
neighbourhood SES levels. This is because customers across varying levels of SES were equally
satisfied with service attributes related to the reliability and on-time performance of their trip,
which are service attributes closely monitored through contract performance standards. The
dilemma presented by these findings is that quality standards of service features related to vehicles
and stop facilities are not incorporated into minimum performance standards set within contracts
with private operators. Accordingly, performance indicators specific to the state of repair and
cleanliness of vehicles should be adopted in future contracts to ensure a high-quality service for
all SES. Furthermore, London Buses should assess the state of repair, information and cleanliness
of bus stops and shelters across the network, as these facilities are managed by London Buses.

52
This study provides evidence of the success of delivering quality public transit service
under the regime of public transit contracts. However, to increase customer satisfaction and loyalty
and retain passengers, such as transit captive riders in areas of higher social deprivation, more
attention to the quality of buses as well as bus stops and shelters provided across the network is
required. At a time when bus contracting is receiving interest around the world, the findings from
this research show the success of this contracting method as it appears to aid in the provision of a
consistent level of service, as it is reflected in the satisfaction with service quality questions, across
all areas regardless of neighbourhood SES. Furthermore, this study highlights the importance of
including cleanliness and bus internal quality as performance indicators when contracting bus
services, to ensure that all customers receive the same quality of service in the region regardless
of their SES, in addition to other widely used reliability measures.
A limitation of the proposed spatial analysis of route-level satisfaction presented in this
chapter is that in some cases a bus route intersected multiple neighbourhoods with varying SES
levels. In future studies this can be mitigated by focusing the analysis on bus routes with relatively
little variation in SES. Alternatively, with detailed information on passengers’ origin and
destinations, allowing an agency to map each riders’ trip and to intersect trips that pass through a
neighbourhood and study average satisfaction levels.
53
CHAPTER 3: WHERE IS THE HAPPY TRANSIT RIDER? EVALUATING
SATISFACTION WITH REGIONAL RAIL SERVICE USING A SPATIAL
SEGMENTATION APPROACH
3.1 CHAPTER OVERVIEW
Transit agencies wishing to better understand the markets that they serve commonly employ
marketing strategies such as satisfaction surveys, however traditionally both in the literature and
in practice, analyses of satisfaction have been conducted without spatial analysis techniques. The
previous chapter (Chapter 2) demonstrated a novel technique that spatially modeled route-level
satisfaction data, which can be applied by transit agencies to assess how performance is delivered
across a transit network. The present chapter (Chapter 3) presents a second spatial application of
satisfaction data, whereby addressing the identified shortcoming in the market segmentation
research discussed in the introductory chapter of this dissertation. Market segmentation analyses
are commonly employed by transit agencies to identify groups of users, which are subsequently
used as a base for developing policies and strategies aimed at improving customer satisfaction.
However, previous studies adopting this market segmentation approach have predominantly
ignored spatial and contextual factors related to the transit network and the built environment of
where a user resides, resulting in network-wide policies that are difficult to implement especially
for agencies with scarce resources. Accordingly, this chapter presents a new segmentation
approach that incorporates spatial and contextual factors in addition to other rider’s preferences
and satisfaction levels with commuter rail service in the Greater Toronto and Hamilton Area,
Canada. Including these factors in a market segmentation analysis has enabled us to recommend
service interventions at a local and finer scale compared to previous studies, while at the same time
providing the greatest impact on a specified segment of riders. This research provides transit
planners and policy makers with a spatial segmentation approach, which can be used to maximize

54
the benefits of service improvements intended to increase satisfaction with public transit among
certain groups of users in a region.
3.2 INTRODUCTION
Delivering high quality, affordable, and efficient urban public transit service that is equally
beneficial to all residents is a major feat that cities are striving for globally. Transit agencies are
continuously determined to achieve a balance between economic efficiency of the provision of
service and delivery of a desired level of service. The success of a transit agency can be measured
by the number of satisfied passengers using the service and who will continue to use the service in
the future (de Oña et al., 2013). Accordingly, regular monitoring of customers’ perception of
service through the collection of customer satisfaction surveys is one of the most widely used and
recognized tools in the industry to directly capture the customers’ perception of service quality
(Davis & Heineke, 1998; Hensher et al., 2003). Customer satisfaction is a subjectively measured
quality of service indicator, which is perceived as an important determinant of a user’s travel
demand (Prioni & Hensher, 2000). Improvements in passengers’ satisfaction is generally
associated with higher levels of consumer loyalty (S. Olsen, 2007), and customers who are satisfied
with the service are more likely to continue to use transit at the same or a higher level of frequency,
and positive experiences with service are likely to be communicated to friends and family (Davis
& Heineke, 1998).
In order to design and prioritize transport strategies that can improve service quality,
considerable research has been conducted to identify which service attributes have the strongest
influence on the overall assessment of service quality (de Oña et al., 2013; Eboli & Mazzulla,
2007, 2015; Hensher et al., 2003; van Lierop & El-Geneidy, 2016c). However, transit agencies
must acknowledge that there are different groups of transit riders, who have different needs and

55
expectations (Beirão & Cabral, 2007; Bordagaray et al., 2014; dell’Olio et al., 2010). Traditionally,
transit market research has categorized transit users as either captive or choice riders according to
their vehicle access and travel behaviour (Beimborn et al., 2003; Jacques et al., 2013; Krizek &
El-Geneidy, 2007). While more recent research started to segment the market further by
incorporating additional factors such as attitudes and personal motivations, travel behavior and trip
details and socio-demographic information in order to develop more specific policy
recommendations targeted towards each group (Beirão & Cabral, 2008; De Oña, De Oña, Diez-
Mesa, Eboli, & Mazzulla, 2016; de Oña, de Oña, & López, 2016; van Lierop & El-Geneidy,
2017a). Yet such an approach to market segmentation leads to the generation of system-wide
policies that require an abundance of resources to implement, while only the targeted segment of
the market will benefit from this policy.
Transit agencies with scarce resources need to prioritize strategies in certain areas in the
region that can target concentrations of certain segments of riders, or to allow agencies to prioritize
service interventions in areas where high proportions of socially vulnerable individuals that are
dependent on transit service. Accordingly, this study builds off the current practice of public transit
market segmentation by incorporating spatial and contextual factors, related to where each user
lives and the service they frequently use, in addition to satisfaction levels and personal
characteristics. This approach generates geographically sensitive segments of users where policies
can be applied to target a certain segment of the transit market either due to its need or due to its
level of satisfaction. This study uses customer satisfaction survey data collected from commuter
train users in the Greater Toronto and Hamilton Area (GTHA), Canada to demonstrate this new
geographically sensitive public market segmentation approach. It also shows the value of
56
implementing such an approach through recommending service interventions at a local and finer
scale compared to previous studies.
The following section of this paper provides a detailed review of literature relevant to
customer satisfaction and market segmentation approaches. Next, the case study and data included
are described, which is followed by an outline of the statistical methods applied to geographically
segment users in our sample. This is followed by the results of the geographically sensitive
segmentation analysis. Lastly, a discussion of policy recommendations specific to each segment is
demonstrated in an effort to show how a transit agency with scarce resources can increase
satisfaction through targeting policies in certain areas in a region that is dominated by a specific
group of users.
3.3 LITERATURE REVIEW
Various public transit agencies are trying to be competitive in the rapidly changing transportation
market through applying market-oriented strategies. Market-oriented strategies are employed by
these agencies to ensure ridership retention through increases in customer satisfaction (Molander,
Fellesson, Friman, & Skålén, 2012). Customer satisfaction as defined by Anderson (1973) is the
difference between customers’ perceptions and expectations of the service they received.
Accordingly, high customer satisfaction results when service performance meets or exceeds the
customers’ expectations or desired standard of service. However, developing valid and accurate
constructs of service quality is complicated by the fact that a customer’s evaluation of quality is a
rather elusive concept to measure, which is particularly complicated by intangible service
attributes (Parasuraman et al., 1985). Intangible service attributes in the public transit market
include safety, comfort and cleanliness, whereas factors such as service reliability or on-time
performance are more tangible measures of service quality. Accordingly, the measurement of

57
service quality remains challenging for public transit agencies (Hensher et al., 2003), which is
exacerbated by research that indicates that the perception of service quality and the relative
importance of service attributes vary among groups of users (dell’Olio et al., 2010). The
heterogeneity among individuals and the differences among attitudes towards transit or personal
desires requires the use of segmentation analyses that accounts for travelers attitudes and
behaviours (Beirão & Cabral, 2007).
Segmentation analyses are employed by transit agencies to identify different types of users
who have similar characteristics, and the resulting segments of users can serve as a base for future
marketing strategies (Weinstein, 2004). At its most basic, segmentation analyses categorize people
according to socio-demographic variables and transport use, however these measures have been
found to oversimplify the market (Anable, 2005). Psychological factors, such as perceptions,
attitudes and habits, have shown to be important factors for understanding travel behavior (Fujii
& Kitamura, 2003), and users’ perception of service quality has been linked to continued use of a
service (Lai & Chen, 2011). Building off this knowledge, Krizek and El-Geneidy (2007) employed
a market segmentation approach to uncover groups of both users and non-transit users that have
similar travel habits and preferences towards public transit. The authors identified captive and
choice transit riders who were distinguished by their frequency of use and identified
recommendations for how to market transit service most effectively to increase satisfaction among
each group. Tyrinopoulos and Antoniou (2008) segmented respondents by their sex to evaluate
differences in perceptions and the relative importance of service attributes between these groups.
More specific to satisfaction levels among users of a suburban commuter rail service, De Ona et
al. (2015) categorized types of users according to their frequency of use and travel time in a typical
day. Following the identification of groups of users, the authors applied a classification and

58
regression tree approach to identify which service characteristics have the most significant
influence on overall service quality. This approach to evaluating the relative importance of service
characteristics among stratified groups of users has been applied in other contexts (de Oña, de Oña,
& López, 2016).
Lastly, Abenoza, Cats, and Susilo (2017b) segmented current and potential public transit
users across Sweden according to socio-demographics, travel patterns and accessibility measures
(job accessibility and accessibility to amenities). Then the authors determined the proportion of
each segment found regionally and the relative importance of key service attributes specific to
each segment, and satisfaction levels with public transit performance. Similar to research by Diana
(2012) who considered population density when analyzing satisfaction levels of multimodal
travelers, individuals residing in smaller, low-density regions expressed higher levels of
satisfaction than those in larger urban areas, which include cities with more extensive networks
and more frequent service. Abenoza et al. (2017b) speculated that this is a result of factors
affecting service attributes in urban regions such as congestion, crowding and stress levels.
However, Diana (2012) suggested that more conclusive results could have been drawn from
incorporating information regarding individuals’ mobility patterns when using public transit .
The real value of market segmentation for transport agencies lies in its ability to be
translated into achievable strategies to increase satisfaction levels among different groups.
However, a limitation of the literature discussed above is the ability to recommend targeted
interventions across the transit network, or where to prioritize service improvements, which is
crucial information for transit agencies with limited resources. Accordingly, in this study we will
build on the segmentation strategies employed in previous research by including detailed data
related to where each user lives, and information on the service they frequently use. To the best of

59
the authors’ knowledge, this level of detail, regarding spatial and contextual factors, has not been
applied for the segmentation of transit users in the past to spatially target interventions and policy
recommendations for improved service quality and customer satisfaction.
3.4 DATA
Data used in this study was collected by GO Transit, the regional public transit provider for the
Greater Toronto and Hamilton Area (GTHA). GO Transit consists of a network of commuter trains
and a regional bus service, covering an 11,000-square-kilometer area, which carries over 271,000
people daily, as of 2015. Around 80% of GO Transit customers use the train network. As shown
in Figure 9, GO Transit offers service along seven rail corridors, and currently has 62 stations
where the majority of stations are located in suburban or semi-rural areas. Go Train service is
predominantly structured to bring passengers from all seven train lines into Union Station in the
morning (which is a major intermodal transportation hub located in the heart of downtown
Toronto) and bring passengers back to the suburbs during the evening commute.

60
Figure 9: GO Transit train system map
GO Transit conducts quarterly surveys to measure customer satisfaction and loyalty
among existing users. These surveys were administered through either paper surveys or online.
Only customers who have travelled on a GO Train or GO Bus in the last year were asked to
complete the survey. GO Transit provided the results of eight years of surveys, of GO bus and
train users, although in this study, only users who stated using the GO Train in the past year were
included in our sample. GO Transit’s customer satisfaction survey is designed to ask customers
about their overall experience with GO Transit over the past year, in other words all satisfaction
responses were designed to be derived from a users’ collective experience with transit over the
past year. The survey began with broad questions about the users’ overall satisfaction with GO

61
Transit, their loyalty to GO Transit, satisfaction with GO Train service, and satisfaction levels with
specific service attributes, and lastly personal characteristics. The initial sample of train users was
16,902, however over time the questionnaire was modified, consequently, only surveys with
questions that were asked in a consistent manner and that contained our questions of interest were
used for further analysis. This provided us with a final sample size of 4,750 complete responses,
of data collected between 2011 and 2016.
The goal of this study is to demonstrate how a geographically sensitive segmentation
exercise of GO Train users can be conducted, according to each train users’ travel behavior,
satisfaction levels, personal and socio-demographic characteristics, and geographic and contextual
factors. Using each respondents’ home postal code, the following geographical variables were
collected: distance to Union Station (the heart of downtown), distance from a users’ home to the
nearest GO Train (commuter train) station, average morning peak train service frequency of that
nearest train station, accessibility to parking spaces and occupancy rates, job accessibility within
45 minutes by transit, and the average commute distance of the Census Tract where each user lives.
Union Station, as shown in the GO Transit system map (Figure 9), is the convergence point
of all the train lines, and was therefore used as the reference point for the distance to downtown
variable considered in the analysis. Approximately 95% of GO Train customers travel to or from
Union Station (GO Transit, 2017), which characterizes travel patterns on the GO Train network.
The network distance between the residence of each GO train user in the survey and the nearest
train station along the line he or she uses to commute was measured and linked to the morning
peak frequency of that station. Peak frequency was determined using schedules obtained from the
General Transit Feed Specification (GTFS) (April 2017 schedule). Peak frequency is defined as

62
the number of trains passing through each station in an hour during the morning peak period (6
AM until 9 AM).
Station access has been previously found to be an important driver of satisfaction with rail
trips (Brons, Givoni, & Rietveld, 2009; Givoni & Rietveld, 2007). Park-and-ride facilities are a
critical component of GO Transit’s service, considering that stations are located in suburban and
semi-rural locations with stop spacing reaching between 4 to 6 km (Engel-Yan, Rudra, Livett, &
Nagorsky, 2014). As a result, approximately 67% of users accessed a GO Train station by driving
and parking in 2015 (Metrolinx, 2016). Accordingly, we constructed a measure of accessibility to
parking spaces. This measure is derived by identifying the 3 closest stations within 10 km of each
user’s residence and calculating the average capacity and utilization rates of these parking lots.
Monthly parking capacity and utilization rate data for years 2010 to 2016 were provided by
Metrolinx, and this data were averaged across the years to contextualize parking availability for
different users. A 10 kilometer cutoff was chosen since termini stations have been found to draw
passengers from distances of 10 km and greater, although stations located in denser
neighbourhoods closer to downtown Toronto typically have smaller catchment areas (Engel-Yan
et al., 2014). Furthermore, Iacono, Krizek, and El-Geneidy (2008) found that the threshold distance
for transit trips with auto access was 10 kilometers, and that few users would access train stations
from farther distances.
The next geographic variable we considered in the analysis was accessibility to jobs by
transit. Two main data sources were used, the 2011 National Household Survey (NHS) commuting
flows data provided by Statistics Canada, and the most recent GTFS data provided by each transit
agency in the GTHA. A cumulative accessibility measure at the census tract (CT) level was
calculated to determine the number of jobs an individual can reach by public transit within 45

63
minutes of travel. Travel time data across the GTHA were calculated using GTFS data extracted
from GO Transit, and the 10 local transit agencies which operate in the GTHA. Travel time for
four departure times were calculated: 7:00, 7:15, 7:30 and 7:45 AM, and the lowest travel time
was selected for each CT pair. We selected the minimum travel time largely for cases where a train
operates on an hourly or twice-hourly basis, and since waiting time is built into the travel time
calculation, this would significantly overestimate travel time in these cases. Within the travel time
calculation, access, in-vehicle travel time, and egress times are included, however walking was the
only mode considered for access to stations, which might underestimate accessibility levels for
individuals who drive to train stations. Using these travel times, the number of jobs accessible by
GO Transit (only) and regional transit (including GO Transit) within 45 minutes were then
calculated for each CT. The final variable included in our analysis, was the average commute
distance of each CT, which was calculated using the 2011 NHS commuting flows data.
These contextual variables were selected to describe and capture differences in where users
live across the GTHA and what level of service and public transit options are available which
might impact satisfaction levels. From the customer satisfaction survey, we know how frequently
each person travels by GO Train on an average week, and at what time of day they typically travel
and whether trips are commonly made on weekdays or weekend. While we do know which train
corridor each user is most frequently traveling on, we do not know where they most often travel,
and how this may impact a user’s overall satisfaction with GO Transit service.
3.5 ANALYSIS
In this study, a two-step approach to segment different groups of users within the study sample
according to their travel behavior, satisfaction levels, personal and socio-demographic
characteristics, and contextual variables was used. First, a factor analysis was used to derive factors

64
of related survey questions and geographic data. Second, K-means cluster analysis was employed
to group respondents into similar groups. This method, which is also known as factor-cluster
analysis is described in further detail in the following sections, and the resulting clusters are
described and mapped to allow for further analysis of each group of users.
3.5.1 Factor analysis
Factor analysis, or more specifically Principle Component Analysis (PCA), is a commonly used
statistical technique to identify factors of related questions or data, from a large set of data that
contains questions with a relatively high correlation among responses. It is often used in studies
working with large survey data (Anable, 2005; Figler et al., 2011; Tyrinopoulos & Antoniou,
2008), as it helps researchers to evaluate and identify patterns of how different variables relate to
one another, and therefore reduces the number of variables analyzed. In this study we linked the
various contextual characteristics to each rider’s response and included these geography specific
variables in the factor analysis alongside the questions from the satisfaction survey.
Varimax rotation was used to derive factors, and the criteria, eigenvalues greater than one,
was selected to determine the number of suitable factors. Variables that did not group with other
questions were removed. Six factors resulted from the PCA, and the name of each factor, included
variables and factor loading are presented in Table 8. These six factors collectively explain 61%
of the variance in the original values. To interpret factor loadings, the closer the absolute value is
to 1, the stronger the relationship between the variable and the factor as a whole.
As seen in Table 8 some contextual factors were grouped together like the accessibility to
jobs variables, while others were grouped with some satisfaction question like the satisfaction with
parking availability and parking occupancy near the residence of the user. The factor loadings for
each factor was then saved giving each surveyed person a score that represents his answer to a

65
question or his contextual characteristics or a combined score for both. These factor loadings were
then used in the next section to generate different groups of commuter train users.
Table 8: Results from the Principle Component Analysis
Factors Survey Question or Variable Loading
1. Satisfaction
with service and
train stations
How satisfied are you with your personal safety in train stations? 0.818
How satisfied are you with the cleanliness of stations (other than Union
Station)? 0.789
How satisfied are you with GO Train stations overall? 0.585
How satisfied are you with helpful and friendly staff (at train stations
other than Union Station)? 0.770
How satisfied are you with helpful and friendly staff (Union Station)? 0.752
How satisfied are you with the lighting in the parking lots? 0.786
How satisfied are you with your personal safety in the parking lots? 0.778
How satisfied are you with helpful and friendly staff (on-board trains)? 0.729
How satisfied are you with the cleanliness on board trains? 0.700
How satisfied are you with the temperature on trains? 0.646
How satisfied are you with communication of service delays? 0.588
How satisfied are you with sufficient fare inspections? 0.564
How satisfied are you with availability of seats? 0.437
2. Loyalty and
overall GO Train
satisfaction
How likely you will be to recommend GO transit to a friend/colleague? 0.795
How likely you will be to continue to take GO Transit? 0.698
How would you rate your level of satisfaction with GO Transit overall? 0.787
How satisfied are you with GO Train service overall?5 0.763
How satisfied are you with trains running on time? 0.622
3. Accessibility
and commuting
behaviour
Number of jobs accessible within 45 minutes by regional transit service. 0.941
Number of jobs accessible within 45 minutes by GO train service only. 0.915
Average commuting distance of census tract. -0.595 Hourly GO Train frequency during the morning peak (6 - 9 AM). 0.757
4. Level of service Accessibility to parking spaces. 0.711 Ratio of regional transit accessibility and accessibility by GO transit. -0.629
5. Financial status
and personal
travel behaviour
What is your total household income before taxes? (Over $100,000) 0.656
What time of day do you typically board your GO train? (Peak periods:
before 8:30 AM, 3:30 PM to 5:30 PM) 0.614
What is your current employment status? (Student) -0.593
6. Satisfaction
with parking and
parking
occupancy
Average parking occupancy at nearest 3 stations within 10km. 0.820
How satisfied are you with the availability of parking spaces?
-0.479
5 Please note, that the question asking customers to rate satisfaction with GO Transit overall is referring to the entire
GO Transit network including bus and train service, while this question is specific to GO Train service.

66
3.5.2 Cluster analysis
Using the six factors described above, K-means cluster analyses were performed with the intent to
uncover how these factors combine to identify different types of users. This method of
segmentation is common in previous literature (Krizek, 2006; Krizek & El-Geneidy, 2007; Song
& Knaap, 2007; van Lierop & El-Geneidy, 2017a). Using the K-means cluster analysis in the
Statistical Package for the Social Sciences (SPSS), the scores of the six factors were used to
generate geographically sensitive groups or clusters of different users, based on the distance and
similarity among factor scores. To determine the most appropriate number of clusters, we tested a
range of cluster values from four to ten clusters. We also tested different combinations of variables
within the factor analysis and removed select variables that were perceived to dominate the cluster
formation, especially from a geographical perspective, such as distance to Union Station.
Furthermore, because our sample contains surveys collected between 2011 and 2016, we checked
for bias among clusters, to ensure that a cluster was not dominated by responses from one survey
year. We concluded that seven distinct and recognizable clusters of GO Train riders existed in our
sample, according to their respective scores on various components such as satisfaction levels,
socio-demographic characteristics and geographic location.
The seven clusters are presented in Figure 10 where the bars represent the relative value of
the six factors described in Table 8, and below the percentage of users found in the cluster is
displayed. The bars describe whether these users are positive or negative towards a factor. For
example, unsatisfied young urbanites score very highly in the accessibility and commuting
behaviour factor, as these users live in neighbourhoods with very high accessibility to jobs by
public transit. Before describing these seven clusters in greater detail, the home postal code of
users in each of the seven clusters is displayed in Figure 11 and Figure 12.

67
Figure 10: Clusters derived from principle component analysis
Figure 11: Home location of users in clusters 1 - 4

68
Figure 12: Home location of users in clusters 5 -7, and an overview map of all users segmented by
cluster
In the following section we will be describing the main characteristics of each cluster and
the type of recommendations that can be derived from understanding the levels of satisfaction
among different factors. Furthermore, where these recommendations can be implemented in the
region is discussed, to show the value of including geographic information to a transit market-
segmentation approach and how it can lead to more geographically sensitive policies.

69
3.5.2.1 Cluster 1: Loyal underserved users
Loyal underserved users (24% of the sample) are characterized by their positive perception of train
stations, including the cleanliness of stations, personnel, and personal safety at train stations. With
regards to service characteristics on-board trains, these users are very satisfied with the cleanliness
and personnel. Where service improvements are needed for these riders are on-time performance
(mean of 7.9 out of 10), seat availability (mean of 6.6 out of 10) and communication of delays
(mean of 7.4 out of 10). Loyal underserved users are among the most frequent users of GO Train
service, where 99% of these users commute at peak times during the week. Stated future usage
among these riders is very high (mean of 9.2 out of 10), and these respondents are very likely to
recommend the GO Train service to family or friends (mean of 8.5 out of 10).
On average these users live 37 km from Union Station and live approximately 5 km from
a train station with low morning peak frequency (2.6 trains an hour). Interestingly, this cluster
contains 77% of respondents who most regularly use the Richmond Hill corridor, which is the only
corridor to most cleanly fit into one cluster. The ratio between accessibility to jobs by GO Transit
and all regional transit service is 3.6, which indicates that the GO Transit service is well integrated
with the local transit service. In other words, these users can reach significantly more jobs if they
combine GO Transit service with local transit service. In terms of parking, these users on average
have access to 2870 parking spaces within 10 km, however parking at nearby stations are almost
at capacity. During the study period, the average parking occupancy of these stations was 93%,
which compared to other clusters is the highest parking occupancy rates. The oversaturation in
parking lots experienced by these users is reflected in their very low score for satisfaction with
available parking (mean of 5.9 out of 10).

70
Recommendations:
A major improvement to these users’ satisfaction levels, is to alleviate dissatisfaction with parking
availability. Sustainable means of decreasing the demand for parking would include increasing the
number of riders who access the station via local transit service, walking, cycling or car-pooling.
Perhaps, while the regional transit accessibility is well integrated with the GO network, there are
currently barriers preventing more users from using transit, such as inconvenient connections, or
the cost of the regional transit service in addition to the GO Transit fare, while parking is free.
Poorly timed connections between local public transit and GO Train service would be exacerbated
by the low service frequency. Other barriers that may prevent alternative means of station access
include poor cycling and walking infrastructure, or a lack of secure bicycle parking.
3.5.2.2 Cluster 2: Frustrated yet dedicated riders
Frustrated yet dedicated riders (14% of the sample) are highly dissatisfied with service
characteristics and stations. Most notably, very low satisfaction with seat availability (mean of 4.9
out of 10), communication of delays (mean of 4.6 out of 10), personal safety in parking lots (mean
of 4.6 out of 10) and on-time performance (mean 6 out of 10) were reported by these users.
Accordingly, overall satisfaction scores of train service are low (mean of 6.3 out of 10), and these
riders are the least likely to recommend the service to others. Despite the very low satisfaction
levels expressed by this group, they are still highly likely to continue to use the service in the future
(mean of 8.4 out of 10). A major concern expressed by these users is their level of satisfaction with
available parking spaces, with the lowest mean value of all clusters (mean of 4 out of 10). These
users have very high access to parking spaces, with a mean value of 4939 spaces within 10 km,
and during the study period these parking lots had occupancy rates of approximately 89%. In
comparison to cluster 1, with the highest parking occupancy rates but significant lower access to

71
parking spaces (2870), these users are least satisfied with available parking, which can potentially
be explained by their higher accessibility to parking spaces. Living in proximity to stations with
such high volumes of parking spaces, potentially prevented these users from considering other
means of accessing stations. Frustrated yet dedicated riders are very frequent users of GO Train
service, who travel at peak times. The level of service experienced by the frustrated yet dedicated
riders is an average of 4.3 trains per hour during the morning peak.
Recommendations:
To increase satisfaction and loyalty among these riders, considerable efforts are needed to address
crowding, safety, communication of delays and available parking. The majority of these users
frequently take the Lakeshore East Line, and would benefit from the introduction of short turn
trains at peak hours, in order to reduce the levels of crowding along busy train corridors.
3.5.2.3 Cluster 3: Unsatisfied young urbanites
Unsatisfied young urbanites make up 1% of the study sample and are distinguished by their
proximity to Union Station, their low levels of satisfaction and loyalty, and demographic
characteristics. These users are concentrated in downtown Toronto and live an average distance of
3.4 km from Union station. These users have the highest levels of accessibility to jobs by GO
Transit and all regional transit service. Unsatisfied young urbanites tend to be infrequent users
who mostly travel at off-peak times and travel the least of all clusters during the weekday (65%).
Perhaps, their high access to transit service in Toronto, which is operated by the Toronto Transit
Commission (TTC), would fulfil their daily travel needs for those who live and work in downtown,
and GO Transit would allow for efficient inter-regional transit for other trip purposes.
Relative to other users, the unsatisfied young urbanites express low levels of loyalty, and
satisfaction with train stations and service characteristics. Namely, these users express low levels

72
of satisfaction with fare inspections (mean of 7 out of 10), communication of delays (mean of 7
out of 10), and on-time performance (7.4 out of 10). Their likelihood of future usage is low relative
to other groups (mean of 8.3 out of 10, and are moderately likely to recommend service (7.8 out
of 10). The relatively low levels of loyalty expressed by these users may be a result of their loyalty
to TTC service, making GO Transit their secondary mode of travel by public transit. Accordingly,
better integration of these transit services may strongly impact these users, including fare
integration. Currently, riders pay full fares for both TTC and GO Transit, which may deter these
users from making shorter trips by GO Transit due to the high costs incurred by users. Fifty-six
percent of unsatisfied young urbanites are under the age of 35, mostly with a household income of
less than $50,000. Furthermore, 14% of these users stated their employment status as student.
Recommendations:
Frequency of travel among this group and satisfaction levels would likely increase from higher
levels of service at off-peak hours and weekends as well as greater service frequency for reverse
commuters. Go Train service is structured to bring passengers from all seven train lines into Union
Station in the morning and bring passengers outwards to the suburbs during the evening commute.
Since these users live close to Union Station, GO Train service is potentially not meeting their
travel needs. Furthermore, fare integration with the TTC may increase the ridership among these
young urban travelers and would likely attract potential riders to GO Transit.
3.5.2.4 Cluster 4: Spatially captive users
Spatially captive users (16% of the sample) are distinct from other clusters as they live in areas
with the lowest levels of job accessibility by public transit. Furthermore, this group lives the
furthest distance from Union Station (58 km on average) and live an average distance of 7.6 km
from a GO Train station, which is distinctly higher than other clusters.

73
Relative to other groups, spatially captive users are highly satisfied with the availability of
parking (7.9 out of 10) and seat availability (mean of 7.9 out of 10). Average parking occupancy
rates at stations closest to this group are on average 76% full, which is statistically lower than the
mean. Higher satisfaction levels with these service attributes is perhaps a reflection of the low
morning peak frequency of the nearest train stations to these users, as on average two trains an
hour serve these stations, therefore crowding at these stations is likely minimal. Spatially captive
users are very likely to continue to use the train service (mean of 9.3 out of 10) and among the
most likely group to recommend GO Transit (mean of 8.3 out of 10).
Recommendations:
The spatially captive users are among the most loyal GO Train users, which is perhaps a result of
their captivity to train service, to avoid driving because of the cost and the negative effects of stress
that can be felt if they drive (Legrain, Eluru, & El-Geneidy, 2015). It is recommended to continue
to monitor the satisfaction levels of these users, to ensure they remain regular and happy riders.
3.5.2.5 Cluster 5: Connected choice riders
Connected choice riders (13% of the sample) are satisfied with most service characteristics and
highly loyal to GO Transit. Users expressed their likelihood of future usage as 9.3 out of 10 on
average and are among the most likely group to recommend service to friends or colleagues (8.6
out of 10). However, service characteristics that users are dissatisfied with include seat availability
(6.6 out of 10 on average). The frustration with seat availability expressed by these users may be
a result of these riders’ proximity to Union Station, where trains would be reaching their capacity.
On average these riders live 25 km from Union Station, and live close to a train station (mean of
3.4 km). Users are dissatisfied with available parking (mean of 6.8 out of 10) and live near train
stations with parking lots that are nearing full capacity (88% occupied on average). Forty-two

74
percent of users report that they most frequently use the Lakeshore West corridor, which in 2016
had the highest weekday ridership of all train corridors.
These users are referred to as choice riders, because of their high levels of job accessibility
by transit and proximity to downtown. These users are selecting GO Transit over other modes of
transport including the TTC, however their trips may be in conjunction with other local transit
service. These users had the highest, although not statistically significant, proportion of high-
income users, namely 61% of these users reported having a household income of $100,000 or
more. Similarly, these users are the oldest in age, although not statistically significant, where 61%
of users are between 36 and 55 years of age, and 24% of users are above the age of 55.
Recommendations:
Increasing levels of satisfaction with seat availability and availability of parking would be
important targets for these otherwise satisfied and loyal users. Short-turn trains may be an effective
strategy to alleviate crowding. Additionally, these users live under 4 km on average from a train
station, which is a distance easily achieved by bicycle. Promoting cycling can be achieved through
the provision of secured bicycle parking and bicycle lanes in the area leading to the train stations
serving this group. Considering their close proximity to the CBD and high levels of regional transit
accessibility, they are an important group of users to monitor, since they are loyal, but it is
unknown at what point or at what levels of service frustrations would cause a shift to being highly
dissatisfied and deciding to drive or take other means of transit.
3.5.2.6 Cluster 6: Long-distance commuters
Long-distance commuters (25% of the sample) are distinguished by their poor transit accessibility,
and their high parking accessibility. On average these users have access to 5,941 parking spaces
within 10 km of their home, and similar to the long-distance commuters parking occupancy rates

75
are nearing capacity (87% occupied on average). These users live in census tracts with the highest
average commuting distances, 18.6 km on average. The most frequently used train corridor of 78%
of these users is the Lakeshore West or East line, particularly towards the end of both lines.
Accordingly, service frequency is high with an average of 4.7 trains an hour during the morning
commute.
With regards to on-time performance, these users are satisfied with service timeliness (7.9
of 10), however they rate their satisfaction with communication of service delays as 7 out of 10.
This suggests that users perceive that service is reliable and mostly adheres to schedules, however
in the event of a service disruption, more efforts are required to effectively communicate
information to customers regarding the disruption. Overall satisfaction levels among these users
are low (mean of 7.4 out of 10). Examining their level of loyalty; stated future usage and
recommending the service provider to others; we see a large discrepancy between these two
questions. These riders are very likely to continue to use GO Transit (mean of 9 out of 10), however
the likelihood of recommending the service to friends or family has an average score of 7.9 out of
10. Similar to the spatially captive riders these users are also likely frustrated with commuting
such distances by car and choose transit as the best alternative.
Demographic characteristics of these users are most similar to the connected choice riders,
as 59% of the sample reported a household income of $100,000 or more, and 59% of users are
between the ages of 36 and 55. These respondents use the train service to commute daily, and 99%
of riders reported using the service during peak times.
Recommendations:
To increase satisfaction levels among these users, interventions related to service reliability and
communication of service disruptions are important. Strategies to minimize frustration and

76
confusion in the event of a delay should lead to a higher perception of service quality. Additionally,
reducing crowding levels through increased train service would increase satisfaction among these
riders, especially along the Lakeshore corridor as they are mostly using this train line.
3.5.2.7 Cluster 7: Infrequent young students
The final cluster, infrequent young students (7% of the sample), as indicated by their name, are
predominantly under the age of 35 (64%), and 47% are students. Reflective of the high proportion
of students, only 38% of riders travel during peak times, although 94% of this group reported using
the service during the weekday. Relative to other clusters, there are more users who are either
lower or medium income, specifically, 47% reported a household income of less than $50,000 and
43% of users earn between $50,000 and $99,999.
Low levels of satisfaction with available parking (mean of 6.5 out of 10) were reported by
infrequent young students. Average parking occupancy rates at stations closest to this group are
on average 87% full. However, because the majority of these users do not travel during the morning
peak, parking may be very difficult to find when arriving at stations at later times of the day. These
are loyal riders, with an average future usage response of 8.8 out of 10 and are likely to recommend
the service (mean of 8.1 out of 10). However, the overall satisfaction level of these users is 7.7 out
of 10 on average. These users have moderate job accessibility, and the train service appears to be
well integrated with local transit service. These users live an average distance of 5.7 km from a
train station, and on average live 43 km from Union Station.
Recommendations:
Infrequent young students would benefit from targeted service improvements at off-peak times.
To improve overall satisfaction levels among these users an increase in service frequency at off-
peak times must be addressed. Additionally, the current network structure may deter this group

77
from travelling more frequently, as the train service is predominantly designed to bring all
passengers through Union Station, however there are few institutions that are located in proximity
to Union Station. Accordingly, GO Transit needs to expand its network to a more comprehensive
system that links multiple activity centers and communities, and provides better connections to
large institutions. Another consideration to ensure that these users continue to use GO Transit, is
for greater financial incentives or concession passes. While students do have access to a discounted
rate, which is more substantial when a monthly pass is being purchased, the student discount is
potentially not significant enough for GO Transit to be an affordable transportation option for
students.
3.6 DISCUSSION AND CONCLUSIONS
The main objective of this study was to present a new method of segmenting the transit market by
incorporating detailed geographic information about where the user lives, and the service that they
experience. Using a factor-cluster approach, regional train users in the Greater Toronto and
Hamilton Area were segmented according to their satisfaction levels, personal characteristics and
geographic factors. The results of this study reveal that contextual and geographic factors prove to
be especially useful for the identification of different groups of users and the development of
policies specific to each group that are specific to where they live and the transit service they
regularly use.
A consolidation of the recommended policies that arose from this analysis and their relative
impact on user satisfaction among the groups is presented in Figure 13. The four overarching
policies for service improvements are: service reliability and crowding, station access and parking
policies, fare policies, and network structure and off-peak level of service. While improvements
in service reliability and crowding would benefit all users, as Figure 13 suggests, service

78
improvements such as reducing crowding levels would likely have the largest impact on
satisfaction levels of the connected choice riders. Knowing that these users live either in the City
of Toronto or in the suburbs immediately surrounding Toronto, the introduction of short-turn train
service particularly along the Lakeshore West corridor which 42% of these users most frequently
use, may have significant impacts on overall satisfaction levels of these users. Shorter lines provide
agencies with more opportunities for recovery from delays compared to longer train lines
(Schmöcker, Cooper, & Adeney, 2005) and would reduce crowding levels experienced by
passengers who board the train closer to Union Station. Additionally, it is interesting to note, that
each group of users reported higher average satisfaction with on-time performance than
communication of delays. Delays incurred by passengers have negative effects on overall
satisfaction levels reported by customers (Monsuur, Enoch, Quddus, & Meek, 2017). However,
policies aimed at minimizing frustration and confusion in the event of a delay are important and
cost-effective strategies that will likely lead to a higher perceived service quality and should not
be overlooked by transit agencies.
Frustration with available parking spaces was reported by all users. Park-and-ride
expansion at suburban rail stations has historically supported ridership growth (Merriman, 1998),
but presents transit agencies including Metrolinx with a challenge as station parking lots operate
at near or full capacity. This requires strategies to reduce passengers’ reliance on park-and-ride
facilities by encouraging alternative means of station access (Engel-Yan et al., 2014). Loyal
underserved users are particularly frustrated with available parking, although these users live in
neighbourhoods with high transit accessibility which is well integrated with GO Train service.
Identifying and eliminating barriers that prevent these users from using local transit or active
modes to reach GO stations is critical. Furthermore, connected choice riders live closest to train

79
stations relative to other clusters (under 4 km on average) which is a distance easily achieved by
bicycle. Accordingly, policies to encourage cycling to stations, such as offering secured bicycle
parking and improved cycling facilities around train stations, should be targeted towards these
users. Accordingly, to prioritize bicycle facility upgrades at stations, GO Transit should consider
which stations the connected choice riders frequently use.
Figure 13: Summary of recommended policies and their expected impact on each cluster (hatching
symbology represents clusters with high proportion of low income individuals)
We also identified which policies would have the largest impact on low income users in
Figure 13. Of the users in our sample, 13% reported an annual household income of under $50,000,
compared to 49% of respondents reported earnings of above $100,000. Important policies that

80
would impact both the unsatisfied young urbanites and infrequent young students are related to the
fare structure. More specific to the unsatisfied young urbanites, fare integration with transit service
in Toronto will benefit these riders and potentially attract the ridership of similar individuals
currently not using GO Transit. Also, reductions in the current fares would benefit these riders.
The fares of GO Transit are set to cost approximately 74% of the total cost of driving, including
the cost of fuel and the cost of parking downtown Toronto (Metrolinx, No date). Accordingly,
greater consideration towards individuals of lower socioeconomic status and the economic burden
that GO Transit fares might present is highly recommended, through subsidy programs for
example (Stolper & Rankin, 2016). Furthermore, the customers’ evaluation of GO Transit fares
suggests that the fare structure in the outer suburbs works well relative to the perception of the fare
structure within the City of Toronto, where fares are not competitive against Toronto’s transit
service. Restructuring fare levels may increase the number of shorter inter-city trips on GO Transit.
The final policy recommendation which is targeted towards the unsatisfied young urbanites
and infrequent young students, is for increased off-peak service and expanding the network
structure. GO Transit’s network structure is predominantly designed for commuters, which is
reflected by the low proportion of students in the sample (4%). Expanding the GO Train network
to facilitate suburban to suburban travel and serving institutions and commercial hubs would likely
increase the satisfaction and usage of groups such as the unsatisfied young urbanites and infrequent
young students.
Overall the results of this study have demonstrated how geographic data can be
incorporated into the public transit segmentation approach to recommend geographically sensitive
strategies that can improve customer satisfaction. Future segmentation analyses that build on this
approach can be enhanced with access to detailed trip characteristics about the users’ typical travel

81
behavior, including which stations they regularly begin and end their trip at. With growing
competition in the transportation market, agencies need to be market-oriented to maintain and/or
increase ridership. The ability to identify where targeted interventions for service quality
improvements are required is expected to be very relevant and applicable for transit agencies,
particularly those with scarce resources. Accordingly, other transit agencies can apply a similar
approach to help them prioritize investments in service improvement that can lead to the highest
increase in satisfaction among a targeted group of users.

82
CHAPTER 4: TRANSFERRING MATTERS: AN ANALYSIS OF THE
INFLUENCE OF TRANSFERS ON TRIP SATISFACTION
4.1 OVERVIEW OF CHAPTER
This chapter addresses the second major gap identified in satisfaction literature, related to the lack
of contextual trip details that are included in satisfaction analyses. In-depth knowledge of how
customers perceive characteristics of a transit service should guide transit planners so that
customer demand is at the forefront of strategic decisions. Specifically, this chapter questions the
conventional wisdom in transport planning that transfers should be minimized due to negative
perceptions associated to them. This is an important topic as there is little evidence in the literature
regarding how transferring impacts overall satisfaction levels. Therefore, to address the gap in
knowledge, this chapter aims to answer the following three research questions: (1) Are people that
require transfers on their daily commute less satisfied with their trips compared to their non-
transferring counterparts? (2) How many transfers appear to be too many transfers to remain
satisfied with a trip? (3) Do mode-specific transfers have differential impacts on overall
satisfaction levels? Using data from a 2017/18 commuting survey of students, faculty and staff at
McGill University, Montreal, Canada, we try to answer the above questions through two statistical
models, general and mode specific. The general model showed that compared to trips involving
zero transfers, no statistical difference in trip satisfaction was observed for one-transfer trips,
whilst trip satisfaction declines by 32% when a rider must transfer at least two times. The mode-
specific transfers showed that transferring between bus routes and between a bus and subway
negatively impact trip satisfaction. However, transferring between subway lines did not show an
impact in our models. These results show that transferring between high frequency routes does not
impact total trip satisfaction levels in the same way as transfers involving low frequency services.

83
Findings from this study are expected to contribute to both scholarly and practical discussions of
the relationship between transferring and customer satisfaction.
4.2 INTRODUCTION
As cities have grown more dispersed and auto-oriented, the demand for travel has become
increasing difficult to meet via public transport. In large metropolitan areas public transport
providers have been trying to deliver reliable, integrated, and multi-modal systems. In doing so,
carefully designing a seamless integration between different public transport modes is critical to
minimize the burden that transferring potentially imposes on passengers. A transfer can be a
burden due to a potential increase in overall travel time, imposed by walking between stops, and
waiting times for next vehicle. Furthermore, unreliable service can cause missed connections or
extend waiting times (Bates et al., 2001), both which can have negative implications on the users’
experience with public transport. In response to an unreliable service, a commuter might adjust
their departure time to leave early in light of an uncertainty in service (Knight, 1974; Loong & El-
Geneidy, 2016), and the additional time budgeted for delays has been shown to significantly lower
trip satisfaction (St-Louis, Manaugh, van Lierop, & El-Geneidy, 2014). For commuters who are
unfamiliar with a public transport system, poor information and/or signage at transfer points can
lead to wandering, stress, and uncertainty (Iseki & Taylor, 2009), which can compound the existing
stress that some public transport users experience compared to other modes (Legrain et al., 2015).
Difficulty in wayfinding can invoke anxious feelings in passengers (Schmitt, Currie, & Delbosc,
2015), and these impressions of unfamiliar travel can influence overall attitudes towards public
transport services (Schmitt, Currie, & Delbosc, 2013) and can have an impact on people’s intention
to use the service in the future (Schmitt et al., 2015).

84
Conventional wisdom in public transport planning suggests that transfers should be minimized due
to negative perceptions associated with them (Badia, Argote-Cabanero, & Daganzo, 2017).
Despite the seeming consensus in the literature regarding public transport users’ aversion to
transferring, little scholarly attention has been paid to the association between number and type of
transfers and overall satisfaction with public transport services. Therefore, the aim of this study is
to answer the following three research questions: (1) Are people that require transfers on their
daily commute less satisfied with their trips compared to their non-transferring counterparts? (2)
How many transfers appear to be too many transfers to remain satisfied with a trip? (3) Do mode-
specific transfers have differential impacts on overall satisfaction levels? Results of this study aim
to provide public transport agencies with a clear understanding of the role of transferring in daily
trip satisfaction among existing riders. Ensuring rider’s satisfaction in today’s competitive
transport market presents many benefits for a public transport agency, most notably the cost-
efficiency of customer retention (Transportation Research Board, 1998).
4.3 LITERATURE REVIEW
Transfers play a significant role in the daily operations of public transport service, with respect to
ridership, cost-effectiveness, and customer perceptions of service quality (Guo & Wilson, 2004b).
Much scholarly attention has been paid to attributing a penalty to represent the perceived
inconvenience that public transport riders experience when transferring (for example (Guo &
Wilson, 2004b; Liu, Pendyala, & Polzin, 1997; Wardman, Hine, & Stradling, 2001)). Knowledge
of transfer penalties has important implications for public transport planning, including ridership
forecasting, network design, station design, and marketing strategies. The impedance of
transferring has several components, including transfer time, walking distance, inconvenience,
fare, and labour (Eluru, Chakour, & El-Geneidy, 2012; Guo & Wilson, 2004b; Liu et al., 1997).

85
One way of estimating the transfer penalty is through revealed choices of routes when passengers
have route alternatives. In other words, comparing choices that passengers make between a route
with and without transfers. For example, Guo and Wilson (2004b) conducted an on-board travel
survey to examine riders’ path selection from a subway line to their final destination, to evaluate
the choice of riders’ between a path that either includes or excludes a transfer. Interestingly, the
authors observed different transfer penalties depending on the transfer station and time of day, and
also found that the pedestrian environment impacts how far people are willing to walk to avoid
transferring, thus impacting the transfer penalty.
In response to conventional knowledge of the perceived inconvenience of transferring,
public transport planning design strategies have aimed to minimize or constrain transferring. As
described by Vuchic (2005), there are two bus network design strategies that are generally
considered by public transport planners. The first is a direct-service model, which encourages
direct trips so that users can reach their destination with one route. In this bus network design, each
route in the network works independently of other routes. The second model is a transfer-based
model, which for the most part is designed in a grid-like fashion where transfers are essential. To
maximize the appeal of a transfer-based network, potential interruptions to passengers must be
minimized. As transferring does impose a time delay for passengers, Vuchic (2005) classifies
“convenient” transfers based on the headway of the destination line, as transferring from any line
to a line with a short headway (less than 10 minutes) involves short transfer times, and in this case
no need for schedule coordination at transfer points is needed. However, transferring from any line
to a long-headway line (10 minutes or more) can involve short or long waiting times, thus
impacting the convenience of this transfer. When transfers are planned effectively and disruption
to customers is minimized through good network design (i.e. schedule coordination, frequent

86
service, pedestrian connections and wayfinding), transfers can be beneficial by offering passengers
a much greater selection of travel paths compared to direct-service networks (Vuchic, 2005).
Badia et al. (2017) presented a case study of a reshaped bus network in Barcelona, which
transitioned from a direct-service network to a transfer-based network, which increased demand
for service. This experiment suggests that bus users are less averse to transfers than previous
literature found due to higher demand. However, what is missing from the above literature on
transferring is the stated preference or perception of customers’ while transferring.
Within the literature on public transport customer satisfaction, the research on transfers has
largely focused on details related to the quality of the transfer experience. For example,
Tyrinopoulos and Antoniou (2008) evaluated the importance of service attributes related to overall
satisfaction in Greece, and observed that factors related to transfer coordination, including
distance, waiting time and information, are of high priority to customers. Similarly, Susilo and
Cats (2014) found that the ease of transferring impacts overall satisfaction. de Abreu e Silva and
Bazrafshan (2013) evaluated passengers’ satisfaction of intermodal transfer facilities, to
understand which characteristics of these infrastructures have the greatest influence on passenger
satisfaction. The authors concluded that investments in station maintenance, signage and security
are important for increasing satisfaction levels. Similarly, Hernandez, Monzon, and de Oña (2016)
studied the discrepancies between performance ratings and the relative importance of features in a
transport interchange in Spain, observing that improvements in comfort inside the interchange,
number and variety of shops, and aspects related to emergency situations should be high priority
areas of improvement due to their low performance ratings yet high importance. Lastly, Guo and
Wilson (2004b) showed that presence of escalators increase the willingness of passengers to
transfer, and perception of the pedestrian environment can influence the decision to transfer or not,

87
whereby a positive perception of the walking environment influences passengers to walk further
distances to avoid transferring.
Despite the knowledge that can be garnered from the above discussion on how transfer
stations and stops can be designed to improve the transfer experience for passengers, Iseki and
Taylor (2010) found that the influence of the physical characteristics of the facility were minor
compared to factors related to the frequency and reliability of service and personal safety. In a
study specifically focusing on the experience of bus transfers, Stradling et al. (2007) similarly
found that the previously mentioned service characteristics were most important to passengers,
with the addition of protection against the weather. While the customer satisfaction literature
discussed above focused closely on satisfaction with transferring and/or transferring facilities,
surprisingly little is known about how transferring impacts overall satisfaction levels.
4.4 BACKGROUND AND DATA
The data used in this study was obtained from the 2017/18 McGill University Travel Survey. The
majority of McGill University students, faculty, and staff commute to the downtown campus in
the heart of Montreal, Canada with an average mode of share of 56% using public transport for
their daily commute. However, McGill does have a second campus, Macdonald campus, located
in the suburbs of the Island of Montreal (approximately 35 km from the downtown), as well as
several teaching hospitals located throughout the city. Figure 1 shows the location of McGill’s
downtown campus and Macdonald campus in relation to the public transport network. Montreal’s
public transport network is comprised of buses, subways and commuter train lines, however the
subway and bus network are operated by the Société de transport de Montreal (STM), while the
commuter train network is operated by Exo. This means that passengers transferring from the train

88
to the subway pay two fares or a more expensive monthly fare compared to riding one of the two
networks. Presently, transfers across the network are not synchronized.
The public transport system in Montreal was designed with a direct-service model to
downtown complemented with a transfer-based model feeding into the direct-service network.
With regards to the stop and station design of Montreal’s public transport network, all subway
stations are located underground. All of Montreal’s subway stations have an indoor heated space
for passengers to wait when connecting to a bus, yet in many cases bus stops are located within a
walking distance from this waiting area. Many passengers do wait outdoors for their bus
connection in front of subway stations. Some of Montreal’s bus stops have a shelter, however these
shelters are rarely heated. Commuter trains operate above ground, except for a small portion of
track that is operated underground in downtown Montreal. Above-ground train stations are
equipped with shelters for passengers to wait. All trains and most subway platforms provide
customers with real-time information however few bus stops are equipped with next-bus
information. Next arrival information for buses is present only for smart phone users with internet
connections through two applications.

89
Figure 14: Map of the location of McGill University relative to the Montreal public transit network
The survey was distributed to all McGill staff and faculty, while a random sample of one
third of the student population were selected to complete the survey. All selected participants
received an invitation via email to complete the survey online, and various prizes were offered to
entice participants to complete the survey. One reminder email was sent to each participant who
had not completed the survey within two weeks of receiving the initial invitation. Half of the
selected participants were invited to participate in the survey in fall 2017, while the other half were
invited to complete the survey in winter 2018. A total of 16,930 invitations were sent in the two
seasons. This allowed us to obtain a representative sample of commutes under different weather
trends. A total of 4,859 completed responses were obtained, representing a 33.4% response rate.
Our final sample consisted of 1,342 responses who commuted to either of McGill’s campuses by
public transit and answered questions related to their home address or postal code, satisfaction

90
with commute, travel time, and stated the number of distinct bus, subway and train lines that they
used on their last commute, representing 27.6% of the collected sample. Respondents were asked
to state the time they departed home and arrived at McGill. Of those respondents whose reported
travel time was approximately 12 hours, we adjusted for mistakes in the reporting of either the AM
or PM time by determining which arrival and departure time made sense with their reported time
of departure from McGill at the end of the day. Lastly, we did not remove respondents who drove
or bicycled to a public transit station from our sample.
4.5 METHODOLOGY
Our analysis begins by presenting descriptive statistics of the relationship between satisfaction
levels of each respondent’s most recent trip to McGill University and transferring. In this study a
transfer is present any time the public transit user switches routes or modes on his/her way to
school or work. For example, a trip that began on a bus and then required two subway lines would
be a two-transfer trip. We then disaggregate the relationship between transferring and satisfaction
further by segmenting our study sample first by number of transfers and second by public transit
modes involved in each transfer. Chi-square tests were then conducted to test for statistically
significant differences between satisfaction levels between the different groups. Following the
descriptive statistics, we conducted two binary logistic models to assess the determinants of overall
satisfaction, with the goal of disentangling the effects of transferring on overall satisfaction. The
dependent variable for both models was derived from the following question: “Overall, how
satisfied are you with your most recent trip?” This question was asked on a five-point Likert scale.
Due to the failure of the parallel assumption test and for the ease of communicating our model
findings, we recoded this satisfaction variable as a binary variable, satisfied or unsatisfied. Values

91
4 and 5 were considered satisfied (coded as 1) and values of 3 and lower were unsatisfied (coded
as 1).
Model 1 controls for the number of transfers involved in each respondents’ trip. While
Model 2 controls for the mode-specific transfers that were observed, which includes: bus-bus,
subway-subway, bus-subway, subway-train, and bus-train transfers. It is important to note, that
these categories are not mutually exclusive, rather a trip may have involved more than one mode-
specific transfer, for example in the case of a trip that involved transferring between bus routes
and a transfer to the subway. A variable to capture number of modes used was tested in the model,
however was removed due to multicollinearity. For intermodal transfers, we do not know the order
in which the transfer occurred. Also, we were unable to study satisfaction when transferring
between train lines as no responses in our study sample reported using more than one train line. It
is a rare occasion in the Montreal train system to transfer between train lines due to the structure
of the train network, as all train lines converge in downtown Montreal.
All independent variables explored within this study are presented in Table 9. Travel time
was obtained by subtracting the respondents’ reported arrival and departure time (reported in 15-
minute increments) of their morning commute to McGill. Our decision to control for travel time
rather than trip distance reflects the relationship between travel time and satisfaction as noted in
previous literature (Dell’Olio, Ibeas, & Cecin, 2011; Mouwen, 2015; Susilo & Cats, 2014).
Furthermore, there is a potential waiting time associated with each transfer, and therefore holding
travel time constant in our model allows us to isolate the relationship between transferring and
satisfaction, to determine how significantly other factors associated with transferring impact
overall trip satisfaction. Lastly, to capture non-linear effects of travel time, we included the square
of travel time in the model.

92
Table 9: Description of variables and summary statistics
Variable Variable description Mean Std.
Personal characteristics
Car ownership Dummy variable equal to 1 if the respondent reported that they
own a car 46% --
Household size Number of people residing in the respondents' primary
household 2.80 1.33
Child at home Dummy variable equal to 1 if the respondent has a child under
the age of 16 living at home 27% --
Male Dummy variable equal to 1 if respondent is a male 37% --
Other Dummy variable equal to 1 if respondent identified as other 1% --
Age Age of the respondent 36.43 13.51
High income Yearly personal income above $80,000 16% --
Medium income Yearly personal income between $40,000 and $79,999 37% --
Trip characteristics
Fall trip Dummy variable equal to 1 if the surveyed trip in question
occurred in the fall semester (September - December 2017) 48% --
Travel time Reported travel time in minutes 51.67 23.02
Travel time
squared
A square term of travel time to capture the diminishing return
associated with travel time 3200.47 2972.82
Travel during
peak hour
Dummy variable equal to 1 if the surveyed trip occurred during
or partially during peak hours (7AM and 9AM) 65% --
Downtown
campus
Dummy variable equal to 1 if the individual reported spending
the majority of time at McGill’s downtown campus 99% --
Model 1
Number of transfers
One transfer Dummy variable equal to 1 if 1 transfer was needed to
complete the respondents' last trip 32% --
Two transfers Dummy variable equal to 1 if 2 or more transfers were needed
to complete the respondents' last trip 23% --
Model 2
Mode-specific types of transfers
Bus-bus transfer Dummy variable equal to 1 if a respondent transferred bus
routes 11% --
Subway-subway
transfer
Dummy variable equal to 1 if a respondent transferred subway
lines 32% --
Bus-subway
transfer
Dummy variable equal to 1 if a respondent transferred from a
bus route to a subway or a subway to a bus route* 31% --
Bus-train transfer Dummy variable equal to 1 if a respondent transferred from a
bus route to a commuter train* 3% --
Train-subway
transfer
Dummy variable equal to 1 if a respondent transferred from a
commuter train route to a subway line* 4% -- * For cross-model transfers, order of transfer between modes is unknown

93
Additional trip characteristics were included in our models, such as the season in which
the survey was completed (fall or winter), a dummy variable to differentiate a trip to the downtown
campus compared to another affiliated McGill University campus, and a dummy variable to
identify trips that occurred or partially occurred during the peak morning commute. Other
variables, such as a travel time ratio between public transit and walking as well as a ratio of travel
time by public transit to congested driving time, were tested but did not show an effect on trip
satisfaction so they were excluded from the models. Lastly, we tested whether individuals’
responses were spatially nested in their neighborhoods, requiring a multilevel modeling approach
to reduce potential spatial estimation bias. However, the test indicated that a multilevel model was
not needed for our data.
4.6 RESULTS
4.6.1 Descriptive statistics
Table 10 presents summary statistics of our study sample, average trip satisfaction, travel time,
and trip distance, according to the number and type of transfers taken on each respondent’s last
trip. Results of the chi-square tests of statistical significance are presented in Table 11 alongside
absolute differences between all groups. Looking at trends in average satisfaction according to
number of transfers we observe that satisfaction decreases with number of transfers, and each of
these differences are statistically significant. Of individuals who did not transfer on their last trip,
train and subway commuters are equally the most satisfied, followed by bus users, although this
difference is only statistically significant at the 90% level. Looking at average travel times, it is
important to note that the commute time for train users is almost twice as large as bus and subway
users, yet the satisfaction levels of these riders with zero transfers are all similar.

94
Table 10: Evaluating satisfaction levels and trip characteristics by number of transfers and mode-
specific transfers
N
Average
satisfaction
Average travel
time (min)
Average trip
distance (km)
Comparing trip details by number of transfers
0 transfer 598 4.13 49.47 12.26
1 transfer 433 3.90 58.61 14.01
2 or more transfers 311 3.20 79.66 17.59
All respondents 1,342 3.44 72.06 16.27
Trips with zero transfers
Train only 144 4.17 71.77 23.15
Bus only 247 3.96 40.69 7.12
Subway only 207 4.25 35.94 6.53
Mode-specific transfers
Bus-bus 154 3.48 62.24 11.47
Subway-subway 425 3.88 53.08 11.26
Bus-subway 414 3.73 58.91 12.93
Bus-train 40 3.60 87.00 26.12
Train-subway 51 3.69 77.65 25.32
Comparing satisfaction levels of individuals who completed at least one transfer in their
last trip (Table 10), we see that individuals who transferred subway lines were more satisfied (mean
of 3.88 out of 5) compared to those who transferred bus routes (mean of 3.5 out of 5). We also see
that individuals transferring from a subway to a bus were more satisfied (mean satisfaction of 3.73)
compared to people transferring bus routes. We also observe that trips that involved a transfer
between a bus and a subway were more satisfied (3.73) than trips involving a transfer between a
train and a subway (3.69), although this difference is at the 90% level. No significant differences
in mean satisfaction were observed between the remaining mode-specific transfers.

95
Table 11: Statistical significance of difference in mean satisfaction levels of trips according to
number of transfers and mode-specific transfers, using a Chi-square test
Number of transfers
0 transfers 1 transfer 2 or more
transfers
0 transfers ---
1 transfer 0.23** ---
2 or more transfers 0.7*** 0.24** ---
Trips with zero transfers
Train Bus Subway
Train ---
Bus 0.21* ---
Subway 0.08 0.29* ---
Mode-specific transfers
Bus-bus Subway-subway Bus-subway Bus-train Train-subway
Bus-bus ---
Subway-subway 0.40*** ---
Bus-subway 0.25** 0.15 ---
Bus-train 0.12 0.28 0.13 ---
Train-subway 0.21 0.19 0.04* 0.09 ---
In the case of a statistically significant difference, the level of significance is represented as follows:
*** Significant at 99% ** Significant at 95% * Significant at 90%
4.6.2 Regression analysis
The first regression model presented in Table 12 concentrates on the direct impacts of the number
of transfers on satisfaction with last trip among public transit users while controlling for other
personal and trip characteristics excluding the type of transfer. Trips involving one transfer
compared to zero transfers have the same odds of being satisfied, while keeping all other variables
constant at their mean. The odds of being satisfied drops by 32% when two transfers or more are
required in a trip compared to zero transfers. In our sample only 3% of respondents transferred
either three or four times, and due to the rarity of these trips we combined them with two transfers
to avoid bias in our estimations.

96
With respect to other trip characteristics, travel time decreased the odds of satisfaction by
5% for every additional 15 minutes spent travelling. However, the square term of travel time is
positive and therefore indicates that there are diminishing effects of travel time on overall trip
satisfaction. This is mostly related to commuter train users, as they are generally more satisfied
and have the longest commute time. We see a modest decrease in satisfaction for those who
travelled during peak hours compared to non-peak hours, although this variable was not
statistically significant. While travel at peak hours can be frustrating for riders due to crowding,
higher frequency service during peak-hour travel, including shorter waiting times for transfers,
may for some passengers be more important in their overall perception of service quality and is
therefore a more satisfying time to travel. Individuals who spend the majority of their time at
McGill’s downtown campus are far more likely to be satisfied with their trip compared to those
who work on McGill’s Macdonald Campus, although this variable was not statistically significant.
This is mostly related to the level of service and the way the Montreal public transit system is
design as a direct-system to downtown. Furthermore, McGill University offers a shuttle service
between the two campuses, which likely explains why only 1% of our study sample reported
commuting by public transit to the suburban campus.
In terms of differences in satisfaction levels across seasons, we see that commuters in the
fall were 1.43 times more likely to be satisfied with their last trip compared to winter commuters.
In the 2017/2018 academic year, weather conditions differed substantially between the two seasons
in which the survey was active. Mean temperatures varied from 10 degrees Celsius in fall to -7
degrees Celsius in winter. Snow on the ground also changed by season with an average of less than
one centimeter in fall, to an average of 67 centimeters in winter.

97
Demographic characteristics were also important predictors of trip satisfaction. Our
findings indicate that females are 28% less likely to be satisfied when compared to males and
individuals who stated their gender as other. This finding echoes Handy and Thigpen (2018) who
observed that on average women were less satisfied with their commutes, reported higher levels
of stress, higher sense that their time while traveling is wasted, and a stronger dislike for their
selected transport mode compared to men. We also see a positive relationship between age and
satisfaction. A one-year increase in age is associated with 1% higher odds of satisfaction. With
respect to income level, we observe that medium income individuals are 1.48 times more likely to
be satisfied compared to low income individuals. Age and income were highly correlated with
position at the university (student, faculty or staff), and previous studies of commuting to
universities have observed a significant effect of role at the university. Handy and Thigpen (2018)
observed that faculty are highly satisfied with their commute, which they hypothesize is a result
of higher satisfaction in other domains such as income, job security and intellectual fulfillment.
Similarly, Sprumont, Astegiano, and Viti (2017) observed satisfaction levels of PhD students,
professors and staff and found that PhD students were the least satisfied with their commuting trip.

98
Table 12: Satisfaction with last trip model
Variable Odds Ratio Sig. † 95% Conf. interval
Interval]
Personal characteristics
Car ownership 1.25 0.92 1.71
Household size 0.97 0.86 1.09
Child at home 1.08 0.76 1.55
Female 0.72 ** 0.54 0.95
Other (ref = male) 1.42 0.24 8.38
Age 1.01 * 1.00 1.03
High income 1.55 0.89 2.69
Medium income (ref = low income) 1.48 * 0.99 2.21
Trip characteristics
Fall trip 1.43 ** 1.10 1.85
Downtown campus 2.53 * 0.83 7.66
Travel during peak hour 0.97 0.72 1.31
Travel time (minutes) 0.95 *** 0.93 0.97
Travel time squared 1.01 *** 1.00 1.01
Number of transfers (ref = 0 transfers)
One transfer 1.02 0.75 1.39
Two or more transfers 0.68 ** 0.49 0.96
Constant 3.77 * 0.95 14.98
AIC 1445.329
BIC 1528.56
Log likelihood -706.66
Observations 1,342
†*** Significant at 99% ** Significant at 95% * Significant at 90%, blank cell indicates no statistical
significance
The second regression model (Table 13), is similar to the first model yet it distinguishes
between different types of transfers. Demographic and trip characteristics in Model 2 all had the
same direction, statistical significance and similar odds ratios as in Model 1. Focusing first on
transfers between one public transit mode, we see that a transfer between two bus routes decreases
the odds of satisfaction by 37%, compared to a non-transferring trip, all else equal. In contrast, a
transfer between subway lines does not negatively impact satisfaction, rather this type of transfer
has no statistically significant impact on trip satisfaction. Looking at transfers between different
public transit modes, we see that commuters who transferred from a subway to a bus or vice versa
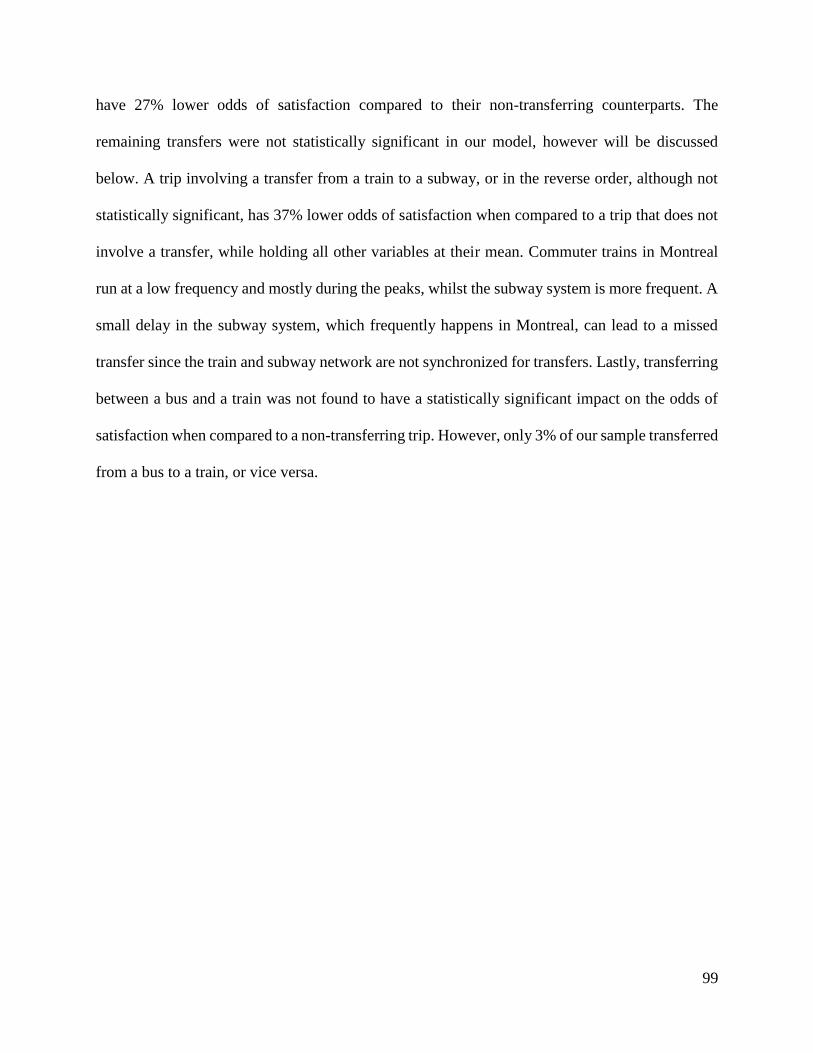
99
have 27% lower odds of satisfaction compared to their non-transferring counterparts. The
remaining transfers were not statistically significant in our model, however will be discussed
below. A trip involving a transfer from a train to a subway, or in the reverse order, although not
statistically significant, has 37% lower odds of satisfaction when compared to a trip that does not
involve a transfer, while holding all other variables at their mean. Commuter trains in Montreal
run at a low frequency and mostly during the peaks, whilst the subway system is more frequent. A
small delay in the subway system, which frequently happens in Montreal, can lead to a missed
transfer since the train and subway network are not synchronized for transfers. Lastly, transferring
between a bus and a train was not found to have a statistically significant impact on the odds of
satisfaction when compared to a non-transferring trip. However, only 3% of our sample transferred
from a bus to a train, or vice versa.

100
Table 13: Satisfaction with last trip with mode-specific controls
Variable Odds Ratio Sig. † 95% Conf. Interval
Personal characteristics
Car ownership 1.21 0.89 1.66
Household size 0.97 0.86 1.09
Child at home 1.09 0.76 1.57
Female 0.73 ** 0.55 0.96
Other (ref = male) 1.30 0.23 7.47
Age 1.01 * 1.00 1.03
High income 1.53 0.88 2.67
Medium income (ref = low income) 1.48 * 0.99 2.21
Trip characteristics
Fall trip 1.38 ** 1.06 1.79
Downtown campus 2.44 0.79 7.55
Travel during peak hour 0.94 0.70 1.28
Travel time (min) 0.95 *** 0.93 0.97
Travel time squared 1.01 ** 1.00 1.01
Type of transfer
Bus-bus transfer 0.63 ** 0.43 0.92
Subway-subway transfer 1.03 0.76 1.40
Bus-subway transfer 0.73 ** 0.54 0.97
Bus-train transfer 1.12 0.52 2.44
Train-subway transfer 0.63 0.31 1.26
Constant 3.94 ** 0.98 15.81
AIC 1445.84 BIC 1544.68 Log likelihood -703.92 Observations 1,342
†*** Significant at 99% ** Significant at 95% * Significant at 90%, blank cell indicates no statistical
significance
4.7 DISCUSSION OF RESULTS
Transferring is strongly associated with trip satisfaction however the results of both models
indicate that the relationship varies according to the number of transfers and the mode(s)
comprising a trip. Our results indicate that there are no statistically significant differences between
those who transferred once compared to those who did not transfer, all else equal. However, we

101
see that the odds of satisfaction decline by 32% for those who require two or more transfers. Imaz
et al. (2015) similarly found that trips involving 2 or more transfers negatively impact customer
loyalty. Public transport agencies should try to either minimize the number of trips involving two
or more transfers, or place efforts towards minimizing waiting times for these trips through
strategies such as increasing service frequency or a transfer synchronization approach.
Our results suggest that different types of transfers impact trip satisfaction differently.
Transferring between bus routes was the most dissatisfying transfer observed in our study. Currie
(2005) summarized transfer penalties observed from a range of studies and found far higher
valuations of transfer penalties for bus trips compared to rail-based modes, due to the time delays
caused by transferring routes. The observed declines in overall satisfaction levels among riders
who transfer bus routes can largely be attributed to waiting time which is negatively associated
with trip satisfaction (Cantwell, Caulfield, & O’Mahony, 2009). Vuchic (2005) classifies transfers
not according to mode but according to short and long headways, as he explains that transferring
to a route with a short headway (high service frequency) is convenient due to the short time delay
imposed by this transfer. This would explain why we see little impact on overall satisfaction for
passengers who transfer subway lines, as headways are short (around 3-4 minutes during peak
service) and therefore waiting time is minimal. With detailed data on the bus routes taken by each
passenger and their associated headways, future research should control for the headway of bus
routes and explore whether the observed differences in satisfaction levels still stand when
analyzing mode-specific transfers. For example, transferring bus routes in the winter may still
negatively impact overall trip satisfaction for bus users of a frequent service, due to waiting times
outdoors in cold temperatures, whereas subway riders transfer within heated stations.

102
Finally, we observed that a transfer between a bus and a subway decreases the odds of
satisfaction by 27%, all else equal. When transferring from a bus to a subway, this decline in odds
is potentially attributed to walking between the bus stop and subway platform, which can be
stressful if unfamiliar with the station layout. Improved wayfinding has been shown to positively
influence trip satisfaction, particularly among those who are unfamiliar with a station. Also, when
crowded it can be unpleasant walking through a station and during rush hour subway cars can be
overcrowded requiring that people wait for the next subway. Alternatively, for those transferring
from the subway to a bus, missing a bus due to slower than usual service can impact satisfaction.
While knowledge of the order of a bus-subway transfer would have been valuable for this analysis,
we would expect that most of these transfers occurred from the bus to subway, since McGill
University is located in close proximity to two subway stations.
Lastly, it is interesting to note that switching from a train to a subway (or a subway to a
train) shows a negative impact on trip satisfaction, although not statistically significant. In
Montreal, the commuter train network is operated by Exo mostly during peak hours and at a low
frequency, while the subway and bus network are operated by the Société de transport de Montreal
(STM) at a much higher frequency with little coordination in schedules between the two agencies.
Transferring between these two modes requires walking up and down many stairs and can be
particularly crowded and uncomfortable in rush hour. Also, a slight delay in a bus or a subway
ride can lead the train commuters to miss his/her connection. It is also important to note that the
subway and bus network require an additional fare for train riders, which is potentially contributing
to dissatisfaction among these users. Providing seamless fare integration for these riders will
potentially improve their satisfaction levels as well as encourage more riders to use these services.

103
A limitation of this data is that we cannot analyze satisfaction of non-public transport
riders. In a global review of the crucial strategic and tactical steps for designing and scheduling a
public transport network, Guihaire and Hao (2008) write: “In a general manner, if a trip requires
more than two transfers, it is assumed that the user will switch to another means of transportation”
(Guihaire & Hao, 2008, p. 1254). Given that only 3% of our study sample reported transferring
three times, Guihaire and Hao’s assertion that public transport users are unwilling to complete
three transfers appears to hold true in our study context. A stronger understanding of overall
willingness to transfer can be attained through mode choice analysis, for example (Eluru et al.,
2012). A mode choice analysis similar to the aforementioned study can shed light on the role that
transferring plays on travel behaviour, or the choice to take public transport compared to other
modes of travel. Furthermore, as this study only modeled the relationship between transferring and
satisfaction of trips that were taken for work and study purposes, future research should explore
the impact of transferring on trip satisfaction for other trip purposes such as leisure, utilitarian, etc.
Lastly, as the survey data used in this study was collected in the fall and winter, collection of data
in the summer would provide a complete picture of how under different weather conditions users
are satisfied with their trip, as well as how transferring impacts satisfaction across all seasons.
In this study, transferring was conceptualized in the traditional sense: a transfer either
between a public transport mode or across different modes. Recent literature has begun to
recognize the importance of conceptualizing a trip as a sequence of legs from origin to destination
with one trip purpose (Axhausen, 2008). These different trip legs, including access and egress can
influence satisfaction with the main leg (Susilo & Cats, 2014), and therefore inclusion of
satisfaction with each trip leg is becoming increasingly prevalent in the literature for improved
understanding of overall trip satisfaction (Abenoza, Cats, & Susilo, 2017a; Ettema, Abenoza, &

104
Susilo, 2016; Suzuki et al., 2014). Future research should explore whether our conceptualization
of transferring should be extended to include a ‘transfer’ from the first leg of our trip, for example
walking to a station or stop, to the first or main mode of public transport used to complete that trip.
Choice of station or stop access likely has an impact on this first ‘transfer’, particularly when
taking a mode of public transport that is infrequent. For example, choosing to bicycle to a train
station rather than taking the bus might positively impact that users’ overall trip satisfaction, as
bicycling provides a high degree of travel time reliability relative to the bus. In this example,
passengers who are satisfied with this first ‘transfer’ are potentially more likely to be satisfied with
their trip overall, compared to those who missed their connection.
4.8 CONCLUSIONS
Results of this chapter indicate that trips involving one transfer have similar satisfaction levels to
trips of a similar travel time that do not require a transfer, whereas steep declines in overall
satisfaction levels were observed for trips involving two or more transfers. The evidence presented
in this paper reveals that not all transfers have an equal impact on satisfaction. As expected,
transferring between bus routes and transferring between a subway and a bus both negatively
impacted satisfaction levels. Whenever possible, agencies should plan to coordinate transfers to
reduce the waiting time associated with each transfer. However, improvements to service
frequency and reliability will likely have the most significant impact on improving satisfaction
among these riders, since synchronizing transfers can come at a high cost for agencies and requires
strict schedule adherence for this strategy to be effective. Also synchronizing transfers can lead to
bus or subway holdings for substantial amounts of time until a bus or a subway arrives from
another direction to enable the synchronized transfer, which can delay other commuters. In
addition to increasing service frequency, improvements in station and stop design should be

105
considered, such as seating, cleanliness and protection from weather, to reduce the perceived
waiting time of passengers.
Interestingly, no significant impact on satisfaction was observed from transferring subway
lines. This is an encouraging finding for public transport agencies, as it presents evidence that not
all transfers negatively impact satisfaction. Moreover, this result shows that transferring between
high frequency routes does not impact total trip satisfaction levels in the same way as transfers
involving low frequency services, namely bus service. Service frequency has been identified as a
major factor influencing patronage growth (Currie & Wallis, 2008) and researchers have found
that operating a high-performance bus service with frequency levels and operational characteristics
similar to rail service can result in similar ridership attraction as rail (Ben-Akiva & Morikawa,
2002). This corroborates findings from Badia et al. (2017) where they observed an increase in
passenger demand in a Spanish network after it moved to high frequency transfer-based bus
network. A longitudinal analysis of satisfaction before and after such a network redesign would
contribute to the knowledge of whether dissatisfaction with transferring is mitigated in light of
high frequency service. In light of declining public transport ridership that has recently been seen
in many North American cities (Boisjoly et al., 2018), results of this study suggest that increases
in service frequency across the public transport network, mainly train and bus service, would
strongly reduce the observed dissatisfaction of transferring we saw in this study and should help
in retaining existing riders and attract new ones.
A limitation in our study is almost all questions were not mandatory, which led to a decline
in the sample size, and therefore future research should consider making all satisfaction questions
mandatory to yield a higher sample size. Also, finer detail of information related to each trip, such
as route number for every mode used, would have enriched our analysis and enabled comparisons

106
to online trip planner suggestions. In this study we used binary logistic regressions to model
satisfaction for the ease of communicating our results, future research can explore other modeling
techniques such as ordered or generalized ordered logits.

107
CHAPTER 5: ASSESSING OPERATION AND CUSTOMER PERCEPTION
CHARACTERISTICS OF HIGH FREQUENCY LOCAL AND LIMITED-
STOP BUS SERVICE IN VANCOUVER, CANADA
5.1 CHAPTER OVERVIEW
Building off the previous chapter (Chapter 4), this chapter continues to explore passenger
perceptions of service by examining differences in satisfaction levels among users of a local and a
limited-stop bus service. Limited-stop bus service is an operational service strategy employed by
transit agencies to decrease travel times for existing riders and to reduce pressure on the local route
that operates in parallel with the limited-stop service. To assess differences in satisfaction levels
between local and limited-stop bus users, operations data obtained from automatic vehicle location
(AVL) and automatic passenger counter (APC) systems are integrated into this analysis as a means
of controlling for the service characteristics these users have experienced, such as on-time
performance and passenger activity levels. This method is expected to provide deeper insight into
the determinants of satisfaction expressed by these passengers, compared to a method comparing
mean overall satisfaction values. The results reveal that after controlling for characteristics related
to the conditions of the service experienced by users, namely passenger activity levels, patrons of
the limited-stop bus service were more likely to be satisfied with the transit service compared to
users of the local service. This study finding indicates that the operational characteristics of a
limited-stop service, including in-vehicle time savings and higher route frequency, are highly
valued by its users. With that being said, reducing crowding along the limited-stop service is
critical in order to keep these riders satisfied with the service. Results of this study demonstrate
how operations data can provide greater context for customer satisfaction analyses. Finally, this
study provides transit planners and policy makers with a better understanding of how customers
perceive local and limited-stop service.

108
5.2 INTRODUCTION
The success of a public transit agency largely depends on the number of satisfied passengers using
the system and who will continue to use it in the future. Operational improvements, namely
reductions in travel time and advances in service reliability, increase the operational efficiency for
a public transit provider (Diab et al., 2015). However, these improvements may also increase
riders’ satisfaction (Hensher et al., 2003; Mouwen, 2015) and result in the growth of patronage
(Bates et al., 2001; Noland & Polak, 2002), which is an important measure of success for a public
transit provider. One of the most effective strategies to reduce the running time of a bus route is
the implementation of a limited-stop bus service along public transit corridors with high passenger
demand.
Limited-stop bus or express service is a special service that serves a limited number of
stops along a bus route where high passenger activity is present (Tétreault & El-Geneidy, 2010),
while usually a parallel route serves all stops along the same corridor. While limited-stop service
provides passengers with lower travel times, network design must be carefully considered to ease
passenger transfers, ensuring that the increased stop spacing does not increase the access and
egress time for passengers to the point that the overall travel time surpasses the base case (travel
time of the existing local service) (Ibarra-Rojas, Delgado, Giesen, & Muñoz, 2015; Scorcia, 2010).
Spacing of stops along a limited-stop bus service should be several times greater than a local
service (Vuchic, 2005) and located at high passenger activity stops and transfer points to maximize
the benefits from this kind of service. Whilst there appears to be little in the way of standards for
the implementation of a limited-stop bus service, Ercolano (1984) stated that time savings of a
limited-stop route must be at least 5 minutes in order for users to perceive the operational
improvements.

109
There are two main objectives of this study, first is to predict overall satisfaction levels of
users of two concurrent bus routes, a local and limited-stop bus service, while controlling for
operational characteristics of the service these users experienced. The second objective is to
expand our understanding of how operations data, collected from automatic vehicle location
(AVL) and automatic passenger counter (APC) systems, can be used to better understand how
customers perceive transit service. Using AVL/APC data and customer satisfaction data collected
for a local and limited-stop bus route in Vancouver, Canada, logistic regression modeling is
employed to understand how service characteristics influence overall satisfaction levels of local
and limited-stop route users. Results of this article provide further insight on how customers
perceive the quality of limited-stop bus service and contribute to the limited knowledge in the
literature regarding how operational data can be used to provide a complete picture of satisfaction
levels, particularly how experience with transit service affects passenger satisfaction levels.
This study commences with a review of relevant literature on customer satisfaction and
operational benefits of limited-stop and local bus service, which is followed by a description of
the study context. The next section provides a detailed description of the operations data and
customer satisfaction data used in this study, which is followed by a detailed explanation of how
we merged the operations data to each survey respondent. Next, we present the satisfaction data
used in this study and model results of overall satisfaction levels with bus operations data. Finally,
the results are discussed and conclusions from this paper are drawn.
5.3 LITERATURE REVIEW
The implementation of a limited-stop bus service and the various benefits resulting from this
operational strategy have been studied from many different approaches. Broadly, the literature can
be categorized into studies that evaluated the operational benefits of this new service strategy (Diab

110
& El-Geneidy, 2012; Surprenant-Legault & El-Geneidy, 2011; Tétreault & El-Geneidy, 2010),
how customers perceived the new service (Conlon, Foote, O'Malley, & Stuart, 2001), studies
evaluating best practices for the design of such routes (Chen, Liu, Zhu, & Wang, 2015;
Chiraphadhanakul & Barnhart, 2013; Leiva, Muñoz, Giesen, & Larrain, 2010) and others
recommending planning approaches for designing the service (Tétreault & El-Geneidy, 2010).
El-Geneidy and Surprenant-Legault (2010) observed bus run time savings of a newly
implemented limited-stop bus service in Montreal and found a decrease in the running time of 13%
during peak hours. Similarly, running time savings of 10.8% were observed by Diab and El-
Geneidy (2012) while evaluating changes in run time along the same route evaluated as the
previously mentioned study, after a combination of operational service strategies were
implemented along this bus corridor in Montreal. Declines in running time between 10.8% and
13% can lead to substantial savings in operations. Both studies were conducted on an express bus
service which operates parallel to a local bus service that serves all bus stops including the limited
and intermediate stops. In terms of the local bus service, time savings are also expected on this
route because a proportion of the passenger activity of this route will shift to the new limited-stop
service (Tétreault & El-Geneidy, 2010).
In addition to studying the operational benefits associated with limited-stop bus service, a
few studies have in parallel evaluated how customers perceived the implementation of a limited-
stop service. Conlon et al. (2001) studied the implementation of a new limited-stop route in
Chicago and found significant increases in satisfaction among the users of the new service.
Furthermore, the authors reported that this new service attracted new riders to the route, increased
the share of infrequent riders along the route, and drew riders from other bus routes. Following the
implementation of a new limited-stop line in Montreal, El-Geneidy and Surprenant-Legault (2010)

111
surveyed users on their perception of travel time savings, and observed that among users that
reported switching to the limited-stop bus service, 66% of riders reported a decrease in their travel
time and on average these users reported times savings within the range of 6.9 to 11.9 minutes,
although real time savings were on average 1.5 minutes per trip. A similar result was observed by
Diab and El-Geneidy (2012), who found that 55% of users reported a decrease in their travel time,
and riders overestimated their travel time savings within a range of 2.5 to 6 minutes. Also, the
authors noted that riders were walking longer distances to use the faster limited-stop service.
Accordingly, passengers have a positive attitude towards service improvements, and generally
overestimate travel time savings compared to reality, which was also observed by El-Geneidy et
al. (2017) after determining that users overestimated the time savings associated with an all-door
boarding pilot project. Reasons for the overestimation of the benefits associated with a newly
implemented service strategy such as limited-stop service remain unclear, and how these
perceptions change over time is unknown (Diab et al., 2015).
Archived data collected through AVL and APC systems provide transit agencies with a
rich and extensive database that can be analyzed in transit research for planning and operational
improvements (Dueker, Kimpel, Strathman, & Callas, 2004; EI-Geneidy, Strathman, Kimpel, &
Crout, 2006). However, the use of operations data in combination with perception variables to
understand what influences users’ satisfaction levels has been rarely demonstrated in the literature.
While satisfaction measures obtained from passengers are frequently incorporated in performance-
based contracts due to the presumed link to the overall performance of a provider, few studies have
actually examined the link between customer satisfaction data and performance measures in public
transit (Friman & Fellesson, 2009), with the recent exception by van Lierop and El-Geneidy
(2017b). Davis and Heineke (1998) argue that satisfaction surveys are most valuable if a link can
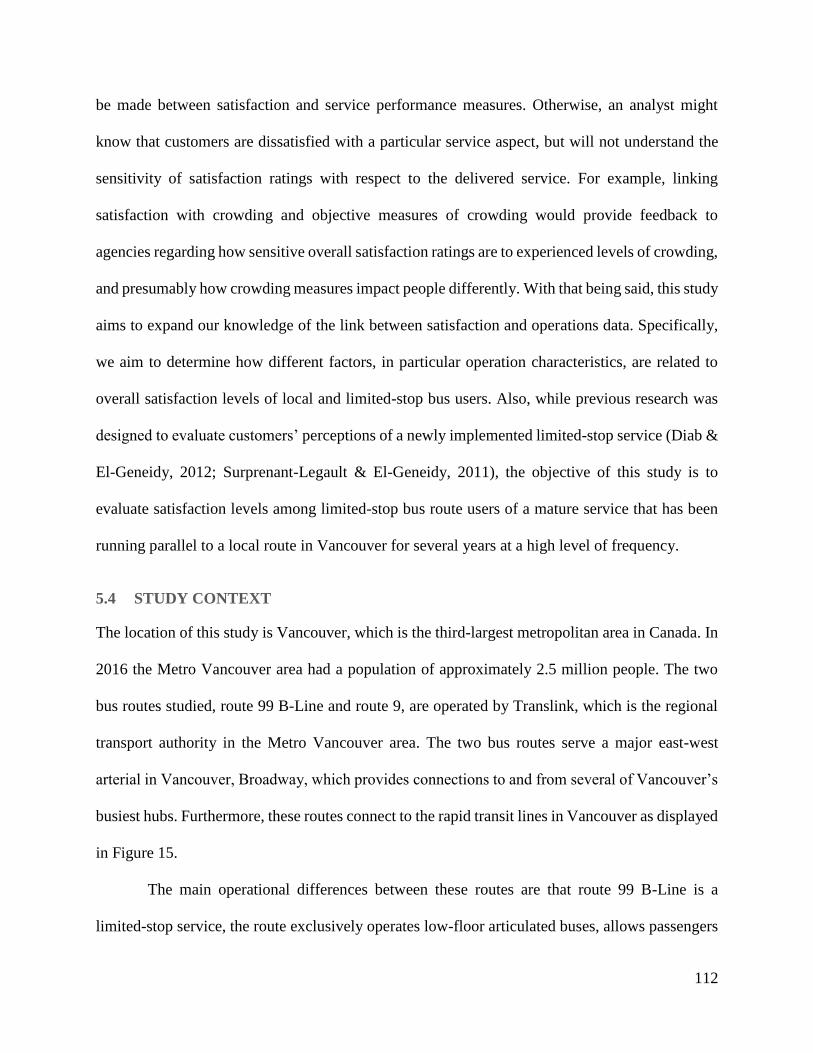
112
be made between satisfaction and service performance measures. Otherwise, an analyst might
know that customers are dissatisfied with a particular service aspect, but will not understand the
sensitivity of satisfaction ratings with respect to the delivered service. For example, linking
satisfaction with crowding and objective measures of crowding would provide feedback to
agencies regarding how sensitive overall satisfaction ratings are to experienced levels of crowding,
and presumably how crowding measures impact people differently. With that being said, this study
aims to expand our knowledge of the link between satisfaction and operations data. Specifically,
we aim to determine how different factors, in particular operation characteristics, are related to
overall satisfaction levels of local and limited-stop bus users. Also, while previous research was
designed to evaluate customers’ perceptions of a newly implemented limited-stop service (Diab &
El-Geneidy, 2012; Surprenant-Legault & El-Geneidy, 2011), the objective of this study is to
evaluate satisfaction levels among limited-stop bus route users of a mature service that has been
running parallel to a local route in Vancouver for several years at a high level of frequency.
5.4 STUDY CONTEXT
The location of this study is Vancouver, which is the third-largest metropolitan area in Canada. In
2016 the Metro Vancouver area had a population of approximately 2.5 million people. The two
bus routes studied, route 99 B-Line and route 9, are operated by Translink, which is the regional
transport authority in the Metro Vancouver area. The two bus routes serve a major east-west
arterial in Vancouver, Broadway, which provides connections to and from several of Vancouver’s
busiest hubs. Furthermore, these routes connect to the rapid transit lines in Vancouver as displayed
in Figure 15.
The main operational differences between these routes are that route 99 B-Line is a
limited-stop service, the route exclusively operates low-floor articulated buses, allows passengers

113
with a prepaid fare to board at all doors of the bus, and the alignments of the two routes differ
slightly at the eastern and western ends. The western terminus of route 99 is located at the
University of British Columbia (UBC), whereas route 9 ends around 4 km prior to UBC, whilst it
provides occasional service to the university (between September and April). From the eastern
side, route 9 commences around 3 km east of route 99 at Boundary Loop, then it is joined by the
99 B-Line at Commercial Drive to run in parallel along Broadway street until it intersects with
Alma street in the west where route 9 usually ends. The alignments of both routes are displayed in
Figure 15. The 99 B-Line has an average one-way route length of 13.9 km, and on average the
travel time is 40 minutes. Route 99 B-Line has an average daily boardings of 55,000 passengers,
making it the busiest bus route in the Translink bus network (Translink, 2016). During peak hours,
customers using the 99 B-Line service experience a headway of 3.5 minutes or less between buses.
The average one-way length of the local bus service (route 9) is 10.4 km and has an average trip
duration of 63 minutes. During peak hours, the headway of route 9 is 5 minutes. In 2015, the
average weekday daily boardings on route 9 were 22,950 riders, making route 9 the fourth busiest
route in the network.

114
Figure 15: Context map for routes 99 B-Line and 9 in Vancouver, Canada
Two sources of data were obtained from Translink: (1) AVL/APC operations data, and (2)
customer satisfaction survey data. In our analysis we use only data collected between January 1,
2011 and December 31, 2013 from both sources. The analysis of this study commences with a
descriptive analysis of operational differences between both routes and differences in perception
of service quality among route 99 B-Line and 9 riders. This is followed by an analysis of customer
perceptions of service quality among express and local bus users, which controls for the actual
service these customers experienced (operations data).

115
5.5 ANALYSIS
5.5.1 Operations data
The operations data (AVL/APC data) employed in this study was provided by Translink. For routes
99 and 9, these data are collected at the stop-level and include scheduled and actual trip start time,
scheduled and actual stop arrival and departure times, details regarding the use of the wheelchair
ramp or bicycle rack, the number of boardings and alightings (averaged across all doors), and the
passenger load departure. Table 14 presents summary statistics of operations data, to differentiate
operational characteristics of both the express bus service (route 99) and local bus service (route
9). We cleaned the source data by removing incomplete trips and trips on the weekend and
holidays.
Table 14: Descriptive statistics of operational characteristics of both routes
99 B-Line
Limited-stop
service
Route 9
Local service
Variable Name Description Mean SD Mean SD
On-time
performance
The percent of stops where a bus
arrived more than 5 minutes late. 12% 19% 7% 17%
Passenger activity
The number of passenger
boardings and alightings at all
doors during a trip.
235.2 102.3 132.3 77.5
Stop-level passenger
activity
The number of passenger
boardings and alightings at stops
during a trip.
16.5 7.2 8.8 22.2
Passenger load The number of passengers on a
bus at the departure of a stop. 34.9 16.8 13.4 6.8
Crowding
Percent of trips with one or more
stops that had a passenger load
that exceeded the capacity of the
bus.
19% 40% 4% 19%
Bicycle rack usage Percent of trips where the bicycle
rack was used. 41% 49% 11% 31%
Wheelchair ramp
usage
Percent of trips where the
wheelchair ramp was activated. 21% 41% 15% 36%

116
The summary table of operational characteristics of both bus routes indicates that the
express service experiences on average twice the number of passenger boardings and alightings as
the local bus service. The average passenger load of a bus along route 99 is 34.9 passengers, which
is significantly higher than the average load at stops along route 9 (13.4 passengers). It is important
to note that route 99 B-Line is exclusively served by articulated buses with a capacity of 85
passengers, whereas route 9 is operated by standard sized buses that have a capacity of 55
passengers. Despite the operation of higher capacity vehicles along route 99, 19% of trips along
route 99 from our study sample experienced extreme crowding levels at one or more stops along
the trip, and this number increases to 30% of trips during the evening peak. Along trips operated
by route 9 however, only 4% of trips achieved extreme levels of crowding along a trip.
5.5.2 Customer satisfaction data
As of 2015, routes 99 and 9 were ranked the first and fourth busiest bus routes, respectively, in the
Translink network. There are key operational differences between these routes, namely route 99
only serves select stops, which reduces the run time by approximately 23 minutes compared to
route 9 that serves both the limited stops and all intermediate stops. Also, route 99 allows
passengers to board at any door of the bus as long as they have prepaid fares. Accordingly, we
wanted to assess how passengers perceived these differences in operational characteristics, by
evaluating satisfaction levels among respondents whose most recent trip was on either one of these
two routes, while controlling for the performance of these two routes using the AVL/APC data
introduced above.
The customer satisfaction surveys are conducted quarterly and are collected with the
purpose of evaluating how existing customers (specifically participants who reported taking a trip
in the past 30 days) perceive the quality of service provided by Translink. Surveys are conducted

117
by telephone, and are voluntary, which can result in non-response bias. The survey begins broadly
by asking customers to rate their overall experience with the transit system in the Greater
Vancouver Region within the past seven days. Then, the survey asks respondents to name the
mode(s) and route number they have used during their last or second to last trip and follows that
with questions about their perception of service quality during that trip. The survey questions cover
a range of service characteristics, including their perception of crowding, trip duration, and the on-
time performance of their most recent trip. At the end of the survey, participants are asked a series
of questions related to their socio-demographic and household characteristics and their usage of
transit.
For the purpose of our study, we selected respondents who reported using the bus on their
last trip, but removed users who reported using more than one bus or mode, to avoid any bias that
may impact their perception of the service on route 9 or 99. We focused on questions related to
the customers’ perception of the performance of these two routes, for example the level of
crowding and how one would rate the trip for providing punctual service. Table 15 presents
summary statistics of the differences in socio-demographics between the limited-stop (route 99)
and local (route 9) riders, and mean levels of satisfaction related to service performance variables.
A t-test was used to compare mean values of riders on route 99 and 9, to assess statistically
significant differences of user-reported perceptions of service characteristics as well as differences
in socio-demographic characteristics and usage levels of the two groups of users.

118
Table 15: Summary statistics of survey variables comparing Route 99 and 9 users
99 B-Line
Limited-stop service
N = 485
Route 9
Local service
N = 194 Personal Variables Age 16-34 25% 15% ***
Age 35-54 39% 39% Age 55 plus 36% 46% **
Household Income level
Under $25,000 12% 19% **
$25,000 – 55,000 23% 30% **
$55,000 – 85,000 27% 30%
$85,000 and over 38% 21% ***
Employed full time 49% 45%
Student 11% 5% ***
Transit Usage
Irregular riders 10% 10% Customer for over 1 year 83% 83%
Compared to 6 months ago, are you now
riding transit…
More regularly 13% 17%
Less regularly 11% 8%
The same 76% 75%
Access to a car 69% 61% *
Likely to continue to use transit 92% 88% Satisfaction levels Overall service provided by the transit system
in the Greater Vancouver Region 7.7 7.9 *
Satisfaction with previous trip on route 9/99 7.5 8.0 ***
Crowding 5.3 7.5 ***
On-time reliable service 7.9 7.7 Trip duration 8.5 8.5 Frequency of service 8.1 7.6 ***
Significantly different sample mean: ***=p<0.01, **=p<0.05, *=p<0.1
As indicated in Table 15, users of route 99 are younger, are more likely to be students and
have higher levels of income compared to route 9 users. Regarding their satisfaction levels,
differences are observed, however the most noteworthy difference among these riders is their
perception of crowding. Namely route 99 users are very dissatisfied with crowding levels (mean
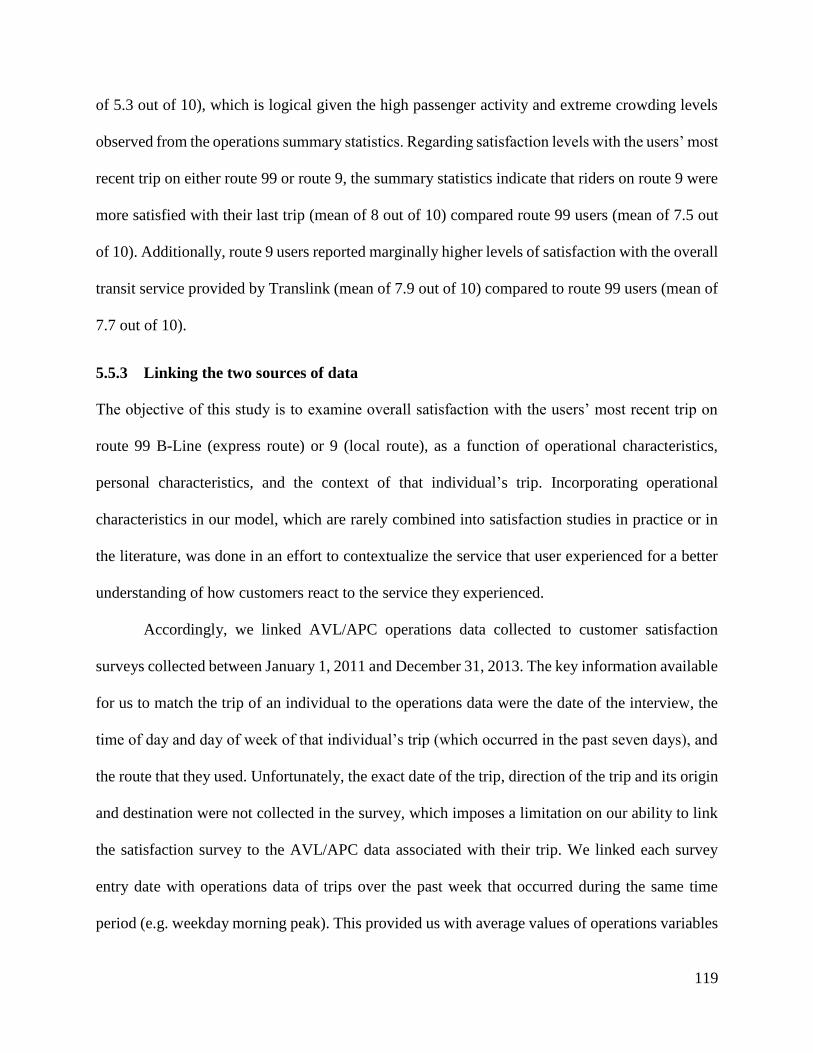
119
of 5.3 out of 10), which is logical given the high passenger activity and extreme crowding levels
observed from the operations summary statistics. Regarding satisfaction levels with the users’ most
recent trip on either route 99 or route 9, the summary statistics indicate that riders on route 9 were
more satisfied with their last trip (mean of 8 out of 10) compared route 99 users (mean of 7.5 out
of 10). Additionally, route 9 users reported marginally higher levels of satisfaction with the overall
transit service provided by Translink (mean of 7.9 out of 10) compared to route 99 users (mean of
7.7 out of 10).
5.5.3 Linking the two sources of data
The objective of this study is to examine overall satisfaction with the users’ most recent trip on
route 99 B-Line (express route) or 9 (local route), as a function of operational characteristics,
personal characteristics, and the context of that individual’s trip. Incorporating operational
characteristics in our model, which are rarely combined into satisfaction studies in practice or in
the literature, was done in an effort to contextualize the service that user experienced for a better
understanding of how customers react to the service they experienced.
Accordingly, we linked AVL/APC operations data collected to customer satisfaction
surveys collected between January 1, 2011 and December 31, 2013. The key information available
for us to match the trip of an individual to the operations data were the date of the interview, the
time of day and day of week of that individual’s trip (which occurred in the past seven days), and
the route that they used. Unfortunately, the exact date of the trip, direction of the trip and its origin
and destination were not collected in the survey, which imposes a limitation on our ability to link
the satisfaction survey to the AVL/APC data associated with their trip. We linked each survey
entry date with operations data of trips over the past week that occurred during the same time
period (e.g. weekday morning peak). This provided us with average values of operations variables

120
we anticipated would impact an individual’s overall satisfaction levels, such as on-time
performance, crowding, passenger activity and leave load. We also calculated the standard
deviation and coefficient of variation for each variable, to control for variability in service
characteristics throughout the seven days. Linking these two sources of data was done to better
understand the service these users experienced and to determine how operational characteristics
predict overall satisfaction levels.
5.5.4 Overall satisfaction model
Our goal is to understand the factors impacting the satisfaction level of users of route 99 or 9.
Accordingly, a logit model was employed to predict a satisfied user or not, using the following
question as our dependent variable: “Based on your own experience in the past seven days, on a
scale of one to ten how would you rate the overall service provided by the transit system in the
Greater Vancouver Region?” The selection of this question as our dependent variable, rather than
satisfaction with the users’ last bus trip will be discussed in the final section of this paper.
Satisfaction was asked on a scale between 0 and 10, so a binary variable was created, where
responses of 8 and above were converted to “satisfied” and below 8 “dissatisfied”. These cut-offs
are based on the internal threshold for which Translink considers customers as satisfied or not. We
modeled overall satisfaction as a function of operations variables we collected over the seven days,
including on-time performance, passenger load, passenger activity and crowding, and
characteristics of that trip, including the route used (99 or 9), and whether the trip occurred during
a peak hour. We then expanded our model to include personal characteristics, including age,
household car access, and their frequency of transit use.
Two logit regression models were developed using overall satisfaction with transit service
in the Greater Vancouver Region as the dependent variable, and the results are presented in Table

121
16. Model 1 assesses whether the operations variables describing the context of the service during
the past seven days, i.e., the conditions experienced by route 99 and 9 users, influenced overall
satisfaction levels. Model 2 expands on Model 1 by including personal characteristics of the user,
namely their age category. Both models have a total sample size of 679.
The key policy variable in Model 1 is the route 99 dummy variable, which accounts for
whether a respondents’ last trip was along this route and controls for the operational characteristics
that are unique to the limited-stop service. This variable showed a positive and statistically
significant impact on the likelihood that a user was satisfied with the service delivered by
Translink. More specifically, the odds of an express route user being satisfied are 4 times higher
than a local route user, while controlling for other variables. This suggests that route 99 users are
more likely to be satisfied with service than users of route 9 when experiencing similar service
characteristics, including levels of passenger activity. As expected, more heavily loaded buses and
trips with higher passenger activity decrease the odds of satisfaction among riders. With
consistently high passenger demand along bus routes such as route 99, passengers do not know if
they will be able to board the bus or whether they will have to wait for the next bus. This results
in greater variation in waiting time and travel time for customers (Tirachini, Hensher, & Rose,
2013), which may change customers’ behavior, as risk-averse riders may choose a route with lower
occupancy rates (Kurauchi, Bell, & Schmöcker, 2003), for assurance that they will be able to board
the bus.
Variables that were tested in our model but did not reveal statistical significance include
average on-time performance and the standard deviation of on-time performance. The percentage
of crowded stops along a trip (stops where the bus departed a stop exceeding the capacity) also
revealed no statistical significance in our model. Crowding has many effects on both the operations

122
of bus service and passengers’ well-being (Z. Li & Hensher, 2011; Milkovits, 2008), however the
impact of crowding on riders is very complex to analyze particularly in this study predicting
satisfaction of users from two bus routes, as a result of the mediating effect of the travel time
savings experienced by route 99 users, despite higher crowding levels. Also previous research has
shown variance in satisfaction levels with crowding during the peak and off-peak which was
mostly related to expectations of riders (van Lierop & El-Geneidy, 2017b). In other words, riders
using the route 99 were found to be satisfied with a crowded bus during the peak and not satisfied
with the same level of crowdedness along a bus route operating during the off-peak.
Table 16: Predicting satisfaction with transit service
Model 1: Operations data Model 2: Operations data and
personal characteristics
Variable OR Confidence level OR Confidence level 2.5% 97.5%
2.5% 97.5%
Constant 131.11* 1.03 2.65 213.79** 1.44 39327.79
Operations Data
Average leave load 0.88** 0.78 0.98 0.88** 0.78 0.98
Variation in leave load 0.17 0.00 99.35 0.17 0.00 105.86
Passenger activity 0.98* 0.96 1.00 0.98** 0.96 1.00
Passenger activity squared 1.00*** 1.00 1.00 1.00*** 1.00 1.00
General Trip Information
AM peak trip 1.08 0.52 2.26 1.19 0.57 2.51
PM peak trip 0.83 0.44 1.55 0.95 0.50 1.79
Off-peak trip Reference
Route 99 4.00** 1.06 15.73 4.68** 1.22 18.77
Satisfaction Variables
Age 16 – 34 years --- --- --- 0.68* 0.43 1.06
Age 35 – 54 years --- --- --- 0.56*** 0.39 0.82
Age 55 and over --- --- --- Reference
Goodness-of-fit measures AIC: 869.55
BIC: 905.72
N = 679
Log likelihood: -426.78
AIC: 864.57
BIC: 909.77
N = 679
Log likelihood: -422.28
***=p<0.01, **=p<0.05, *=p<0.1

123
Model 2 expands on our first model by incorporating personal characteristics of the user.
We tested different variables including car access, employment status, frequency of transit use and
income level and found no statistical significance of these variables in our model. Similar
operational results are found after controlling for users’ age. When compared to individuals aged
55 and over, the odds of users between the ages of 16 and 34 being satisfied are 32% lower.
Similarly, the odds of being satisfied for users between the ages of 35 to 54 years is 44% lower
than users aged 55 and over. Lower satisfaction levels in younger cohorts have been similarly
observed and explained by the greater likelihood to be employed full time and undertaking many
responsibilities that include travel (van Lierop & El-Geneidy, 2017b).
5.6 DISCUSSION AND CONCLUSIONS
The main objective of this article was twofold. The first objective was to predict satisfaction levels
of users of a local and limited-stop bus service, while controlling for personal and operations
characteristics. The second objective was to expand our knowledge of how operations data can
provide a more complete understanding of passenger satisfaction levels. Operations data extracted
from AVL/APC systems were first employed to provide context for operational differences at the
stop and trip level between the local and limited-stop bus service. Overall, we found that passenger
activity levels are significantly higher on the limited-stop bus service (99 B-Line) compared to the
local bus service. Next, we evaluated differences in satisfaction levels and personal characteristics
of the local and limited-stop service users included in our study sample, to provide a base
understanding of satisfaction levels of these groups of riders. Finally, we constructed two logit
models to predict overall satisfaction with transit service in the Greater Vancouver Region, as a
function of passenger activity and stop observations and personal characteristics of the users
studied. The model results revealed that 99 B-Line users (limited-stop bus route) are 4.7 times

124
more likely to be satisfied with overall bus service compared to route 9 (local route) users, when
keeping all other variables at their mean. In other words, under the same conditions of crowding
and passenger activity, express route users are far more likely to be satisfied. Accordingly,
characteristics of a limited-stop route service that are captured in the dummy variable of our model,
such as the significantly lower travel time that is offered by a limited-stop service, the operation
of articulated buses, and higher service frequency have an important impact on a customers’
satisfaction levels among existing users.
Regular monitoring of customers’ perception of service through the collection of customer
satisfaction surveys is one of the most widely used and recognized tools in the industry to directly
capture the customers’ perception of service quality (Davis & Heineke, 1998; Hensher et al.,
2003). Accordingly, methods of survey data collection and the specific questions included in
questionnaires are critical for the collection of high quality, meaningful data. In this study context,
the survey administered by Translink was designed to first ask customers about their rating of the
quality of transit service in the Greater Vancouver Region and then asked detailed questions
regarding the last trip they took within the past seven days. By linking satisfaction data to
operations data of the past five weekdays corresponding to when the respondent was interviewed,
we were able to predict the respondents’ overall satisfaction with transit service as a function of
operations data and personal characteristics. However, we were unable to find a statistically
significant relationship between these operations variables and the individuals’ satisfaction with
their last bus trip since the actual date of each users’ last trip was not asked in the survey as well
as the origin and destination of each trip. The average performance of trips occurring at the same
time over the past week did however appear to predict the users’ overall satisfaction levels and
their attitudes towards the service quality delivered by Translink which they prompted to reflect

125
on over the past seven days. Collecting more detailed information regarding an individuals’ last
trip in customer satisfaction surveys would significantly improve the ability to combine operations
and customer satisfaction data. One way this could be done is by collecting the users’ payment
card information in surveys and linking their reported satisfaction with their last trip to their travel
information from their payment card, assuming that users are required to tap-on and tap-off. The
use of smart card data for analysis of customer perceptions of service as demonstrated in
Brakewood and Watkins (2016) is emerging in the literature as a strategy to evaluate changes in
transit travel.
As the summary statistics of the express and local route users revealed, on average, the
local route users reported higher overall satisfaction levels, which can be misleading if analysis is
limited to summary statistics. Whilst the advanced modeling approach enabled us to detangle the
causes of these differences and showed that when controlling for the different route and personal
characteristics and under the same operating conditions, users of the express routes will be more
satisfied with the overall service. To increase overall satisfaction levels among the 99 B-Line users,
requires reducing crowding levels, as our model indicated that passenger activity and passenger
loads were found to negatively impact users’ satisfaction overall. Routes 99 and 9 are ranked first
and fourth respectively among the most highly used bus routes in the Translink network. To meet
this passenger demand, peak hour headways are approximately 3.5 minutes and 5 minutes on
routes 99 and 9. Therefore, strategies to mitigate the negative impacts of crowding on these routes
are recommended, for example reductions in fares at off-peak hours, or increasing the frequency
of service or the types of buses operated to have a higher carrying capacity. A total of 77,000
boardings daily along these two routes is also high enough to start discussions of converting the
type of service offered along this corridor to light rail with exclusive right of way.

126
Customer satisfaction data and operations data are rarely studied together either in the
literature or in practice. In most public transit agencies, these data are collected and analyzed by
two different departments. However, there is considerable value in trying to understand how
customers perceive the service they experienced. Public transit agencies set internal targets for
service performance, according to what is presumed to be suitable quality of service for customers.
However, little is known about how accurately these benchmarks align with customer expectations
of service. Furthermore, it is expected that customers’ expectations of service quality change for
different levels of service (i.e. an express bus service compared to a local bus service), among
different groups of people and at different time periods. Accordingly, this is an important future
area of research for both public transit planners and academics to consider.

127
CHAPTER 6: CONCLUSION
6.1 SUMMARY OF CHAPTERS
In today’s transport market, consumers have more transport options than ever before, including
private automobile, ride-hailing services, car sharing, bike and scooter-sharing services, and public
transit. While these mobility options are advantageous to individuals, this model competition has
manifested in many cities with stagnating or declining ridership. Understanding how individuals
experience public transit service is critical, given that previous experience with transit largely
determines future transport behavior. This dissertation began by reviewing prevalent
methodologies within the field of customer satisfaction and identified shortcomings among these
analysis techniques that were addressed in the four empirical studies comprising this research
(Chapters 2, 3, 4, and 5). More specifically, Chapters 2 and 3 show spatial methods to analyze
satisfaction data and demonstrate how satisfaction measures can be linked with service delivery to
generate targeted service quality improvements. Chapters 4 and 5 apply satisfaction data for a
nuanced understanding of how customers perceive service characteristics, including transferring
and limited-stop bus service.
Using data collected by Transport for London, Chapter 2 presents a method to spatially
analyze customer satisfaction data. Satisfaction levels of bus service in London were studied
spatially to determine whether there were notable differences in average satisfaction levels across
neighbourhoods of varying socio-economic (SES) status. The analysis revealed lower levels of
satisfaction along routes serving low SES neighbourhoods, which appears to be attributed to low
satisfaction with service characteristics related to comfort and cleanliness onboard buses and
conditions of the bus stop and shelter. This method of spatially analyzing satisfaction data allows
agencies to evaluate how performance varies across a region, and to identify where to invest

128
resources for services improvements at a more disaggregate level (route or neighbourhood level)
than previous research. Application of the spatial methodology of evaluating satisfaction data
demonstrated in this chapter is an important step towards ensuring that transit agencies are
delivering consistently high-quality service across the agency’s service area.
Chapter 3 complements the spatial analysis presented in the previous chapter (Chapter 2)
by presenting a second spatial application of satisfaction data. More specifically, Chapter 3
expanded upon the market segmentation approach commonly used by transit agencies, by
incorporating data that had not been previously incorporated into the process of segmenting transit
riders. This data includes spatial and contextual factors in addition to rider’s preferences,
satisfaction levels and personal characteristics. This new segmentation approach was demonstrated
using satisfaction data of commuter rail users in the Greater Toronto and Hamilton Area, Canada.
The study shows that contextual and geographic factors are valuable for the identification of
different groups of users and the development of policies for each group that are specific to where
they live and the transit service they regularly use, providing agencies with an important advantage
over policies generated from previous segmentation studies that lack the specificity of where to
prioritize service improvements.
Next, analyses were carried out to provide an in-depth understanding of how customers
perceive the following service characteristics: transferring (Chapter 4) and limited-stop bus service
(Chapter 5). While transferring between public transit vehicles or transit modes is a common
requirement to reach a desired destination in many cases, there appears to be a consensus among
both transit agencies and researchers to minimize transfers due to the perceived burden they place
on transit users, while there is little evidence in the literature to confirm this negative perception
of transferring. Therefore, detailed trip information, including the number of transfers, were

129
collected in a travel survey of commuters to McGill University, Montreal, Canada, with the aim
of determining how both the number of transfers and mode-specific transfers impact overall trip
satisfaction. The analysis found a decline in trip satisfaction for those who transferred 2 or more
times, whilst no significant difference in trip satisfaction was observed for one-transfer trips when
compared to trips involving zero transfers. The mode-specific transfers showed that a transfer
between bus routes, and between a bus and subway were found to negatively impact trip
satisfaction, while interestingly transferring between subway lines did not show an impact. In this
case, transferring between high frequency routes does not impact total trip satisfaction levels in
the same way as transfers involving low frequency services.
Chapter 5 explores differences in satisfaction levels between local and limited-stop bus
users, while controlling for operational characteristics of the service, such as on-time performance
and passenger activity levels, which help explain the service these riders experienced. Operational
characteristics of service have rarely been incorporated into satisfaction analyses, despite the
presumed link between customer satisfaction levels and service quality. The results reveal that
after controlling for characteristics related to the conditions of the service experienced by users,
namely passenger activity levels, patrons of the limited-stop bus service were more likely to be
satisfied with the transit service compared to users of the local service. This method of
incorporating operational data into the analysis of satisfaction measures provided deeper insight
into the determinants of satisfaction expressed by these passengers, which could not have been
observed by comparing mean overall satisfaction values.
The four case studies presented in this dissertation each were focused on a different public
transit system within a unique geographical setting. A main reason for this was to demonstrate
different analysis techniques that can be applied specific to the design of an agency’s satisfaction

130
survey, as seen from these case studies satisfaction survey design varies greatly. For example, with
knowledge of when an individual trip took place, agencies can link transit operations data to
satisfaction surveys to measure the impact of performance on overall trip satisfaction. Whereas,
agencies such as GO Transit that ask customers to reflect on their service experience over the past
year should focus their analysis on developing a market segmentation to better understand
customer behaviour, satisfaction with service characteristics and loyalty, in order to guide strategic
and targeted service improvement policies. With respect to the design of satisfaction surveys,
valuable insights can be drawn from comparing these case studies. By collecting detailed
information on travel behaviour and trip patterns in customer questionnaires, analysts can conduct
detailed and insightful analyses to understand customer perceptions of service across the network.
For example, Translink asks customers to state their satisfaction levels for each unique route that
was used on their last trip. This level of detail allow agencies to study satisfaction levels per route,
unlike a survey that only asks customers to rate satisfaction with their trip, whether that trip
involved multiple transit lines and modes.
Altogether, these studies demonstrate new and innovative techniques to evaluate customer
satisfaction data. This research aims to progress how researchers and transit planners conceptualize
satisfaction data by seeing the value of operationalizing satisfaction data in such a way that it is
directly utilized to respond to customer demands for service improvements. The methodological
advances presented in this dissertation could be an important step toward a more comprehensive
application of data collected in customer satisfaction surveys.
6.2 THEORETICAL AND METHODOLOGICAL CONTRIBUTIONS
As the majority of transit agencies worldwide actively collect customer satisfaction data to gain
insight into the perceptions, attitudes and behaviour of customers, a major contribution of this

131
dissertation is to demonstrate new methods of analyzing this data, which aim to generate more
valuable information for transit policy than previous research. Satisfaction data from four
different surveys were analyzed in this dissertation, to show the range of analyses that can be
conducted using survey data to extract valuable insight into customer perceptions. The
methodologies presented in this dissertation are designed to become part of the general toolkit
which researchers and policymakers can use when analyzing rider satisfaction, as it is essential
for transit agencies to understand their specific transit market. The main findings of each case
study demonstrate the insight that can be garnered when applying these methods, however these
findings are largely context dependent. Looking at the empirical chapters collectively, this
dissertation has expanded the scholarly practice of analyzing satisfaction data, and it is expected
that application of the methods proposed in this dissertation will be helpful for the development
of strategies to retain existing riders that are grounded in comprehensive knowledge of customer
perceptions of service quality.
A major contribution of this research is to develop methodologies that spatially evaluate
satisfaction data. In contrast to previous customer satisfaction literature, the empirical research
presented in Chapters 2 and 3 are the first studies to apply spatial methods to analyze customer
satisfaction data. These studies exemplify the benefit of collecting data in satisfaction surveys
that allow analysts to geographically reference satisfaction levels with service operated on the
ground. With that being said, the methods presented in this dissertation do require analysts to
have an understanding of GIS software and tools. For example, introductory knowledge of GIS
would be needed for analysts to plot the home locations of their transit users as well as to collect
data such as each users’ distance from downtown. As most planning and geography programs in
Canada do offer introductory GIS courses in their core curriculum, I can presume that many

132
analysts would have the skills and experience to carry out these analyses. However, this raises
interesting questions regarding the background and experience of analysts working within
customer satisfaction and marketing departments at transit agencies. Therefore, a survey of the
experience of analysts in these roles would be very valuable for understanding the in-house
adoptability of methods proposed in this dissertation.
With respect to market segmentation, this dissertation emphasizes the shortcomings of the
segmentation approach commonly implemented in the literature and proposes a spatial
segmentation approach that includes geographic data, personal characteristics, travel behaviour
and contextual factors describing access to transit service. Figure 16 presents an overview of transit
market segmentation research, including the data incorporated in the traditional market
segmentation approach, the addition of personal motivations and attitudes in the travel behaviour
segmentation technique, and the inclusion of spatial and contextual factors into the spatial
segmentation technique that was demonstrated in Chapter 3. The ability to identify where
interventions for service quality improvements are required is expected to be very relevant and
applicable for transit agencies, particularly those with scarce resources. Accordingly, other transit
agencies can apply a similar segmentation approach to generate geographically sensitive policy
recommendations for transit riders.

133
Figure 16: Conceptual model of customer satisfaction and its determinants commonly used in
market segmentation studies
Another important contribution of this thesis is to bring attention to the importance of
integrating satisfaction data with auxiliary performance data. Controlling for performance
measures experienced by customers, such as crowding and on-time performance, can bring light
to the main determinants of satisfaction, and how improvements in service factors can be levered
to increase satisfaction levels. As seen in Chapter 5, the statistical modelling technique employed
to predict trip satisfaction indicated that the characteristics of a limited-stop service is highly
influencing satisfaction levels, however unsatisfactory service factors, namely crowding, must be
addressed to see customers truly satisfied with their transit experience. Furthermore, it is important
to note that the summary statistics of the limited-stop and local route users revealed that local route
users reported higher overall satisfaction levels on average. Policies derived only from summary
statistics can provide planners with an incomplete understanding of customer satisfaction, whereas
the modeling approach demonstrated in Chapter 5 uncovered the relative impact of different

134
variables on trip satisfaction, which is vital knowledge for predicting which policies can most
significantly impact passenger satisfaction.
6.3 FUTURE RESEARCH
While this research has offered significant improvements upon the analysis and conceptualization
of customer satisfaction data, there are outstanding issues that need to be addressed to ensure that
transit agencies are best equipped to tackle the challenge of prescribing policies to increase
satisfaction among riders. First, there is an important distinction to be made between the use of the
term satisfaction to refer to satisfaction with a specific trip (trip satisfaction) or satisfaction with
travel in general. De Vos and Witlox (2017) explain that trip satisfaction refers to emotions
experienced during a trip and a cognitive evaluation of this one trip, whereas satisfaction with daily
travel is a measure of how satisfied people are with their daily travel habits. The distinction
between these terms appears to be commonly blurred in practice, which is exemplified by looking
at how differently the four satisfaction surveys applied in this dissertation approached the question
of overall satisfaction. Transport for London asked customers to rate their satisfaction with the trip
they had just completed; the McGill Travel Survey asked respondents to rate satisfaction with their
last trip to McGill; TransLink asked customers to recall their perception of service quality over the
past seven days; Metrolinx asked customers to reflect on service they experienced over the past
year. Future satisfaction survey design will benefit from distinguishing the two types of commute
satisfaction as the measurement of these different types of travel satisfaction can result in different
outcomes for mode choice, attitudes, and well-being (De Vos & Witlox, 2017).
An emerging avenue of research is the connection between customer perceptions of service
quality and performance measures. Chapter 5 presented a method of integrating performance data
into satisfaction studies, which was challenging due to a lack of detailed trip information, such as

135
trip origin and destination, and the date of the trip. While this method provided valuable insight
into the determinants of satisfaction, this method can be improved through satisfaction survey
design. Collecting data regarding when an individual’s trip took place and the origin and
destination of that trip can ease the process of linking these two sources of data that are commonly
collected and analyzed by separate departments. Additional attention should also be paid to when
customers are asked to complete a satisfaction survey. The gold standard of survey design is
through experience sampling, whereby the user is surveyed about their commute in real time,
implying that the sooner a rider has a chance to report his or her level of satisfaction, the more
accurate the results (Kahneman, Krueger, Schkade, Schwarz, & Stone, 2004). This method is
traditionally expensive for transit agencies to conduct; however, smartphone technology has been
identified as a new platform for collecting real-time satisfaction data in a cost-effective manner C.
Li et al. (2017). Furthermore, given recent evidence showing the importance of considering all trip
legs in public transit satisfaction analyses, smartphone transit application data, for example Transit
App, that captures selection of access and egress mode to transit stops and stations has been shown
as a promising means of studying multimodal transit trips (Brakewood, Ghahramani, Peters,
Kwak, & Sion, 2017). Integrating satisfaction questionnaires into smartphone applications and
prompting riders to complete brief satisfaction surveys either during a transit trip or shortly after,
has potential to provide transit agencies with valuable real-time satisfaction data that can be linked
to performance data of the trip completed.
Finally, there appears to be a lack of scholarly knowledge regarding the main motivations
and goals of transit agencies when designing and administering customer satisfaction surveys, as
well as the main techniques that are employed in practice to evaluate survey results. Working
collaboratively with transit agencies would help align academic research with practical transit

136
planning applications of customer satisfaction surveys. Furthermore, working with transit
agencies would provide academic researchers with insight regarding the main challenges and
obstacles that public transit practitioners are facing when conducting satisfaction surveys and
utilizing this data to achieve satisfaction and loyalty goals within the agency.
6.4 CONCLUDING REMARKS
The study of satisfaction data is theoretically motivated by the notion that improvements in
satisfaction will influence an individual’s likelihood of future transit use, will increase one’s
spending on transit, or encourage one to speak positively of the service to friends or family.
Increasing satisfaction is likely to occur in response to a variety of factors including improvements
in service reliability, increases in service frequency, reductions in travel time, and improvements
in the customer experience (i.e. real-time information, new vehicles, free Wi-Fi, fare payment
improvements, etc.). With growing competition in the transport market, ridership retention is more
challenging than ever. To meet these challenges, innovative marketing strategies are needed to
better address rider dissatisfaction in a timely and economically efficient manner.
As satisfaction surveys are regarded as an effective means of understanding transit
ridership, they are therefore collected by transit agencies worldwide. This dissertation shows how
satisfaction data can provide agencies with valuable insight into passenger perceptions of service
quality and how this knowledge can be used to direct resources for service improvements to
where customers are least satisfied or where improvements are likely to have the largest benefits
on existing riders. For example, if cleanliness is a major cause of dissatisfaction among a group
of riders, agencies need to know where to direct their efforts to resolve this issue, i.e. what
stations or routes appear to be performing poorly on this service attribute. Through collecting
more detailed trip data than is commonly collected in satisfaction surveys, such as time, origin

137
and destination of last trip, linking passenger dissatisfaction with the service that is frustrating
these riders can be realistically achieved by transit agencies. Furthermore, this dissertation
provides a framework to understand how service characteristics influence transit users’
satisfaction levels, by incorporating operational data and contextual trip data into the analysis of
trip satisfaction. Overall, this dissertation contributes to both research and practice, by
contributing to knowledge gaps in customer satisfaction literature specific to public transit, while
also producing methodologies that can be applied by public transit professionals with the goal of
improving the practice of analyzing satisfaction data and developing strategies to satisfy transit
riders.

138
REFERENCES
Abenoza, R., Cats, O., & Susilo, Y. (2017a). How does travel satisfaction sum up? An
exploratory analysis in decomposing the door-to-door experience for multimodal trips.
Transportation, 1-28.
Abenoza, R., Cats, O., & Susilo, Y. (2017b). Travel satisfaction with public transport:
Determinants, user classes, regional disparities and their evolution. Transportation
Research Part A: Policy and Practice, 95, 64-84.
Allen, D. (2004). Customer satisfaction research management: A comprehensive guide to
integrating customer loyalty and satisfaction metrics in the management of complex
organizations: ASQ Quality Press.
American Public Transportation Association. (2010). 2009 Public Transit Fact-Book. Retrieved
from Washington D.C.:
http://www.apta.com/resources/statistics/Documents/FactBook/APTA_2009_Fact_Book.
Anable, J. (2005). ‘Complacent car addicts’ or ‘aspiring environmentalists’? Identifying travel
behaviour segments using attitude theory. Transport Policy, 12(1), 65-78.
Anderson, R. (1973). Consumer dissatisfaction: The effect of disconfirmed expectancy on
perceived product performance. Journal of Marketing Research, 38-44.
Andreassen, T. (1995). (Dis) satisfaction with public services: The case of public transportation.
Journal of Services Marketing, 9(5), 30-41.
Axhausen, K. (2008). Definition of movement and activity for transport modelling. Handbook of
Transport Modelling, 329-344.
Badia, H., Argote-Cabanero, J., & Daganzo, C. (2017). How network structure can boost and
shape the demand for bus transit. Transportation Research Part A: Policy and Practice,
103, 83-94.
Bates, J., Polak, J., Jones, P., & Cook, A. (2001). The valuation of reliability for personal travel.
Transportation Research Part E: Logistics and Transportation Review, 37(2), 191-229.
Begg, D. (2013). World Class? London's Transport: Progress and Future Challenges. Retrieved
from
Beimborn, E., Greenwald, M., & Jin, X. (2003). Accessibility, connectivity, and captivity:
Impacts on transit choice. Transportation Research Record: Journal of the
Transportation Research Board, 1835, 1-9.
Beirão, G., & Cabral, J. (2007). Understanding attitudes towards public transport and private car:
A qualitative study. Transport Policy, 14(6), 478-489.

139
Beirão, G., & Cabral, J. (2008). Market segmentation analysis using attitudes toward
transportation: Exploring the differences between men and women. Transportation
Research Record: Journal of the Transportation Research Board(2067), 56-64.
Ben-Akiva, M., & Morikawa, T. (2002). Comparing ridership attraction of rail and bus.
Transport Policy, 9(2), 107-116.
Berry, L., Zeithaml, V., & Parasuraman, A. (1990). Five imperatives for improving service
quality. Sloan Management.
Boisjoly, G., Grisé, E., Maguire, M., Veillette, M., Deboosere, R., Berrebi, E., & El-Geneidy, A.
(2018). Invest in the ride: A 14 year longitudinal analysis of the determinants of public
transport ridership in 25 North American cities. Transportation Research Part A: Policy
and Practice, 116, 434-445.
Bordagaray, M., dell'Olio, L., Ibeas, A., & Cecín, P. (2014). Modelling user perception of bus
transit quality considering user and service heterogeneity. Transportmetrica A: Transport
Science, 10(8), 705-721.
Brakewood, C., Ghahramani, N., Peters, J., Kwak, E., & Sion, J. (2017). Real-Time Riders: A
First Look at User Interaction Data from the Back End of a Transit and Shared Mobility
Smartphone App. Transportation Research Record: Journal of the Transportation
Research Board(2658), 56-63.
Brakewood, C., & Watkins, K. (2016). A Method for Conducting Before-After Analyses of
Transit Use by Linking Smart Card Data and Survey Responses. Boca Raton: Taylor &
Francis Group.
Brons, M., Givoni, M., & Rietveld, P. (2009). Access to railway stations and its potential in
increasing rail use. Transportation Research Part A: Policy and Practice, 43(2), 136-149.
Cantwell, M., Caulfield, B., & O’Mahony, M. (2009). Examining the factors that impact public
transport commuting satisfaction. Journal of Public Transportation, 12(2), 1.
Chen, J., Liu, Z., Zhu, S., & Wang, W. (2015). Design of limited-stop bus service with capacity
constraint and stochastic travel time. Transportation Research Part E: Logistics and
Transportation Review, 83, 1-15.
Chiraphadhanakul, V., & Barnhart, C. (2013). Incremental bus service design: Combining
limited-stop and local bus services. Public Transport, 5(1-2), 53-78.
Church, A., Frost, M., & Sullivan, K. (2000). Transport and social exclusion in London.
Transport Policy, 7(3), 195-205.
Conlon, M., Foote, P., O'Malley, K., & Stuart, D. (2001). Successful arterial street limited-stop
express bus service in Chicago. Transportation Research Record: Journal of the
Transportation Research Board, 1760, 74-80.

140
Currie, G. (2005). The demand performance of bus rapid transit. Journal of Public
Transportation, 8(1), 3.
Currie, G., & Wallis, I. (2008). Effective ways to grow urban bus markets– A synthesis of
evidence. Journal of Transport Geography, 16(6), 419-429.
Curry, B. (2016). Where have all the transit riders gone? . The Globe and Mail. Retrieved from
https://www.theglobeandmail.com/news/politics/drop-in-transitridership-has-officials-
across-canadastumped/article30178600/
Davis, M., & Heineke, J. (1998). How disconfirmation, perception and actual waiting times
impact customer satisfaction. international Journal of Service industry Management,
9(1), 64-73.
de Abreu e Silva, J., & Bazrafshan, H. (2013). User satisfaction of intermodal transfer facilities
in Lisbon, Portugal: Analysis with structural equations modeling. Transportation
Research Record: Journal of the Transportation Research Board, 2350(1), 102-110.
de Oña, J., de Oña, R., & Calvo, F. (2012). A classification tree approach to identify key factors
of transit service quality. Expert Systems with Applications, 39(12), 11164-11171.
De Oña, J., De Oña, R., Diez-Mesa, F., Eboli, L., & Mazzulla, G. (2016). A composite index for
evaluating transit service quality across different user profiles. Journal of Public
Transportation, 19(2), 8.
De Ona, J., de Oña, R., Eboli, L., & Mazzulla, G. (2015). Heterogeneity in perceptions of service
quality among groups of railway passengers. International Journal of Sustainable
Transportation, 9(8), 612-626.
de Oña, J., de Oña, R., Eboli, L., & Mazzulla, G. (2013). Perceived service quality in bus transit
service: A structural equation approach. Transport Policy, 29, 219-226.
de Oña, J., de Oña, R., & López, G. (2016). Transit service quality analysis using cluster analysis
and decision trees: A step forward to personalized marketing in public transportation.
Transportation, 43(5), 725-747.
De Vos, J., & Witlox, F. (2017). Travel satisfaction revisited. On the pivotal role of travel
satisfaction in conceptualising a travel behaviour process. Transportation Research Part
A: Policy and Practice, 106, 364-373.
Dell’Olio, L., Ibeas, A., & Cecin, P. (2011). The quality of service desired by public transport
users. Transport Policy, 18(1), 217-227.
dell’Olio, L., Ibeas, A., & Cecín, P. (2010). Modelling user perception of bus transit quality.
Transport Policy, 17(6), 388-397.

141
Diab, E., Badami, M., & El-Geneidy, A. (2015). Bus transit service reliability and improvement
strategies: Integrating the perspectives of passengers and transit agencies in North
America. Transport Reviews, 35(3), 292-328.
Diab, E., & El-Geneidy, A. (2012). Understanding the impacts of a combination of service
improvement strategies on bus running time and passenger’s perception. Transportation
Research Part A: Policy and Practice, 46(3), 614-625.
Diana, M. (2012). Measuring the satisfaction of multimodal travelers for local transit services in
different urban contexts. Transportation Research Part A: Policy and Practice, 46(1), 1-
11.
Dueker, K., Kimpel, T., Strathman, J., & Callas, S. (2004). Determinants of bus dwell time.
Journal of Public Transportation, 7(1), 2.
Eboli, L., & Mazzulla, G. (2007). Service quality attributes affecting customer satisfaction for
bus transit. Journal of Public Transportation, 10(3), 2.
Eboli, L., & Mazzulla, G. (2011). A methodology for evaluating transit service quality based on
subjective and objective measures from the passenger’s point of view. Transport Policy,
18(1), 172-181.
Eboli, L., & Mazzulla, G. (2015). Relationships between rail passengers’ satisfaction and service
quality: A framework for identifying key service factors. Public Transport, 7(2), 185-
201.
EI-Geneidy, A., Strathman, J., Kimpel, T., & Crout, D. (2006). Effects of bus stop consolidation
on passenger activity and transit operations. Transportation Research Record(1971), 32-
41.
El-Geneidy, A., Buliung, R., Diab, E., van Lierop, D., Langlois, M., & Legrain, A. (2016). Non-
stop equity: Assessing daily intersections between transit accessibility and social
disparity across the Greater Toronto and Hamilton Area (GTHA). Environment and
Planning B: Planning and Design, 43(3), 540-560.
El-Geneidy, A., Hourdos, J., & Horning, J. (2009). Bus transit service planning and operations in
a competitive environment. Journal of Public Transportation, 12(3), 3.
El-Geneidy, A., & Surprenant-Legault, J. (2010). Limited-stop bus service: an evaluation of an
implementation strategy. Public Transport, 2(4), 291-306.
El-Geneidy, A., van Lierop, D., Grisé, E., Boisjoly, G., Swallow, D., Fordham, L., & Herrmann,
T. (2017). Get on board: Assessing an all-door boarding pilot project in Montreal,
Canada. Transportation Research Part A: Policy and Practice, 99, 114-124.
Eluru, N., Chakour, V., & El-Geneidy, A. (2012). Travel mode choice and transit route choice
behavior in Montreal: Insights from McGill University members commute patterns.
Public Transport, 4(2), 129-149.

142
Engel-Yan, J., Rudra, M., Livett, C., & Nagorsky, R. (2014). Strategic station access planning
for commuter rail: Balancing park-and-ride with other modes. Transportation Research
Record: Journal of the Transportation Research Board(2419), 82-91.
Ercolano, J. (1984). Limited-stop bus operations: An evaluation. Transportation Research
Record: Journal of the Transportation Research Board, 994.
Ettema, D., Abenoza, R., & Susilo, Y. (2016). Satisfaction with intermodal trips in Stockholm:
How do service attributes influence satisfaction with the main mode and with the journey
as a whole. Paper presented at the Paper submitted for presentation at the 95th Annual
Meeting of the Transportation Research Board, Washington, DC.
Figler, S., Sriraj, P., Welch, E., & Yavuz, N. (2011). Customer Loyalty and Chicago, Illinois,
Transit Authority Buses: Results from 2008 Customer Satisfaction Survey.
Transportation Research Record: Journal of the Transportation Research Board(2216),
148-156.
Fitzsimmons, E. (2017). Subway ridership declines in New York. Is Uber to Blame? New York
Times. Retrieved from https://www.nytimes.com/2017/02/23/nyregion/new-york-city-
subway-
ridership.html?rref=collection%2Ftimestopic%2FMetropolitan%20Transportation%20Au
thority%2C%20N.Y
Fornell, C. (1992). A national customer satisfaction barometer: The Swedish experience. the
Journal of Marketing, 6-21.
Fornell, C., Johnson, M. D., Anderson, E., Cha, J., & Bryant, B. E. (1996). The American
Customer Satisfaction Index: Nature, purpose, and findings. Journal of Marketing, 60(4),
7-18.
Foth, N., Manaugh, K., & El-Geneidy, A. (2013). Towards equitable transit: Examining transit
accessibility and social need in Toronto, Canada, 1996–2006. Journal of transport
geography, 29, 1-10.
Friman, M. (2004). Implementing quality improvements in public transport. Journal of Public
Transportation, 7(4), 3.
Friman, M., & Fellesson, M. (2009). Service supply and customer satisfaction in public
transportation: The quality paradox. Journal of Public Transportation, 12(4), 57-69.
Fujii, S., & Kitamura, R. (2003). What does a one-month free bus ticket do to habitual drivers?
An experimental analysis of habit and attitude change. Transportation, 30(1), 81-95.
Givoni, M., & Rietveld, P. (2007). The access journey to the railway station and its role in
passengers’ satisfaction with rail travel. Transport Policy, 14(5), 357-365.

143
GO Transit. (2017). Strategic Plan GO 2020. Retrieved from
http://www.gotransit.com/Public/en/docs/publications/Strategic_Plan_GO_2020_lowres.
pdf:
Grigoroudis, E., & Siskos, Y. (2009). Customer satisfaction evaluation: Methods for measuring
and implementing service quality (Vol. 139): Springer Science & Business Media.
Guihaire, V., & Hao, J. (2008). Transit network design and scheduling: A global review.
Transportation Research Part A: Policy and Practice, 42(10), 1251-1273.
Guo, Z., & Wilson, N. (2004a). Assessment of the transfer penalty for transit trips geographic
information system-based disaggregate modeling approach. Transportation Research
Record, 1872, 10-18.
Guo, Z., & Wilson, N. (2004b). Assessment of the transfer penalty for transit trips geographic
information system-based disaggregate modeling approach. Transportation Research
Record: Journal of the Transportation Research Board(1872), 10-18.
Hamnett, C. (2003). Unequal city: London in the global arena: Psychology Press.
Handy, S., & Thigpen, C. (2018). Commute quality and its implications for commute
satisfaction: Exploring the role of mode, location, and other factors. Travel Behaviour
and Society.
Hansen, W. (1959). How accessibility shapes land use. Journal of the American Institute of
Planners, 25(2), 73-76.
Henao, A., & Marshall, W. (2017). A Framework for Understanding the impacts of ridesourcing
on transportation Disrupting Mobility (pp. 197-209): Springer.
Hensher, D., Stopher, P., & Bullock, P. (2003). Service quality––developing a service quality
index in the provision of commercial bus contracts. Transportation Research Part A:
Policy and Practice, 37(6), 499-517.
Hernandez, S., Monzon, A., & de Oña, R. (2016). Urban transport interchanges: A methodology
for evaluating perceived quality. Transportation Research Part A: Policy and Practice,
84, 31-43.
Iacono, M., Krizek, K., & El-Geneidy, A. (2008). Access to destinations: how close is close
enough? Estimating accurate distance decay functions for multiple modes and different
purposes.
Ibarra-Rojas, O., Delgado, F., Giesen, R., & Muñoz, J. (2015). Planning, operation, and control
of bus transport systems: A literature review. Transportation Research Part B:
Methodological, 77, 38-75.
Imaz, A., Habib, K., Shalaby, A., & Idris, A. (2015). Investigating the factors affecting transit
user loyalty. Public Transport, 7(1), 39-60.

144
Iseki, H., & Taylor, B. (2009). Not all transfers are created equal: Towards a framework relating
transfer connectivity to travel behaviour. Transport Reviews, 29(6), 777-800.
Iseki, H., & Taylor, B. (2010). Style versus service? An analysis of user perceptions of transit
stops and stations. Journal of Public Transportation, 13(3), 2.
Jacques, C., Manaugh, K., & El-Geneidy, A. (2013). Rescuing the captive [mode] user: An
alternative approach to transport market segmentation. Transportation, 40(3), 625-645.
Jensen, M. (1999). Passion and heart in transport—a sociological analysis on transport
behaviour. Transport Policy, 6(1), 19-33.
Jones, P., & Lucas, K. (2012). The social consequences of transport decision-making: clarifying
concepts, synthesising knowledge and assessing implications. Journal of transport
geography, 21, 4-16.
Kahneman, D., Krueger, A., Schkade, D., Schwarz, N., & Stone, A. (2004). A survey method for
characterizing daily life experience: The day reconstruction method. Science, 306(5702),
1776-1780.
Knight, T. (1974). An approach to the evaluation of changes in travel unreliability: A “safety
margin” hypothesis. Transportation, 3(4), 393-408.
Krizek, K. (2006). Lifestyles, residential location decisions, and pedestrian and transit activity.
Transportation Research Record: Journal of the Transportation Research Board(1981),
171-178.
Krizek, K., & El-Geneidy, A. (2007). Segmenting preferences and habits of transit users and
non-users. Journal of Public Transportation, 10(3), 5.
Kurauchi, F., Bell, M., & Schmöcker, J. (2003). Capacity constrained transit assignment with
common lines. Journal of Mathematical Modelling and Algorithms, 2(4), 309-327.
Lai, W., & Chen, C. (2011). Behavioral intentions of public transit passengers—The roles of
service quality, perceived value, satisfaction and involvement. Transport Policy, 18(2),
318-325.
Lee, J., Jin, B., & Ji, Y. (2009). Development of a Structural Equation Model for ride comfort of
the Korean high-speed railway. International Journal of Industrial Ergonomics, 39(1), 7-
14.
Legrain, A., Buliung, R., & El-Geneidy, A. (2016). Travelling fair: Targeting equitable transit by
understanding job location, sectorial concentration, and transit use among low-wage
workers. Journal of transport geography, 53, 1-11.
Legrain, A., Eluru, N., & El-Geneidy, A. (2015). Am stressed, must travel: The relationship
between mode choice and commuting stress. Transportation Research Part F: Traffic
Psychology and Behaviour, 34, 145-150.

145
Leiva, C., Muñoz, J., Giesen, R., & Larrain, H. (2010). Design of limited-stop services for an
urban bus corridor with capacity constraints. Transportation Research Part B:
Methodological, 44(10), 1186-1201.
Levinson, D. (2017). . On the Predictability of the Decline of Transit Ridership in the US.
Retrieved from https://transportist.org/2017/03/20/on-the-predictability-ofthe-decline-of-
transit-ridership-in-the-us/
Lewis, R., & Booms, R. (1983). The marketing aspects of service quality. Emerging perspectives
on services marketing, Chicago, 99-107.
Li, C., Zegras, P., Zhao, F., Qin, Z., Shahid, A., Ben-Akiva, M., . . . Zhao, J. (2017). Enabling
Transit Service Quality Co-monitoring Through a Smartphone-Based Platform.
Retrieved from Transportation Research Board 96th Annual Meeting:
Li, Z., & Hensher, D. (2011). Crowding and public transport: A review of willingness to pay
evidence and its relevance in project appraisal. Transport Policy, 18(6), 880-887.
Linton, J. (2016). What factors are causing metro’s declining ridership? What next? Retrieved
from http://la.streetsblog.org/2016/01/29/what-factors-are-causingmetros-declining-
ridership-what-next/
Liu, R., Pendyala, R., & Polzin, S. (1997). Assessment of intermodal transfer penalties using
stated preference data. Transportation Research Record: Journal of the Transportation
Research Board(1607), 74-80.
Loong, C., & El-Geneidy, A. (2016). It's a matter of time: An assessment of additional time
budgeted for commuting across modes. Transportation Research Record(2565), 94-102.
Martens, K., Golub, A., & Robinson, G. (2012). A justice-theoretic approach to the distribution
of transportation benefits: Implications for transportation planning practice in the United
States. Transportation Research Part A: Policy and Practice, 46(4), 684-695.
Merriman, D. (1998). How many parking spaces does it take to create one additional transit
passenger? Regional Science and Urban Economics, 28(5), 565-584.
Metrolinx. (2016). GO Rail Station Access Plan. Retrieved from
http://www.metrolinx.com/en/regionalplanning/projectevaluation/studies/GO_Rail_Statio
n_Access_Plan_EN.pdf
Metrolinx. (No date). Metrolinx Annual Report 2015-2016 Retrieved from
http://www.gotransit.com/public/en/docs/publications/Strategic_Plan_GO_2020_lowres.
Milkovits, M. (2008). Modeling the factors affecting bus stop dwell time: use of automatic
passenger counting, automatic fare counting, and automatic vehicle location data.
Transportation Research Record: Journal of the Transportation Research Board, 2072,
125-130.

146
Minser, J., & Webb, V. (2010). Quantifying the benefits: Application of customer loyalty
modeling in public transportation context. Transportation Research Record: Journal of
the Transportation Research Board(2144), 111-120.
Molander, S., Fellesson, M., Friman, M., & Skålén, P. (2012). Market orientation in public
transport research—A review. Transport Reviews, 32(2), 155-180.
Monsuur, F., Enoch, M., Quddus, M., & Meek, S. (2017). The Impact of Train and Station Types
on Perceived Rail Service Quality. Transportation Research Board 96th Annual Meeting
Compendium of Papers.
Mouwen, A. (2015). Drivers of customer satisfaction with public transport services.
Transportation Research Part A: Policy and Practice, 78, 1-20.
Murray, A. T., & Davis, R. (2001). Equity in regional service provision. Journal of Regional
Science, 41(4), 557-600.
Nelson, L., & Weikel, D. (2016). Billions spent, but fewer people are using public transportation
in Southern California. Los Angeles Times. Los Angeles Times. Retrieved from
http://www.latimes.com/local/california/la-me-ridership-slump-20160127-story.html
Noland, R., & Polak, J. (2002). Travel time variability: A review of theoretical and empirical
issues. Transport Reviews, 22(1), 39-54.
Office for National Statistics. (2015). Super Output Area (SOA). Retrieved from
http://www.ons.gov.uk/ons/guide-method/geography/beginner-s-guide/census/super-
output-areas--soas-/index.html
Olsen, S. (2007). Repurchase loyalty: The role of involvement and satisfaction. Psychology &
Marketing, 24(4), 315-341.
Olsen, S. O. (2007). Repurchase loyalty: The role of involvement and satisfaction. Psychology &
Marketing, 24(4), 315-341.
Parasuraman, A., Zeithaml, V., & Berry, L. (1985). A conceptual model of service quality and its
implications for future research. the Journal of Marketing, 41-50.
Polzin, S., Chu, X., & Rey, J. (2000). Density and captivity in public transit success:
Observations from the 1995 nationwide personal transportation study. Transportation
Research Record: Journal of the Transportation Research Board(1735), 10-18.
Prioni, P., & Hensher, D. (2000). Measuring service quality in scheduled bus services. Journal of
Public Transportation, 3(2).
Sánchez-Cantalejo, C., Ocana-Riola, R., & Fernández-Ajuria, A. (2008). Deprivation index for
small areas in Spain. Social Indicators Research, 89(2), 259-273.

147
Schmitt, L., Currie, G., & Delbosc, A. (2013). Measuring the impact of unfamiliar transit travel
using a university access survey. Transport Policy, 30, 301-307.
Schmitt, L., Currie, G., & Delbosc, A. (2015). Lost in transit? Unfamiliar public transport travel
explored using a journey planner web survey. Transportation, 42(1), 101-122.
Schmöcker, J., Cooper, S., & Adeney, W. (2005). Metro service delay recovery: Comparison of
strategies and constraints across systems. Transportation Research Record: Journal of
the Transportation Research Board(1930), 30-37.
Scorcia, H. (2010). Design and evaluation of BRT and limited-stop services.
Shaheen, S., Totte, H., & Stocker, A. (2018). Future of Mobility White Paper. Retrieved from
UC Berkeley:
https://cloudfront.escholarship.org/dist/prd/content/qt68g2h1qv/qt68g2h1qv.pdf?t=p3w8
dj
Shiftan, Y., Outwater, M., & Zhou, Y. (2008). Transit market research using structural equation
modeling and attitudinal market segmentation. Transport Policy, 15(3), 186-195.
Song, Y., & Knaap, G. (2007). Quantitative classification of neighbourhoods: The
neighbourhoods of new single-family homes in the Portland Metropolitan Area. Journal
of Urban Design, 12(1), 1-24.
Sprumont, F., Astegiano, P., & Viti, F. (2017). On the consistency between commuting
satisfaction and traveling utility: The case of the University of Luxembourg. European
Journal of Transport and Infrastructure Research, 17(2), 248-262.
St-Louis, E., Manaugh, K., van Lierop, D., & El-Geneidy, A. (2014). The happy commuter: a
comparison of commuter satisfaction across modes. Transportation Research Part F:
Traffic Psychology and Behaviour, 26, 160-170.
Stolper, H., & Rankin, N. (2016). The Transit Affordability Crisis: How Reduced MTA Fares
Can Help Low-Income New Yorkers Move Ahead. Retrieved from
Stradling, S., Anable, J., & Carreno, M. (2007). Performance, importance and user
disgruntlement: A six-step method for measuring satisfaction with travel modes.
Transportation Research Part A: Policy and Practice, 41(1), 98-106.
Stuart, K., Mednick, M., & Bockman, J. (2000). Structural equation model of customer
satisfaction for the New York City subway system. Transportation Research Record:
Journal of the Transportation Research Board(1735), 133-137.
Surprenant-Legault, J., & El-Geneidy, A. (2011). Introduction of reserved bus lane: Impact on
bus running time and on-time performance. Transportation Research Record: Journal of
the Transportation Research Board, 2218, 10-18.

148
Susilo, Y., & Cats, O. (2014). Exploring key determinants of travel satisfaction for multi-modal
trips by different traveler groups. Transportation Research Part A: Policy and Practice,
67, 366-380.
Suzuki, H., Fujii, S., Gärling, T., Ettema, D., Olsson, L., & Friman, M. (2014). Rules for
aggregated satisfaction with work commutes. Transportation, 41(3), 495-506.
Tétreault, P., & El-Geneidy, A. (2010). Estimating bus run times for new limited-stop service
using archived AVL and APC data. Transportation Research Part A: Policy and
Practice, 44(6), 390-402.
Thøgersen, J. (2006). Understanding repetitive travel mode choices in a stable context: A panel
study approach. Transportation Research Part A: Policy and Practice, 40(8), 621-638.
Tirachini, A., Hensher, D., & Rose, J. (2013). Crowding in public transport systems: Effects on
users, operation and implications for the estimation of demand. Transportation Research
Part A: Policy and Practice, 53, 36-52.
Townsend, P., Phillimore, P., & Beattie, A. (1998). Health and deprivation: inequality and the
north: Croom Helm, Beckenham, U.K.
Transit Cooperative Research Program. (1998). Funding Strategies for Public Transportation.
Retrieved from Washington, DC:
Translink. (2016). 2016 Transit Service Performance Review - Appendix C1 - Bus Route
Summaries: Route 1-99. Retrieved from https://www.translink.ca/en/Plans-and-
Projects/Managing-the-Transit-Network/Transit-Service-Performance-Review.aspx
Transport for London. (2015). London’s Bus Contracting and Tendering Process. Retrieved
from
Transportation Research Board. (1998). A handbook: Integrating market research into transit
management. Retrieved from
Transportation Research Board. (1999). A handbook for measuring customer satisfaction and
service quality. Retrieved from
Tyrinopoulos, Y., & Antoniou, C. (2008). Public transit user satisfaction: Variability and policy
implications. Transport Policy, 15(4), 260-272.
van Lierop, D., Badami, M., & El-Geneidy, A. (2017). Nothing But a Good Ride: The Influences
of Satisfaction and Loyalty in Public Transport. Paper presented at 96th
Transportation Research Board Annual Meeting.
van Lierop, D., & El-Geneidy, A. (2015). Getting committed: A new perspective on public transit
market segmentation from two Canadian cities. Paper presented at the Transportation
Research Board 94th Annual Meeting.

149
van Lierop, D., & El-Geneidy, A. (2016a). Enjoying loyalty: The relationship between service
quality, customer satisfaction, and behavioral intentions in public transit. Research in
Transportation Economics, 59, 50-59.
van Lierop, D., & El-Geneidy, A. (2016b). Loyalty in transit: An analysis of bus and rail users in
two Canadian cities. Research in Transportation Economics.
van Lierop, D., & El-Geneidy, A. (2016c). Loyalty in transit: An analysis of bus and rail users in
two Canadian cities. Research in Transportation Economics,, 59, 50-59.
van Lierop, D., & El-Geneidy, A. (2017a). A new market segmentation approach: Evidence from
two Canadian cities. Journal of Public Transportation, 20(1), 20-43.
van Lierop, D., & El-Geneidy, A. (2017b). Perceived Reality: Understanding the relationship
between customer perceptions and operational characteristics. Transportation Research
Record: Journal of the Transportation Research Board.
Verbich, D., & El-Geneidy, A. (2016a). The pursuit of satisfaction: Variation in satisfaction with
bus transit service among different bus users using a large-scale survey from London,
UK. Transport Policy, 47, 64-71.
Verbich, D., & El-Geneidy, A. (2016b). The pursuit of satisfaction: Variation in satisfaction with
bus transit service among riders with encumbrances and riders with disabilities using a
large-scale survey from London, UK. Transport Policy, 47, 64-71.
Vuchic, V. (2005). Urban transit: Operations, planning, and economics.
Walker, J. (2008). Purpose-driven public transport: creating a clear conversation about public
transport goals. Journal of transport geography, 16(6), 436-442.
Wardman, M., Hine, J., & Stradling, S. (2001). Interchange and Travel Choice Volume 1.
Scottish Executive Central Research Unit.
Webb, V. (2010). Customer loyalty in the public transportation context. (Master's thesis),
Massachusetts Institute of Technology, Cambridge, Mass.
Weinstein, A. (2000). Customer satisfaction among transit riders: How customers rank the
relative importance of various service attributes. Transportation Research Record:
Journal of the Transportation Research Board(1735), 123-132.
Weinstein, A. (2004). Handbook of market segmentation: Strategic targeting for business and
technology firms: Psychology Press.
Wen, C., Lan, L., & Cheng, H. (2005). Structural Equation Modeling to Determine Passenger
Loyalty Toward Intercity Bus Services. Transportation Research Record: Journal of the
Transportation Research Board(1927), 249-255.

150
Wu, B., & Hine, J. (2003). A PTAL approach to measuring changes in bus service accessibility.
Transport Policy, 10(4), 307-320.
Zeithaml, V. (1981). How consumer evaluation processes differ between goods and services.
Chicago: American Marketing.
Zhao, J., Webb, V., & Shah, P. (2014). Customer loyalty differences between captive and choice
transit riders. Transportation Research Record: Journal of the Transportation Research
Board(2415), 80-88.