FOSTERING GROWTH THROUGH DIGITALISATION Economic … · Economic Outlook for Southeast Asia, China...
236
Economic Outlook for Southeast Asia, China and India 2018 FOSTERING GROWTH THROUGH DIGITALISATION 2018
Transcript of FOSTERING GROWTH THROUGH DIGITALISATION Economic … · Economic Outlook for Southeast Asia, China...
Eco
nom
ic Ou
tloo
k for S
ou
theast A
sia, Ch
ina an
d In
dia 2018
FOS
TE
RIN
G G
RO
WT
H T
HR
OU
GH
DIG
ITAL
ISA
TIO
N
Consult this publication on line at http://dx.doi.org/9789264286184-en
This work is published on the OECD iLibrary, which gathers all OECD books, periodicals and statistical databases. Visit www.oecd-ilibrary.org for more information.
Economic Outlook for Southeast Asia, China and India 2018FOSTERING GROWTH THROUGH DIGITALISATIONThe Economic Outlook for Southeast Asia, China and India is a bi-annual publication on regional economic growth, development and regional integration in Emerging Asia. It focuses on the economic conditions of Association of Southeast Asian Nations (ASEAN) member countries: Brunei Darussalam, Cambodia, Indonesia, Lao PDR, Malaysia, Myanmar, the Philippines, Singapore, Thailand and Viet Nam. It also addresses relevant economic issues in China and India to fully reflect economic developments in the region. Each edition of the Outlook comprises four main parts, each highlighting a particular dimension of recent economic developments in the region. The first part presents the regional economic monitor, depicting the economic outlook and macroeconomic challenges in the region. The second part takes stock of recent progress made in key aspects of regional integration. The third part consists of a special thematic chapter addressing a major issue facing the region. The 2018 edition focuses on fostering growth through digitalisation. And the fourth part includes structural policy country notes offering country-specific reviews and recommendations.
Contents
Chapter 1: Macroeconomic assessments and economic outlook for Emerging Asia
Chapter 2: Progress and challenges of regional integration in ASEAN and Emerging Asia
Chapter 3: Digitalisation in manufacturing and services in Emerging Asia
Chapter 4: Structural policy country notes
ISBN: 978-92-64-286177
41 2017 24 1 P1
Economic Outlook for Southeast Asia, China and India 2018FOSTERING GROWTH THROUGH DIGITALISATION
2018
1. <Header left page - cHapter>
Economic Outlook for Southeast Asia,
China and India 2018
FOSTERING GROWTH THROUGH DIGITALISATION
Economic Outlookfor Southeast Asia,
China and India 2017
ADDRESSING ENERGY CHALLENGES
3ecONOMIc OUtlOOK fOr SOUtHeaSt aSIa, cHINa aNd INdIa 2018: fOSterINg grOWtH tHrOUgH dIgItalISatION © Oecd 2018
This work is published under the responsibility of the Secretary-General of the OECD. The opinions expressed and arguments employed herein do not necessarily reflect those of the OECD, its Development Centre or of their member countries.
This document and any, as well as any data and map included herein, are without prejudice to the status of or sovereignty over any territory, to the delimitation of international frontiers and boundaries and to the name of any territory, city or area.
The statistical data for Israel are supplied by and under the responsibility of the relevant Israeli authorities. The use of such data by the OECD is without prejudice to the status of the Golan Heights, East Jerusalem and Israeli settlements in the West Bank under the terms of international law.
Photo credits: Cover design by the OECD Development Centre.
Corrigenda to OECD publications may be found on line at: www.oecd.org/publishing/corrigenda.
© OECD 2018
You can copy, download or print OECD content for your own use, and you can include excerpts from OECD publications, databases and multimedia products in your own documents, presentations, blogs, websites and teaching materials, provided that suitable acknowledgment of the source and copyright owner is given. All requests for public or commercial use and translation rights should be submitted to [email protected]. Requests for permission to photocopy portions of this material for public or commercial use shall be addressed directly to the Copyright Clearance Center (CCC) at [email protected] or the Centre français d’exploitation du droit de copie (CFC) [email protected].
Please cite this publication as:
OECD (2018), Economic Outlook for Southeast Asia, China and India 2018: Fostering Growth Through Digitalisation, OECD Publishing, Paris, http://dx.doi.org/9789264286184-en.
ISBN: 978-92-64-28617-7 (print)
ISBN: 978-92-64-28618-4 (pdf)
Annual: Economic Outlook for Southeast Asia, China and India
ISSN 2310-1105 (print)
ISSN 2310-1113 (online)
1. fOreWOrd
3ecONOMIc OUtlOOK fOr SOUtHeaSt aSIa, cHINa aNd INdIa 2018: fOSterINg grOWtH tHrOUgH dIgItalISatION © Oecd 2018
Foreword
The Economic Outlook for Southeast Asia, China and India is a biannual publication on Asia’s regional economic growth, development and regional integration processes. It focuses on the economic conditions of the Association of Southeast Asian Nations (ASEAN) member countries (Brunei Darussalam, Cambodia, Indonesia, Lao PDR, Malaysia, Myanmar, the Philippines, Singapore, Thailand and Viet Nam) and two large economies in the region, China and India. This publication evolved from the Southeast Asian Economic Outlook. Beginning with the first release of the Update to the Outlook in June 2016, the Outlook has become a biannual publication, with the main report released in the fall and its update released the following spring.
The Outlook was initially proposed at an informal reflection group on Southeast Asia in 2008 as a follow-up of the Council Meeting at Ministerial level (MCM) in 2007 and was accepted by ministers/senior officials from ASEAN countries at the occasion of the 2nd OECD-Southeast Asia Regional Forum in Bangkok in 2009. The Outlook project was officially launched in 2010 and each edition is regularly presented at the occasion of the ASEAN/East Asia Summit. It was included in the OECD’s Southeast Asia Regional Programme (SEARP) at the Steering Group Meeting in Jakarta, Indonesia in March 2015, with its role of providing a horizontal view of activities, identifying emerging trends in the region and providing a backbone for the different streams of the Programme confirmed at the 2015 MCM. The Outlook serves as a strategic foresight and policy dialogue tool for the SEARP and includes summaries of recent developments in the region on issues related to the Programme’s six Regional Policy Networks and three Initiatives.
Each edition of the Outlook is comprised of four main parts: a regional economic monitor, an overview of recent developments in regional integration, structural policy country notes and a thematic focus specific to each year’s report. The 2018 edition of the Outlook focuses on the transformative effects of the digital economy and policy challenges for Emerging Asian countries in seizing the opportunities it presents. Digitalisation has already affected ways of doing business, trade and productivity in the region. New technologies and improved access to the internet and information and communication technologies will continue to reshape manufacturing and services sectors. Fostering inclusive growth through digitalisation requires reforms to trade and investment policies, the development of supportive infrastructure, and addressing labour market challenges.
The OECD Development Centre is committed to working alongside governments of developing and emerging economies and regional actors to identify key areas of intervention in order to address these challenges. The Centre enjoys the full membership of three Southeast Asian countries, namely Indonesia, Thailand and Viet Nam, as well as India and China. This project has also benefited from the generous support of other Emerging Asian countries.
Like other regional economic outlooks produced by the OECD Development Centre, this report was prepared in collaboration with regional partners; UNESCAP and the Economic Research Institute for ASEAN and East Asia (ERIA) contributed to the 2018 edition. The Outlook also benefited from discussions with the ASEAN Secretariat. The OECD is committed to supporting Asian countries in their efforts to promote economic and social well-being through rigorous analysis, peer learning and best practices.

5ecONOMIc OUtlOOK fOr SOUtHeaSt aSIa, cHINa aNd INdIa 2018: fOSterINg grOWtH tHrOUgH dIgItalISatION © Oecd 2018
1. table Of cONteNtS
5ecONOMIc OUtlOOK fOr SOUtHeaSt aSIa, cHINa aNd INdIa 2018: fOSterINg grOWtH tHrOUgH dIgItalISatION © Oecd 2018
Table of contentsExecutive summary .........................................................................................................................................................................17
Economic outlook to 2022 ......................................................................................................................................................17Recent developments in regional integration ..........................................................................................................17The impacts of digitalisation on manufacturing and services .....................................................................18Key structural policy challenges ......................................................................................................................................18
Overview .................................................................................................................................................................................................19
Chapter 1: Macroeconomic assessments and economic outlook for Emerging Asia .......................19Chapter 2: Progress and challenges of regional integration in ASEAN and Emerging Asia
25Chapter 3: Digitalisation in manufacturing and services in Emerging Asia ........................................28Chapter 4: Key structural policy challenges in Emerging Asia .....................................................................35
Chapter 1. Macroeconomic assessments and economic outlook for Emerging Asia ..........................41Introduction ...................................................................................................................................................................................42Overview and main findings: The economic outlook for 2017-22 ...............................................................43Other key points of the economic outlook and assessment ...........................................................................45Recent macroeconomic developments and medium-term prospects .....................................................47The impact of increased trade on current accounts differs across Emerging Asia ..........................66Net FDI trends in Emerging Asia remain generally encouraging ...............................................................68Headline inflation continues to diverge in Emerging Asian economies ................................................69Monetary accommodation may have bottomed out in Emerging Asia ....................................................71Stock markets in Emerging Asia have been robust .............................................................................................74Fiscal positions exhibit some vulnerabilities but are largely stable ..........................................................75Risks to growth and policy challenges .........................................................................................................................77
Chapter 2. Progress and challenges of regional integration in ASEAN and Emerging Asia ..............91Overview: Building momentum for the ASEAN Economic Community..................................................92Trade in goods: ASEAN is working to further reduce tariffs ..........................................................................93Trade in services: ASEAN strives to liberalise services, but progress is slow .....................................98Conclusion .................................................................................................................................................................................... 103
Chapter 3. Digitalisation in manufacturing and services in Emerging Asia .......................................... 105Introduction ................................................................................................................................................................................ 106Recent developments in and impacts of digitalisation .................................................................................. 106Challenges for policy makers ........................................................................................................................................... 119Conclusion ....................................................................................................................................................................................134
Chapter 4. Structural policy country notes.................................................................................................................... 139ASEAN-5..........................................................................................................................................................................................141Brunei Darussalam and Singapore ............................................................................................................................... 185CLM ................................................................................................................................................................................................... 197CLM ................................................................................................................................................................................................... 197China and India ........................................................................................................................................................................ 221China and India ........................................................................................................................................................................ 221
Annex A. Statistical annex ...................................................................................................................................................... 237
1110 ecONOMIc OUtlOOK fOr SOUtHeaSt aSIa, cHINa aNd INdIa 2018: fOSterINg grOWtH tHrOUgH dIgItalISatION © Oecd 2018 ecONOMIc OUtlOOK fOr SOUtHeaSt aSIa, cHINa aNd INdIa 2018: fOSterINg grOWtH tHrOUgH dIgItalISatION © Oecd 2018
1. acrONYMS aNd abbrevIatIONSacrONYMS aNd abbrevIatIONS
Acronyms and abbreviations
ABC ASEAN Broadband CorridorABIF ASEAN Banking Integration FrameworkABIS ASEAN Business & Investment Summit
ABMI Asian Bond Market InitiativeACAP ASEAN Competition Action Plan
ACCMSME ASEAN Coordinating Committee on Micro, Small, and Medium EnterprisesACCP ASEAN Committee on Consumer Protection
ACCSQ ASEAN Consultative Committee on Standards and QualityACEF Agricultural Competitiveness Enhancement FundACIA ASEAN Comprehensive Investment Agreement
ACMF ASEAN Capital Markets Forum ACTS ASEAN Customs Transit SystemADB Asian Development Bank
ADBI Asian Development Bank InstituteAEC ASEAN Economic CommunityAEF ASEAN Ecotourism Forum
AEGC ASEAN Experts Group on CompetitionAEOI Automatic Exchange of InformationAFAS ASEAN Framework Agreement on Services
AFC Asian Financial CrisisAFTA ASEAN Free Trade AreaAHN ASEAN Highway Network
AI Artificial IntelligenceAIX ASEAN Internet Exchange Network
AMC Asset Management CompanyAMDAL Environmental Impact Assessment
AMRO ASEAN+3 Macroeconomic Research OfficeAPEC Asia-Pacific Economic Co-operationAPO Asian Productivity Organization
ASAPCP ASEAN Strategic Action Plan for Consumer ProtectionASCC ASEAN Socio-Cultural Community
ASEAN Association of Southeast Asian NationsASEAN+3 ASEAN-10 countries plus China, Japan and South KoreaASEAN+6 ASEAN+3 countries plus Australia, India and New ZealandASEAN-5 Indonesia, Malaysia, the Philippines, Thailand and Viet NamASEAN-6 Brunei Darussalam, Indonesia, Malaysia, Philippines, Singapore and Thailand
ASW ASEAN Single WindowATIGA ASEAN Trade in Goods AgreementATISA ASEAN Trade in Services Agreement
AWGIPC ASEAN Working Group on Intellectual Property Co-operationB2B Business-to-BusinessB2C Business-to-Consumer
BEPS Base Erosion and Profit ShiftingBIMP-EAGA Brunei Darussalam-Indonesia-Malaysia-Philippines East ASEAN Growth Area
BKPM Indonesia Investment Coordinating BoardBND Brunei Dollar
1. acrONYMS aNd abbrevIatIONS
11ecONOMIc OUtlOOK fOr SOUtHeaSt aSIa, cHINa aNd INdIa 2018: fOSterINg grOWtH tHrOUgH dIgItalISatION © Oecd 2018
BOJ Bank of JapanBOT Build–Operate–TransferBPO Business Process Outsourcing
BRIC Brazil, Russia, India and ChinaBSP Bangko Sentral ng Pilipinas
BTKI 2017 Buku Tarif Kepabeanan Indonesia 2017 BTO Build-to-OrderC2C Consumer-to-ConsumerCA Current Account
CDS Credit Default SwapCEPT Common Effective Preferential Tariff
CIS Collective Investment SchemeCLM Cambodia, Lao PDR and Myanmar
CLMV Cambodia, Lao PDR, Myanmar and Viet NamCPC Central Product ClassificationCPC Communist Party of ChinaCPI Consumer Price Index
CSR Corporate Social ResponsibilityCUFA Credit Union Foundation AustraliaDSA Direct School AdmissionEAS East Asia Summit
ECAP European Union-ASEAN Project on the Protection of Intellectual Property RightsECB European Central Bank
ERIA Economic Research Institute for ASEAN and East AsiaESCS PISA Index of Economic, Social and Cultural Status
EU European UnionFAO Food and Agriculture OrganizationFAS Foreign Agricultural Service
FAST Focused and Strategic ActionFDI Foreign Direct Investment
FINL Foreign Investment Negative ListFY Fiscal Year
GATS General Agreement on Trade in ServicesGDP Gross Domestic Product
GERD Gross Expenditure on Research and DevelopmentGFC Global Financial CrisisGHG Greenhouse GasGMS Greater Mekong SubregionGNI Gross National Income
GNPA Gross Non-performing AssetGST Goods and Service TaxHDC Halal Industry Development Corporation
IAI Initiative for ASEAN IntegrationIBEF India Brand Equity FoundationICC Investment Coordination CommitteeICT Information and Communication TechnologyIDI ICT Development Index
IDR Indonesian RupiahIEA International Energy Agency
acrONYMS aNd abbrevIatIONS
1. acrONYMS aNd abbrevIatIONS
1312 ecONOMIc OUtlOOK fOr SOUtHeaSt aSIa, cHINa aNd INdIa 2018: fOSterINg grOWtH tHrOUgH dIgItalISatION © Oecd 2018 ecONOMIc OUtlOOK fOr SOUtHeaSt aSIa, cHINa aNd INdIa 2018: fOSterINg grOWtH tHrOUgH dIgItalISatION © Oecd 2018
XXXXXX1. acrONYMS aNd abbrevIatIONSacrONYMS aNd abbrevIatIONS
IFAD International Fund for Agricultural DevelopmentILO International Labour OrganizationIMF International Monetary FundINR Indian RupeeIoT Internet of Things
IP Intellectual PropertyIPI Industrial Production Index
IPR Intellectual Property RightsISIC International Standard Industrial Classification
IT Information TechnologyITE Institute of Technical EducationITU International Telecommunication Union
JAKIM Department of Islamic Development MalaysiaJETRO Japan External Trade Organization
JICA Japan International Cooperation AgencyKHR Cambodian RielKPO Knowledge Process OffshoringLAK Lao KipLGU Local Government UnitLPI Logistics Performance Index
MACCS Myanmar Automated Cargo Clearance SystemMDEC Malaysia Digital Economy CorporationMIDA Malaysian Investment Development Authority MITI Ministry of International Trade and IndustryMMK Burmese KyatMOE Ministry of Education
MPAC Master Plan on ASEAN ConnectivityMPF Medium-term Projection FrameworkMRA Mutual Recognition ArrangementMSG Muslim Consumer Group
MSME Micro, Small and Medium EnterprisesMSMED Micro, Small & Medium Enterprises Development
MYR Malaysian RinggitNBFI Non-bank Financial InstitutionsNDGI Narrowing Development Gap IndicatorsNGO Non-governmental Organization
NOAH Nationwide Operational Assessment of HazardsNPL Non-performing Loan
NSW National Single WindowNTB Non-Tariff Barrier
NTM Non-Tariff MeasureODA Official Development Assistance
OECD Organisation for Economic Co-operation and Development OJK Indonesia Financial Services AuthorityPDS Philippine Dealing SystemPHP Philippine PesoPIC Productivity and Innovation Credit
PISA Programme for International Student AssessmentPLDT Philippine Long Distance Telephone Company
1. acrONYMS aNd abbrevIatIONS1. acrONYMS aNd abbrevIatIONS
13ecONOMIc OUtlOOK fOr SOUtHeaSt aSIa, cHINa aNd INdIa 2018: fOSterINg grOWtH tHrOUgH dIgItalISatION © Oecd 2018
PLN Indonesia State Electricity CompanyPMI Purchasing Managers IndexPPP Public-Private Partnership
PPPC PPP Centre PROPER Program for Pollution Control, Evaluation, and Rating
PSE Philippine Stock ExchangeR&D Research and Development
RCEP Regional Comprehensive Economic PartnershipREDD+ Reducing Emissions from Deforestation and Forest Degradation Plus
RMB Renminbi (Chinese Yuan)ROO Rules of Origin
RoRo Roll-on/Roll-offSCIC State Capital Investment CorporationSEDS Socio-Economic Development Strategy
SEZ Special Economic ZoneSGD Singapore DollarSITC Standard International Trade ClassificationSME Small and Medium-sized EnterprisesSMS Short Message Service SOE State-owned Enterprise
STEM Science, Technology, Engineering and MathematicsSTEP Short-Term Economic ProspectsSTRI Services Trade Restrictiveness IndexTFA Trade Facilitation Agreement TFP Total Factor ProductivityTHB Thai BahtTPP Trans-Pacific Partnership
TPPA Trans Pacific Partnership AgreementTRIPS Trade-Related Aspects of Intellectual Property Rights
TRQ Tariff Rate QuotaTTIP Transatlantic Trade and Investment Partnership
TVET Technical and Vocational Education and TrainingUN United Nations
UNCTAD United Nations Conference on Trade and DevelopmentUNESCAP United Nations Economic and Social Commission for Asia and the Pacific
UNESCO United Nations Educational, Scientific and Cultural OrganizationURA Urban Redevelopment Authority
US-ACTI United States-ASEAN Connectivity through Trade and InvestmentUSAID United States Agency for International Development
VAT Value Added TaxVND Vietnamese DongWEF World Economic Forum
WIPO World Intellectual Property OrganizationWITS World Integrated Trade Solution WTO World Trade Organization YOY Year-over-yearYTD Year-to-date
acrONYMS aNd abbrevIatIONS

15ecONOMIc OUtlOOK fOr SOUtHeaSt aSIa, cHINa aNd INdIa 2018: fOSterINg grOWtH tHrOUgH dIgItalISatION © Oecd 2018
15ecONOMIc OUtlOOK fOr SOUtHeaSt aSIa, cHINa aNd INdIa 2018: fOSterINg grOWtH tHrOUgH dIgItalISatION © Oecd 2018
Editorial
Growth in Emerging Asia – Southeast Asia, China and India – is projected to continue at a steady pace in 2017 relative to 2016. Growth in China and ASEAN is picking up due to a strong trade rebound and resilient domestic consumption, while India’s growth is expected to nudge downward as a result of taxation and monetary reforms. Over 2018-22, Emerging Asia as a whole is expected to grow by an average 6.3% per year on the assumption that trade momentum holds and domestic reforms continue. The ability of governments to deliver on infrastructure programmes will also be a crucial factor in medium-term growth. The most prominent risks to growth in the region are the possibility of a more rapid monetary policy contraction in advanced economies, the expansion of trade restrictions globally coupled with limited progress in regional trade agreements and the rapid rise in private-sector debt.
Over the longer term, technological change in general and the emergence of the digital economy in particular is a major factor driving economic growth in Emerging Asia. Due to the importance of this topic for the region, the thematic focus of this edition of the Outlook is fostering growth through digitalisation, including the impact of digitalisation on the manufacturing and services sectors in Emerging Asia.
Over recent decades, digitalisation has transformed the world economy into a more integrated, complex and dynamic system. Emerging Asian economies have been active participants in this new wave of change. The region is being transformed by the rapid adoption of technologies. Internet use, a prerequisite for participation in most aspects of the digital economy, has risen steadily across the region in recent years, although there are still significant differences between countries. Business activity, trade and productivity in manufacturing and services sectors have been affected. These trends are expected to continue in the future, but will also be influenced by emerging technologies and business models. While digitalisation presents many opportunities, considerable challenges remain in realising its potential to support the development of inclusive and sustainable economic growth in the region. Looking to the future, digitalisation can benefit the region as a whole and help to level the playing field for small and large businesses in ASEAN. This was highlighted in the ASEAN 2017 MSME Business Summit held in Manila in July this year.
This is an appropriate year to be looking at what lies ahead; 2017 marks an important milestone for ASEAN as a regional community with the celebration of the association’s 50-year anniversary. This is an opportune time for the region to not only take stock of how much it has achieved over the past five decades, it is also the perfect opportunity to look forward and consider what will be needed to achieve the vision of a unified and seamless ASEAN Economic Community (AEC) in the years to come. The policy challenges and recommendations highlighted in the 2018 edition of the Economic Outlook for Southeast Asia, China and India facilitate policy dialogue through fora such as the OECD’s Southeast Asia Regional Programme (SEARP) and seek to inform those concerned with the region’s growth and development.
Mario Pezzini
Director, OECD Development Centre and Special Advisor to the OECD Secretary-General on Development

17ecONOMIc OUtlOOK fOr SOUtHeaSt aSIa, cHINa aNd INdIa 2018: fOSterINg grOWtH tHrOUgH dIgItalISatION © Oecd 2018
17ecONOMIc OUtlOOK fOr SOUtHeaSt aSIa, cHINa aNd INdIa 2018: fOSterINg grOWtH tHrOUgH dIgItalISatION © Oecd 2018
Executive summary
The 2018 edition of the Economic Outlook for Southeast Asia, China and India covers four main topics on Emerging Asia: the regional economic outlook to 2022 (Chapter 1), recent developments in regional integration (Chapter 2), the impacts of digitalisation on manufacturing and services in the region (Chapter 3), and country notes on key structural policy challenges (Chapter 4).
Economic outlook to 2022
Overall, growth in 2017 in Emerging Asia (Southeast Asia, China and India) is expected to remain strong. In 2017, growth in China and ASEAN is expected to pick up on a strong trade rebound and resilient domestic consumption while growth in India is anticipated to nudge down owing to taxation and monetary reforms. Over the medium term (2018-22), the region’s growth is projected to remain robust, though slightly lower in comparison with the average pace between 2011 and 2015. While the growth rate of China is slowing, growth in India is anticipated to stay brisk. Southeast Asia is poised to maintain its growth momentum, averaging 5.2% per year from 2018 to 2022 on robust domestic private spending and the implementation of planned infrastructure initiatives. Cambodia, Lao PDR and Myanmar are projected to grow the fastest of the ten member countries in the next five years through 2022, while the Philippines and Viet Nam are expected to lead growth among the ASEAN-5 (Indonesia, Malaysia, Philippines, Thailand and Viet Nam).
The external positions of Emerging Asian economies have remained generally robust, although the direction of recent current account trends varies and foreign direct investment (FDI) net inflows have weakened in some countries. Central banks’ accommodative monetary stances persist, anchored on benign inflation, notwithstanding the recent manifestations of renewed price pressures. In turn, the stances of monetary authorities, coupled with low risk perceptions, support the palpable optimism in capital markets. Meanwhile, increased infrastructure spending looks set to contribute to continued expansionary fiscal policies in the near term. The widening of the fiscal gap may be a concern in certain economies, but generally overall positions are stable.
The most prominent overarching risks to growth at this point are the possibility of a more rapid monetary policy contraction in advanced economies; the rapid rise in private-sector debt; and the broadening of trade restrictions globally, coupled with limited progress in regional trade agreements.
Recent developments in regional integration
The 50th anniversary of ASEAN in 2017 is an opportunity for the region to take stock of the achievements made in regional integration and co-operation, as well as a chance to look ahead and consider what needs to be done to achieve the vision of a unified and seamless ASEAN Economic Community (AEC) in the future. Since its establishment in 1967, ASEAN has worked towards regional integration in a number of policy areas, including tourism, infrastructure and consumer protection in working to foster inclusive and sustainable growth across the region.
In the past year, regional integration has progressed most significantly in trade in goods and trade in services. ASEAN is working rapidly to further reduce tariffs to meet the ASEAN Trade in Goods Agreement (ATIGA) by 2018. Tariff rates have decreased further for ASEAN-6 and CLMV countries in multiple product groups. However, the
1918 ecONOMIc OUtlOOK fOr SOUtHeaSt aSIa, cHINa aNd INdIa 2018: fOSterINg grOWtH tHrOUgH dIgItalISatION © Oecd 2018 ecONOMIc OUtlOOK fOr SOUtHeaSt aSIa, cHINa aNd INdIa 2018: fOSterINg grOWtH tHrOUgH dIgItalISatION © Oecd 2018
speed of implementing the ATIGA schedule varies by country. In addition, the ASEAN Single Window initiative is well under way, with most member countries participating. When fully implemented, the platform will support seamless trade among members and may attract increased trade flows from partners outside the region. In services, the ASEAN logistics subsector is being incrementally liberalised. This effort remains as one of the region’s more ambitious goals, as the sector is among the most highly protected in ASEAN member countries. For the services sector, the ASEAN Economic Ministers had set a 2015 deadline for liberalisation, but progress has been slow for many ASEAN countries. The effectiveness of mutual recognition arrangements (MRAs) depends on the movement of skilled labour, where there remains room for growth.
The impacts of digitalisation on manufacturing and services
The expansion of the digital economy – the convergence of fixed, mobile and broadcast networks, the increasing connectivity of devices and objects, and the changes in social interactions and personal relationships that these developments bring about – is reshaping the manufacturing and services sectors in Emerging Asia. This process of digitalisation has brought about rapid change and presents further opportunities and challenges for the region.
In Emerging Asia, the increased use of ICT in manufacturing and services is affecting business activities, trade and productivity. It has led to the expansion of existing industries and the emergence of new ones in the region, such as electronics manufacturing, software development and ICT in Viet Nam; business and knowledge process outsourcing in the Philippines; and mobile payments in China. ICT services embodied in manufacturing and services account for a considerable share of the value of exports from some of the region. Interestingly, it is primarily domestic digital added value that is being embodied in services exports. There is also evidence that improvements in aggregate and firm-level productivity are associated with the use of new technologies in many countries.
Despite the progress made, access to the digital economy is uneven across and within Emerging Asian countries. For example, rates of Internet use, a prerequisite for participation in most aspects of the digital economy, varies between 81% of the population in Singapore and 22% in Lao PDR. Policy makers in the region seeking to foster the continued responsible development of digitalisation should consider addressing the issue of trade restrictions, particularly those affecting trade in services; barriers to investment in the digital economy; the development and reform of physical and regulatory infrastructure; and ways of addressing labour market and social challenges. As digitalisation is influenced by a range of factors, policy strategies will need to be adapted to local needs. Continued regional co-operation is also needed in addressing shared and cross-border challenges in the digital economy.
Key structural policy challenges
As illustrated in the policy focus discussions of the structural policy country notes, domestic structural reform is necessary to improve prospects for inclusive and sustainable growth in Emerging Asia. These notes highlight some of the key areas for reform in Southeast Asia, China and India. Policy areas covered include skills and education, FDI, infrastructure and connectivity, green finance, trade, state-owned enterprises, land use, and innovation. The contexts of these policy challenges are discussed, in order to appropriately frame recommendations for achieving national development goals.
eXecUtIve SUMMarY
19ecONOMIc OUtlOOK fOr SOUtHeaSt aSIa, cHINa aNd INdIa 2018: fOSterINg grOWtH tHrOUgH dIgItalISatION © Oecd 2018
OverviewChapter 1: Macroeconomic assessments and economic outlook for Emerging Asia
Overall, growth in Emerging Asia – Southeast Asia, China and India – is projected to remain robust in 2017. Growth in many ASEAN countries and China has picked up on a strong trade rebound and resilient domestic consumption, while growth in India has edged downwards owing to taxation and monetary reforms. The region’s growth is also projected to remain solid in the medium term. While growth will slow in China, it is expected to stay brisk in India. Southeast Asia is poised to maintain strong growth momentum from 2018 to 2022 on robust domestic private consumption and infrastructure initiatives planned by a number of governments.
The external positions of Emerging Asian economies have remained generally solid, although recent current account trends vary and net inflows of foreign direct investment (FDI) have weakened in some countries. Monetary authorities in the region are maintaining an accommodative monetary policy, anchored on benign inflation, despite recent manifestations of renewed price pressures. Coupled with the perception that risk is low, this is supporting optimism in financial markets. Meanwhile, fiscal policy in many economies has been expansionary and looks set to continue as such in the near term with planned increases in infrastructure spending. A widening fiscal gap may be a concern in certain economies, but positions are generally stable.
Overview and main findings: The economic outlook for 2017-22
Gross domestic product (GDP) in Emerging Asia is expected to grow by 6.4% in 2017, unchanged from the 2016 rate (Table 1), and 6.3% during 2018-22, according to the OECD Development Centre’s Medium-term Projection Framework (MPF-2018). Emerging Asia’s estimated growth rate in 2017 is higher compared with the projected growth rates of Latin America and the Caribbean, 1.1%, and Africa, 3.4%. Growth in ASEAN and China is on a somewhat steeper upward trajectory in 2017 on the strength of the trade rebound and resilience of domestic consumption, whereas India’s growth in 2017 appears to be retreating as the economy wobbles due to the effects of demonetisation and the impact of tax changes. Over the medium term, however, China’s growth rate is expected to slow to an average of 6.2%, while India’s average expansion rate in the next five years will remain robust at 7.3%. Structural reform challenges in China indicate that the pace of growth will slow from its 2011-15 rate. Southeast Asia is poised to achieve average growth of 5.2% between 2018 and 2022, relatively unchanged from 5.1% between 2011 and 2015. Growth prospects of ASEAN are anchored on robust domestic demand and on the infrastructure initiatives presented by a number of governments. Among the bloc’s ten member countries, Cambodia, Lao PDR and Myanmar are projected to grow the fastest from now through 2022, while the Philippines and Viet Nam are expected to lead in growth among the ASEAN-5 (Indonesia, Malaysia, Philippines, Thailand and Viet Nam).
2120 ecONOMIc OUtlOOK fOr SOUtHeaSt aSIa, cHINa aNd INdIa 2018: fOSterINg grOWtH tHrOUgH dIgItalISatION © Oecd 2018 ecONOMIc OUtlOOK fOr SOUtHeaSt aSIa, cHINa aNd INdIa 2018: fOSterINg grOWtH tHrOUgH dIgItalISatION © Oecd 2018
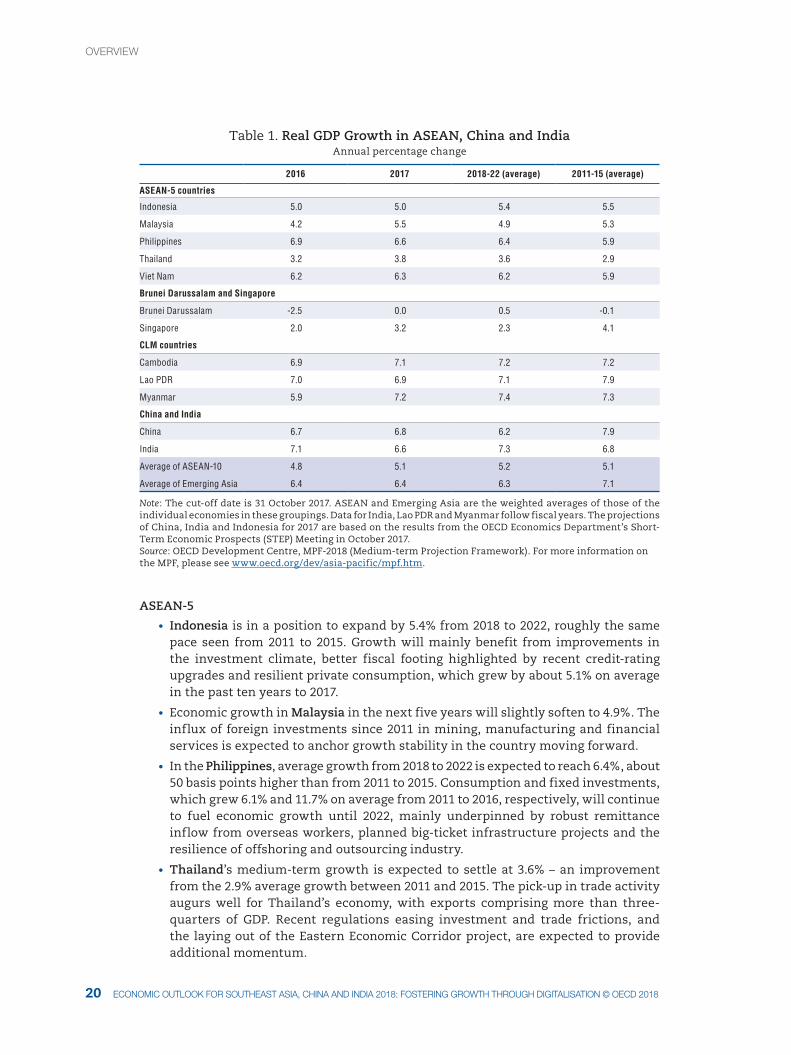
Table 1. Real GDP Growth in ASEAN, China and IndiaAnnual percentage change
2016 2017 2018-22 (average) 2011-15 (average)
ASEAN-5 countries
Indonesia 5.0 5.0 5.4 5.5
Malaysia 4.2 5.5 4.9 5.3
Philippines 6.9 6.6 6.4 5.9
Thailand 3.2 3.8 3.6 2.9
Viet Nam 6.2 6.3 6.2 5.9
Brunei Darussalam and Singapore
Brunei Darussalam -2.5 0.0 0.5 -0.1
Singapore 2.0 3.2 2.3 4.1
CLM countries
Cambodia 6.9 7.1 7.2 7.2
Lao PDR 7.0 6.9 7.1 7.9
Myanmar 5.9 7.2 7.4 7.3
China and India
China 6.7 6.8 6.2 7.9
India 7.1 6.6 7.3 6.8
Average of ASEAN-10 4.8 5.1 5.2 5.1
Average of Emerging Asia 6.4 6.4 6.3 7.1
Note: The cut-off date is 31 October 2017. ASEAN and Emerging Asia are the weighted averages of those of the individual economies in these groupings. Data for India, Lao PDR and Myanmar follow fiscal years. The projections of China, India and Indonesia for 2017 are based on the results from the OECD Economics Department’s Short-Term Economic Prospects (STEP) Meeting in October 2017.Source: OECD Development Centre, MPF-2018 (Medium-term Projection Framework). For more information on the MPF, please see www.oecd.org/dev/asia-pacific/mpf.htm.
ASEAN-5
• Indonesia is in a position to expand by 5.4% from 2018 to 2022, roughly the same pace seen from 2011 to 2015. Growth will mainly benefit from improvements in the investment climate, better fiscal footing highlighted by recent credit-rating upgrades and resilient private consumption, which grew by about 5.1% on average in the past ten years to 2017.
• Economic growth in Malaysia in the next five years will slightly soften to 4.9%. The influx of foreign investments since 2011 in mining, manufacturing and financial services is expected to anchor growth stability in the country moving forward.
• In the Philippines, average growth from 2018 to 2022 is expected to reach 6.4%, about 50 basis points higher than from 2011 to 2015. Consumption and fixed investments, which grew 6.1% and 11.7% on average from 2011 to 2016, respectively, will continue to fuel economic growth until 2022, mainly underpinned by robust remittance inflow from overseas workers, planned big-ticket infrastructure projects and the resilience of offshoring and outsourcing industry.
• Thailand’s medium-term growth is expected to settle at 3.6% – an improvement from the 2.9% average growth between 2011 and 2015. The pick-up in trade activity augurs well for Thailand’s economy, with exports comprising more than three-quarters of GDP. Recent regulations easing investment and trade frictions, and the laying out of the Eastern Economic Corridor project, are expected to provide additional momentum.
OvervIeW
21ecONOMIc OUtlOOK fOr SOUtHeaSt aSIa, cHINa aNd INdIa 2018: fOSterINg grOWtH tHrOUgH dIgItalISatION © Oecd 2018
• Viet Nam is likewise expected to outmatch the 5.9% average growth between 2011 and 2015, with an estimated expansion rate of 6.2% in the next five years. Private consumption, though gradually slowing, will continue to be a reliable source of growth momentum. Exports will also boost GDP growth, if global trade recovery makes progress.
Brunei Darussalam and Singapore
• Brunei Darussalam is showing signs of revival amid renewed (though still muted) optimism in oil and gas prices. The economy is projected to expand by 0.5% on average between 2018 and 2022, in line with better global trade prospects, barring another episode of steep energy price slides.
• Singapore’s GDP growth is also on the upswing in 2017 as manufacturing and trade-related services gain momentum. Growth is projected to remain steady at 2.3% for the period 2018-22. Investment in areas that foster digitalisation and the government’s commitment to continue pouring funds into its social and infrastructure agenda are a boon to the country’s potential output.
CLM countries
• Growth of the CLM economies (Cambodia, Lao PDR and Myanmar) is expected to stay strong through 2022. Cambodia’s growth will reach around 7.2% in the next half-decade on the back of export recovery, consumption-supportive industrialisation policy and initiatives to develop capital markets.
• Growth in Lao PDR from 2018 to 2022 will remain robust at 7.1%, although this is lower than the average of 7.9% from 2011 to 2015. An impressive decline in poverty and an anticipated rebound in tourist arrivals bode well for private consumption. The new competition law, amendments to the investment promotion law and initiatives to broaden linkages of special economic zones with neighbouring ASEAN members should also facilitate capital infusion and trade.
• In Myanmar, leading indicators suggest a marked recovery after a steep pullback in tourist arrivals and exports took its toll on GDP growth in 2016. In the medium term, the economy is expected to expand by 7.4%, above the country’s average of 7.3% from 2011 to 2015. The renewed uptrend in exports and tourism, coupled with the passage of a new investment law, will likely keep investors interested in the country. Overseas remittances, which jumped in 2016, stand to provide substantial fuel to private spending in the coming years.
China and India
• China is expected to grow more slowly, by 6.2% in the medium term. Excess capacity issues and financial market vulnerabilities are the main drags on growth. Private consumption and investment will remain the anchors of growth. Exports are expected to contribute more significantly in the coming years as new free trade zones gain traction and following the government’s initiatives to scale up the value added of China’s traded goods.
• India’s growth will rise to about 7.3% between FY 2018-19 and FY 2022-23, from the 6.8% average from FY 2011-12 to FY 2015-16, despite the structural strains due to reform measures. Economic growth will draw support from the steady expansion of private consumption and investments following foreign ownership liberalisation in some industries. The planned government spending expansion should further boost growth. However, the jump in the stock of banks’ bad assets and contingent liability risks may limit the expansion of demand.
OvervIeW
1. OvervIeW
2322 ecONOMIc OUtlOOK fOr SOUtHeaSt aSIa, cHINa aNd INdIa 2018: fOSterINg grOWtH tHrOUgH dIgItalISatION © Oecd 2018 ecONOMIc OUtlOOK fOr SOUtHeaSt aSIa, cHINa aNd INdIa 2018: fOSterINg grOWtH tHrOUgH dIgItalISatION © Oecd 2018
Other key points of the economic outlook and assessment• The accommodative monetary stances of central banks in many countries in the
region persist, anchored on benign inflation, even though recent data indicate some manifestation of renewed price pressures. Headline inflation still diverges across Emerging Asia. Inflation firmed up in most of the big ASEAN economies, driven by the marked rise in food and transport sub-indices. CPI growth in China is on a very gradual rise, owing to increases in housing and health care costs. Headline inflation in India is increasing gradually supported by movements in fuel, clothing and housing prices. In contrast, headline inflation has waned in the CLM countries.
• The external positions of Emerging Asia have remained generally robust. The recovery of exports and of imports have had contradictory impacts on current account (CA) balances. Net FDI inflows to Emerging Asia have stayed largely on the uptrend in recent years. Factors that have kept investors interested in the region include improvement in trade prospects, the announcement of big-ticket infrastructure projects, the resilience of domestic demand, and the aggressive drive of some governments to develop industries related to information technology and e-commerce through investment incentives.
• Fiscal policy in Emerging Asia has been largely expansionary this year. A widening gap may be a concern in some economies, but fiscal positions are generally stable. In the near term, many large ASEAN countries plan to increase spending, especially on infrastructure. China is maintaining a stable footing despite stronger spending of late. This may not be the case for India, Lao PDR and Viet Nam, which are trying to contain concerns related to budget deficits and poor performance of financial institutions.
Risks to the outlook
Overall, Emerging Asia is projected to experience favourable growth over the near and medium terms. However, maintaining robust growth momentum requires careful attention to several downside risks:
• the possibility of a more rapid monetary policy normalisation in advanced economies
• a rapid rise in private-sector debt
• the broadening of trade restrictions globally coupled by limited progress in regional trade agreements, including the Regional Comprehensive Economic Partnership (RCEP).
More rapid monetary policy normalisation in advanced economies would affect Emerging Asia
The upward march of the US policy rate since December 2015 has had benign effects on financial markets in Emerging Asia thus far, thanks largely to the advanced transmission of monetary policy direction. The commitment to accommodative monetary policy made by the European Central Bank and the Bank of Japan, at least in the next few months, has also helped to keep speculation at bay. The concern is what may happen if major central banks proceed with monetary policy normalisation at a more rapid pace than expected. With the amount of liquidity involved, economic activity in Emerging Asia could be dampened through various channels.
First, rapid monetary normalisation in advanced economies will potentially narrow interest rate differentials rather sharply and can instigate capital outflow from Emerging Asian economies. Capital flight can in turn intensify depreciation pressures, can be inflationary and can trigger central banks to raise their own policy rates.
Second, it can expose some vulnerabilities in the corporate sector. Higher interest rates can lead to capital losses and can ultimately result in a downsizing of corporate balance sheets. Financial institutions, especially those already facing some asset quality
OvervIeW
1. OvervIeW1. OvervIeW
23ecONOMIc OUtlOOK fOr SOUtHeaSt aSIa, cHINa aNd INdIa 2018: fOSterINg grOWtH tHrOUgH dIgItalISatION © Oecd 2018
issues, might face difficulties as corporate solvency risks rise. And as firms’ spending capacity gets constrained, domestic demand will have to carry more slack.
Third, liquidity reduction in advanced economies can dampen their own demand for imported goods. Imports coming from Emerging Asia can be affected directly and indirectly through global value chains.
In summary, as it is, the monetary normalisation in advanced economies will affect Emerging Asia’s growth through various channels. It is arguable, however, that adjustments will not be disruptive should there be no significant deviation between the announced path of policy changes in the US, Europe or Japan and the actual policy changes. In addition, the scale of Emerging Asia’s international reserves provides a considerable buffer while the generally stable macro fundamentals give the region some room for manoeuvre to mitigate negative effects.
Private-sector debt accumulation creates risks for growth
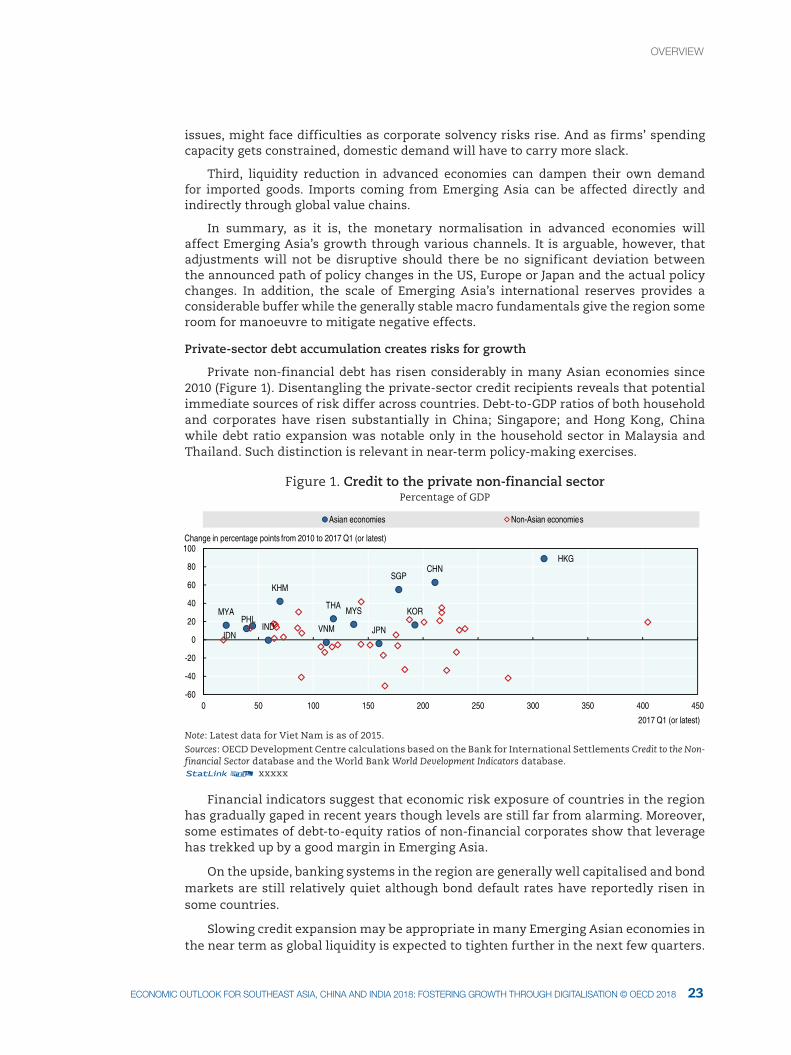
Private non-financial debt has risen considerably in many Asian economies since 2010 (Figure 1). Disentangling the private-sector credit recipients reveals that potential immediate sources of risk differ across countries. Debt-to-GDP ratios of both household and corporates have risen substantially in China; Singapore; and Hong Kong, China while debt ratio expansion was notable only in the household sector in Malaysia and Thailand. Such distinction is relevant in near-term policy-making exercises.
Figure 1. Credit to the private non-financial sectorPercentage of GDP
HKGCHN
KOR
SGP
JPN
MYSTHA
INDIDN
KHM
MYAPHL
VNM
-60
-40
-20
0
20
40
60
80
100
0 50 100 150 200 250 300 350 400 450
2017 Q1 (or latest)
Asian economies Non-Asian economies
Change in percentage points from 2010 to 2017 Q1 (or latest)
Note: Latest data for Viet Nam is as of 2015.Sources: OECD Development Centre calculations based on the Bank for International Settlements Credit to the Non-financial Sector database and the World Bank World Development Indicators database.12 xxxxx
Financial indicators suggest that economic risk exposure of countries in the region has gradually gaped in recent years though levels are still far from alarming. Moreover, some estimates of debt-to-equity ratios of non-financial corporates show that leverage has trekked up by a good margin in Emerging Asia.
On the upside, banking systems in the region are generally well capitalised and bond markets are still relatively quiet although bond default rates have reportedly risen in some countries.
Slowing credit expansion may be appropriate in many Emerging Asian economies in the near term as global liquidity is expected to tighten further in the next few quarters.
OvervIeW
1. OvervIeW
2524 ecONOMIc OUtlOOK fOr SOUtHeaSt aSIa, cHINa aNd INdIa 2018: fOSterINg grOWtH tHrOUgH dIgItalISatION © Oecd 2018 ecONOMIc OUtlOOK fOr SOUtHeaSt aSIa, cHINa aNd INdIa 2018: fOSterINg grOWtH tHrOUgH dIgItalISatION © Oecd 2018
In terms of monitoring, monetary authorities in the region have been very active in upgrading their surveillance frameworks over the years. However, the progress has been asymmetric and the quality of monitoring is uneven. In this respect, regional platforms and multilateral institutions could take more prominent roles in facilitating the catch-up process by enhancing capacities of national institutions.
The RCEP trade agreement holds great potential but faces challenges
The Regional Comprehensive Economic Partnership (RCEP) free trade agreement (FTA) is believed to have the potential to reshape the region’s existing economic integration framework into a more committed and binding agreement that extends beyond traditional trade agreements. RCEP, which is poised to set a higher standard than the existing ASEAN-plus-one agreements, will reap higher welfare gains by countries participating in the long term.
The RCEP process is moving forward; 19 rounds of negotiations have taken place to date. At the last round, held in Hyderabad, India, in July 2017, agreement was reached on a set of “key elements for significant outcomes” to be achieved by the end of 2017. The meeting also highlighted the need for balanced discussions to push negotiations forward across all areas. This was followed by a ministerial-level gathering in the Philippines in September.
Despite progress on the RCEP, stumbling blocks remain. While most of the participating countries have existing FTAs with one another, some do not. More time will be needed for them to negotiate from scratch, and this will have an impact on the time needed to finalise the negotiations.
Another factor that is complicating the finalisation process of RCEP negotiations concerns the large number of countries involved and their level of development, with priorities and interests differing among participants. While some countries prefer a simple manufacturing-oriented trade deal, other members are pushing for liberalisation of the services sector and freedom of movement for skilled workers.
It remains to be seen whether the final product of RCEP negotiations will be an in-depth and inclusive integration or just a basic commitment to be upgraded in the years to come. Nevertheless, due to missing chapters, the RCEP will result in a somewhat diluted form of economic integration, compared to the stalled Trans-Pacific Partnership agreement.
• The RCEP agreement does not include provisions on SOEs such as guidelines on their accepted behaviour in the marketplace to promote a level playing field and prevent them from crowding out local and international firms domestically.
• Likewise, a chapter on government procurement is not included in the RCEP framework. Without this chapter, governments are free to award projects to local and international firms according to their own mechanisms, processes and standards. As with SOEs, the absence of a chapter on government procurement will result in an unlevel playing field.
• Provisions on investment and dispute settlement are vital discipline chapters that represent the backbone of the RCEP agreement, as they address the issue of backpedalling by governments when it comes to international investments. Nevertheless, the extent and depth of the penalisation commitment are still unknown.
OvervIeW
1. OvervIeW1. OvervIeW
25ecONOMIc OUtlOOK fOr SOUtHeaSt aSIa, cHINa aNd INdIa 2018: fOSterINg grOWtH tHrOUgH dIgItalISatION © Oecd 2018
• Although crucial, a labour chapter is also not included in the agreement. Yet it is vital to address the rights of the region’s workers, both skilled and unskilled, in terms of wages, working conditions and the empowerment of unions.
• Finally, the absence of an environment chapter in the RCEP may be an issue.
Despite these caveats, the RCEP still has the potential to become a very inclusive agreement with a balanced agenda for growth in the area of trade liberalisation and for protecting the rights of consumers and workers. To speed up finalisation of the agreement, countries may wish to consider that a stricter and feasible deadline be incorporated into every negotiation.
Chapter 2: Progress and challenges of regional integration in ASEAN and Emerging Asia
Building momentum for the ASEAN Economic Community
ASEAN promotes inclusive and innovation-led economic growth to enhance the performance of the ASEAN Economic Community (AEC). In 2017, ASEAN members adopted the AEC 2025 Consolidated Strategic Action Plan to implement the 2025 AEC Blueprint. Endorsed by ASEAN economic ministers and the AEC Council, the Strategic Action Plan aims to foster regional integration by increasing trade and investment; integrating micro, small and medium-sized enterprises into the digital economy; and developing an innovation-driven economy. These measures reflect the main theme of the 30th ASEAN Summit in April 2017, “Partnering for Change, Engaging the World”.
In the past year, regional integration has progressed most significantly in the trade of goods and services. The speed of implementing the ASEAN Trade in Goods Agreement (ATIGA) schedule varies by country. Cambodia, Lao PDR, Myanmar and Viet Nam (the CLMV countries) further reduced tariffs earlier in 2017 under the ATIGA schedule. Additionally, the digital economy will enhance the free flow of goods and services within ASEAN through the ASEAN Single Window initiative. ASEAN member countries’ advances in implementing their National Single Windows further boosted trade activities. The ASEAN Framework Agreement on Services (AFAS) and mutual recognition arrangements (MRAs) in several sectors have helped liberalise services; the ninth package of AFAS commitments is in effect. In addition to the eight MRAs signed in the past, the ASEAN MRA for generic medicinal products was finalised recently.
Trade in goods: ASEAN is working to further reduce tariffs
ASEAN is working rapidly to further reduce tariffs to meet ATIGA commitments by 2018. ASEAN-6 (Brunei Darussalam, Indonesia, Malaysia, the Philippines, Singapore and Thailand) removed all import duties by 2010, except for items in the Sensitive and Highly Sensitive Lists. Tariffs were reduced more quickly than planned in the original schedule. The CLMV countries advanced the reduction of import tariffs from 2018 to 2015 for all products except those in the Sensitive and Highly Sensitive Lists, and the tariff reduction for some sensitive products is scheduled for 2018, in accordance with the provisions of the Protocol to Amend the Common Effective Preferential Tariff (CEPT) Agreement for the Elimination of Import Duties. The AEC Blueprint has introduced the remaining products in the Sensitive List into the CEPT schedule. Tariffs on these products were decreased to between zero and 5% for Lao PDR and Myanmar in 2015, and for Cambodia in 2017.
OvervIeW
1. OvervIeW
2726 ecONOMIc OUtlOOK fOr SOUtHeaSt aSIa, cHINa aNd INdIa 2018: fOSterINg grOWtH tHrOUgH dIgItalISatION © Oecd 2018 ecONOMIc OUtlOOK fOr SOUtHeaSt aSIa, cHINa aNd INdIa 2018: fOSterINg grOWtH tHrOUgH dIgItalISatION © Oecd 2018
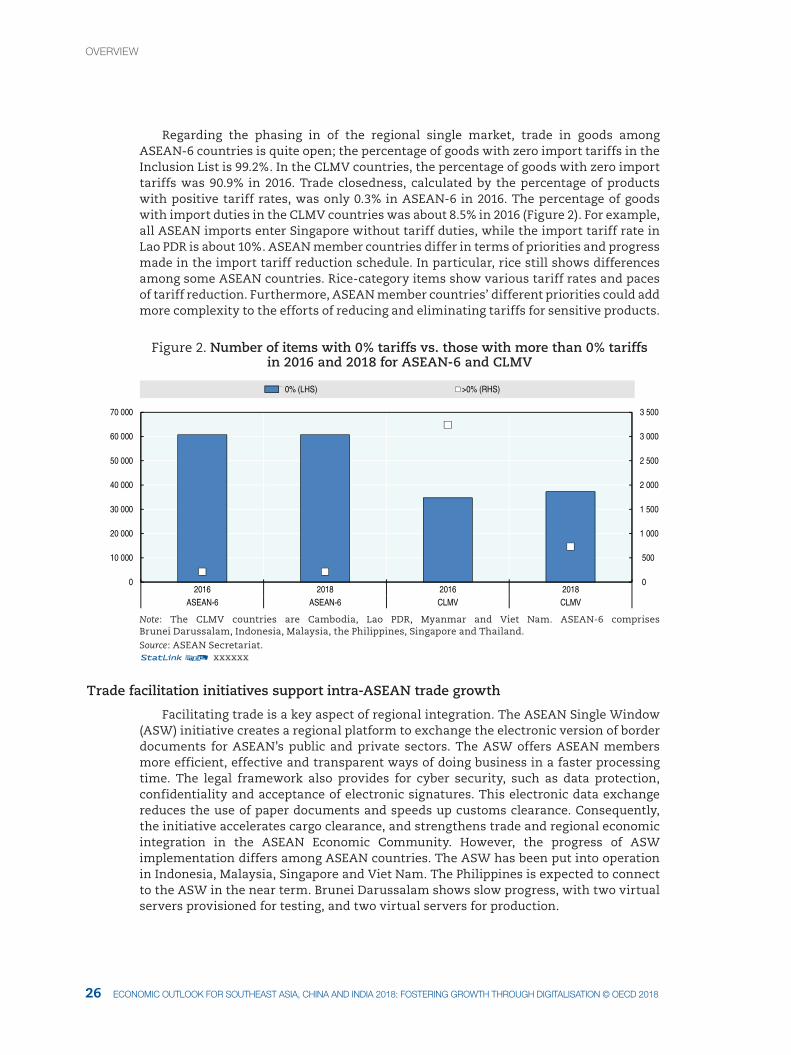
Regarding the phasing in of the regional single market, trade in goods among ASEAN-6 countries is quite open; the percentage of goods with zero import tariffs in the Inclusion List is 99.2%. In the CLMV countries, the percentage of goods with zero import tariffs was 90.9% in 2016. Trade closedness, calculated by the percentage of products with positive tariff rates, was only 0.3% in ASEAN-6 in 2016. The percentage of goods with import duties in the CLMV countries was about 8.5% in 2016 (Figure 2). For example, all ASEAN imports enter Singapore without tariff duties, while the import tariff rate in Lao PDR is about 10%. ASEAN member countries differ in terms of priorities and progress made in the import tariff reduction schedule. In particular, rice still shows differences among some ASEAN countries. Rice-category items show various tariff rates and paces of tariff reduction. Furthermore, ASEAN member countries’ different priorities could add more complexity to the efforts of reducing and eliminating tariffs for sensitive products.
Figure 2. Number of items with 0% tariffs vs. those with more than 0% tariffs in 2016 and 2018 for ASEAN-6 and CLMV
0
500
1 000
1 500
2 000
2 500
3 000
3 500
0
10 000
20 000
30 000
40 000
50 000
60 000
70 000
2016 2018 2016 2018ASEAN-6 ASEAN-6 CLMV CLMV
0% (LHS) >0% (RHS)
Note: The CLMV countries are Cambodia, Lao PDR, Myanmar and Viet Nam. ASEAN-6 comprises Brunei Darussalam, Indonesia, Malaysia, the Philippines, Singapore and Thailand.Source: ASEAN Secretariat.12 xxxxxx
Trade facilitation initiatives support intra-ASEAN trade growth
Facilitating trade is a key aspect of regional integration. The ASEAN Single Window (ASW) initiative creates a regional platform to exchange the electronic version of border documents for ASEAN’s public and private sectors. The ASW offers ASEAN members more efficient, effective and transparent ways of doing business in a faster processing time. The legal framework also provides for cyber security, such as data protection, confidentiality and acceptance of electronic signatures. This electronic data exchange reduces the use of paper documents and speeds up customs clearance. Consequently, the initiative accelerates cargo clearance, and strengthens trade and regional economic integration in the ASEAN Economic Community. However, the progress of ASW implementation differs among ASEAN countries. The ASW has been put into operation in Indonesia, Malaysia, Singapore and Viet Nam. The Philippines is expected to connect to the ASW in the near term. Brunei Darussalam shows slow progress, with two virtual servers provisioned for testing, and two virtual servers for production.
OvervIeW
1. OvervIeW1. OvervIeW
27ecONOMIc OUtlOOK fOr SOUtHeaSt aSIa, cHINa aNd INdIa 2018: fOSterINg grOWtH tHrOUgH dIgItalISatION © Oecd 2018
Trade in services: ASEAN strives to liberalise services, but progress is slow
To date, ASEAN member states are intensifying efforts to finalise the outstanding tenth package of commitments under AFAS with the schedule for completion in 2017. The ninth package, signed in 2015 and the latest in effect, resulted from negotiations among ASEAN countries on measures that affect trade in selected services. This agreement highlights detailed commitments to liberalise the services sub-sectors in different ASEAN countries. The steps towards liberalisation are based on the targeted services and deadlines set in the AEC Blueprint 2025. One of the ninth package’s most ambitious targets is the requirement for members to increase their minimum ASEAN equity participation to 70% in logistics services. Efforts to liberalise logistics services have been ongoing since 2005, when ASEAN members ratified the fifth package of AFAS commitments.
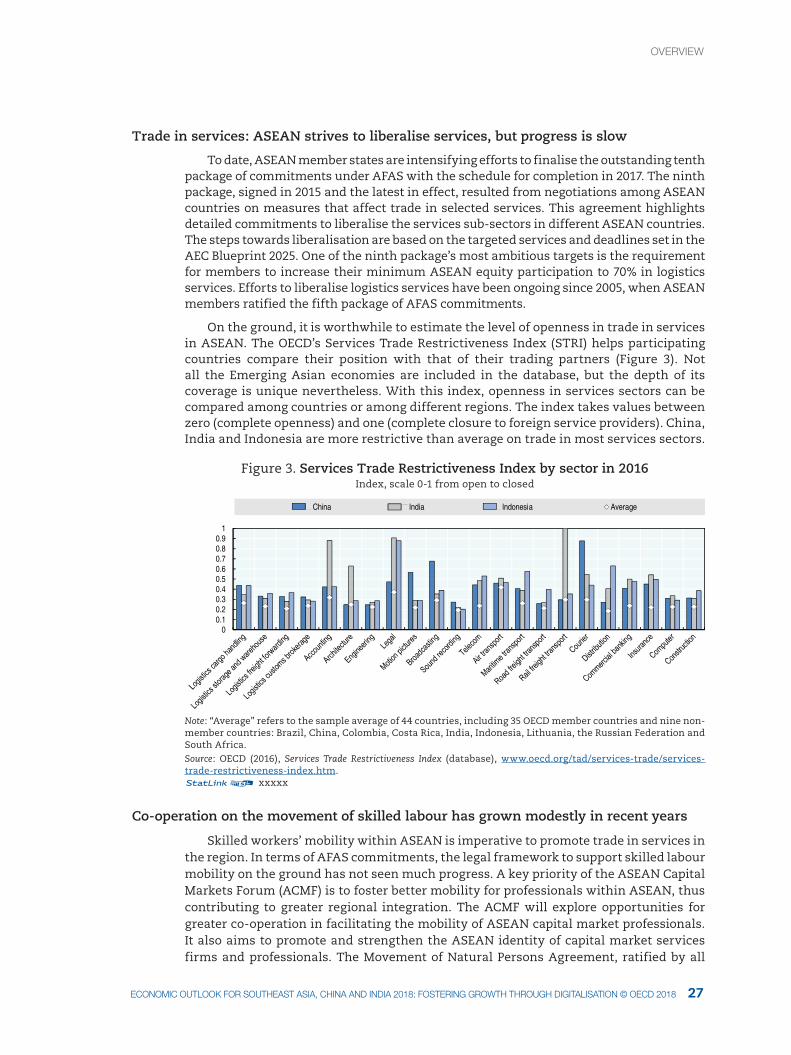
On the ground, it is worthwhile to estimate the level of openness in trade in services in ASEAN. The OECD’s Services Trade Restrictiveness Index (STRI) helps participating countries compare their position with that of their trading partners (Figure 3). Not all the Emerging Asian economies are included in the database, but the depth of its coverage is unique nevertheless. With this index, openness in services sectors can be compared among countries or among different regions. The index takes values between zero (complete openness) and one (complete closure to foreign service providers). China, India and Indonesia are more restrictive than average on trade in most services sectors.
Figure 3. Services Trade Restrictiveness Index by sector in 2016 Index, scale 0-1 from open to closed
00.10.20.30.40.50.60.70.80.9
1
China India Indonesia Average
Note: “Average” refers to the sample average of 44 countries, including 35 OECD member countries and nine non-member countries: Brazil, China, Colombia, Costa Rica, India, Indonesia, Lithuania, the Russian Federation and South Africa. Source: OECD (2016), Services Trade Restrictiveness Index (database), www.oecd.org/tad/services-trade/services-trade-restrictiveness-index.htm. 12 xxxxx
Co-operation on the movement of skilled labour has grown modestly in recent years
Skilled workers’ mobility within ASEAN is imperative to promote trade in services in the region. In terms of AFAS commitments, the legal framework to support skilled labour mobility on the ground has not seen much progress. A key priority of the ASEAN Capital Markets Forum (ACMF) is to foster better mobility for professionals within ASEAN, thus contributing to greater regional integration. The ACMF will explore opportunities for greater co-operation in facilitating the mobility of ASEAN capital market professionals. It also aims to promote and strengthen the ASEAN identity of capital market services firms and professionals. The Movement of Natural Persons Agreement, ratified by all
OvervIeW

1. OvervIeW
2928 ecONOMIc OUtlOOK fOr SOUtHeaSt aSIa, cHINa aNd INdIa 2018: fOSterINg grOWtH tHrOUgH dIgItalISatION © Oecd 2018 ecONOMIc OUtlOOK fOr SOUtHeaSt aSIa, cHINa aNd INdIa 2018: fOSterINg grOWtH tHrOUgH dIgItalISatION © Oecd 2018
ASEAN countries in 2016, has boosted these efforts. Because the ratification is quite recent, each country’s implementation of the commitment remains a challenge and needs to be examined in the near future.
In addition to the eight previous MRAs, ASEAN recently finalised an MRA for generic medicinal products to encourage a smoother flow of generic drugs within ASEAN. In addition to the MRAs signed for selected occupations, the MRAs on automotive products, processed food, and building and construction material are poised to be included in the list as soon as negotiations are finished (Table 2).
Table 2. Timeline of ASEAN MRAsType of MRA Date Status
ASEAN MRA on Engineering Services 9 December 2005 Signed
ASEAN MRA on Nursing Services 8 December 2006 Signed
ASEAN MRA on Architectural Services 19 November 2007 Signed
ASEAN Framework Arrangement for the Mutual Recognition of Surveying Qualifications 19 November 2007 Signed
ASEAN MRA Framework on Accountancy Services 26 February 2009 Signed
ASEAN MRA on Medical Practitioners 26 February 2009 Signed
ASEAN MRA on Dental Practitioners 26 February 2009 Signed
ASEAN MRA on Tourism Professionals 9 November 2012 Signed
ASEAN MRA for Bio-Equivalence (BE) Study Reports of Generic Medicinal Products Mid-2016 Finalised
ASEAN MRA for Automotive Products Ongoing Under negotiation
ASEAN MRA for Processed Food Products Ongoing Under negotiation
ASEAN MRA for Building and Construction Materials Ongoing Under negotiation
Source: OECD Development Centre compilation, based on ASEAN Secretariat.
Chapter 3: Digitalisation in manufacturing and services in Emerging Asia
The digital economy includes the convergence of fixed, mobile and broadcast networks, the increasing connectivity of devices and objects, and the changes in social interactions and personal relationships that these developments bring about. Through digitalisation, digital technologies and processes are being integrated into more areas of economic activity. This transformation presents opportunities for growth and development alongside economic and social challenges. In Emerging Asia, the increased use of information and communication technology (ICT) in manufacturing and services is affecting business activities, trade and productivity. Policy makers in the region can help manufacturing and services firms to seize the opportunities presented by digitalisation through reforms to trade and investment policies, the development of supportive infrastructure, addressing labour market challenges and other reforms targeting the main constraints facing their economies.
Digital technologies are transforming Emerging Asian economies
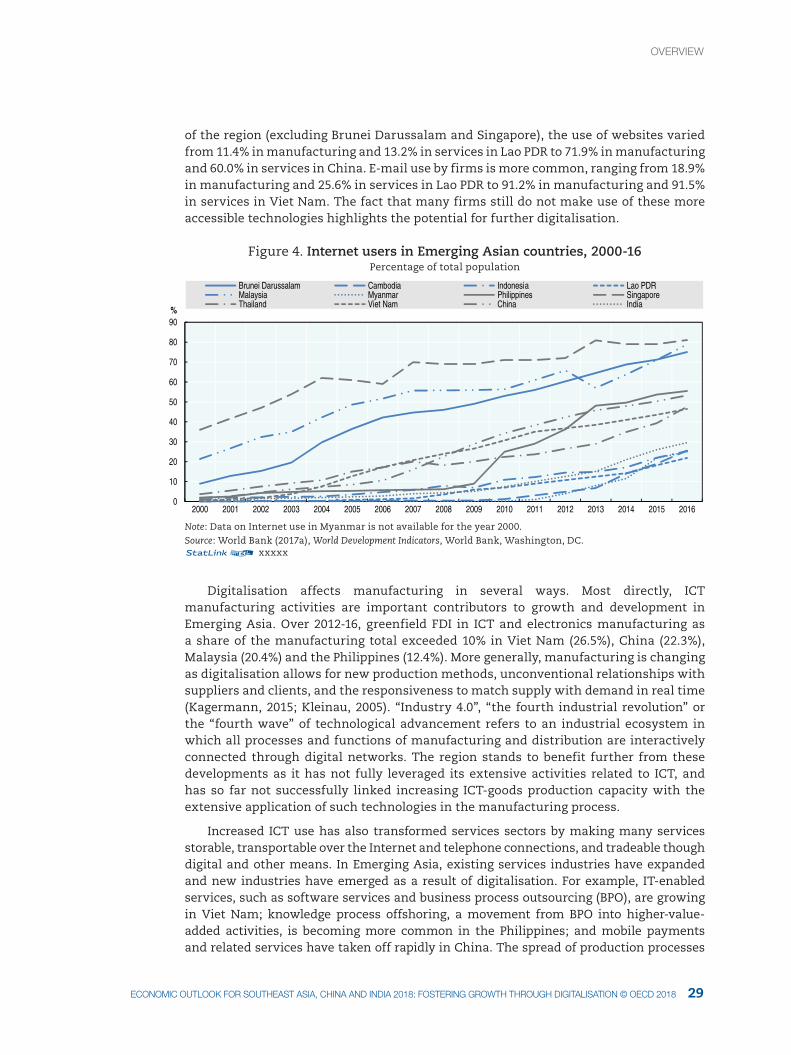
Emerging Asian countries have been enthusiastic adopters of new technologies, although further progress is needed to foster inclusive digitalisation across the region. Internet use, a prerequisite for participation in much of the activity in the digital economy, has increased across the region in recent years (Figure 4). Differences remain considerable at the country level; in 2016, 81.0% of Singapore’s population were Internet users, compared with only 21.9% of the population in Lao PDR. Many firms are also making use of ICT. According to surveys conducted between 2012 and 2016 in much
OvervIeW
1. OvervIeW1. OvervIeW
29ecONOMIc OUtlOOK fOr SOUtHeaSt aSIa, cHINa aNd INdIa 2018: fOSterINg grOWtH tHrOUgH dIgItalISatION © Oecd 2018
of the region (excluding Brunei Darussalam and Singapore), the use of websites varied from 11.4% in manufacturing and 13.2% in services in Lao PDR to 71.9% in manufacturing and 60.0% in services in China. E-mail use by firms is more common, ranging from 18.9% in manufacturing and 25.6% in services in Lao PDR to 91.2% in manufacturing and 91.5% in services in Viet Nam. The fact that many firms still do not make use of these more accessible technologies highlights the potential for further digitalisation.
Figure 4. Internet users in Emerging Asian countries, 2000-16Percentage of total population
0
10
20
30
40
50
60
70
80
90
2000 2001 2002 2003 2004 2005 2006 2007 2008 2009 2010 2011 2012 2013 2014 2015 2016
%
Brunei Darussalam Cambodia Indonesia Lao PDRMalaysia Myanmar Philippines SingaporeThailand Viet Nam China India
Note: Data on Internet use in Myanmar is not available for the year 2000.Source: World Bank (2017a), World Development Indicators, World Bank, Washington, DC.12 xxxxx
Digitalisation affects manufacturing in several ways. Most directly, ICT manufacturing activities are important contributors to growth and development in Emerging Asia. Over 2012-16, greenfield FDI in ICT and electronics manufacturing as a share of the manufacturing total exceeded 10% in Viet Nam (26.5%), China (22.3%), Malaysia (20.4%) and the Philippines (12.4%). More generally, manufacturing is changing as digitalisation allows for new production methods, unconventional relationships with suppliers and clients, and the responsiveness to match supply with demand in real time (Kagermann, 2015; Kleinau, 2005). “Industry 4.0”, “the fourth industrial revolution” or the “fourth wave” of technological advancement refers to an industrial ecosystem in which all processes and functions of manufacturing and distribution are interactively connected through digital networks. The region stands to benefit further from these developments as it has not fully leveraged its extensive activities related to ICT, and has so far not successfully linked increasing ICT-goods production capacity with the extensive application of such technologies in the manufacturing process.
Increased ICT use has also transformed services sectors by making many services storable, transportable over the Internet and telephone connections, and tradeable though digital and other means. In Emerging Asia, existing services industries have expanded and new industries have emerged as a result of digitalisation. For example, IT-enabled services, such as software services and business process outsourcing (BPO), are growing in Viet Nam; knowledge process offshoring, a movement from BPO into higher-value-added activities, is becoming more common in the Philippines; and mobile payments and related services have taken off rapidly in China. The spread of production processes
OvervIeW
1. OvervIeW
3130 ecONOMIc OUtlOOK fOr SOUtHeaSt aSIa, cHINa aNd INdIa 2018: fOSterINg grOWtH tHrOUgH dIgItalISatION © Oecd 2018 ecONOMIc OUtlOOK fOr SOUtHeaSt aSIa, cHINa aNd INdIa 2018: fOSterINg grOWtH tHrOUgH dIgItalISatION © Oecd 2018
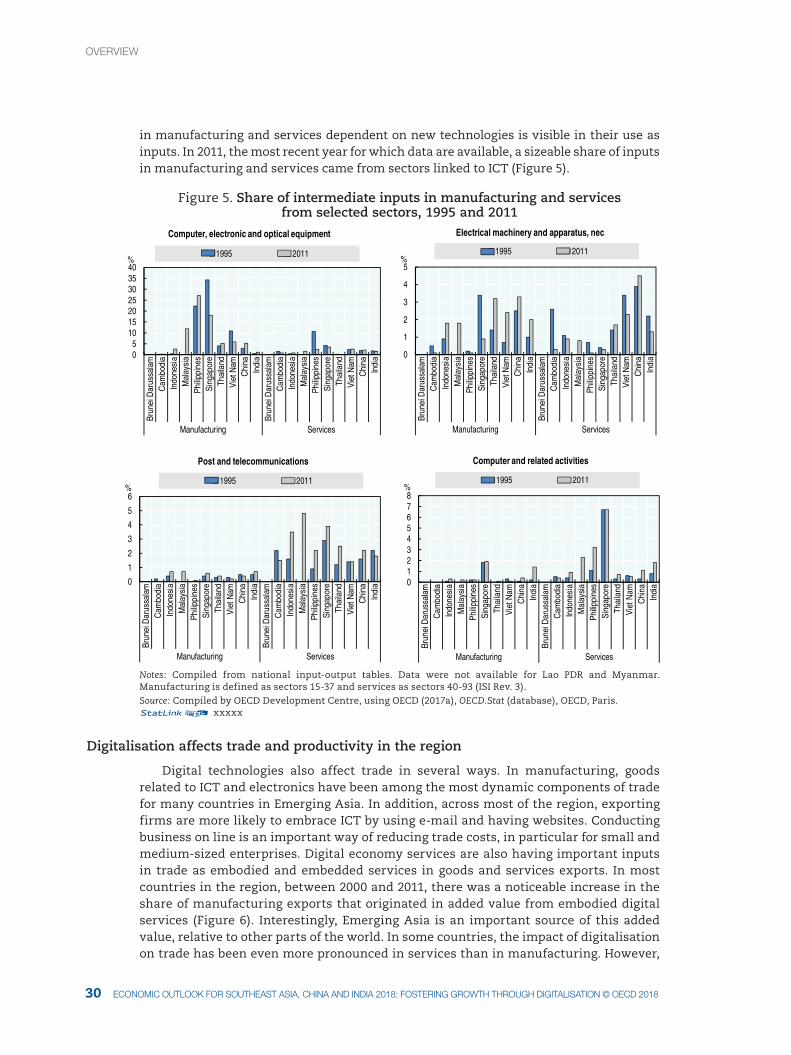
in manufacturing and services dependent on new technologies is visible in their use as inputs. In 2011, the most recent year for which data are available, a sizeable share of inputs in manufacturing and services came from sectors linked to ICT (Figure 5).
Figure 5. Share of intermediate inputs in manufacturing and services from selected sectors, 1995 and 2011
05
10152025303540
Brun
ei D
arus
sala
mC
ambo
dia
Indo
nesi
aM
alay
sia
Philip
pine
sSi
ngap
ore
Thai
land
Viet
Nam
Chi
naIn
dia
Brun
ei D
arus
sala
mC
ambo
dia
Indo
nesi
aM
alay
sia
Philip
pine
sSi
ngap
ore
Thai
land
Viet
Nam
Chi
naIn
dia
Manufacturing Services
%
Computer, electronic and optical equipment
1995 2011
0
1
2
3
4
5
Brun
ei D
arus
sala
mC
ambo
dia
Indo
nesi
aM
alay
sia
Philip
pine
sSi
ngap
ore
Thai
land
Viet
Nam
Chi
naIn
dia
Brun
ei D
arus
sala
mC
ambo
dia
Indo
nesi
aM
alay
sia
Philip
pine
sSi
ngap
ore
Thai
land
Viet
Nam
Chi
naIn
dia
Manufacturing Services
%
Electrical machinery and apparatus, nec
1995 2011
0
1
2
3
4
5
6
Brun
ei D
arus
sala
mC
ambo
dia
Indo
nesi
aM
alay
sia
Philip
pine
sSi
ngap
ore
Thai
land
Viet
Nam
Chi
naIn
dia
Brun
ei D
arus
sala
mC
ambo
dia
Indo
nesi
aM
alay
sia
Philip
pine
sSi
ngap
ore
Thai
land
Viet
Nam
Chi
naIn
dia
Manufacturing Services
%
Post and telecommunications
1995 2011
012345678
Brun
ei D
arus
sala
mC
ambo
dia
Indo
nesi
aM
alay
sia
Philip
pine
sSi
ngap
ore
Thai
land
Viet
Nam
Chi
naIn
dia
Brun
ei D
arus
sala
mC
ambo
dia
Indo
nesi
aM
alay
sia
Philip
pine
sSi
ngap
ore
Thai
land
Viet
Nam
Chi
naIn
dia
Manufacturing Services
%
Computer and related activities
1995 2011
Notes: Compiled from national input-output tables. Data were not available for Lao PDR and Myanmar. Manufacturing is defined as sectors 15-37 and services as sectors 40-93 (ISI Rev. 3).Source: Compiled by OECD Development Centre, using OECD (2017a), OECD.Stat (database), OECD, Paris.12 xxxxx
Digitalisation affects trade and productivity in the region
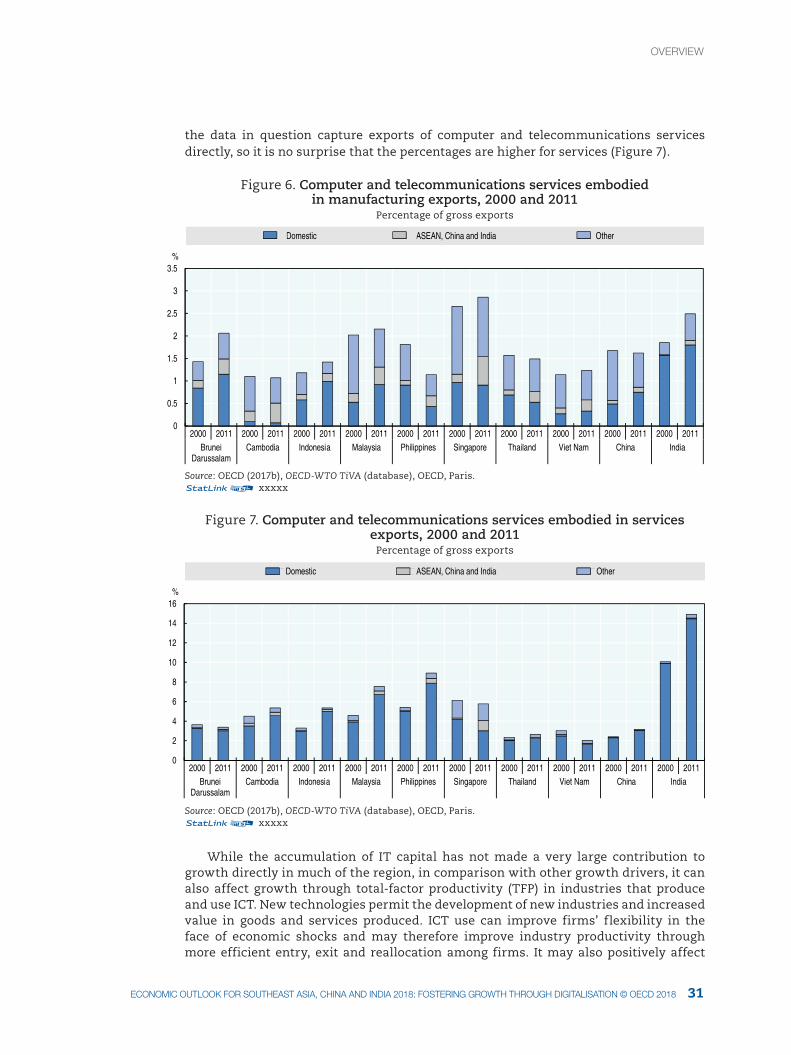
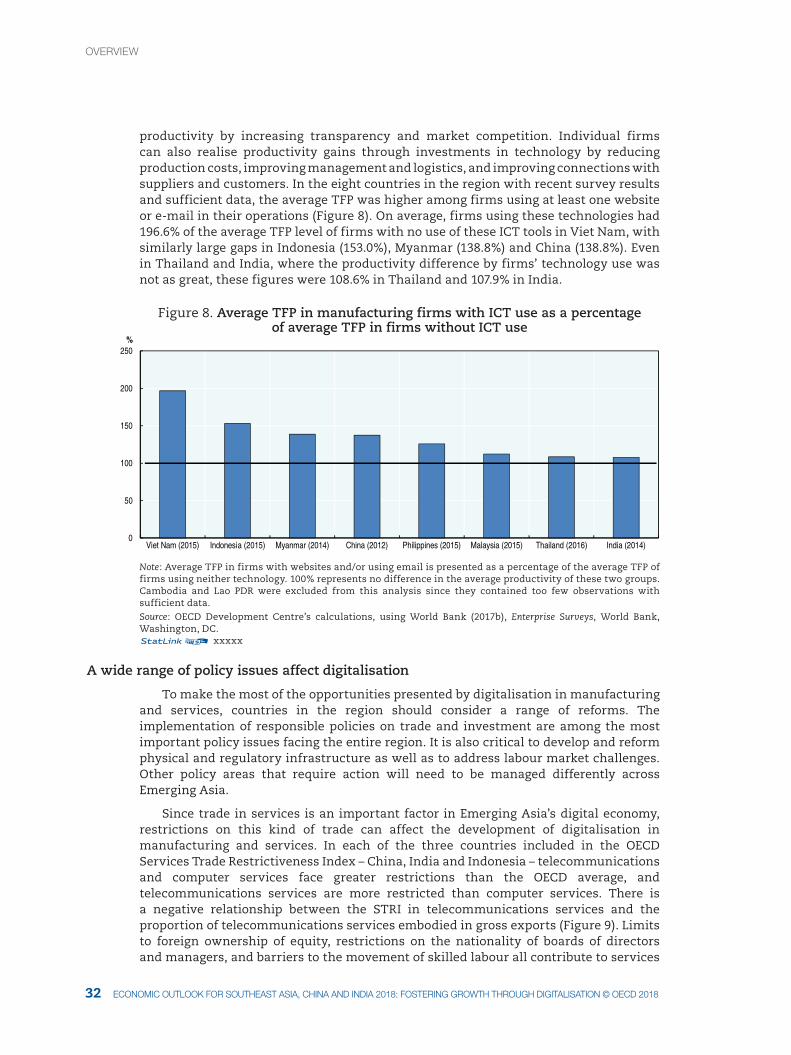
Digital technologies also affect trade in several ways. In manufacturing, goods related to ICT and electronics have been among the most dynamic components of trade for many countries in Emerging Asia. In addition, across most of the region, exporting firms are more likely to embrace ICT by using e-mail and having websites. Conducting business on line is an important way of reducing trade costs, in particular for small and medium-sized enterprises. Digital economy services are also having important inputs in trade as embodied and embedded services in goods and services exports. In most countries in the region, between 2000 and 2011, there was a noticeable increase in the share of manufacturing exports that originated in added value from embodied digital services (Figure 6). Interestingly, Emerging Asia is an important source of this added value, relative to other parts of the world. In some countries, the impact of digitalisation on trade has been even more pronounced in services than in manufacturing. However,
OvervIeW
1. OvervIeW1. OvervIeW
31ecONOMIc OUtlOOK fOr SOUtHeaSt aSIa, cHINa aNd INdIa 2018: fOSterINg grOWtH tHrOUgH dIgItalISatION © Oecd 2018
the data in question capture exports of computer and telecommunications services directly, so it is no surprise that the percentages are higher for services (Figure 7).
Figure 6. Computer and telecommunications services embodied in manufacturing exports, 2000 and 2011
Percentage of gross exports
0
0.5
1
1.5
2
2.5
3
3.5
2000 2011 2000 2011 2000 2011 2000 2011 2000 2011 2000 2011 2000 2011 2000 2011 2000 2011 2000 2011Brunei
DarussalamCambodia Indonesia Malaysia Philippines Singapore Thailand Viet Nam China India
%
Domestic ASEAN, China and India Other
Source: OECD (2017b), OECD-WTO TiVA (database), OECD, Paris.12 xxxxx
Figure 7. Computer and telecommunications services embodied in services exports, 2000 and 2011
Percentage of gross exports
0
2
4
6
8
10
12
14
16
2000 2011 2000 2011 2000 2011 2000 2011 2000 2011 2000 2011 2000 2011 2000 2011 2000 2011 2000 2011Brunei
DarussalamCambodia Indonesia Malaysia Philippines Singapore Thailand Viet Nam China India
%
Domestic ASEAN, China and India Other
Source: OECD (2017b), OECD-WTO TiVA (database), OECD, Paris.12 xxxxx
While the accumulation of IT capital has not made a very large contribution to growth directly in much of the region, in comparison with other growth drivers, it can also affect growth through total-factor productivity (TFP) in industries that produce and use ICT. New technologies permit the development of new industries and increased value in goods and services produced. ICT use can improve firms’ flexibility in the face of economic shocks and may therefore improve industry productivity through more efficient entry, exit and reallocation among firms. It may also positively affect
OvervIeW
1. OvervIeW
3332 ecONOMIc OUtlOOK fOr SOUtHeaSt aSIa, cHINa aNd INdIa 2018: fOSterINg grOWtH tHrOUgH dIgItalISatION © Oecd 2018 ecONOMIc OUtlOOK fOr SOUtHeaSt aSIa, cHINa aNd INdIa 2018: fOSterINg grOWtH tHrOUgH dIgItalISatION © Oecd 2018
productivity by increasing transparency and market competition. Individual firms can also realise productivity gains through investments in technology by reducing production costs, improving management and logistics, and improving connections with suppliers and customers. In the eight countries in the region with recent survey results and sufficient data, the average TFP was higher among firms using at least one website or e-mail in their operations (Figure 8). On average, firms using these technologies had 196.6% of the average TFP level of firms with no use of these ICT tools in Viet Nam, with similarly large gaps in Indonesia (153.0%), Myanmar (138.8%) and China (138.8%). Even in Thailand and India, where the productivity difference by firms’ technology use was not as great, these figures were 108.6% in Thailand and 107.9% in India.
Figure 8. Average TFP in manufacturing firms with ICT use as a percentage of average TFP in firms without ICT use
0
50
100
150
200
250
Viet Nam (2015) Indonesia (2015) Myanmar (2014) China (2012) Philippines (2015) Malaysia (2015) Thailand (2016) India (2014)
%
Note: Average TFP in firms with websites and/or using email is presented as a percentage of the average TFP of firms using neither technology. 100% represents no difference in the average productivity of these two groups. Cambodia and Lao PDR were excluded from this analysis since they contained too few observations with sufficient data.Source: OECD Development Centre’s calculations, using World Bank (2017b), Enterprise Surveys, World Bank, Washington, DC.12 xxxxx
A wide range of policy issues affect digitalisation
To make the most of the opportunities presented by digitalisation in manufacturing and services, countries in the region should consider a range of reforms. The implementation of responsible policies on trade and investment are among the most important policy issues facing the entire region. It is also critical to develop and reform physical and regulatory infrastructure as well as to address labour market challenges. Other policy areas that require action will need to be managed differently across Emerging Asia.
Since trade in services is an important factor in Emerging Asia’s digital economy, restrictions on this kind of trade can affect the development of digitalisation in manufacturing and services. In each of the three countries included in the OECD Services Trade Restrictiveness Index – China, India and Indonesia – telecommunications and computer services face greater restrictions than the OECD average, and telecommunications services are more restricted than computer services. There is a negative relationship between the STRI in telecommunications services and the proportion of telecommunications services embodied in gross exports (Figure 9). Limits to foreign ownership of equity, restrictions on the nationality of boards of directors and managers, and barriers to the movement of skilled labour all contribute to services
OvervIeW
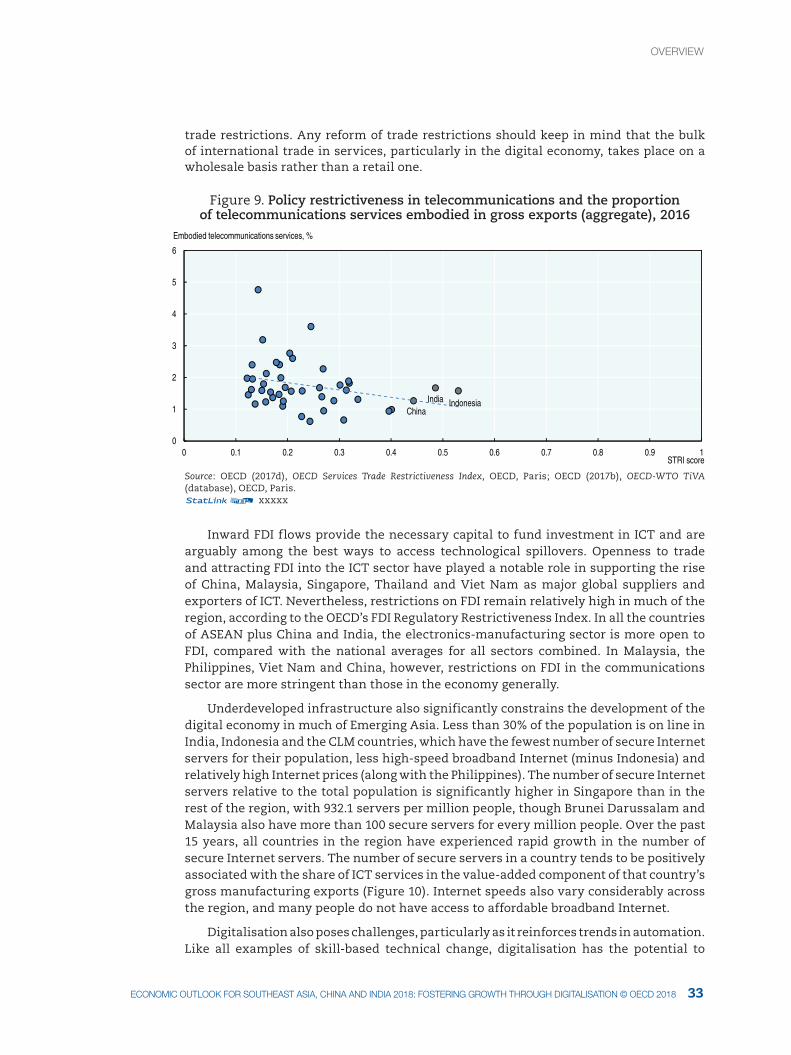
1. OvervIeW1. OvervIeW
33ecONOMIc OUtlOOK fOr SOUtHeaSt aSIa, cHINa aNd INdIa 2018: fOSterINg grOWtH tHrOUgH dIgItalISatION © Oecd 2018
trade restrictions. Any reform of trade restrictions should keep in mind that the bulk of international trade in services, particularly in the digital economy, takes place on a wholesale basis rather than a retail one.
Figure 9. Policy restrictiveness in telecommunications and the proportion of telecommunications services embodied in gross exports (aggregate), 2016
0
1
2
3
4
5
6
0 0.1 0.2 0.3 0.4 0.5 0.6 0.7 0.8 0.9 1STRI score
Embodied telecommunications services, %
ChinaIndia Indonesia
Source: OECD (2017d), OECD Services Trade Restrictiveness Index, OECD, Paris; OECD (2017b), OECD-WTO TiVA (database), OECD, Paris.12 xxxxx
Inward FDI flows provide the necessary capital to fund investment in ICT and are arguably among the best ways to access technological spillovers. Openness to trade and attracting FDI into the ICT sector have played a notable role in supporting the rise of China, Malaysia, Singapore, Thailand and Viet Nam as major global suppliers and exporters of ICT. Nevertheless, restrictions on FDI remain relatively high in much of the region, according to the OECD’s FDI Regulatory Restrictiveness Index. In all the countries of ASEAN plus China and India, the electronics-manufacturing sector is more open to FDI, compared with the national averages for all sectors combined. In Malaysia, the Philippines, Viet Nam and China, however, restrictions on FDI in the communications sector are more stringent than those in the economy generally.
Underdeveloped infrastructure also significantly constrains the development of the digital economy in much of Emerging Asia. Less than 30% of the population is on line in India, Indonesia and the CLM countries, which have the fewest number of secure Internet servers for their population, less high-speed broadband Internet (minus Indonesia) and relatively high Internet prices (along with the Philippines). The number of secure Internet servers relative to the total population is significantly higher in Singapore than in the rest of the region, with 932.1 servers per million people, though Brunei Darussalam and Malaysia also have more than 100 secure servers for every million people. Over the past 15 years, all countries in the region have experienced rapid growth in the number of secure Internet servers. The number of secure servers in a country tends to be positively associated with the share of ICT services in the value-added component of that country’s gross manufacturing exports (Figure 10). Internet speeds also vary considerably across the region, and many people do not have access to affordable broadband Internet.
Digitalisation also poses challenges, particularly as it reinforces trends in automation. Like all examples of skill-based technical change, digitalisation has the potential to
OvervIeW
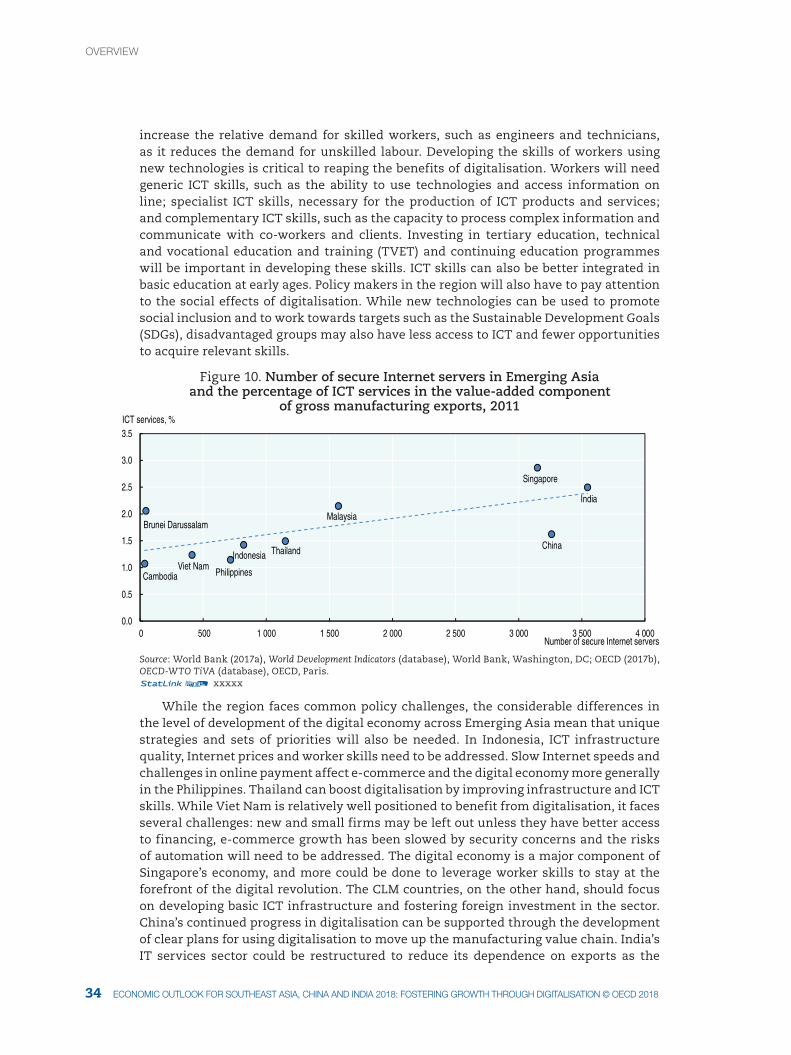
1. OvervIeW
3534 ecONOMIc OUtlOOK fOr SOUtHeaSt aSIa, cHINa aNd INdIa 2018: fOSterINg grOWtH tHrOUgH dIgItalISatION © Oecd 2018 ecONOMIc OUtlOOK fOr SOUtHeaSt aSIa, cHINa aNd INdIa 2018: fOSterINg grOWtH tHrOUgH dIgItalISatION © Oecd 2018
increase the relative demand for skilled workers, such as engineers and technicians, as it reduces the demand for unskilled labour. Developing the skills of workers using new technologies is critical to reaping the benefits of digitalisation. Workers will need generic ICT skills, such as the ability to use technologies and access information on line; specialist ICT skills, necessary for the production of ICT products and services; and complementary ICT skills, such as the capacity to process complex information and communicate with co-workers and clients. Investing in tertiary education, technical and vocational education and training (TVET) and continuing education programmes will be important in developing these skills. ICT skills can also be better integrated in basic education at early ages. Policy makers in the region will also have to pay attention to the social effects of digitalisation. While new technologies can be used to promote social inclusion and to work towards targets such as the Sustainable Development Goals (SDGs), disadvantaged groups may also have less access to ICT and fewer opportunities to acquire relevant skills.
Figure 10. Number of secure Internet servers in Emerging Asia and the percentage of ICT services in the value-added component
of gross manufacturing exports, 2011
0.0
0.5
1.0
1.5
2.0
2.5
3.0
3.5
0 500 1 000 1 500 2 000 2 500 3 000 3 500 4 000
ICT services, %
Number of secure Internet servers
Brunei Darussalam
CambodiaViet Nam
Philippines
Indonesia Thailand
Malaysia
Singapore
India
China
Source: World Bank (2017a), World Development Indicators (database), World Bank, Washington, DC; OECD (2017b), OECD-WTO TiVA (database), OECD, Paris.12 xxxxx
While the region faces common policy challenges, the considerable differences in the level of development of the digital economy across Emerging Asia mean that unique strategies and sets of priorities will also be needed. In Indonesia, ICT infrastructure quality, Internet prices and worker skills need to be addressed. Slow Internet speeds and challenges in online payment affect e-commerce and the digital economy more generally in the Philippines. Thailand can boost digitalisation by improving infrastructure and ICT skills. While Viet Nam is relatively well positioned to benefit from digitalisation, it faces several challenges: new and small firms may be left out unless they have better access to financing, e-commerce growth has been slowed by security concerns and the risks of automation will need to be addressed. The digital economy is a major component of Singapore’s economy, and more could be done to leverage worker skills to stay at the forefront of the digital revolution. The CLM countries, on the other hand, should focus on developing basic ICT infrastructure and fostering foreign investment in the sector. China’s continued progress in digitalisation can be supported through the development of clear plans for using digitalisation to move up the manufacturing value chain. India’s IT services sector could be restructured to reduce its dependence on exports as the
OvervIeW
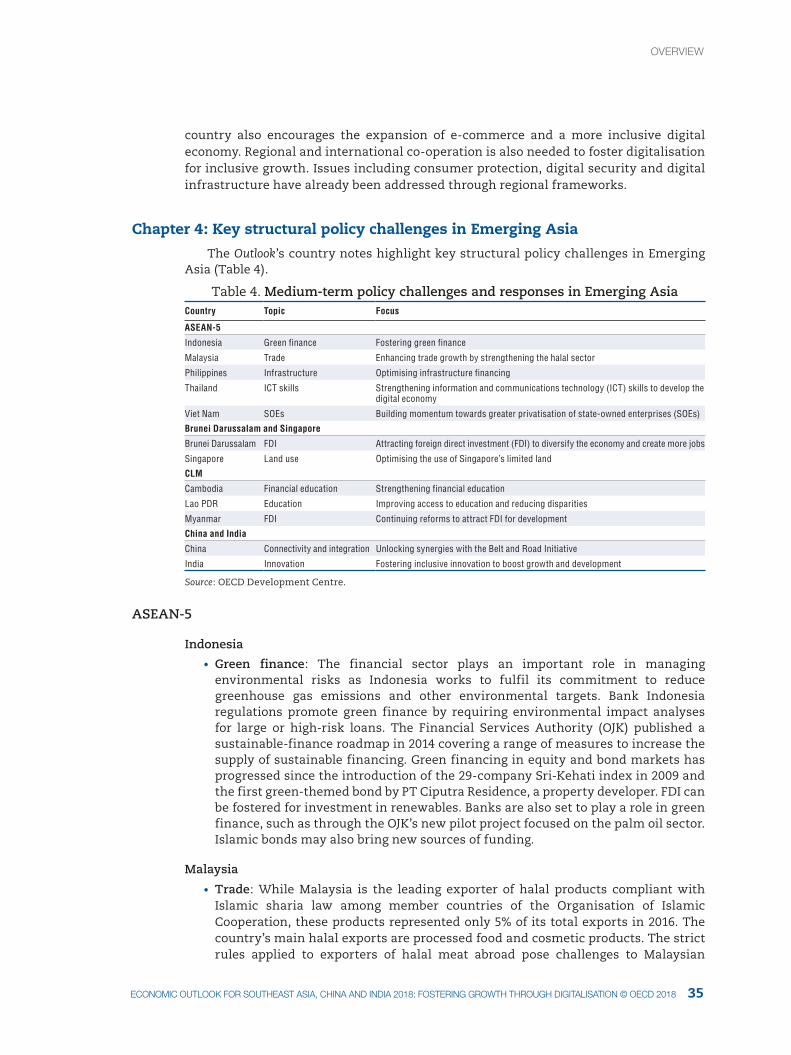
1. OvervIeW1. OvervIeW
35ecONOMIc OUtlOOK fOr SOUtHeaSt aSIa, cHINa aNd INdIa 2018: fOSterINg grOWtH tHrOUgH dIgItalISatION © Oecd 2018
country also encourages the expansion of e-commerce and a more inclusive digital economy. Regional and international co-operation is also needed to foster digitalisation for inclusive growth. Issues including consumer protection, digital security and digital infrastructure have already been addressed through regional frameworks.
Chapter 4: Key structural policy challenges in Emerging Asia
The Outlook’s country notes highlight key structural policy challenges in Emerging Asia (Table 4).
Table 4. Medium-term policy challenges and responses in Emerging AsiaCountry Topic Focus
ASEAN-5
Indonesia Green finance Fostering green finance
Malaysia Trade Enhancing trade growth by strengthening the halal sector
Philippines Infrastructure Optimising infrastructure financing
Thailand ICT skills Strengthening information and communications technology (ICT) skills to develop the digital economy
Viet Nam SOEs Building momentum towards greater privatisation of state-owned enterprises (SOEs)
Brunei Darussalam and Singapore
Brunei Darussalam FDI Attracting foreign direct investment (FDI) to diversify the economy and create more jobs
Singapore Land use Optimising the use of Singapore’s limited land
CLM
Cambodia Financial education Strengthening financial education
Lao PDR Education Improving access to education and reducing disparities
Myanmar FDI Continuing reforms to attract FDI for development
China and India
China Connectivity and integration Unlocking synergies with the Belt and Road Initiative
India Innovation Fostering inclusive innovation to boost growth and development
Source: OECD Development Centre.
ASEAN-5
Indonesia
• Green finance: The financial sector plays an important role in managing environmental risks as Indonesia works to fulfil its commitment to reduce greenhouse gas emissions and other environmental targets. Bank Indonesia regulations promote green finance by requiring environmental impact analyses for large or high-risk loans. The Financial Services Authority (OJK) published a sustainable-finance roadmap in 2014 covering a range of measures to increase the supply of sustainable financing. Green financing in equity and bond markets has progressed since the introduction of the 29-company Sri-Kehati index in 2009 and the first green-themed bond by PT Ciputra Residence, a property developer. FDI can be fostered for investment in renewables. Banks are also set to play a role in green finance, such as through the OJK’s new pilot project focused on the palm oil sector. Islamic bonds may also bring new sources of funding.
Malaysia
• Trade: While Malaysia is the leading exporter of halal products compliant with Islamic sharia law among member countries of the Organisation of Islamic Cooperation, these products represented only 5% of its total exports in 2016. The country’s main halal exports are processed food and cosmetic products. The strict rules applied to exporters of halal meat abroad pose challenges to Malaysian
OvervIeW
1. OvervIeW
3736 ecONOMIc OUtlOOK fOr SOUtHeaSt aSIa, cHINa aNd INdIa 2018: fOSterINg grOWtH tHrOUgH dIgItalISatION © Oecd 2018 ecONOMIc OUtlOOK fOr SOUtHeaSt aSIa, cHINa aNd INdIa 2018: fOSterINg grOWtH tHrOUgH dIgItalISatION © Oecd 2018
producers, and Malaysia itself depends to a large extent on exporters such as Australia and New Zealand to supply halal meat. Co-ordinated efforts are being made under the Halal Industry Master Plan to achieve Malaysia’s goal of becoming a halal hub by 2025. Enhanced international co-operation through the Department of Islamic Development Malaysia would encourage both knowledge transfer and the delegation of responsibility to representatives abroad.
Philippines
• Infrastructure: As highlighted in the Philippine Development Plan 2017-2022, there is a need to address the country’s underdeveloped infrastructure. While improvements have been made in recent years, additional capital and efficient investments will be needed to keep up with demand for infrastructure development in the fast-growing economy. The government is looking to attract investors for public-private partnerships (PPPs), but faces challenges such as the absence of a deep long-term fund pool, which means that private project developers bear higher costs of credit. The PPP Center could be strengthened in terms of its mandate and resources. While the bond market could provide an alternative source of financing, these markets need further development; the ratio of the total outstanding value of local-currency bonds to GDP remains relatively small.
Thailand
• ICT skills: The Digital Thailand plan aims to develop the use of digital technologies in all socio-economic activities over a 20-year timeframe. Recent initiatives in support of this goal include the five-year Digital Government Development Plan and an operational plan for promoting the digital economy. High-capacity broadband Internet and data centres are among the infrastructure facilities needed, and the government plans to establish a digital park in the Chon Buri province by 2018 as part of the Eastern Economic Corridor. While Internet use has improved, many people lack access or the skills needed to use new technologies. According to a survey from the National Statistical Office of Thailand, a lack of knowledge is the principal reason people have for not using the Internet. Training on basic skills should take into consideration that needs vary with different demographics’ use of the Internet. More advanced ICT skills will be needed to develop the labour market, which can be developed through exposure at younger ages and encouraging specialisation in these subjects in tertiary education.
Viet Nam
• SOEs: While state-owned enterprises are numerous and account for about a third of Viet Nam’s GDP, they are becoming less efficient. Opening up this sector therefore offers an opportunity to raise productivity and boost FDI. A 2012 decision required government-linked companies to prepare detailed restructuring plans concentrating on their core business lines and the provision of essential public goods and services. The government is also restructuring large SOEs through divestment. Progress on privatisation and divestment has slowed, however. Additional goals for SOEs should include enhanced transparency. In addition to reforming SOEs, it should be ensured that privatisation leads to deep managerial and administrative restructuring, such as through the election of a board of directors drawn from the private sector. The government can also clarify a list of non-commercial obligations performed by SOEs and establish an arm’s-length relationship with them to limit interference.
OvervIeW
1. OvervIeW1. OvervIeW
37ecONOMIc OUtlOOK fOr SOUtHeaSt aSIa, cHINa aNd INdIa 2018: fOSterINg grOWtH tHrOUgH dIgItalISatION © Oecd 2018
Brunei Darussalam and Singapore
Brunei Darussalam
• FDI: Attracting increased FDI inflows is a key element of Brunei Darussalam’s long-term vision to 2035 and would help to boost economic growth and job creation. To support diversification, steps have been taken to encourage FDI in sectors outside of oil and gas, which have long dominated the economy. While inflows have declined in recent years, the sectoral diversity of these flows is improving. A greater share of employment is also found in the services sector. Several key sectors – including technology, halal products, and downstream oil and gas – have been identified as priority clusters for investment. More generally, boosting FDI in Brunei Darussalam requires the government to improve the business climate for foreign investors through reforms in policy areas, including entrepreneurship promotion and competition policy. At the same time, greater efforts are needed in promoting privatisation and PPPs.
Singapore
• Land use: Singapore’s population is expected to increase considerably in the coming decades. This population growth can be handled with the country’s limited supply of land by reclaiming land from the sea, developing reserve areas, intensifying new development and redeveloping land with low-intensity uses, such as old industrial areas and golf courses, to achieve higher productivity. The government’s current master plan has shown flexibility in accommodating economic change in Singapore, such as the growth of services provided by manufacturers and the growth of new services industries. The plan allows Business 1 category companies (encompassing sectors ranging from computer software to distribution services) to use land more flexibly by easing some land-use zoning rules. Firms in this category are also allowed to take part in the pilot development of the Woodlands regional centre.
CLM
Cambodia
• Financial education: The expansion of financial markets in Cambodia is making financial education in the country more important. According to the results of a 2014 survey, only 18% of adults are considered financially literate in Cambodia, placing the country 135th out of 144 surveyed nations, and the lowest among all Southeast Asian countries included in the survey. Improved financial literacy could help to support the inclusive development of the financial sector. Education initiatives have been conducted sporadically, relying heavily upon contributions from the private sector and non-governmental organisations (NGOs). The issue would be better addressed with the support of the highest levels of government, the integration of lessons in classrooms and the establishment of a comprehensive national strategy for financial education.
Lao PDR
• Education: Lao PDR’s Eighth National Socio-Economic Development Plan, covering 2016-20, targets an increase in the education budget, the development of education infrastructure and improved learning at all levels. While progress has been made in improving access to secondary education, enrolment is lower than in much of
OvervIeW
1. OvervIeW
3938 ecONOMIc OUtlOOK fOr SOUtHeaSt aSIa, cHINa aNd INdIa 2018: fOSterINg grOWtH tHrOUgH dIgItalISatION © Oecd 2018 ecONOMIc OUtlOOK fOr SOUtHeaSt aSIa, cHINa aNd INdIa 2018: fOSterINg grOWtH tHrOUgH dIgItalISatION © Oecd 2018
the rest of the region, and there is a lack of trained teachers. The effectiveness of tertiary education, meanwhile, is limited by the poor alignment between what is taught in the universities and what is required in the labour market. Achieving the goal of universal access to education requires an effort to address disparities in access by income level, gender, ethnicity and location. Policy options for improving the inclusiveness of education include investments in basic education infrastructure, the provision of scholarships to poor students and non-financial assistance for those facing difficulty in reaching schools.
Myanmar
• FDI: Inflows of foreign capital, and the technology and knowledge flows that accompany them, will be crucial for the growth of Myanmar’s economy. While openness has increased and liberalising reforms have been implemented, constraints to FDI remain. FDI inflows have not rebounded significantly since many international sanctions were lifted in 2012 and 2013, although flows are diversifying in terms of their sector composition and country of origin. The energy sector is receiving relatively less investment, and China’s share has declined from 93.6% in 2011-12 to 35.1% in 2015-16. The new investment law outlines new processes for approving investments through the Myanmar Investment Commission, simplifying the review process. Regulatory constraints on FDI, an underdeveloped financial system and structural challenges such as poor infrastructure all discourage additional growth in investment. Special economic zones (SEZs) being developed under the 2014 Special Economic Zone Law are set to play a significant role in attracting investment into industry and services in Myanmar.
China and India
China
• Connectivity and integration: The Belt and Road Initiative is a large-scale project of economic integration, now including 65 countries representing two-thirds of the world’s population and one-third of its GDP. Promoting trade and investment in Asia and Europe, it aims to enhance connectivity as well as co-ordination and harmonisation in many other areas. The initiative aligns well with the focus areas of China’s current five-year plan, particularly openness, by encouraging trade integration and FDI flows; sharing in development, through enhanced infrastructure; co-ordination and reduced regulatory uncertainty; green development and co-operation on shared environmental challenges; and innovation, with countries working closer together. The initiative will also facilitate shared development and market integration within China, contributing to the process of productivity convergence already seen among provinces. A 2015 document designated 18 Chinese provinces and province-level municipalities – most of which are among those with lower service-sector productivity – as major participants in the Belt and Road Initiative.
India
• Innovation: Increasing innovative activities in India would contribute significantly to continued growth, and can also be directed to help address inequalities in growth and development. Spending on research and development (R&D) in India relative to GDP is lower than in most of the wealthier Emerging Asian countries. Innovation capacities have improved in the recent past, however. The number of researchers in R&D has increased faster than the population and patent applications have grown with legislative reform and participation in international agreements. The potential for innovation in meeting development needs has been recognised. Small
OvervIeW

1. OvervIeW1. OvervIeW
39ecONOMIc OUtlOOK fOr SOUtHeaSt aSIa, cHINa aNd INdIa 2018: fOSterINg grOWtH tHrOUgH dIgItalISatION © Oecd 2018
and medium-sized enterprises (SMEs) have a role to play in promoting inclusive participation, but tend to be less likely to implement innovations developed autonomously or by others. Worker and management skills, regulatory barriers and financing constraints are among the greatest challenges to overcome in encouraging innovation and technology use among SMEs.
OvervIeW

41ecONOMIc OUtlOOK fOr SOUtHeaSt aSIa, cHINa aNd INdIa 2018: fOSterINg grOWtH tHrOUgH dIgItalISatION © Oecd 2018
41ecONOMIc OUtlOOK fOr SOUtHeaSt aSIa, cHINa aNd INdIa 2018: fOSterINg grOWtH tHrOUgH dIgItalISatION © Oecd 2018
Chapter 1
Macroeconomic assessments and economic outlook for Emerging Asia
Overall, growth in Emerging Asian economies is projected to remain
robust through 2022. Growth in 2017 in ASEAN and China will pick
up on a strong trade rebound and resilient domestic consumption,
while growth in India has edged downwards owing to taxation
and monetary reforms. In the medium term, the region’s growth
will be anchored by domestic consumption and the infrastructure
initiatives currently planned by a number of governments. Among
the ASEAN’s ten member countries, Myanmar, Cambodia and
Lao PDR are projected to grow fastest, while the Philippines and
Viet Nam are expected to lead the growth of the ASEAN-5. Even
though macroeconomic fundamentals have been largely stable,
policy makers in the region should pay close attention to the risks
of a faster than expected monetary policy contraction in advanced
economies, the rapid rise in private-sector debt, and the broadening
of trade restrictions globally and limited progress in regional trade
agreements.
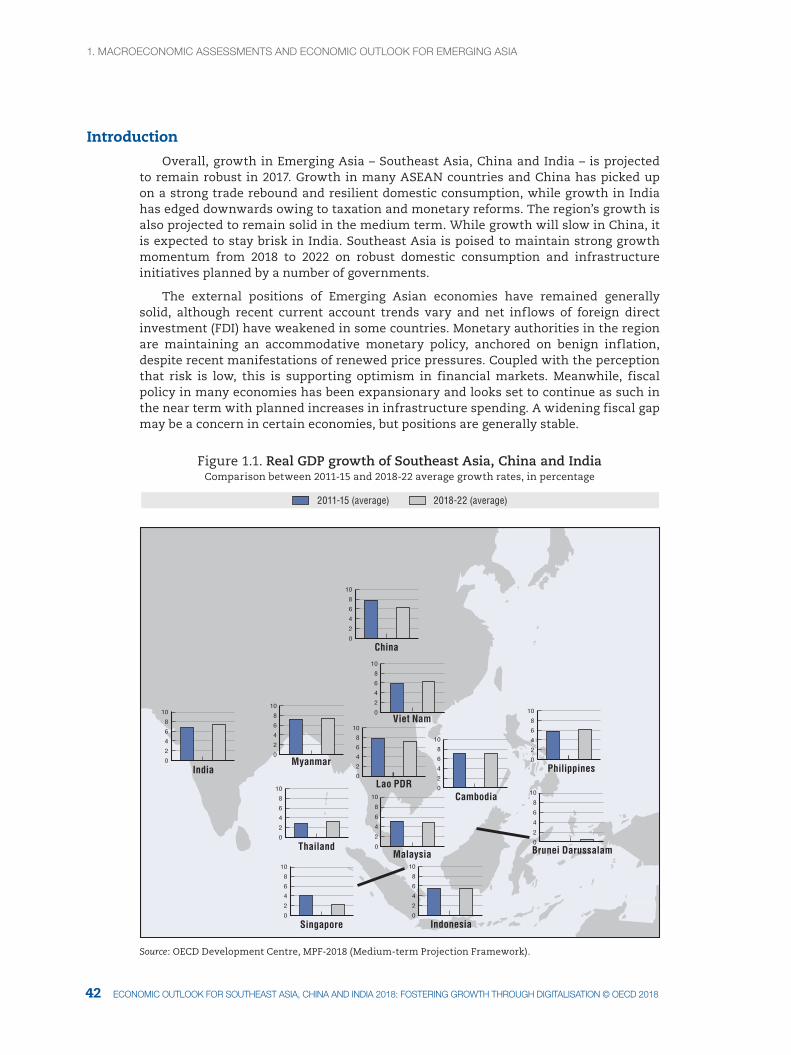
1. MacrOecONOMIc aSSeSSMeNtS aNd ecONOMIc OUtlOOK fOr eMergINg aSIa
4342 ecONOMIc OUtlOOK fOr SOUtHeaSt aSIa, cHINa aNd INdIa 2018: fOSterINg grOWtH tHrOUgH dIgItalISatION © Oecd 2018 ecONOMIc OUtlOOK fOr SOUtHeaSt aSIa, cHINa aNd INdIa 2018: fOSterINg grOWtH tHrOUgH dIgItalISatION © Oecd 2018
Introduction
Overall, growth in Emerging Asia – Southeast Asia, China and India – is projected to remain robust in 2017. Growth in many ASEAN countries and China has picked up on a strong trade rebound and resilient domestic consumption, while growth in India has edged downwards owing to taxation and monetary reforms. The region’s growth is also projected to remain solid in the medium term. While growth will slow in China, it is expected to stay brisk in India. Southeast Asia is poised to maintain strong growth momentum from 2018 to 2022 on robust domestic consumption and infrastructure initiatives planned by a number of governments.
The external positions of Emerging Asian economies have remained generally solid, although recent current account trends vary and net inflows of foreign direct investment (FDI) have weakened in some countries. Monetary authorities in the region are maintaining an accommodative monetary policy, anchored on benign inflation, despite recent manifestations of renewed price pressures. Coupled with the perception that risk is low, this is supporting optimism in financial markets. Meanwhile, fiscal policy in many economies has been expansionary and looks set to continue as such in the near term with planned increases in infrastructure spending. A widening fiscal gap may be a concern in certain economies, but positions are generally stable.
Figure 1.1. Real GDP growth of Southeast Asia, China and IndiaComparison between 2011-15 and 2018-22 average growth rates, in percentage
Cambodia
Indonesia
Lao PDR
Viet Nam
Malaysia
MyanmarPhilippines
China
Thailand
India
Singapore
2018
2011-15 (average) 2018-22 (average)
0
2
4
6
8
10
0
2
4
6
8
10
0
2
4
6
8
10
0
2
4
6
8
10
0
2
4
6
8
10
0
2
4
6
8
10
0
2
4
6
8
10
0
2
4
6
8
10
0
2
4
6
8
10
Brunei Darussalam 0
2
4
6
8
10
0
2
4
6
8
10
0
2
4
6
8
10
Source: OECD Development Centre, MPF-2018 (Medium-term Projection Framework).
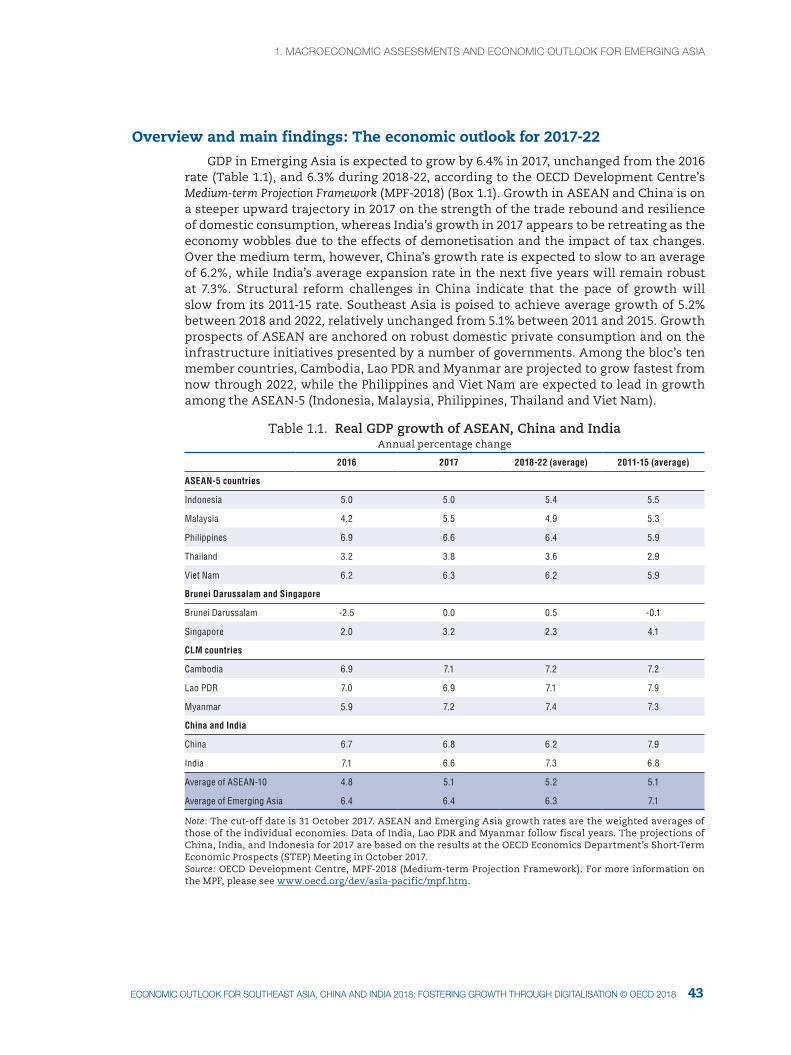
1. MacrOecONOMIc aSSeSSMeNtS aNd ecONOMIc OUtlOOK fOr eMergINg aSIa1. MacrOecONOMIc aSSeSSMeNtS aNd ecONOMIc OUtlOOK fOr eMergINg aSIa
43ecONOMIc OUtlOOK fOr SOUtHeaSt aSIa, cHINa aNd INdIa 2018: fOSterINg grOWtH tHrOUgH dIgItalISatION © Oecd 2018
Overview and main findings: The economic outlook for 2017-22
GDP in Emerging Asia is expected to grow by 6.4% in 2017, unchanged from the 2016 rate (Table 1.1), and 6.3% during 2018-22, according to the OECD Development Centre’s Medium-term Projection Framework (MPF-2018) (Box 1.1). Growth in ASEAN and China is on a steeper upward trajectory in 2017 on the strength of the trade rebound and resilience of domestic consumption, whereas India’s growth in 2017 appears to be retreating as the economy wobbles due to the effects of demonetisation and the impact of tax changes. Over the medium term, however, China’s growth rate is expected to slow to an average of 6.2%, while India’s average expansion rate in the next five years will remain robust at 7.3%. Structural reform challenges in China indicate that the pace of growth will slow from its 2011-15 rate. Southeast Asia is poised to achieve average growth of 5.2% between 2018 and 2022, relatively unchanged from 5.1% between 2011 and 2015. Growth prospects of ASEAN are anchored on robust domestic private consumption and on the infrastructure initiatives presented by a number of governments. Among the bloc’s ten member countries, Cambodia, Lao PDR and Myanmar are projected to grow fastest from now through 2022, while the Philippines and Viet Nam are expected to lead in growth among the ASEAN-5 (Indonesia, Malaysia, Philippines, Thailand and Viet Nam).
Table 1.1. Real GDP growth of ASEAN, China and IndiaAnnual percentage change
2016 2017 2018-22 (average) 2011-15 (average)
ASEAN-5 countries
Indonesia 5.0 5.0 5.4 5.5
Malaysia 4.2 5.5 4.9 5.3
Philippines 6.9 6.6 6.4 5.9
Thailand 3.2 3.8 3.6 2.9
Viet Nam 6.2 6.3 6.2 5.9
Brunei Darussalam and Singapore
Brunei Darussalam -2.5 0.0 0.5 -0.1
Singapore 2.0 3.2 2.3 4.1
CLM countries
Cambodia 6.9 7.1 7.2 7.2
Lao PDR 7.0 6.9 7.1 7.9
Myanmar 5.9 7.2 7.4 7.3
China and India
China 6.7 6.8 6.2 7.9
India 7.1 6.6 7.3 6.8
Average of ASEAN-10 4.8 5.1 5.2 5.1
Average of Emerging Asia 6.4 6.4 6.3 7.1
Note: The cut-off date is 31 October 2017. ASEAN and Emerging Asia growth rates are the weighted averages of those of the individual economies. Data of India, Lao PDR and Myanmar follow fiscal years. The projections of China, India, and Indonesia for 2017 are based on the results at the OECD Economics Department’s Short-Term Economic Prospects (STEP) Meeting in October 2017. Source: OECD Development Centre, MPF-2018 (Medium-term Projection Framework). For more information on the MPF, please see www.oecd.org/dev/asia-pacific/mpf.htm.
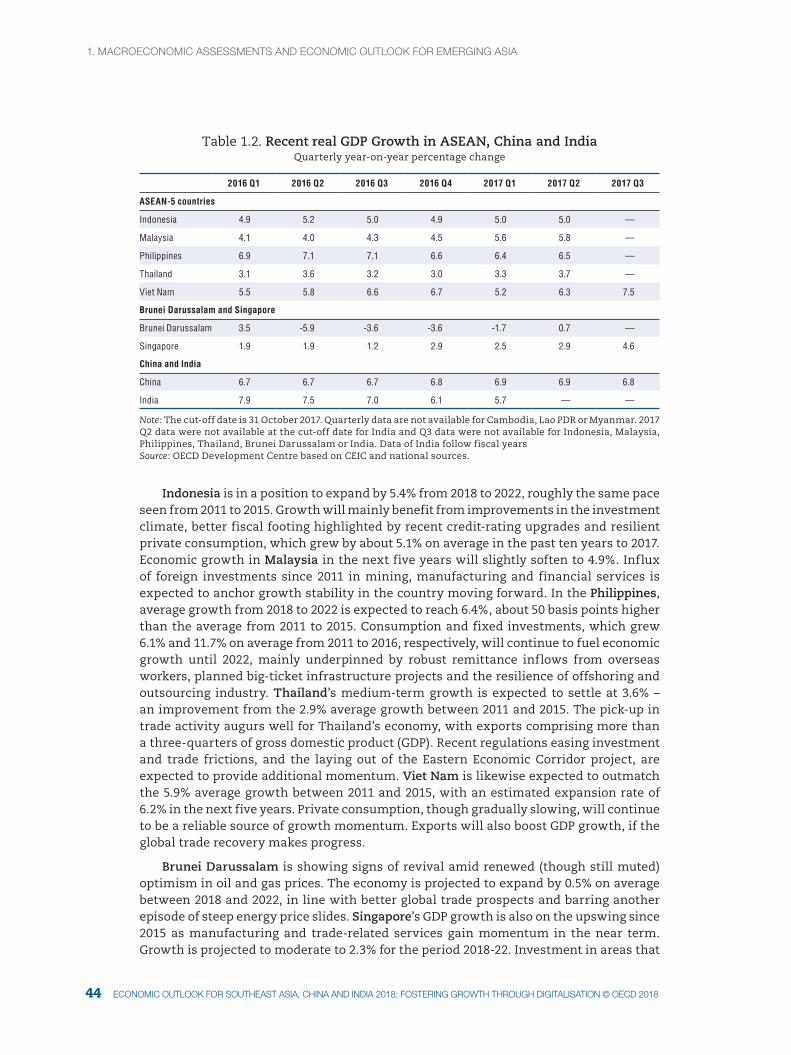
1. MacrOecONOMIc aSSeSSMeNtS aNd ecONOMIc OUtlOOK fOr eMergINg aSIa
4544 ecONOMIc OUtlOOK fOr SOUtHeaSt aSIa, cHINa aNd INdIa 2018: fOSterINg grOWtH tHrOUgH dIgItalISatION © Oecd 2018 ecONOMIc OUtlOOK fOr SOUtHeaSt aSIa, cHINa aNd INdIa 2018: fOSterINg grOWtH tHrOUgH dIgItalISatION © Oecd 2018
Table 1.2. Recent real GDP Growth in ASEAN, China and IndiaQuarterly year-on-year percentage change
2016 Q1 2016 Q2 2016 Q3 2016 Q4 2017 Q1 2017 Q2 2017 Q3
ASEAN-5 countries
Indonesia 4.9 5.2 5.0 4.9 5.0 5.0 —
Malaysia 4.1 4.0 4.3 4.5 5.6 5.8 —
Philippines 6.9 7.1 7.1 6.6 6.4 6.5 —
Thailand 3.1 3.6 3.2 3.0 3.3 3.7 —
Viet Nam 5.5 5.8 6.6 6.7 5.2 6.3 7.5
Brunei Darussalam and Singapore
Brunei Darussalam 3.5 -5.9 -3.6 -3.6 -1.7 0.7 —
Singapore 1.9 1.9 1.2 2.9 2.5 2.9 4.6
China and India
China 6.7 6.7 6.7 6.8 6.9 6.9 6.8
India 7.9 7.5 7.0 6.1 5.7 — —
Note: The cut-off date is 31 October 2017. Quarterly data are not available for Cambodia, Lao PDR or Myanmar. 2017 Q2 data were not available at the cut-off date for India and Q3 data were not available for Indonesia, Malaysia, Philippines, Thailand, Brunei Darussalam or India. Data of India follow fiscal yearsSource: OECD Development Centre based on CEIC and national sources.
Indonesia is in a position to expand by 5.4% from 2018 to 2022, roughly the same pace seen from 2011 to 2015. Growth will mainly benefit from improvements in the investment climate, better fiscal footing highlighted by recent credit-rating upgrades and resilient private consumption, which grew by about 5.1% on average in the past ten years to 2017. Economic growth in Malaysia in the next five years will slightly soften to 4.9%. Influx of foreign investments since 2011 in mining, manufacturing and financial services is expected to anchor growth stability in the country moving forward. In the Philippines, average growth from 2018 to 2022 is expected to reach 6.4%, about 50 basis points higher than the average from 2011 to 2015. Consumption and fixed investments, which grew 6.1% and 11.7% on average from 2011 to 2016, respectively, will continue to fuel economic growth until 2022, mainly underpinned by robust remittance inflows from overseas workers, planned big-ticket infrastructure projects and the resilience of offshoring and outsourcing industry. Thailand’s medium-term growth is expected to settle at 3.6% – an improvement from the 2.9% average growth between 2011 and 2015. The pick-up in trade activity augurs well for Thailand’s economy, with exports comprising more than a three-quarters of gross domestic product (GDP). Recent regulations easing investment and trade frictions, and the laying out of the Eastern Economic Corridor project, are expected to provide additional momentum. Viet Nam is likewise expected to outmatch the 5.9% average growth between 2011 and 2015, with an estimated expansion rate of 6.2% in the next five years. Private consumption, though gradually slowing, will continue to be a reliable source of growth momentum. Exports will also boost GDP growth, if the global trade recovery makes progress.
Brunei Darussalam is showing signs of revival amid renewed (though still muted) optimism in oil and gas prices. The economy is projected to expand by 0.5% on average between 2018 and 2022, in line with better global trade prospects and barring another episode of steep energy price slides. Singapore’s GDP growth is also on the upswing since 2015 as manufacturing and trade-related services gain momentum in the near term. Growth is projected to moderate to 2.3% for the period 2018-22. Investment in areas that
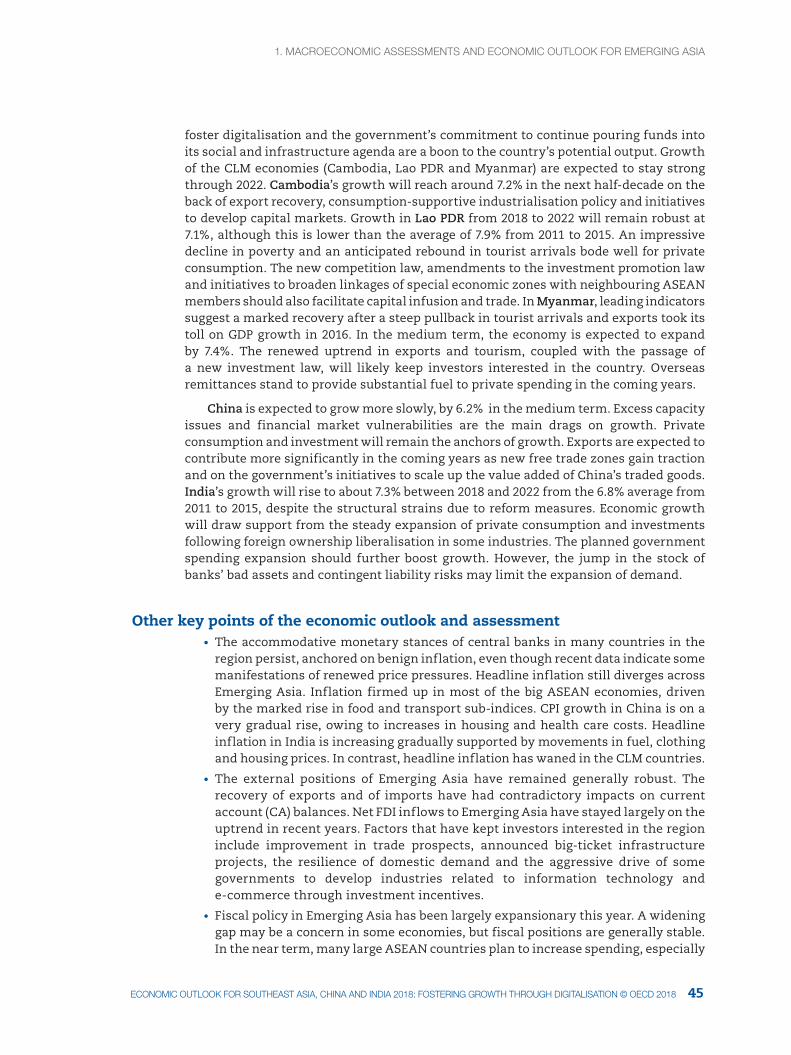
1. MacrOecONOMIc aSSeSSMeNtS aNd ecONOMIc OUtlOOK fOr eMergINg aSIa1. MacrOecONOMIc aSSeSSMeNtS aNd ecONOMIc OUtlOOK fOr eMergINg aSIa
45ecONOMIc OUtlOOK fOr SOUtHeaSt aSIa, cHINa aNd INdIa 2018: fOSterINg grOWtH tHrOUgH dIgItalISatION © Oecd 2018
foster digitalisation and the government’s commitment to continue pouring funds into its social and infrastructure agenda are a boon to the country’s potential output. Growth of the CLM economies (Cambodia, Lao PDR and Myanmar) are expected to stay strong through 2022. Cambodia’s growth will reach around 7.2% in the next half-decade on the back of export recovery, consumption-supportive industrialisation policy and initiatives to develop capital markets. Growth in Lao PDR from 2018 to 2022 will remain robust at 7.1%, although this is lower than the average of 7.9% from 2011 to 2015. An impressive decline in poverty and an anticipated rebound in tourist arrivals bode well for private consumption. The new competition law, amendments to the investment promotion law and initiatives to broaden linkages of special economic zones with neighbouring ASEAN members should also facilitate capital infusion and trade. In Myanmar, leading indicators suggest a marked recovery after a steep pullback in tourist arrivals and exports took its toll on GDP growth in 2016. In the medium term, the economy is expected to expand by 7.4%. The renewed uptrend in exports and tourism, coupled with the passage of a new investment law, will likely keep investors interested in the country. Overseas remittances stand to provide substantial fuel to private spending in the coming years.
China is expected to grow more slowly, by 6.2% in the medium term. Excess capacity issues and financial market vulnerabilities are the main drags on growth. Private consumption and investment will remain the anchors of growth. Exports are expected to contribute more significantly in the coming years as new free trade zones gain traction and on the government’s initiatives to scale up the value added of China’s traded goods. India’s growth will rise to about 7.3% between 2018 and 2022 from the 6.8% average from 2011 to 2015, despite the structural strains due to reform measures. Economic growth will draw support from the steady expansion of private consumption and investments following foreign ownership liberalisation in some industries. The planned government spending expansion should further boost growth. However, the jump in the stock of banks’ bad assets and contingent liability risks may limit the expansion of demand.
Other key points of the economic outlook and assessment• The accommodative monetary stances of central banks in many countries in the
region persist, anchored on benign inflation, even though recent data indicate some manifestations of renewed price pressures. Headline inflation still diverges across Emerging Asia. Inflation firmed up in most of the big ASEAN economies, driven by the marked rise in food and transport sub-indices. CPI growth in China is on a very gradual rise, owing to increases in housing and health care costs. Headline inflation in India is increasing gradually supported by movements in fuel, clothing and housing prices. In contrast, headline inflation has waned in the CLM countries.
• The external positions of Emerging Asia have remained generally robust. The recovery of exports and of imports have had contradictory impacts on current account (CA) balances. Net FDI inflows to Emerging Asia have stayed largely on the uptrend in recent years. Factors that have kept investors interested in the region include improvement in trade prospects, announced big-ticket infrastructure projects, the resilience of domestic demand and the aggressive drive of some governments to develop industries related to information technology and e-commerce through investment incentives.
• Fiscal policy in Emerging Asia has been largely expansionary this year. A widening gap may be a concern in some economies, but fiscal positions are generally stable. In the near term, many large ASEAN countries plan to increase spending, especially
1. MacrOecONOMIc aSSeSSMeNtS aNd ecONOMIc OUtlOOK fOr eMergINg aSIa
4746 ecONOMIc OUtlOOK fOr SOUtHeaSt aSIa, cHINa aNd INdIa 2018: fOSterINg grOWtH tHrOUgH dIgItalISatION © Oecd 2018 ecONOMIc OUtlOOK fOr SOUtHeaSt aSIa, cHINa aNd INdIa 2018: fOSterINg grOWtH tHrOUgH dIgItalISatION © Oecd 2018
on infrastructure. China is maintaining a stable footing despite stronger spending of late. This may not be the case for India, Lao PDR and Viet Nam, which are trying to contain concerns related to budget deficits and poor performance of financial institutions.
Box 1.1. Key assumptions of the medium-term outlook to 2022
Projections over 2018-22 are produced using the OECD Development Centre’s Medium-term Projection Framework, which includes the following assumptions:
• The output gap – the gap between actual and potential GDP – will converge to zero by 2022.
• Inflation-targeting countries will continue to pursue stability and to adjust monetary policies to support their targets.
• Regional economic integration initiatives and projects will advance at the same pace as before.
• The national medium-term development plans of Emerging Asia countries will largely be implemented, subject to budgetary and other policy considerations (see Chapter 4).
• Unanticipated economic events and other external factors will not significantly alter the situation beyond the cut-off date.
• The cut-off date of data for the projection is 31 October 2017. For more detailed information on MPF, please see www.oecd.org/dev/asia-pacific/mpf.htm.
Recent macroeconomic developments and medium-term prospects
ASEAN-5
Indonesia
Indonesia’s growth remained robust at 5.0% in the first half of 2017 (2017 H1 onwards), closely tracking the 5.1% expansion in 2016 H1 (Figure 1.2) as well as the government’s target of 5.2% for this year. Private consumption, which accounts for more than half of the economy, maintained its growth pace of 5.0% in the first two quarters of 2017, in line with the short-run average since 2014 Q1 (Figure 1.3). Exports and investments have also grown faster in 2017 H1 than in the same period in 2016, with export receipts posting 5.8% YOY growth in 2017 H1 to reverse the 2.7% decline in 2016 H1. Goods (excluding oil and gas) as well as services exports have grown strongly during the period, even as oil and gas outbound sales scaled back by about 2.3%. Moreover, fixed capital accumulation rose 5.1% in 2017 H1, largely due to the construction of buildings and structures, which increased to 6.0% in 2017 H1 from 5.9% in 2016 H1. On the other hand, public spending slowed markedly in 2017 H1, with growth practically flatlining compared to 5.0% in 2016 H1. Lower than expected revenue collection has been partly responsible for motivating a pullback in disbursements.
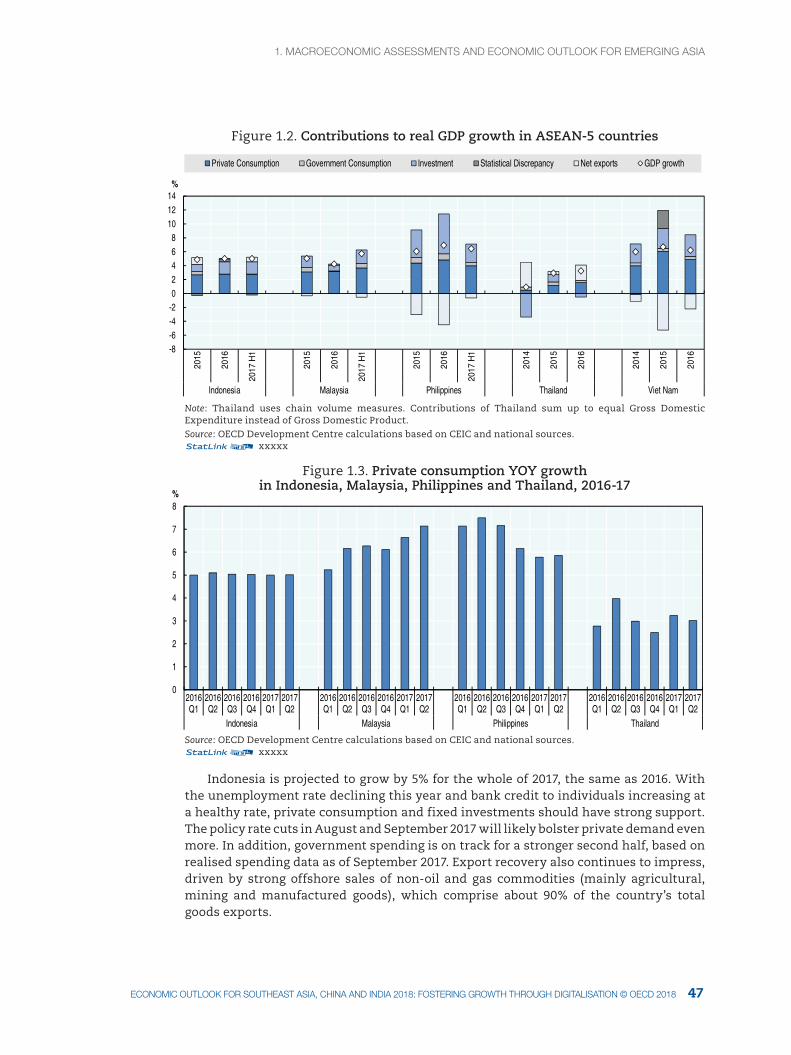
1. MacrOecONOMIc aSSeSSMeNtS aNd ecONOMIc OUtlOOK fOr eMergINg aSIa1. MacrOecONOMIc aSSeSSMeNtS aNd ecONOMIc OUtlOOK fOr eMergINg aSIa
47ecONOMIc OUtlOOK fOr SOUtHeaSt aSIa, cHINa aNd INdIa 2018: fOSterINg grOWtH tHrOUgH dIgItalISatION © Oecd 2018
Figure 1.2. Contributions to real GDP growth in ASEAN-5 countries
-8-6-4-202468
101214
2015
2016
2017
H1
2015
2016
2017
H1
2015
2016
2017
H1
2014
2015
2016
2014
2015
2016
Indonesia Malaysia Philippines Thailand Viet Nam
%
Private Consumption Government Consumption Investment Statistical Discrepancy Net exports GDP growth
Note: Thailand uses chain volume measures. Contributions of Thailand sum up to equal Gross Domestic Expenditure instead of Gross Domestic Product.Source: OECD Development Centre calculations based on CEIC and national sources.12 xxxxx
Figure 1.3. Private consumption YOY growth in Indonesia, Malaysia, Philippines and Thailand, 2016-17
0
1
2
3
4
5
6
7
8
2016Q1
2016Q2
2016Q3
2016Q4
2017Q1
2017Q2
2016Q1
2016Q2
2016Q3
2016Q4
2017Q1
2017Q2
2016Q1
2016Q2
2016Q3
2016Q4
2017Q1
2017Q2
2016Q1
2016Q2
2016Q3
2016Q4
2017Q1
2017Q2
Indonesia Malaysia Philippines Thailand
%
Source: OECD Development Centre calculations based on CEIC and national sources.12 xxxxx
Indonesia is projected to grow by 5% for the whole of 2017, the same as 2016. With the unemployment rate declining this year and bank credit to individuals increasing at a healthy rate, private consumption and fixed investments should have strong support. The policy rate cuts in August and September 2017 will likely bolster private demand even more. In addition, government spending is on track for a stronger second half, based on realised spending data as of September 2017. Export recovery also continues to impress, driven by strong offshore sales of non-oil and gas commodities (mainly agricultural, mining and manufactured goods), which comprise about 90% of the country’s total goods exports.
1. MacrOecONOMIc aSSeSSMeNtS aNd ecONOMIc OUtlOOK fOr eMergINg aSIa
4948 ecONOMIc OUtlOOK fOr SOUtHeaSt aSIa, cHINa aNd INdIa 2018: fOSterINg grOWtH tHrOUgH dIgItalISatION © Oecd 2018 ecONOMIc OUtlOOK fOr SOUtHeaSt aSIa, cHINa aNd INdIa 2018: fOSterINg grOWtH tHrOUgH dIgItalISatION © Oecd 2018
Over the medium term, Indonesia’s growth will average 5.4% between 2018 and 2022, on the back of fixed capital formation and private consumption. The less restrictive investment climate provides greater incentive to private-sector investors. In addition, private consumption growth, which averaged about 5.1% over the ten years since 2007, is expected to maintain steady momentum. The improvement in investment prospects bodes well for consumer appetite through employment generation and better wages. The staging of the 2018 Asian Games in Jakarta and Palembang will likely contribute to the spending boost. Meanwhile, barring significant regulation-initiated shocks, and even if global oil prices stay modest, exports should be able to consolidate their nascent recovery in the next few years after contracting in 2015 and 2016.
One key domestic challenge is to roll out infrastructure projects expeditiously. Enhancing the existing framework for private-sector involvement in construction projects may be crucial since the government is seeking to keep the deficit ceiling down. Transparency is needed in public-private partnership (PPP) procedures. Having a one-stop shop to facilitate private-sector involvement could also benefit this effort. In addition to infrastructure development, it is important for the government to follow up on its initiatives to optimise revenue collection and resource allocation, given the legal constraints on state spending. In the same vein, improving disbursement to minimise the extent of unspent allotments requires attention. Notably, official data show that, between 2009 and 2016, expenditure realisation as a proportion of the revised expenditure target was below 86% on average. Similarly, the government suggests that in 2017 the deficit will be roughly 2.67% of GDP, or about 25 basis points below the revised ceiling of 2.92%. A tax amnesty programme in 2016 was designed to improve revenue collection (Box 1.2).
Box 1.2. Indonesia’s tax amnesty programme
Tax revenue has been historically low in Indonesia due to tax evasion and low voluntary compliance. Even in comparison to other developing countries in the region, Indonesia’s tax revenues in relation to GDP are quite low (Figure 1.4). In 2014, a mere 10.4% of the total population in Indonesia were registered taxpayers and only a fraction of these taxpayers, about 900 000, actually paid what they owed (OECD, 2016a). In order to address these issues and generate more revenues to support provision of public services, the government of Indonesia has made efforts in the past decades to strengthen revenue collection and the efficiency of tax administration – introducing tax administration reforms in the 2000s, offering a low tax rate to SMEs in order to improve their compliance and expanding electronic invoicing for VAT. The 2016 tax amnesty programme, launched on 18 July 2016, is the biggest government project in recent years to address this challenge. It aimed to broaden the base of taxation, increaserevenues from the non-oil and gas sector and draw in offshore corporate revenues by effectively forgiving hidden and undeclared assets on which taxes had not been paid to the government.
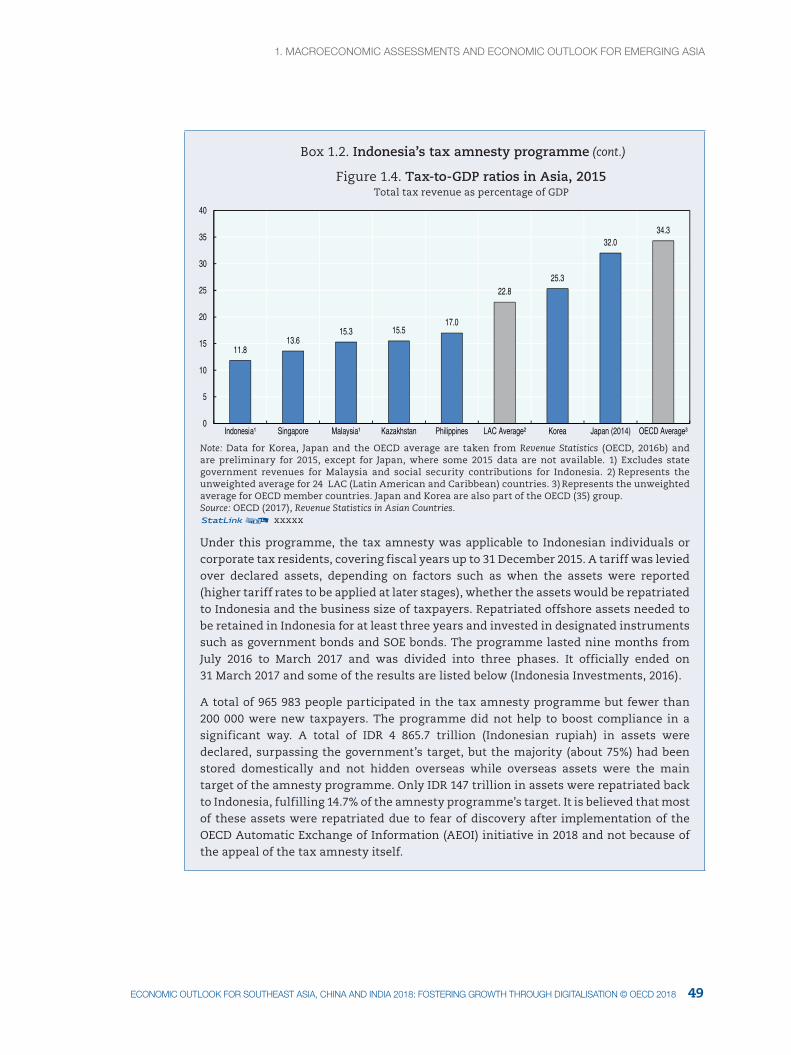
1. MacrOecONOMIc aSSeSSMeNtS aNd ecONOMIc OUtlOOK fOr eMergINg aSIa1. MacrOecONOMIc aSSeSSMeNtS aNd ecONOMIc OUtlOOK fOr eMergINg aSIa
49ecONOMIc OUtlOOK fOr SOUtHeaSt aSIa, cHINa aNd INdIa 2018: fOSterINg grOWtH tHrOUgH dIgItalISatION © Oecd 2018
Box 1.2. Indonesia’s tax amnesty programme
Figure 1.4. Tax-to-GDP ratios in Asia, 2015Total tax revenue as percentage of GDP
11.813.6
15.3 15.517.0
22.825.3
32.034.3
0
5
10
15
20
25
30
35
40
Indonesia¹ Singapore Malaysia¹ Kazakhstan Philippines LAC Average² Korea Japan (2014) OECD Average³
Note: Data for Korea, Japan and the OECD average are taken from Revenue Statistics (OECD, 2016b) and are preliminary for 2015, except for Japan, where some 2015 data are not available. 1) Excludes state government revenues for Malaysia and social security contributions for Indonesia. 2) Represents the unweighted average for 24 LAC (Latin American and Caribbean) countries. 3) Represents the unweighted average for OECD member countries. Japan and Korea are also part of the OECD (35) group.Source: OECD (2017), Revenue Statistics in Asian Countries.12 xxxxx
Under this programme, the tax amnesty was applicable to Indonesian individuals or corporate tax residents, covering fiscal years up to 31 December 2015. A tariff was levied over declared assets, depending on factors such as when the assets were reported (higher tariff rates to be applied at later stages), whether the assets would be repatriated to Indonesia and the business size of taxpayers. Repatriated offshore assets needed to be retained in Indonesia for at least three years and invested in designated instruments such as government bonds and SOE bonds. The programme lasted nine months from July 2016 to March 2017 and was divided into three phases. It officially ended on 31 March 2017 and some of the results are listed below (Indonesia Investments, 2016).
A total of 965 983 people participated in the tax amnesty programme but fewer than 200 000 were new taxpayers. The programme did not help to boost compliance in a significant way. A total of IDR 4 865.7 trillion (Indonesian rupiah) in assets were declared, surpassing the government’s target, but the majority (about 75%) had been stored domestically and not hidden overseas while overseas assets were the main target of the amnesty programme. Only IDR 147 trillion in assets were repatriated back to Indonesia, fulfilling 14.7% of the amnesty programme’s target. It is believed that most of these assets were repatriated due to fear of discovery after implementation of the OECD Automatic Exchange of Information (AEOI) initiative in 2018 and not because of the appeal of the tax amnesty itself.
(cont.)
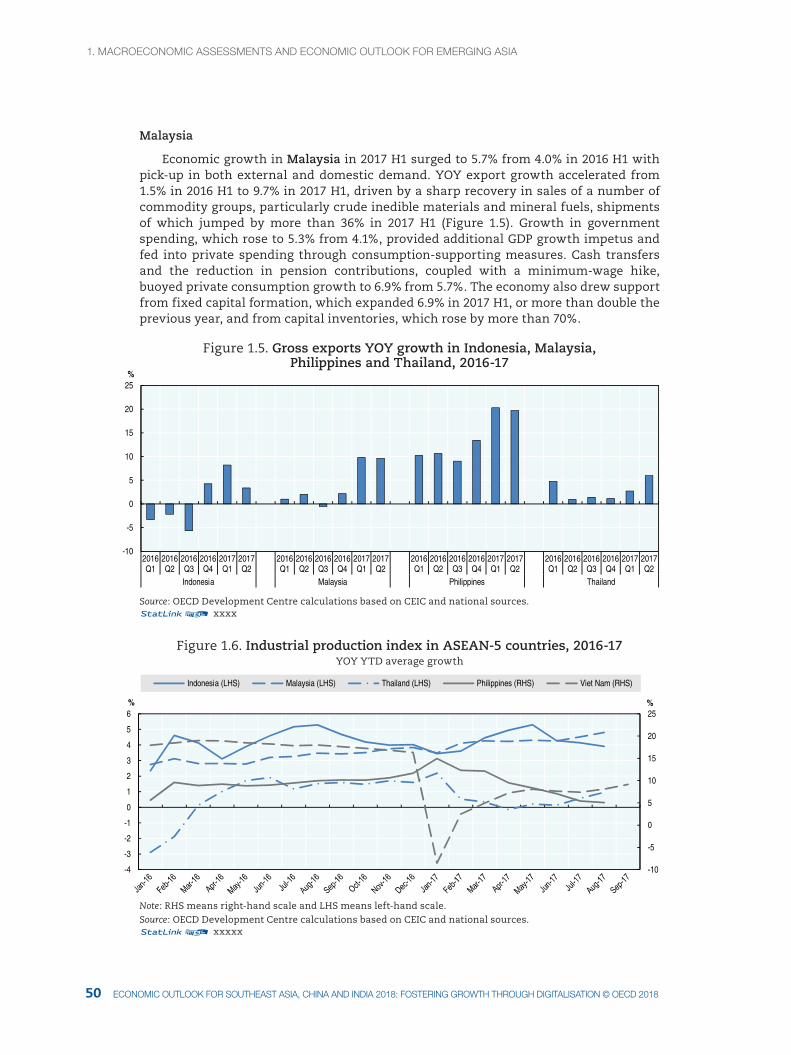
1. MacrOecONOMIc aSSeSSMeNtS aNd ecONOMIc OUtlOOK fOr eMergINg aSIa
5150 ecONOMIc OUtlOOK fOr SOUtHeaSt aSIa, cHINa aNd INdIa 2018: fOSterINg grOWtH tHrOUgH dIgItalISatION © Oecd 2018 ecONOMIc OUtlOOK fOr SOUtHeaSt aSIa, cHINa aNd INdIa 2018: fOSterINg grOWtH tHrOUgH dIgItalISatION © Oecd 2018
Malaysia
Economic growth in Malaysia in 2017 H1 surged to 5.7% from 4.0% in 2016 H1 with pick-up in both external and domestic demand. YOY export growth accelerated from 1.5% in 2016 H1 to 9.7% in 2017 H1, driven by a sharp recovery in sales of a number of commodity groups, particularly crude inedible materials and mineral fuels, shipments of which jumped by more than 36% in 2017 H1 (Figure 1.5). Growth in government spending, which rose to 5.3% from 4.1%, provided additional GDP growth impetus and fed into private spending through consumption-supporting measures. Cash transfers and the reduction in pension contributions, coupled with a minimum-wage hike, buoyed private consumption growth to 6.9% from 5.7%. The economy also drew support from fixed capital formation, which expanded 6.9% in 2017 H1, or more than double the previous year, and from capital inventories, which rose by more than 70%.
Figure 1.5. Gross exports YOY growth in Indonesia, Malaysia, Philippines and Thailand, 2016-17
-10
-5
0
5
10
15
20
25
2016Q1
2016Q2
2016Q3
2016Q4
2017Q1
2017Q2
2016Q1
2016Q2
2016Q3
2016Q4
2017Q1
2017Q2
2016Q1
2016Q2
2016Q3
2016Q4
2017Q1
2017Q2
2016Q1
2016Q2
2016Q3
2016Q4
2017Q1
2017Q2
Indonesia Malaysia Philippines Thailand
%
Source: OECD Development Centre calculations based on CEIC and national sources.12 xxxx
Figure 1.6. Industrial production index in ASEAN-5 countries, 2016-17YOY YTD average growth
-10
-5
0
5
10
15
20
25
-4
-3
-2
-1
0
1
2
3
4
5
6%%
Indonesia (LHS) Malaysia (LHS) Thailand (LHS) Philippines (RHS) Viet Nam (RHS)
Note: RHS means right-hand scale and LHS means left-hand scale.Source: OECD Development Centre calculations based on CEIC and national sources.12 xxxxx
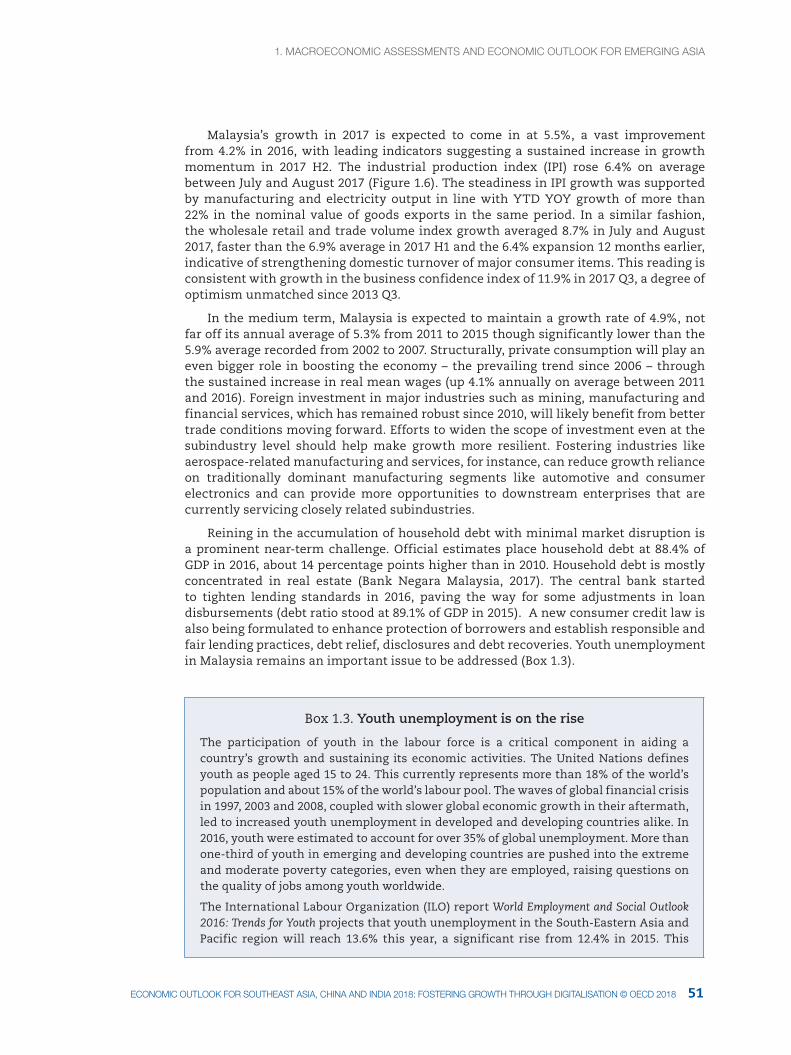
1. MacrOecONOMIc aSSeSSMeNtS aNd ecONOMIc OUtlOOK fOr eMergINg aSIa1. MacrOecONOMIc aSSeSSMeNtS aNd ecONOMIc OUtlOOK fOr eMergINg aSIa
51ecONOMIc OUtlOOK fOr SOUtHeaSt aSIa, cHINa aNd INdIa 2018: fOSterINg grOWtH tHrOUgH dIgItalISatION © Oecd 2018
Malaysia’s growth in 2017 is expected to come in at 5.5%, a vast improvement from 4.2% in 2016, with leading indicators suggesting a sustained increase in growth momentum in 2017 H2. The industrial production index (IPI) rose 6.4% on average between July and August 2017 (Figure 1.6). The steadiness in IPI growth was supported by manufacturing and electricity output in line with YTD YOY growth of more than 22% in the nominal value of goods exports in the same period. In a similar fashion, the wholesale retail and trade volume index growth averaged 8.7% in July and August 2017, faster than the 6.9% average in 2017 H1 and the 6.4% expansion 12 months earlier, indicative of strengthening domestic turnover of major consumer items. This reading is consistent with growth in the business confidence index of 11.9% in 2017 Q3, a degree of optimism unmatched since 2013 Q3.
In the medium term, Malaysia is expected to maintain a growth rate of 4.9%, not far off its annual average of 5.3% from 2011 to 2015 though significantly lower than the 5.9% average recorded from 2002 to 2007. Structurally, private consumption will play an even bigger role in boosting the economy – the prevailing trend since 2006 – through the sustained increase in real mean wages (up 4.1% annually on average between 2011 and 2016). Foreign investment in major industries such as mining, manufacturing and financial services, which has remained robust since 2010, will likely benefit from better trade conditions moving forward. Efforts to widen the scope of investment even at the subindustry level should help make growth more resilient. Fostering industries like aerospace-related manufacturing and services, for instance, can reduce growth reliance on traditionally dominant manufacturing segments like automotive and consumer electronics and can provide more opportunities to downstream enterprises that are currently servicing closely related subindustries.
Reining in the accumulation of household debt with minimal market disruption is a prominent near-term challenge. Official estimates place household debt at 88.4% of GDP in 2016, about 14 percentage points higher than in 2010. Household debt is mostly concentrated in real estate (Bank Negara Malaysia, 2017). The central bank started to tighten lending standards in 2016, paving the way for some adjustments in loan disbursements (debt ratio stood at 89.1% of GDP in 2015). A new consumer credit law is also being formulated to enhance protection of borrowers and establish responsible and fair lending practices, debt relief, disclosures and debt recoveries. Youth unemployment in Malaysia remains an important issue to be addressed (Box 1.3).
Box 1.3. Youth unemployment is on the rise
The participation of youth in the labour force is a critical component in aiding a country’s growth and sustaining its economic activities. The United Nations defines youth as people aged 15 to 24. This currently represents more than 18% of the world’s population and about 15% of the world’s labour pool. The waves of global financial crisis in 1997, 2003 and 2008, coupled with slower global economic growth in their aftermath, led to increased youth unemployment in developed and developing countries alike. In 2016, youth were estimated to account for over 35% of global unemployment. More than one-third of youth in emerging and developing countries are pushed into the extreme and moderate poverty categories, even when they are employed, raising questions on the quality of jobs among youth worldwide.
The International Labour Organization (ILO) report World Employment and Social Outlook 2016: Trends for Youth projects that youth unemployment in the South-Eastern Asia and Pacific region will reach 13.6% this year, a significant rise from 12.4% in 2015. This
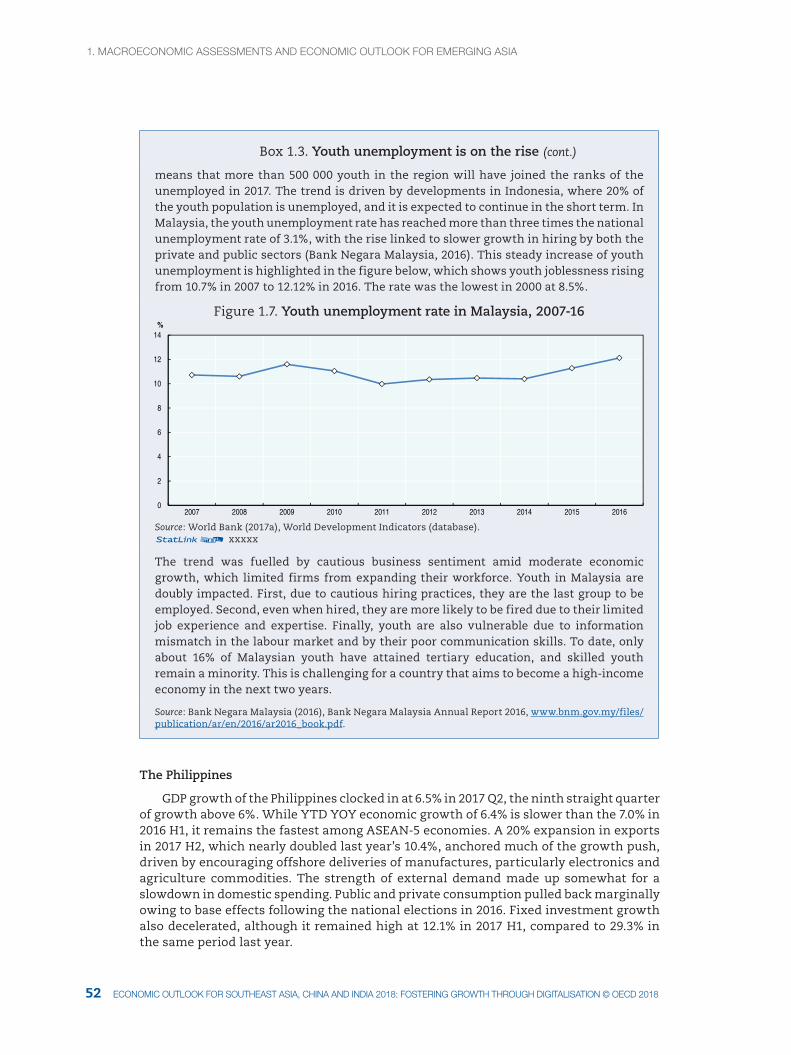
1. MacrOecONOMIc aSSeSSMeNtS aNd ecONOMIc OUtlOOK fOr eMergINg aSIa
5352 ecONOMIc OUtlOOK fOr SOUtHeaSt aSIa, cHINa aNd INdIa 2018: fOSterINg grOWtH tHrOUgH dIgItalISatION © Oecd 2018 ecONOMIc OUtlOOK fOr SOUtHeaSt aSIa, cHINa aNd INdIa 2018: fOSterINg grOWtH tHrOUgH dIgItalISatION © Oecd 2018
Box 1.3. Youth unemployment is on the rise
means that more than 500 000 youth in the region will have joined the ranks of the unemployed in 2017. The trend is driven by developments in Indonesia, where 20% of the youth population is unemployed, and it is expected to continue in the short term. In Malaysia, the youth unemployment rate has reached more than three times the national unemployment rate of 3.1%, with the rise linked to slower growth in hiring by both the private and public sectors (Bank Negara Malaysia, 2016). This steady increase of youth unemployment is highlighted in the figure below, which shows youth joblessness rising from 10.7% in 2007 to 12.12% in 2016. The rate was the lowest in 2000 at 8.5%.
Figure 1.7. Youth unemployment rate in Malaysia, 2007-16
0
2
4
6
8
10
12
14
2007 2008 2009 2010 2011 2012 2013 2014 2015 2016
%
Source: World Bank (2017a), World Development Indicators (database).12 xxxxx
The trend was fuelled by cautious business sentiment amid moderate economic growth, which limited firms from expanding their workforce. Youth in Malaysia are doubly impacted. First, due to cautious hiring practices, they are the last group to be employed. Second, even when hired, they are more likely to be fired due to their limited job experience and expertise. Finally, youth are also vulnerable due to information mismatch in the labour market and by their poor communication skills. To date, only about 16% of Malaysian youth have attained tertiary education, and skilled youth remain a minority. This is challenging for a country that aims to become a high-income economy in the next two years.
Source: Bank Negara Malaysia (2016), Bank Negara Malaysia Annual Report 2016, www.bnm.gov.my/files/publication/ar/en/2016/ar2016_book.pdf.
The Philippines
GDP growth of the Philippines clocked in at 6.5% in 2017 Q2, the ninth straight quarter of growth above 6%. While YTD YOY economic growth of 6.4% is slower than the 7.0% in 2016 H1, it remains the fastest among ASEAN-5 economies. A 20% expansion in exports in 2017 H2, which nearly doubled last year’s 10.4%, anchored much of the growth push, driven by encouraging offshore deliveries of manufactures, particularly electronics and agriculture commodities. The strength of external demand made up somewhat for a slowdown in domestic spending. Public and private consumption pulled back marginally owing to base effects following the national elections in 2016. Fixed investment growth also decelerated, although it remained high at 12.1% in 2017 H1, compared to 29.3% in the same period last year.
(cont.)
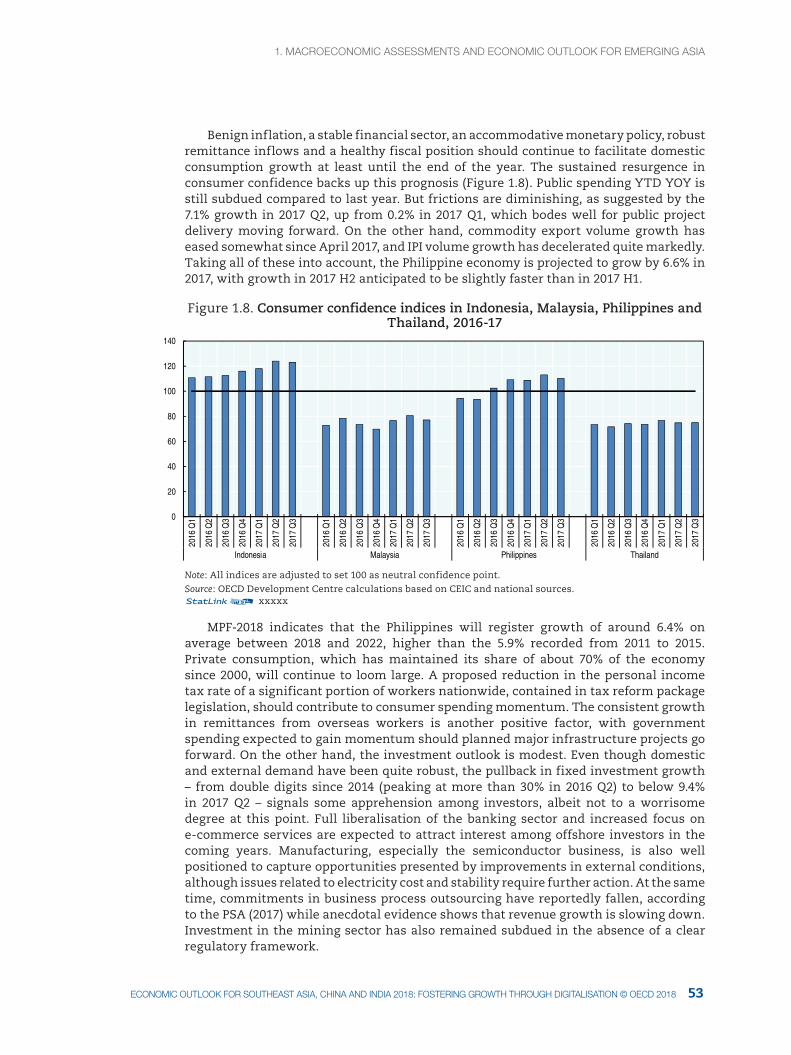
1. MacrOecONOMIc aSSeSSMeNtS aNd ecONOMIc OUtlOOK fOr eMergINg aSIa1. MacrOecONOMIc aSSeSSMeNtS aNd ecONOMIc OUtlOOK fOr eMergINg aSIa
53ecONOMIc OUtlOOK fOr SOUtHeaSt aSIa, cHINa aNd INdIa 2018: fOSterINg grOWtH tHrOUgH dIgItalISatION © Oecd 2018
Benign inflation, a stable financial sector, an accommodative monetary policy, robust remittance inflows and a healthy fiscal position should continue to facilitate domestic consumption growth at least until the end of the year. The sustained resurgence in consumer confidence backs up this prognosis (Figure 1.8). Public spending YTD YOY is still subdued compared to last year. But frictions are diminishing, as suggested by the 7.1% growth in 2017 Q2, up from 0.2% in 2017 Q1, which bodes well for public project delivery moving forward. On the other hand, commodity export volume growth has eased somewhat since April 2017, and IPI volume growth has decelerated quite markedly. Taking all of these into account, the Philippine economy is projected to grow by 6.6% in 2017, with growth in 2017 H2 anticipated to be slightly faster than in 2017 H1.
Figure 1.8. Consumer confidence indices in Indonesia, Malaysia, Philippines and Thailand, 2016-17
0
20
40
60
80
100
120
140
2016
Q1
2016
Q2
2016
Q3
2016
Q4
2017
Q1
2017
Q2
2017
Q3
2016
Q1
2016
Q2
2016
Q3
2016
Q4
2017
Q1
2017
Q2
2017
Q3
2016
Q1
2016
Q2
2016
Q3
2016
Q4
2017
Q1
2017
Q2
2017
Q3
2016
Q1
2016
Q2
2016
Q3
2016
Q4
2017
Q1
2017
Q2
2017
Q3
Indonesia Malaysia Philippines Thailand
Note: All indices are adjusted to set 100 as neutral confidence point.Source: OECD Development Centre calculations based on CEIC and national sources.12 xxxxx
MPF-2018 indicates that the Philippines will register growth of around 6.4% on average between 2018 and 2022, higher than the 5.9% recorded from 2011 to 2015. Private consumption, which has maintained its share of about 70% of the economy since 2000, will continue to loom large. A proposed reduction in the personal income tax rate of a significant portion of workers nationwide, contained in tax reform package legislation, should contribute to consumer spending momentum. The consistent growth in remittances from overseas workers is another positive factor, with government spending expected to gain momentum should planned major infrastructure projects go forward. On the other hand, the investment outlook is modest. Even though domestic and external demand have been quite robust, the pullback in fixed investment growth – from double digits since 2014 (peaking at more than 30% in 2016 Q2) to below 9.4% in 2017 Q2 – signals some apprehension among investors, albeit not to a worrisome degree at this point. Full liberalisation of the banking sector and increased focus on e-commerce services are expected to attract interest among offshore investors in the coming years. Manufacturing, especially the semiconductor business, is also well positioned to capture opportunities presented by improvements in external conditions, although issues related to electricity cost and stability require further action. At the same time, commitments in business process outsourcing have reportedly fallen, according to the PSA (2017) while anecdotal evidence shows that revenue growth is slowing down. Investment in the mining sector has also remained subdued in the absence of a clear regulatory framework.
1. MacrOecONOMIc aSSeSSMeNtS aNd ecONOMIc OUtlOOK fOr eMergINg aSIa
5554 ecONOMIc OUtlOOK fOr SOUtHeaSt aSIa, cHINa aNd INdIa 2018: fOSterINg grOWtH tHrOUgH dIgItalISatION © Oecd 2018 ecONOMIc OUtlOOK fOr SOUtHeaSt aSIa, cHINa aNd INdIa 2018: fOSterINg grOWtH tHrOUgH dIgItalISatION © Oecd 2018
One key challenge is to alleviate business uncertainties related to contract enforcement and continuity of government programmes. Efforts undertaken to facilitate competition in various sectors should help spark investor interest, as should government’s decision to review the foreign investment negative list and to update of the Investment Priorities Plan. Timely delivery of above-standard big-ticket infrastructure projects announced and planned to be completed before national elections in 2022, is another challenge. Moreover, close attention should be paid to narrowing job mismatches and generating more quality, high-value-added jobs. While underemployment has steadily declined, from about 20% in 2012 to 16.2% 2017 (first three quarters), stalled progress in curbing the unemployment rate amid the persistent decline in the labour participation rate can be a potential drag on growth. Informal sector employment remains sizeable, at roughly 35% of total employment in 2016.2 About 31.6% of all employees are considered low skilled as of 2016, based on the data of the International Labour Organization (ILO).
Thailand
Acceleration of export growth, as consumption moderates, was the main factor behind Thailand’s growth of 3.5% in 2017 H1, up from 3.4% in 2016 H1. Gross exports, led by minerals and fuels, agriculture products, and manufactures, grew by 4.3%, up from 2.9% the previous year, while consumption expansion nudged down marginally to 3.1% from 3.4%, with wages proving sticky this year and growth of bank lending to individuals softening. On the supply side, farm output surged by 10% in 2017 H1 – reversing the 1.3% contraction in 2016 H1 – on the back of renewed government assistance, recovery in external demand and favourable weather conditions. Wholesale and retail trade services, as well as transport, storage and communication services, likewise recorded faster growth.
Thailand is projected to grow by 3.8% for the whole of 2017, with the expectation that the economy will expand moderately faster in 2017 H2 than in 2017 H1. Exports, which show a sustained uptick after 2017 H1 (especially shipments of agriculture and manufacturing goods), will likely lead the growth push until the end of the year. The persistent double-digit rise in YOY growth of the agricultural production index supports the sanguine outlook on farm output in the near term (Box 1.4). In the same way, brisk growth in imports of raw materials, intermediate products and capital goods points to a possible pick-up in capital formation in the next few quarters. However, leading indicators for consumption are sending mixed signals. YOY growth of spending on vehicles and passenger transportation in July and August 2017 appears to be holding up in comparison to YOY growth in 2017 H1. Growth of spending on accommodation and restaurants also remains relatively high, while consumption of clothing products has contracted since April 2017. Tourist arrivals, which were weak at the start of the year, are showing signs of improvement though the rate of increase is still lower than during the same period in 2016.
Thailand’s average growth from 2018 to 2022 is expected to average 3.6%, modestly higher than the 2.9% mean annual expansion rate from 2011 to 2015. With regulatory uncertainties gradually clearing, along with improving competitiveness and a better global trade picture, capital formation should be more robust in the coming years. Measures set forth recently by the government to ease access of foreign capital in the domestic market include: i) the removal of certain financial services from the protected industries list in February 2016; ii) passage of a new Customs Act in March 2017 (effective November 2017) that focuses on trade-related legal infractions, levies and procedural transparency after almost a decade of negotiations; and iii) the launching of Thailand 4.0 to support the development of the automotive industry, aviation, tourism, health care,
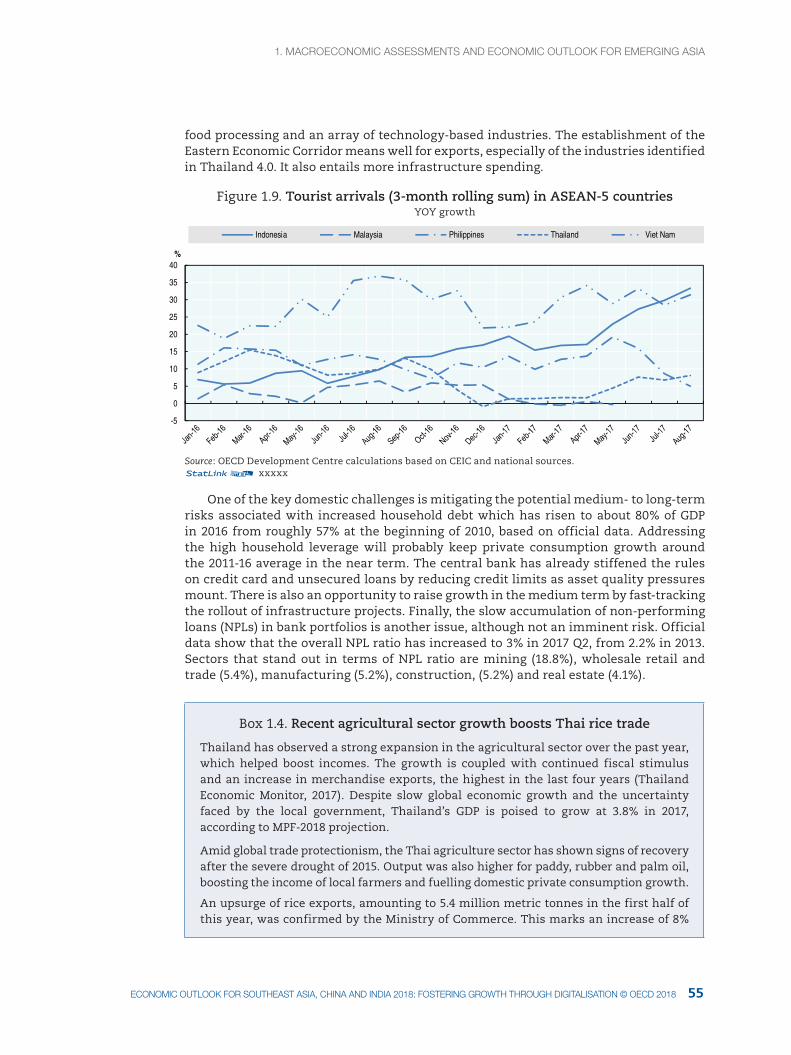
1. MacrOecONOMIc aSSeSSMeNtS aNd ecONOMIc OUtlOOK fOr eMergINg aSIa1. MacrOecONOMIc aSSeSSMeNtS aNd ecONOMIc OUtlOOK fOr eMergINg aSIa
55ecONOMIc OUtlOOK fOr SOUtHeaSt aSIa, cHINa aNd INdIa 2018: fOSterINg grOWtH tHrOUgH dIgItalISatION © Oecd 2018
food processing and an array of technology-based industries. The establishment of the Eastern Economic Corridor means well for exports, especially of the industries identified in Thailand 4.0. It also entails more infrastructure spending.
Figure 1.9. Tourist arrivals (3-month rolling sum) in ASEAN-5 countriesYOY growth
-5
0
5
10
15
20
25
30
35
40%
Indonesia Malaysia Philippines Thailand Viet Nam
Source: OECD Development Centre calculations based on CEIC and national sources.12 xxxxx
One of the key domestic challenges is mitigating the potential medium- to long-term risks associated with increased household debt which has risen to about 80% of GDP in 2016 from roughly 57% at the beginning of 2010, based on official data. Addressing the high household leverage will probably keep private consumption growth around the 2011-16 average in the near term. The central bank has already stiffened the rules on credit card and unsecured loans by reducing credit limits as asset quality pressures mount. There is also an opportunity to raise growth in the medium term by fast-tracking the rollout of infrastructure projects. Finally, the slow accumulation of non-performing loans (NPLs) in bank portfolios is another issue, although not an imminent risk. Official data show that the overall NPL ratio has increased to 3% in 2017 Q2, from 2.2% in 2013. Sectors that stand out in terms of NPL ratio are mining (18.8%), wholesale retail and trade (5.4%), manufacturing (5.2%), construction, (5.2%) and real estate (4.1%).
Box 1.4. Recent agricultural sector growth boosts Thai rice trade
Thailand has observed a strong expansion in the agricultural sector over the past year, which helped boost incomes. The growth is coupled with continued fiscal stimulus and an increase in merchandise exports, the highest in the last four years (Thailand Economic Monitor, 2017). Despite slow global economic growth and the uncertainty faced by the local government, Thailand’s GDP is poised to grow at 3.8% in 2017, according to MPF-2018 projection.
Amid global trade protectionism, the Thai agriculture sector has shown signs of recovery after the severe drought of 2015. Output was also higher for paddy, rubber and palm oil, boosting the income of local farmers and fuelling domestic private consumption growth.
An upsurge of rice exports, amounting to 5.4 million metric tonnes in the first half of this year, was confirmed by the Ministry of Commerce. This marks an increase of 8%
1. MacrOecONOMIc aSSeSSMeNtS aNd ecONOMIc OUtlOOK fOr eMergINg aSIa
5756 ecONOMIc OUtlOOK fOr SOUtHeaSt aSIa, cHINa aNd INdIa 2018: fOSterINg grOWtH tHrOUgH dIgItalISatION © Oecd 2018 ecONOMIc OUtlOOK fOr SOUtHeaSt aSIa, cHINa aNd INdIa 2018: fOSterINg grOWtH tHrOUgH dIgItalISatION © Oecd 2018
Box 1.4. Recent agricultural sector growth boosts Thai rice trade
growth compared to the previous year, and is attributed to the fact that Thai white and parboiled rice are more competitive in the Middle East and Africa. The export surge was also propelled by the sale of government rice stocks and the recovery of marketing year 2016/17 off-season rice production. Exports of white rice alone reached 2.7 million metric tonnes in the first half of 2017. The increase of exports for this type of rice settled modestly at 2%. Nevertheless, this growth is very much welcomed as it marks the end of a five-month decline of 5%. In the lead, parboiled rice exports recorded an increase of 25% YOY, reaching 1.2 million metric tonnes in the first half of 2017.
Nonetheless, the pace of rice export growth is expected to slow in the second half of 2017, in particular for white rice. This is due to the halt of sales of the government’s rice stock in mid-2017. As a result, Thai rice exports are expected to reach 10.5 million metric tonnes in 2017, falling short of earlier predictions by 0.5 million metric tonnes, as highlighted by a report by the U.S. Department of Agriculture’s Foreign Agricultural Service (FAS). However, even with the sales halt, exports are projected to expand by 6% YOY.
In order to delay sales of rice, the government in November 2016 introduced a new short-term rice subsidy programme, called the rice loan scheme, with an allocation of THB 54 billion (Thai baht). Through this programme, Thai farmers received credit of up to 90% of the market price of their rice in stock and subsidies of 10% for barn storage. An additional 20% of subsidy was allocated for harvesting and paddy-quality improvement activities. The policy ended in February 2017 amid stronger rice exports.
Source: World Bank (2017b), Thailand Economic Monitor: Digital Transformation, http://pubdocs.worldbank.org/en/823661503543356520/pdf/Thailand-Economic-Monitor-August-2017.pdf.
Viet Nam
Viet Nam saw its economy expand by 7.5% in 2017 Q3, pushing YTD growth to 6.4%, from 6.0% the previous year, on the strength of domestic consumption and external demand. The services sector, which comprises more than 38% of GDP, grew 7.3%, up from 6.7%, led by wholesale-retail trade, accommodation services and finance. YTD retail sales growth has been particularly strong at 10.5%, up from 9.5% last year, and is indicative of vigorous domestic demand. Similarly, agriculture growth accelerated from 6.0% to 6.4% and manufacturing production from 11.2% to 12.8%, largely boosted by a sharp uptick in export receipts, which increased by almost 20% during the period, up from about 7.0% in the same period in 2016 (nominal basis). Offshore sales of electronic components, machinery and related products, as well as rice, vegetables, rubber and nuts, accounted for much of the increase in exports. Agricultural production also benefitted from relatively good weather this year.
The near-term outlook for Viet Nam is better than last year’s, with GDP growth projected come in at 6.3% in 2017, marginally higher than 6.2% in 2016, although slightly slower than the 6.7% government target. Exports are expected to gain steam in the last quarter of 2017, as has been the case in the previous years. Tourist arrivals are on track to grow by more than 30% this year, up from 26% in 2016. In addition, a 15.4% YTD rise (as of September 2017) in business registration, which yielded a 43.5% increase in business capital by end-September 2017 based on the data of GSO (2017), signals good employment prospects ahead.
Between 2018 and 2022, Viet Nam’s economy is projected to expand by 6.2%, a modest rise from the 5.9% average between 2011 and 2015. Given that the proportion of gross exports to GDP is roughly 110% of GDP based on the data of the Asian Development
(cont.)
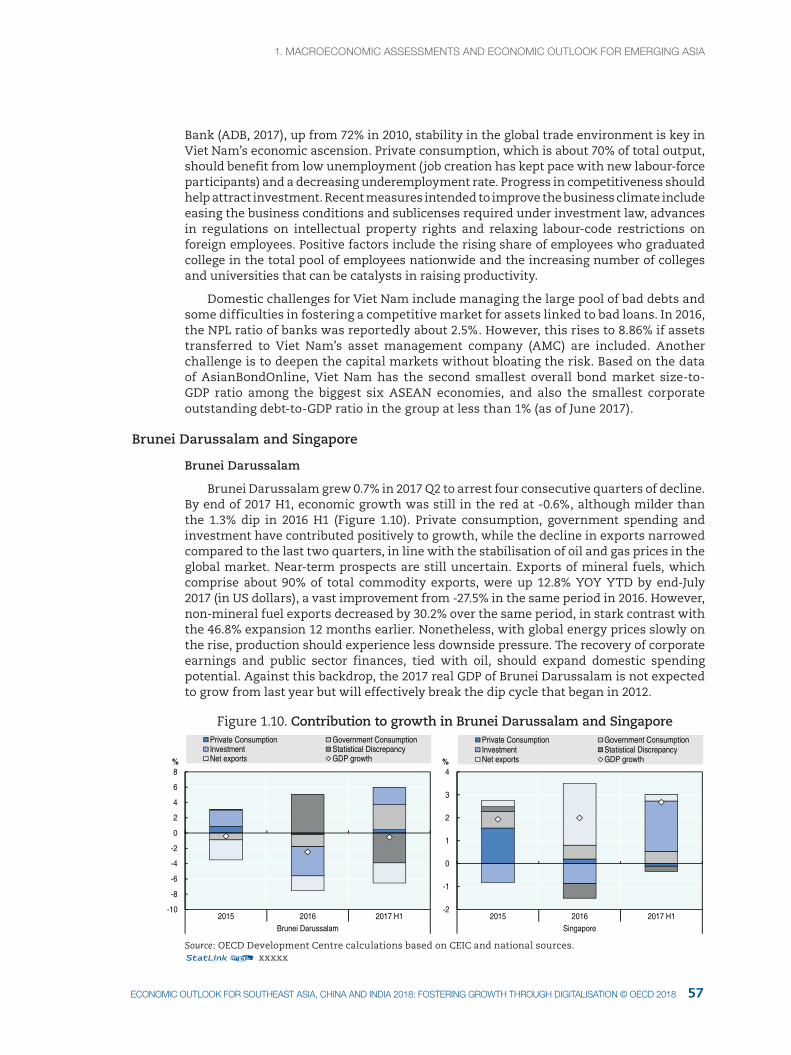
1. MacrOecONOMIc aSSeSSMeNtS aNd ecONOMIc OUtlOOK fOr eMergINg aSIa1. MacrOecONOMIc aSSeSSMeNtS aNd ecONOMIc OUtlOOK fOr eMergINg aSIa
57ecONOMIc OUtlOOK fOr SOUtHeaSt aSIa, cHINa aNd INdIa 2018: fOSterINg grOWtH tHrOUgH dIgItalISatION © Oecd 2018
Bank (ADB, 2017), up from 72% in 2010, stability in the global trade environment is key in Viet Nam’s economic ascension. Private consumption, which is about 70% of total output, should benefit from low unemployment (job creation has kept pace with new labour-force participants) and a decreasing underemployment rate. Progress in competitiveness should help attract investment. Recent measures intended to improve the business climate include easing the business conditions and sublicenses required under investment law, advances in regulations on intellectual property rights and relaxing labour-code restrictions on foreign employees. Positive factors include the rising share of employees who graduated college in the total pool of employees nationwide and the increasing number of colleges and universities that can be catalysts in raising productivity.
Domestic challenges for Viet Nam include managing the large pool of bad debts and some difficulties in fostering a competitive market for assets linked to bad loans. In 2016, the NPL ratio of banks was reportedly about 2.5%. However, this rises to 8.86% if assets transferred to Viet Nam’s asset management company (AMC) are included. Another challenge is to deepen the capital markets without bloating the risk. Based on the data of AsianBondOnline, Viet Nam has the second smallest overall bond market size-to-GDP ratio among the biggest six ASEAN economies, and also the smallest corporate outstanding debt-to-GDP ratio in the group at less than 1% (as of June 2017).
Brunei Darussalam and Singapore
Brunei Darussalam
Brunei Darussalam grew 0.7% in 2017 Q2 to arrest four consecutive quarters of decline. By end of 2017 H1, economic growth was still in the red at -0.6%, although milder than the 1.3% dip in 2016 H1 (Figure 1.10). Private consumption, government spending and investment have contributed positively to growth, while the decline in exports narrowed compared to the last two quarters, in line with the stabilisation of oil and gas prices in the global market. Near-term prospects are still uncertain. Exports of mineral fuels, which comprise about 90% of total commodity exports, were up 12.8% YOY YTD by end-July 2017 (in US dollars), a vast improvement from -27.5% in the same period in 2016. However, non-mineral fuel exports decreased by 30.2% over the same period, in stark contrast with the 46.8% expansion 12 months earlier. Nonetheless, with global energy prices slowly on the rise, production should experience less downside pressure. The recovery of corporate earnings and public sector finances, tied with oil, should expand domestic spending potential. Against this backdrop, the 2017 real GDP of Brunei Darussalam is not expected to grow from last year but will effectively break the dip cycle that began in 2012.
Figure 1.10. Contribution to growth in Brunei Darussalam and Singapore
-10
-8
-6
-4
-2
0
2
4
6
8
2015 2016 2017 H1Brunei Darussalam
%
Private Consumption Government ConsumptionInvestment Statistical DiscrepancyNet exports GDP growth
-2
-1
0
1
2
3
4
2015 2016 2017 H1Singapore
%
Private Consumption Government ConsumptionInvestment Statistical DiscrepancyNet exports GDP growth
Source: OECD Development Centre calculations based on CEIC and national sources.12 xxxxx
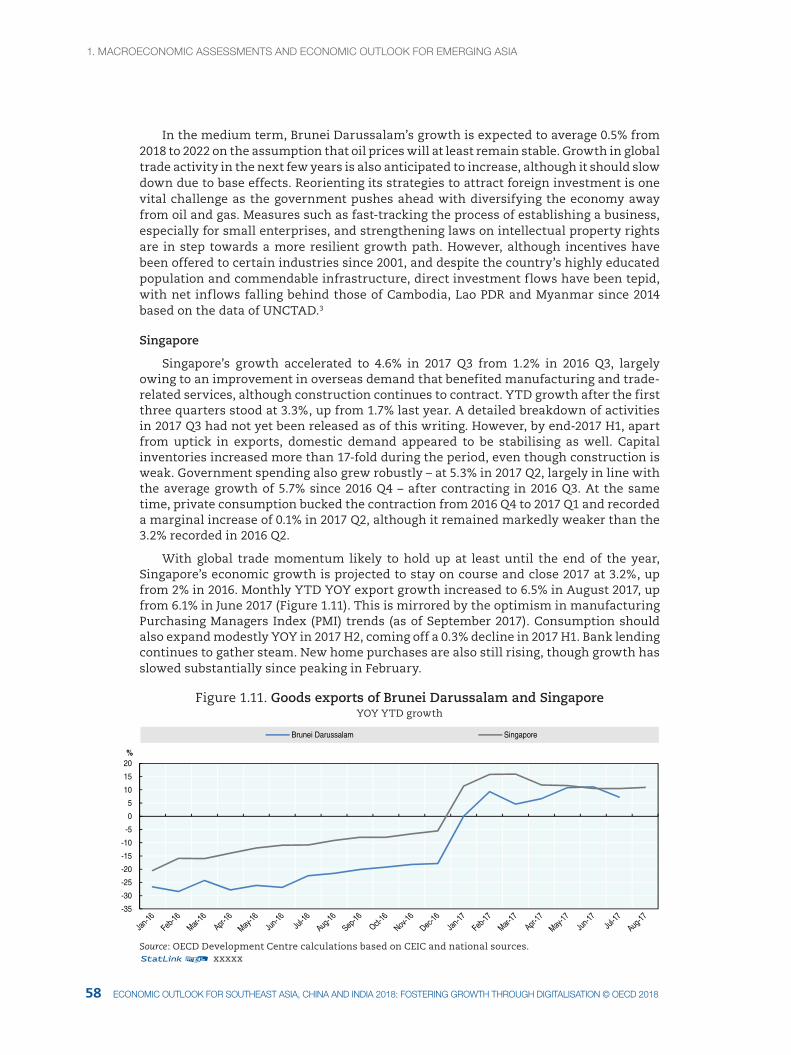
1. MacrOecONOMIc aSSeSSMeNtS aNd ecONOMIc OUtlOOK fOr eMergINg aSIa
5958 ecONOMIc OUtlOOK fOr SOUtHeaSt aSIa, cHINa aNd INdIa 2018: fOSterINg grOWtH tHrOUgH dIgItalISatION © Oecd 2018 ecONOMIc OUtlOOK fOr SOUtHeaSt aSIa, cHINa aNd INdIa 2018: fOSterINg grOWtH tHrOUgH dIgItalISatION © Oecd 2018
In the medium term, Brunei Darussalam’s growth is expected to average 0.5% from 2018 to 2022 on the assumption that oil prices will at least remain stable. Growth in global trade activity in the next few years is also anticipated to increase, although it should slow down due to base effects. Reorienting its strategies to attract foreign investment is one vital challenge as the government pushes ahead with diversifying the economy away from oil and gas. Measures such as fast-tracking the process of establishing a business, especially for small enterprises, and strengthening laws on intellectual property rights are in step towards a more resilient growth path. However, although incentives have been offered to certain industries since 2001, and despite the country’s highly educated population and commendable infrastructure, direct investment flows have been tepid, with net inflows falling behind those of Cambodia, Lao PDR and Myanmar since 2014 based on the data of UNCTAD.3
Singapore
Singapore’s growth accelerated to 4.6% in 2017 Q3 from 1.2% in 2016 Q3, largely owing to an improvement in overseas demand that benefited manufacturing and trade-related services, although construction continues to contract. YTD growth after the first three quarters stood at 3.3%, up from 1.7% last year. A detailed breakdown of activities in 2017 Q3 had not yet been released as of this writing. However, by end-2017 H1, apart from uptick in exports, domestic demand appeared to be stabilising as well. Capital inventories increased more than 17-fold during the period, even though construction is weak. Government spending also grew robustly – at 5.3% in 2017 Q2, largely in line with the average growth of 5.7% since 2016 Q4 – after contracting in 2016 Q3. At the same time, private consumption bucked the contraction from 2016 Q4 to 2017 Q1 and recorded a marginal increase of 0.1% in 2017 Q2, although it remained markedly weaker than the 3.2% recorded in 2016 Q2.
With global trade momentum likely to hold up at least until the end of the year, Singapore’s economic growth is projected to stay on course and close 2017 at 3.2%, up from 2% in 2016. Monthly YTD YOY export growth increased to 6.5% in August 2017, up from 6.1% in June 2017 (Figure 1.11). This is mirrored by the optimism in manufacturing Purchasing Managers Index (PMI) trends (as of September 2017). Consumption should also expand modestly YOY in 2017 H2, coming off a 0.3% decline in 2017 H1. Bank lending continues to gather steam. New home purchases are also still rising, though growth has slowed substantially since peaking in February.
Figure 1.11. Goods exports of Brunei Darussalam and SingaporeYOY YTD growth
-35
-30
-25
-20
-15
-10
-5
0
5
10
15
20%
Brunei Darussalam Singapore
Source: OECD Development Centre calculations based on CEIC and national sources.12 xxxxx
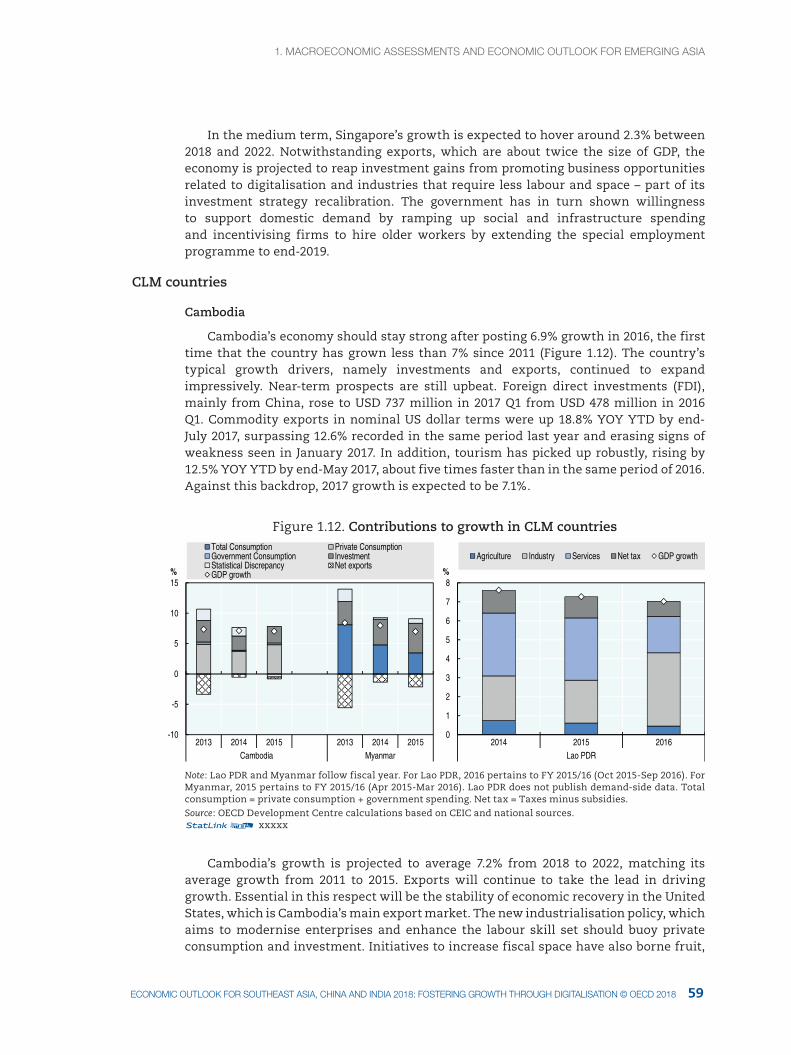
1. MacrOecONOMIc aSSeSSMeNtS aNd ecONOMIc OUtlOOK fOr eMergINg aSIa1. MacrOecONOMIc aSSeSSMeNtS aNd ecONOMIc OUtlOOK fOr eMergINg aSIa
59ecONOMIc OUtlOOK fOr SOUtHeaSt aSIa, cHINa aNd INdIa 2018: fOSterINg grOWtH tHrOUgH dIgItalISatION © Oecd 2018
In the medium term, Singapore’s growth is expected to hover around 2.3% between 2018 and 2022. Notwithstanding exports, which are about twice the size of GDP, the economy is projected to reap investment gains from promoting business opportunities related to digitalisation and industries that require less labour and space – part of its investment strategy recalibration. The government has in turn shown willingness to support domestic demand by ramping up social and infrastructure spending and incentivising firms to hire older workers by extending the special employment programme to end-2019.
CLM countries
Cambodia
Cambodia’s economy should stay strong after posting 6.9% growth in 2016, the first time that the country has grown less than 7% since 2011 (Figure 1.12). The country’s typical growth drivers, namely investments and exports, continued to expand impressively. Near-term prospects are still upbeat. Foreign direct investments (FDI), mainly from China, rose to USD 737 million in 2017 Q1 from USD 478 million in 2016 Q1. Commodity exports in nominal US dollar terms were up 18.8% YOY YTD by end-July 2017, surpassing 12.6% recorded in the same period last year and erasing signs of weakness seen in January 2017. In addition, tourism has picked up robustly, rising by 12.5% YOY YTD by end-May 2017, about five times faster than in the same period of 2016. Against this backdrop, 2017 growth is expected to be 7.1%.
Figure 1.12. Contributions to growth in CLM countries
-10
-5
0
5
10
15
2013 2014 2015 2013 2014 2015Cambodia Myanmar
%
Total Consumption Private ConsumptionGovernment Consumption InvestmentStatistical Discrepancy Net exportsGDP growth
0
1
2
3
4
5
6
7
8
2014 2015 2016Lao PDR
%
Agriculture Industry Services Net tax GDP growth
Note: Lao PDR and Myanmar follow fiscal year. For Lao PDR, 2016 pertains to FY 2015/16 (Oct 2015-Sep 2016). For Myanmar, 2015 pertains to FY 2015/16 (Apr 2015-Mar 2016). Lao PDR does not publish demand-side data. Total consumption = private consumption + government spending. Net tax = Taxes minus subsidies.Source: OECD Development Centre calculations based on CEIC and national sources.12 xxxxx
Cambodia’s growth is projected to average 7.2% from 2018 to 2022, matching its average growth from 2011 to 2015. Exports will continue to take the lead in driving growth. Essential in this respect will be the stability of economic recovery in the United States, which is Cambodia’s main export market. The new industrialisation policy, which aims to modernise enterprises and enhance the labour skill set should buoy private consumption and investment. Initiatives to increase fiscal space have also borne fruit,
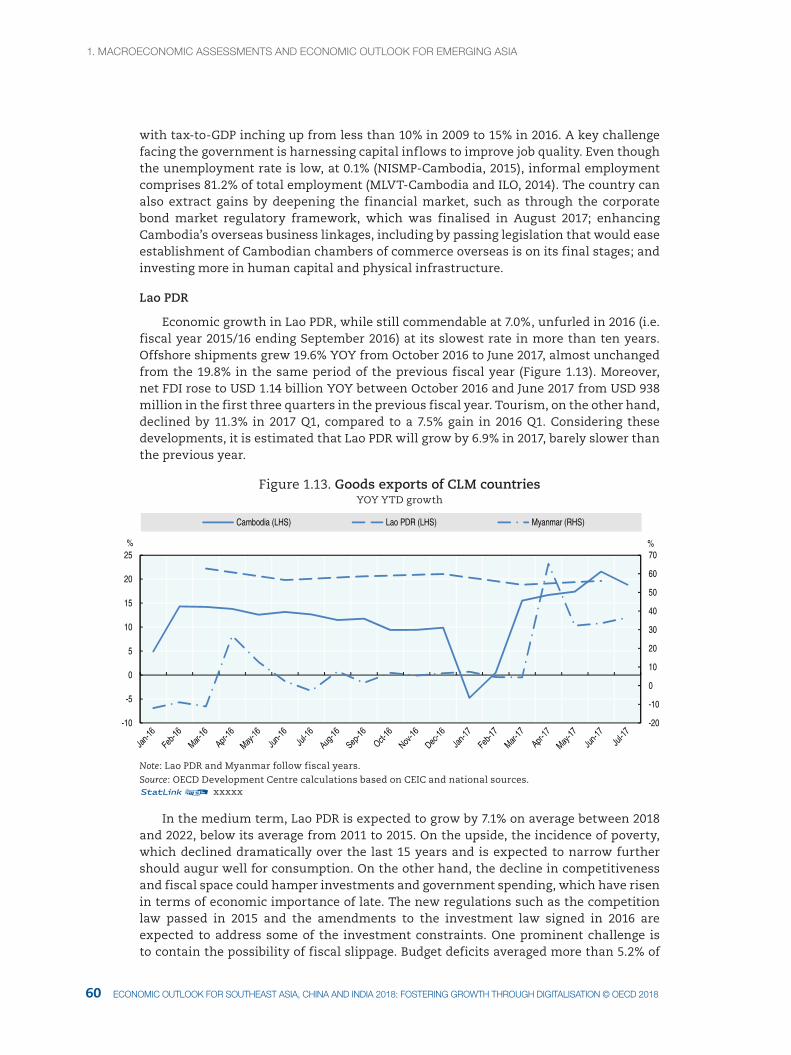
1. MacrOecONOMIc aSSeSSMeNtS aNd ecONOMIc OUtlOOK fOr eMergINg aSIa
6160 ecONOMIc OUtlOOK fOr SOUtHeaSt aSIa, cHINa aNd INdIa 2018: fOSterINg grOWtH tHrOUgH dIgItalISatION © Oecd 2018 ecONOMIc OUtlOOK fOr SOUtHeaSt aSIa, cHINa aNd INdIa 2018: fOSterINg grOWtH tHrOUgH dIgItalISatION © Oecd 2018
with tax-to-GDP inching up from less than 10% in 2009 to 15% in 2016. A key challenge facing the government is harnessing capital inflows to improve job quality. Even though the unemployment rate is low, at 0.1% (NISMP-Cambodia, 2015), informal employment comprises 81.2% of total employment (MLVT-Cambodia and ILO, 2014). The country can also extract gains by deepening the financial market, such as through the corporate bond market regulatory framework, which was finalised in August 2017; enhancing Cambodia’s overseas business linkages, including by passing legislation that would ease establishment of Cambodian chambers of commerce overseas is on its final stages; and investing more in human capital and physical infrastructure.
Lao PDR
Economic growth in Lao PDR, while still commendable at 7.0%, unfurled in 2016 (i.e. fiscal year 2015/16 ending September 2016) at its slowest rate in more than ten years. Offshore shipments grew 19.6% YOY from October 2016 to June 2017, almost unchanged from the 19.8% in the same period of the previous fiscal year (Figure 1.13). Moreover, net FDI rose to USD 1.14 billion YOY between October 2016 and June 2017 from USD 938 million in the first three quarters in the previous fiscal year. Tourism, on the other hand, declined by 11.3% in 2017 Q1, compared to a 7.5% gain in 2016 Q1. Considering these developments, it is estimated that Lao PDR will grow by 6.9% in 2017, barely slower than the previous year.
Figure 1.13. Goods exports of CLM countriesYOY YTD growth
-20
-10
0
10
20
30
40
50
60
70
-10
-5
0
5
10
15
20
25%%
Cambodia (LHS) Lao PDR (LHS) Myanmar (RHS)
Note: Lao PDR and Myanmar follow fiscal years.Source: OECD Development Centre calculations based on CEIC and national sources.12 xxxxx
In the medium term, Lao PDR is expected to grow by 7.1% on average between 2018 and 2022, below its average from 2011 to 2015. On the upside, the incidence of poverty, which declined dramatically over the last 15 years and is expected to narrow further should augur well for consumption. On the other hand, the decline in competitiveness and fiscal space could hamper investments and government spending, which have risen in terms of economic importance of late. The new regulations such as the competition law passed in 2015 and the amendments to the investment law signed in 2016 are expected to address some of the investment constraints. One prominent challenge is to contain the possibility of fiscal slippage. Budget deficits averaged more than 5.2% of
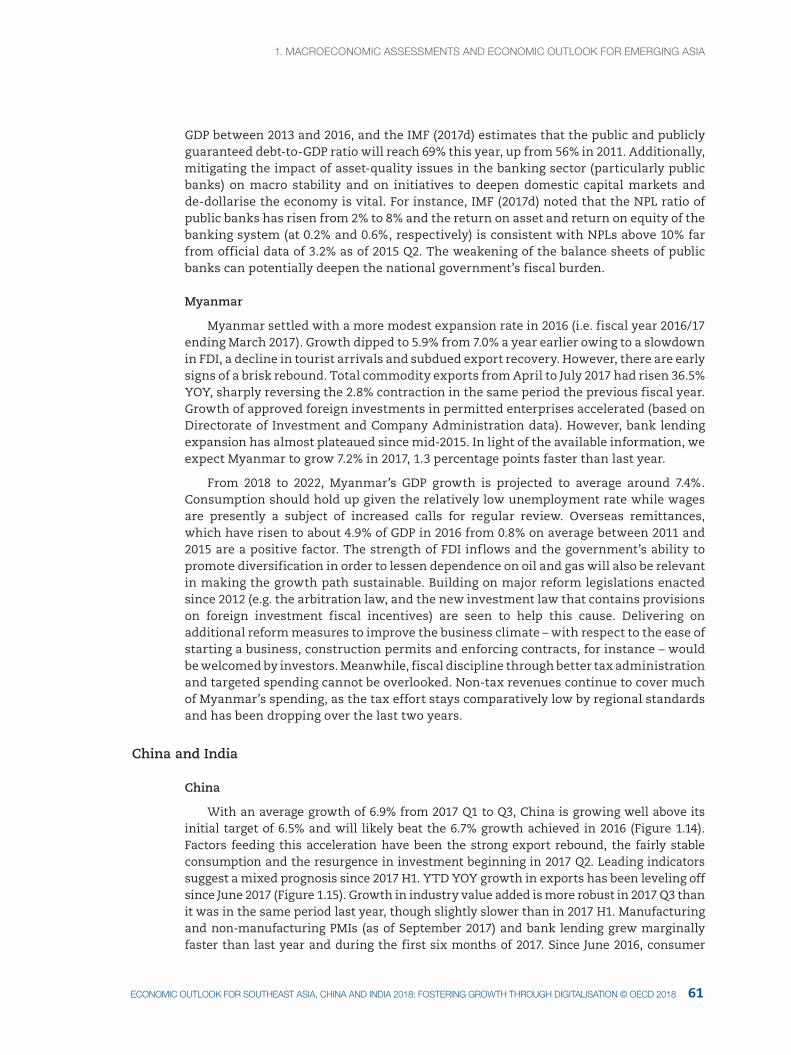
1. MacrOecONOMIc aSSeSSMeNtS aNd ecONOMIc OUtlOOK fOr eMergINg aSIa1. MacrOecONOMIc aSSeSSMeNtS aNd ecONOMIc OUtlOOK fOr eMergINg aSIa
61ecONOMIc OUtlOOK fOr SOUtHeaSt aSIa, cHINa aNd INdIa 2018: fOSterINg grOWtH tHrOUgH dIgItalISatION © Oecd 2018
GDP between 2013 and 2016, and the IMF (2017d) estimates that the public and publicly guaranteed debt-to-GDP ratio will reach 69% this year, up from 56% in 2011. Additionally, mitigating the impact of asset-quality issues in the banking sector (particularly public banks) on macro stability and on initiatives to deepen domestic capital markets and de-dollarise the economy is vital. For instance, IMF (2017d) noted that the NPL ratio of public banks has risen from 2% to 8% and the return on asset and return on equity of the banking system (at 0.2% and 0.6%, respectively) is consistent with NPLs above 10% far from official data of 3.2% as of 2015 Q2. The weakening of the balance sheets of public banks can potentially deepen the national government’s fiscal burden.
Myanmar
Myanmar settled with a more modest expansion rate in 2016 (i.e. fiscal year 2016/17 ending March 2017). Growth dipped to 5.9% from 7.0% a year earlier owing to a slowdown in FDI, a decline in tourist arrivals and subdued export recovery. However, there are early signs of a brisk rebound. Total commodity exports from April to July 2017 had risen 36.5% YOY, sharply reversing the 2.8% contraction in the same period the previous fiscal year. Growth of approved foreign investments in permitted enterprises accelerated (based on Directorate of Investment and Company Administration data). However, bank lending expansion has almost plateaued since mid-2015. In light of the available information, we expect Myanmar to grow 7.2% in 2017, 1.3 percentage points faster than last year.
From 2018 to 2022, Myanmar’s GDP growth is projected to average around 7.4%. Consumption should hold up given the relatively low unemployment rate while wages are presently a subject of increased calls for regular review. Overseas remittances, which have risen to about 4.9% of GDP in 2016 from 0.8% on average between 2011 and 2015 are a positive factor. The strength of FDI inflows and the government’s ability to promote diversification in order to lessen dependence on oil and gas will also be relevant in making the growth path sustainable. Building on major reform legislations enacted since 2012 (e.g. the arbitration law, and the new investment law that contains provisions on foreign investment fiscal incentives) are seen to help this cause. Delivering on additional reform measures to improve the business climate – with respect to the ease of starting a business, construction permits and enforcing contracts, for instance – would be welcomed by investors. Meanwhile, fiscal discipline through better tax administration and targeted spending cannot be overlooked. Non-tax revenues continue to cover much of Myanmar’s spending, as the tax effort stays comparatively low by regional standards and has been dropping over the last two years.
China and India
China
With an average growth of 6.9% from 2017 Q1 to Q3, China is growing well above its initial target of 6.5% and will likely beat the 6.7% growth achieved in 2016 (Figure 1.14). Factors feeding this acceleration have been the strong export rebound, the fairly stable consumption and the resurgence in investment beginning in 2017 Q2. Leading indicators suggest a mixed prognosis since 2017 H1. YTD YOY growth in exports has been leveling off since June 2017 (Figure 1.15). Growth in industry value added is more robust in 2017 Q3 than it was in the same period last year, though slightly slower than in 2017 H1. Manufacturing and non-manufacturing PMIs (as of September 2017) and bank lending grew marginally faster than last year and during the first six months of 2017. Since June 2016, consumer
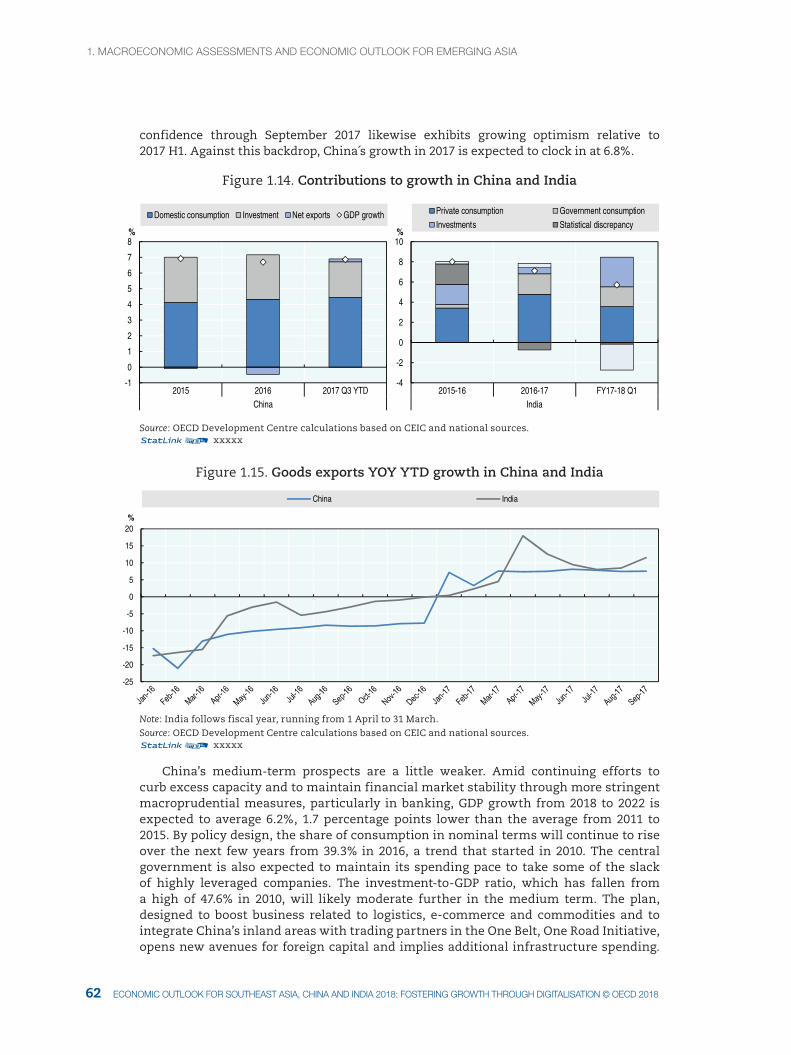
1. MacrOecONOMIc aSSeSSMeNtS aNd ecONOMIc OUtlOOK fOr eMergINg aSIa
6362 ecONOMIc OUtlOOK fOr SOUtHeaSt aSIa, cHINa aNd INdIa 2018: fOSterINg grOWtH tHrOUgH dIgItalISatION © Oecd 2018 ecONOMIc OUtlOOK fOr SOUtHeaSt aSIa, cHINa aNd INdIa 2018: fOSterINg grOWtH tHrOUgH dIgItalISatION © Oecd 2018
confidence through September 2017 likewise exhibits growing optimism relative to 2017 H1. Against this backdrop, China´s growth in 2017 is expected to clock in at 6.8%.
Figure 1.14. Contributions to growth in China and India
-1
0
1
2
3
4
5
6
7
8
2015 2016 2017 Q3 YTDChina
%
Domestic consumption Investment Net exports GDP growth
-4
-2
0
2
4
6
8
10
2015-16 2016-17 FY17-18 Q1India
%
Private consumption Government consumption
Investments Statistical discrepancy
Source: OECD Development Centre calculations based on CEIC and national sources.12 xxxxx
Figure 1.15. Goods exports YOY YTD growth in China and India
-25
-20
-15
-10
-5
0
5
10
15
20%
China India
Note: India follows fiscal year, running from 1 April to 31 March.Source: OECD Development Centre calculations based on CEIC and national sources.12 xxxxx
China’s medium-term prospects are a little weaker. Amid continuing efforts to curb excess capacity and to maintain financial market stability through more stringent macroprudential measures, particularly in banking, GDP growth from 2018 to 2022 is expected to average 6.2%, 1.7 percentage points lower than the average from 2011 to 2015. By policy design, the share of consumption in nominal terms will continue to rise over the next few years from 39.3% in 2016, a trend that started in 2010. The central government is also expected to maintain its spending pace to take some of the slack of highly leveraged companies. The investment-to-GDP ratio, which has fallen from a high of 47.6% in 2010, will likely moderate further in the medium term. The plan, designed to boost business related to logistics, e-commerce and commodities and to integrate China’s inland areas with trading partners in the One Belt, One Road Initiative, opens new avenues for foreign capital and implies additional infrastructure spending.
1. MacrOecONOMIc aSSeSSMeNtS aNd ecONOMIc OUtlOOK fOr eMergINg aSIa1. MacrOecONOMIc aSSeSSMeNtS aNd ecONOMIc OUtlOOK fOr eMergINg aSIa
63ecONOMIc OUtlOOK fOr SOUtHeaSt aSIa, cHINa aNd INdIa 2018: fOSterINg grOWtH tHrOUgH dIgItalISatION © Oecd 2018
Meanwhile, the speech of President Xi Jinping during the National Congress in mid-October reaffirmed China’s commitment to continue pursuing the objectives of the Thirteenth Plan (2016-20): elevating industries in global value chains; maintaining openness to investors, especially in construction; consolidating the anti-corruption drive; and promoting ecologically-friendly products (Box 1.5).
Box 1.5. Xi Jinping’s vision for China in 2050
“Socialism with Chinese characteristics has entered a new era”, President Xi Jinping proclaimed in his opening remarks to the 19th National Congress of the Communist Party of China (CPC) on 18 October. During the unusually long speech of more than three hours, President Xi assessed his administration’s achievements over the past five years and laid out guidelines for China’s development in the future. Compared to the speech at the last National Congress by then President Hu Jintao, the recent report differed in both length and substance. Words related to politics and governance were used frequently in the new report, and managing the environment received strong emphasis.
Under President Xi’s vision, China will build a moderately prosperous society by 2020 and achieve two stages of development between 2020 and 2050. During the first stage, from 2020 to 2035, China should strive to become a basically modernised country with greatly improved economic and scientific strength as well as a large middle-income population and a narrower wealth gap. By the end of the second stage, from 2035 to 2050, China should become an advanced and strong socialist country with top-ranked global influence while being “prosperous, democratic, civilised, harmonious and beautiful.”
The new plan by President Xi encompasses a wide variety of areas including economic development, rule of law, party building, anti-corruption, environmental protection, public welfare, national sovereignty, foreign affairs and China’s role in the global community.
Economic development
• Economic growth of China should be of high quality, efficient and sustainable. New methods should be developed to improve macroeconomic regulation by better co-ordinating fiscal, monetary, industrial, regional, and other economic policies.
• Chinese products should no longer be associated with being cheap and of poor quality. The government will “move Chinese industries up to the medium-high end of the global value chain, and foster a number of world-class advanced manufacturing clusters.”
• China will continue reform of state-owned enterprises (SOEs), develop mixed-ownership economic entities and make Chinese enterprises bigger, better and more competitive in the global market.
• Supply-side structural reforms, including reform of investment and financial systems, will be deepened.
• China will continue its liberalisation of interest rates and exchange rates.
• China will continue the policy of “opening up” and the One Belt, One Road Initiative will remain a national priority.
• Protection of property rights will be further strengthened and the government will continue to support the development of private businesses.
• In order to encourage fair and orderly competition, the government will introduce a negative list for market access nationwide and abolish regulations and practices that impede the development of a unified market and fair competition.
1. MacrOecONOMIc aSSeSSMeNtS aNd ecONOMIc OUtlOOK fOr eMergINg aSIa
6564 ecONOMIc OUtlOOK fOr SOUtHeaSt aSIa, cHINa aNd INdIa 2018: fOSterINg grOWtH tHrOUgH dIgItalISatION © Oecd 2018 ecONOMIc OUtlOOK fOr SOUtHeaSt aSIa, cHINa aNd INdIa 2018: fOSterINg grOWtH tHrOUgH dIgItalISatION © Oecd 2018
Box 1.5. Xi Jinping’s vision for China in 2050
Rule of law and party building
• China will set up a central leading group to advance law-based governance in all fields. Both the CPC and government shall rule the country under the law and through public oversight.
• The fight against corruption will continue and the methodology will be changed as reform of the national supervision system deepens. Corruption suspects will soon be detained by law enforcement instead of “shuanggui”, an intra-party disciplinary practice. A national supervision law will be formulated and China will set up supervisory commissions at the national, provincial, city, and county levels, which will share offices and work together with the party’s disciplinary inspection commissions.
Environmental protection
• China will take the lead in international co-operation on climate change to ensure the survival of mankind.
• China will step up efforts to establish a legal and policy framework that promotes green production and consumption and will promote sound economic structure that facilitates green, low-carbon, circular development.
• China will develop a nature reserves system composed mainly of national parks as part of an effort to build a beautiful China.
• Fundamental improvement in the environment can be expected by 2035.
Social welfare
• China will continue poverty reduction effort and ensure that all rural people living below the poverty line and all state-designated poor counties will be lifted out of poverty.
• China will step up efforts to build a comprehensive top-down mechanism of social management, to prevent and defuse tensions over “internal conflicts within the people” and to crack down on crime.
• Addressing concerns over rising property prices, the government insisted that “houses are for living, not for speculation”.
A prominent domestic challenge for China is to pursue reforms centred on financial markets and industrial capacity while ensuring that the economy does not lose significant steam. Bank NPLs and sizeable private-sector debt and wealth management products (WMPs) are parts and parcel of this risk. Regulations have been tightened through risk disclosure requirements, the scope of permissible investments and risk provisions. However, while these steps were welcomed by the market, recent back-to-back downgrades by Moody’s and then Fitch – highlighting the debt issue vis-à-vis public contingent liability – point to persistent vulnerabilities. The government has also reiterated its no-bailout policy involving WMPs.
(cont.)
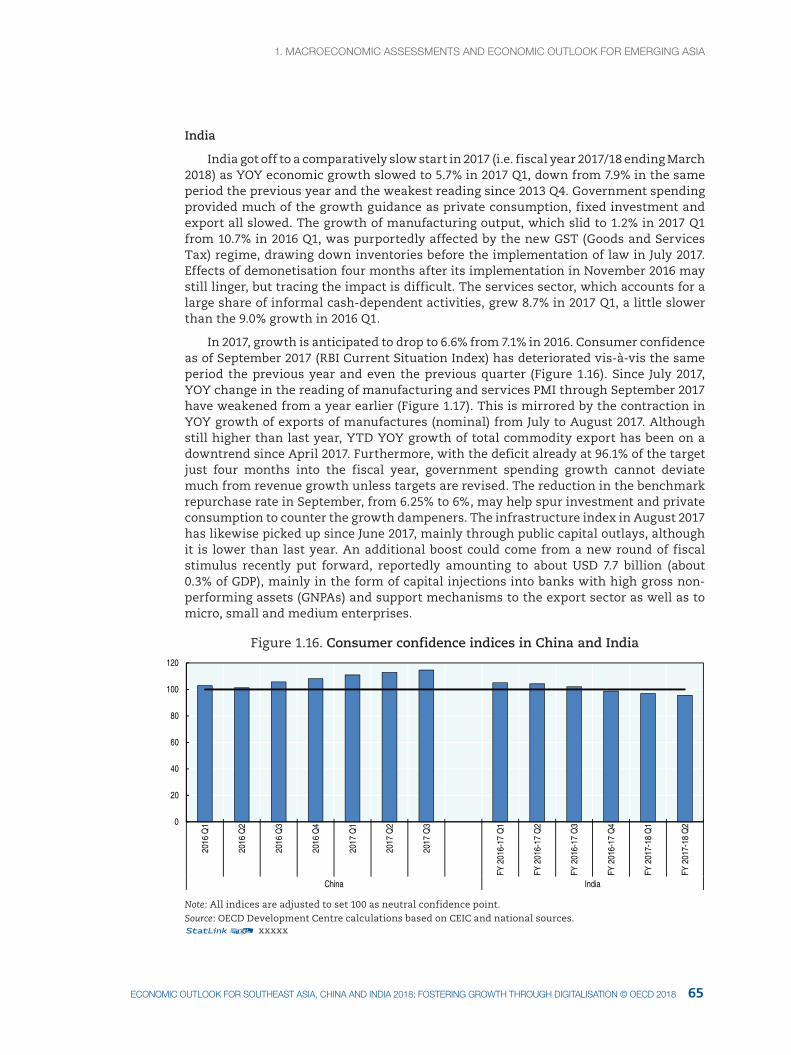
1. MacrOecONOMIc aSSeSSMeNtS aNd ecONOMIc OUtlOOK fOr eMergINg aSIa1. MacrOecONOMIc aSSeSSMeNtS aNd ecONOMIc OUtlOOK fOr eMergINg aSIa
65ecONOMIc OUtlOOK fOr SOUtHeaSt aSIa, cHINa aNd INdIa 2018: fOSterINg grOWtH tHrOUgH dIgItalISatION © Oecd 2018
India
India got off to a comparatively slow start in 2017 (i.e. fiscal year 2017/18 ending March 2018) as YOY economic growth slowed to 5.7% in 2017 Q1, down from 7.9% in the same period the previous year and the weakest reading since 2013 Q4. Government spending provided much of the growth guidance as private consumption, fixed investment and export all slowed. The growth of manufacturing output, which slid to 1.2% in 2017 Q1 from 10.7% in 2016 Q1, was purportedly affected by the new GST (Goods and Services Tax) regime, drawing down inventories before the implementation of law in July 2017. Effects of demonetisation four months after its implementation in November 2016 may still linger, but tracing the impact is difficult. The services sector, which accounts for a large share of informal cash-dependent activities, grew 8.7% in 2017 Q1, a little slower than the 9.0% growth in 2016 Q1.
In 2017, growth is anticipated to drop to 6.6% from 7.1% in 2016. Consumer confidence as of September 2017 (RBI Current Situation Index) has deteriorated vis-à-vis the same period the previous year and even the previous quarter (Figure 1.16). Since July 2017, YOY change in the reading of manufacturing and services PMI through September 2017 have weakened from a year earlier (Figure 1.17). This is mirrored by the contraction in YOY growth of exports of manufactures (nominal) from July to August 2017. Although still higher than last year, YTD YOY growth of total commodity export has been on a downtrend since April 2017. Furthermore, with the deficit already at 96.1% of the target just four months into the fiscal year, government spending growth cannot deviate much from revenue growth unless targets are revised. The reduction in the benchmark repurchase rate in September, from 6.25% to 6%, may help spur investment and private consumption to counter the growth dampeners. The infrastructure index in August 2017 has likewise picked up since June 2017, mainly through public capital outlays, although it is lower than last year. An additional boost could come from a new round of fiscal stimulus recently put forward, reportedly amounting to about USD 7.7 billion (about 0.3% of GDP), mainly in the form of capital injections into banks with high gross non-performing assets (GNPAs) and support mechanisms to the export sector as well as to micro, small and medium enterprises.
Figure 1.16. Consumer confidence indices in China and India
0
20
40
60
80
100
120
2016
Q1
2016
Q2
2016
Q3
2016
Q4
2017
Q1
2017
Q2
2017
Q3
FY 2
016-
17 Q
1
FY 2
016-
17 Q
2
FY 2
016-
17 Q
3
FY 2
016-
17 Q
4
FY 2
017-
18 Q
1
FY 2
017-
18 Q
2
China India
Note: All indices are adjusted to set 100 as neutral confidence point.Source: OECD Development Centre calculations based on CEIC and national sources.12 xxxxx
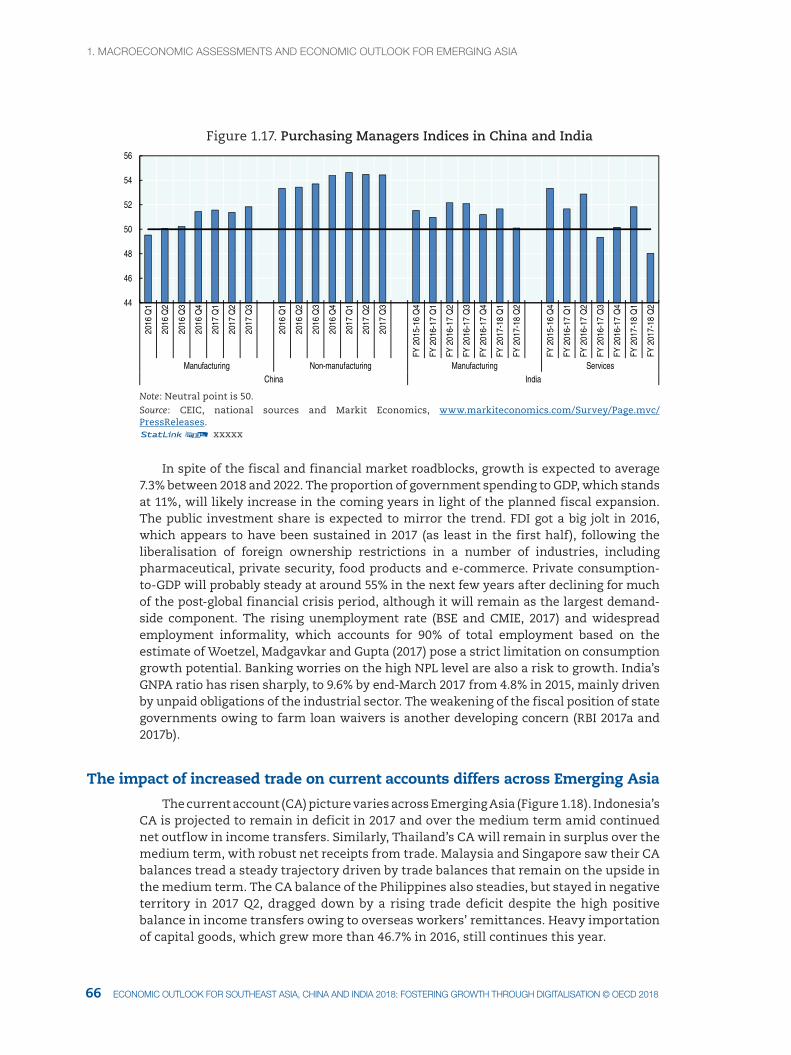
1. MacrOecONOMIc aSSeSSMeNtS aNd ecONOMIc OUtlOOK fOr eMergINg aSIa
6766 ecONOMIc OUtlOOK fOr SOUtHeaSt aSIa, cHINa aNd INdIa 2018: fOSterINg grOWtH tHrOUgH dIgItalISatION © Oecd 2018 ecONOMIc OUtlOOK fOr SOUtHeaSt aSIa, cHINa aNd INdIa 2018: fOSterINg grOWtH tHrOUgH dIgItalISatION © Oecd 2018
Figure 1.17. Purchasing Managers Indices in China and India
44
46
48
50
52
54
5620
16 Q
1
2016
Q2
2016
Q3
2016
Q4
2017
Q1
2017
Q2
2017
Q3
2016
Q1
2016
Q2
2016
Q3
2016
Q4
2017
Q1
2017
Q2
2017
Q3
FY 2
015-
16 Q
4
FY 2
016-
17 Q
1
FY 2
016-
17 Q
2
FY 2
016-
17 Q
3
FY 2
016-
17 Q
4
FY 2
017-
18 Q
1
FY 2
017-
18 Q
2
FY 2
015-
16 Q
4
FY 2
016-
17 Q
1
FY 2
016-
17 Q
2
FY 2
016-
17 Q
3
FY 2
016-
17 Q
4
FY 2
017-
18 Q
1
FY 2
017-
18 Q
2
Manufacturing Non-manufacturing Manufacturing ServicesChina India
Note: Neutral point is 50.Source: CEIC, national sources and Markit Economics, www.markiteconomics.com/Survey/Page.mvc/PressReleases.12 xxxxx
In spite of the fiscal and financial market roadblocks, growth is expected to average 7.3% between 2018 and 2022. The proportion of government spending to GDP, which stands at 11%, will likely increase in the coming years in light of the planned fiscal expansion. The public investment share is expected to mirror the trend. FDI got a big jolt in 2016, which appears to have been sustained in 2017 (as least in the first half), following the liberalisation of foreign ownership restrictions in a number of industries, including pharmaceutical, private security, food products and e-commerce. Private consumption-to-GDP will probably steady at around 55% in the next few years after declining for much of the post-global financial crisis period, although it will remain as the largest demand-side component. The rising unemployment rate (BSE and CMIE, 2017) and widespread employment informality, which accounts for 90% of total employment based on the estimate of Woetzel, Madgavkar and Gupta (2017) pose a strict limitation on consumption growth potential. Banking worries on the high NPL level are also a risk to growth. India’s GNPA ratio has risen sharply, to 9.6% by end-March 2017 from 4.8% in 2015, mainly driven by unpaid obligations of the industrial sector. The weakening of the fiscal position of state governments owing to farm loan waivers is another developing concern (RBI 2017a and 2017b).
The impact of increased trade on current accounts differs across Emerging Asia
The current account (CA) picture varies across Emerging Asia (Figure 1.18). Indonesia’s CA is projected to remain in deficit in 2017 and over the medium term amid continued net outflow in income transfers. Similarly, Thailand’s CA will remain in surplus over the medium term, with robust net receipts from trade. Malaysia and Singapore saw their CA balances tread a steady trajectory driven by trade balances that remain on the upside in the medium term. The CA balance of the Philippines also steadies, but stayed in negative territory in 2017 Q2, dragged down by a rising trade deficit despite the high positive balance in income transfers owing to overseas workers’ remittances. Heavy importation of capital goods, which grew more than 46.7% in 2016, still continues this year.
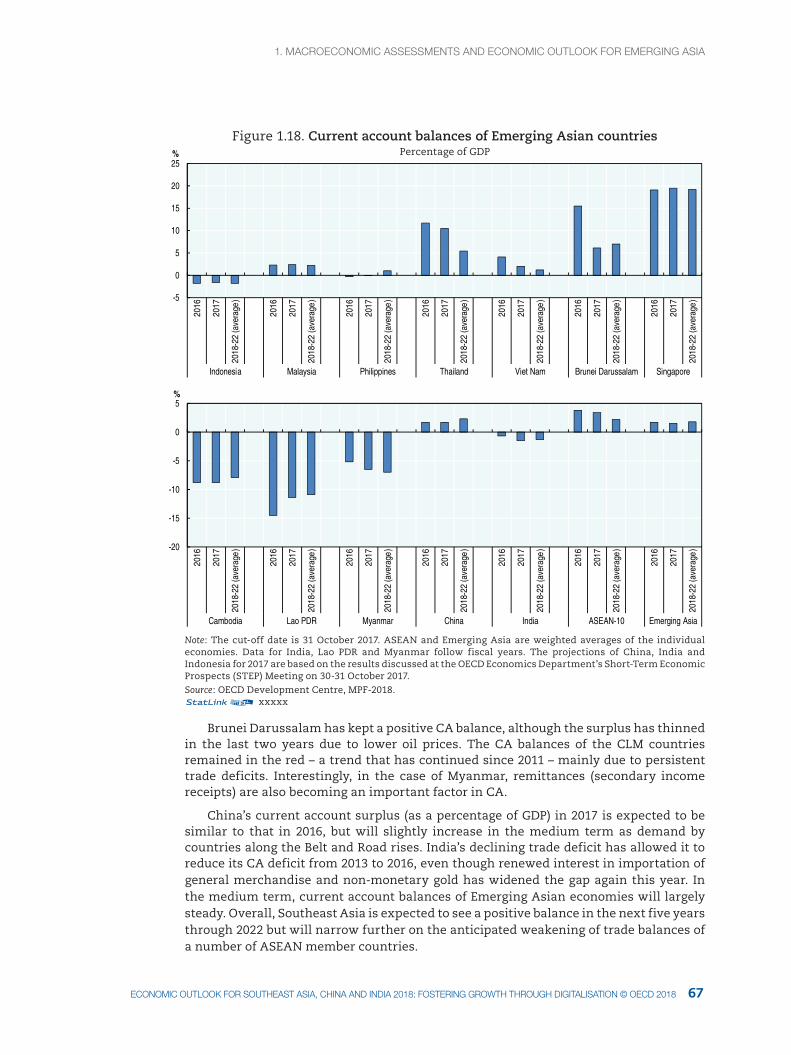
1. MacrOecONOMIc aSSeSSMeNtS aNd ecONOMIc OUtlOOK fOr eMergINg aSIa1. MacrOecONOMIc aSSeSSMeNtS aNd ecONOMIc OUtlOOK fOr eMergINg aSIa
67ecONOMIc OUtlOOK fOr SOUtHeaSt aSIa, cHINa aNd INdIa 2018: fOSterINg grOWtH tHrOUgH dIgItalISatION © Oecd 2018
Figure 1.18. Current account balances of Emerging Asian countriesPercentage of GDP
-5
0
5
10
15
20
25
2016
2017
2018
-22
(ave
rage
)
2016
2017
2018
-22
(ave
rage
)
2016
2017
2018
-22
(ave
rage
)
2016
2017
2018
-22
(ave
rage
)
2016
2017
2018
-22
(ave
rage
)
2016
2017
2018
-22
(ave
rage
)
2016
2017
2018
-22
(ave
rage
)
Indonesia Malaysia Philippines Thailand Viet Nam Brunei Darussalam Singapore
%
-20
-15
-10
-5
0
5
2016
2017
2018
-22
(ave
rage
)
2016
2017
2018
-22
(ave
rage
)
2016
2017
2018
-22
(ave
rage
)
2016
2017
2018
-22
(ave
rage
)
2016
2017
2018
-22
(ave
rage
)
2016
2017
2018
-22
(ave
rage
)
2016
2017
2018
-22
(ave
rage
)
Cambodia Lao PDR Myanmar China India ASEAN-10 Emerging Asia
%
Note: The cut-off date is 31 October 2017. ASEAN and Emerging Asia are weighted averages of the individual economies. Data for India, Lao PDR and Myanmar follow fiscal years. The projections of China, India and Indonesia for 2017 are based on the results discussed at the OECD Economics Department’s Short-Term Economic Prospects (STEP) Meeting on 30-31 October 2017.Source: OECD Development Centre, MPF-2018.12 xxxxx
Brunei Darussalam has kept a positive CA balance, although the surplus has thinned in the last two years due to lower oil prices. The CA balances of the CLM countries remained in the red – a trend that has continued since 2011 – mainly due to persistent trade deficits. Interestingly, in the case of Myanmar, remittances (secondary income receipts) are also becoming an important factor in CA.
China’s current account surplus (as a percentage of GDP) in 2017 is expected to be similar to that in 2016, but will slightly increase in the medium term as demand by countries along the Belt and Road rises. India’s declining trade deficit has allowed it to reduce its CA deficit from 2013 to 2016, even though renewed interest in importation of general merchandise and non-monetary gold has widened the gap again this year. In the medium term, current account balances of Emerging Asian economies will largely steady. Overall, Southeast Asia is expected to see a positive balance in the next five years through 2022 but will narrow further on the anticipated weakening of trade balances of a number of ASEAN member countries.
1. MacrOecONOMIc aSSeSSMeNtS aNd ecONOMIc OUtlOOK fOr eMergINg aSIa
6968 ecONOMIc OUtlOOK fOr SOUtHeaSt aSIa, cHINa aNd INdIa 2018: fOSterINg grOWtH tHrOUgH dIgItalISatION © Oecd 2018 ecONOMIc OUtlOOK fOr SOUtHeaSt aSIa, cHINa aNd INdIa 2018: fOSterINg grOWtH tHrOUgH dIgItalISatION © Oecd 2018
Net FDI trends in Emerging Asia remain generally encouraging
Net FDI inflows to Emerging Asia have remained largely on the upswing in recent years (Figure 1.19). Factors keeping investors interested in the region include the recovery of trade, the announcement of big ticket infrastructure projects, the resilience of domestic demand and the aggressive drive of some governments to develop industries related to information technology and e-commerce through investment incentives. In Malaysia, manufacturing, mining and financial services have received the bulk of the offshore capital. In the Philippines, 80.8% of net capital inflows from January 2016 to June 2017 were placed in debt (71.1%) or reinvested (9.7%); both have no breakdown by industry. Capital purchasing equity (19.2%) largely went to finance and the insurance industry. Net FDI in Viet Nam – which has steadily grown since 2011, driven mainly by inflows from Japan and Korea – has been primarily directed to manufacturing, power production, and wholesale and retail trade. In September 2017, the government substantially reduced conditions imposed on business and investment in terms of administrative and inspection procedures, in hope of improving the business climate. Net FDI inflows in Singapore have been steady in the last four years, with commitments from the United States and Europe holding up firmly, mainly benefitting the electronics, chemical production and services subsectors.
Net FDI inflows in the CLM countries have stayed on solid footing, supported by the sustained interest of investors from China, presumably in line with the One Belt, One Road Initiative. The improvement in the competitiveness of these countries has also been notable, especially in terms of institutional factors and market efficiency. Foreign capital in these countries largely went to manufacturing, agriculture, power and financial services. India’s net FDI inflows have likewise increased significantly since 2012. Greenfield projects and opportunities for mergers and acquisitions have attracted a number of the deals. The FDI policy for 2017 indicates continued easing of market access restrictions. For instance, manufacturing for retail trading including e-commerce (subject to government approval) has been fully liberalised. Investment in civil aviation through the automatic route has also been fully opened from a previous threshold of 74%, and the government has streamlined approval procedures and simplified the bankruptcy code.
In China, the slide in net FDI inflows appears to be easing as financial market risks ebb. The launching of new free trade zones could also ignite renewed investor interest. Net FDI in Indonesia regained some momentum in 2017 H1 after dropping sharply in 2016 Q4, partly due to the US election and domestic political uncertainties. The same can be said of Thailand, which experienced an outflow episode in 2016 Q3; net inflow has since recovered. Brunei Darussalam saw withdrawals outmatch placements in 2016 owing to oil price concerns. The government has since announced a number of projects in various areas, including halal food production, oil and gas downstream sectors and agriculture, in an effort to reverse the declining net FDI inflow trend and to reduce its economic reliance on the energy sector.
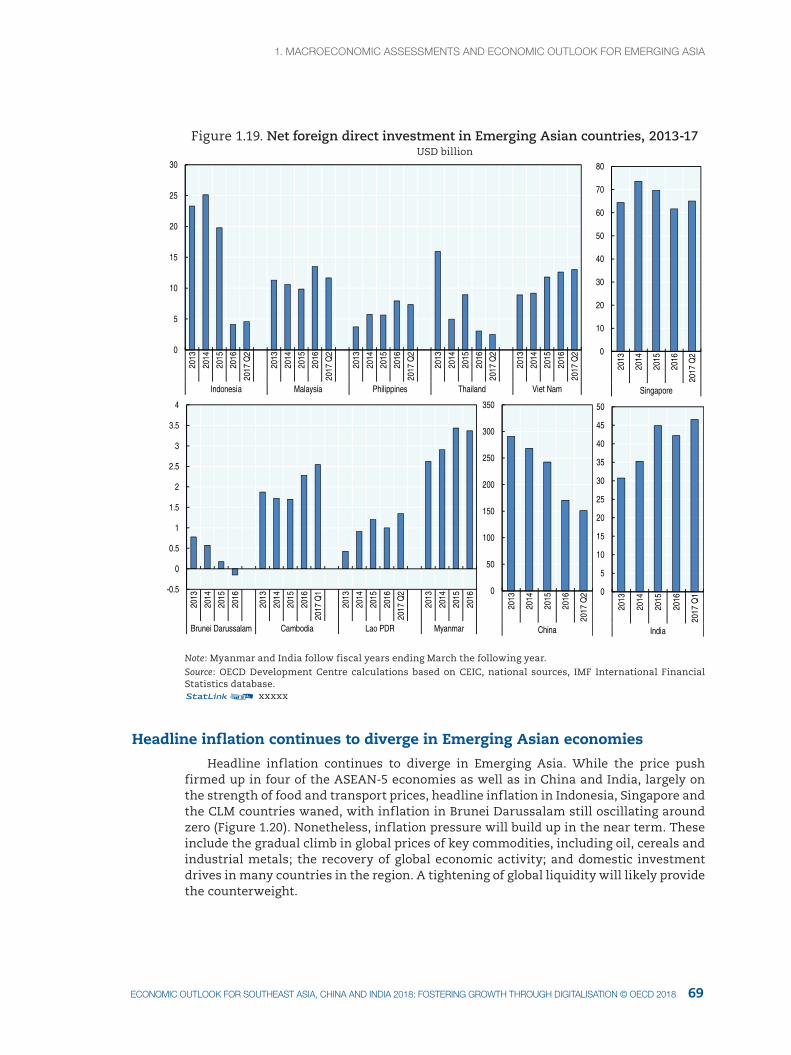
1. MacrOecONOMIc aSSeSSMeNtS aNd ecONOMIc OUtlOOK fOr eMergINg aSIa1. MacrOecONOMIc aSSeSSMeNtS aNd ecONOMIc OUtlOOK fOr eMergINg aSIa
69ecONOMIc OUtlOOK fOr SOUtHeaSt aSIa, cHINa aNd INdIa 2018: fOSterINg grOWtH tHrOUgH dIgItalISatION © Oecd 2018
Figure 1.19. Net foreign direct investment in Emerging Asian countries, 2013-17 USD billion
0
10
20
30
40
50
60
70
80
2013
2014
2015
2016
2017
Q2
Singapore
0
5
10
15
20
25
30
2013
2014
2015
2016
2017
Q2
2013
2014
2015
2016
2017
Q2
2013
2014
2015
2016
2017
Q2
2013
2014
2015
2016
2017
Q2
2013
2014
2015
2016
2017
Q2
Indonesia Malaysia Philippines Thailand Viet Nam
-0.5
0
0.5
1
1.5
2
2.5
3
3.5
4
2013
2014
2015
2016
2013
2014
2015
2016
2017
Q1
2013
2014
2015
2016
2017
Q2
2013
2014
2015
2016
Brunei Darussalam Cambodia Lao PDR Myanmar
0
50
100
150
200
250
300
350
2013
2014
2015
2016
2017
Q2
China
0
5
10
15
20
25
30
35
40
45
50
2013
2014
2015
2016
2017
Q1
India
Note: Myanmar and India follow fiscal years ending March the following year.Source: OECD Development Centre calculations based on CEIC, national sources, IMF International Financial Statistics database.12 xxxxx
Headline inflation continues to diverge in Emerging Asian economies
Headline inflation continues to diverge in Emerging Asia. While the price push firmed up in four of the ASEAN-5 economies as well as in China and India, largely on the strength of food and transport prices, headline inflation in Indonesia, Singapore and the CLM countries waned, with inflation in Brunei Darussalam still oscillating around zero (Figure 1.20). Nonetheless, inflation pressure will build up in the near term. These include the gradual climb in global prices of key commodities, including oil, cereals and industrial metals; the recovery of global economic activity; and domestic investment drives in many countries in the region. A tightening of global liquidity will likely provide the counterweight.
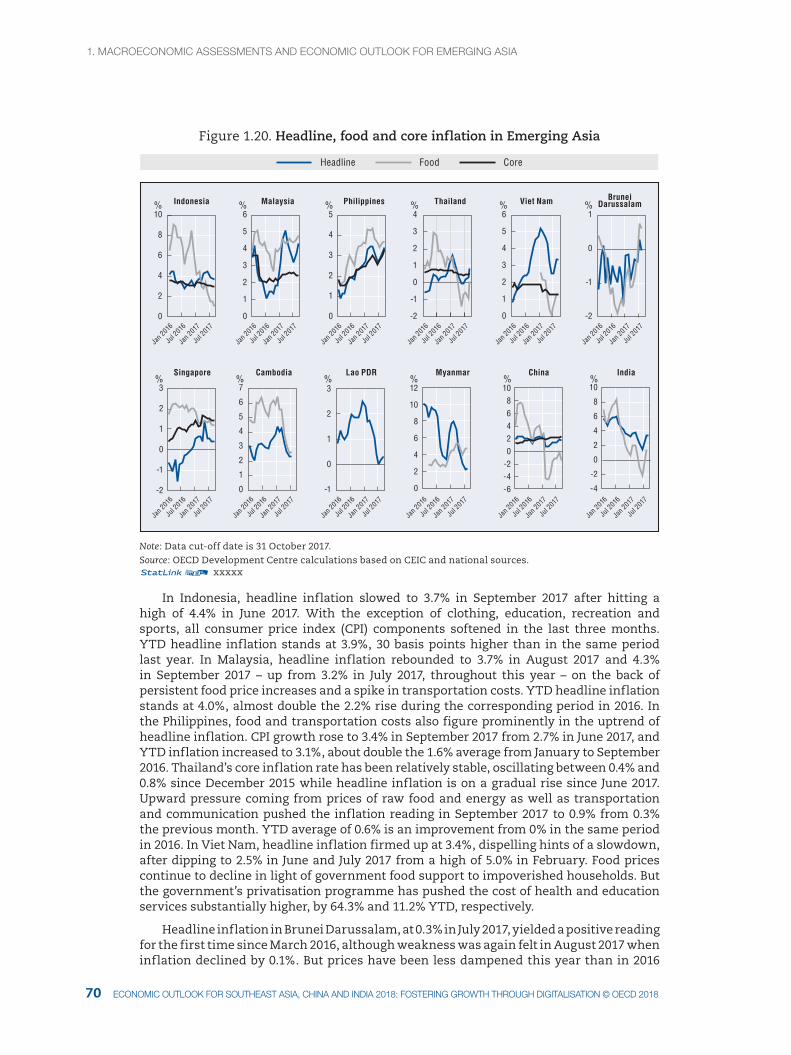
1. MacrOecONOMIc aSSeSSMeNtS aNd ecONOMIc OUtlOOK fOr eMergINg aSIa
7170 ecONOMIc OUtlOOK fOr SOUtHeaSt aSIa, cHINa aNd INdIa 2018: fOSterINg grOWtH tHrOUgH dIgItalISatION © Oecd 2018 ecONOMIc OUtlOOK fOr SOUtHeaSt aSIa, cHINa aNd INdIa 2018: fOSterINg grOWtH tHrOUgH dIgItalISatION © Oecd 2018
Figure 1.20. Headline, food and core inflation in Emerging Asia
0
2
4
6
8
10
0
1
2
3
4
5
6
0
1
2
3
4
5
-2
-1
0
1
2
3
4
0
1
2
3
4
5
6
-2
-1
0
1
-2
-1
0
1
2
3
0
1
2
3
4
5
6
7
-1
0
1
2
3
0
2
4
6
8
10
12
-6
-4
-2
0
2
4
6
8
10
-4
-2
0
2
4
6
8
10
Jan 2
016
Jul 2
016
Jan 2
017
Jul 2
017
Jan 2
016
Jul 2
016
Jan 2
017
Jul 2
017
Jan 2
016
Jul 2
016
Jan 2
017
Jul 2
017
Jan 2
016
Jul 2
016
Jan 2
017
Jul 2
017
Jan 2
016
Jul 2
016
Jan 2
017
Jul 2
017
Jan 2
016
Jul 2
016
Jan 2
017
Jul 2
017
Jan 2
016
Jul 2
016
Jan 2
017
Jul 2
017
Jan 2
016
Jul 2
016
Jan 2
017
Jul 2
017
Jan 2
016
Jul 2
016
Jan 2
017
Jul 2
017
Jan 2
016
Jul 2
016
Jan 2
017
Jul 2
017
Jan 2
016
Jul 2
016
Jan 2
017
Jul 2
017
Jan 2
016
Jul 2
016
Jan 2
017
Jul 2
017
Headline Food Core
Indonesia Philippines Thailand Viet Nam BruneiDarussalam
IndiaChinaMyanmarLao PDRCambodiaSingapore
Malaysia%
% % % % % %
% % % % %
Note: Data cut-off date is 31 October 2017.Source: OECD Development Centre calculations based on CEIC and national sources.12 xxxxx
In Indonesia, headline inflation slowed to 3.7% in September 2017 after hitting a high of 4.4% in June 2017. With the exception of clothing, education, recreation and sports, all consumer price index (CPI) components softened in the last three months. YTD headline inflation stands at 3.9%, 30 basis points higher than in the same period last year. In Malaysia, headline inflation rebounded to 3.7% in August 2017 and 4.3% in September 2017 – up from 3.2% in July 2017, throughout this year – on the back of persistent food price increases and a spike in transportation costs. YTD headline inflation stands at 4.0%, almost double the 2.2% rise during the corresponding period in 2016. In the Philippines, food and transportation costs also figure prominently in the uptrend of headline inflation. CPI growth rose to 3.4% in September 2017 from 2.7% in June 2017, and YTD inflation increased to 3.1%, about double the 1.6% average from January to September 2016. Thailand’s core inflation rate has been relatively stable, oscillating between 0.4% and 0.8% since December 2015 while headline inflation is on a gradual rise since June 2017. Upward pressure coming from prices of raw food and energy as well as transportation and communication pushed the inflation reading in September 2017 to 0.9% from 0.3% the previous month. YTD average of 0.6% is an improvement from 0% in the same period in 2016. In Viet Nam, headline inflation firmed up at 3.4%, dispelling hints of a slowdown, after dipping to 2.5% in June and July 2017 from a high of 5.0% in February. Food prices continue to decline in light of government food support to impoverished households. But the government’s privatisation programme has pushed the cost of health and education services substantially higher, by 64.3% and 11.2% YTD, respectively.
Headline inflation in Brunei Darussalam, at 0.3% in July 2017, yielded a positive reading for the first time since March 2016, although weakness was again felt in August 2017 when inflation declined by 0.1%. But prices have been less dampened this year than in 2016
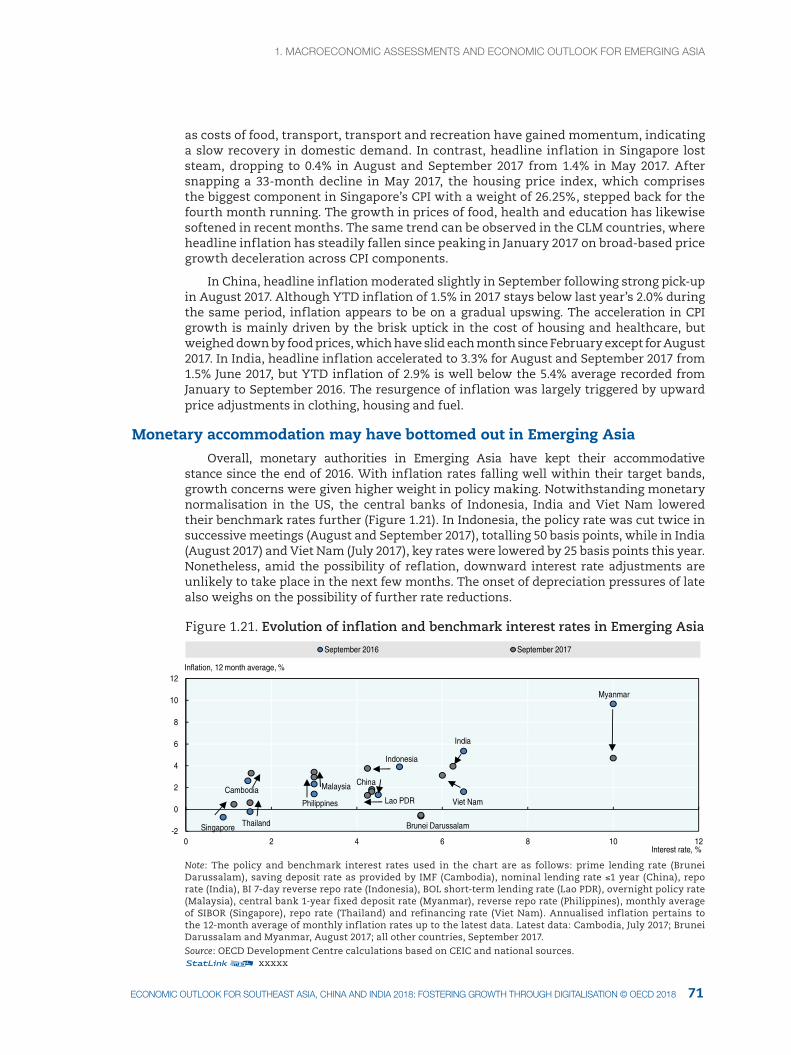
1. MacrOecONOMIc aSSeSSMeNtS aNd ecONOMIc OUtlOOK fOr eMergINg aSIa1. MacrOecONOMIc aSSeSSMeNtS aNd ecONOMIc OUtlOOK fOr eMergINg aSIa
71ecONOMIc OUtlOOK fOr SOUtHeaSt aSIa, cHINa aNd INdIa 2018: fOSterINg grOWtH tHrOUgH dIgItalISatION © Oecd 2018
as costs of food, transport, transport and recreation have gained momentum, indicating a slow recovery in domestic demand. In contrast, headline inflation in Singapore lost steam, dropping to 0.4% in August and September 2017 from 1.4% in May 2017. After snapping a 33-month decline in May 2017, the housing price index, which comprises the biggest component in Singapore’s CPI with a weight of 26.25%, stepped back for the fourth month running. The growth in prices of food, health and education has likewise softened in recent months. The same trend can be observed in the CLM countries, where headline inflation has steadily fallen since peaking in January 2017 on broad-based price growth deceleration across CPI components.
In China, headline inflation moderated slightly in September following strong pick-up in August 2017. Although YTD inflation of 1.5% in 2017 stays below last year’s 2.0% during the same period, inflation appears to be on a gradual upswing. The acceleration in CPI growth is mainly driven by the brisk uptick in the cost of housing and healthcare, but weighed down by food prices, which have slid each month since February except for August 2017. In India, headline inflation accelerated to 3.3% for August and September 2017 from 1.5% June 2017, but YTD inflation of 2.9% is well below the 5.4% average recorded from January to September 2016. The resurgence of inflation was largely triggered by upward price adjustments in clothing, housing and fuel.
Monetary accommodation may have bottomed out in Emerging Asia
Overall, monetary authorities in Emerging Asia have kept their accommodative stance since the end of 2016. With inflation rates falling well within their target bands, growth concerns were given higher weight in policy making. Notwithstanding monetary normalisation in the US, the central banks of Indonesia, India and Viet Nam lowered their benchmark rates further (Figure 1.21). In Indonesia, the policy rate was cut twice in successive meetings (August and September 2017), totalling 50 basis points, while in India (August 2017) and Viet Nam (July 2017), key rates were lowered by 25 basis points this year. Nonetheless, amid the possibility of reflation, downward interest rate adjustments are unlikely to take place in the next few months. The onset of depreciation pressures of late also weighs on the possibility of further rate reductions.
Figure 1.21. Evolution of inflation and benchmark interest rates in Emerging Asia
-2
0
2
4
6
8
10
12
0 2 4 6 8 10 12Interest rate, %
September 2016 September 2017
Myanmar
India
Viet Nam
Brunei Darussalam
Indonesia
China
Lao PDRPhilippines
MalaysiaCambodia
ThailandSingapore
Inflation, 12 month average, %
Note: The policy and benchmark interest rates used in the chart are as follows: prime lending rate (Brunei Darussalam), saving deposit rate as provided by IMF (Cambodia), nominal lending rate ≤1 year (China), repo rate (India), BI 7-day reverse repo rate (Indonesia), BOL short-term lending rate (Lao PDR), overnight policy rate (Malaysia), central bank 1-year fixed deposit rate (Myanmar), reverse repo rate (Philippines), monthly average of SIBOR (Singapore), repo rate (Thailand) and refinancing rate (Viet Nam). Annualised inflation pertains to the 12-month average of monthly inflation rates up to the latest data. Latest data: Cambodia, July 2017; Brunei Darussalam and Myanmar, August 2017; all other countries, September 2017.Source: OECD Development Centre calculations based on CEIC and national sources.12 xxxxx
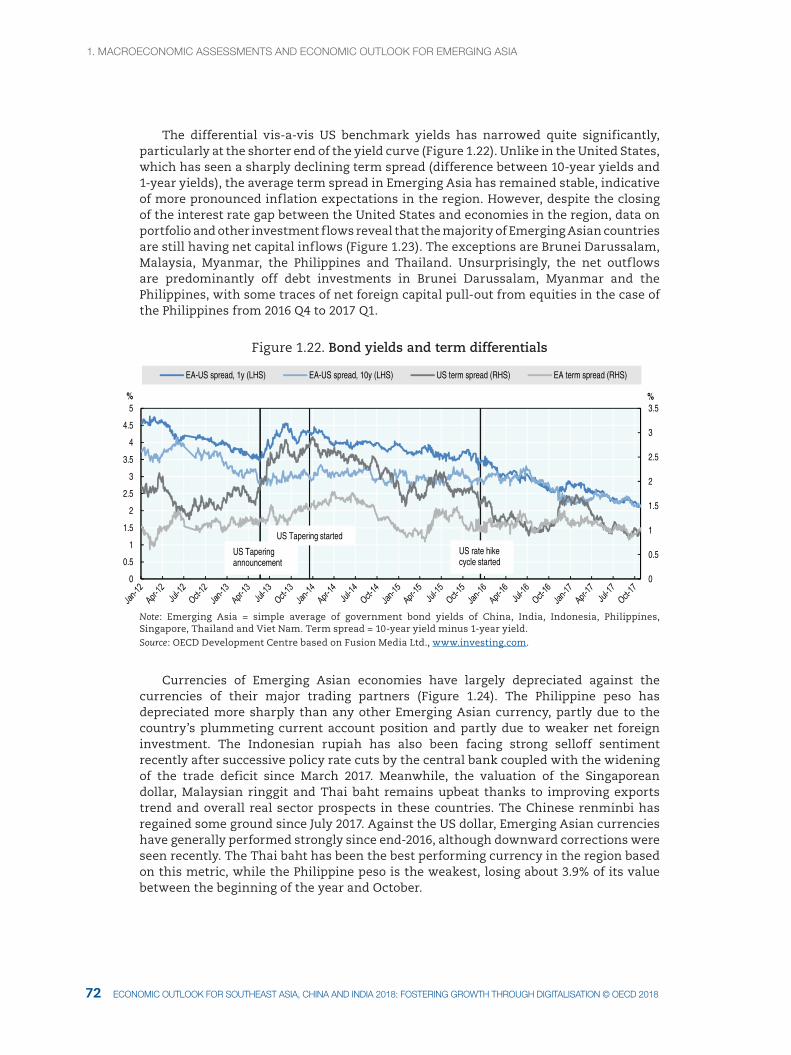
1. MacrOecONOMIc aSSeSSMeNtS aNd ecONOMIc OUtlOOK fOr eMergINg aSIa
7372 ecONOMIc OUtlOOK fOr SOUtHeaSt aSIa, cHINa aNd INdIa 2018: fOSterINg grOWtH tHrOUgH dIgItalISatION © Oecd 2018 ecONOMIc OUtlOOK fOr SOUtHeaSt aSIa, cHINa aNd INdIa 2018: fOSterINg grOWtH tHrOUgH dIgItalISatION © Oecd 2018
The differential vis-a-vis US benchmark yields has narrowed quite significantly, particularly at the shorter end of the yield curve (Figure 1.22). Unlike in the United States, which has seen a sharply declining term spread (difference between 10-year yields and 1-year yields), the average term spread in Emerging Asia has remained stable, indicative of more pronounced inflation expectations in the region. However, despite the closing of the interest rate gap between the United States and economies in the region, data on portfolio and other investment flows reveal that the majority of Emerging Asian countries are still having net capital inflows (Figure 1.23). The exceptions are Brunei Darussalam, Malaysia, Myanmar, the Philippines and Thailand. Unsurprisingly, the net outflows are predominantly off debt investments in Brunei Darussalam, Myanmar and the Philippines, with some traces of net foreign capital pull-out from equities in the case of the Philippines from 2016 Q4 to 2017 Q1.
Figure 1.22. Bond yields and term differentials
0
0.5
1
1.5
2
2.5
3
3.5
0
0.5
1
1.5
2
2.5
3
3.5
4
4.5
5%%
EA-US spread, 1y (LHS) EA-US spread, 10y (LHS) US term spread (RHS) EA term spread (RHS)
US Tapering announcement
US Tapering started
US rate hike cycle started
Note: Emerging Asia = simple average of government bond yields of China, India, Indonesia, Philippines, Singapore, Thailand and Viet Nam. Term spread = 10-year yield minus 1-year yield.Source: OECD Development Centre based on Fusion Media Ltd., www.investing.com.
Currencies of Emerging Asian economies have largely depreciated against the currencies of their major trading partners (Figure 1.24). The Philippine peso has depreciated more sharply than any other Emerging Asian currency, partly due to the country’s plummeting current account position and partly due to weaker net foreign investment. The Indonesian rupiah has also been facing strong selloff sentiment recently after successive policy rate cuts by the central bank coupled with the widening of the trade deficit since March 2017. Meanwhile, the valuation of the Singaporean dollar, Malaysian ringgit and Thai baht remains upbeat thanks to improving exports trend and overall real sector prospects in these countries. The Chinese renminbi has regained some ground since July 2017. Against the US dollar, Emerging Asian currencies have generally performed strongly since end-2016, although downward corrections were seen recently. The Thai baht has been the best performing currency in the region based on this metric, while the Philippine peso is the weakest, losing about 3.9% of its value between the beginning of the year and October.
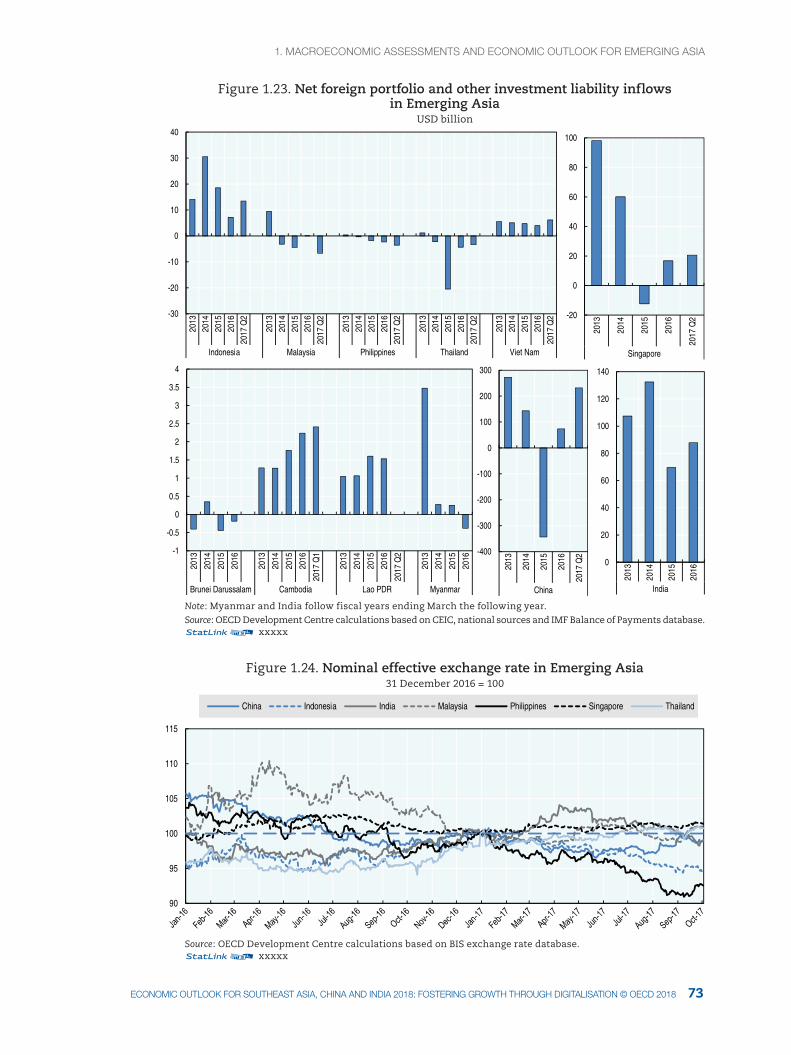
1. MacrOecONOMIc aSSeSSMeNtS aNd ecONOMIc OUtlOOK fOr eMergINg aSIa1. MacrOecONOMIc aSSeSSMeNtS aNd ecONOMIc OUtlOOK fOr eMergINg aSIa
73ecONOMIc OUtlOOK fOr SOUtHeaSt aSIa, cHINa aNd INdIa 2018: fOSterINg grOWtH tHrOUgH dIgItalISatION © Oecd 2018
Figure 1.23. Net foreign portfolio and other investment liability inflows in Emerging Asia
USD billion
-20
0
20
40
60
80
100
2013
2014
2015
2016
2017
Q2
Singapore
-30
-20
-10
0
10
20
30
40
2013
2014
2015
2016
2017
Q2
2013
2014
2015
2016
2017
Q2
2013
2014
2015
2016
2017
Q2
2013
2014
2015
2016
2017
Q2
2013
2014
2015
2016
2017
Q2
Indonesia Malaysia Philippines Thailand Viet Nam
-1
-0.5
0
0.5
1
1.5
2
2.5
3
3.5
4
2013
2014
2015
2016
2013
2014
2015
2016
2017
Q1
2013
2014
2015
2016
2017
Q2
2013
2014
2015
2016
Brunei Darussalam Cambodia Lao PDR Myanmar
-400
-300
-200
-100
0
100
200
300
2013
2014
2015
2016
2017
Q2
China
0
20
40
60
80
100
120
140
2013
2014
2015
2016
India
Note: Myanmar and India follow fiscal years ending March the following year.Source: OECD Development Centre calculations based on CEIC, national sources and IMF Balance of Payments database.12 xxxxx
Figure 1.24. Nominal effective exchange rate in Emerging Asia 31 December 2016 = 100
90
95
100
105
110
115
China Indonesia India Malaysia Philippines Singapore Thailand
Source: OECD Development Centre calculations based on BIS exchange rate database.12 xxxxx
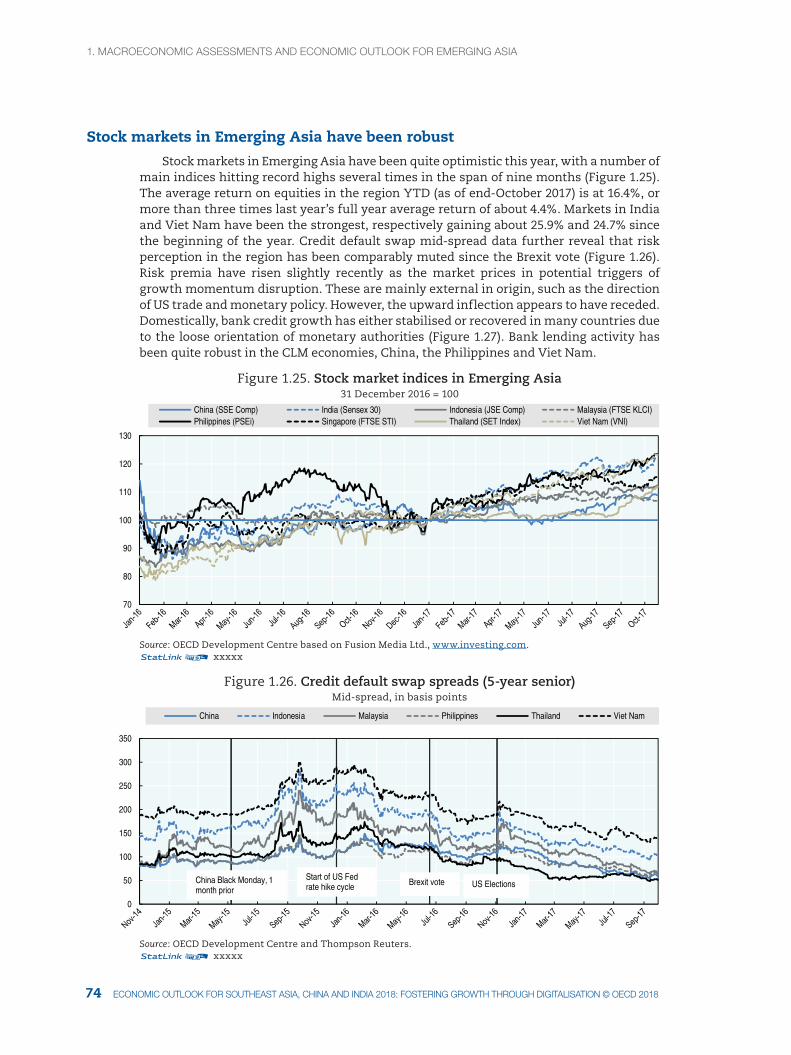
1. MacrOecONOMIc aSSeSSMeNtS aNd ecONOMIc OUtlOOK fOr eMergINg aSIa
7574 ecONOMIc OUtlOOK fOr SOUtHeaSt aSIa, cHINa aNd INdIa 2018: fOSterINg grOWtH tHrOUgH dIgItalISatION © Oecd 2018 ecONOMIc OUtlOOK fOr SOUtHeaSt aSIa, cHINa aNd INdIa 2018: fOSterINg grOWtH tHrOUgH dIgItalISatION © Oecd 2018
Stock markets in Emerging Asia have been robust
Stock markets in Emerging Asia have been quite optimistic this year, with a number of main indices hitting record highs several times in the span of nine months (Figure 1.25). The average return on equities in the region YTD (as of end-October 2017) is at 16.4%, or more than three times last year’s full year average return of about 4.4%. Markets in India and Viet Nam have been the strongest, respectively gaining about 25.9% and 24.7% since the beginning of the year. Credit default swap mid-spread data further reveal that risk perception in the region has been comparably muted since the Brexit vote (Figure 1.26). Risk premia have risen slightly recently as the market prices in potential triggers of growth momentum disruption. These are mainly external in origin, such as the direction of US trade and monetary policy. However, the upward inflection appears to have receded. Domestically, bank credit growth has either stabilised or recovered in many countries due to the loose orientation of monetary authorities (Figure 1.27). Bank lending activity has been quite robust in the CLM economies, China, the Philippines and Viet Nam.
Figure 1.25. Stock market indices in Emerging Asia 31 December 2016 = 100
70
80
90
100
110
120
130
China (SSE Comp) India (Sensex 30) Indonesia (JSE Comp) Malaysia (FTSE KLCI)Philippines (PSEi) Singapore (FTSE STI) Thailand (SET Index) Viet Nam (VNI)
Source: OECD Development Centre based on Fusion Media Ltd., www.investing.com.12 xxxxx
Figure 1.26. Credit default swap spreads (5-year senior)Mid-spread, in basis points
0
50
100
150
200
250
300
350
China Indonesia Malaysia Philippines Thailand Viet Nam
China Black Monday, 1 month prior
Start of US Fed rate hike cycle Brexit vote US Elections
Source: OECD Development Centre and Thompson Reuters.12 xxxxx
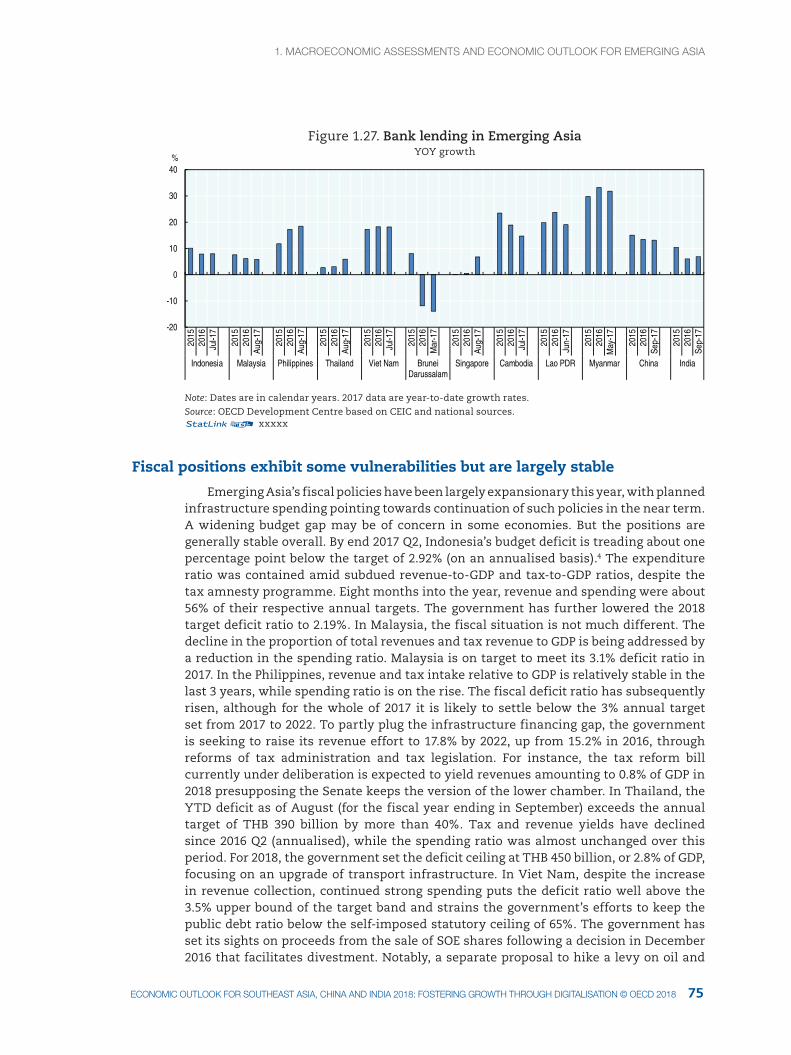
1. MacrOecONOMIc aSSeSSMeNtS aNd ecONOMIc OUtlOOK fOr eMergINg aSIa1. MacrOecONOMIc aSSeSSMeNtS aNd ecONOMIc OUtlOOK fOr eMergINg aSIa
75ecONOMIc OUtlOOK fOr SOUtHeaSt aSIa, cHINa aNd INdIa 2018: fOSterINg grOWtH tHrOUgH dIgItalISatION © Oecd 2018
Figure 1.27. Bank lending in Emerging AsiaYOY growth
-20
-10
0
10
20
30
40
2015
2016
Jul-1
7
2015
2016
Aug-
17
2015
2016
Aug-
17
2015
2016
Aug-
17
2015
2016
Jul-1
7
2015
2016
Mar
-17
2015
2016
Aug-
17
2015
2016
Jul-1
7
2015
2016
Jun-
17
2015
2016
May
-17
2015
2016
Sep-
17
2015
2016
Sep-
17
Indonesia Malaysia Philippines Thailand Viet Nam BruneiDarussalam
Singapore Cambodia Lao PDR Myanmar China India
%
Note: Dates are in calendar years. 2017 data are year-to-date growth rates.Source: OECD Development Centre based on CEIC and national sources.12 xxxxx
Fiscal positions exhibit some vulnerabilities but are largely stable
Emerging Asia’s fiscal policies have been largely expansionary this year, with planned infrastructure spending pointing towards continuation of such policies in the near term. A widening budget gap may be of concern in some economies. But the positions are generally stable overall. By end 2017 Q2, Indonesia’s budget deficit is treading about one percentage point below the target of 2.92% (on an annualised basis).4 The expenditure ratio was contained amid subdued revenue-to-GDP and tax-to-GDP ratios, despite the tax amnesty programme. Eight months into the year, revenue and spending were about 56% of their respective annual targets. The government has further lowered the 2018 target deficit ratio to 2.19%. In Malaysia, the fiscal situation is not much different. The decline in the proportion of total revenues and tax revenue to GDP is being addressed by a reduction in the spending ratio. Malaysia is on target to meet its 3.1% deficit ratio in 2017. In the Philippines, revenue and tax intake relative to GDP is relatively stable in the last 3 years, while spending ratio is on the rise. The fiscal deficit ratio has subsequently risen, although for the whole of 2017 it is likely to settle below the 3% annual target set from 2017 to 2022. To partly plug the infrastructure financing gap, the government is seeking to raise its revenue effort to 17.8% by 2022, up from 15.2% in 2016, through reforms of tax administration and tax legislation. For instance, the tax reform bill currently under deliberation is expected to yield revenues amounting to 0.8% of GDP in 2018 presupposing the Senate keeps the version of the lower chamber. In Thailand, the YTD deficit as of August (for the fiscal year ending in September) exceeds the annual target of THB 390 billion by more than 40%. Tax and revenue yields have declined since 2016 Q2 (annualised), while the spending ratio was almost unchanged over this period. For 2018, the government set the deficit ceiling at THB 450 billion, or 2.8% of GDP, focusing on an upgrade of transport infrastructure. In Viet Nam, despite the increase in revenue collection, continued strong spending puts the deficit ratio well above the 3.5% upper bound of the target band and strains the government’s efforts to keep the public debt ratio below the self-imposed statutory ceiling of 65%. The government has set its sights on proceeds from the sale of SOE shares following a decision in December 2016 that facilitates divestment. Notably, a separate proposal to hike a levy on oil and
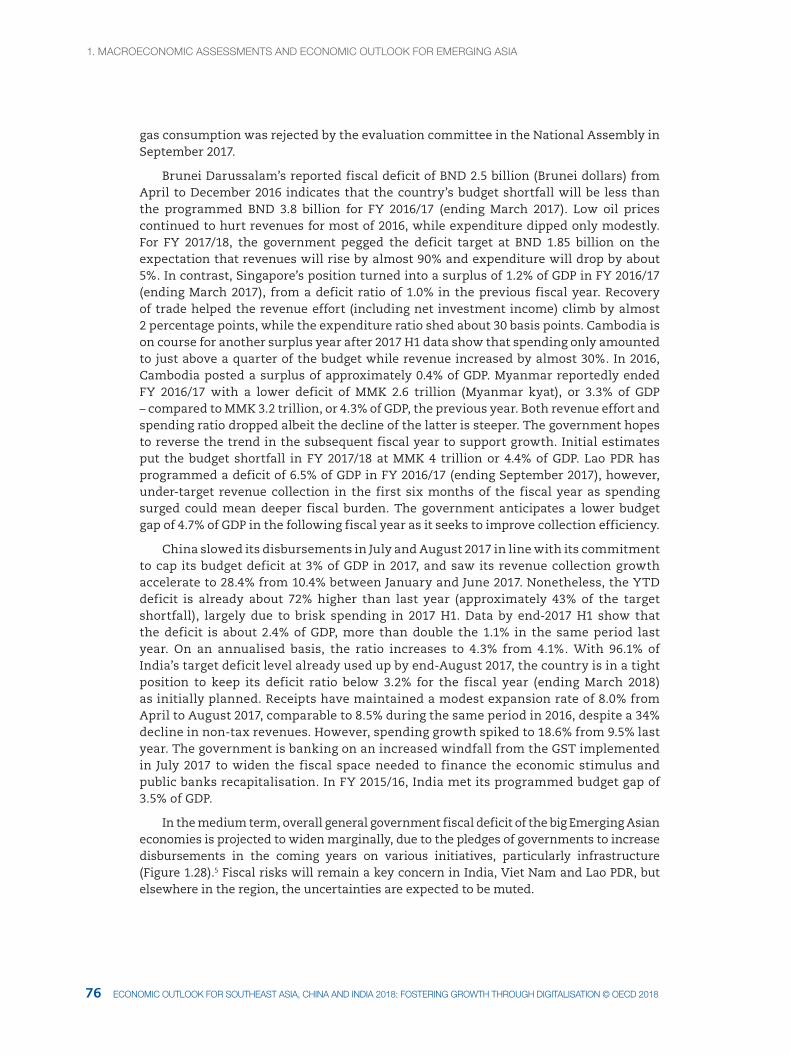
1. MacrOecONOMIc aSSeSSMeNtS aNd ecONOMIc OUtlOOK fOr eMergINg aSIa
7776 ecONOMIc OUtlOOK fOr SOUtHeaSt aSIa, cHINa aNd INdIa 2018: fOSterINg grOWtH tHrOUgH dIgItalISatION © Oecd 2018 ecONOMIc OUtlOOK fOr SOUtHeaSt aSIa, cHINa aNd INdIa 2018: fOSterINg grOWtH tHrOUgH dIgItalISatION © Oecd 2018
gas consumption was rejected by the evaluation committee in the National Assembly in September 2017.
Brunei Darussalam’s reported fiscal deficit of BND 2.5 billion (Brunei dollars) from April to December 2016 indicates that the country’s budget shortfall will be less than the programmed BND 3.8 billion for FY 2016/17 (ending March 2017). Low oil prices continued to hurt revenues for most of 2016, while expenditure dipped only modestly. For FY 2017/18, the government pegged the deficit target at BND 1.85 billion on the expectation that revenues will rise by almost 90% and expenditure will drop by about 5%. In contrast, Singapore’s position turned into a surplus of 1.2% of GDP in FY 2016/17 (ending March 2017), from a deficit ratio of 1.0% in the previous fiscal year. Recovery of trade helped the revenue effort (including net investment income) climb by almost 2 percentage points, while the expenditure ratio shed about 30 basis points. Cambodia is on course for another surplus year after 2017 H1 data show that spending only amounted to just above a quarter of the budget while revenue increased by almost 30%. In 2016, Cambodia posted a surplus of approximately 0.4% of GDP. Myanmar reportedly ended FY 2016/17 with a lower deficit of MMK 2.6 trillion (Myanmar kyat), or 3.3% of GDP – compared to MMK 3.2 trillion, or 4.3% of GDP, the previous year. Both revenue effort and spending ratio dropped albeit the decline of the latter is steeper. The government hopes to reverse the trend in the subsequent fiscal year to support growth. Initial estimates put the budget shortfall in FY 2017/18 at MMK 4 trillion or 4.4% of GDP. Lao PDR has programmed a deficit of 6.5% of GDP in FY 2016/17 (ending September 2017), however, under-target revenue collection in the first six months of the fiscal year as spending surged could mean deeper fiscal burden. The government anticipates a lower budget gap of 4.7% of GDP in the following fiscal year as it seeks to improve collection efficiency.
China slowed its disbursements in July and August 2017 in line with its commitment to cap its budget deficit at 3% of GDP in 2017, and saw its revenue collection growth accelerate to 28.4% from 10.4% between January and June 2017. Nonetheless, the YTD deficit is already about 72% higher than last year (approximately 43% of the target shortfall), largely due to brisk spending in 2017 H1. Data by end-2017 H1 show that the deficit is about 2.4% of GDP, more than double the 1.1% in the same period last year. On an annualised basis, the ratio increases to 4.3% from 4.1%. With 96.1% of India’s target deficit level already used up by end-August 2017, the country is in a tight position to keep its deficit ratio below 3.2% for the fiscal year (ending March 2018) as initially planned. Receipts have maintained a modest expansion rate of 8.0% from April to August 2017, comparable to 8.5% during the same period in 2016, despite a 34% decline in non-tax revenues. However, spending growth spiked to 18.6% from 9.5% last year. The government is banking on an increased windfall from the GST implemented in July 2017 to widen the fiscal space needed to finance the economic stimulus and public banks recapitalisation. In FY 2015/16, India met its programmed budget gap of 3.5% of GDP.
In the medium term, overall general government fiscal deficit of the big Emerging Asian economies is projected to widen marginally, due to the pledges of governments to increase disbursements in the coming years on various initiatives, particularly infrastructure (Figure 1.28).5 Fiscal risks will remain a key concern in India, Viet Nam and Lao PDR, but elsewhere in the region, the uncertainties are expected to be muted.
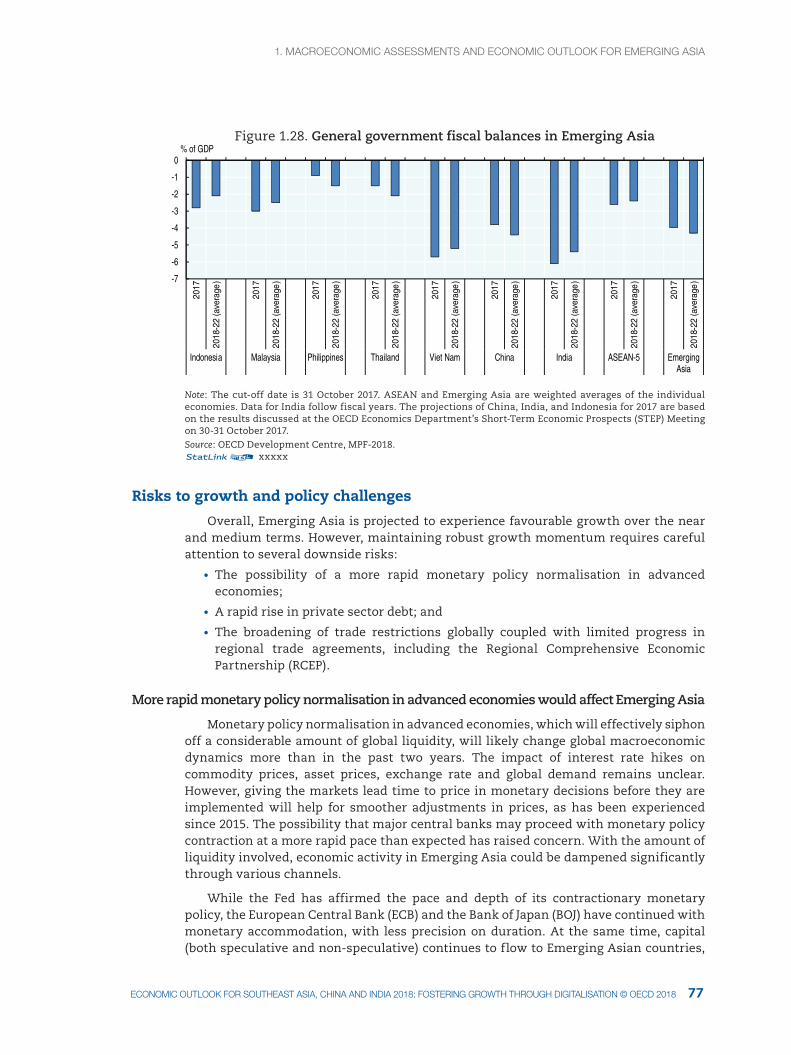
1. MacrOecONOMIc aSSeSSMeNtS aNd ecONOMIc OUtlOOK fOr eMergINg aSIa1. MacrOecONOMIc aSSeSSMeNtS aNd ecONOMIc OUtlOOK fOr eMergINg aSIa
77ecONOMIc OUtlOOK fOr SOUtHeaSt aSIa, cHINa aNd INdIa 2018: fOSterINg grOWtH tHrOUgH dIgItalISatION © Oecd 2018
Figure 1.28. General government fiscal balances in Emerging Asia
-7
-6
-5
-4
-3
-2
-1
0
2017
2018
-22
(ave
rage
)
2017
2018
-22
(ave
rage
)
2017
2018
-22
(ave
rage
)
2017
2018
-22
(ave
rage
)
2017
2018
-22
(ave
rage
)
2017
2018
-22
(ave
rage
)
2017
2018
-22
(ave
rage
)
2017
2018
-22
(ave
rage
)
2017
2018
-22
(ave
rage
)
Indonesia Malaysia Philippines Thailand Viet Nam China India ASEAN-5 EmergingAsia
% of GDP
Note: The cut-off date is 31 October 2017. ASEAN and Emerging Asia are weighted averages of the individual economies. Data for India follow fiscal years. The projections of China, India, and Indonesia for 2017 are based on the results discussed at the OECD Economics Department’s Short-Term Economic Prospects (STEP) Meeting on 30-31 October 2017.Source: OECD Development Centre, MPF-2018.12 xxxxx
Risks to growth and policy challenges
Overall, Emerging Asia is projected to experience favourable growth over the near and medium terms. However, maintaining robust growth momentum requires careful attention to several downside risks:
• The possibility of a more rapid monetary policy normalisation in advanced economies;
• A rapid rise in private sector debt; and
• The broadening of trade restrictions globally coupled with limited progress in regional trade agreements, including the Regional Comprehensive Economic Partnership (RCEP).
More rapid monetary policy normalisation in advanced economies would affect Emerging Asia
Monetary policy normalisation in advanced economies, which will effectively siphon off a considerable amount of global liquidity, will likely change global macroeconomic dynamics more than in the past two years. The impact of interest rate hikes on commodity prices, asset prices, exchange rate and global demand remains unclear. However, giving the markets lead time to price in monetary decisions before they are implemented will help for smoother adjustments in prices, as has been experienced since 2015. The possibility that major central banks may proceed with monetary policy contraction at a more rapid pace than expected has raised concern. With the amount of liquidity involved, economic activity in Emerging Asia could be dampened significantly through various channels.
While the Fed has affirmed the pace and depth of its contractionary monetary policy, the European Central Bank (ECB) and the Bank of Japan (BOJ) have continued with monetary accommodation, with less precision on duration. At the same time, capital (both speculative and non-speculative) continues to flow to Emerging Asian countries,
1. MacrOecONOMIc aSSeSSMeNtS aNd ecONOMIc OUtlOOK fOr eMergINg aSIa
7978 ecONOMIc OUtlOOK fOr SOUtHeaSt aSIa, cHINa aNd INdIa 2018: fOSterINg grOWtH tHrOUgH dIgItalISatION © Oecd 2018 ecONOMIc OUtlOOK fOr SOUtHeaSt aSIa, cHINa aNd INdIa 2018: fOSterINg grOWtH tHrOUgH dIgItalISatION © Oecd 2018
with debt markets largely tranquil, commodity markets building on budding price recovery and equity markets continuing to beat their historic highs with great regularity in the past months.
At least three channels have been identified through which monetary normalisation can soften Emerging Asia’s growth prospects. First, normalisation will likely lead to further narrowing of the interest rate differential, which can instigate capital outflow from Emerging Asian economies. Notwithstanding the narrowing interest rate differential, so far, the evidence of capital flow reversal in Emerging Asia is not clear. Currencies in the region are experiencing increasing depreciation pressures in recent months. The nominal effective exchange rates of a number of Emerging Asian currencies, and particularly the Philippine peso, have been on a depreciation trend since the start of the year. Inflationary pressures, however, have been relatively modest.
Second, monetary normalisation has the potential to expose some vulnerabilities in the corporate sector. The higher cost of borrowing will arguably not sit well with highly leveraged firms. Financial institutions, especially those already facing some asset quality issues (OECD, 2017), might also face difficulties as corporate solvency risks rise. As firms’ spending capacity gets constrained, domestic demand is likely to pull back.
Third, policies that aim to reduce liquidity in advanced economies can also dampen their own demand for imported goods, affecting trade. Imports coming from Emerging Asia can be affected directly and indirectly through global value chains.
The scale of Emerging Asia’s international reserves provides considerable insurance when it comes to capital flow risks. Moreover, generally stable macro fundamentals in Emerging Asia should help the region mitigate the effects of an increase in borrowing costs and trade frictions. Nonetheless, Emerging Asia should prepare for sudden and unexpected changes, particularly if the normalisation process proceeds more rapidly than expected. It also cannot discount negative spillovers within the region. Enhancing both national and regional co-ordination and surveillance is vital. Additionally, countries with prevailing vulnerabilities (those with issues concerning structural fiscal and external deficits, asset quality in the banking system and high household and corporate leverage) should persist with measures that aim to lower risk.
Private non-financial sector debt accumulation creates risks for growth
Private sector debt is another source of risk to Emerging Asia’s growth. As a proportion of GDP, private sector credit in many Asian economies is below that of advanced economies, although China; Hong Kong, China; and Singapore currently have ratios above the US and euro area average (Figure 1.29). Debt accumulation in the region was particularly rapid after the global financial crisis. Since 2010, China; Hong Kong, China; and Singapore have seen their debt ratios rise between 56 and 80 percentage points (Figure 1.30). Cambodia, Malaysia, Myanmar, the Philippines, Thailand and Viet Nam have also increased their non-financial sector debt ratios by an average of almost 20 percentage points in the same period – a rate that is faster than more than half of the economies in our sample.6
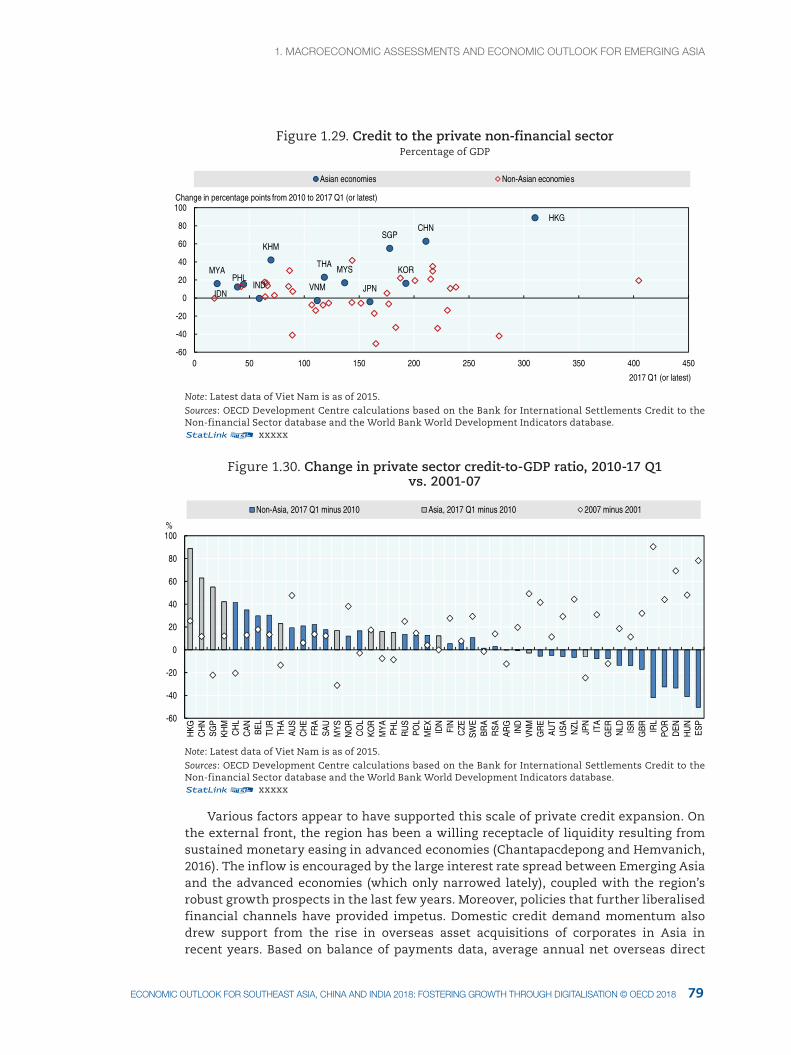
1. MacrOecONOMIc aSSeSSMeNtS aNd ecONOMIc OUtlOOK fOr eMergINg aSIa1. MacrOecONOMIc aSSeSSMeNtS aNd ecONOMIc OUtlOOK fOr eMergINg aSIa
79ecONOMIc OUtlOOK fOr SOUtHeaSt aSIa, cHINa aNd INdIa 2018: fOSterINg grOWtH tHrOUgH dIgItalISatION © Oecd 2018
Figure 1.29. Credit to the private non-financial sectorPercentage of GDP
HKGCHN
KOR
SGP
JPN
MYSTHA
INDIDN
KHM
MYAPHL
VNM
-60
-40
-20
0
20
40
60
80
100
0 50 100 150 200 250 300 350 400 450
2017 Q1 (or latest)
Asian economies Non-Asian economies
Change in percentage points from 2010 to 2017 Q1 (or latest)
Note: Latest data of Viet Nam is as of 2015.Sources: OECD Development Centre calculations based on the Bank for International Settlements Credit to the Non-financial Sector database and the World Bank World Development Indicators database.12 xxxxx
Figure 1.30. Change in private sector credit-to-GDP ratio, 2010-17 Q1 vs. 2001-07
-60
-40
-20
0
20
40
60
80
100
HKG
CH
NSG
PKH
MC
HL
CAN BE
LTU
RTH
AAU
SC
HE
FRA
SAU
MYS
NO
RC
OL
KOR
MYA PH
LR
US
POL
MEX ID
NFI
NC
ZESW
EBR
AR
SAAR
GIN
DVN
MG
RE
AUT
USA NZL
JPN
ITA
GER NLD ISR
GBR IR
LPO
RD
ENH
UN
ESP
Non-Asia, 2017 Q1 minus 2010 Asia, 2017 Q1 minus 2010 2007 minus 2001
%
Note: Latest data of Viet Nam is as of 2015.Sources: OECD Development Centre calculations based on the Bank for International Settlements Credit to the Non-financial Sector database and the World Bank World Development Indicators database.12 xxxxx
Various factors appear to have supported this scale of private credit expansion. On the external front, the region has been a willing receptacle of liquidity resulting from sustained monetary easing in advanced economies (Chantapacdepong and Hemvanich, 2016). The inflow is encouraged by the large interest rate spread between Emerging Asia and the advanced economies (which only narrowed lately), coupled with the region’s robust growth prospects in the last few years. Moreover, policies that further liberalised financial channels have provided impetus. Domestic credit demand momentum also drew support from the rise in overseas asset acquisitions of corporates in Asia in recent years. Based on balance of payments data, average annual net overseas direct
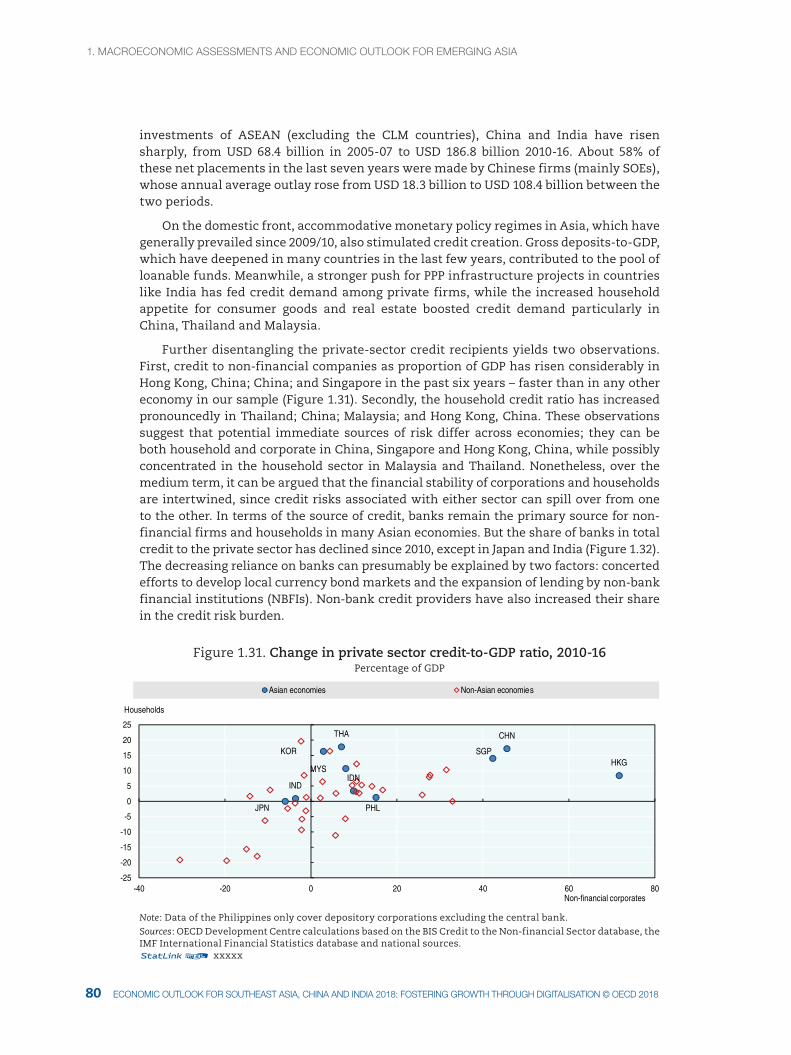
1. MacrOecONOMIc aSSeSSMeNtS aNd ecONOMIc OUtlOOK fOr eMergINg aSIa
8180 ecONOMIc OUtlOOK fOr SOUtHeaSt aSIa, cHINa aNd INdIa 2018: fOSterINg grOWtH tHrOUgH dIgItalISatION © Oecd 2018 ecONOMIc OUtlOOK fOr SOUtHeaSt aSIa, cHINa aNd INdIa 2018: fOSterINg grOWtH tHrOUgH dIgItalISatION © Oecd 2018
investments of ASEAN (excluding the CLM countries), China and India have risen sharply, from USD 68.4 billion in 2005-07 to USD 186.8 billion 2010-16. About 58% of these net placements in the last seven years were made by Chinese firms (mainly SOEs), whose annual average outlay rose from USD 18.3 billion to USD 108.4 billion between the two periods.
On the domestic front, accommodative monetary policy regimes in Asia, which have generally prevailed since 2009/10, also stimulated credit creation. Gross deposits-to-GDP, which have deepened in many countries in the last few years, contributed to the pool of loanable funds. Meanwhile, a stronger push for PPP infrastructure projects in countries like India has fed credit demand among private firms, while the increased household appetite for consumer goods and real estate boosted credit demand particularly in China, Thailand and Malaysia.
Further disentangling the private-sector credit recipients yields two observations. First, credit to non-financial companies as proportion of GDP has risen considerably in Hong Kong, China; China; and Singapore in the past six years – faster than in any other economy in our sample (Figure 1.31). Secondly, the household credit ratio has increased pronouncedly in Thailand; China; Malaysia; and Hong Kong, China. These observations suggest that potential immediate sources of risk differ across economies; they can be both household and corporate in China, Singapore and Hong Kong, China, while possibly concentrated in the household sector in Malaysia and Thailand. Nonetheless, over the medium term, it can be argued that the financial stability of corporations and households are intertwined, since credit risks associated with either sector can spill over from one to the other. In terms of the source of credit, banks remain the primary source for non-financial firms and households in many Asian economies. But the share of banks in total credit to the private sector has declined since 2010, except in Japan and India (Figure 1.32). The decreasing reliance on banks can presumably be explained by two factors: concerted efforts to develop local currency bond markets and the expansion of lending by non-bank financial institutions (NBFIs). Non-bank credit providers have also increased their share in the credit risk burden.
Figure 1.31. Change in private sector credit-to-GDP ratio, 2010-16Percentage of GDP
HKG
JPN
SGP
CHN
KOR
MYS
THA
INDIDN
PHL
-25
-20
-15
-10
-5
0
5
10
15
20
25
-40 -20 0 20 40 60 80
Households
Non-financial corporates
Asian economies Non-Asian economies
Note: Data of the Philippines only cover depository corporations excluding the central bank.Sources: OECD Development Centre calculations based on the BIS Credit to the Non-financial Sector database, the IMF International Financial Statistics database and national sources.12 xxxxx
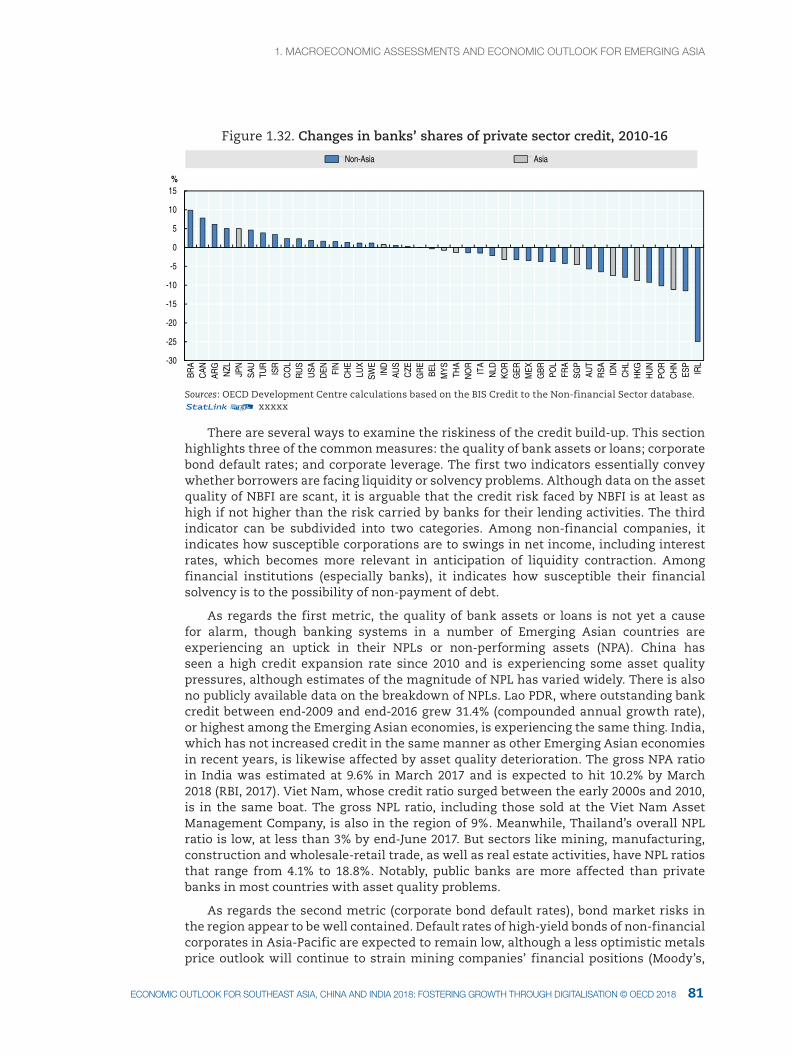
1. MacrOecONOMIc aSSeSSMeNtS aNd ecONOMIc OUtlOOK fOr eMergINg aSIa1. MacrOecONOMIc aSSeSSMeNtS aNd ecONOMIc OUtlOOK fOr eMergINg aSIa
81ecONOMIc OUtlOOK fOr SOUtHeaSt aSIa, cHINa aNd INdIa 2018: fOSterINg grOWtH tHrOUgH dIgItalISatION © Oecd 2018
Figure 1.32. Changes in banks’ shares of private sector credit, 2010-16
-30
-25
-20
-15
-10
-5
0
5
10
15BR
AC
ANAR
GN
ZLJP
NSA
UTU
RIS
RC
OL
RU
SU
SAD
EN FIN
CH
ELU
XSW
EIN
DAU
SC
ZEG
RE
BEL
MYS TH
AN
OR
ITA
NLD
KOR
GER
MEX
GBR PO
LFR
ASG
PAU
TR
SA IDN
CH
LH
KGH
UN
POR
CH
NES
PIR
L
%
Non-Asia Asia
Sources: OECD Development Centre calculations based on the BIS Credit to the Non-financial Sector database.12 xxxxx
There are several ways to examine the riskiness of the credit build-up. This section highlights three of the common measures: the quality of bank assets or loans; corporate bond default rates; and corporate leverage. The first two indicators essentially convey whether borrowers are facing liquidity or solvency problems. Although data on the asset quality of NBFI are scant, it is arguable that the credit risk faced by NBFI is at least as high if not higher than the risk carried by banks for their lending activities. The third indicator can be subdivided into two categories. Among non-financial companies, it indicates how susceptible corporations are to swings in net income, including interest rates, which becomes more relevant in anticipation of liquidity contraction. Among financial institutions (especially banks), it indicates how susceptible their financial solvency is to the possibility of non-payment of debt.
As regards the first metric, the quality of bank assets or loans is not yet a cause for alarm, though banking systems in a number of Emerging Asian countries are experiencing an uptick in their NPLs or non-performing assets (NPA). China has seen a high credit expansion rate since 2010 and is experiencing some asset quality pressures, although estimates of the magnitude of NPL has varied widely. There is also no publicly available data on the breakdown of NPLs. Lao PDR, where outstanding bank credit between end-2009 and end-2016 grew 31.4% (compounded annual growth rate), or highest among the Emerging Asian economies, is experiencing the same thing. India, which has not increased credit in the same manner as other Emerging Asian economies in recent years, is likewise affected by asset quality deterioration. The gross NPA ratio in India was estimated at 9.6% in March 2017 and is expected to hit 10.2% by March 2018 (RBI, 2017). Viet Nam, whose credit ratio surged between the early 2000s and 2010, is in the same boat. The gross NPL ratio, including those sold at the Viet Nam Asset Management Company, is also in the region of 9%. Meanwhile, Thailand’s overall NPL ratio is low, at less than 3% by end-June 2017. But sectors like mining, manufacturing, construction and wholesale-retail trade, as well as real estate activities, have NPL ratios that range from 4.1% to 18.8%. Notably, public banks are more affected than private banks in most countries with asset quality problems.
As regards the second metric (corporate bond default rates), bond market risks in the region appear to be well contained. Default rates of high-yield bonds of non-financial corporates in Asia-Pacific are expected to remain low, although a less optimistic metals price outlook will continue to strain mining companies’ financial positions (Moody’s,
1. MacrOecONOMIc aSSeSSMeNtS aNd ecONOMIc OUtlOOK fOr eMergINg aSIa
8382 ecONOMIc OUtlOOK fOr SOUtHeaSt aSIa, cHINa aNd INdIa 2018: fOSterINg grOWtH tHrOUgH dIgItalISatION © Oecd 2018 ecONOMIc OUtlOOK fOr SOUtHeaSt aSIa, cHINa aNd INdIa 2018: fOSterINg grOWtH tHrOUgH dIgItalISatION © Oecd 2018
2017). However, there is evidence of vulnerabilities. For instance, the bond default rate in China is six times higher than the level at the end of 2015 (Bloomberg, 2017a and 2017b). The incidence of bond defaults has also gained mild momentum in Singapore and in India (Bloomberg, 2017c; Huiwen, 2017; Joshi and Antoni, 2017).
As regards the third metric (corporate leverage), banking systems are generally well-capitalised even by Basel 3 standards – despite the fact that not all Emerging Asian economies have adopted the Basel 3 requirements.7 Tier 1 capital-to-risk weighted asset ratios of Emerging Asian economies range from about 9% (Cambodia) to 23.4% (Brunei Darussalam) based on IMF data.8 It is noteworthy, though, that only Brunei Darussalam, Indonesia and Cambodia have ratios above the global average of 16.5% covering 125 economies. In terms of liquidity, with the exception of Cambodia and Indonesia, all Emerging Asian economies have deposit-to-loan ratios of above 100%. But, again, only India, the Philippines and Viet Nam are above the global average of 111 economies.
Concerning non-financial companies, estimates of leverage differ across countries. Debt-to-equity ratios in China and the rest of Asia have been rising steadily since 2009 – a trend that also applies to the Latin America, Middle East and North Africa regions (IMF, 2017b). But a study by Goyal and Packer (2017), which examined firm-level data from Hong Kong, China; Indonesia; Malaysia; the Philippines; Singapore; and Thailand between 1991 and 2015, shows limited evidence of rising leverage in recent years. The leverage ratios of Hong Kong, China; Singapore; and the Philippines may have risen by somewhere between 4 and 7 percentage points from 2009 to 2015. Yet, ratios of Singapore and the Philippines are still far off from their highs of the mid-1990s while the ratio of Hong Kong, China is still below its peak seen in 1995-96 though rising. At the same time, leverage ratios of companies in Indonesia, Korea, Malaysia and Thailand have been easing since 2009.
Based on the trends of the three metrics, it can be argued that some manifestations of financial vulnerabilities are building up, although the extent is not expected to cause imminent difficulties. Markets are likewise not showing excessive concern at this juncture, as suggested by low benchmark bond yields, generally robust lending growth and a strong upward bias in equity prices in recent weeks. In any case, the rapid rise in credit should still be seen as an important macroprudential issue that requires careful attention.
In terms of bank lending activity, it is worth examining whether banks have loosened lending standards or whether the current bank lending standards are sufficient to appropriately assess risk. The business environment has also become more complex in recent years. The deepening of globalisation and the increased penetration of technology in various industries, for instance, have arguably altered the traditional way of viewing market risk. Monetary authorities in the region have been very active in upgrading their surveillance frameworks over the years, helped by various regional initiatives. But the progress has been asymmetric and the quality of monitoring is uneven. A number of central banks in Emerging Asia, for example, still have limited capacity to perform regular mandatory audits, to come up with periodic and timely financial stability reports or even just to publish relevant and reliable data. In this respect, it may be a tall order for smaller economies to address the challenge largely on their own. As such, regional platforms, for example the South East Asian Central Banks Research and Training Centre, and multilateral institutions can take more prominent roles in facilitating the catch up process in enhancing capacities of national institutions.
Strengthening supervision of credit provision outside the banking system is equally vital. However, there are various limitations, including legal, bureaucratic and political impediments; financial resource constraints on the part of the supervisory agency, if one exists; and personnel capability, among others. Although this has been flagged for
1. MacrOecONOMIc aSSeSSMeNtS aNd ecONOMIc OUtlOOK fOr eMergINg aSIa1. MacrOecONOMIc aSSeSSMeNtS aNd ecONOMIc OUtlOOK fOr eMergINg aSIa
83ecONOMIc OUtlOOK fOr SOUtHeaSt aSIa, cHINa aNd INdIa 2018: fOSterINg grOWtH tHrOUgH dIgItalISatION © Oecd 2018
a few years, oversight remains an issue in many countries. Even estimating the current scope of activities is difficult. This, too, requires more extensive national and regional collaboration, especially in the case of smaller economies.
Overall, in many countries in the region, slowing credit expansion or deleveraging may be appropriate in the near term as global liquidity is expected to tighten in the next few quarters. Efforts to put the brakes on credit growth may take a toll on domestic demand since it will constrain consumer spending and investments. However, if left unabated, a number of factors can trigger potential economic slippage through these structural cracks. Potential triggers may include the regional geopolitical tensions, reversal of nascent trade recovery and more rapid monetary contraction in advanced economies (as discussed above), which can push interest rates higher among other effects.
The improvement in global trade in recent months somehow mutes the economic impact of rapidly rising economy-wide debt insofar as corporate revenues get an additional boost externally. The relative stability in the domestic labour market is another upside. As such, this is an opportune time to implement or enhance the implementation of existing measures to keep credit quality above board. Nonetheless, any additional policy actions have to be designed carefully so that their disruptive effects should be limited. Aggressively denting credit expansion and, accordingly, private domestic demand might exacerbate existing financial weaknesses rather than addressing them.
The RCEP trade agreement holds great potential but faces challenges
Amid global malaise over economic growth, the Regional Comprehensive Economic Partnership (RCEP) free trade agreement (FTA) is believed by many to have the potential to reshape the region’s existing economic integration framework into a more committed and binding agreement that extends beyond traditional trade agreements. RCEP, which is poised to set a higher standard than the existing ASEAN-plus-one agreements, will reap higher welfare gains by participating countries in the long term. Lee and Itakura (2015) estimated that the welfare gains of RCEP countries will increase between 2020 and 2030 and that the gains will be varied, with India reaching 0.5% and Korea achieving welfare gains of 3.4% in 2030. The welfare gains will also increase drastically with more members participating, with the assumption that non-tariff barriers (NTB) in services and logistics time will be cut by 20% and that rice will be excluded in the FTA. In the near and medium terms, adjustment costs will be incurred, resulting in lower gains for some RCEP countries.
Apart from welfare gains, RCEP would indirectly streamline the existing FTAs and improve the “noodle-bowl” effect that is plaguing the region by making trade more costly. RCEP will not be able to completely untangle complications of the existing agreements, but it can at least standardise and harmonise discipline issues such as rules of origin (ROO), dispute settlement, competition and intellectual property rights (IPR). Different countries have different bilateral or multilateral FTAs with different level of commitments made with their trading partners. This then has resulted in trade activities becoming more costly and unstandardised from one trading partner to the other depending on the terms of the FTA agreed upon in negotiations.
This is why the RCEP, with ASEAN centrality at its core, is so important for the region. It will have a significant economic impact at both the regional and global levels, especially as it aims to improve the existing global value chains (GVCs) to become a more seamless hub with decreased trade costs once the NTBs are eliminated. What is unique about the RCEP is that, unlike the traditional FTAs, this mega-regional trade agreement has been joined by 16 countries that represent a major share of world trade
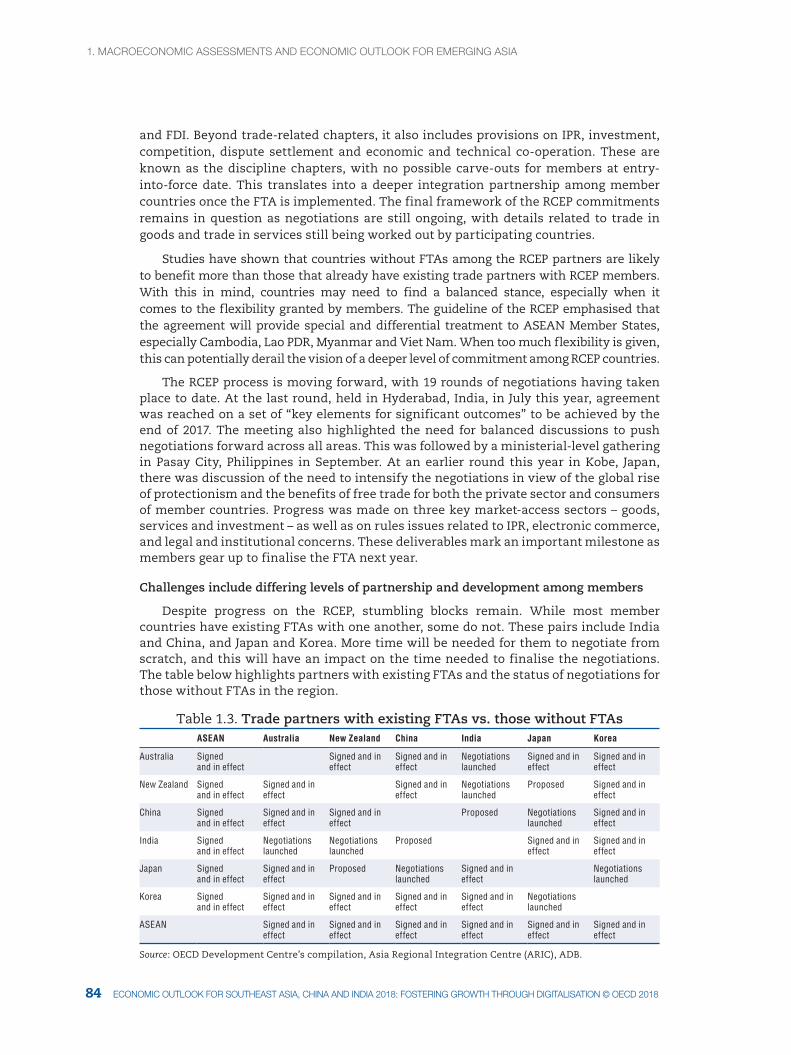
1. MacrOecONOMIc aSSeSSMeNtS aNd ecONOMIc OUtlOOK fOr eMergINg aSIa
8584 ecONOMIc OUtlOOK fOr SOUtHeaSt aSIa, cHINa aNd INdIa 2018: fOSterINg grOWtH tHrOUgH dIgItalISatION © Oecd 2018 ecONOMIc OUtlOOK fOr SOUtHeaSt aSIa, cHINa aNd INdIa 2018: fOSterINg grOWtH tHrOUgH dIgItalISatION © Oecd 2018
and FDI. Beyond trade-related chapters, it also includes provisions on IPR, investment, competition, dispute settlement and economic and technical co-operation. These are known as the discipline chapters, with no possible carve-outs for members at entry-into-force date. This translates into a deeper integration partnership among member countries once the FTA is implemented. The final framework of the RCEP commitments remains in question as negotiations are still ongoing, with details related to trade in goods and trade in services still being worked out by participating countries.
Studies have shown that countries without FTAs among the RCEP partners are likely to benefit more than those that already have existing trade partners with RCEP members. With this in mind, countries may need to find a balanced stance, especially when it comes to the flexibility granted by members. The guideline of the RCEP emphasised that the agreement will provide special and differential treatment to ASEAN Member States, especially Cambodia, Lao PDR, Myanmar and Viet Nam. When too much flexibility is given, this can potentially derail the vision of a deeper level of commitment among RCEP countries.
The RCEP process is moving forward, with 19 rounds of negotiations having taken place to date. At the last round, held in Hyderabad, India, in July this year, agreement was reached on a set of “key elements for significant outcomes” to be achieved by the end of 2017. The meeting also highlighted the need for balanced discussions to push negotiations forward across all areas. This was followed by a ministerial-level gathering in Pasay City, Philippines in September. At an earlier round this year in Kobe, Japan, there was discussion of the need to intensify the negotiations in view of the global rise of protectionism and the benefits of free trade for both the private sector and consumers of member countries. Progress was made on three key market-access sectors – goods, services and investment – as well as on rules issues related to IPR, electronic commerce, and legal and institutional concerns. These deliverables mark an important milestone as members gear up to finalise the FTA next year.
Challenges include differing levels of partnership and development among members
Despite progress on the RCEP, stumbling blocks remain. While most member countries have existing FTAs with one another, some do not. These pairs include India and China, and Japan and Korea. More time will be needed for them to negotiate from scratch, and this will have an impact on the time needed to finalise the negotiations. The table below highlights partners with existing FTAs and the status of negotiations for those without FTAs in the region.
Table 1.3. Trade partners with existing FTAs vs. those without FTAs ASEAN Australia New Zealand China India Japan Korea
Australia Signed and in effect
Signed and in effect
Signed and in effect
Negotiations launched
Signed and in effect
Signed and in effect
New Zealand Signed and in effect
Signed and in effect
Signed and in effect
Negotiations launched
Proposed Signed and in effect
China Signed and in effect
Signed and in effect
Signed and in effect
Proposed Negotiations launched
Signed and in effect
India Signed and in effect
Negotiations launched
Negotiations launched
Proposed Signed and in effect
Signed and in effect
Japan Signed and in effect
Signed and in effect
Proposed Negotiations launched
Signed and in effect
Negotiations launched
Korea Signed and in effect
Signed and in effect
Signed and in effect
Signed and in effect
Signed and in effect
Negotiations launched
ASEAN Signed and in effect
Signed and in effect
Signed and in effect
Signed and in effect
Signed and in effect
Signed and in effect
Source: OECD Development Centre’s compilation, Asia Regional Integration Centre (ARIC), ADB.
1. MacrOecONOMIc aSSeSSMeNtS aNd ecONOMIc OUtlOOK fOr eMergINg aSIa1. MacrOecONOMIc aSSeSSMeNtS aNd ecONOMIc OUtlOOK fOr eMergINg aSIa
85ecONOMIc OUtlOOK fOr SOUtHeaSt aSIa, cHINa aNd INdIa 2018: fOSterINg grOWtH tHrOUgH dIgItalISatION © Oecd 2018
Another factor that is complicating the finalisation process of RCEP negotiations is the large number of countries involved and differences in their level of development, with priorities and interests differing among participating economies. While some countries prefer a simple manufacturing-oriented trade deal, other members are pushing for liberalisation of the services sector and freedom of movement for skilled workers. The fact that this is not necessarily well accepted by all members explains why agreement on market access remains one of the most difficult challenges. Given the partners’ different priorities, tariff elimination on various products is not expected to be standardised at the entry-into-force date.
The absence of discipline chapters could limit the relevance of RCEP
It remains to be seen whether the final product of RCEP negotiations will be an in-depth and inclusive integration or just a basic commitment to be upgraded in the years to come. Nevertheless, due to missing chapters, the RCEP will result in a somewhat diluted form of economic integration, compared to the stalled Trans-Pacific Partnership agreement.
The RCEP agreement would not include provisions on SOEs such as guidelines on their accepted behaviour in the marketplace to promote a level playing field and prevent them from crowding out local and international firms in the domestic market. Provisions in the competition chapter would address this issue, but not in a detailed fashion. The dominance of SOEs in the region allows them to function in an almost oligopolistic manner in local markets. This impacts local SMEs negatively as they are unable to compete. The issue is complicated further by unequal treatment in the awarding of government procurements.
Likewise, a chapter on government procurement is not included in the RCEP framework. Without this chapter, governments have the freedom to award projects to local and international firms according to their own mechanisms, processes and standards. Nevertheless, the absence of provisions on this important issue would not improve transparency in the selection process of tendered projects, as governments would not be obliged to justifying their choices. As with SOEs, the absence of a chapter on government procurement will result in an unlevel playing field.
Provisions on investment and dispute settlement are vital discipline chapters that represent the backbone of the RCEP agreement, as they address the issue of backpedalling by governments when it comes to international investments. Nevertheless, the extent and depth of the penalisation commitment are still unknown. Some countries are pushing for a strict outline and commitment like the Investor-State Dispute Settlement Chapter that was proposed by the TPP, the Transatlantic Trade and Investment Partnership (TTIP) and the Korea-US FTA. In a nutshell, this chapter notes that firms that are negatively impacted by government backpedalling may take the government in question to be reviewed by an independent arbitration body.
A labour chapter is also not included in the agreement though this would be vital in addressing the rights of the region’s workers, both skilled and unskilled, in terms of wages, working conditions and the empowerment of unions. Such a chapter would also address the issues of exploitation and human trafficking, particularly of unskilled workers. This is highly controversial, as such a chapter would push for reforms of immigration policies in participating countries where labour mobility issues persist.
Finally, the absence of an environment chapter in the RCEP may lead to negative results on the environment depending on the implementation and monitoring of each government in the wake of drastic liberalisation process. An environment chapter would
1. MacrOecONOMIc aSSeSSMeNtS aNd ecONOMIc OUtlOOK fOr eMergINg aSIa
8786 ecONOMIc OUtlOOK fOr SOUtHeaSt aSIa, cHINa aNd INdIa 2018: fOSterINg grOWtH tHrOUgH dIgItalISatION © Oecd 2018 ecONOMIc OUtlOOK fOr SOUtHeaSt aSIa, cHINa aNd INdIa 2018: fOSterINg grOWtH tHrOUgH dIgItalISatION © Oecd 2018
be very helpful in addressing fundamental issues like pollution, overfishing, overlogging and the illegal trade and smuggling of endangered species from one member country to the other.
Despite these caveats, the RCEP still has the potential to become a very inclusive agreement with a balanced agenda for growth in the area of trade liberalisation and for protecting rights.
1. MacrOecONOMIc aSSeSSMeNtS aNd ecONOMIc OUtlOOK fOr eMergINg aSIa1. MacrOecONOMIc aSSeSSMeNtS aNd ecONOMIc OUtlOOK fOr eMergINg aSIa
87ecONOMIc OUtlOOK fOr SOUtHeaSt aSIa, cHINa aNd INdIa 2018: fOSterINg grOWtH tHrOUgH dIgItalISatION © Oecd 2018
Notes
1. Calculation of ratios relative to GDP (e.g. consumption, exports, etc.) are based on constant price data unless otherwise indicated.
2. Informal sector employment is computed as the sum of non-wage self-employed workers without any paid employees and non-wage workers in own family-operated farms or businesses (without pay).
3. The details of Investment Incentives Order 2001 are available on the website of the Ministry of Primary Resources and Tourism: www.mprt.gov.bn/SitePages/Investing%20in%20Brunei%20Darussalam.aspx.
4. The level data used in calculating the ratios in this section – revenue effort, tax effort, expenditure ratio and deficit ratio – are on an annualised basis, i.e. 4-quarter running sum, unless otherwise stated.
5. General government balances data are not necessarily comparable to the budget balances published by national governments.
6. Our sample is comprised of 48 economies. Data were mainly sourced from the Bank for International Settlements (BIS) database except for the four Emerging Asian economies, where data from the World Bank World Development Indicators were used since they are not included in the BIS database. Non-Asian economies included in the sample are mainly OECD economies. Non-Asian and non-OECD economies included are Argentina, Brazil, Colombia, Russian Federation and Saudi Arabia.
7. While the big economies in Emerging Asia have been compliant with Basel 3 for a few years now, the smaller economies like Brunei Darussalam, Viet Nam and the CML countries have either just adopted or are in the process of adopting fully the Basel 2 standards.
8. The latest data available are used. Key banking system ratios of Lao PDR are not readily available. The Basel 3 target tier 1 capital-to-risk weighted assets ratio is 8.5%-11% inclusive of the capital conservation buffer and capital surcharges for 30 (note: minimum is 6%) (BIS, 2017).
1. MacrOecONOMIc aSSeSSMeNtS aNd ecONOMIc OUtlOOK fOr eMergINg aSIa
8988 ecONOMIc OUtlOOK fOr SOUtHeaSt aSIa, cHINa aNd INdIa 2018: fOSterINg grOWtH tHrOUgH dIgItalISatION © Oecd 2018 ecONOMIc OUtlOOK fOr SOUtHeaSt aSIa, cHINa aNd INdIa 2018: fOSterINg grOWtH tHrOUgH dIgItalISatION © Oecd 2018
References
ADB (2017), Key Indicators for Asia and the Pacific 2017, Manila, https://www.adb.org/publications/key-indicators-asia-and-pacific-2017.
ADB (2017), AsianBondsOnline (database), Manila, https://asianbondsonline.adb.org/.
ADB Free Trade Agreement Database, https://aric.adb.org/fta (accessed on 25 September 2017).
Bank Negara Malaysia (2016), Bank Negara Malaysia Annual Report 2016, Kuala Lumpur, http://www.bnm.gov.my/files/publication/ar/en/2016/ar2016_book.pdf
Bank Negara Malaysia (2017), Financial Stability and Payment Systems Report 2016, Kuala Lumpur, http://www.bnm.gov.my/files/publication/fsps/en/2016/fs2016_book.pdf.
BIS (2017a), Credit to the Non-financial Sector (database), Bank for International Settlements, Basel, https://www.bis.org/statistics/totcredit.htm.
BIS (2017b), Effective Exchange Rate Indices (database), Bank for International Settlements, Basel, https://www.bis.org/statistics/eer.htm.
Bloomberg (2017a), “China has its worst-ever start to a year for defaults”, 3 April, New York, https://www.bloomberg.com/news/articles/2017-04-02/china-just-had-its-worst-ever-start-to-a-year-for-bond-defaults.
Bloomberg (2017b), “China’s latest bond default is a cautionary tale for investors”, 11 September, New York, https://www.bloomberg.com/news/articles/2017-09-10/china-s-latest-bond-default-is-a-cautionary-tale-for-investors.
BSE and CMIE (2017), Unemployment Rate in India (database), Bombay Stock Exchange Ltd. and Centre for Monitoring Indian Economy Pvt, https://unemploymentinindia.cmie.com/kommon/bin/sr.php?kall=wshowtab&tabno=0001.
Chantapacdepong, P. and S. Hemvanich (2016), “The pattern of capital flows into Asia in the last decade”, Asia Pathways, Asian Development Bank Institute blog, Tokyo, https://www.asiapathways-adbi.org/2016/06/the-pattern-of-capital-flows-into-asia-in-the-last-decade/.
Fusion Media Ltd (2017), Government Bond Yields and Stock Market Indices (database), www.investing.com.
Goyal, V. and F. Packer (2017), “Corporate leverage in emerging Asia”, Bank for International Settlements, Basel, https://www.bis.org/publ/bppdf/bispap91e_rh.pdf.
GSO (2017), Press release on the socio-economic situation in the first 9 months of 2017, General Statistics Office of Viet Nam, Hanoi, http://www.gso.gov.vn/default.aspx?tabid=382&idmid=2&ItemID=18576.
Hogan Lovells (2017), “China’s new foreign exchange controls create fresh concerns”, London, https://www.hoganlovells.com/en/publications/chinas-new-foreign-exchange-controls-create-fresh-concerns.
Huiwen, N. (2017), “Move to streamline insolvency framework”, The Straits Times, Singapore, http://www.straitstimes.com/singapore/move-to-streamline-insolvency-framework.
ILO (2017), Key Indicators of the Labour Market (database), Geneva, www.ilo.org/ilostat/faces/ilostat-home/home?_adf.ctrl-state=11r6dvrqbe_33&_afrLoop=218736986326360#.
Jones, M. (2015), “Which ASEAN country is the most competitive?”, World Economic Forum, Cologne, https://www.weforum.org/agenda/2015/04/which-asean-country-is-the-most-competitive/.
IMF (2017a), Balance of Payments Statistics (database), Washington, DC., http://www.imf.org/external/datamapper/datasets/BOP.
IMF (2017b), “Getting the policy mix right”, Global Financial Stability Report, Washington, DC., https://www.imf.org/en/Publications/GFSR/Issues/2017/03/30/global-financial-stability-report-april-2017.
IMF (2017c), International Financial Statistics (database), Washington, DC., http://data.imf.org/?sk=4C514D48-B6BA-49ED-8AB9-52B0C1A0179B.
IMF (2017d), “Lao People’s Democratic Republic: 2016 Article IV Consultation-Press Release; Staff Report; and Statement by the Executive Director for Lao People’s Democratic Republic”, Washington, DC., https://www.imf.org/en/Publications/CR/Issues/2017/02/15/Lao-People-s-Democratic-Republic-2016-Article-IV-Consultation-Press-Release-Staff-Report-and-44669.
IMF (2017e), “Malaysia: 2017 Article IV Consultation-Press Release; Staff Report; and Statement by the Authorities of Malaysia”, Washington, DC., https://www.imf.org/en/Publications/CR/Issues/2017/04/28/Malaysia-2017-Article-IV-Consultation-Press-Release-Staff-Report-and-Statement-by-the-44869.
https://www.asiapathways-adbi.org/2016/06/the-pattern-of-capital-flows-into-asia-in-the-last-decade/
1. MacrOecONOMIc aSSeSSMeNtS aNd ecONOMIc OUtlOOK fOr eMergINg aSIa1. MacrOecONOMIc aSSeSSMeNtS aNd ecONOMIc OUtlOOK fOr eMergINg aSIa
89ecONOMIc OUtlOOK fOr SOUtHeaSt aSIa, cHINa aNd INdIa 2018: fOSterINg grOWtH tHrOUgH dIgItalISatION © Oecd 2018
IMF (2017f), World Economic Outlook (database), October 2017, Washington, DC., https://www.imf.org/external/pubs/ft/weo/2017/02/weodata/index.aspx.
Joshi, A. and A. Antony (2017), “Record defaults in India worsen nation’s bad asset pain”, Bloomberg Businessweek, New York, https://www.bloomberg.com/news/articles/2017-08-21/record-defaults-in-india-worsen-nation-s-bad-asset-pain.
Lee, H. and K. Itakura (2015), Applied General Equilibrium Analysis of Mega-Regional Free Trade Initiatives in the Asia-Pacific. Available online: http://econpapers.repec.org/paper/ospwpaper/15e001.htm (accessed on 25 September 2017).
Markit Economics (various dates), press releases, https://www.markiteconomics.com/Survey/Page.mvc/PressReleases.
Ministry of Commerce-India (MOC-India, 2017), “Consolidated FDI policy (effective from August 28, 2017)”, New Delhi, http://dipp.nic.in/sites/default/files/CFPC_2017_FINAL_RELEASED_28.8.17.pdf.
Ministry of Labour and Vocational Training-Cambodia and International Labour Organization (MLVT-Cambodia and ILO, 2014), “Policy on labour migration for Cambodia”, Phnom Penh, https://www.colomboprocess.org/images/pdfs/Labour_Migration_Policy_for_Cambodia_2015-18.pdf.
Moody’s Investor Service (2017), “Moody’s: Default rate for Asian high-yield non-financial corporates to stay low in 2017”, Global Credit Research, Hong Kong, https://www.moodys.com/research/Moodys-Default-rate-for-Asian-high-yield-non-financial-corporates--PR_362660.
National Institute of Statistics, Ministry of Planning-Cambodia (NISMP-Cambodia, 2015), “Cambodia socio-economic survey 2015”, Phnom Penh, www.nis.gov.kh/nis/CSES/Final%20Report%20CSES%202015.pdf.
OECD (2017a), Economic Outlook for Southeast Asia, China and India 2017: Addressing Energy Challenges, OECD Publishing, Paris, http://dx.doi.org/10.1787/saeo-2017-11-en.
OECD (2017b), Revenue Statistics in Asian Countries 2017: Trends in Indonesia, Japan, Kazakhstan, Korea, Malaysia, the Philippines and Singapore, OECD Publishing, Paris, http://dx.doi.org/10.1787/9789264278943-en.
OECD (2017c), Economic Outlook for Southeast Asia, China and India 2017 –Special Supplement: August 2017 Update, OECD Publishing, Paris, http://dx.doi.org/10.1787/saeo-2017-11-en.
Philippine Statistics Authority (PSA, 2017), “Total approved foreign investments reached P18.2 billion in Q2 2017”, Manila, https://psa.gov.ph/foreign-investments-press-releases.
Reserve Bank of India (RBI, 2017a), Annual Report of the Reserve Bank of India 2017, Mumbai, https://rbi.org.in/Scripts/AnnualReportPublications.aspx?year=2017.
Reserve Bank of India (RBI, 2017b), Financial Stability Report, Issue No. 15, Mumbai, https://rbidocs.rbi.org.in/rdocs/PublicationReport/Pdfs/0FSR_30061794092D8D036447928A4B45880863B33E.PDF.
UNCTAD (2017), FDI Statistics (database), Geneva, http://unctad.org/en/Pages/DIAE/FDI%20Statistics/FDI-Statistics.aspx.
Wee, D. and A. Vishnoi (2017), “Watch the bond deadlines of these four Singapore companies”, Bloomberg Technology, New York, https://www.bloomberg.com/news/articles/2017-06-06/here-are-four-singapore-companies-with-bond-deadlines-to-watch.
Woetzel, J., A. Madgavkar and S. Gupta (2017), “India’s labour market: A new emphasis on gainful employment”, McKinsey Global Institute Discussion Paper, New York, www.bjp.org/images/MGI_India_Labour_Market_Discussion_paper_June%202017.pdf.
World Bank (2017a), World Development Indicators (database), World Bank, Washington, DC.
World Bank (2017b), Thailand Economic Monitor: Digital Transformation, August, http://pubdocs.worldbank.org/en/823661503543356520/pdf/Thailand-Economic-Monitor-August-2017.pdf.

91ecONOMIc OUtlOOK fOr SOUtHeaSt aSIa, cHINa aNd INdIa 2018: fOSterINg grOWtH tHrOUgH dIgItalISatION © Oecd 2018
ASEAN member countries are celebrating the 50th anniversary of
the regional community in 2017, during the chairmanship of the
Philippines. This anniversary marks an opportunity to take stock of
the achievements of the bloc over the past five decades and to consider
the work that needs to be done to achieve the vision of a unified and
seamless ASEAN Economic Community (AEC) in the future. Since
its establishment in 1967, ASEAN has blossomed into a community
pursuing economic and other modes of integration through the unique
consensus-based ASEAN Way. Member countries co-operate on policy
areas including tourism, infrastructure and consumer protection in
working to foster inclusive and sustainable growth across the region.
In the past year, regional integration has progressed most significantly
in trade in goods and trade in services. Tariffs decreased further for
ASEAN-6 and CLMV countries. Additionally, the ASEAN Single Window
initiative is well under way for implementation.
Chapter 2
Progress and challenges of regional integration in ASEAN and Emerging Asia
2. prOgreSS aNd cHalleNgeS Of regIONal INtegratION IN aSeaN aNd eMergINg aSIa
9392 ecONOMIc OUtlOOK fOr SOUtHeaSt aSIa, cHINa aNd INdIa 2018: fOSterINg grOWtH tHrOUgH dIgItalISatION © Oecd 2018 ecONOMIc OUtlOOK fOr SOUtHeaSt aSIa, cHINa aNd INdIa 2018: fOSterINg grOWtH tHrOUgH dIgItalISatION © Oecd 2018
Overview: Building momentum for the ASEAN Economic Community
The Association of Southeast Asian Nations (ASEAN) promotes inclusive and innovation-led economic growth to enhance the performance of the ASEAN Economic Community (AEC). In 2017, ASEAN members – Brunei Darussalam, Cambodia, Indonesia, Lao PDR, Malaysia, Myanmar, the Philippines, Singapore, Thailand and Viet Nam – adopted the AEC 2025 Consolidated Strategic Action Plan to implement the 2025 AEC Blueprint. Endorsed by ASEAN economic ministers and the AEC Council, the Strategic Action Plan aims to foster regional integration by increasing trade and investment; integrating micro, small and medium-sized enterprises (MSMEs) into the digital economy; and developing an innovation-driven economy. These measures reflect the main theme of the 30th ASEAN Summit in April 2017, “Partnering for Change, Engaging the World”.
Encouraging the seamless flow of investment within ASEAN is a key aspect of regional integration. The ASEAN Coordinating Committee on Investments, at its 69th meeting in March 2017, agreed to push the Focused and Strategic Action (FAST) Action Agenda on investment. The agenda’s four main goals are aligned with the four pillars of the ASEAN Comprehensive Investment Agreement: investment promotion, facilitation, protection and liberalisation. The agenda includes assessing trade-related investment measures, promoting MSMEs, establishing ASEAN investment agreements and building business registration requirements.
Integrating capital markets and fostering the mobility of professionals within ASEAN are important steps to be taken on the path to an integrated economy. The ASEAN Capital Markets Forum (ACMF) Group of Experts has developed an implementation plan for the integration of ASEAN capital markets. One of their priorities is to ensure the mobility of skilled labour. In the ASEAN Framework Agreement on Services (AFAS), however, progress in the legal framework to support the mobility of skilled labour has been slow. On the positive side, the ASEAN High-Level Conference on Social Protection, held from 15-17 August 2017, focused on social welfare and human capital development, and the 31st ASEAN Summit in November 2017 plans to finalise the instruments on the protection and promotion of migrant workers’ rights.
In the past year, regional integration has progressed most significantly in the trade of goods and services. The speed of implementing the ASEAN Trade in Goods Agreement (ATIGA) schedule varies by country. Cambodia, Lao PDR, Myanmar and Viet Nam (the CLMV countries) further reduced tariffs earlier in 2017 under the ATIGA schedule. Additionally, the digital economy will enhance the free flow of goods and services within ASEAN through the ASEAN Single Window (ASW) initiative, which establishes a regional platform for the electronic exchange of data for trade activities. ASEAN member countries’ advances in implementing their National Single Windows (NSW) are further boosting trade activities. Indonesia, Malaysia and Singapore have shown incremental progress in the NSW, while Brunei Darussalam and Viet Nam are still catching up. Cambodia, Lao PDR, Myanmar, the Philippines and Thailand are slowly advancing to build their NSW. Furthermore, the AFAS and mutual recognition arrangements (MRAs) in several sectors have helped liberalise services; the ninth package of AFAS commitments is in effect. In addition to the eight MRAs signed in the past, the ASEAN MRA for generic medicinal products was finalised recently.
MSMEs’ participation in the digital economy is crucial to ensure their sustainable growth in ASEAN. To encourage this, ASEAN policy makers announced five key measures in 2017: i) support mobile financial services, e-commerce and broadband; ii) develop infrastructure to connect cities; iii) strengthen local digital economies; iv) boost research and development investment in digital innovation; and v) improve the ASEAN digital economy’s security system (the ASEAN Cybersecurity Cooperation Strategy).
2. prOgreSS aNd cHalleNgeS Of regIONal INtegratION IN aSeaN aNd eMergINg aSIa2. prOgreSS aNd cHalleNgeS Of regIONal INtegratION IN aSeaN aNd eMergINg aSIa
93ecONOMIc OUtlOOK fOr SOUtHeaSt aSIa, cHINa aNd INdIa 2018: fOSterINg grOWtH tHrOUgH dIgItalISatION © Oecd 2018
In line with ASEAN’s move to become a digital economy, it recently established the ASEAN Coordinating Committee on Electronic Commerce; the committee covers several aspects of e-commerce development, including infrastructure, payment systems and consumer protection. Additionally, changing consumption behaviour and trends have realigned competition policy and laws for a new era in the digital economy; ASEAN’s Regional Capacity Building Roadmap for Competition Policy and Law 2017-20 builds up capacities effectively to implement competition law in ASEAN. Beyond ASEAN initiatives, the European Union-ASEAN Project on the Protection of Intellectual Property Rights (ECAP) had its final Project Steering Committee meeting in Lao PDR in February 2017. A new programme on intellectual property rights for 2017-21 under the EU-ASEAN co-operation will be launched later this year.
MSMEs’ smooth transition into the digital economy requires increasing global and regional connectivity through road, sea and air. Building, operating and maintaining rails, roads, ports, airports and hubs in major cities will help improve and strengthen the region’s connectivity and access to global markets and businesses. With this in mind, ASEAN has launched a roll-on roll-off sea route between the cities of Davao and General Santos in Mindanao (the Philippines) and Bitung (Indonesia) to boost regional trade in goods.
Other developments are also observed in other areas of regional integration. The Travel and Tourism Competitiveness Report 2017 indicates that Southeast Asia is a highly price-competitive destination. However, the region needs to improve its infrastructure as well as information and communication technology (ICT). Energy is another integral part of connecting and building infrastructures. To enhance ASEAN’s electric-power infrastructure, the region is implementing cross-border interconnection and developing the first multilateral connection: the Lao PDR-Thailand-Malaysia (LTM project) Power Grid connection. This fulfils a vision, in the ASEAN Plan of Action for Energy Cooperation 2016-25, for the ASEAN Power Grid to initiate multilateral electricity trade in at least one sub-region by 2018. The ASEAN Strategic Policy Dialogue on Disaster Management in August 2017 adds resiliency to the region’s connectivity and infrastructure development.
Additionally, the Initiative for ASEAN Integration (IAI) Work Plan III (2016-20) focuses on five strategic areas: food and agriculture, trade facilitation, MSMEs, education, and health and well-being for sustainable development. In 2017, the ASEAN Food and Beverage Alliance called on ASEAN member countries to accelerate regional standardisation, including that of nutritional labelling, under the World Trade Organization (WTO). Trading among ASEAN member countries requires common standards on food safety because the regulations that govern nutrition labelling and other standards follow different international guidelines. Brunei Darussalam, Cambodia, Lao PDR, Malaysia, Singapore and Viet Nam follow the Codex guidelines in their food safety regulations, while the Philippines and Thailand have adopted the United States’ nutrition labelling guidelines. The Philippines and Thailand need to revise their food legislation in light of the Codex standards for benchmarking with international standards. Nevertheless, the two countries have made progress in implementing the ASEAN Integrated Food Security Framework and the Strategic Plan of Action on ASEAN Food Security 2015-20.
Trade in goods: ASEAN is working to further reduce tariffs
The AEC Blueprint Action Plan outlines the progress on import duties in Cambodia, Lao PDR, Myanmar and Viet Nam. In 2016, these CLMV countries had not completed the tariff reduction on some Schedule A items (which should have been eliminated by 2015). Import tariffs on some sensitive items in ASEAN-6 countries (Brunei Darussalam, Indonesia, Malaysia, the Philippines, Singapore and Thailand) are still in force, but
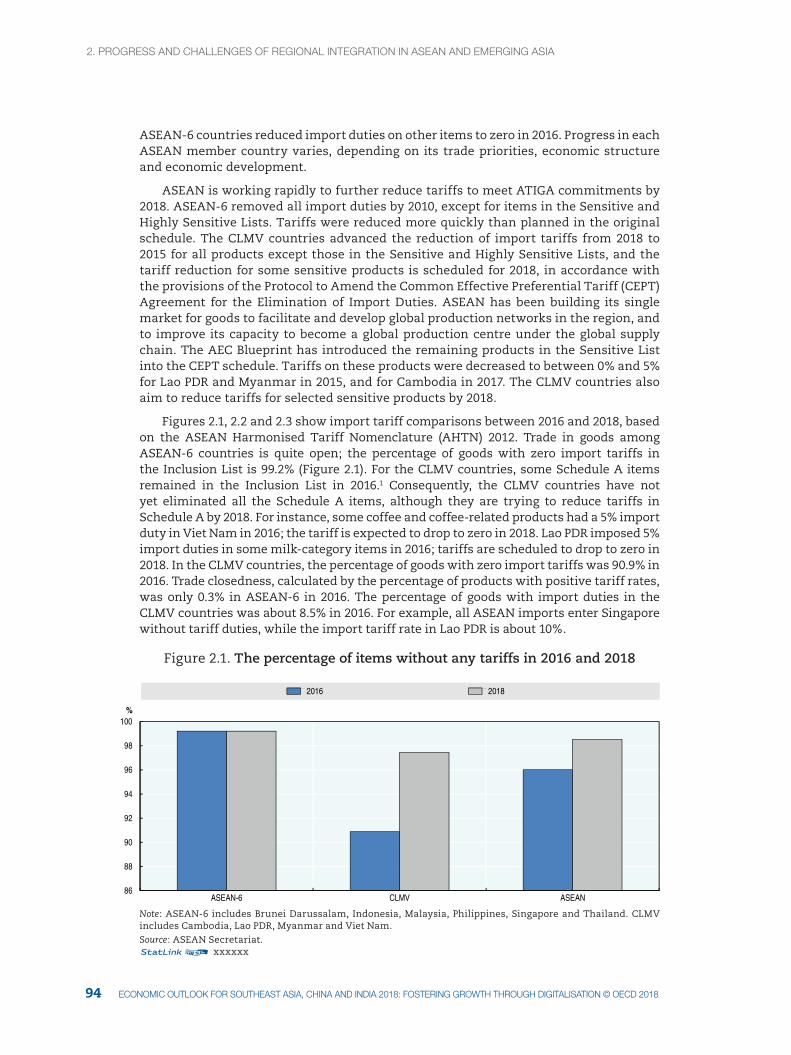
2. prOgreSS aNd cHalleNgeS Of regIONal INtegratION IN aSeaN aNd eMergINg aSIa
9594 ecONOMIc OUtlOOK fOr SOUtHeaSt aSIa, cHINa aNd INdIa 2018: fOSterINg grOWtH tHrOUgH dIgItalISatION © Oecd 2018 ecONOMIc OUtlOOK fOr SOUtHeaSt aSIa, cHINa aNd INdIa 2018: fOSterINg grOWtH tHrOUgH dIgItalISatION © Oecd 2018
ASEAN-6 countries reduced import duties on other items to zero in 2016. Progress in each ASEAN member country varies, depending on its trade priorities, economic structure and economic development.
ASEAN is working rapidly to further reduce tariffs to meet ATIGA commitments by 2018. ASEAN-6 removed all import duties by 2010, except for items in the Sensitive and Highly Sensitive Lists. Tariffs were reduced more quickly than planned in the original schedule. The CLMV countries advanced the reduction of import tariffs from 2018 to 2015 for all products except those in the Sensitive and Highly Sensitive Lists, and the tariff reduction for some sensitive products is scheduled for 2018, in accordance with the provisions of the Protocol to Amend the Common Effective Preferential Tariff (CEPT) Agreement for the Elimination of Import Duties. ASEAN has been building its single market for goods to facilitate and develop global production networks in the region, and to improve its capacity to become a global production centre under the global supply chain. The AEC Blueprint has introduced the remaining products in the Sensitive List into the CEPT schedule. Tariffs on these products were decreased to between 0% and 5% for Lao PDR and Myanmar in 2015, and for Cambodia in 2017. The CLMV countries also aim to reduce tariffs for selected sensitive products by 2018.
Figures 2.1, 2.2 and 2.3 show import tariff comparisons between 2016 and 2018, based on the ASEAN Harmonised Tariff Nomenclature (AHTN) 2012. Trade in goods among ASEAN-6 countries is quite open; the percentage of goods with zero import tariffs in the Inclusion List is 99.2% (Figure 2.1). For the CLMV countries, some Schedule A items
remained in the Inclusion List in 2016.1 Consequently, the CLMV countries have not yet eliminated all the Schedule A items, although they are trying to reduce tariffs in Schedule A by 2018. For instance, some coffee and coffee-related products had a 5% import duty in Viet Nam in 2016; the tariff is expected to drop to zero in 2018. Lao PDR imposed 5% import duties in some milk-category items in 2016; tariffs are scheduled to drop to zero in 2018. In the CLMV countries, the percentage of goods with zero import tariffs was 90.9% in 2016. Trade closedness, calculated by the percentage of products with positive tariff rates, was only 0.3% in ASEAN-6 in 2016. The percentage of goods with import duties in the CLMV countries was about 8.5% in 2016. For example, all ASEAN imports enter Singapore without tariff duties, while the import tariff rate in Lao PDR is about 10%.
Figure 2.1. The percentage of items without any tariffs in 2016 and 2018
86
88
90
92
94
96
98
100
ASEAN-6 CLMV ASEAN
%
2016 2018
Note: ASEAN-6 includes Brunei Darussalam, Indonesia, Malaysia, Philippines, Singapore and Thailand. CLMV includes Cambodia, Lao PDR, Myanmar and Viet Nam.Source: ASEAN Secretariat.12 xxxxxx
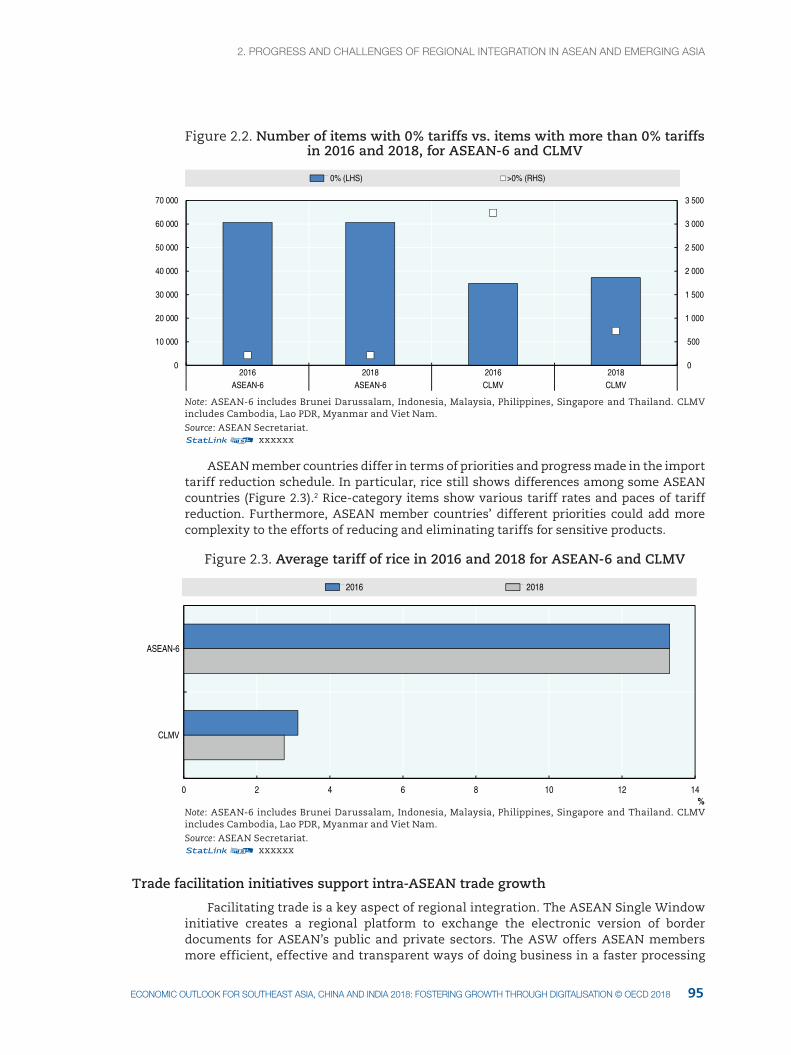
2. prOgreSS aNd cHalleNgeS Of regIONal INtegratION IN aSeaN aNd eMergINg aSIa2. prOgreSS aNd cHalleNgeS Of regIONal INtegratION IN aSeaN aNd eMergINg aSIa
95ecONOMIc OUtlOOK fOr SOUtHeaSt aSIa, cHINa aNd INdIa 2018: fOSterINg grOWtH tHrOUgH dIgItalISatION © Oecd 2018
Figure 2.2. Number of items with 0% tariffs vs. items with more than 0% tariffs in 2016 and 2018, for ASEAN-6 and CLMV
0
500
1 000
1 500
2 000
2 500
3 000
3 500
0
10 000
20 000
30 000
40 000
50 000
60 000
70 000
2016 2018 2016 2018ASEAN-6 ASEAN-6 CLMV CLMV
0% (LHS) >0% (RHS)
Note: ASEAN-6 includes Brunei Darussalam, Indonesia, Malaysia, Philippines, Singapore and Thailand. CLMV includes Cambodia, Lao PDR, Myanmar and Viet Nam.Source: ASEAN Secretariat.12 xxxxxx
ASEAN member countries differ in terms of priorities and progress made in the import tariff reduction schedule. In particular, rice still shows differences among some ASEAN countries (Figure 2.3).2 Rice-category items show various tariff rates and paces of tariff reduction. Furthermore, ASEAN member countries’ different priorities could add more complexity to the efforts of reducing and eliminating tariffs for sensitive products.
Figure 2.3. Average tariff of rice in 2016 and 2018 for ASEAN-6 and CLMV
0 2 4 6 8 10 12 14
ASEAN-6
CLMV
%
2016 2018
Note: ASEAN-6 includes Brunei Darussalam, Indonesia, Malaysia, Philippines, Singapore and Thailand. CLMV includes Cambodia, Lao PDR, Myanmar and Viet Nam.Source: ASEAN Secretariat.12 xxxxxx
Trade facilitation initiatives support intra-ASEAN trade growth
Facilitating trade is a key aspect of regional integration. The ASEAN Single Window initiative creates a regional platform to exchange the electronic version of border documents for ASEAN’s public and private sectors. The ASW offers ASEAN members more efficient, effective and transparent ways of doing business in a faster processing
2. prOgreSS aNd cHalleNgeS Of regIONal INtegratION IN aSeaN aNd eMergINg aSIa
9796 ecONOMIc OUtlOOK fOr SOUtHeaSt aSIa, cHINa aNd INdIa 2018: fOSterINg grOWtH tHrOUgH dIgItalISatION © Oecd 2018 ecONOMIc OUtlOOK fOr SOUtHeaSt aSIa, cHINa aNd INdIa 2018: fOSterINg grOWtH tHrOUgH dIgItalISatION © Oecd 2018
time. The legal framework also provides for cyber security, such as data protection, confidentiality and acceptance of electronic signatures. This electronic data exchange reduces the use of paper documents and speeds up customs clearance. Consequently, the initiative accelerates cargo clearance, and strengthens trade and regional economic integration in the ASEAN Economic Community. It also improves the region’s productivity and economic competitiveness. For instance, ASEAN member countries exchange electronically the Preferential Certificate of Origin, which allows goods from the original country to profit from reduced duties under trade agreements such as ATIGA. ASEAN member countries plan to expand the ASW to support the exchange of export declaration information through the ASEAN Customs Declaration Document data, in order to support their risk management system and exchange of electronic phytosanitary certificates. They are considering enlarging the system to exchange other documents, such as cargo documentation, shipping manifests, and other port and transport documents.
Unfortunately, the progress of ASW implementation differs among ASEAN countries. The ASW has been put into operation in Indonesia, Malaysia, Viet Nam and Singapore. The Philippines is expected to connect to the ASW by December 2017 according to government officials. In Viet Nam, meetings were held to discuss the removal of obstacles and the deployment of solutions to implement the ASW which led the country to join the ASEAN Single Window live operation in September 2015. Progress has been slow so far for other countries, and very few procedures might be included in the ASW by the end of 2017 at the earliest. Brunei also shows slow progress (i.e. two virtual servers were provisioned for testing and two virtual servers for production). On the upside, the contractor of ASW successfully installed the ASW B2Bi software on the servers in April 2017. In March 2017, Indonesia’s National Single Window implemented the ASEAN Harmonised Tariff Nomenclature 2017, which is Buku Tarif Kepabeanan Indonesia 2017 (Ministry of Finance of Indonesia 2017), according to the Minister of Finance Regulation on the Stipulation of Classification of Goods and Imposition of Import Duty on Imported Goods (BTKI 2017). Malaysia has been promoting the live exchange of e-ATIGA and improving the ASW live data-exchange system. Singapore’s TradeNet, a nationwide electronic data interchange system, has been upgraded several times since it was introduced in 1989 (from version 3.1 to 4.0 in 2007, and 4.1 in 2012). Brunei Darussalam is enhancing its NSW to enable the Ports Clearance Module.
On the other hand, ASW implementation is still in progress in Cambodia, Lao PDR, Myanmar, the Philippines and Thailand. In Thailand, the National Logistics Committee endorsed the Regulatory Framework Model of the Thailand NSW in 2010. The Philippines has requested technical assistance on ASW’s readiness and assessment from the United States-ASEAN Connectivity through Trade and Investment (US-ACTI) programme. Funded by the United States Agency for International Development (USAID), US-ACTI encourages key trade-facilitation measures such as the ASW. The Philippines started this process in April 2017, and aims to go live with its NSW by the end of 2017. Cambodia has recently completed the Needs Assessment and the ASW Briefing for Single Window Stakeholders in Cambodia, with support from US-ACTI. They plan to complete this assessment by the end of 2017. The country is, therefore, joining the testing on the exchange of e-ATIGA Form D with other AMS by mid of 2017 and aims to go live by the end of 2017. In Myanmar, the Myanmar Automated Cargo Clearance System (MACCS) online system will apply the Customs Department’s import/export clearance procedures; MACCS will be operational for 24-hour trading. The Customs Department will implement MACCS in the Yangon area and extend it to the border areas by the end of 2017.
Other trade-related progress includes the ASEAN Coordinating Committee on Electronic Commerce, which supports e-commerce for regional economic integration and aims to facilitate cross-border e-commerce transactions in ASEAN under the AEC Blueprint 2025. The strategic measures in this blueprint include standardised consumer rights and protection laws; a legal framework for online dispute resolution that accounts for available international standards; inter-operable, mutually recognised, secure,
2. prOgreSS aNd cHalleNgeS Of regIONal INtegratION IN aSeaN aNd eMergINg aSIa2. prOgreSS aNd cHalleNgeS Of regIONal INtegratION IN aSeaN aNd eMergINg aSIa
97ecONOMIc OUtlOOK fOr SOUtHeaSt aSIa, cHINa aNd INdIa 2018: fOSterINg grOWtH tHrOUgH dIgItalISatION © Oecd 2018
reliable and user-friendly e-identification and authorisation (electronic signature) initiatives; and a coherent and comprehensive framework for personal data protection.
The ASEAN Customs Transit System (ACTS) was created to guide the ASEAN Framework Agreement on the Facilitation of Goods in Transit and its protocols, through a computerised customs transit management system. ACTS is administratively simple and reduces the costs of moving and transporting goods between participating countries. The ACTS pilot project was implemented in 2016. Malaysia, Singapore and Thailand planned to pilot the system in late 2016 and early 2017.
The ASEAN Framework Agreement on the Facilitation of Cross-Border Transport of Passengers by Road Vehicles will increase trade in goods and enhance people-to-people connectivity in the region. The agreement promotes tourism and passenger mobility; it facilitates trade, investment and cultural partnership among ASEAN member countries. In November 2016, ASEAN transport ministers concluded negotiations on this agreement during the 22nd ASEAN transport ministers (ATM) meeting. Although they announced that they were ready to sign it soon, they have not done it yet. For example, Indonesia plans to sign it during the 23rd ATM meeting at Singapore in October 2017. Additionally in November 2016, the transport ministers recognised the progress made to ratify and enact domestic laws and regulations to implement the ASEAN Framework Agreement on the Facilitation of Goods in Transit, the ASEAN Framework Agreement on Multimodal Transport and the ASEAN Framework Agreement on the Facilitation of Inter-State Transport.
Another boost for regional integration is the WTO Trade Facilitation Agreement, which supports measures to expedite the movement, release and clearance of goods, including goods in transit. It also has provisions for technical assistance and capacity building (Box 2.1).
Box 2.1. WTO Trade Facilitation Agreement is signed, and TRIPS Agreement is updated
The WTO’s Trade Facilitation Agreement (TFA), which entered into force in February 2017, aims to promote global trade growth by eliminating non-tariff barriers such as bureaucratic delays and red tape. WTO members had concluded TFA negotiations at the 2013 Bali Ministerial Meeting. Two-thirds of these members, or 119 countries, ratified the agreement, exceeding the number of countries that accepted the agreement in the first place. This is a significant achievement: 119 countries have committed to combating the rise of protectionist sentiments around the world.
According to the WTO’s World Trade Report 2015, harmonising and upgrading customs requirements and procedures, as well as streamlining and simplifying application processes, can save time and reduce the trade costs of goods. At present, trade costs in high-income countries are equivalent to applying a 134% ad valorem tariff on a product; in developing countries, the corresponding figure would be 219%.
The TFA includes provisions on expediting the movement, release and clearance of goods, including goods in transit. In addition, it contains measures to promote effective co-operation between customs and other authorities on trade facilitation and customs compliance. A Trade Facilitation Agreement Facility was created to help developing and least-developed countries implement their part in the agreement so they can benefit fully from it. Least-developed countries have an additional year to prepare before the TFA comes into force, while developing countries need to implement only those provisions agreed upon from 22 January 2017. All developed countries in the WTO have implemented their commitments since January 2017. To date, all the ASEAN member countries, except for Indonesia, have ratified the TFA. In 2017, ASEAN economic ministers agreed to reduce trade transaction costs by 10% by 2020.
2. prOgreSS aNd cHalleNgeS Of regIONal INtegratION IN aSeaN aNd eMergINg aSIa
9998 ecONOMIc OUtlOOK fOr SOUtHeaSt aSIa, cHINa aNd INdIa 2018: fOSterINg grOWtH tHrOUgH dIgItalISatION © Oecd 2018 ecONOMIc OUtlOOK fOr SOUtHeaSt aSIa, cHINa aNd INdIa 2018: fOSterINg grOWtH tHrOUgH dIgItalISatION © Oecd 2018
Box 2.1. WTO Trade Facilitation Agreement is signed, and TRIPS Agreement is updated
Other related WTO agreements have been updated. In January 2017, the amendment to the WTO Trade-Related Aspects of Intellectual Property Rights (TRIPS) Agreement entered into force. This amendment increases the access of developing and least-developed countries to affordable generic medicines. In particular, it allows countries producing generic medicines under “compulsory licences” to export the medicines at reasonable prices to developing and least-developed countries with no or limited pharmaceutical production capacity. Before this amendment, most medicines produced under compulsory licences could be provided only to the domestic market of the producing country.
The effectiveness of both agreements in eliminating non-tariff barriers can be gauged in the coming years, when all countries have implemented their commitments according to their schedules.
Source: WTO (2015), World Trade Report 2015, www.wto.org/english/res_e/booksp_e/world_trade_report15_e.pdf.
Further tariff reduction on products will boost intra-ASEAN trade in the short to medium term. To ensure that tariff reduction and elimination increase trade in the long term, the NSW and the ASW must be implemented seamlessly on the ground. With the ASW launched and effectively managed, the trading of goods, in particular, can be done smoothly from permit application to fee payments for exporters. As for importers, the one-stop website can provide them with vital information and guidelines on how to import different products into different ASEAN countries.
Trade in services: ASEAN strives to liberalise services, but progress is slow
ASEAN has been working to liberalise its services sector since 1995. The region’s Economic Ministers signed the ASEAN Framework Agreement on Services on 15 December 1995, during the Fifth ASEAN Summit in Bangkok, Thailand. AFAS recognises the growing economic importance of services and the need to enhance and strengthen trade in services within ASEAN. It provides an important legal platform to empower members to incrementally open their markets to foreign competition, while also giving national treatment to services suppliers from ASEAN countries. All AFAS rules are consistent with international rules for trade in services, as set out in the WTO’s General Agreement on Trade in Services (GATS).
ASEAN Economic Ministers had set 2015 as the deadline for liberalising all services sub-sectors with flexibilities. Liberalisation concerns 12 broad sectors with 128 services sub-sectors listed in the WTO Services Sectoral Classification List. Two years after this deadline, progress has been slow for many ASEAN countries.
To date, the ASEAN Member States are intensifying efforts to finalise the outstanding 10th Package of Commitments under AFAS with the schedule for completion in 2017 (ASEAN Secretariat, 2017). The ninth package, signed in 2015 and the latest in effect, resulted from negotiations among ASEAN countries on measures that affect trade in selected services. This agreement highlights detailed commitments to liberalise the services sub-sectors in different ASEAN countries. The steps towards liberalisation are based on the targeted services and deadlines set in the AEC Blueprint 2025. The agreement is binding 180 days after its signing date for all parties involved that are ready.
(cont.)
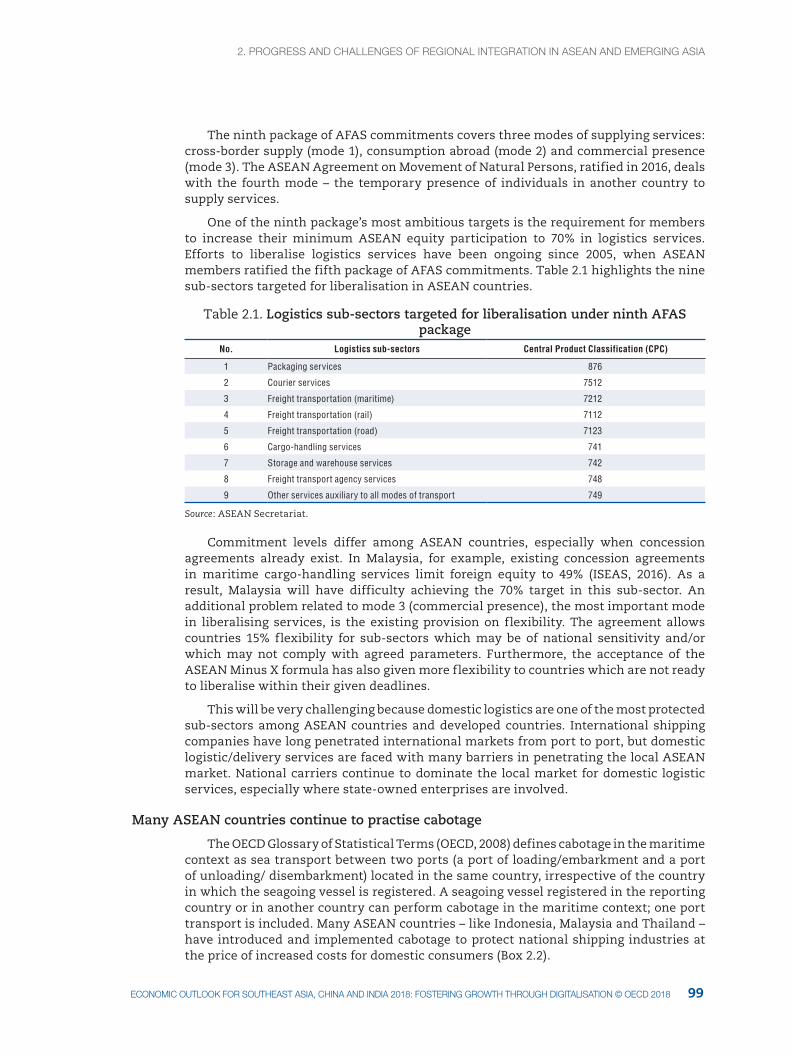
2. prOgreSS aNd cHalleNgeS Of regIONal INtegratION IN aSeaN aNd eMergINg aSIa2. prOgreSS aNd cHalleNgeS Of regIONal INtegratION IN aSeaN aNd eMergINg aSIa
99ecONOMIc OUtlOOK fOr SOUtHeaSt aSIa, cHINa aNd INdIa 2018: fOSterINg grOWtH tHrOUgH dIgItalISatION © Oecd 2018
The ninth package of AFAS commitments covers three modes of supplying services: cross-border supply (mode 1), consumption abroad (mode 2) and commercial presence (mode 3). The ASEAN Agreement on Movement of Natural Persons, ratified in 2016, deals with the fourth mode – the temporary presence of individuals in another country to supply services.
One of the ninth package’s most ambitious targets is the requirement for members to increase their minimum ASEAN equity participation to 70% in logistics services. Efforts to liberalise logistics services have been ongoing since 2005, when ASEAN members ratified the fifth package of AFAS commitments. Table 2.1 highlights the nine sub-sectors targeted for liberalisation in ASEAN countries.
Table 2.1. Logistics sub-sectors targeted for liberalisation under ninth AFAS package
No. Logistics sub-sectors Central Product Classification (CPC)
1 Packaging services 876
2 Courier services 7512
3 Freight transportation (maritime) 7212
4 Freight transportation (rail) 7112
5 Freight transportation (road) 7123
6 Cargo-handling services 741
7 Storage and warehouse services 742
8 Freight transport agency services 748
9 Other services auxiliary to all modes of transport 749
Source: ASEAN Secretariat.
Commitment levels differ among ASEAN countries, especially when concession agreements already exist. In Malaysia, for example, existing concession agreements in maritime cargo-handling services limit foreign equity to 49% (ISEAS, 2016). As a result, Malaysia will have difficulty achieving the 70% target in this sub-sector. An additional problem related to mode 3 (commercial presence), the most important mode in liberalising services, is the existing provision on flexibility. The agreement allows countries 15% flexibility for sub-sectors which may be of national sensitivity and/or which may not comply with agreed parameters. Furthermore, the acceptance of the ASEAN Minus X formula has also given more flexibility to countries which are not ready to liberalise within their given deadlines.
This will be very challenging because domestic logistics are one of the most protected sub-sectors among ASEAN countries and developed countries. International shipping companies have long penetrated international markets from port to port, but domestic logistic/delivery services are faced with many barriers in penetrating the local ASEAN market. National carriers continue to dominate the local market for domestic logistic services, especially where state-owned enterprises are involved.
Many ASEAN countries continue to practise cabotage
The OECD Glossary of Statistical Terms (OECD, 2008) defines cabotage in the maritime context as sea transport between two ports (a port of loading/embarkment and a port of unloading/ disembarkment) located in the same country, irrespective of the country in which the seagoing vessel is registered. A seagoing vessel registered in the reporting country or in another country can perform cabotage in the maritime context; one port transport is included. Many ASEAN countries – like Indonesia, Malaysia and Thailand – have introduced and implemented cabotage to protect national shipping industries at the price of increased costs for domestic consumers (Box 2.2).
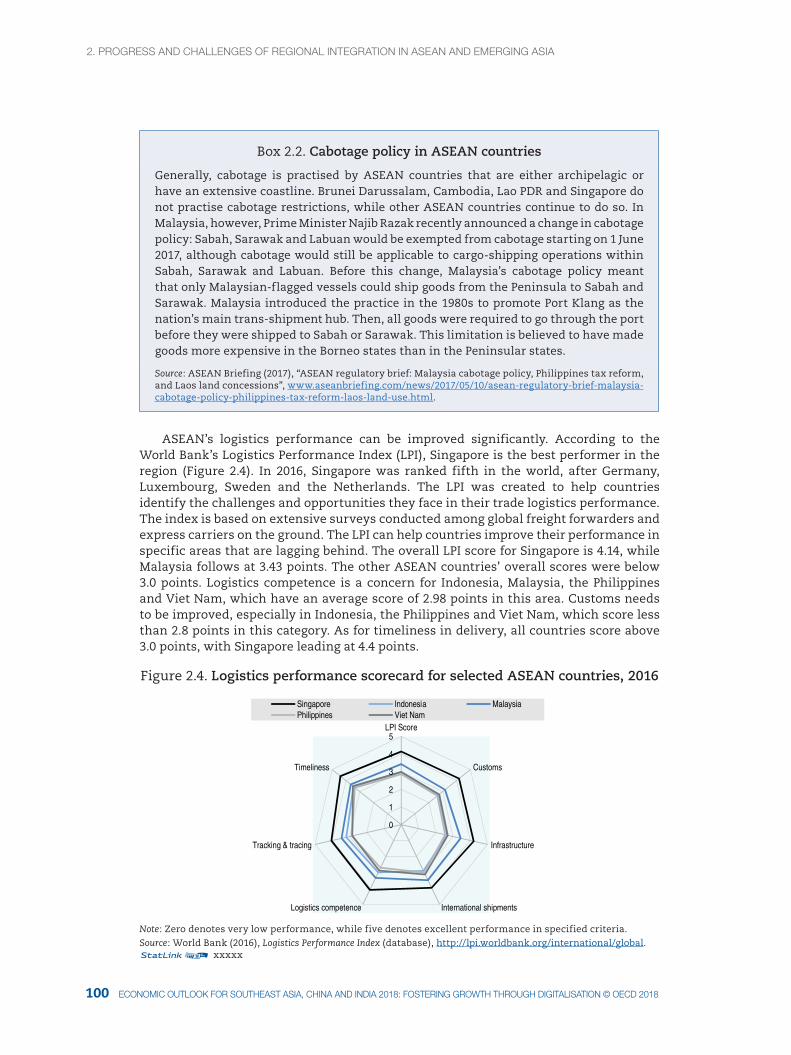
2. prOgreSS aNd cHalleNgeS Of regIONal INtegratION IN aSeaN aNd eMergINg aSIa
101100 ecONOMIc OUtlOOK fOr SOUtHeaSt aSIa, cHINa aNd INdIa 2018: fOSterINg grOWtH tHrOUgH dIgItalISatION © Oecd 2018 ecONOMIc OUtlOOK fOr SOUtHeaSt aSIa, cHINa aNd INdIa 2018: fOSterINg grOWtH tHrOUgH dIgItalISatION © Oecd 2018
Box 2.2. Cabotage policy in ASEAN countries
Generally, cabotage is practised by ASEAN countries that are either archipelagic or have an extensive coastline. Brunei Darussalam, Cambodia, Lao PDR and Singapore do not practise cabotage restrictions, while other ASEAN countries continue to do so. In Malaysia, however, Prime Minister Najib Razak recently announced a change in cabotage policy: Sabah, Sarawak and Labuan would be exempted from cabotage starting on 1 June 2017, although cabotage would still be applicable to cargo-shipping operations within Sabah, Sarawak and Labuan. Before this change, Malaysia’s cabotage policy meant that only Malaysian-flagged vessels could ship goods from the Peninsula to Sabah and Sarawak. Malaysia introduced the practice in the 1980s to promote Port Klang as the nation’s main trans-shipment hub. Then, all goods were required to go through the port before they were shipped to Sabah or Sarawak. This limitation is believed to have made goods more expensive in the Borneo states than in the Peninsular states.
Source: ASEAN Briefing (2017), “ASEAN regulatory brief: Malaysia cabotage policy, Philippines tax reform, and Laos land concessions”, www.aseanbriefing.com/news/2017/05/10/asean-regulatory-brief-malaysia-cabotage-policy-philippines-tax-reform-laos-land-use.html.
ASEAN’s logistics performance can be improved significantly. According to the World Bank’s Logistics Performance Index (LPI), Singapore is the best performer in the region (Figure 2.4). In 2016, Singapore was ranked fifth in the world, after Germany, Luxembourg, Sweden and the Netherlands. The LPI was created to help countries identify the challenges and opportunities they face in their trade logistics performance. The index is based on extensive surveys conducted among global freight forwarders and express carriers on the ground. The LPI can help countries improve their performance in specific areas that are lagging behind. The overall LPI score for Singapore is 4.14, while Malaysia follows at 3.43 points. The other ASEAN countries’ overall scores were below 3.0 points. Logistics competence is a concern for Indonesia, Malaysia, the Philippines and Viet Nam, which have an average score of 2.98 points in this area. Customs needs to be improved, especially in Indonesia, the Philippines and Viet Nam, which score less than 2.8 points in this category. As for timeliness in delivery, all countries score above 3.0 points, with Singapore leading at 4.4 points.
Figure 2.4. Logistics performance scorecard for selected ASEAN countries, 2016
0
1
2
3
4
5LPI Score
Customs
Infrastructure
International shipmentsLogistics competence
Tracking & tracing
Timeliness
Singapore Indonesia MalaysiaPhilippines Viet Nam
Note: Zero denotes very low performance, while five denotes excellent performance in specified criteria.Source: World Bank (2016), Logistics Performance Index (database), http://lpi.worldbank.org/international/global. 12 xxxxx
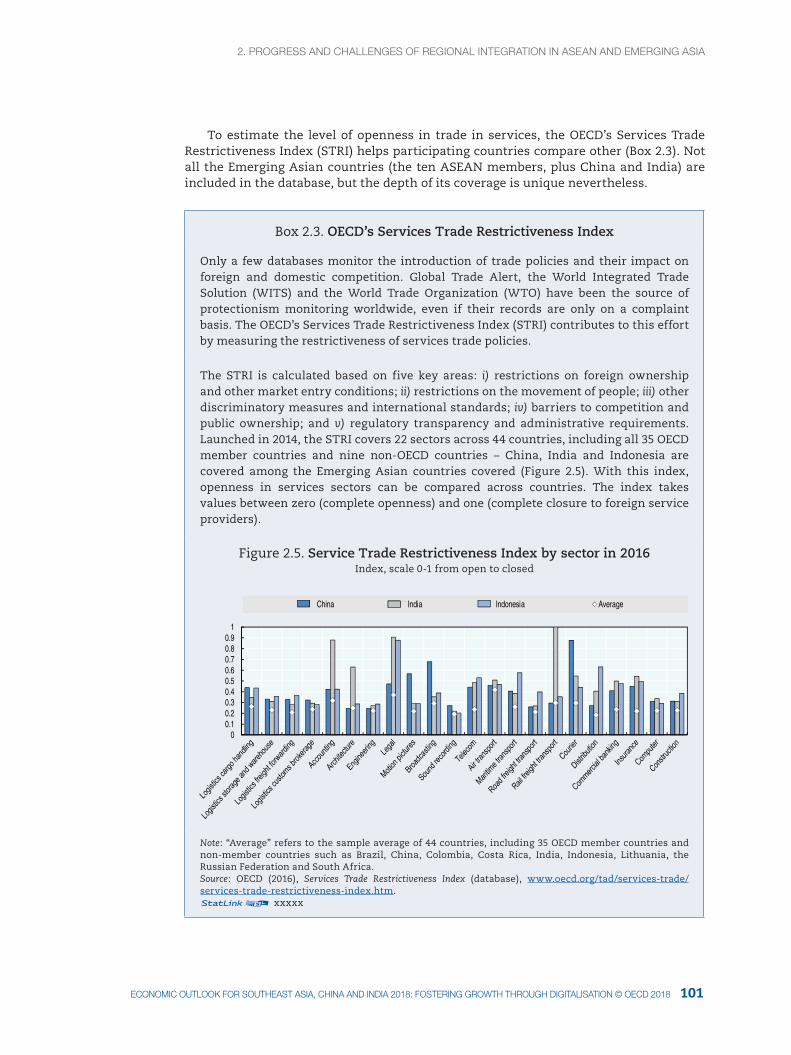
2. prOgreSS aNd cHalleNgeS Of regIONal INtegratION IN aSeaN aNd eMergINg aSIa2. prOgreSS aNd cHalleNgeS Of regIONal INtegratION IN aSeaN aNd eMergINg aSIa
101ecONOMIc OUtlOOK fOr SOUtHeaSt aSIa, cHINa aNd INdIa 2018: fOSterINg grOWtH tHrOUgH dIgItalISatION © Oecd 2018
To estimate the level of openness in trade in services, the OECD’s Services Trade Restrictiveness Index (STRI) helps participating countries compare other (Box 2.3). Not all the Emerging Asian countries (the ten ASEAN members, plus China and India) are included in the database, but the depth of its coverage is unique nevertheless.
Box 2.3. OECD’s Services Trade Restrictiveness Index
Only a few databases monitor the introduction of trade policies and their impact on foreign and domestic competition. Global Trade Alert, the World Integrated Trade Solution (WITS) and the World Trade Organization (WTO) have been the source of protectionism monitoring worldwide, even if their records are only on a complaint basis. The OECD’s Services Trade Restrictiveness Index (STRI) contributes to this effort by measuring the restrictiveness of services trade policies.
The STRI is calculated based on five key areas: i) restrictions on foreign ownership and other market entry conditions; ii) restrictions on the movement of people; iii) other discriminatory measures and international standards; iv) barriers to competition and public ownership; and v) regulatory transparency and administrative requirements. Launched in 2014, the STRI covers 22 sectors across 44 countries, including all 35 OECD member countries and nine non-OECD countries – China, India and Indonesia are covered among the Emerging Asian countries covered (Figure 2.5). With this index, openness in services sectors can be compared across countries. The index takes values between zero (complete openness) and one (complete closure to foreign service providers).
Figure 2.5. Service Trade Restrictiveness Index by sector in 2016 Index, scale 0-1 from open to closed
00.10.20.30.40.50.60.70.80.9
1
China India Indonesia Average
Note: “Average” refers to the sample average of 44 countries, including 35 OECD member countries and non-member countries such as Brazil, China, Colombia, Costa Rica, India, Indonesia, Lithuania, the Russian Federation and South Africa. Source: OECD (2016), Services Trade Restrictiveness Index (database), www.oecd.org/tad/services-trade/services-trade-restrictiveness-index.htm. 12 xxxxx
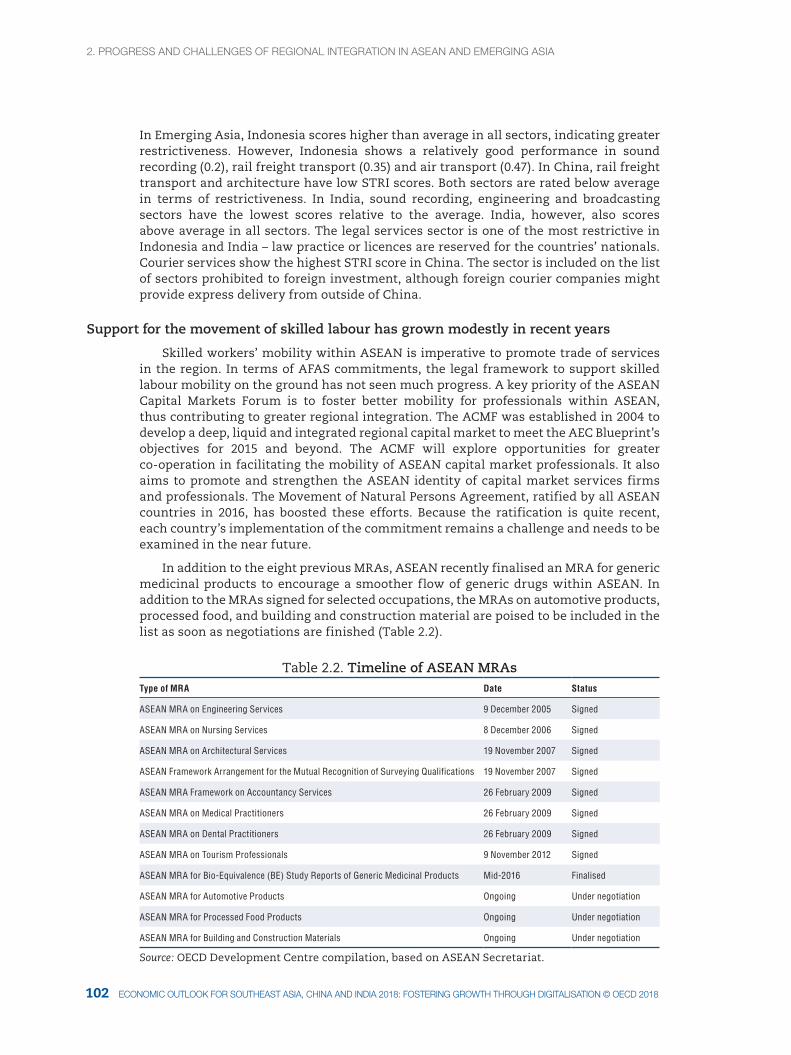
2. prOgreSS aNd cHalleNgeS Of regIONal INtegratION IN aSeaN aNd eMergINg aSIa
103102 ecONOMIc OUtlOOK fOr SOUtHeaSt aSIa, cHINa aNd INdIa 2018: fOSterINg grOWtH tHrOUgH dIgItalISatION © Oecd 2018 ecONOMIc OUtlOOK fOr SOUtHeaSt aSIa, cHINa aNd INdIa 2018: fOSterINg grOWtH tHrOUgH dIgItalISatION © Oecd 2018
In Emerging Asia, Indonesia scores higher than average in all sectors, indicating greater restrictiveness. However, Indonesia shows a relatively good performance in sound recording (0.2), rail freight transport (0.35) and air transport (0.47). In China, rail freight transport and architecture have low STRI scores. Both sectors are rated below average in terms of restrictiveness. In India, sound recording, engineering and broadcasting sectors have the lowest scores relative to the average. India, however, also scores above average in all sectors. The legal services sector is one of the most restrictive in Indonesia and India – law practice or licences are reserved for the countries’ nationals. Courier services show the highest STRI score in China. The sector is included on the list of sectors prohibited to foreign investment, although foreign courier companies might provide express delivery from outside of China.
Support for the movement of skilled labour has grown modestly in recent years
Skilled workers’ mobility within ASEAN is imperative to promote trade of services in the region. In terms of AFAS commitments, the legal framework to support skilled labour mobility on the ground has not seen much progress. A key priority of the ASEAN Capital Markets Forum is to foster better mobility for professionals within ASEAN, thus contributing to greater regional integration. The ACMF was established in 2004 to develop a deep, liquid and integrated regional capital market to meet the AEC Blueprint’s objectives for 2015 and beyond. The ACMF will explore opportunities for greater co-operation in facilitating the mobility of ASEAN capital market professionals. It also aims to promote and strengthen the ASEAN identity of capital market services firms and professionals. The Movement of Natural Persons Agreement, ratified by all ASEAN countries in 2016, has boosted these efforts. Because the ratification is quite recent, each country’s implementation of the commitment remains a challenge and needs to be examined in the near future.
In addition to the eight previous MRAs, ASEAN recently finalised an MRA for generic medicinal products to encourage a smoother flow of generic drugs within ASEAN. In addition to the MRAs signed for selected occupations, the MRAs on automotive products, processed food, and building and construction material are poised to be included in the list as soon as negotiations are finished (Table 2.2).
Table 2.2. Timeline of ASEAN MRAsType of MRA Date Status
ASEAN MRA on Engineering Services 9 December 2005 Signed
ASEAN MRA on Nursing Services 8 December 2006 Signed
ASEAN MRA on Architectural Services 19 November 2007 Signed
ASEAN Framework Arrangement for the Mutual Recognition of Surveying Qualifications 19 November 2007 Signed
ASEAN MRA Framework on Accountancy Services 26 February 2009 Signed
ASEAN MRA on Medical Practitioners 26 February 2009 Signed
ASEAN MRA on Dental Practitioners 26 February 2009 Signed
ASEAN MRA on Tourism Professionals 9 November 2012 Signed
ASEAN MRA for Bio-Equivalence (BE) Study Reports of Generic Medicinal Products Mid-2016 Finalised
ASEAN MRA for Automotive Products Ongoing Under negotiation
ASEAN MRA for Processed Food Products Ongoing Under negotiation
ASEAN MRA for Building and Construction Materials Ongoing Under negotiation
Source: OECD Development Centre compilation, based on ASEAN Secretariat.
2. prOgreSS aNd cHalleNgeS Of regIONal INtegratION IN aSeaN aNd eMergINg aSIa2. prOgreSS aNd cHalleNgeS Of regIONal INtegratION IN aSeaN aNd eMergINg aSIa
103ecONOMIc OUtlOOK fOr SOUtHeaSt aSIa, cHINa aNd INdIa 2018: fOSterINg grOWtH tHrOUgH dIgItalISatION © Oecd 2018
As highlighted in this section, ASEAN member countries can greatly improve its logistics services. The AFAS packages enable the countries to incrementally liberalise its service sub-sectors so that the AEC’s main vision – for goods and services to move seamlessly beyond national borders within ASEAN – can be realised.
Conclusion
In the past year, regional integration has progressed most significantly in the trade of goods and services sector. Overall, ASEAN is working rapidly to further reduce tariffs to meet the ATIGA commitments by 2018. However, the speed of implementing the ASEAN Trade in Goods Agreement schedule varies by country. The ASEAN-6 removed all import duties by 2010, except for items in the Sensitive and Highly Sensitive Lists; while the CLMV countries will also eliminate tariffs on some sensitive products by 2018. Additionally, the ASEAN member countries have made progress in implementing their ASW to further boost trade activities. While Indonesia, Malaysia, Viet Nam and Singapore have shown incremental progress in implementing their ASW, other countries like Brunei Darussalam, Cambodia, Lao PDR, Myanmar, the Philippines and Thailand may need more time. For the services sector, the ASEAN Economic Ministers had set 2015 as the deadline for liberalising all services sub-sectors with flexibilities. Liberalisation concerns 12 broad sectors with 128 services sub-sectors listed in the WTO Services Sectoral Classification List. Two years on, progress has been slow for many ASEAN countries. In terms of MRAs, its effectiveness needs to be supported by the movement of skilled labour, where room for growth is still ample. To gauge the impact of AFAS packages and the MRAs in liberalising the services sub-sectors, governments need to implement their schedules of commitments within the given deadlines, and these commitments must be in parallel with their implemented national policies.
2. prOgreSS aNd cHalleNgeS Of regIONal INtegratION IN aSeaN aNd eMergINg aSIa
NP104 ecONOMIc OUtlOOK fOr SOUtHeaSt aSIa, cHINa aNd INdIa 2018: fOSterINg grOWtH tHrOUgH dIgItalISatION © Oecd 2018
Notes
1. Import duties on the products listed in Schedule A (Inclusion List) of each ASEAN member country’s tariff liberalisation schedule shall be eliminated by 2010 for ASEAN-6 and 2015 for CLMV, in accordance with the schedule highlighted in the ATIGA.
2. Indonesia categorises rice (10.06) into ten items as part of its Highly Sensitive List in Schedule E, with an average tariff rate of 25% (Figure 2.3). The Philippines classifies 19 items with an average tariff rate of 35%, while Malaysia categorises rice into 13 items with a tariff rate of about 20% as part of its Schedule E (originally, Highly Sensitive List). Among the other ASEAN-6 countries, the average tariff rate of rice is zero for Brunei Darussalam, Singapore and Thailand in 2016 and 2018. Brunei Darussalam identifies rice as Schedule A, while Thailand shows it as Schedule F. On the other hand, Cambodia identifies rice as Schedule A, with three out of ten items having a 5% tariff in 2016 (the average is 1.5%) and with zero tariff in 2018. Viet Nam treats six out of ten items in rice as Schedule A (0%), and four as Schedule D (Sensitive List) with 5% tariff (the average is 2% tariff) in 2016 and 2018. Lao PDR and Myanmar categorise it as Schedule D (Sensitive List), while Lao PDR imposes 5% import tariffs (the average is 5%) in 2016 and 2018. Myanmar imposes 5% tariff on eight out of ten items, and zero tariffs on two (the average is 4%) in 2016 and 2018.
References
ASEAN Secretariat, www.asean.org.
ASEAN Secretariat (2017), ASEAN Annual Report 2016-2017, Partnering for Change, Engaging the World, Jakarta, Indoensia, http://asean.org/storage/2017/08/ASEAN-ANNUAL-REPORT-2016-2017-7-Aug.pdf.
ASEAN Briefing (2017), “ASEAN regulatory brief: Malaysia cabotage policy, Philippines tax reform, and Laos land concessions”, Asia Briefing Ltd., Hong Kong, China, www.aseanbriefing.com/news/2017/05/10/asean-regulatory-brief-malaysia-cabotage-policy-philippines-tax-reform-laos-land-use.html (accessed 23 July 2017).
ISEAS (2016), Logistics Integration in ASEAN Faces Serious Challenges, Issue: 2016, No. 55, ISEAS Yusof Ishak Institute, Singapore, https://www.iseas.edu.sg/images/pdf/ISEAS_Perspective_2016_55.pdf.
Ministry of Finance Indonesia (2017), Buku Tarif Kepabeanan Indonesia (BTKI) 2017, Directorate General for Customs and Tax, Jakarta.
OECD (2008), Glossary of Statistical Terms, OECD Publishing, Paris, https://stats.oecd.org/glossary/detail.asp?ID=4278.
OECD (2016), Services Trade Restrictiveness Index (database), OECD Publishing, Paris, www.oecd.org/tad/services-trade/services-trade-restrictiveness-index.htm.
World Bank (2016), Logistics Performance Index (database), World Bank, Washington, DC, http://lpi.worldbank.org/international/global.
WTO (2015), World Trade Report 2015, World Trade Organization, Geneva, Switzerland, www.wto.org/english/res_e/booksp_e/world_trade_report15_e.pdf.
105ecONOMIc OUtlOOK fOr SOUtHeaSt aSIa, cHINa aNd INdIa 2018: fOSterINg grOWtH tHrOUgH dIgItalISatION © Oecd 2018
Digitalisation and the expansion of the digital economy – the
convergence of fixed, mobile and broadcast networks, the increasing
connectivity of devices and objects, and the changes in social
interactions and personal relationships that these developments
bring about – are reshaping the manufacturing and services sectors
in Emerging Asia. These impacts are seen in the emergence of
new ways of doing business and effects on trade and productivity
trends. Policy makers in the region seeking to foster the continued
responsible development of digitalisation should consider addressing
trade restrictions, particularly those affecting trade in services;
barriers to investment in the digital economy; the need for the
development and reform of physical and regulatory infrastructure;
and labour market and social challenges. Optimal policy strategies
are likely to differ by country across the region.
Chapter 3
Digitalisation in manufacturing and services in Emerging Asia
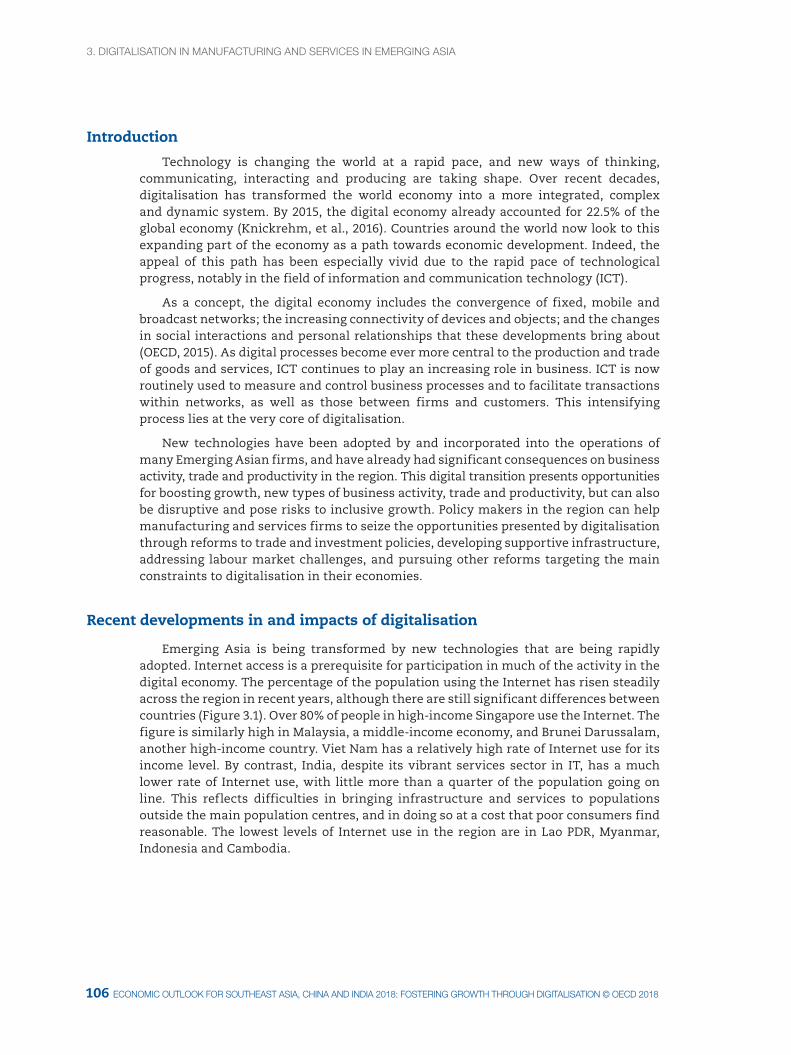
3. dIgItalISatION IN MaNUfactUrINg aNd ServIceS IN eMergINg aSIa
107106 ecONOMIc OUtlOOK fOr SOUtHeaSt aSIa, cHINa aNd INdIa 2018: fOSterINg grOWtH tHrOUgH dIgItalISatION © Oecd 2018 ecONOMIc OUtlOOK fOr SOUtHeaSt aSIa, cHINa aNd INdIa 2018: fOSterINg grOWtH tHrOUgH dIgItalISatION © Oecd 2018
Introduction
Technology is changing the world at a rapid pace, and new ways of thinking, communicating, interacting and producing are taking shape. Over recent decades, digitalisation has transformed the world economy into a more integrated, complex and dynamic system. By 2015, the digital economy already accounted for 22.5% of the global economy (Knickrehm, et al., 2016). Countries around the world now look to this expanding part of the economy as a path towards economic development. Indeed, the appeal of this path has been especially vivid due to the rapid pace of technological progress, notably in the field of information and communication technology (ICT).
As a concept, the digital economy includes the convergence of fixed, mobile and broadcast networks; the increasing connectivity of devices and objects; and the changes in social interactions and personal relationships that these developments bring about (OECD, 2015). As digital processes become ever more central to the production and trade of goods and services, ICT continues to play an increasing role in business. ICT is now routinely used to measure and control business processes and to facilitate transactions within networks, as well as those between firms and customers. This intensifying process lies at the very core of digitalisation.
New technologies have been adopted by and incorporated into the operations of many Emerging Asian firms, and have already had significant consequences on business activity, trade and productivity in the region. This digital transition presents opportunities for boosting growth, new types of business activity, trade and productivity, but can also be disruptive and pose risks to inclusive growth. Policy makers in the region can help manufacturing and services firms to seize the opportunities presented by digitalisation through reforms to trade and investment policies, developing supportive infrastructure, addressing labour market challenges, and pursuing other reforms targeting the main constraints to digitalisation in their economies.
Recent developments in and impacts of digitalisation
Emerging Asia is being transformed by new technologies that are being rapidly adopted. Internet access is a prerequisite for participation in much of the activity in the digital economy. The percentage of the population using the Internet has risen steadily across the region in recent years, although there are still significant differences between countries (Figure 3.1). Over 80% of people in high-income Singapore use the Internet. The figure is similarly high in Malaysia, a middle-income economy, and Brunei Darussalam, another high-income country. Viet Nam has a relatively high rate of Internet use for its income level. By contrast, India, despite its vibrant services sector in IT, has a much lower rate of Internet use, with little more than a quarter of the population going on line. This reflects difficulties in bringing infrastructure and services to populations outside the main population centres, and in doing so at a cost that poor consumers find reasonable. The lowest levels of Internet use in the region are in Lao PDR, Myanmar, Indonesia and Cambodia.
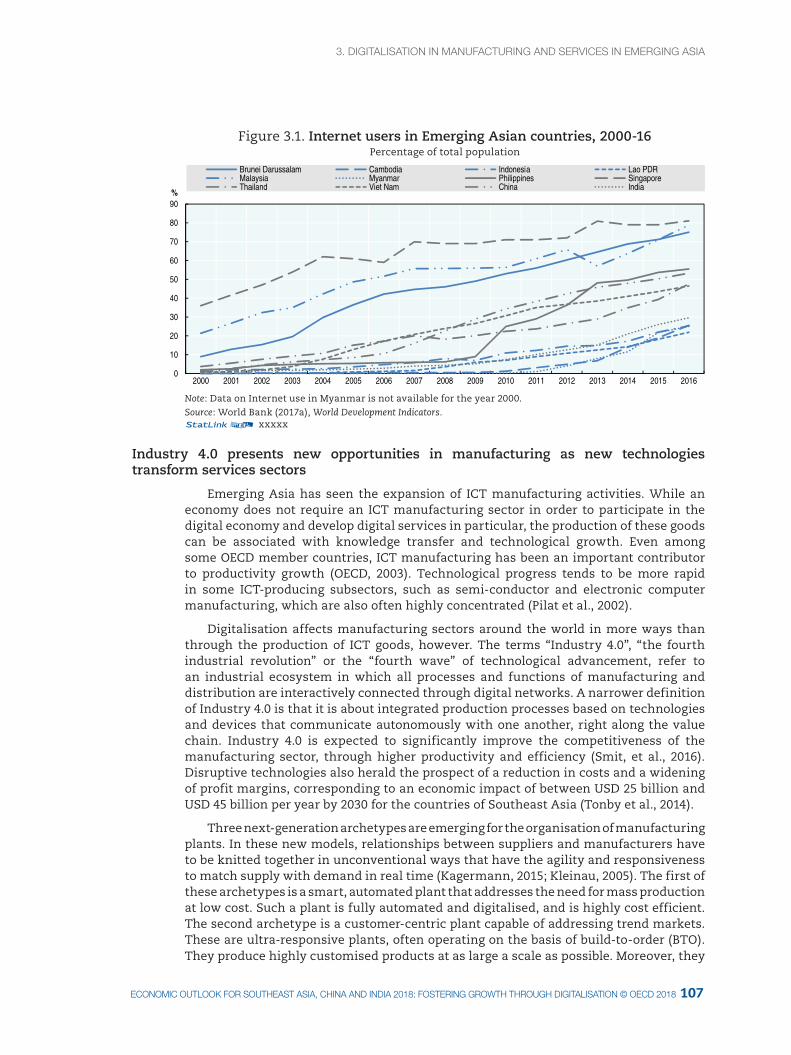
3. dIgItalISatION IN MaNUfactUrINg aNd ServIceS IN eMergINg aSIa3. dIgItalISatION IN MaNUfactUrINg aNd ServIceS IN eMergINg aSIa
107ecONOMIc OUtlOOK fOr SOUtHeaSt aSIa, cHINa aNd INdIa 2018: fOSterINg grOWtH tHrOUgH dIgItalISatION © Oecd 2018
Figure 3.1. Internet users in Emerging Asian countries, 2000-16Percentage of total population
0
10
20
30
40
50
60
70
80
90
2000 2001 2002 2003 2004 2005 2006 2007 2008 2009 2010 2011 2012 2013 2014 2015 2016
%
Brunei Darussalam Cambodia Indonesia Lao PDRMalaysia Myanmar Philippines SingaporeThailand Viet Nam China India
Note: Data on Internet use in Myanmar is not available for the year 2000.Source: World Bank (2017a), World Development Indicators.12 xxxxx
Industry 4.0 presents new opportunities in manufacturing as new technologies transform services sectors
Emerging Asia has seen the expansion of ICT manufacturing activities. While an economy does not require an ICT manufacturing sector in order to participate in the digital economy and develop digital services in particular, the production of these goods can be associated with knowledge transfer and technological growth. Even among some OECD member countries, ICT manufacturing has been an important contributor to productivity growth (OECD, 2003). Technological progress tends to be more rapid in some ICT-producing subsectors, such as semi-conductor and electronic computer manufacturing, which are also often highly concentrated (Pilat et al., 2002).
Digitalisation affects manufacturing sectors around the world in more ways than through the production of ICT goods, however. The terms “Industry 4.0”, “the fourth industrial revolution” or the “fourth wave” of technological advancement, refer to an industrial ecosystem in which all processes and functions of manufacturing and distribution are interactively connected through digital networks. A narrower definition of Industry 4.0 is that it is about integrated production processes based on technologies and devices that communicate autonomously with one another, right along the value chain. Industry 4.0 is expected to significantly improve the competitiveness of the manufacturing sector, through higher productivity and efficiency (Smit, et al., 2016). Disruptive technologies also herald the prospect of a reduction in costs and a widening of profit margins, corresponding to an economic impact of between USD 25 billion and USD 45 billion per year by 2030 for the countries of Southeast Asia (Tonby et al., 2014).
Three next-generation archetypes are emerging for the organisation of manufacturing plants. In these new models, relationships between suppliers and manufacturers have to be knitted together in unconventional ways that have the agility and responsiveness to match supply with demand in real time (Kagermann, 2015; Kleinau, 2005). The first of these archetypes is a smart, automated plant that addresses the need for mass production at low cost. Such a plant is fully automated and digitalised, and is highly cost efficient. The second archetype is a customer-centric plant capable of addressing trend markets. These are ultra-responsive plants, often operating on the basis of build-to-order (BTO). They produce highly customised products at as large a scale as possible. Moreover, they
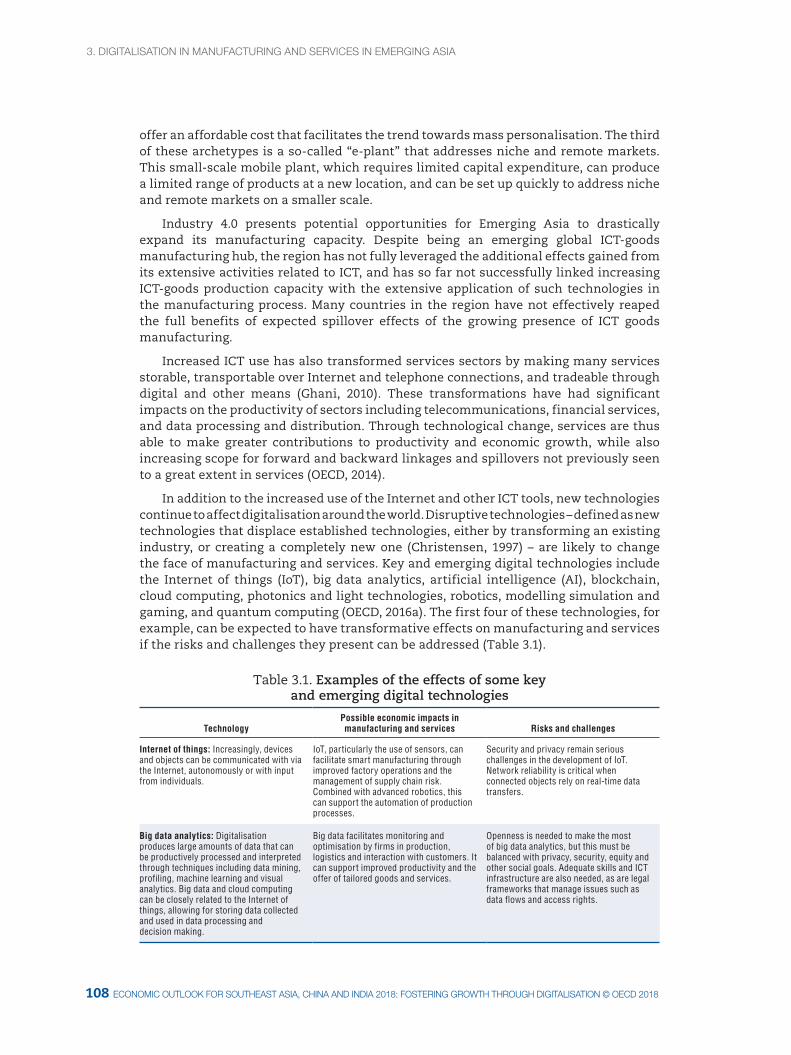
3. dIgItalISatION IN MaNUfactUrINg aNd ServIceS IN eMergINg aSIa
109108 ecONOMIc OUtlOOK fOr SOUtHeaSt aSIa, cHINa aNd INdIa 2018: fOSterINg grOWtH tHrOUgH dIgItalISatION © Oecd 2018 ecONOMIc OUtlOOK fOr SOUtHeaSt aSIa, cHINa aNd INdIa 2018: fOSterINg grOWtH tHrOUgH dIgItalISatION © Oecd 2018
offer an affordable cost that facilitates the trend towards mass personalisation. The third of these archetypes is a so-called “e-plant” that addresses niche and remote markets. This small-scale mobile plant, which requires limited capital expenditure, can produce a limited range of products at a new location, and can be set up quickly to address niche and remote markets on a smaller scale.
Industry 4.0 presents potential opportunities for Emerging Asia to drastically expand its manufacturing capacity. Despite being an emerging global ICT-goods manufacturing hub, the region has not fully leveraged the additional effects gained from its extensive activities related to ICT, and has so far not successfully linked increasing ICT-goods production capacity with the extensive application of such technologies in the manufacturing process. Many countries in the region have not effectively reaped the full benefits of expected spillover effects of the growing presence of ICT goods manufacturing.
Increased ICT use has also transformed services sectors by making many services storable, transportable over Internet and telephone connections, and tradeable through digital and other means (Ghani, 2010). These transformations have had significant impacts on the productivity of sectors including telecommunications, financial services, and data processing and distribution. Through technological change, services are thus able to make greater contributions to productivity and economic growth, while also increasing scope for forward and backward linkages and spillovers not previously seen to a great extent in services (OECD, 2014).
In addition to the increased use of the Internet and other ICT tools, new technologies continue to affect digitalisation around the world. Disruptive technologies – defined as new technologies that displace established technologies, either by transforming an existing industry, or creating a completely new one (Christensen, 1997) – are likely to change the face of manufacturing and services. Key and emerging digital technologies include the Internet of things (IoT), big data analytics, artificial intelligence (AI), blockchain, cloud computing, photonics and light technologies, robotics, modelling simulation and gaming, and quantum computing (OECD, 2016a). The first four of these technologies, for example, can be expected to have transformative effects on manufacturing and services if the risks and challenges they present can be addressed (Table 3.1).
Table 3.1. Examples of the effects of some key and emerging digital technologies
TechnologyPossible economic impacts in manufacturing and services Risks and challenges
Internet of things: Increasingly, devices and objects can be communicated with via the Internet, autonomously or with input from individuals.
IoT, particularly the use of sensors, can facilitate smart manufacturing through improved factory operations and the management of supply chain risk. Combined with advanced robotics, this can support the automation of production processes.
Security and privacy remain serious challenges in the development of IoT. Network reliability is critical when connected objects rely on real-time data transfers.
Big data analytics: Digitalisation produces large amounts of data that can be productively processed and interpreted through techniques including data mining, profiling, machine learning and visual analytics. Big data and cloud computing can be closely related to the Internet of things, allowing for storing data collected and used in data processing and decision making.
Big data facilitates monitoring and optimisation by firms in production, logistics and interaction with customers. It can support improved productivity and the offer of tailored goods and services.
Openness is needed to make the most of big data analytics, but this must be balanced with privacy, security, equity and other social goals. Adequate skills and ICT infrastructure are also needed, as are legal frameworks that manage issues such as data flows and access rights.

3. dIgItalISatION IN MaNUfactUrINg aNd ServIceS IN eMergINg aSIa3. dIgItalISatION IN MaNUfactUrINg aNd ServIceS IN eMergINg aSIa
109ecONOMIc OUtlOOK fOr SOUtHeaSt aSIa, cHINa aNd INdIa 2018: fOSterINg grOWtH tHrOUgH dIgItalISatION © Oecd 2018
Table 3.1. Examples of the effects of some key and emerging digital technologies
Artificial Intelligence: Intelligent machines and systems are able to apply knowledge to tasks including sensing, processing oral language, reasoning, learning, making decisions and manipulating physical objects. AI systems may use big data, cloud computing, IoT and other new technologies in learning and operating.
AI-enabled robotics and machinery may displace workers in activities beyond the repetitive tasks that have been automated in the past, including knowledge work. Finance and other services are being revolutionised by AI and big data analytics.
Reliable infrastructure is needed to make the most of AI. Legal frameworks must clarify liabilities arising from imperfect decision making by AI systems. Workers with complementary skills, such as creative and tacit thinking or social and physical dexterity, will be needed.
Blockchain: A distributed database that functions as a transparent and trusted public ledger, blockchain allows for protocols such as the digital currency bitcoin, that require trust without being managed by a central institution.
Potential applications of blockchain technology beyond digital currency include financial transactions such as cross-border remittance payments, likely affecting the businesses of clearing houses, banks and insurance companies. Record and verification systems may use the technology, which can also be used in the formulation of smart contracts.
The security of these systems depends on the number of users, though increased use also raises computational complexity. Pseudo-anonymous transactions may encourage the use of the technology in illegal activities.
Source: Compiled by OECD Development Centre, using OECD (2016a), OECD Science, Technology and Innovation Outlook 2016, OECD Publishing, Paris.
Emerging Asia is already being affected by digitalisation
The spread of production processes dependent on new technologies is visible in their use as inputs. In 2011, the most recent year for which data are available, a sizeable share of inputs in manufacturing and services came from sectors linked to ICT (Figure 3.2). These sectors included computer, electronic and optical equipment (sectors 30-33) of the third revision of the United Nations’ International Standard Industrial Classification (ISIC Rev. 3).1 They also included electrical machinery and apparatus not elsewhere classified (ISIC Rev. 3, sector 31), postal and telecommunications sectors (ISIC Rev. 3, sector 64), and computer and related activities (ISIC Rev. 3, sector 72). This was particularly true for the use of inputs from computer, electronics and optical equipment manufacturers, which accounted for an average 7.7% of manufacturing inputs used in Emerging Asian countries. Services sectors were relatively more likely to use inputs from ICT-linked sectors that were also in services, namely post and telecommunications and computer and related activities. Between 1995 and 2011, the share of inputs coming from ICT-linked services sectors increased in a majority of countries in the region. There was particular growth in the use of computer, electronic and optical equipment in Malaysia and the Philippines and post and telecommunications inputs in Malaysia.
For companies, two of the most accessible ways of participating in the digital economy are by establishing an online presence, and by doing business using digital means. Many firms in Emerging Asia use the Internet in their operations (Figure 3.3). In these terms, digital uptake is quite strong among businesses in the region, although trends vary substantially, from Cambodia, Lao PDR and Myanmar at the low end, to China, Viet Nam and Malaysia at the high end. Meanwhile, differences between manufacturing and services firms in their use of technology vary from country to country. In Malaysia, Myanmar, Viet Nam and China, for instance, manufacturers are more likely than services firms to have websites and to use email. In Cambodia, Indonesia, Lao PDR and Thailand, however, services firms are more likely to use these technologies than manufacturers. Perhaps unsurprisingly, the proportion of firms that use email in each country is higher than the corresponding proportion that have their own websites.
(cont.)
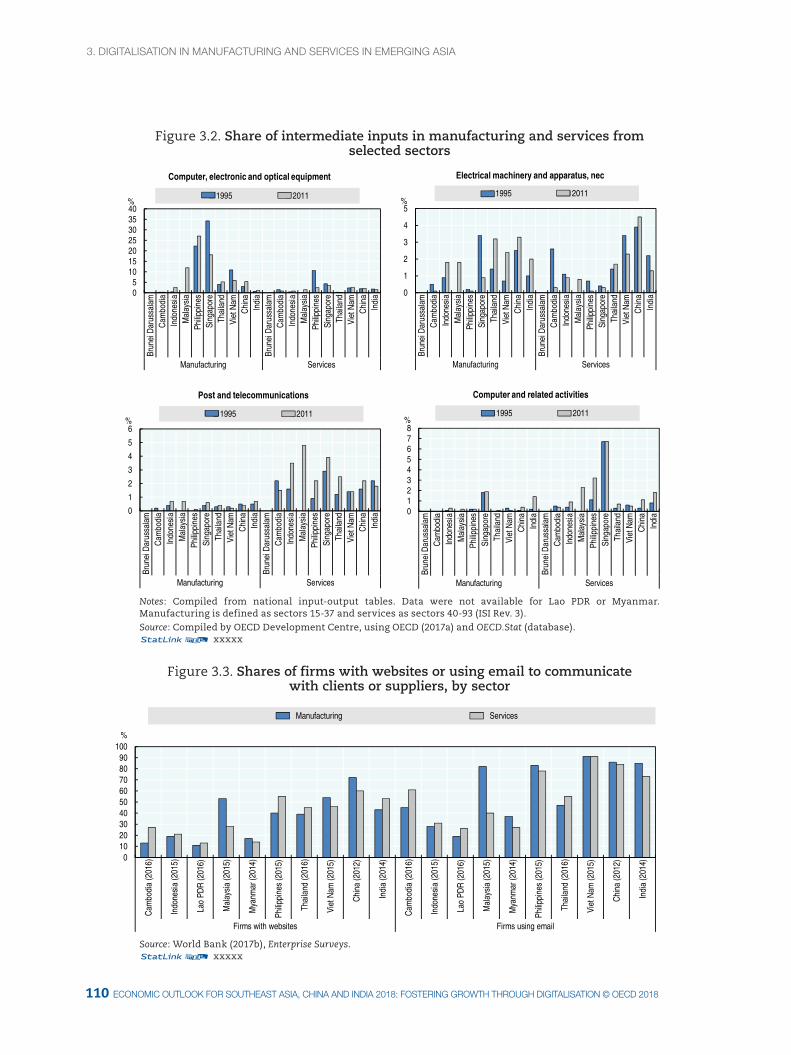
3. dIgItalISatION IN MaNUfactUrINg aNd ServIceS IN eMergINg aSIa
111110 ecONOMIc OUtlOOK fOr SOUtHeaSt aSIa, cHINa aNd INdIa 2018: fOSterINg grOWtH tHrOUgH dIgItalISatION © Oecd 2018 ecONOMIc OUtlOOK fOr SOUtHeaSt aSIa, cHINa aNd INdIa 2018: fOSterINg grOWtH tHrOUgH dIgItalISatION © Oecd 2018
Figure 3.2. Share of intermediate inputs in manufacturing and services from selected sectors
05
10152025303540
Brun
ei D
arus
sala
mC
ambo
dia
Indo
nesi
aM
alay
sia
Philip
pine
sSi
ngap
ore
Thai
land
Viet
Nam
Chi
naIn
dia
Brun
ei D
arus
sala
mC
ambo
dia
Indo
nesi
aM
alay
sia
Philip
pine
sSi
ngap
ore
Thai
land
Viet
Nam
Chi
naIn
dia
Manufacturing Services
%
Computer, electronic and optical equipment
1995 2011
0
1
2
3
4
5
Brun
ei D
arus
sala
mC
ambo
dia
Indo
nesi
aM
alay
sia
Philip
pine
sSi
ngap
ore
Thai
land
Viet
Nam
Chi
naIn
dia
Brun
ei D
arus
sala
mC
ambo
dia
Indo
nesi
aM
alay
sia
Philip
pine
sSi
ngap
ore
Thai
land
Viet
Nam
Chi
naIn
dia
Manufacturing Services
%
Electrical machinery and apparatus, nec
1995 2011
0
1
2
3
4
5
6
Brun
ei D
arus
sala
mC
ambo
dia
Indo
nesi
aM
alay
sia
Philip
pine
sSi
ngap
ore
Thai
land
Viet
Nam
Chi
naIn
dia
Brun
ei D
arus
sala
mC
ambo
dia
Indo
nesi
aM
alay
sia
Philip
pine
sSi
ngap
ore
Thai
land
Viet
Nam
Chi
naIn
dia
Manufacturing Services
%
Post and telecommunications
1995 2011
012345678
Brun
ei D
arus
sala
mC
ambo
dia
Indo
nesi
aM
alay
sia
Philip
pine
sSi
ngap
ore
Thai
land
Viet
Nam
Chi
naIn
dia
Brun
ei D
arus
sala
mC
ambo
dia
Indo
nesi
aM
alay
sia
Philip
pine
sSi
ngap
ore
Thai
land
Viet
Nam
Chi
naIn
dia
Manufacturing Services
%
Computer and related activities
1995 2011
Notes: Compiled from national input-output tables. Data were not available for Lao PDR or Myanmar. Manufacturing is defined as sectors 15-37 and services as sectors 40-93 (ISI Rev. 3).Source: Compiled by OECD Development Centre, using OECD (2017a) and OECD.Stat (database).12 xxxxx
Figure 3.3. Shares of firms with websites or using email to communicate with clients or suppliers, by sector
0102030405060708090
100
Cam
bodi
a (2
016)
Indo
nesi
a (2
015)
Lao
PDR
(201
6)
Mal
aysi
a (2
015)
Mya
nmar
(201
4)
Philip
pine
s (2
015)
Thai
land
(201
6)
Viet
Nam
(201
5)
Chi
na (2
012)
Indi
a (2
014)
Cam
bodi
a (2
016)
Indo
nesi
a (2
015)
Lao
PDR
(201
6)
Mal
aysi
a (2
015)
Mya
nmar
(201
4)
Philip
pine
s (2
015)
Thai
land
(201
6)
Viet
Nam
(201
5)
Chi
na (2
012)
Indi
a (2
014)
Firms with websites Firms using email
%
Manufacturing Services
Source: World Bank (2017b), Enterprise Surveys.12 xxxxx
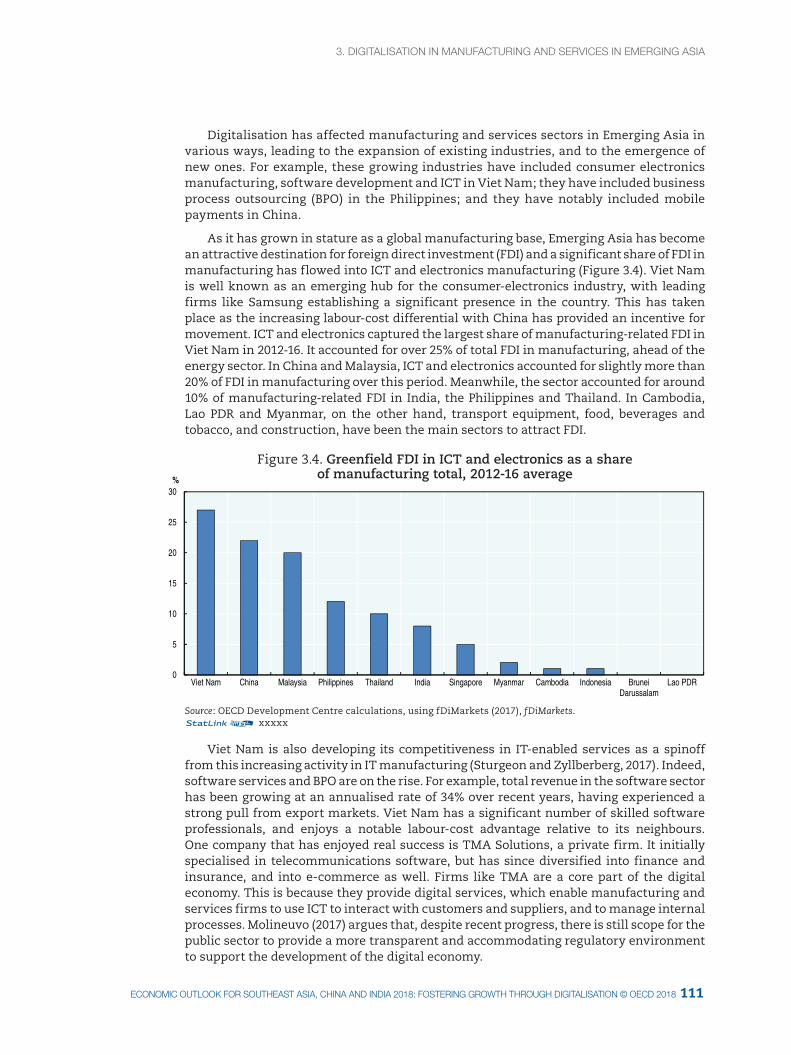
3. dIgItalISatION IN MaNUfactUrINg aNd ServIceS IN eMergINg aSIa3. dIgItalISatION IN MaNUfactUrINg aNd ServIceS IN eMergINg aSIa
111ecONOMIc OUtlOOK fOr SOUtHeaSt aSIa, cHINa aNd INdIa 2018: fOSterINg grOWtH tHrOUgH dIgItalISatION © Oecd 2018
Digitalisation has affected manufacturing and services sectors in Emerging Asia in various ways, leading to the expansion of existing industries, and to the emergence of new ones. For example, these growing industries have included consumer electronics manufacturing, software development and ICT in Viet Nam; they have included business process outsourcing (BPO) in the Philippines; and they have notably included mobile payments in China.
As it has grown in stature as a global manufacturing base, Emerging Asia has become an attractive destination for foreign direct investment (FDI) and a significant share of FDI in manufacturing has flowed into ICT and electronics manufacturing (Figure 3.4). Viet Nam is well known as an emerging hub for the consumer-electronics industry, with leading firms like Samsung establishing a significant presence in the country. This has taken place as the increasing labour-cost differential with China has provided an incentive for movement. ICT and electronics captured the largest share of manufacturing-related FDI in Viet Nam in 2012-16. It accounted for over 25% of total FDI in manufacturing, ahead of the energy sector. In China and Malaysia, ICT and electronics accounted for slightly more than 20% of FDI in manufacturing over this period. Meanwhile, the sector accounted for around 10% of manufacturing-related FDI in India, the Philippines and Thailand. In Cambodia, Lao PDR and Myanmar, on the other hand, transport equipment, food, beverages and tobacco, and construction, have been the main sectors to attract FDI.
Figure 3.4. Greenfield FDI in ICT and electronics as a share of manufacturing total, 2012-16 average
0
5
10
15
20
25
30
Viet Nam China Malaysia Philippines Thailand India Singapore Myanmar Cambodia Indonesia BruneiDarussalam
Lao PDR
%
Source: OECD Development Centre calculations, using fDiMarkets (2017), fDiMarkets.12 xxxxx
Viet Nam is also developing its competitiveness in IT-enabled services as a spinoff from this increasing activity in IT manufacturing (Sturgeon and Zyllberberg, 2017). Indeed, software services and BPO are on the rise. For example, total revenue in the software sector has been growing at an annualised rate of 34% over recent years, having experienced a strong pull from export markets. Viet Nam has a significant number of skilled software professionals, and enjoys a notable labour-cost advantage relative to its neighbours. One company that has enjoyed real success is TMA Solutions, a private firm. It initially specialised in telecommunications software, but has since diversified into finance and insurance, and into e-commerce as well. Firms like TMA are a core part of the digital economy. This is because they provide digital services, which enable manufacturing and services firms to use ICT to interact with customers and suppliers, and to manage internal processes. Molineuvo (2017) argues that, despite recent progress, there is still scope for the public sector to provide a more transparent and accommodating regulatory environment to support the development of the digital economy.
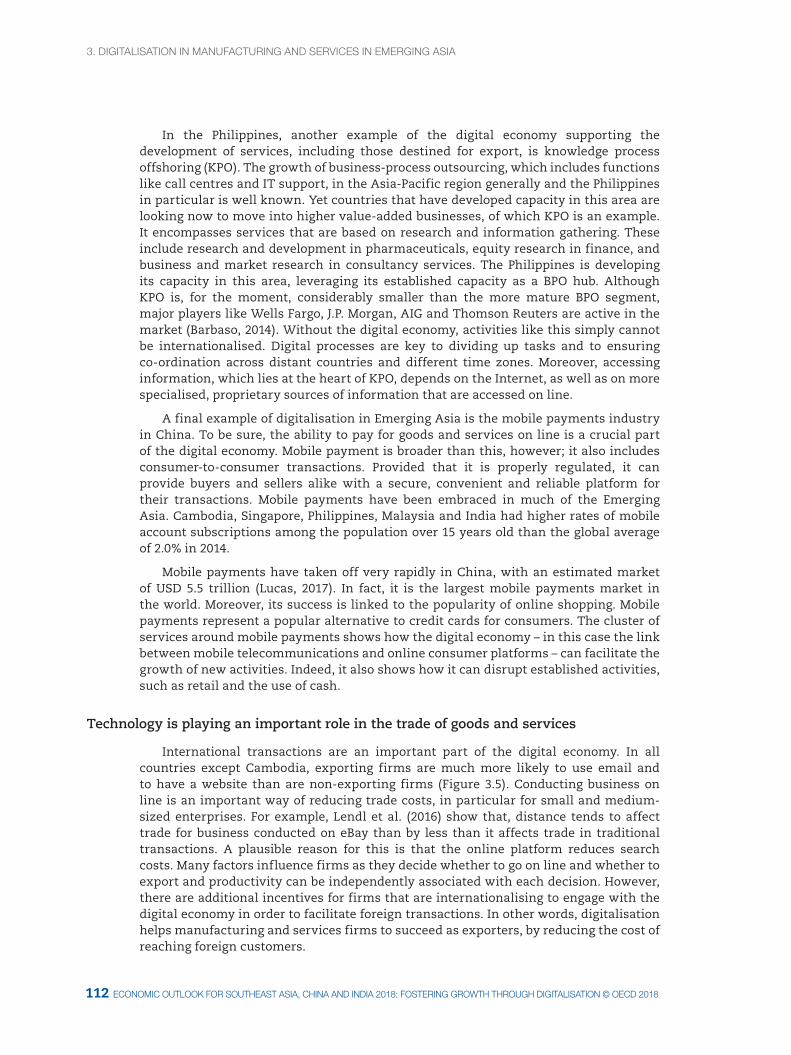
3. dIgItalISatION IN MaNUfactUrINg aNd ServIceS IN eMergINg aSIa
113112 ecONOMIc OUtlOOK fOr SOUtHeaSt aSIa, cHINa aNd INdIa 2018: fOSterINg grOWtH tHrOUgH dIgItalISatION © Oecd 2018 ecONOMIc OUtlOOK fOr SOUtHeaSt aSIa, cHINa aNd INdIa 2018: fOSterINg grOWtH tHrOUgH dIgItalISatION © Oecd 2018
In the Philippines, another example of the digital economy supporting the development of services, including those destined for export, is knowledge process offshoring (KPO). The growth of business-process outsourcing, which includes functions like call centres and IT support, in the Asia-Pacific region generally and the Philippines in particular is well known. Yet countries that have developed capacity in this area are looking now to move into higher value-added businesses, of which KPO is an example. It encompasses services that are based on research and information gathering. These include research and development in pharmaceuticals, equity research in finance, and business and market research in consultancy services. The Philippines is developing its capacity in this area, leveraging its established capacity as a BPO hub. Although KPO is, for the moment, considerably smaller than the more mature BPO segment, major players like Wells Fargo, J.P. Morgan, AIG and Thomson Reuters are active in the market (Barbaso, 2014). Without the digital economy, activities like this simply cannot be internationalised. Digital processes are key to dividing up tasks and to ensuring co-ordination across distant countries and different time zones. Moreover, accessing information, which lies at the heart of KPO, depends on the Internet, as well as on more specialised, proprietary sources of information that are accessed on line.
A final example of digitalisation in Emerging Asia is the mobile payments industry in China. To be sure, the ability to pay for goods and services on line is a crucial part of the digital economy. Mobile payment is broader than this, however; it also includes consumer-to-consumer transactions. Provided that it is properly regulated, it can provide buyers and sellers alike with a secure, convenient and reliable platform for their transactions. Mobile payments have been embraced in much of the Emerging Asia. Cambodia, Singapore, Philippines, Malaysia and India had higher rates of mobile account subscriptions among the population over 15 years old than the global average of 2.0% in 2014.
Mobile payments have taken off very rapidly in China, with an estimated market of USD 5.5 trillion (Lucas, 2017). In fact, it is the largest mobile payments market in the world. Moreover, its success is linked to the popularity of online shopping. Mobile payments represent a popular alternative to credit cards for consumers. The cluster of services around mobile payments shows how the digital economy – in this case the link between mobile telecommunications and online consumer platforms – can facilitate the growth of new activities. Indeed, it also shows how it can disrupt established activities, such as retail and the use of cash.
Technology is playing an important role in the trade of goods and services
International transactions are an important part of the digital economy. In all countries except Cambodia, exporting firms are much more likely to use email and to have a website than are non-exporting firms (Figure 3.5). Conducting business on line is an important way of reducing trade costs, in particular for small and medium-sized enterprises. For example, Lendl et al. (2016) show that, distance tends to affect trade for business conducted on eBay than by less than it affects trade in traditional transactions. A plausible reason for this is that the online platform reduces search costs. Many factors influence firms as they decide whether to go on line and whether to export and productivity can be independently associated with each decision. However, there are additional incentives for firms that are internationalising to engage with the digital economy in order to facilitate foreign transactions. In other words, digitalisation helps manufacturing and services firms to succeed as exporters, by reducing the cost of reaching foreign customers.
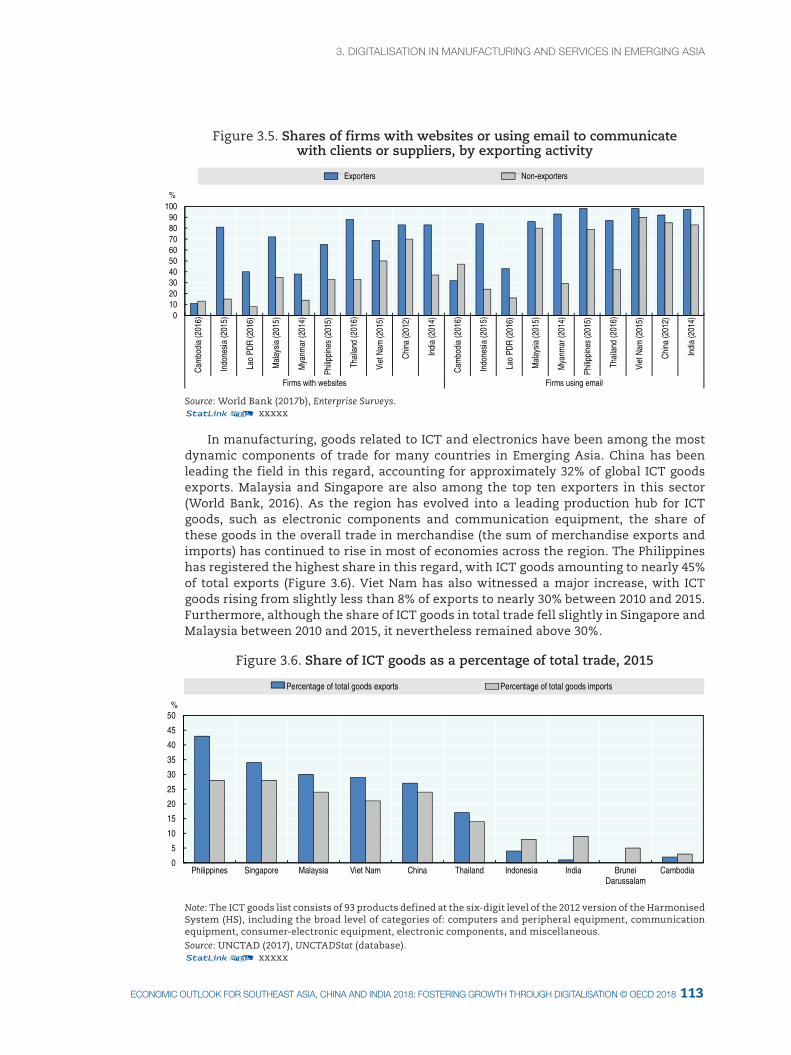
3. dIgItalISatION IN MaNUfactUrINg aNd ServIceS IN eMergINg aSIa3. dIgItalISatION IN MaNUfactUrINg aNd ServIceS IN eMergINg aSIa
113ecONOMIc OUtlOOK fOr SOUtHeaSt aSIa, cHINa aNd INdIa 2018: fOSterINg grOWtH tHrOUgH dIgItalISatION © Oecd 2018
Figure 3.5. Shares of firms with websites or using email to communicate with clients or suppliers, by exporting activity
0102030405060708090
100C
ambo
dia
(201
6)
Indo
nesi
a (2
015)
Lao
PDR
(201
6)
Mal
aysi
a (2
015)
Mya
nmar
(201
4)
Philip
pine
s (2
015)
Thai
land
(201
6)
Viet
Nam
(201
5)
Chin
a (2
012)
Indi
a (2
014)
Cam
bodi
a (2
016)
Indo
nesi
a (2
015)
Lao
PDR
(201
6)
Mal
aysi
a (2
015)
Mya
nmar
(201
4)
Philip
pine
s (2
015)
Thai
land
(201
6)
Viet
Nam
(201
5)
Chin
a (2
012)
Indi
a (2
014)
Firms with websites Firms using email
%
Exporters Non-exporters
Source: World Bank (2017b), Enterprise Surveys.12 xxxxx
In manufacturing, goods related to ICT and electronics have been among the most dynamic components of trade for many countries in Emerging Asia. China has been leading the field in this regard, accounting for approximately 32% of global ICT goods exports. Malaysia and Singapore are also among the top ten exporters in this sector (World Bank, 2016). As the region has evolved into a leading production hub for ICT goods, such as electronic components and communication equipment, the share of these goods in the overall trade in merchandise (the sum of merchandise exports and imports) has continued to rise in most of economies across the region. The Philippines has registered the highest share in this regard, with ICT goods amounting to nearly 45% of total exports (Figure 3.6). Viet Nam has also witnessed a major increase, with ICT goods rising from slightly less than 8% of exports to nearly 30% between 2010 and 2015. Furthermore, although the share of ICT goods in total trade fell slightly in Singapore and Malaysia between 2010 and 2015, it nevertheless remained above 30%.
Figure 3.6. Share of ICT goods as a percentage of total trade, 2015
0
5
10
15
20
25
30
35
40
45
50
Philippines Singapore Malaysia Viet Nam China Thailand Indonesia India BruneiDarussalam
Cambodia
%
Percentage of total goods exports Percentage of total goods imports
Note: The ICT goods list consists of 93 products defined at the six-digit level of the 2012 version of the Harmonised System (HS), including the broad level of categories of: computers and peripheral equipment, communication equipment, consumer-electronic equipment, electronic components, and miscellaneous.Source: UNCTAD (2017), UNCTADStat (database). 12 xxxxx
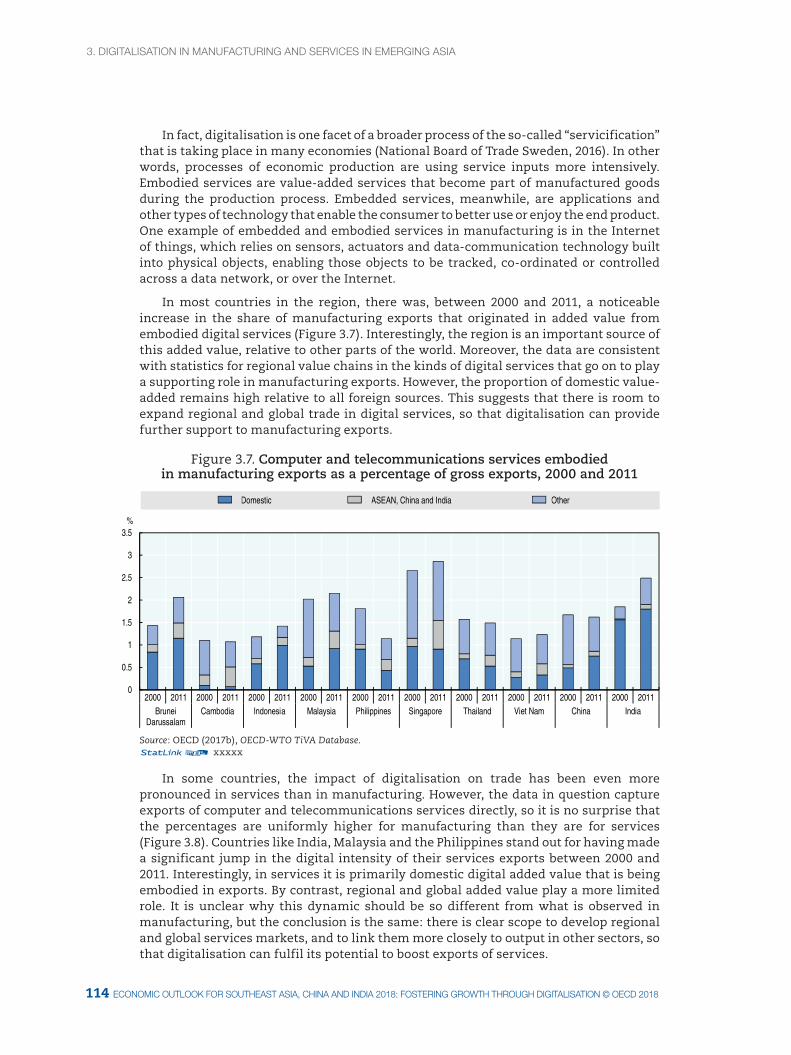
3. dIgItalISatION IN MaNUfactUrINg aNd ServIceS IN eMergINg aSIa
115114 ecONOMIc OUtlOOK fOr SOUtHeaSt aSIa, cHINa aNd INdIa 2018: fOSterINg grOWtH tHrOUgH dIgItalISatION © Oecd 2018 ecONOMIc OUtlOOK fOr SOUtHeaSt aSIa, cHINa aNd INdIa 2018: fOSterINg grOWtH tHrOUgH dIgItalISatION © Oecd 2018
In fact, digitalisation is one facet of a broader process of the so-called “servicification” that is taking place in many economies (National Board of Trade Sweden, 2016). In other words, processes of economic production are using service inputs more intensively. Embodied services are value-added services that become part of manufactured goods during the production process. Embedded services, meanwhile, are applications and other types of technology that enable the consumer to better use or enjoy the end product. One example of embedded and embodied services in manufacturing is in the Internet of things, which relies on sensors, actuators and data-communication technology built into physical objects, enabling those objects to be tracked, co-ordinated or controlled across a data network, or over the Internet.
In most countries in the region, there was, between 2000 and 2011, a noticeable increase in the share of manufacturing exports that originated in added value from embodied digital services (Figure 3.7). Interestingly, the region is an important source of this added value, relative to other parts of the world. Moreover, the data are consistent with statistics for regional value chains in the kinds of digital services that go on to play a supporting role in manufacturing exports. However, the proportion of domestic value-added remains high relative to all foreign sources. This suggests that there is room to expand regional and global trade in digital services, so that digitalisation can provide further support to manufacturing exports.
Figure 3.7. Computer and telecommunications services embodied in manufacturing exports as a percentage of gross exports, 2000 and 2011
0
0.5
1
1.5
2
2.5
3
3.5
2000 2011 2000 2011 2000 2011 2000 2011 2000 2011 2000 2011 2000 2011 2000 2011 2000 2011 2000 2011Brunei
DarussalamCambodia Indonesia Malaysia Philippines Singapore Thailand Viet Nam China India
%
Domestic ASEAN, China and India Other
Source: OECD (2017b), OECD-WTO TiVA Database.12 xxxxx
In some countries, the impact of digitalisation on trade has been even more pronounced in services than in manufacturing. However, the data in question capture exports of computer and telecommunications services directly, so it is no surprise that the percentages are uniformly higher for manufacturing than they are for services (Figure 3.8). Countries like India, Malaysia and the Philippines stand out for having made a significant jump in the digital intensity of their services exports between 2000 and 2011. Interestingly, in services it is primarily domestic digital added value that is being embodied in exports. By contrast, regional and global added value play a more limited role. It is unclear why this dynamic should be so different from what is observed in manufacturing, but the conclusion is the same: there is clear scope to develop regional and global services markets, and to link them more closely to output in other sectors, so that digitalisation can fulfil its potential to boost exports of services.
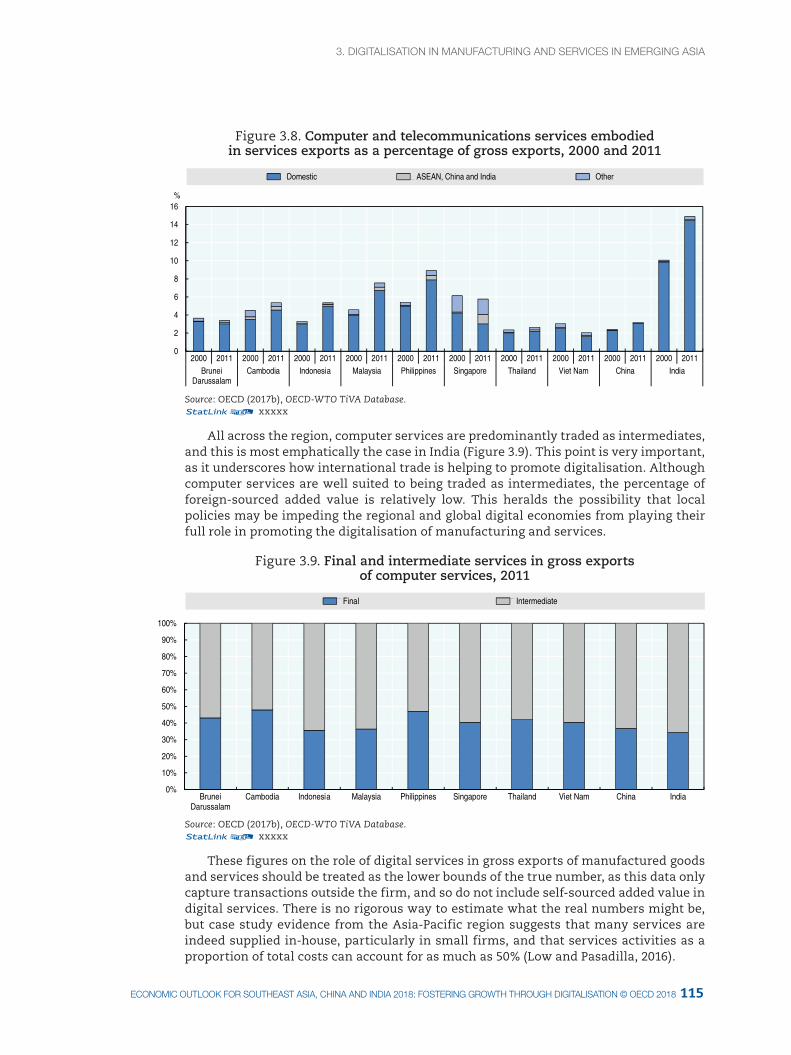
3. dIgItalISatION IN MaNUfactUrINg aNd ServIceS IN eMergINg aSIa3. dIgItalISatION IN MaNUfactUrINg aNd ServIceS IN eMergINg aSIa
115ecONOMIc OUtlOOK fOr SOUtHeaSt aSIa, cHINa aNd INdIa 2018: fOSterINg grOWtH tHrOUgH dIgItalISatION © Oecd 2018
Figure 3.8. Computer and telecommunications services embodied in services exports as a percentage of gross exports, 2000 and 2011
0
2
4
6
8
10
12
14
16
2000 2011 2000 2011 2000 2011 2000 2011 2000 2011 2000 2011 2000 2011 2000 2011 2000 2011 2000 2011Brunei
DarussalamCambodia Indonesia Malaysia Philippines Singapore Thailand Viet Nam China India
%
Domestic ASEAN, China and India Other
Source: OECD (2017b), OECD-WTO TiVA Database.12 xxxxx
All across the region, computer services are predominantly traded as intermediates, and this is most emphatically the case in India (Figure 3.9). This point is very important, as it underscores how international trade is helping to promote digitalisation. Although computer services are well suited to being traded as intermediates, the percentage of foreign-sourced added value is relatively low. This heralds the possibility that local policies may be impeding the regional and global digital economies from playing their full role in promoting the digitalisation of manufacturing and services.
Figure 3.9. Final and intermediate services in gross exports of computer services, 2011
0%
10%
20%
30%
40%
50%
60%
70%
80%
90%
100%
BruneiDarussalam
Cambodia Indonesia Malaysia Philippines Singapore Thailand Viet Nam China India
Final Intermediate
Source: OECD (2017b), OECD-WTO TiVA Database.12 xxxxx
These figures on the role of digital services in gross exports of manufactured goods and services should be treated as the lower bounds of the true number, as this data only capture transactions outside the firm, and so do not include self-sourced added value in digital services. There is no rigorous way to estimate what the real numbers might be, but case study evidence from the Asia-Pacific region suggests that many services are indeed supplied in-house, particularly in small firms, and that services activities as a proportion of total costs can account for as much as 50% (Low and Pasadilla, 2016).
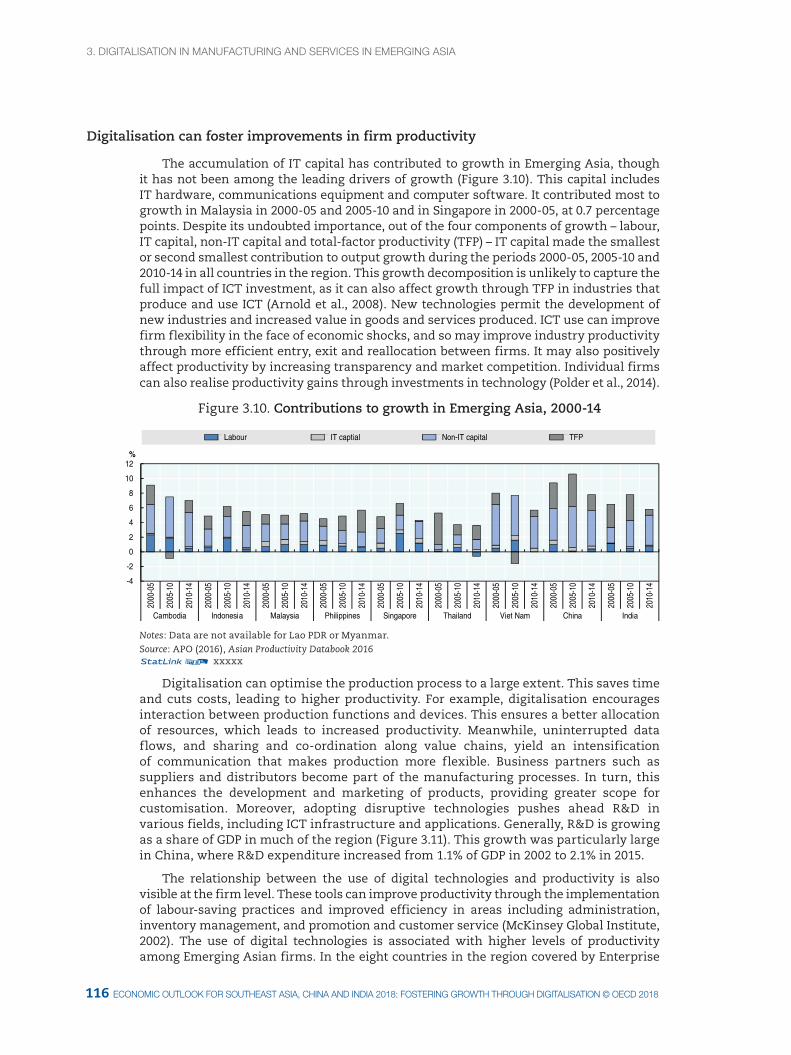
3. dIgItalISatION IN MaNUfactUrINg aNd ServIceS IN eMergINg aSIa
117116 ecONOMIc OUtlOOK fOr SOUtHeaSt aSIa, cHINa aNd INdIa 2018: fOSterINg grOWtH tHrOUgH dIgItalISatION © Oecd 2018 ecONOMIc OUtlOOK fOr SOUtHeaSt aSIa, cHINa aNd INdIa 2018: fOSterINg grOWtH tHrOUgH dIgItalISatION © Oecd 2018
Digitalisation can foster improvements in firm productivity
The accumulation of IT capital has contributed to growth in Emerging Asia, though it has not been among the leading drivers of growth (Figure 3.10). This capital includes IT hardware, communications equipment and computer software. It contributed most to growth in Malaysia in 2000-05 and 2005-10 and in Singapore in 2000-05, at 0.7 percentage points. Despite its undoubted importance, out of the four components of growth – labour, IT capital, non-IT capital and total-factor productivity (TFP) – IT capital made the smallest or second smallest contribution to output growth during the periods 2000-05, 2005-10 and 2010-14 in all countries in the region. This growth decomposition is unlikely to capture the full impact of ICT investment, as it can also affect growth through TFP in industries that produce and use ICT (Arnold et al., 2008). New technologies permit the development of new industries and increased value in goods and services produced. ICT use can improve firm flexibility in the face of economic shocks, and so may improve industry productivity through more efficient entry, exit and reallocation between firms. It may also positively affect productivity by increasing transparency and market competition. Individual firms can also realise productivity gains through investments in technology (Polder et al., 2014).
Figure 3.10. Contributions to growth in Emerging Asia, 2000-14
-4
-2
0
2
4
6
8
10
12
2000
-05
2005
-10
2010
-14
2000
-05
2005
-10
2010
-14
2000
-05
2005
-10
2010
-14
2000
-05
2005
-10
2010
-14
2000
-05
2005
-10
2010
-14
2000
-05
2005
-10
2010
-14
2000
-05
2005
-10
2010
-14
2000
-05
2005
-10
2010
-14
2000
-05
2005
-10
2010
-14
Cambodia Indonesia Malaysia Philippines Singapore Thailand Viet Nam China India
%
Labour IT captial Non-IT capital TFP
Notes: Data are not available for Lao PDR or Myanmar.Source: APO (2016), Asian Productivity Databook 201612 xxxxx
Digitalisation can optimise the production process to a large extent. This saves time and cuts costs, leading to higher productivity. For example, digitalisation encourages interaction between production functions and devices. This ensures a better allocation of resources, which leads to increased productivity. Meanwhile, uninterrupted data flows, and sharing and co-ordination along value chains, yield an intensification of communication that makes production more flexible. Business partners such as suppliers and distributors become part of the manufacturing processes. In turn, this enhances the development and marketing of products, providing greater scope for customisation. Moreover, adopting disruptive technologies pushes ahead R&D in various fields, including ICT infrastructure and applications. Generally, R&D is growing as a share of GDP in much of the region (Figure 3.11). This growth was particularly large in China, where R&D expenditure increased from 1.1% of GDP in 2002 to 2.1% in 2015.
The relationship between the use of digital technologies and productivity is also visible at the firm level. These tools can improve productivity through the implementation of labour-saving practices and improved efficiency in areas including administration, inventory management, and promotion and customer service (McKinsey Global Institute, 2002). The use of digital technologies is associated with higher levels of productivity among Emerging Asian firms. In the eight countries in the region covered by Enterprise
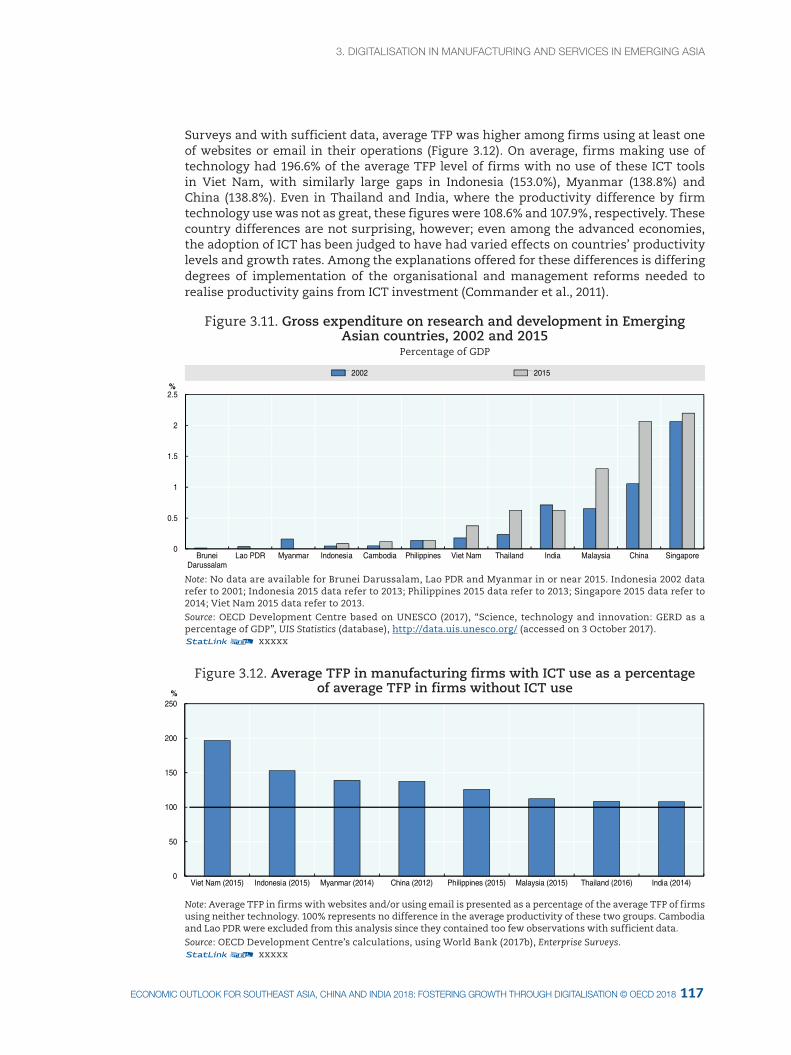
3. dIgItalISatION IN MaNUfactUrINg aNd ServIceS IN eMergINg aSIa3. dIgItalISatION IN MaNUfactUrINg aNd ServIceS IN eMergINg aSIa
117ecONOMIc OUtlOOK fOr SOUtHeaSt aSIa, cHINa aNd INdIa 2018: fOSterINg grOWtH tHrOUgH dIgItalISatION © Oecd 2018
Surveys and with sufficient data, average TFP was higher among firms using at least one of websites or email in their operations (Figure 3.12). On average, firms making use of technology had 196.6% of the average TFP level of firms with no use of these ICT tools in Viet Nam, with similarly large gaps in Indonesia (153.0%), Myanmar (138.8%) and China (138.8%). Even in Thailand and India, where the productivity difference by firm technology use was not as great, these figures were 108.6% and 107.9%, respectively. These country differences are not surprising, however; even among the advanced economies, the adoption of ICT has been judged to have had varied effects on countries’ productivity levels and growth rates. Among the explanations offered for these differences is differing degrees of implementation of the organisational and management reforms needed to realise productivity gains from ICT investment (Commander et al., 2011).
Figure 3.11. Gross expenditure on research and development in Emerging Asian countries, 2002 and 2015
Percentage of GDP
0
0.5
1
1.5
2
2.5
BruneiDarussalam
Lao PDR Myanmar Indonesia Cambodia Philippines Viet Nam Thailand India Malaysia China Singapore
%
2002 2015
Note: No data are available for Brunei Darussalam, Lao PDR and Myanmar in or near 2015. Indonesia 2002 data refer to 2001; Indonesia 2015 data refer to 2013; Philippines 2015 data refer to 2013; Singapore 2015 data refer to 2014; Viet Nam 2015 data refer to 2013.Source: OECD Development Centre based on UNESCO (2017), “Science, technology and innovation: GERD as a percentage of GDP”, UIS Statistics (database), http://data.uis.unesco.org/ (accessed on 3 October 2017).12 xxxxx
Figure 3.12. Average TFP in manufacturing firms with ICT use as a percentage of average TFP in firms without ICT use
0
50
100
150
200
250
Viet Nam (2015) Indonesia (2015) Myanmar (2014) China (2012) Philippines (2015) Malaysia (2015) Thailand (2016) India (2014)
%
Note: Average TFP in firms with websites and/or using email is presented as a percentage of the average TFP of firms using neither technology. 100% represents no difference in the average productivity of these two groups. Cambodia and Lao PDR were excluded from this analysis since they contained too few observations with sufficient data.Source: OECD Development Centre’s calculations, using World Bank (2017b), Enterprise Surveys.12 xxxxx
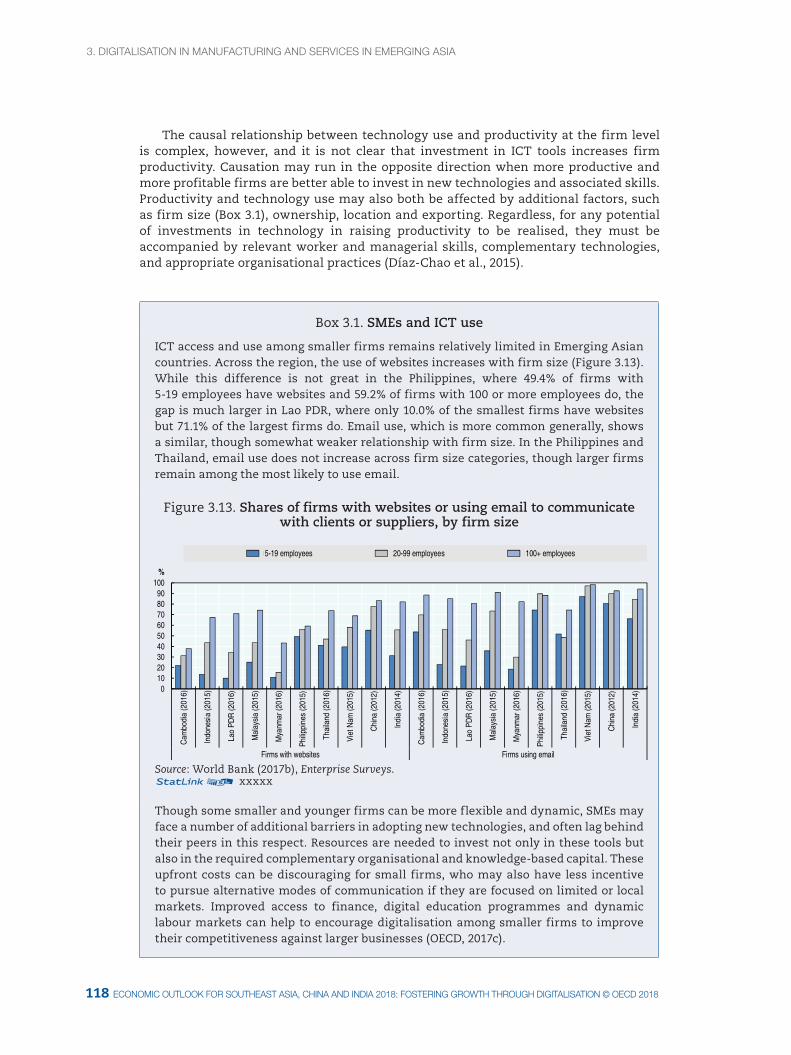
3. dIgItalISatION IN MaNUfactUrINg aNd ServIceS IN eMergINg aSIa
119118 ecONOMIc OUtlOOK fOr SOUtHeaSt aSIa, cHINa aNd INdIa 2018: fOSterINg grOWtH tHrOUgH dIgItalISatION © Oecd 2018 ecONOMIc OUtlOOK fOr SOUtHeaSt aSIa, cHINa aNd INdIa 2018: fOSterINg grOWtH tHrOUgH dIgItalISatION © Oecd 2018
The causal relationship between technology use and productivity at the firm level is complex, however, and it is not clear that investment in ICT tools increases firm productivity. Causation may run in the opposite direction when more productive and more profitable firms are better able to invest in new technologies and associated skills. Productivity and technology use may also both be affected by additional factors, such as firm size (Box 3.1), ownership, location and exporting. Regardless, for any potential of investments in technology in raising productivity to be realised, they must be accompanied by relevant worker and managerial skills, complementary technologies, and appropriate organisational practices (Díaz-Chao et al., 2015).
Box 3.1. SMEs and ICT use
ICT access and use among smaller firms remains relatively limited in Emerging Asian countries. Across the region, the use of websites increases with firm size (Figure 3.13). While this difference is not great in the Philippines, where 49.4% of firms with 5-19 employees have websites and 59.2% of firms with 100 or more employees do, the gap is much larger in Lao PDR, where only 10.0% of the smallest firms have websites but 71.1% of the largest firms do. Email use, which is more common generally, shows a similar, though somewhat weaker relationship with firm size. In the Philippines and Thailand, email use does not increase across firm size categories, though larger firms remain among the most likely to use email.
Figure 3.13. Shares of firms with websites or using email to communicate with clients or suppliers, by firm size
0102030405060708090
100
Cam
bodi
a (2
016)
Indo
nesi
a (2
015)
Lao
PDR
(201
6)
Mal
aysi
a (2
015)
Mya
nmar
(201
6)
Philip
pine
s (2
015)
Thai
land
(201
6)
Viet
Nam
(201
5)
Chi
na (2
012)
Indi
a (2
014)
Cam
bodi
a (2
016)
Indo
nesi
a (2
015)
Lao
PDR
(201
6)
Mal
aysi
a (2
015)
Mya
nmar
(201
6)
Philip
pine
s (2
015)
Thai
land
(201
6)
Viet
Nam
(201
5)
Chi
na (2
012)
Indi
a (2
014)
Firms with websites Firms using email
%
5-19 employees 20-99 employees 100+ employees
Source: World Bank (2017b), Enterprise Surveys.12 xxxxx
Though some smaller and younger firms can be more flexible and dynamic, SMEs may face a number of additional barriers in adopting new technologies, and often lag behind their peers in this respect. Resources are needed to invest not only in these tools but also in the required complementary organisational and knowledge-based capital. These upfront costs can be discouraging for small firms, who may also have less incentive to pursue alternative modes of communication if they are focused on limited or local markets. Improved access to finance, digital education programmes and dynamic labour markets can help to encourage digitalisation among smaller firms to improve their competitiveness against larger businesses (OECD, 2017c).
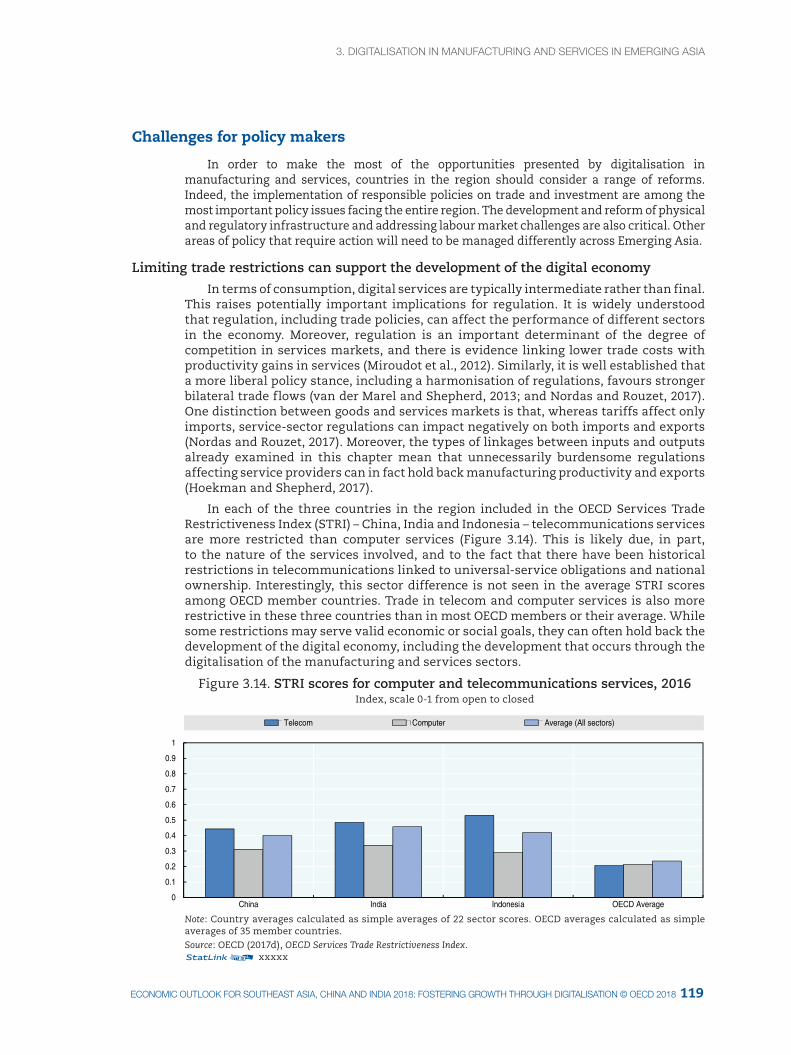
3. dIgItalISatION IN MaNUfactUrINg aNd ServIceS IN eMergINg aSIa3. dIgItalISatION IN MaNUfactUrINg aNd ServIceS IN eMergINg aSIa
119ecONOMIc OUtlOOK fOr SOUtHeaSt aSIa, cHINa aNd INdIa 2018: fOSterINg grOWtH tHrOUgH dIgItalISatION © Oecd 2018
Challenges for policy makers
In order to make the most of the opportunities presented by digitalisation in manufacturing and services, countries in the region should consider a range of reforms. Indeed, the implementation of responsible policies on trade and investment are among the most important policy issues facing the entire region. The development and reform of physical and regulatory infrastructure and addressing labour market challenges are also critical. Other areas of policy that require action will need to be managed differently across Emerging Asia.
Limiting trade restrictions can support the development of the digital economy
In terms of consumption, digital services are typically intermediate rather than final. This raises potentially important implications for regulation. It is widely understood that regulation, including trade policies, can affect the performance of different sectors in the economy. Moreover, regulation is an important determinant of the degree of competition in services markets, and there is evidence linking lower trade costs with productivity gains in services (Miroudot et al., 2012). Similarly, it is well established that a more liberal policy stance, including a harmonisation of regulations, favours stronger bilateral trade flows (van der Marel and Shepherd, 2013; and Nordas and Rouzet, 2017). One distinction between goods and services markets is that, whereas tariffs affect only imports, service-sector regulations can impact negatively on both imports and exports (Nordas and Rouzet, 2017). Moreover, the types of linkages between inputs and outputs already examined in this chapter mean that unnecessarily burdensome regulations affecting service providers can in fact hold back manufacturing productivity and exports (Hoekman and Shepherd, 2017).
In each of the three countries in the region included in the OECD Services Trade Restrictiveness Index (STRI) – China, India and Indonesia – telecommunications services are more restricted than computer services (Figure 3.14). This is likely due, in part, to the nature of the services involved, and to the fact that there have been historical restrictions in telecommunications linked to universal-service obligations and national ownership. Interestingly, this sector difference is not seen in the average STRI scores among OECD member countries. Trade in telecom and computer services is also more restrictive in these three countries than in most OECD members or their average. While some restrictions may serve valid economic or social goals, they can often hold back the development of the digital economy, including the development that occurs through the digitalisation of the manufacturing and services sectors.
Figure 3.14. STRI scores for computer and telecommunications services, 2016Index, scale 0-1 from open to closed
0
0.1
0.2
0.3
0.4
0.5
0.6
0.7
0.8
0.9
1
China India Indonesia OECD Average
Telecom Computer Average (All sectors)
Note: Country averages calculated as simple averages of 22 sector scores. OECD averages calculated as simple averages of 35 member countries. Source: OECD (2017d), OECD Services Trade Restrictiveness Index.12 xxxxx
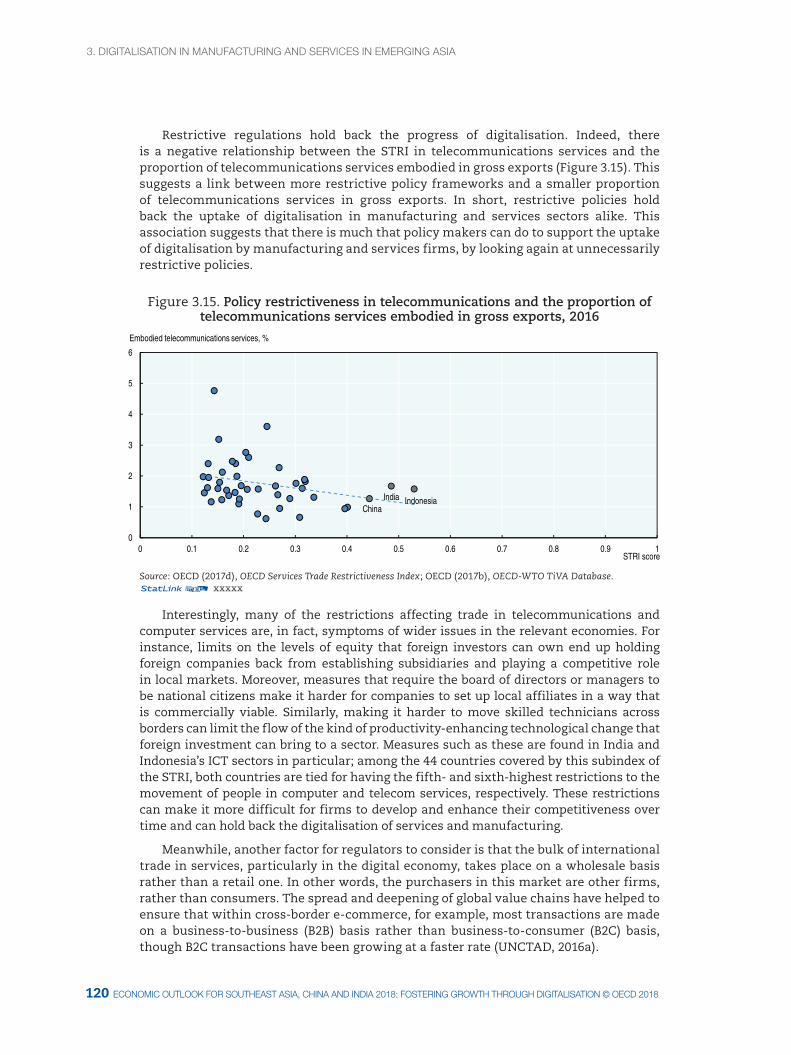
3. Digitalisation in manufacturing anD services in emerging asia
121120 economic outlooK for soutHeast asia, cHina anD inDia 2018: fostering groWtH tHrougH Digitalisation © oecD 2018 economic outlooK for soutHeast asia, cHina anD inDia 2018: fostering groWtH tHrougH Digitalisation © oecD 2018
Restrictive regulations hold back the progress of digitalisation. Indeed, there is a negative relationship between the STRI in telecommunications services and the proportion of telecommunications services embodied in gross exports (Figure 3.15). This suggests a link between more restrictive policy frameworks and a smaller proportion of telecommunications services in gross exports. In short, restrictive policies hold back the uptake of digitalisation in manufacturing and services sectors alike. This association suggests that there is much that policy makers can do to support the uptake of digitalisation by manufacturing and services firms, by looking again at unnecessarily restrictive policies.
Figure 3.15. Policy restrictiveness in telecommunications and the proportion of telecommunications services embodied in gross exports, 2016
0
1
2
3
4
5
6
0 0.1 0.2 0.3 0.4 0.5 0.6 0.7 0.8 0.9 1STRI score
Embodied telecommunications services, %
ChinaIndia Indonesia
Source: OECD (2017d), OECD Services Trade Restrictiveness Index; OECD (2017b), OECD-WTO TiVA Database.12 xxxxx
Interestingly, many of the restrictions affecting trade in telecommunications and computer services are, in fact, symptoms of wider issues in the relevant economies. For instance, limits on the levels of equity that foreign investors can own end up holding foreign companies back from establishing subsidiaries and playing a competitive role in local markets. Moreover, measures that require the board of directors or managers to be national citizens make it harder for companies to set up local affiliates in a way that is commercially viable. Similarly, making it harder to move skilled technicians across borders can limit the flow of the kind of productivity-enhancing technological change that foreign investment can bring to a sector. Measures such as these are found in India and Indonesia’s ICT sectors in particular; among the 44 countries covered by this subindex of the STRI, both countries are tied for having the fifth- and sixth-highest restrictions to the movement of people in computer and telecom services, respectively. These restrictions can make it more difficult for firms to develop and enhance their competitiveness over time and can hold back the digitalisation of services and manufacturing.
Meanwhile, another factor for regulators to consider is that the bulk of international trade in services, particularly in the digital economy, takes place on a wholesale basis rather than a retail one. In other words, the purchasers in this market are other firms, rather than consumers. The spread and deepening of global value chains have helped to ensure that within cross-border e-commerce, for example, most transactions are made on a business-to-business (B2B) basis rather than business-to-consumer (B2C) basis, though B2C transactions have been growing at a faster rate (UNCTAD, 2016a).
3. dIgItalISatION IN MaNUfactUrINg aNd ServIceS IN eMergINg aSIa3. dIgItalISatION IN MaNUfactUrINg aNd ServIceS IN eMergINg aSIa
121ecONOMIc OUtlOOK fOr SOUtHeaSt aSIa, cHINa aNd INdIa 2018: fOSterINg grOWtH tHrOUgH dIgItalISatION © Oecd 2018
Regulators in most economies recognise that, although there is a strong rationale for protecting consumers from unscrupulous traders, the situation with business-to-business transactions is somewhat different. In particular, businesses can be expected to expend considerable resources in researching the products or services they are purchasing, and to satisfy themselves that these products and services are of sufficient quality and are appropriate for their needs. As a result, it may make sense to target consumer protection regulation towards business-to-consumer transactions rather than business-to-business transactions. The likely effect of such a prioritisation would be to reduce the regulatory burden on international trade in services, including in sectors linked to the digital economy.
Fostering investment can help to develop the digital economy
In Emerging Asia, FDI is arguably one of the channels that can be most effective in delivering positive externalities in the form of technological spillovers. Indeed, economic researchers and policy makers generally acknowledge the positive impact of FDI on the economic development of host countries. An emerging-market country with a low level of capacity in ICT has less opportunity, and a lesser capacity, to finance costly ICT infrastructure domestically, without external support. Inward flows of FDI provide the necessary capital to fund investment in ICT. Notably, these inflows also encourage transfers of skills and technology, which can provide a durable boost to a country’s emerging digital economy. Therefore, governments in Emerging Asia may implement policies to facilitate and attract inward foreign investment flows, with the aim of enhancing their ICT industry and spreading the use of digital technology.
According to Gholami et al. (2005), FDI inflows into developing countries with low levels of ICT infrastructure tend to accelerate investment in ICT. Meanwhile, Tan and Leewongcharoen (2005) also highlight Thailand’s success in enhancing its ICT sector, thanks to spillovers from inward FDI in terms of technology and human resources. Thus, the transfers of technology that such FDI tends to induce have had a substantive and lasting impact on host countries’ ICT sectors.
In a similar vein, there is evidence to suggest that a combination of openness to trade, on the one hand, and policies to facilitate FDI, on the other, are likely to promote the digital economy in Emerging Asia. For example, Shirazi et al. (2010) argue that openness to trade, and attracting FDI into the ICT sector, have played a notable role in supporting the rise of China, Malaysia, Singapore, Thailand and Viet Nam as major global suppliers and exporters of ICT. Indeed, the economic reforms that these countries implemented in the mid-1990s sparked massive inflows of FDI and trade. In turn, these led to further inflows to the host countries in terms of technology and ICT-related skills. Moreover, Tan (2004) emphasises that China has enhanced its ICT sector by relaxing restrictions on imports and exports of technology. The resulting free flows of technology may have played a critical role in providing China with the technology and human capital upon which it has built its success in telecommunications. Furthermore, Gholami et al. point to the case of Singapore, which successfully developed its ICT sector with the support of inward FDI and imports of ICT. Singapore thus became a regional hub in Asia for high-tech manufacturing. It did so thanks to large-scale investment in telecommunications infrastructure, which was supported by the liberalisation of trade and investment that the country pursued since the 1970s. The technology transfers resulting from such foreign investment and imports have helped Singapore to become a dynamic hub, with over 4 000 domestic electronics production firms.
Nevertheless, restrictions on FDI remain relatively high in much of the region, according to the OECD’s FDI Regulatory Restrictiveness Index. This index assesses a country’s openness to FDI across 22 sectors, by measuring the degree to which it
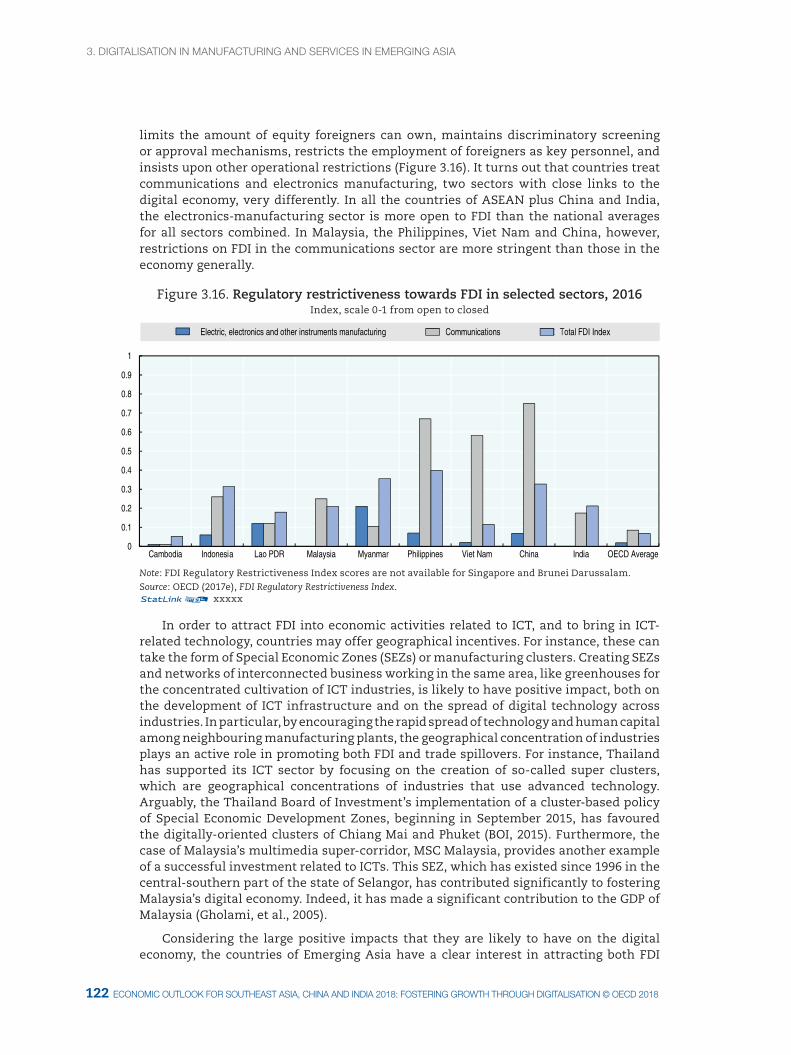
3. dIgItalISatION IN MaNUfactUrINg aNd ServIceS IN eMergINg aSIa
123122 ecONOMIc OUtlOOK fOr SOUtHeaSt aSIa, cHINa aNd INdIa 2018: fOSterINg grOWtH tHrOUgH dIgItalISatION © Oecd 2018 ecONOMIc OUtlOOK fOr SOUtHeaSt aSIa, cHINa aNd INdIa 2018: fOSterINg grOWtH tHrOUgH dIgItalISatION © Oecd 2018
limits the amount of equity foreigners can own, maintains discriminatory screening or approval mechanisms, restricts the employment of foreigners as key personnel, and insists upon other operational restrictions (Figure 3.16). It turns out that countries treat communications and electronics manufacturing, two sectors with close links to the digital economy, very differently. In all the countries of ASEAN plus China and India, the electronics-manufacturing sector is more open to FDI than the national averages for all sectors combined. In Malaysia, the Philippines, Viet Nam and China, however, restrictions on FDI in the communications sector are more stringent than those in the economy generally.
Figure 3.16. Regulatory restrictiveness towards FDI in selected sectors, 2016Index, scale 0-1 from open to closed
0
0.1
0.2
0.3
0.4
0.5
0.6
0.7
0.8
0.9
1
Cambodia Indonesia Lao PDR Malaysia Myanmar Philippines Viet Nam China India OECD Average
Electric, electronics and other instruments manufacturing Communications Total FDI Index
Note: FDI Regulatory Restrictiveness Index scores are not available for Singapore and Brunei Darussalam. Source: OECD (2017e), FDI Regulatory Restrictiveness Index.12 xxxxx
In order to attract FDI into economic activities related to ICT, and to bring in ICT-related technology, countries may offer geographical incentives. For instance, these can take the form of Special Economic Zones (SEZs) or manufacturing clusters. Creating SEZs and networks of interconnected business working in the same area, like greenhouses for the concentrated cultivation of ICT industries, is likely to have positive impact, both on the development of ICT infrastructure and on the spread of digital technology across industries. In particular, by encouraging the rapid spread of technology and human capital among neighbouring manufacturing plants, the geographical concentration of industries plays an active role in promoting both FDI and trade spillovers. For instance, Thailand has supported its ICT sector by focusing on the creation of so-called super clusters, which are geographical concentrations of industries that use advanced technology. Arguably, the Thailand Board of Investment’s implementation of a cluster-based policy of Special Economic Development Zones, beginning in September 2015, has favoured the digitally-oriented clusters of Chiang Mai and Phuket (BOI, 2015). Furthermore, the case of Malaysia’s multimedia super-corridor, MSC Malaysia, provides another example of a successful investment related to ICTs. This SEZ, which has existed since 1996 in the central-southern part of the state of Selangor, has contributed significantly to fostering Malaysia’s digital economy. Indeed, it has made a significant contribution to the GDP of Malaysia (Gholami, et al., 2005).
Considering the large positive impacts that they are likely to have on the digital economy, the countries of Emerging Asia have a clear interest in attracting both FDI
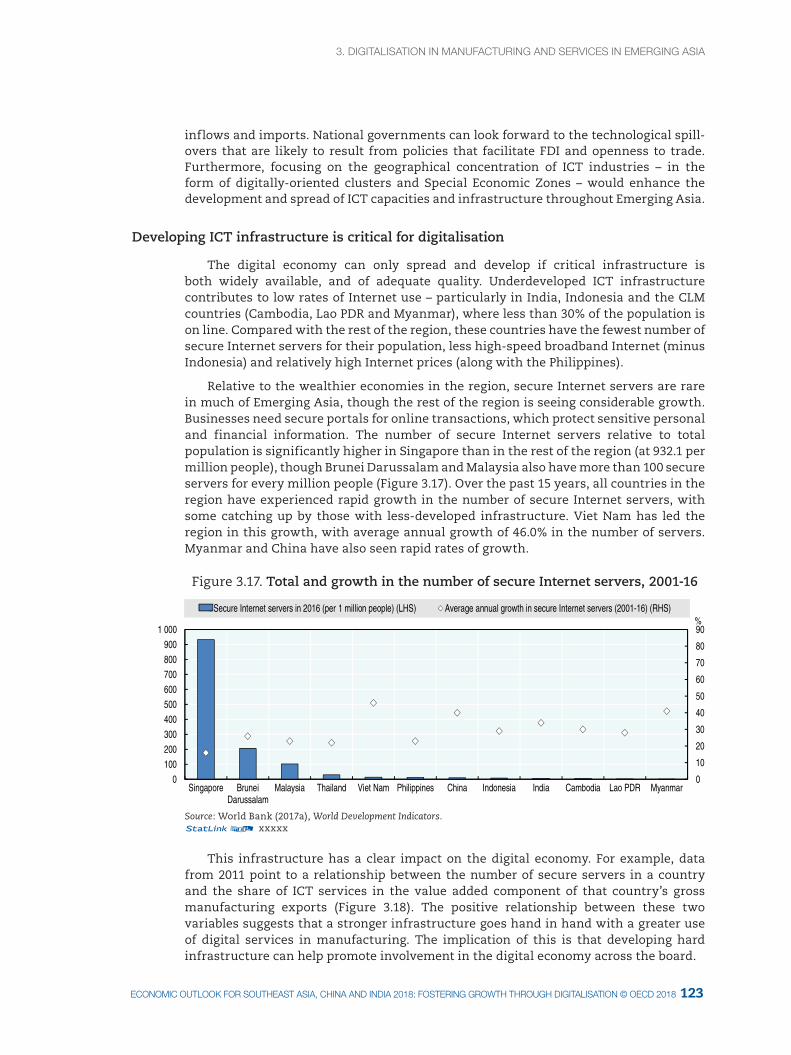
3. dIgItalISatION IN MaNUfactUrINg aNd ServIceS IN eMergINg aSIa3. dIgItalISatION IN MaNUfactUrINg aNd ServIceS IN eMergINg aSIa
123ecONOMIc OUtlOOK fOr SOUtHeaSt aSIa, cHINa aNd INdIa 2018: fOSterINg grOWtH tHrOUgH dIgItalISatION © Oecd 2018
inflows and imports. National governments can look forward to the technological spill-overs that are likely to result from policies that facilitate FDI and openness to trade. Furthermore, focusing on the geographical concentration of ICT industries – in the form of digitally-oriented clusters and Special Economic Zones – would enhance the development and spread of ICT capacities and infrastructure throughout Emerging Asia.
Developing ICT infrastructure is critical for digitalisation
The digital economy can only spread and develop if critical infrastructure is both widely available, and of adequate quality. Underdeveloped ICT infrastructure contributes to low rates of Internet use – particularly in India, Indonesia and the CLM countries (Cambodia, Lao PDR and Myanmar), where less than 30% of the population is on line. Compared with the rest of the region, these countries have the fewest number of secure Internet servers for their population, less high-speed broadband Internet (minus Indonesia) and relatively high Internet prices (along with the Philippines).
Relative to the wealthier economies in the region, secure Internet servers are rare in much of Emerging Asia, though the rest of the region is seeing considerable growth. Businesses need secure portals for online transactions, which protect sensitive personal and financial information. The number of secure Internet servers relative to total population is significantly higher in Singapore than in the rest of the region (at 932.1 per million people), though Brunei Darussalam and Malaysia also have more than 100 secure servers for every million people (Figure 3.17). Over the past 15 years, all countries in the region have experienced rapid growth in the number of secure Internet servers, with some catching up by those with less-developed infrastructure. Viet Nam has led the region in this growth, with average annual growth of 46.0% in the number of servers. Myanmar and China have also seen rapid rates of growth.
Figure 3.17. Total and growth in the number of secure Internet servers, 2001-16
0
10
20
30
40
50
60
70
80
90
0 100 200 300 400 500 600 700 800 900
1 000
Singapore BruneiDarussalam
Malaysia Thailand Viet Nam Philippines China Indonesia India Cambodia Lao PDR Myanmar
%Secure Internet servers in 2016 (per 1 million people) (LHS) Average annual growth in secure Internet servers (2001-16) (RHS)
Source: World Bank (2017a), World Development Indicators.12 xxxxx
This infrastructure has a clear impact on the digital economy. For example, data from 2011 point to a relationship between the number of secure servers in a country and the share of ICT services in the value added component of that country’s gross manufacturing exports (Figure 3.18). The positive relationship between these two variables suggests that a stronger infrastructure goes hand in hand with a greater use of digital services in manufacturing. The implication of this is that developing hard infrastructure can help promote involvement in the digital economy across the board.
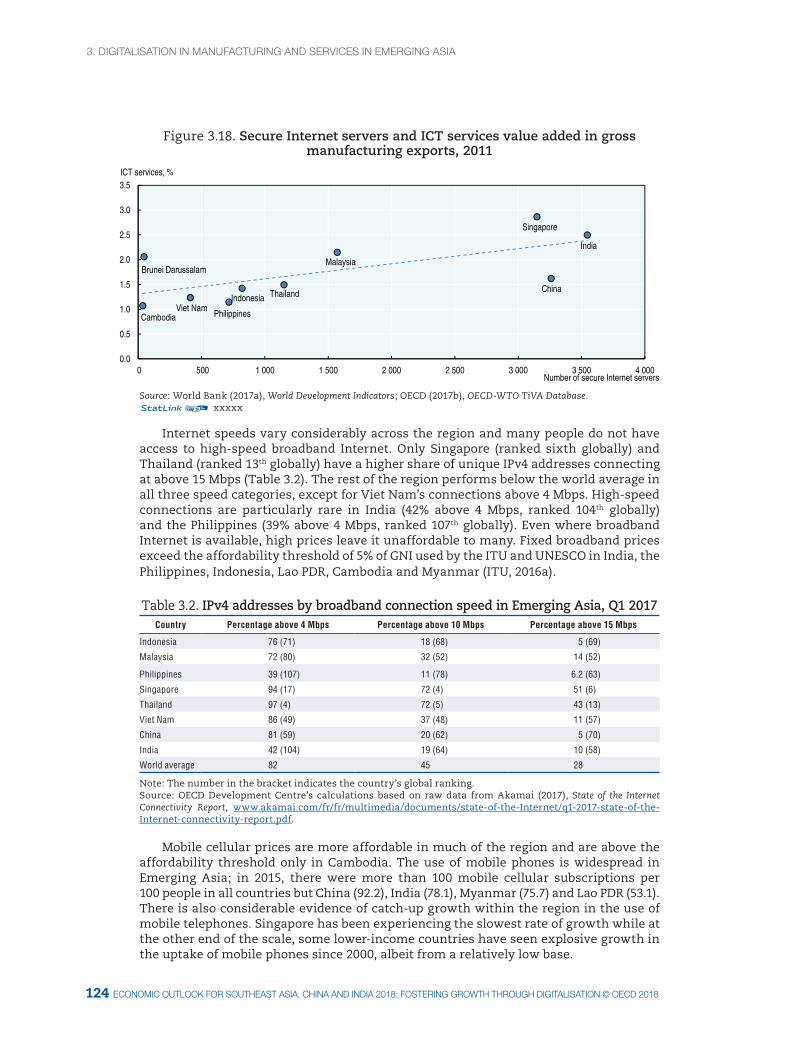
3. dIgItalISatION IN MaNUfactUrINg aNd ServIceS IN eMergINg aSIa
125124 ecONOMIc OUtlOOK fOr SOUtHeaSt aSIa, cHINa aNd INdIa 2018: fOSterINg grOWtH tHrOUgH dIgItalISatION © Oecd 2018 ecONOMIc OUtlOOK fOr SOUtHeaSt aSIa, cHINa aNd INdIa 2018: fOSterINg grOWtH tHrOUgH dIgItalISatION © Oecd 2018
Figure 3.18. Secure Internet servers and ICT services value added in gross manufacturing exports, 2011
0.0
0.5
1.0
1.5
2.0
2.5
3.0
3.5
0 500 1 000 1 500 2 000 2 500 3 000 3 500 4 000
ICT services, %
Number of secure Internet servers
Brunei Darussalam
CambodiaViet Nam
Philippines
Indonesia Thailand
Malaysia
Singapore
India
China
Source: World Bank (2017a), World Development Indicators; OECD (2017b), OECD-WTO TiVA Database.12 xxxxx
Internet speeds vary considerably across the region and many people do not have access to high-speed broadband Internet. Only Singapore (ranked sixth globally) and Thailand (ranked 13th globally) have a higher share of unique IPv4 addresses connecting at above 15 Mbps (Table 3.2). The rest of the region performs below the world average in all three speed categories, except for Viet Nam’s connections above 4 Mbps. High-speed connections are particularly rare in India (42% above 4 Mbps, ranked 104th globally) and the Philippines (39% above 4 Mbps, ranked 107th globally). Even where broadband Internet is available, high prices leave it unaffordable to many. Fixed broadband prices exceed the affordability threshold of 5% of GNI used by the ITU and UNESCO in India, the Philippines, Indonesia, Lao PDR, Cambodia and Myanmar (ITU, 2016a).
Table 3.2. IPv4 addresses by broadband connection speed in Emerging Asia, Q1 2017Country Percentage above 4 Mbps Percentage above 10 Mbps Percentage above 15 Mbps
Indonesia 76 (71) 18 (68) 5 (69)
Malaysia 72 (80) 32 (52) 14 (52)
Philippines 39 (107) 11 (78) 6.2 (63)
Singapore 94 (17) 72 (4) 51 (6)
Thailand 97 (4) 72 (5) 43 (13)
Viet Nam 86 (49) 37 (48) 11 (57)
China 81 (59) 20 (62) 5 (70)
India 42 (104) 19 (64) 10 (58)
World average 82 45 28
Note: The number in the bracket indicates the country’s global ranking.Source: OECD Development Centre’s calculations based on raw data from Akamai (2017), State of the Internet Connectivity Report, www.akamai.com/fr/fr/multimedia/documents/state-of-the-Internet/q1-2017-state-of-the-Internet-connectivity-report.pdf.
Mobile cellular prices are more affordable in much of the region and are above the affordability threshold only in Cambodia. The use of mobile phones is widespread in Emerging Asia; in 2015, there were more than 100 mobile cellular subscriptions per 100 people in all countries but China (92.2), India (78.1), Myanmar (75.7) and Lao PDR (53.1). There is also considerable evidence of catch-up growth within the region in the use of mobile telephones. Singapore has been experiencing the slowest rate of growth while at the other end of the scale, some lower-income countries have seen explosive growth in the uptake of mobile phones since 2000, albeit from a relatively low base.
3. dIgItalISatION IN MaNUfactUrINg aNd ServIceS IN eMergINg aSIa3. dIgItalISatION IN MaNUfactUrINg aNd ServIceS IN eMergINg aSIa
125ecONOMIc OUtlOOK fOr SOUtHeaSt aSIa, cHINa aNd INdIa 2018: fOSterINg grOWtH tHrOUgH dIgItalISatION © Oecd 2018
In addition to building up a country’s physical infrastructure, and extending the reach of online services as widely as possible, a country’s soft regulatory infrastructure is also an important factor in growing the digital economy. For instance, before the digital economy can really take off, laws and regulations need to be in place to facilitate digital signatures, and to make sure online payments are secure. The management of digital rights and protection for intellectual property are two other areas of interest in this regard, as are measures to deal with security and cybercrime. Much of the region has implemented regulatory infrastructure in areas such as electronic transactions, consumer protection, privacy and data protection, and cybercrime needed to support the digital economy.
Labour market challenges arising from digitalisation should be addressed
The digital economy poses both opportunities and challenges in labour markets
Increasingly, digitalisation is overlapping with automation, as computer-controlled processes develop the capacity to substitute themselves for labour in some industries. Like all examples of skill-based technical change, digitalisation has the potential to increase the relative demand for skilled workers such as engineers and technicians. However, it also has the potential to reduce the demand for unskilled labour. For example, workers performing repetitive tasks may be replaced by robots. Moreover, 3D printing may eliminate several production stages on an assembly line. Indeed, this development could exacerbate both unemployment and wage inequality, especially in developing countries where low-skilled occupations dominate the labour market.
Many studies have been conducted to analyse the impact of digitalisation on labour markets. Some studies suggest that digitalisation could cause a large proportion of tasks or even entire occupations currently carried out by human workers be taken over by machines in the near future (Frey and Osborne, 2013). A report by the International Labour Organisation shows that approximately 56% of all employment in the five ASEAN countries covered by its survey (Cambodia, Indonesia, the Philippines, Thailand and Viet Nam) is at high risk of displacement due to technology over the next decade or two (ILO, 2016). Industries such as hotels and restaurants, wholesale and retail trade, as well as construction and manufacturing will be most affected.
However, others argue that the job displacement risks due to automation might be only related to specific tasks while occupations will evolve to accommodate the technological advancement rather than face complete elimination (Bessen, 2015). It is estimated that, based on this theory, 9% of jobs in OECD countries will be at a high risk of automation, another 25% of jobs could undergo significant change, and between 50% and 70% of tasks are at ordinary risk of automation (Arntz, Gregory and Zierahn, 2016).
Some argue, however, that the risks are not imminent and with careful preparation risks can be turned into opportunities. According to data from UNCTAD, currently replacing low-skilled workers with industrial robots in a large scale is more likely to drive up production expenditures despite decreasing automation costs in the past decade. Widespread automation has not yet occurred in many labour-intensive industries except automotive and electrical/electronics, allowing developing countries to pursue industrialisation processes via traditional paths such as garment making (UNCTAD, 2016b). In addition, if digitalisation is adopted with proper organisational changes and good managerial practices, it can contribute to increased productivity, which in turn leads to lower prices and new products, higher final demand, and higher employment, offsetting the initial job displacement (OECD, 2017f).
In addition, digitalisation is also changing how work is organised (OECD, 2016b). Through digitalisation, businesses can access a larger pool of potential workers and suppliers. As shown in some developing countries such as China, ICT technologies allow women to participate more easily in the labour market, often through domestic and cross-border
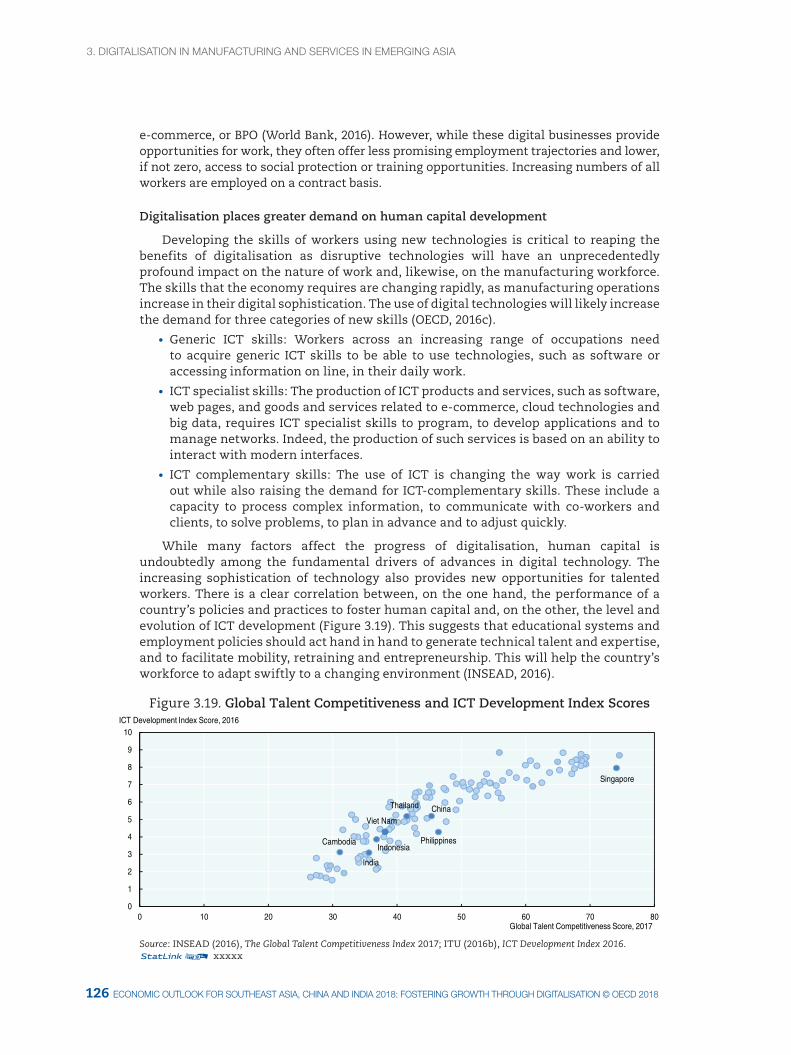
3. dIgItalISatION IN MaNUfactUrINg aNd ServIceS IN eMergINg aSIa
127126 ecONOMIc OUtlOOK fOr SOUtHeaSt aSIa, cHINa aNd INdIa 2018: fOSterINg grOWtH tHrOUgH dIgItalISatION © Oecd 2018 ecONOMIc OUtlOOK fOr SOUtHeaSt aSIa, cHINa aNd INdIa 2018: fOSterINg grOWtH tHrOUgH dIgItalISatION © Oecd 2018
e-commerce, or BPO (World Bank, 2016). However, while these digital businesses provide opportunities for work, they often offer less promising employment trajectories and lower, if not zero, access to social protection or training opportunities. Increasing numbers of all workers are employed on a contract basis.
Digitalisation places greater demand on human capital development
Developing the skills of workers using new technologies is critical to reaping the benefits of digitalisation as disruptive technologies will have an unprecedentedly profound impact on the nature of work and, likewise, on the manufacturing workforce. The skills that the economy requires are changing rapidly, as manufacturing operations increase in their digital sophistication. The use of digital technologies will likely increase the demand for three categories of new skills (OECD, 2016c).
• Generic ICT skills: Workers across an increasing range of occupations need to acquire generic ICT skills to be able to use technologies, such as software or accessing information on line, in their daily work.
• ICT specialist skills: The production of ICT products and services, such as software, web pages, and goods and services related to e-commerce, cloud technologies and big data, requires ICT specialist skills to program, to develop applications and to manage networks. Indeed, the production of such services is based on an ability to interact with modern interfaces.
• ICT complementary skills: The use of ICT is changing the way work is carried out while also raising the demand for ICT-complementary skills. These include a capacity to process complex information, to communicate with co-workers and clients, to solve problems, to plan in advance and to adjust quickly.
While many factors affect the progress of digitalisation, human capital is undoubtedly among the fundamental drivers of advances in digital technology. The increasing sophistication of technology also provides new opportunities for talented workers. There is a clear correlation between, on the one hand, the performance of a country’s policies and practices to foster human capital and, on the other, the level and evolution of ICT development (Figure 3.19). This suggests that educational systems and employment policies should act hand in hand to generate technical talent and expertise, and to facilitate mobility, retraining and entrepreneurship. This will help the country’s workforce to adapt swiftly to a changing environment (INSEAD, 2016).
Figure 3.19. Global Talent Competitiveness and ICT Development Index Scores
0
1
2
3
4
5
6
7
8
9
10
0 10 20 30 40 50 60 70 80Global Talent Competitiveness Score, 2017
Singapore
ICT Development Index Score, 2016
ChinaThailand
Philippines
Viet Nam
India
IndonesiaCambodia
Source: INSEAD (2016), The Global Talent Competitiveness Index 2017; ITU (2016b), ICT Development Index 2016.12 xxxxx
3. dIgItalISatION IN MaNUfactUrINg aNd ServIceS IN eMergINg aSIa3. dIgItalISatION IN MaNUfactUrINg aNd ServIceS IN eMergINg aSIa
127ecONOMIc OUtlOOK fOr SOUtHeaSt aSIa, cHINa aNd INdIa 2018: fOSterINg grOWtH tHrOUgH dIgItalISatION © Oecd 2018
Indeed, as digitalisation proceeds, it is likely that all countries will feel pressure on their education systems. The rise of digital processes and their integration into manufacturing, for example, means that workers with advanced schooling will increasingly be needed in factories. In Indonesia, which aims to become the largest digital economy in Southeast Asia, access to technology skills remains a serious issue for the booming IT sector, mainly due to low tertiary education enrolment rates (Blake, 2016). Only about 22% of college-aged Indonesians are attending universities and many ICT start-up companies in Indonesia have to hire high tech specialists from outside to accommodate their needs. Investing in tertiary education is, therefore, more important than ever before. Doing so will help to ensure that young workers have the skills they need to take full advantage of the opportunities that digitalisation offers.
In addition to tertiary education, technical and vocational education and training (TVET) is also important to foster digital skills among young workers. In Malaysia, the government-owned Malaysia Digital Economy Corporation (MDEC) launched the eUsahawan programme in 2015 to integrate digital entrepreneurship curriculum into major TVET institutions nationwide in order to develop a generation that embraces the digital economy. Meanwhile, programmes to retrain and upgrade the skills of older workers are also necessary. Such programmes can help these workers to move into other occupations if they end up being displaced by digital technologies. Singapore is a good example in this case and launched the SkillsFuture for Digital Workplace programme in 2017 to equip Singaporeans with digital skills that suit their needs. The courses cover simple topics such as the use of e-payments and e-commerce platforms as well as advanced and practical knowledge related to data analytics and automation. An estimated 100 000 people will benefit from this programme over the next three years.
Increasingly, however, it is not only tertiary education that will be important in helping the workforce to adapt to digitalisation. Indeed, the introduction of digital technologies into programmes of basic education will be an important way of ensuring that people grow up with a strong sense of how to use, and master, digital technologies. Making sure that people are at ease with digital technologies at an early age will allow students to learn more specific skills, such as coding, at an appropriate time. Digital technologies are already strongly present in manufacturing and services sectors, and their growth is likely to be strong in the medium term. In the future, it will be difficult to find jobs that do not require a substantial familiarity with digital technologies, at least as a user. Many occupations will require more sophisticated skills, in particular the ability to manipulate and change digital technologies to control physical processes. With this in mind, Malaysia launched the #mydigitalmaker movement in 2016. This joint public-private-academia initiative will integrate Computational Thinking and Computer Science into formal school curriculum as well as getting industry and universities to help nurture talented young digital makers through co-curriculum activities (MDEC, 2016).
Education will be an important element in fostering inclusive digitalisation. The OECD Skills Strategy outlines a framework to help in the development of human capital development policies for inclusive growth through prioritising investments, combining short- and long-term considerations, building a case for lifelong learning, fostering a whole-of-government approach, and including all relevant stakeholders. Among the objectives of any skill development strategy should be the development of foundational skills across the population, which can include an appropriate degree of preparation for participation in the digital economy (OECD, 2016b).
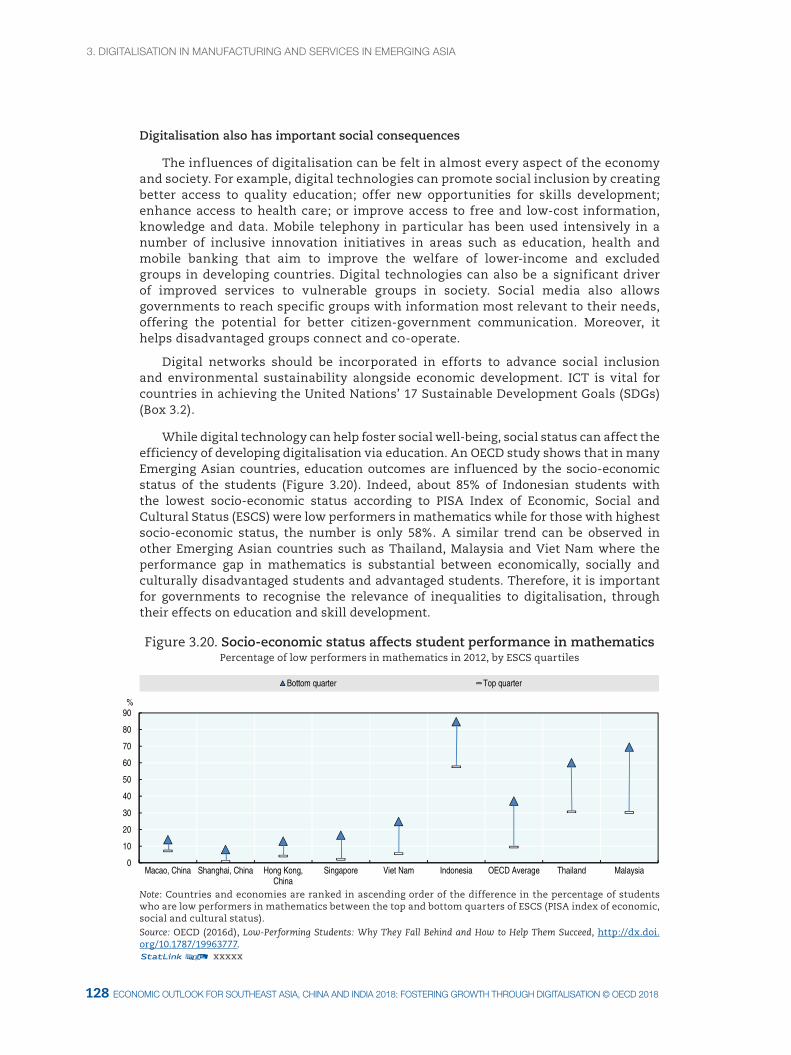
3. dIgItalISatION IN MaNUfactUrINg aNd ServIceS IN eMergINg aSIa
129128 ecONOMIc OUtlOOK fOr SOUtHeaSt aSIa, cHINa aNd INdIa 2018: fOSterINg grOWtH tHrOUgH dIgItalISatION © Oecd 2018 ecONOMIc OUtlOOK fOr SOUtHeaSt aSIa, cHINa aNd INdIa 2018: fOSterINg grOWtH tHrOUgH dIgItalISatION © Oecd 2018
Digitalisation also has important social consequences
The influences of digitalisation can be felt in almost every aspect of the economy and society. For example, digital technologies can promote social inclusion by creating better access to quality education; offer new opportunities for skills development; enhance access to health care; or improve access to free and low-cost information, knowledge and data. Mobile telephony in particular has been used intensively in a number of inclusive innovation initiatives in areas such as education, health and mobile banking that aim to improve the welfare of lower-income and excluded groups in developing countries. Digital technologies can also be a significant driver of improved services to vulnerable groups in society. Social media also allows governments to reach specific groups with information most relevant to their needs, offering the potential for better citizen-government communication. Moreover, it helps disadvantaged groups connect and co-operate.
Digital networks should be incorporated in efforts to advance social inclusion and environmental sustainability alongside economic development. ICT is vital for countries in achieving the United Nations’ 17 Sustainable Development Goals (SDGs) (Box 3.2).
While digital technology can help foster social well-being, social status can affect the efficiency of developing digitalisation via education. An OECD study shows that in many Emerging Asian countries, education outcomes are influenced by the socio-economic status of the students (Figure 3.20). Indeed, about 85% of Indonesian students with the lowest socio-economic status according to PISA Index of Economic, Social and Cultural Status (ESCS) were low performers in mathematics while for those with highest socio-economic status, the number is only 58%. A similar trend can be observed in other Emerging Asian countries such as Thailand, Malaysia and Viet Nam where the performance gap in mathematics is substantial between economically, socially and culturally disadvantaged students and advantaged students. Therefore, it is important for governments to recognise the relevance of inequalities to digitalisation, through their effects on education and skill development.
Figure 3.20. Socio-economic status affects student performance in mathematicsPercentage of low performers in mathematics in 2012, by ESCS quartiles
0
10
20
30
40
50
60
70
80
90
Macao, China Shanghai, China Hong Kong,China
Singapore Viet Nam Indonesia OECD Average Thailand Malaysia
%
Bottom quarter Top quarter
Note: Countries and economies are ranked in ascending order of the difference in the percentage of students who are low performers in mathematics between the top and bottom quarters of ESCS (PISA index of economic, social and cultural status).Source: OECD (2016d), Low-Performing Students: Why They Fall Behind and How to Help Them Succeed, http://dx.doi.org/10.1787/19963777.12 xxxxx
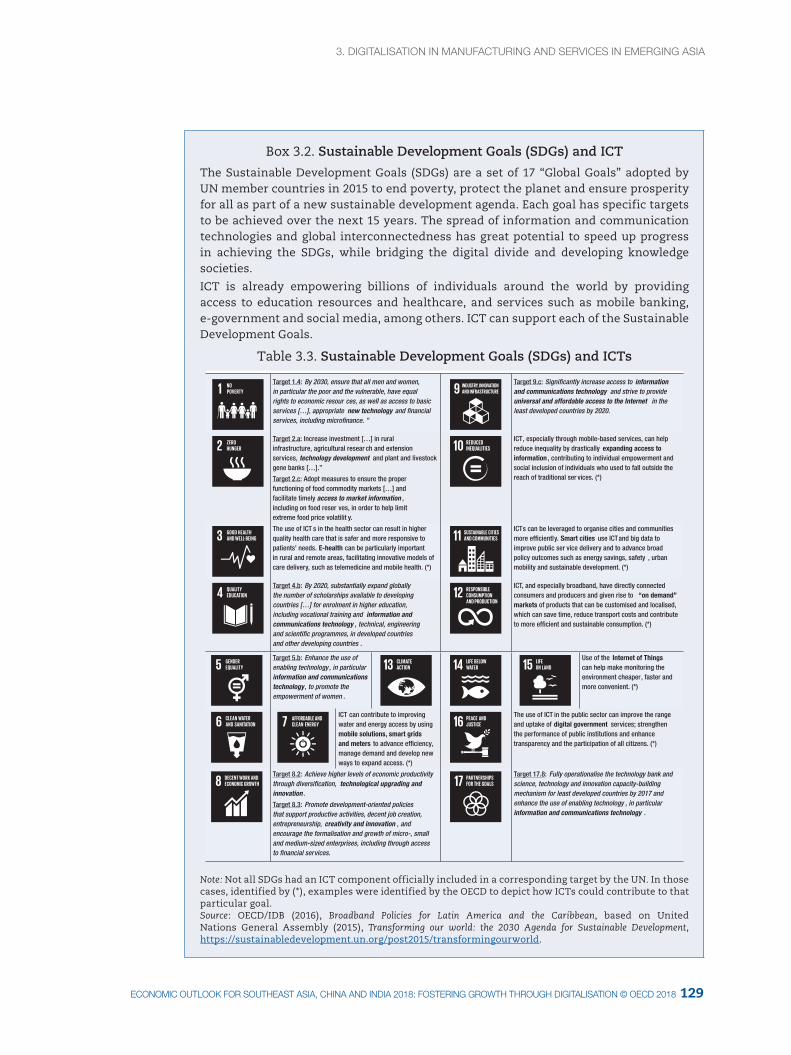
3. dIgItalISatION IN MaNUfactUrINg aNd ServIceS IN eMergINg aSIa3. dIgItalISatION IN MaNUfactUrINg aNd ServIceS IN eMergINg aSIa
129ecONOMIc OUtlOOK fOr SOUtHeaSt aSIa, cHINa aNd INdIa 2018: fOSterINg grOWtH tHrOUgH dIgItalISatION © Oecd 2018
Box 3.2. Sustainable Development Goals (SDGs) and ICT
The Sustainable Development Goals (SDGs) are a set of 17 “Global Goals” adopted by UN member countries in 2015 to end poverty, protect the planet and ensure prosperity for all as part of a new sustainable development agenda. Each goal has specific targets to be achieved over the next 15 years. The spread of information and communication technologies and global interconnectedness has great potential to speed up progress in achieving the SDGs, while bridging the digital divide and developing knowledge societies.
ICT is already empowering billions of individuals around the world by providing access to education resources and healthcare, and services such as mobile banking, e-government and social media, among others. ICT can support each of the Sustainable Development Goals.
Table 3.3. Sustainable Development Goals (SDGs) and ICTs
Target 1.4: By 2030, ensure that all men and women, in particular the poor and the vulnerable, have equal rights to economic resour ces, as well as access to basic services […], appropriate new technology and financial services, including microfinance. ”
Target 9.c: Significantly increase access to information and communications technology and strive to provide universal and affordable access to the Internet in the least developed countries by 2020.
Target 2.a: Increase investment […] in rural infrastructure, agricultural resear ch and extension services, technology development and plant and livestock gene banks […].”
Target 2.c: Adopt measures to ensure the proper functioning of food commodity markets […] and facilitate timely access to market information , including on food reser ves, in order to help limit extreme food price volatilit y.
ICT, especially through mobile-based services, can help reduce inequality by drastically expanding access to information , contributing to individual empowerment and social inclusion of individuals who used to fall outside the reach of traditional ser vices. (*)
The use of ICT s in the health sector can result in higher quality health care that is safer and more responsive to patients’ needs. E-health can be particularly important in rural and remote areas, facilitating innovative models of care delivery, such as telemedicine and mobile health. (*)
ICTs can be leveraged to organise cities and communities more efficiently. Smart cities use ICTand big data to improve public ser vice delivery and to advance broad policy outcomes such as energy savings, safety , urban mobility and sustainable development. (*)
Target 4.b: By 2020, substantially expand globally the number of scholarships available to developing countries […] for enrolment in higher education, including vocational training and information and communications technology , technical, engineering and scientific programmes, in developed countries and other developing countries .
ICT, and especially broadband, have directly connected consumers and producers and given rise to “on demand” markets of products that can be customised and localised, which can save time, reduce transport costs and contribute to more efficient and sustainable consumption. (*)
Target 5.b: Enhance the use of enabling technology , in particular information and communications technology , to promote the empowerment of women .
Use of the Internet of Things can help make monitoring the environment cheaper, faster and more convenient. (*)
ICT can contribute to improving water and energy access by using mobile solutions, smart grids and meters to advance efficiency, manage demand and develop new ways to expand access. (*)
The use of ICT in the public sector can improve the range and uptake of digital government services; strengthen the performance of public institutions and enhance transparency and the participation of all citizens. (*)
Target 8.2: Achieve higher levels of economic productivity through diversification, technological upgrading and innovation .
Target 8.3: Promote development-oriented policies that support productive activities, decent job creation, entrepreneurship, creativity and innovation , and encourage the formalisation and growth of micro-, small and medium-sized enterprises, including through access to financial services.
Target 17.8: Fully operationalise the technology bank and science, technology and innovation capacity-building mechanism for least developed countries by 2017 and enhance the use of enabling technology , in particular information and communications technology .
Note: Not all SDGs had an ICT component officially included in a corresponding target by the UN. In those cases, identified by (*), examples were identified by the OECD to depict how ICTs could contribute to that particular goal.Source: OECD/IDB (2016), Broadband Policies for Latin America and the Caribbean, based on United Nations General Assembly (2015), Transforming our world: the 2030 Agenda for Sustainable Development, https://sustainabledevelopment.un.org/post2015/transformingourworld.
3. dIgItalISatION IN MaNUfactUrINg aNd ServIceS IN eMergINg aSIa
131130 ecONOMIc OUtlOOK fOr SOUtHeaSt aSIa, cHINa aNd INdIa 2018: fOSterINg grOWtH tHrOUgH dIgItalISatION © Oecd 2018 ecONOMIc OUtlOOK fOr SOUtHeaSt aSIa, cHINa aNd INdIa 2018: fOSterINg grOWtH tHrOUgH dIgItalISatION © Oecd 2018
Countries in the region face different priorities in developing the digital economy
Indonesia has the fourth-largest population in the world, and is often projected to become the biggest market for digital trade in Southeast Asia in the near future. Over the years, Indonesia has made progress in digitalisation, as reflected by the rise of Internet users and online shoppers in the country. However, the country needs to address a number of important issues in order to fully release its digital potential. First of all, Indonesia’s ICT infrastructure is relatively poor compared to the rest of Emerging Asia, both in terms of quality and quantity. Internet use stood at 25.4% of the population in 2016. This places Indonesia just above, Lao PDR and Myanmar. Meanwhile, Indonesia’s Internet connection speed is also slower than in many of its neighbours. Moreover, Indonesia also lags behind China and Viet Nam in this regard. Furthermore, the price of broadband Internet in Indonesia is also above the regional average, mainly due to its being an archipelago, which makes it technically more difficult to maintain an Internet network throughout the country. Although the government has started expanding the domestic broadband network through the Palapa Ring Project, much remains to be done for Indonesia to catch up with its regional peers in terms of infrastructure.
Another major challenge that Indonesia faces is in human resources. Many Indonesian start-ups face difficulties in finding skilled workers with the relevant expertise within the country. Indeed, they sometimes have to hire programmers or technicians from other countries, such as India. As the digital economy in Indonesia grows larger over time, there will be an increasing need for personnel specialised in coding, web design, Internet security, big data and other key areas. Moreover, the government needs to enhance investment in technical and vocational education and training (TVET), and to encourage people to engage in vocational education related to ICT. Meanwhile, companies could also strengthen in-house training in order to cater to their specific needs. However, since the majority of enterprises in Indonesia are micro, small and medium-sized enterprises, which tend to be less able to conduct adequate training on their own account, the government may have a supportive role to play where needed.
Like Indonesia, the Philippines is also an archipelago, with over 7 000 small islands. Indeed, the ICT infrastructure of the Philippines shares similar challenges with that of Indonesia in being slow and expensive. Internet speeds are slow and the cost of Internet connections in the Philippines is on a par with the cost in Indonesia. In order to address this situation, the government of the Philippines approved a national broadband plan earlier this year. This sets out detailed physical targets and strategies to support the deployment of broadband nationwide, and to encourage more widespread use of the Internet over the next five years. This plan is certainly a welcome sign of the government’s commitment to improving ICT infrastructure. However, funding these projects may prove to be difficult, as the new administration has also promised to increase spending on a variety of infrastructure projects, and to provide better social welfare, such as free college education. Delivering on all of these plans could put the national budget under strain. In order to fund the national broadband plan alongside other competing priorities, the government could consider using public-private partnerships (PPPs), and could also seek extra foreign aid in support of it.
Online transactions and online payment for goods and services, are among the key features of the digital economy. Moreover, the most basic requirement for online payment is having a bank account and a bank card. However, out of 100 million Filipinos, only 30 million have bank accounts. Meanwhile, the remaining 70 million continue to use cash for their daily needs. This so-called cash economy will not only jeopardise
3. dIgItalISatION IN MaNUfactUrINg aNd ServIceS IN eMergINg aSIa3. dIgItalISatION IN MaNUfactUrINg aNd ServIceS IN eMergINg aSIa
131ecONOMIc OUtlOOK fOr SOUtHeaSt aSIa, cHINa aNd INdIa 2018: fOSterINg grOWtH tHrOUgH dIgItalISatION © Oecd 2018
the development of online payment, which is crucial to the digital economy, but will also foster a business environment in which companies have little desire to innovate and to embrace the digital revolution. While the government should continue to push for financial inclusion in the Philippines, and to encourage citizens to apply for bank accounts, firms also need to change their mentality and to keep an open mind about digitalisation and the opportunities presented by new technologies.
Thailand has been implementing a number of initiatives to promote the digital economy through the “Thailand 4.0” plan. However, some challenges will need to be addressed. The country needs to invest in developing adequate infrastructure to support the digital economy, including high-capacity broadband Internet and data centres. Private investment could play a greater role in addressing this issue. To encourage a wider use of digital technology, improving people’s fluency in its use is an important challenge alongside improvements in access. Further boosting ICT skills is necessary, not only at the level of basic knowledge, but also beyond that. A 2016 survey from the National Statistical Office of Thailand found that in the country, one of the main reasons for not using Internet is not knowing how to use it. Improving people’s familiarity with computers and the Internet is crucial, though basic Internet skills such as sending emails and using web browsers will not be enough if the country is to achieve its goal to maximise the use of digital technologies in all socio-economic activities. Moreover, further efforts are also needed to address labour market challenges, in particular the shortage of labour with specialised ICT skills, including engineers and technicians.
In many ways, Viet Nam is relatively well-positioned to benefit from digitalisation. Among Emerging Asian countries, Viet Nam’s Internet connection speeds and affordability of Internet access are both better than average (Akamai, 2017; ITU, 2016a). Viet Nam also boasts the fourth-highest rate of Internet use relative to population in the region. However, the country faces challenges in some areas. First, new and small firms face considerable financing constraints; many startup companies have to seek funding through venture capital and only about 30% could get private bank loans or use personal savings (Thao Nguyen, 2013). Government programmes have been established to foster ICT startups and assist firms in overcoming these challenges, though more work is needed. A second challenge is the growth of e-commerce, an important component of the digital economy, which in Viet Nam has been slowed by concerns over Internet fraud and defective products. Among those shopping on line, 73% choose cash-on-delivery instead of digital payment methods to avoid disclosing personal financial information over the Internet (Bloomberg BNA, 2015). Finally, continued digitalisation and technological change in other areas will raise challenges from automation in the country. The textile and agricultural sectors still account for a significant share of the Vietnamese economy employ large numbers of workers. The potential impact from automation on these sectors is estimated to be very large and could cause tens of millions of workers to lose their jobs (Tran Dinh Thien, 2017). Skill development and retraining programmes will be important in helping workers adapt to technological change.
Among Emerging Asian countries, Singapore stands out as a state that has been highly successful in supporting digitalisation. A key element of its approach is its openness to trade in digital services. This openness is reflected in a strong proportion of added value from foreign ICT services in its exports of manufactured goods. Interestingly, Singapore relies relatively heavily on inputs sourced from outside the region, which underscores the importance of liberalising on a non-discriminatory basis, rather than doing so primarily through preferential agreements with a limited geographical reach. Of course, part of Singapore’s strong performance is related to its high-income status. This very status
3. dIgItalISatION IN MaNUfactUrINg aNd ServIceS IN eMergINg aSIa
133132 ecONOMIc OUtlOOK fOr SOUtHeaSt aSIa, cHINa aNd INdIa 2018: fOSterINg grOWtH tHrOUgH dIgItalISatION © Oecd 2018 ecONOMIc OUtlOOK fOr SOUtHeaSt aSIa, cHINa aNd INdIa 2018: fOSterINg grOWtH tHrOUgH dIgItalISatION © Oecd 2018
reflects the country’s longstanding commitment to high-quality infrastructure, and to investing in human capital. These policy priorities, for which Singapore is known around the world, are also key to its success in digitalisation. However, even for a country like Singapore, challenges do exist. To further develop its digital economy, it needs to look beyond its border by focusing on cross-border e-commerce, and by taking advantage of large markets in neighbouring ASEAN countries, such as Malaysia and Indonesia. Furthermore, Singapore should leverage its advantage in terms of the quality of its human resources in order to stay at the forefront of digital revolution. The government of Singapore has introduced initiatives to boost know-how in the areas of artificial intelligence, data analytics and financial technology. These initiatives should contribute to cementing Singapore’s status as the technological front-runner in the region.
In the less-developed CLM countries, governments could first focus on developing basic ICT infrastructure, such as broadband Internet, secure servers and mobile phone networks. These are the basic requirements, without which the digital economy cannot flourish. Drafting a comprehensive national strategy to develop ICT could set out systematic guidance, which could help these countries to co-ordinate their efforts across different government departments. In addition, creating a supportive environment for foreign investment, so that it can help to finance the development of costly infrastructure, could help address the issue of funding. As well as improving infrastructure, the governments of these three countries should also make sure that existing infrastructure is efficiently and sufficiently utilised. For example, the allocation of spectrum to telecommunication operators is often not efficient. In Cambodia, concessions of telecommunications frequencies are awarded to various operators, but not all of the spectrum that is awarded is then operated by the licensees. In turn, a sub-optimal allocation of scarce spectrum could raise the costs that operators face in connecting end users to their networks. They may also discourage Internet usage due to the higher prices they create. For Cambodia, Lao PDR and Myanmar, where ICT infrastructure is limited, efficient use of the infrastructure that is already available is of critical importance.
China, meanwhile, is developing its digital economy, with a rapidly growing technology industry and improved ICT infrastructure. Chinese consumers have quickly adapted to change, and have helped the country to become the biggest business-to-consumer (B2C) e-commerce market in the world. As a result, China’s B2C e-commerce market has now surpassed those of the United States and Japan. On the other hand, while digital manufacturing has become a buzzword among Chinese manufacturers, organisational capabilities, talent and mindsets are all lagging behind in many companies. Although most Chinese companies acknowledge that digitalisation can significantly increase their competitiveness and accelerate productivity growth, and although they tend to be willing to undertake industrial upgrades, few are fully ready to embrace digitalisation to its fullest extent. Compared with 71% in the United States, and 68% in Germany, only 57% of Chinese firms said they are ready to undertake a digital transformation of their businesses (Hou et al., 2017). Moreover, only 6% of Chinese companies have a clear roadmap for digitalisation. This contrasts with 33% of companies in the United States, and 35% in Germany. Few companies in China have either made digitalisation a priority, or raised awareness and skills in this regard among frontline managers. In 2015, China announced the Made in China 2025 blueprint as a way to shift manufacturing up the value chain. It is indeed important for government and companies in China to start devising concrete, detailed and well-tailored plans to achieve this goal.
In India, the digital economy is also developing rapidly and outperforming its neighbour China in some areas such as IT services. Indeed, the IT sector has long been the bread and butter of the Indian economy, contributing to 7.7% of GDP in 2016, and high quality IT services are India’s defining feature in the global sourcing market. India’s
3. dIgItalISatION IN MaNUfactUrINg aNd ServIceS IN eMergINg aSIa3. dIgItalISatION IN MaNUfactUrINg aNd ServIceS IN eMergINg aSIa
133ecONOMIc OUtlOOK fOr SOUtHeaSt aSIa, cHINa aNd INdIa 2018: fOSterINg grOWtH tHrOUgH dIgItalISatION © Oecd 2018
IT industry is currently estimated at over USD 150 billion and is a major employer in the country, with about 10 million employees. Despite its global reputation, domestic demand for India’s IT services is relatively weak and more than two-thirds of total industry revenues come from IT exports. The over-reliance on exports could pose a significant risk due to uncertainty of external environment. In terms of other aspects of digital economy, online shopping in India is expected to grow by 85% in 2017 and the usage of digital payment platforms received a major boost from the government’s demonetisation policy last year. However, the size of e-commerce market is still quite small in comparison to China with similar population. Total online spending is projected to be USD 128 billion by 2018, only about 10% of the e-commerce market in China. The government needs to continue deepening financial inclusion and improving financial literacy in order to take advantage of the huge population of India and unleash the full potential of digital economy. With only 29.5% of the population making use of the Internet, further efforts are also needed in expanding infrastructure, encouraging affordable access at sufficient speeds and developing digital skills in order to realise inclusive digitalisation.
Given the international nature of information flows, policy strategies on the development of the digital economy will need to include regional and international co-operation. Issues relevant to e-commerce including consumer protection, digital security and digital infrastructure have already been addressed through regional frameworks (Box 3.3). Another key question that policy makers will need to address relates to the freedom of data flows. Movement of information across borders is crucial to the operation of the digital economy, and thus to the producers of goods and services that rely on it. However, a significant number of governments around the world, including some in Emerging Asia, are exploring rules such as localisation requirements. Such rules have the potential to disrupt the free flow of data, which could in turn inhibit the progress of digitalisation in goods and services markets. Although governments have a clear interest in protecting citizens’ information and data, it is important to choose instruments that do not impose undue economic costs on operators. Data localisation requirements are similar to local content rules. Extensive analysis has shown these to be relatively inefficient ways of achieving social goals. On the other hand, improving co-operation among regulators, and the flow of information between private-sector operators and policy makers, could help to identify less costly regulatory alternatives.
Box 3.3. Regional initiatives on e-commerce
Legislative and regulatory reform in support of e-commerce must consider both the domestic and international contexts. Consumer Protection in E-commerce: OECD Recommendation, for example, calls for global co-operation through actions such as information-sharing, international assistance and mutual recognition and enforcement of judgements on disputes arising from e-commerce activities (OECD, 2016e). ASEAN and other regional frameworks increasingly focus attention on the need to work together to achieve efficient cross-border e-commerce in Emerging Asia.
The 2000 e-ASEAN Framework Agreement outlined regional plans to develop the ICT sector, reduce the digital divide within and among member states, promote co-operation between the public and private sectors, and promote liberalisation of trade in relevant goods and services as well as investment. The Agreement’s Article 5 was concerned with the “facilitation of the growth of electronic commerce” through supportive laws
3. dIgItalISatION IN MaNUfactUrINg aNd ServIceS IN eMergINg aSIa
135134 ecONOMIc OUtlOOK fOr SOUtHeaSt aSIa, cHINa aNd INdIa 2018: fOSterINg grOWtH tHrOUgH dIgItalISatION © Oecd 2018 ecONOMIc OUtlOOK fOr SOUtHeaSt aSIa, cHINa aNd INdIa 2018: fOSterINg grOWtH tHrOUgH dIgItalISatION © Oecd 2018
Box 3.3. Regional initiatives on e-commerce
and policies, the mutual recognition of digital signatures, secure regional electronic transactions, the protection of IPRs arising from e-commerce, protection of data and consumer privacy, and alternative dispute mechanisms for online transactions.
The ASEAN Economic Community Blueprint 2015, adopted in November 2007 and covering the period up to 2015, includes e-commerce as one of six elements needed to build a competitive economic region. Targeted actions on e-commerce included co-operation on telecommunications, harmonisation of relevant legal infrastructures, the development of guidelines and best practices, mutual recognition of digital signatures, and the establishment of a networking forum for businesses in ASEAN and dialogue partner countries.
The current regional economic plan, the ASEAN Economic Community Blueprint 2025, dedicates a section to e-commerce, noting its global growth, importance in determining trade and investment, and the opportunities it presents by lowering costs to businesses. Targets for promoting e-commerce include harmonising consumer rights, protection laws and legal frameworks for online dispute resolution; co-operating on creating e-identification and authorisation initiatives; and building a framework for personal data protection. The 2025 plan also includes targets related to e-commerce in the context of consumer protection and strengthening the role of micro, small and medium-sized enterprises by promoting their use of e-commerce.
The ASEAN ICT Masterplan 2020 comprises eight strategic thrusts, all of which have at least some relevance for the further development of e-commerce in the region: economic development and transformation, people integration and empowerment through ICT, innovation, ICT infrastructure development, human capital development, ICT in the single market, new media and content, and information security and assurance. E-commerce is directly mentioned in the plan only in the context of promoting digital trade, under “economic development and transformation”. The plan calls for the study of policies and best practices to accelerate the development of e-commerce and digital service delivery in ASEAN.
Co-operation on e-commerce and the ICT sector is a key focus of the Greater Mekong Subregion (GMS) programme, which covers Cambodia, Yunnan Province and Guangxi Zhuang Autonomous Region in China, Lao PDR, Myanmar, Thailand and Viet Nam. The GMS programme focuses on increasing connectivity, improving competitiveness and building a greater sense of community through investments in subregional projects in a number of sectors. The Greater Mekong Subregion Economic Cooperation Program Strategic Framework 2012-22, the programme’s current 10-year plan, calls for efforts to strengthen institutional structures, identify future infrastructure needs, advance co-operation on new ICT, promote ICT applications such as e-commerce and e-learning, direct human resources for the sector’s development and develop pilot ICT projects in rural areas.
Beyond ASEAN, wider regional co-operation frameworks also address the need for international approaches to developing the digital economy in general and e-commerce in particular. The Statement on Issues Related to Security of and in the Use of Information and Communications Technologies, released at the 10th East Asia Summit in Malaysia in November 2015, calls on participants to intensify efforts to co-operate on the development of secure ICT systems and risk-reduction initiatives, and to strengthen co-operation on capacity-building and other work.
(cont.)
3. dIgItalISatION IN MaNUfactUrINg aNd ServIceS IN eMergINg aSIa3. dIgItalISatION IN MaNUfactUrINg aNd ServIceS IN eMergINg aSIa
135ecONOMIc OUtlOOK fOr SOUtHeaSt aSIa, cHINa aNd INdIa 2018: fOSterINg grOWtH tHrOUgH dIgItalISatION © Oecd 2018
Conclusion
Digitalisation has transformed manufacturing and services sectors in Emerging Asia as in the rest of the world, and existing and anticipated technologies look certain to drive continued change in the future. Even the use of more accessible ICT technologies and participation in global value chains affects trade and productivity trends in the region. Nevertheless, considerable challenges remain to be overcome to realise the potential of digitalisation in supporting the development of inclusive and sustainable economic growth. The use of technology by individuals and firms is increasing, but access differs considerably between and within countries. Among the key policy challenges to be addressed are those related to trade and investment in the digital economy, as well as labour market and social policy issues. The wide differences across the region mean that countries will need to adopt strategies tailored to their unique situations.
Policy makers will also need to be responsive to changing contexts. The future impacts of digitalisation in manufacturing and services will also be driven by additional factors that will affect how policy makers approach the issue. Continued development of technology will lower prices in its adoption and offer new opportunities and challenges to firms. Innovation in business organisation, such as in global value chains and the reorganisation of production across countries, will also follow and affect technological change.
3. dIgItalISatION IN MaNUfactUrINg aNd ServIceS IN eMergINg aSIa
137136 ecONOMIc OUtlOOK fOr SOUtHeaSt aSIa, cHINa aNd INdIa 2018: fOSterINg grOWtH tHrOUgH dIgItalISatION © Oecd 2018 ecONOMIc OUtlOOK fOr SOUtHeaSt aSIa, cHINa aNd INdIa 2018: fOSterINg grOWtH tHrOUgH dIgItalISatION © Oecd 2018
Note
1. The United Nations International Standard Industrial Classification of All Economic Activities (ISIC) is the international standard for classifying economic activities. It is commonly used to identify industries in industry-level statistics.
References
Akamai (2017), State of the Internet Connectivity Report, Akamai, Cambridge, Massachusetts, www.akamai.com/fr/fr/multimedia/documents/state-of-the-Internet/q1-2017-state-of-the-Internet-connectivity-report.pdf.
APO (2016), Asian Productivity Databook 2016, Asian Productivity Organization, Tokyo.
Arnold, J., G. Nicoletti and S. Scarpetta (2008), “Regulation, Allocative Efficiency and Productivity in OECD Countries”, OECD Economics Department Working Papers, No. 616.
Arntz, M., T. Gregory and U. Zierahn (2016), “The risk of automation for jobs in OECD countries: A comparative analysis”, OECD Social, Employment and Migration Working Papers, No. 189, OECD Publishing, Paris, http://dx.doi.org/10.1787/5jlz9h56dvq7-en.
Barbaso, M. (2014), “The Future of the Philippines’ KPO Industry”, Business World Online, www.bworldonline.com/content.php?section=Economy&title=the-future-of-the-philippines&8217-kpo-industry&id=95576, accessed 4 July 2017.
Bessen, J. (2015), Learning by Doing: The Real Connection between Innovation, Wages, and Wealth, Yale University Press, New Haven.
Blake (2016), Innovation and the Digital Economy, U.S. Embassy & Consulates in Indonesia, https://id.usembassy.gov/remarks-by-ambassador-blake-on-innovation-and-the-digital-economy-university-of-indonesia-depok.
Bloomberg BNA (2015), “Vietnam rolling out digital economy strategy”, https://www.bna.com/vietnam-rolling-digital-n57982058693/.
BOI (2015), Thailand Moving Ahead with Cluster Development, Thailand Board of Investment, Bangkok.
Christensen, C.M. (1997). The Innovator’s Dilemma: When new technologies cause great firms to fail, Harvard Business School Press, Boston.
Commander, S., R. Harrison and N. Menezes-Filho (2011), “ICT and Productivity in Developing Countries: New Firm-Level Evidence from Brazil and India”, Review of Economics and Statistics, 93(2).
Díaz-Chao, Á., J. Saint-González and J. Torrent-Sellens (2015), “ICT, innovation and firm productivity: New evidence from small local firms”, Journal of Business Research, 68:7, July.
fDiMarkets (2017), fDiMarkets, Financial Times, London.
Frey, C. and M. Osborne (2013), “The future of employment: How susceptible are jobs to computerisation?”, Oxford Martin School Working Paper.
Hou, F., A. Wang and T. Wu (2017), A Digital Upgrade for Chinese Manufacturing, McKinsey&Company, www.mckinsey.com/global-themes/china/a-digital-upgrade-for-chinese-manufacturing, accessed 23 August 2017.
Ghani, E. (2010), The Service Revolution in South Asia, Oxford University Press, Oxford.
Gholami, R., S. Lee and A. Heshmati (2005), “The causal relationship between ICT and FDI”, Research Paper, UNU-WIDER, United Nations University (UNU), No. 2005/6, ISBN 9291907057.
Hoekman, B. and B. Shepherd (2017), “Services Productivity, Trade Policy, and Manufacturing Exports”, The World Economy, 40(3): 499-516.
ILO (2016), ASEAN in Transformation: The Future of Jobs at Risk of Automation, International Labour Organisation, Geneva.
INSEAD (2016), The Global Talent Competitiveness Index 2017, INSEAD, Fontainebleau, France.
ITU (2016a), Measuring the Information Society Report 2016, International Telecommunication Union, Geneva.
ITU (2016b), ICT Development Index 2016, International Telecommunication Union, Geneva.
Kagermann, H. (2015), “Change Through Digitization – Value Creation in the Age of Industry 4.0.”, Albach, H., H. Meffert, A. Pinkwart, R. Reichwald (eds.), in Management of Permanent Change, Springer Gabler, Wiesbaden, Germany.
Kleinau, S. (2005), The build–to–order transformation. An Analysis of the Financial Impacts of Build–To–Order Practices in the Automobile and Computer Industries, Tennenbaum Institute, Georgia Institute of Technology, Atlanta.
3. dIgItalISatION IN MaNUfactUrINg aNd ServIceS IN eMergINg aSIa3. dIgItalISatION IN MaNUfactUrINg aNd ServIceS IN eMergINg aSIa
137ecONOMIc OUtlOOK fOr SOUtHeaSt aSIa, cHINa aNd INdIa 2018: fOSterINg grOWtH tHrOUgH dIgItalISatION © Oecd 2018
Knickrehm, M., B. Berthon and P. Daugherty (2016) Digital Disruption: The Growth Multiplier, Accenture, Dublin. https://www.accenture.com/_acnmedia/PDF-4/Accenture-Strategy-DigitalDisruption-Growth-Multiplier.pdf, accessed 2 September 2017.
Lendl, A., M. Olarreaga, S. Schropp and P.-L. Vezina (2016), “There Goes Gravity: eBay and the Death of Distance, Economic Journal, 126(591): 406-441.
Low, P. and G. Pasadilla (2016), Services in Global Value Chains: Manufacturing-Related Services, World Scientific, Singapore.
Lucas, L. (2017), “Race for China’s $5.5tn Mobile Payments Market Hots Up”, Financial Times, https://www.ft.com/content/e3477778-2969-11e7-bc4b-5528796fe35c?mhq5j=e2, accessed 4 July 2017.
van der Marel, E. and B. Shepherd (2013), “Services Trade, Regulation, and Regional Integration: Evidence from Sectoral Data”, The World Economy, 36(110): 1393-1405.
Miroudot, S., J. Sauvage and B. Shepherd (2012), “Trade Costs and Productivity in Services Sectors”, Economics Letters, 114(1): 36-38.
McKinsey Global Institute (2002), How IT Emables Productivity Growth: The US experience across three sectors in the 1990s, McKinsey & Company, San Francisco.
MDEC (2016), Malaysia in Prime Position to Lead the Digital Economy, Malaysia Digital Economy Corporation (MDEC) Sdn Bhd, Cyberjaya, https://mdec.my/news/malaysia-in-prime-position-to-lead-the-digital-economy.,
Molinuevo, M. (2017), “The Role of Vietnam’s Services Regulation in the ICT Sector” in C. Hollweg, T. Smith and D. Taglioni (eds.), Vietnam at a Crossroads: Engaging in the Next Generation of Global Value Chains, World Bank , Washington, DC.
National Board of Trade Sweden (2016), The Servification of EU Manufacturing: Building Competitiveness in the Internal Market, National Board of Trade Sweden, Stockholm.
Nordas, H. and D. Rouzet (2017), “The Impact of Services Trade Restrictiveness on Trade Flows”, The World Economy, 40(6): 1155-1183.
OECD (2017a), OECD.Stat (database), OECD, Paris.
OECD (2017b), OECD-WTO TiVA Database, OECD, Paris.
OECD (2017c), “Key Issues for Digital Transformation in the G20”, report prepared for a joint G20 German Presidency/OECD conference held in Berlin on 12 January 2017, OECD, Paris, https://www.oecd.org/g20/key-issues-for-digital-transformation-in-the-g20.pdf.
OECD (2017d), OECD Services Trade Restrictiveness Index, OECD, Paris.
OECD (2017e), FDI Regulatory Restrictiveness Index, OECD, Paris.
OECD (2017f), “Opportunities and Policy Challenges of Digitalisation in Southeast Asia”, Background note, OECD Southeast Asia Regional Forum, 24 August, Paris, https://www.oecd.org/southeast-asia/events/regional-forum/Forum_Note_Digital_Transformation_STI.pdf.
OECD (2016a), OECD Science, Technology and Innovation Outlook 2016, OECD Publishing, Paris, http://dx.doi.org/10.1787/sti_in_outlook-2016-en.
OECD (2016b), “New Markets and New Jobs”, OECD Digital Economy Papers, No. 255, OECD Publishing, Paris, http://dx.doi.org/10.1787/5jlwt496h37l-en.
OECD (2016c), Skills for a Digital World: Background Paper for Ministerial Panel 4.2, OECD Publishing, Paris.
OECD (2016d), Low-Performing Students: Why They Fall Behind and How to Help Them Succeed, OECD Publishing, Paris, http://dx.doi.org/10.1787/19963777.
OECD (2016e), Consumer Protection in E-commerce, OECD Publishing, Paris.
OECD (2015), OECD Digital Economy Outlook 2015, OECD Publishing, Paris, http://dx.doi.org/10.1787/9789264232440-en.
OECD (2014), Perspectives on Global Development 2014: Boosting Productivity to Meet the Middle-Income Challenge, OECD Publishing, Paris, http://dx.doi.org/10.1787/persp_glob_dev-2014-en.
OECD (2003), Meeting of the OECD Council at Ministerial Level 2003: Seizing the Benefits of ICT in a Digital Economy, OECD Publishing, Paris.
OECD/IDB (2016), Broadband Policies for Latin America and the Caribbean: A Digital Economy Toolkit, OECD Publishing, Paris, http://dx.doi.org/10.1787/9789264251823-en.
Pilat, D., F. Lee and B. van Aark (2002), “Production and the use of ICT: A sectoral perspective on productivity growth in the OECD area”, OECD Economic Studies, No. 35.
Polder, M., G. van Leeuwen and H. de Bondt (2014), Industry productivity dynamics, ICT intensity and the distribution of firm-level performance: Evidence for the Netherlands, paper prepared for the OECD WPIA-EIED Conference, Paris, 8-9 December.
https://www.accenture.com/_acnmedia/PDF-4/Accenture-Strategy-DigitalDisruption-Growth-Multiplier.pdf
3. dIgItalISatION IN MaNUfactUrINg aNd ServIceS IN eMergINg aSIa
NP138 ecONOMIc OUtlOOK fOr SOUtHeaSt aSIa, cHINa aNd INdIa 2018: fOSterINg grOWtH tHrOUgH dIgItalISatION © Oecd 2018 ecONOMIc OUtlOOK fOr SOUtHeaSt aSIa, cHINa aNd INdIa 2018: fOSterINg grOWtH tHrOUgH dIgItalISatION © Oecd 2018
Shirazi, F., R. Gholami and D. Higon (2010), “Do Foreign Direct Investment (FDI) and Trade Openness Explain the Disparity in ICT Diffusion between Asia-Pacific and the Islamic Middle Eastern Countries?”, Journal of Global Information Management, JGIM 18(3).
Smit, J., S. Kreutzer, C. Moeller and M. Carlberg (2016), Industry 4.0.: Study for the ITRE Committee, European Parliament, Policy department A: Economic and Scientific Policy, Brussels.
Sturgeon, T. and E. Zyllberberg (2017), “Vietnam’s Evolving Role in ICT Global Value Chains”, in Hollweg C., T. Smith and D. Taglioni (eds.), Vietnam at a Crossroads: Engaging in the Next Generation of Global Value Chains, World Bank, Washington, DC.
Tan, Z. (2004), “Evolution of China’s Telecommunications Manufacturing industry: Competition, Strategy and Government Policy”, Communication & Strategies, No 53.
Tan, F. and K. Leewongcharoen (2005), “Factors Contributing to IT Industry Success in Developing Economies: The Case of Thailand, Information Technology for Development”, 11(2), 161-194.
Thao Nguyen (2013), “Vietnam’s Internet Governance Policies: Opportunities for Developing a Competitive Digital Economy”, M-RCBG Associate Working Paper, https://www.hks.harvard.edu/sites/default/files/centers/mrcbg/files/Nguyen_Vietnam%2BGovernance%2BReport_ENG.pdf.
Tonby, O., J. Ng and M. Mancini (2014), Understanding ASEAN: The manufacturing opportunity, McKinsey Productivity Sciences Center.
Tran Dinh Thien (2017), Challenges for VN with Industry 4.0, Vietnamnet, http://english.vietnamnet.vn/fms/business/183357/challenges-for-vn-with-industry-4-0.html.
UNCTAD (2017), UNCTADStat (database), United Nations Conference on Trade and Development, Geneva.
UNCTAD (2016a), Project on strengthening technical competency for consumer protection in ASEAN Phones: Internet services & e-commerce, UNCTAD, Australian Aid and ASEAN, http://asean.org/storage/2012/05/E-Commerce-Module-Final-21Jan16.pdf, accessed 30 August 2017.
UNCTAD (2016b), Policy Brief: Robots and Industrialization in Developing Countries, United Nations Conference on Trade and Development, Geneva, http://unctad.org/en/PublicationsLibrary/presspb2016d6_en.pdf.
UNESCO (2017), “Science, technology and innovation: GERD as a percentage of GDP”, UIS Statistics (database), http://data.uis.unesco.org/ (accessed on 3 October 2017).
United Nations General Assembly (2015), Transforming our world: the 2030 Agenda for Sustainable Development, United Nations General Assembly, New York, https://sustainabledevelopment.un.org/post2015/transformingourworld.
World Bank (2017a), World Development Indicators, World Bank, Washington, DC.
World Bank (2017b), Enterprise Surveys, World Bank, Washington, DC.
World Bank (2016), World Development Report 2016: Digital Dividends, World Bank, Washington, DC, http://documents.worldbank.org/curated/en/896971468194972881/pdf/102725-PUB-Replacement-PUBLIC.pdf.
139ecONOMIc OUtlOOK fOr SOUtHeaSt aSIa, cHINa aNd INdIa 2018: fOSterINg grOWtH tHrOUgH dIgItalISatION © Oecd 2018
Domestic structural reform is necessary in improving prospects for
inclusive and sustainable growth in Emerging Asia. These structural
policy country notes highlight some of the key areas for reform in each
of the ASEAN member countries, China and India. Policy areas covered
include skills and education, FDI, infrastructure and connectivity,
green finance, trade, SOEs, land use, and innovation. The contexts of
these policy challenges are discussed, in order to appropriately frame
recommendations for achieving countries’ development goals. The
experiences of OECD member countries are shared where relevant, as
potential examples for policy makers in Emerging Asia. Updates are also
provided on recent developments in policy areas covered by previous
editions of the Outlook.
Chapter 4
Structural policy country notes

141
141ecONOMIc OUtlOOK fOr SOUtHeaSt aSIa, cHINa aNd INdIa 2018: fOSterINg grOWtH tHrOUgH dIgItalISatION © Oecd 2018
ASEAN-5ASEAN-5
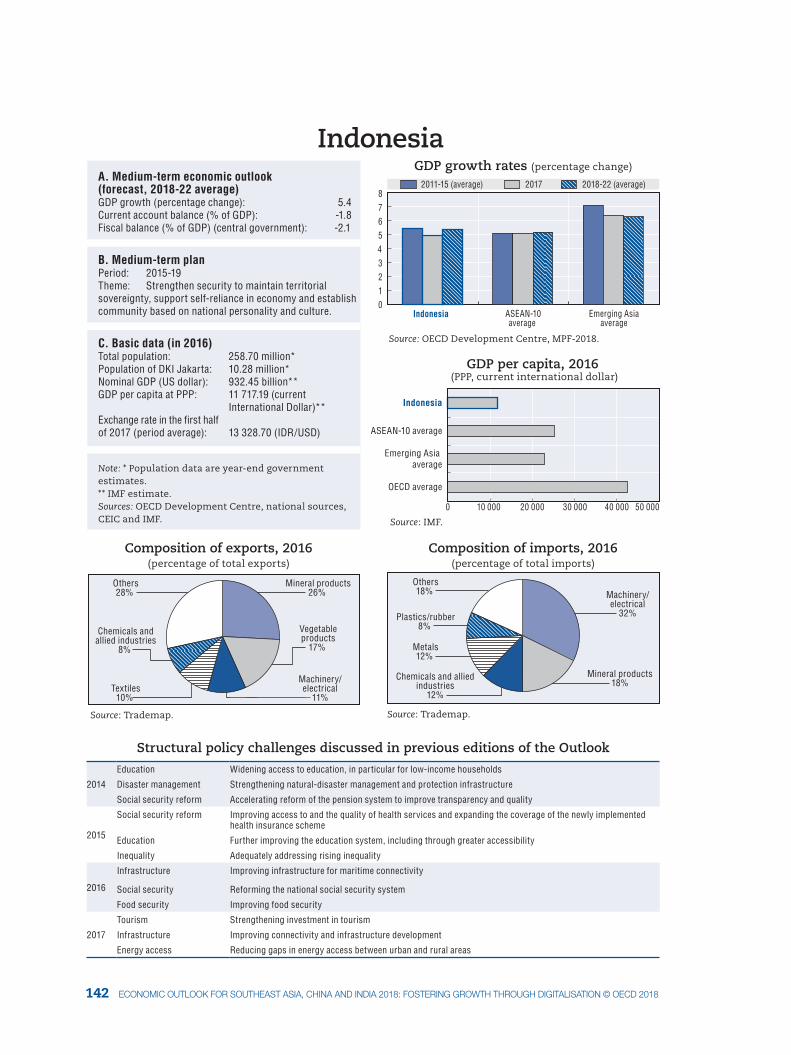
143142 ecONOMIc OUtlOOK fOr SOUtHeaSt aSIa, cHINa aNd INdIa 2018: fOSterINg grOWtH tHrOUgH dIgItalISatION © Oecd 2018
Mineral products26%
Vegetableproducts
17%
Machinery/electrical
11%Textiles
10%
Chemicals andallied industries
8%
Others28%
0 10 000 20 000 30 000 40 000 50 000
Source: OECD Development Centre, MPF-2018.
Source: IMF.
Source: Trademap. Source: Trademap.
Composition of exports, 2016(percentage of total exports)
Composition of imports, 2016(percentage of total imports)
Indonesia
Indonesia ASEAN-10average
Emerging Asiaaverage
2011-15 (average) 2017 2018-22 (average)
GDP growth rates (percentage change)
OECD average
Emerging Asia average
ASEAN-10 average
Indonesia
GDP per capita, 2016 (PPP, current international dollar)
A. Medium-term economic outlook (forecast, 2018-22 average) GDP growth (percentage change): 5.4Current account balance (% of GDP): -1.8Fiscal balance (% of GDP) (central government): -2.1
B. Medium-term plan Period: 2015-19Theme: Strengthen security to maintain territorial sovereignty, support self-reliance in economy and establish community based on national personality and culture.
C. Basic data (in 2016) Total population: 258.70 million*Population of DKI Jakarta: 10.28 million*Nominal GDP (US dollar): 932.45 billion**GDP per capita at PPP: 11 717.19 (current International Dollar)** Exchange rate in the first half of 2017 (period average): 13 328.70 (IDR/USD)
Note: * Population data are year-end government estimates. ** IMF estimate.Sources: OECD Development Centre, national sources, CEIC and IMF.
Mineral products18%
Machinery/electrical
32%
Chemicals and allied industries
12%
Metals12%
Plastics/rubber8%
Others18%
0 1 2 3 4 5 6 7 8
Structural policy challenges discussed in previous editions of the Outlook
2014
Education Widening access to education, in particular for low-income households
Disaster management Strengthening natural-disaster management and protection infrastructure
Social security reform Accelerating reform of the pension system to improve transparency and quality
2015
Social security reform Improving access to and the quality of health services and expanding the coverage of the newly implemented health insurance scheme
Education Further improving the education system, including through greater accessibility
Inequality Adequately addressing rising inequality
2016
Infrastructure Improving infrastructure for maritime connectivity
Social security Reforming the national social security system
Food security Improving food security
2017
Tourism Strengthening investment in tourism
Infrastructure Improving connectivity and infrastructure development
Energy access Reducing gaps in energy access between urban and rural areas
4. StrUctUral pOlIcY cOUNtrY NOteS
143ecONOMIc OUtlOOK fOr SOUtHeaSt aSIa, cHINa aNd INdIa 2018: fOSterINg grOWtH tHrOUgH dIgItalISatION © Oecd 2018
Recent developments in policy areas covered by previous editions of the Outlook
Infrastructure: Improving Indonesia’s logistics and creating single submission system
• On 15 June 2017, Indonesia’s government brought forward the country’s 15th economic policy package. This includes plans to: enhance the role of transportation insurance, reduce costs for logistic service providers, strengthen Indonesia National Single Window authority, and reduce the number of prohibited and restricted goods.
• Moreover, the government unveiled a 16th economic policy package focused on integrating business licensing services, utilising information technology, and enhancing co-operation and co-ordination among government agencies at the central and local levels.
Infrastructure: Strengthening the infrastructure sector by recycling assets
• Indonesia intends to sell minority stakes in its air and sea ports to foreign private investors, in a bid to raise funds for further infrastructure development. The state will sell shares of up to 45% in 10 airports and 20 ports but will retain majority ownership and control of these facilities.
Tourism: An industry facing a new challenge
• The government is planning to remove some countries from the visa-free travel list, which currently contains 169 nations. The Law and Human Rights Ministry is currently evaluating the plan, in partnership with other relevant institutions.
Energy: Fostering green projects in renewable energy
• Independent power producers continue to feature prominently in the 2017 edition of the 10-year electricity supply plan from Indonesia’s state-owned power company, PLN. The plan also envisages power plants that can tap into local energy sources including renewables, along with an increased emphasis on renewable energy with a particular focus on geothermal and hydro power.
• Furthermore, Indonesia’s government approved Energy and Mineral Resources Minister Decree (MD) No. 12/2017, which alters the calculation method for feed-in tariffs for renewable-power projects. This new decree is expected to lower tariffs paid to private developers, and the pricing for the purchase of electricity by PLN from renewable energy projects enacted by this decree is based on average cost of generation, a recommendation from PLN.
POLICY FOCUS
Fostering green finance
In an attempt to pare back business activities that damage the environment, international organisations and the Indonesian government have been promoting environmental, social, and governance programmes. Damage to Indonesia’s natural resources will harm economic growth and food security, and will have a particularly pronounced impact upon those living in poverty. Indonesia is a major producer of palm oil, and deforestation linked to this sector continues to concern the Indonesian government and the broader international community. Furthermore, Indonesia has become one of the world’s top 20 carbon emitters (Figure 4.1.1). Against this backdrop, the financial sector plays an important role as a conduit of investment for sectors with high environmental risks.
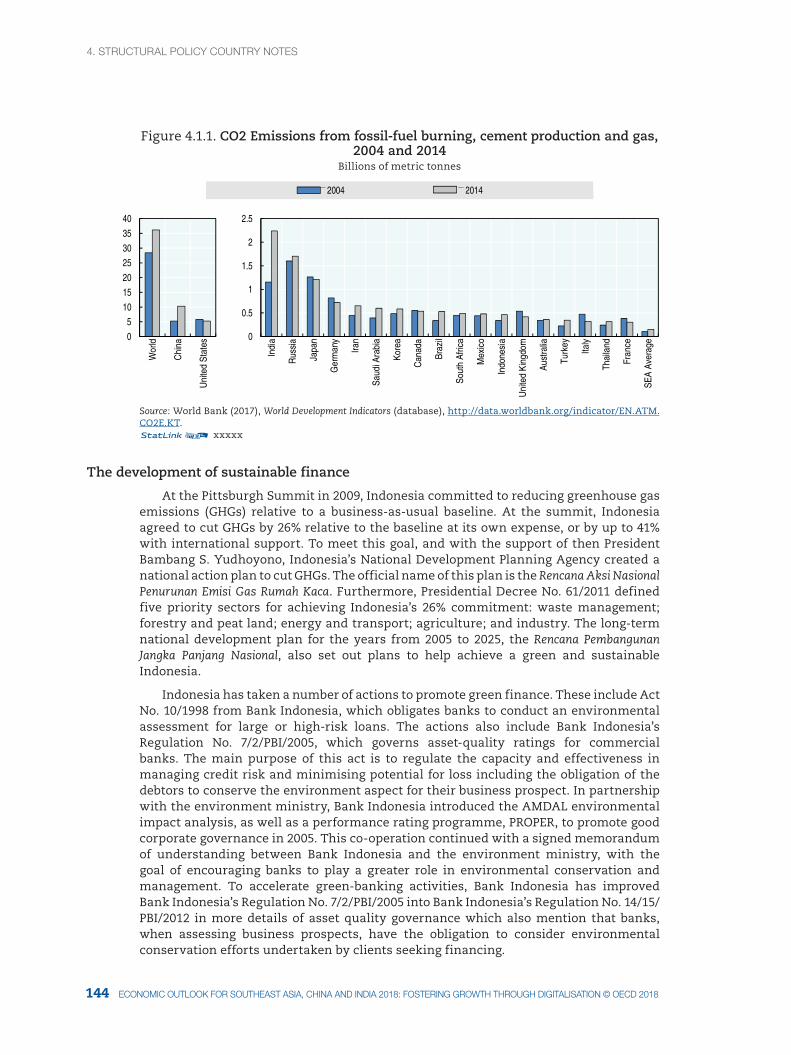
4. StrUctUral pOlIcY cOUNtrY NOteS
145144 ecONOMIc OUtlOOK fOr SOUtHeaSt aSIa, cHINa aNd INdIa 2018: fOSterINg grOWtH tHrOUgH dIgItalISatION © Oecd 2018
Figure 4.1.1. CO2 Emissions from fossil-fuel burning, cement production and gas, 2004 and 2014
Billions of metric tonnes
0
510
15
20
2530
35
40
Wor
ld
Chi
na
Uni
ted
Sta
tes 0
0.5
1
1.5
2
2.5
Indi
a
Rus
sia
Japa
n
Ger
man
y
Iran
Saud
i Ara
bia
Kore
a
Can
ada
Braz
il
Sout
h Af
rica
Mex
ico
Indo
nesi
a
Uni
ted
Kin
gdom
Aust
ralia
Turk
ey
Italy
Thai
land
Fran
ce
SEA
Ave
rage
2004 2014
Source: World Bank (2017), World Development Indicators (database), http://data.worldbank.org/indicator/EN.ATM.CO2E.KT.12 xxxxx
The development of sustainable finance
At the Pittsburgh Summit in 2009, Indonesia committed to reducing greenhouse gas emissions (GHGs) relative to a business-as-usual baseline. At the summit, Indonesia agreed to cut GHGs by 26% relative to the baseline at its own expense, or by up to 41% with international support. To meet this goal, and with the support of then President Bambang S. Yudhoyono, Indonesia’s National Development Planning Agency created a national action plan to cut GHGs. The official name of this plan is the Rencana Aksi Nasional Penurunan Emisi Gas Rumah Kaca. Furthermore, Presidential Decree No. 61/2011 defined five priority sectors for achieving Indonesia’s 26% commitment: waste management; forestry and peat land; energy and transport; agriculture; and industry. The long-term national development plan for the years from 2005 to 2025, the Rencana Pembangunan Jangka Panjang Nasional, also set out plans to help achieve a green and sustainable Indonesia.
Indonesia has taken a number of actions to promote green finance. These include Act No. 10/1998 from Bank Indonesia, which obligates banks to conduct an environmental assessment for large or high-risk loans. The actions also include Bank Indonesia’s Regulation No. 7/2/PBI/2005, which governs asset-quality ratings for commercial banks. The main purpose of this act is to regulate the capacity and effectiveness in managing credit risk and minimising potential for loss including the obligation of the debtors to conserve the environment aspect for their business prospect. In partnership with the environment ministry, Bank Indonesia introduced the AMDAL environmental impact analysis, as well as a performance rating programme, PROPER, to promote good corporate governance in 2005. This co-operation continued with a signed memorandum of understanding between Bank Indonesia and the environment ministry, with the goal of encouraging banks to play a greater role in environmental conservation and management. To accelerate green-banking activities, Bank Indonesia has improved Bank Indonesia’s Regulation No. 7/2/PBI/2005 into Bank Indonesia’s Regulation No. 14/15/PBI/2012 in more details of asset quality governance which also mention that banks, when assessing business prospects, have the obligation to consider environmental conservation efforts undertaken by clients seeking financing.
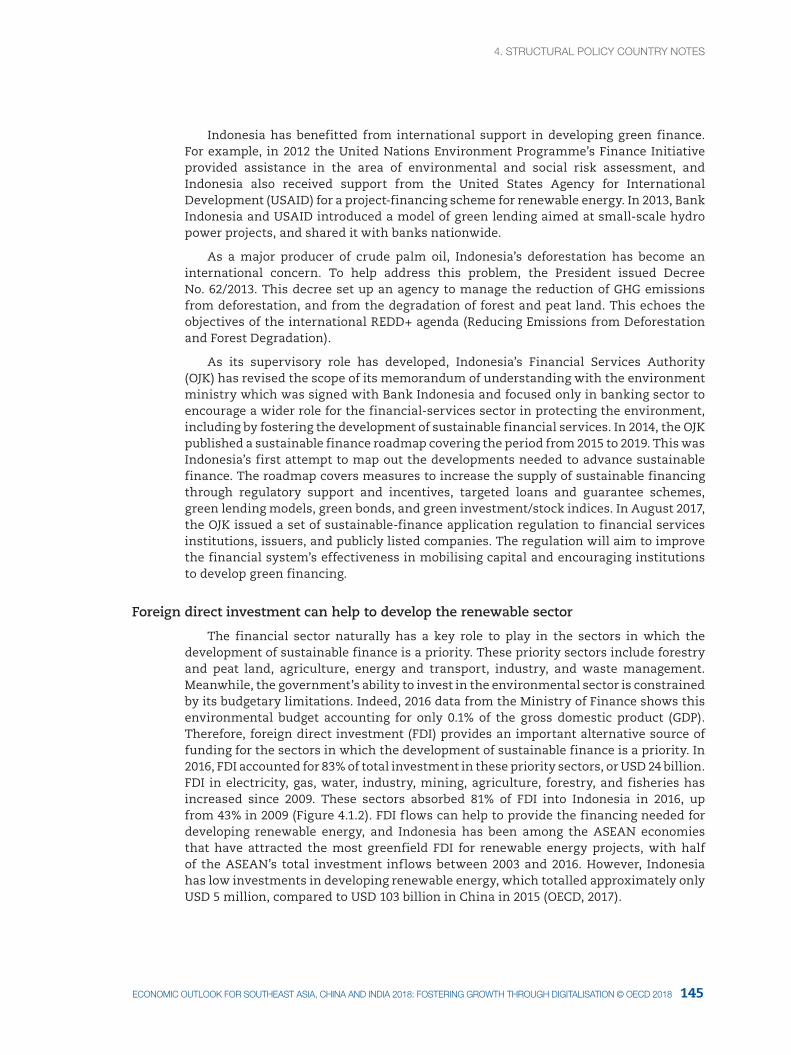
4. StrUctUral pOlIcY cOUNtrY NOteS4. StrUctUral pOlIcY cOUNtrY NOteS
145ecONOMIc OUtlOOK fOr SOUtHeaSt aSIa, cHINa aNd INdIa 2018: fOSterINg grOWtH tHrOUgH dIgItalISatION © Oecd 2018
Indonesia has benefitted from international support in developing green finance. For example, in 2012 the United Nations Environment Programme’s Finance Initiative provided assistance in the area of environmental and social risk assessment, and Indonesia also received support from the United States Agency for International Development (USAID) for a project-financing scheme for renewable energy. In 2013, Bank Indonesia and USAID introduced a model of green lending aimed at small-scale hydro power projects, and shared it with banks nationwide.
As a major producer of crude palm oil, Indonesia’s deforestation has become an international concern. To help address this problem, the President issued Decree No. 62/2013. This decree set up an agency to manage the reduction of GHG emissions from deforestation, and from the degradation of forest and peat land. This echoes the objectives of the international REDD+ agenda (Reducing Emissions from Deforestation and Forest Degradation).
As its supervisory role has developed, Indonesia’s Financial Services Authority (OJK) has revised the scope of its memorandum of understanding with the environment ministry which was signed with Bank Indonesia and focused only in banking sector to encourage a wider role for the financial-services sector in protecting the environment, including by fostering the development of sustainable financial services. In 2014, the OJK published a sustainable finance roadmap covering the period from 2015 to 2019. This was Indonesia’s first attempt to map out the developments needed to advance sustainable finance. The roadmap covers measures to increase the supply of sustainable financing through regulatory support and incentives, targeted loans and guarantee schemes, green lending models, green bonds, and green investment/stock indices. In August 2017, the OJK issued a set of sustainable-finance application regulation to financial services institutions, issuers, and publicly listed companies. The regulation will aim to improve the financial system’s effectiveness in mobilising capital and encouraging institutions to develop green financing.
Foreign direct investment can help to develop the renewable sector
The financial sector naturally has a key role to play in the sectors in which the development of sustainable finance is a priority. These priority sectors include forestry and peat land, agriculture, energy and transport, industry, and waste management. Meanwhile, the government’s ability to invest in the environmental sector is constrained by its budgetary limitations. Indeed, 2016 data from the Ministry of Finance shows this environmental budget accounting for only 0.1% of the gross domestic product (GDP). Therefore, foreign direct investment (FDI) provides an important alternative source of funding for the sectors in which the development of sustainable finance is a priority. In 2016, FDI accounted for 83% of total investment in these priority sectors, or USD 24 billion. FDI in electricity, gas, water, industry, mining, agriculture, forestry, and fisheries has increased since 2009. These sectors absorbed 81% of FDI into Indonesia in 2016, up from 43% in 2009 (Figure 4.1.2). FDI flows can help to provide the financing needed for developing renewable energy, and Indonesia has been among the ASEAN economies that have attracted the most greenfield FDI for renewable energy projects, with half of the ASEAN’s total investment inflows between 2003 and 2016. However, Indonesia has low investments in developing renewable energy, which totalled approximately only USD 5 million, compared to USD 103 billion in China in 2015 (OECD, 2017).
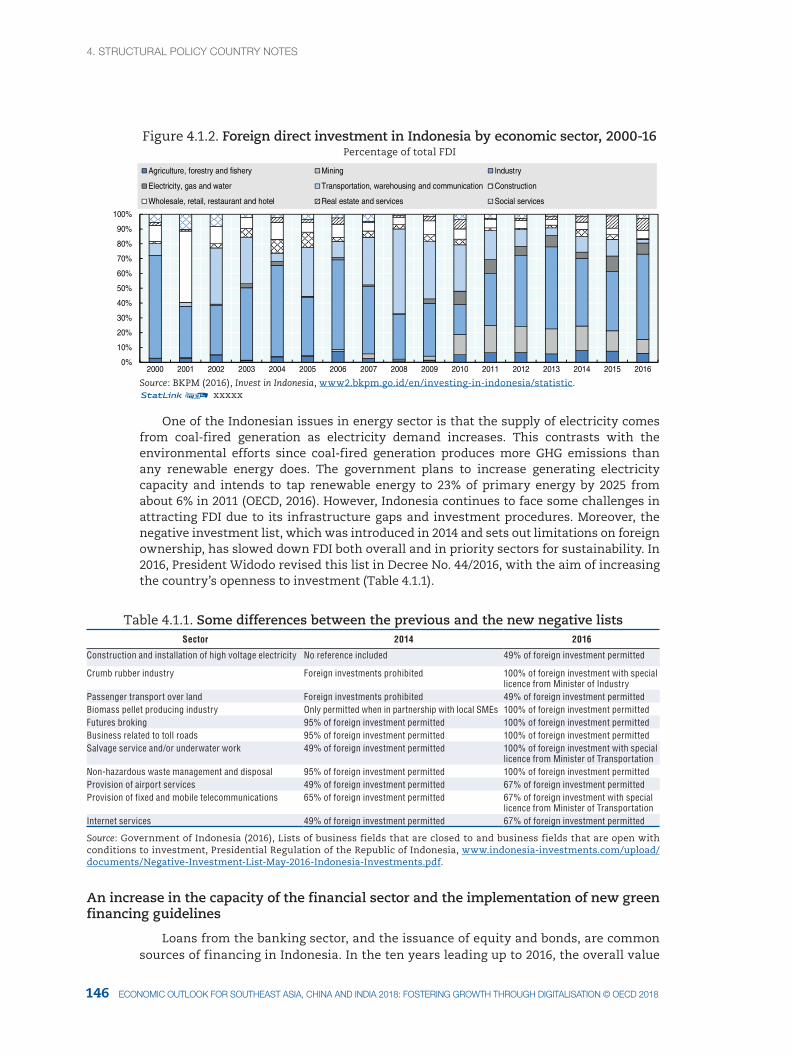
4. StrUctUral pOlIcY cOUNtrY NOteS
147146 ecONOMIc OUtlOOK fOr SOUtHeaSt aSIa, cHINa aNd INdIa 2018: fOSterINg grOWtH tHrOUgH dIgItalISatION © Oecd 2018
Figure 4.1.2. Foreign direct investment in Indonesia by economic sector, 2000-16Percentage of total FDI
0%
10%
20%
30%
40%
50%
60%
70%
80%
90%
100%
2000 2001 2002 2003 2004 2005 2006 2007 2008 2009 2010 2011 2012 2013 2014 2015 2016
Agriculture, forestry and fishery Mining Industry
Electricity, gas and water Transportation, warehousing and communication Construction
Wholesale, retail, restaurant and hotel Real estate and services Social services
Source: BKPM (2016), Invest in Indonesia, www2.bkpm.go.id/en/investing-in-indonesia/statistic.12 xxxxx
One of the Indonesian issues in energy sector is that the supply of electricity comes from coal-fired generation as electricity demand increases. This contrasts with the environmental efforts since coal-fired generation produces more GHG emissions than any renewable energy does. The government plans to increase generating electricity capacity and intends to tap renewable energy to 23% of primary energy by 2025 from about 6% in 2011 (OECD, 2016). However, Indonesia continues to face some challenges in attracting FDI due to its infrastructure gaps and investment procedures. Moreover, the negative investment list, which was introduced in 2014 and sets out limitations on foreign ownership, has slowed down FDI both overall and in priority sectors for sustainability. In 2016, President Widodo revised this list in Decree No. 44/2016, with the aim of increasing the country’s openness to investment (Table 4.1.1).
Table 4.1.1. Some differences between the previous and the new negative listsSector 2014 2016
Construction and installation of high voltage electricity No reference included 49% of foreign investment permitted
Crumb rubber industry Foreign investments prohibited 100% of foreign investment with special licence from Minister of Industry
Passenger transport over land Foreign investments prohibited 49% of foreign investment permittedBiomass pellet producing industry Only permitted when in partnership with local SMEs 100% of foreign investment permittedFutures broking 95% of foreign investment permitted 100% of foreign investment permittedBusiness related to toll roads 95% of foreign investment permitted 100% of foreign investment permittedSalvage service and/or underwater work 49% of foreign investment permitted 100% of foreign investment with special
licence from Minister of TransportationNon-hazardous waste management and disposal 95% of foreign investment permitted 100% of foreign investment permittedProvision of airport services 49% of foreign investment permitted 67% of foreign investment permittedProvision of fixed and mobile telecommunications 65% of foreign investment permitted 67% of foreign investment with special
licence from Minister of TransportationInternet services 49% of foreign investment permitted 67% of foreign investment permitted
Source: Government of Indonesia (2016), Lists of business fields that are closed to and business fields that are open with conditions to investment, Presidential Regulation of the Republic of Indonesia, www.indonesia-investments.com/upload/documents/Negative-Investment-List-May-2016-Indonesia-Investments.pdf.
An increase in the capacity of the financial sector and the implementation of new green financing guidelines
Loans from the banking sector, and the issuance of equity and bonds, are common sources of financing in Indonesia. In the ten years leading up to 2016, the overall value
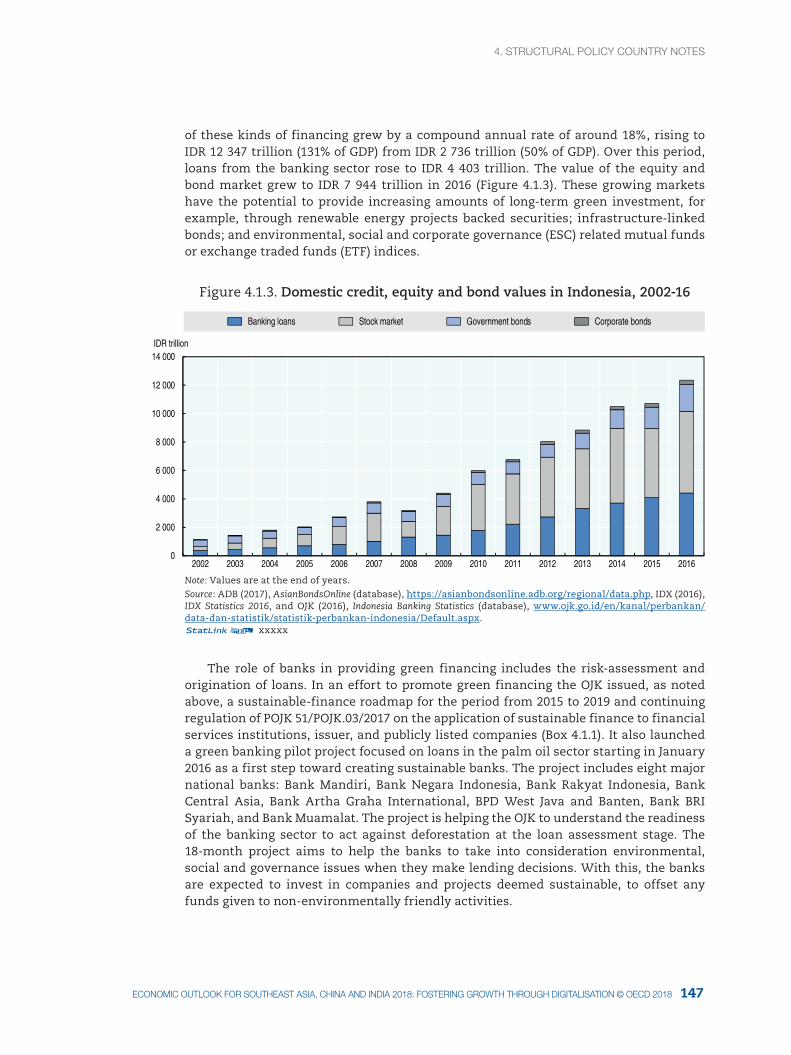
4. StrUctUral pOlIcY cOUNtrY NOteS4. StrUctUral pOlIcY cOUNtrY NOteS
147ecONOMIc OUtlOOK fOr SOUtHeaSt aSIa, cHINa aNd INdIa 2018: fOSterINg grOWtH tHrOUgH dIgItalISatION © Oecd 2018
of these kinds of financing grew by a compound annual rate of around 18%, rising to IDR 12 347 trillion (131% of GDP) from IDR 2 736 trillion (50% of GDP). Over this period, loans from the banking sector rose to IDR 4 403 trillion. The value of the equity and bond market grew to IDR 7 944 trillion in 2016 (Figure 4.1.3). These growing markets have the potential to provide increasing amounts of long-term green investment, for example, through renewable energy projects backed securities; infrastructure-linked bonds; and environmental, social and corporate governance (ESC) related mutual funds or exchange traded funds (ETF) indices.
Figure 4.1.3. Domestic credit, equity and bond values in Indonesia, 2002-16
0
2 000
4 000
6 000
8 000
10 000
12 000
14 000
2002 2003 2004 2005 2006 2007 2008 2009 2010 2011 2012 2013 2014 2015 2016
IDR trillion
Banking loans Stock market Government bonds Corporate bonds
Note: Values are at the end of years.Source: ADB (2017), AsianBondsOnline (database), https://asianbondsonline.adb.org/regional/data.php, IDX (2016), IDX Statistics 2016, and OJK (2016), Indonesia Banking Statistics (database), www.ojk.go.id/en/kanal/perbankan/data-dan-statistik/statistik-perbankan-indonesia/Default.aspx.12 xxxxx
The role of banks in providing green financing includes the risk-assessment and origination of loans. In an effort to promote green financing the OJK issued, as noted above, a sustainable-finance roadmap for the period from 2015 to 2019 and continuing regulation of POJK 51/POJK.03/2017 on the application of sustainable finance to financial services institutions, issuer, and publicly listed companies (Box 4.1.1). It also launched a green banking pilot project focused on loans in the palm oil sector starting in January 2016 as a first step toward creating sustainable banks. The project includes eight major national banks: Bank Mandiri, Bank Negara Indonesia, Bank Rakyat Indonesia, Bank Central Asia, Bank Artha Graha International, BPD West Java and Banten, Bank BRI Syariah, and Bank Muamalat. The project is helping the OJK to understand the readiness of the banking sector to act against deforestation at the loan assessment stage. The 18-month project aims to help the banks to take into consideration environmental, social and governance issues when they make lending decisions. With this, the banks are expected to invest in companies and projects deemed sustainable, to offset any funds given to non-environmentally friendly activities.
4. StrUctUral pOlIcY cOUNtrY NOteS
149148 ecONOMIc OUtlOOK fOr SOUtHeaSt aSIa, cHINa aNd INdIa 2018: fOSterINg grOWtH tHrOUgH dIgItalISatION © Oecd 2018
Box 4.1.1. OJK Roadmap for Sustainable Finance for 2015-2019
In December 2014, OJK published its Roadmap for Sustainable Finance in Indonesia. This roadmap constitutes OJK’s role in the government’s overall master plan for the financial services industry. It encompasses the following four areas:
• Ensure industrial, social and economic improvements that can help address the threat of global warming and mitigate other environmental and social issues.
• Encourage the widespread targeting of a competitive low-carbon economy.
• Strategically promote environmentally friendly investments in various sectors of business and the overall economy.
• Support the principles of development in Indonesia as set out in the National Medium Term Development Plan, the Rencana Pembangunan Jangka Menengah, namely the Four P’s: pro-growth, pro-jobs, pro-poor, and pro-environment.
To help the financial services industry to deliver sustainable finance, the OJK also emphasised the following areas: risk management, increasing sustainable activities in priority sectors, environmental and social governance and reporting, and capacity enhancement and collaborative partnership.
In the OJK’s roadmap, green financing and investment activities in the financial sector are not clearly defined. The biggest challenges include raising awareness within the sector of the need to incorporate environmental and social-risk considerations into lending and investment decisions. The challenges also include building up capacity in capital markets to cope with new types of green products such as ESG-related mutual funds and renewable energy projects backed securities that help foster a sustainable economy.
In August 2017, OJK issued regulation POJK 51/POJK.03/2017 that governs sustainable finance application to financial services institutions (FSI), issuers and publicly listed companies. In summary, this regulation includes the following requirements:
• FSIs, issuers, and publicly listed companies shall apply sustainable finance in their business activities by implementing responsible investment, sustainable business strategy and practice, social and environmental risk management, governance, informative communication, inclusive, priority sector development, and co-ordination and collaboration principle.
• FSIs, issuers, and publicly listed companies have the obligation to prepare a sustainable finance action plan and submit the plan on an annual basis to the financial services authority.
• FSIs, issuers, and publicly listed companies have to implement and communicate the plan to their shareholders and management.
• FSIs, issuers, and publicly listed companies shall prepare a sustainability report and submit the report to the financial services authority annually.
In a recent World Wildlife Fund study, information disclosed by the 34 largest banks in Indonesia, Malaysia, Philippines, Singapore, Thailand and Viet Nam show that only 12 of them have taken steps to direct lending toward more sustainable activities through the use of exclusion lists and sector policies (WWF, 2017). According to the OJK’s banking statistics for 2016, lending in sectors that are priorities to promote sustainable finance such as agriculture, mining, manufacturing, electricity, gas, water, construction,
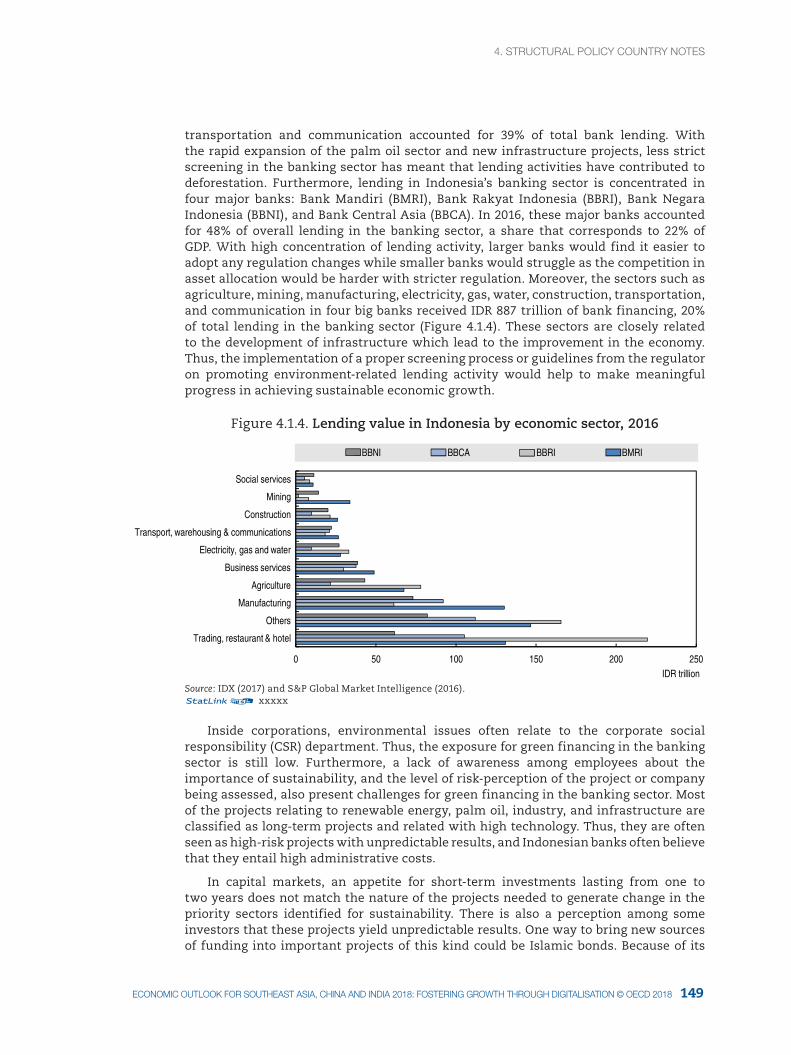
4. StrUctUral pOlIcY cOUNtrY NOteS4. StrUctUral pOlIcY cOUNtrY NOteS
149ecONOMIc OUtlOOK fOr SOUtHeaSt aSIa, cHINa aNd INdIa 2018: fOSterINg grOWtH tHrOUgH dIgItalISatION © Oecd 2018
transportation and communication accounted for 39% of total bank lending. With the rapid expansion of the palm oil sector and new infrastructure projects, less strict screening in the banking sector has meant that lending activities have contributed to deforestation. Furthermore, lending in Indonesia’s banking sector is concentrated in four major banks: Bank Mandiri (BMRI), Bank Rakyat Indonesia (BBRI), Bank Negara Indonesia (BBNI), and Bank Central Asia (BBCA). In 2016, these major banks accounted for 48% of overall lending in the banking sector, a share that corresponds to 22% of GDP. With high concentration of lending activity, larger banks would find it easier to adopt any regulation changes while smaller banks would struggle as the competition in asset allocation would be harder with stricter regulation. Moreover, the sectors such as agriculture, mining, manufacturing, electricity, gas, water, construction, transportation, and communication in four big banks received IDR 887 trillion of bank financing, 20% of total lending in the banking sector (Figure 4.1.4). These sectors are closely related to the development of infrastructure which lead to the improvement in the economy. Thus, the implementation of a proper screening process or guidelines from the regulator on promoting environment-related lending activity would help to make meaningful progress in achieving sustainable economic growth.
Figure 4.1.4. Lending value in Indonesia by economic sector, 2016
0 50 100 150 200 250IDR trillion
BBNI BBCA BBRI BMRI
Social services
Mining
Construction
Transport, warehousing & communications
Electricity, gas and water
Business services
Agriculture
Manufacturing
Others
Trading, restaurant & hotel
Source: IDX (2017) and S&P Global Market Intelligence (2016).12 xxxxx
Inside corporations, environmental issues often relate to the corporate social responsibility (CSR) department. Thus, the exposure for green financing in the banking sector is still low. Furthermore, a lack of awareness among employees about the importance of sustainability, and the level of risk-perception of the project or company being assessed, also present challenges for green financing in the banking sector. Most of the projects relating to renewable energy, palm oil, industry, and infrastructure are classified as long-term projects and related with high technology. Thus, they are often seen as high-risk projects with unpredictable results, and Indonesian banks often believe that they entail high administrative costs.
In capital markets, an appetite for short-term investments lasting from one to two years does not match the nature of the projects needed to generate change in the priority sectors identified for sustainability. There is also a perception among some investors that these projects yield unpredictable results. One way to bring new sources of funding into important projects of this kind could be Islamic bonds. Because of its
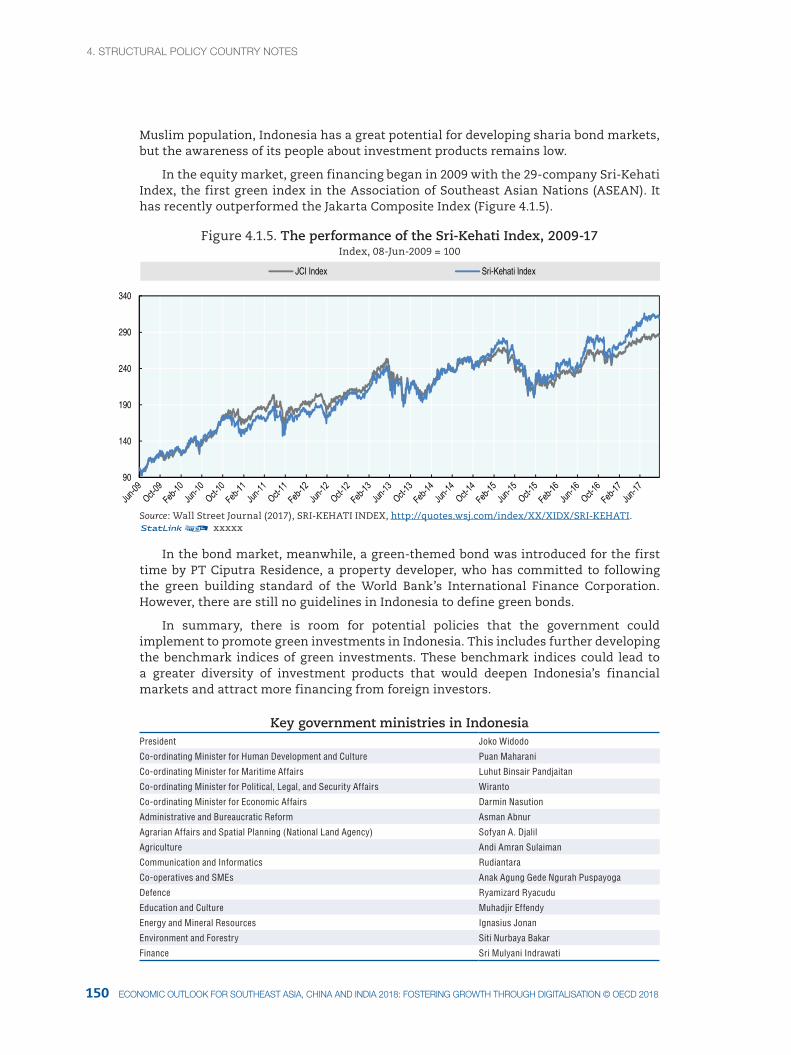
4. StrUctUral pOlIcY cOUNtrY NOteS
151150 ecONOMIc OUtlOOK fOr SOUtHeaSt aSIa, cHINa aNd INdIa 2018: fOSterINg grOWtH tHrOUgH dIgItalISatION © Oecd 2018
Muslim population, Indonesia has a great potential for developing sharia bond markets, but the awareness of its people about investment products remains low.
In the equity market, green financing began in 2009 with the 29-company Sri-Kehati Index, the first green index in the Association of Southeast Asian Nations (ASEAN). It has recently outperformed the Jakarta Composite Index (Figure 4.1.5).
Figure 4.1.5. The performance of the Sri-Kehati Index, 2009-17 Index, 08-Jun-2009 = 100
90
140
190
240
290
340
JCI Index Sri-Kehati Index
Source: Wall Street Journal (2017), SRI-KEHATI INDEX, http://quotes.wsj.com/index/XX/XIDX/SRI-KEHATI. 12 xxxxx
In the bond market, meanwhile, a green-themed bond was introduced for the first time by PT Ciputra Residence, a property developer, who has committed to following the green building standard of the World Bank’s International Finance Corporation. However, there are still no guidelines in Indonesia to define green bonds.
In summary, there is room for potential policies that the government could implement to promote green investments in Indonesia. This includes further developing the benchmark indices of green investments. These benchmark indices could lead to a greater diversity of investment products that would deepen Indonesia’s financial markets and attract more financing from foreign investors.
Key government ministries in IndonesiaPresident Joko Widodo
Co-ordinating Minister for Human Development and Culture Puan Maharani
Co-ordinating Minister for Maritime Affairs Luhut Binsair Pandjaitan
Co-ordinating Minister for Political, Legal, and Security Affairs Wiranto
Co-ordinating Minister for Economic Affairs Darmin Nasution
Administrative and Bureaucratic Reform Asman Abnur
Agrarian Affairs and Spatial Planning (National Land Agency) Sofyan A. Djalil
Agriculture Andi Amran Sulaiman
Communication and Informatics Rudiantara
Co-operatives and SMEs Anak Agung Gede Ngurah Puspayoga
Defence Ryamizard Ryacudu
Education and Culture Muhadjir Effendy
Energy and Mineral Resources Ignasius Jonan
Environment and Forestry Siti Nurbaya Bakar
Finance Sri Mulyani Indrawati
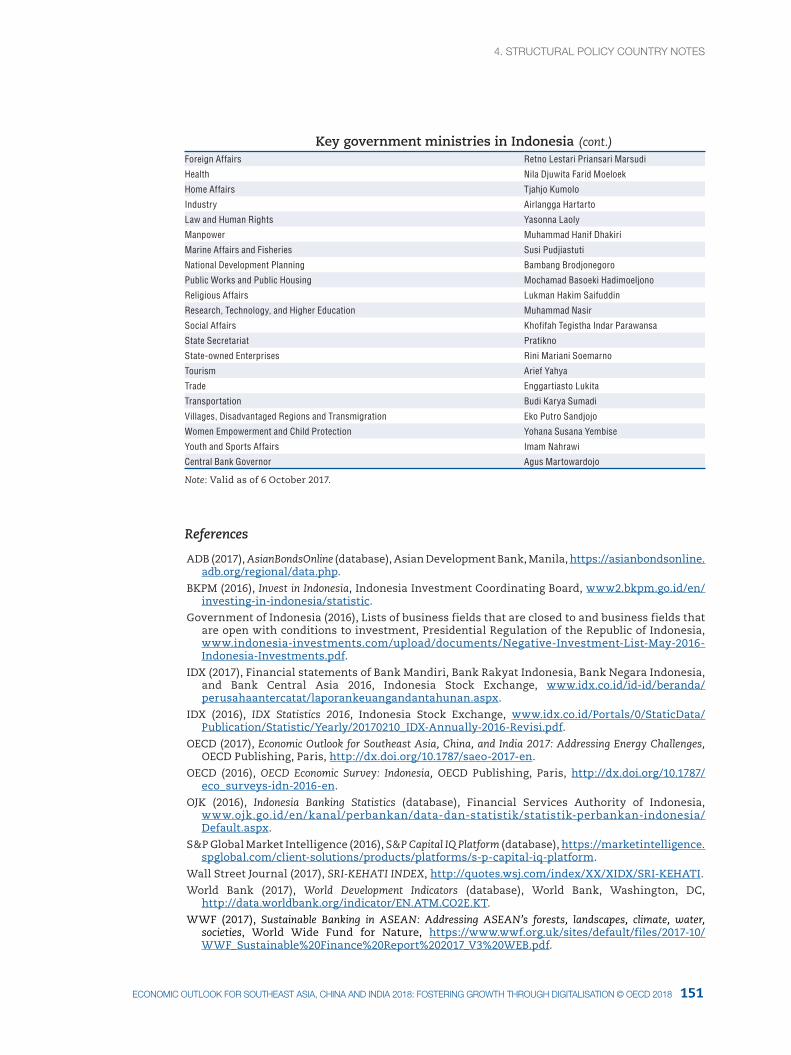
4. StrUctUral pOlIcY cOUNtrY NOteS4. StrUctUral pOlIcY cOUNtrY NOteS
151ecONOMIc OUtlOOK fOr SOUtHeaSt aSIa, cHINa aNd INdIa 2018: fOSterINg grOWtH tHrOUgH dIgItalISatION © Oecd 2018
Key government ministries in IndonesiaForeign Affairs Retno Lestari Priansari Marsudi
Health Nila Djuwita Farid Moeloek
Home Affairs Tjahjo Kumolo
Industry Airlangga Hartarto
Law and Human Rights Yasonna Laoly
Manpower Muhammad Hanif Dhakiri
Marine Affairs and Fisheries Susi Pudjiastuti
National Development Planning Bambang Brodjonegoro
Public Works and Public Housing Mochamad Basoeki Hadimoeljono
Religious Affairs Lukman Hakim Saifuddin
Research, Technology, and Higher Education Muhammad Nasir
Social Affairs Khofifah Tegistha Indar Parawansa
State Secretariat Pratikno
State-owned Enterprises Rini Mariani Soemarno
Tourism Arief Yahya
Trade Enggartiasto Lukita
Transportation Budi Karya Sumadi
Villages, Disadvantaged Regions and Transmigration Eko Putro Sandjojo
Women Empowerment and Child Protection Yohana Susana Yembise
Youth and Sports Affairs Imam Nahrawi
Central Bank Governor Agus Martowardojo
Note: Valid as of 6 October 2017.
References
ADB (2017), AsianBondsOnline (database), Asian Development Bank, Manila, https://asianbondsonline.adb.org/regional/data.php.
BKPM (2016), Invest in Indonesia, Indonesia Investment Coordinating Board, www2.bkpm.go.id/en/investing-in-indonesia/statistic.
Government of Indonesia (2016), Lists of business fields that are closed to and business fields that are open with conditions to investment, Presidential Regulation of the Republic of Indonesia, www.indonesia-investments.com/upload/documents/Negative-Investment-List-May-2016-Indonesia-Investments.pdf.
IDX (2017), Financial statements of Bank Mandiri, Bank Rakyat Indonesia, Bank Negara Indonesia, and Bank Central Asia 2016, Indonesia Stock Exchange, www.idx.co.id/id-id/beranda/perusahaantercatat/laporankeuangandantahunan.aspx.
IDX (2016), IDX Statistics 2016, Indonesia Stock Exchange, www.idx.co.id/Portals/0/StaticData/Publication/Statistic/Yearly/20170210_IDX-Annually-2016-Revisi.pdf.
OECD (2017), Economic Outlook for Southeast Asia, China, and India 2017: Addressing Energy Challenges, OECD Publishing, Paris, http://dx.doi.org/10.1787/saeo-2017-en.
OECD (2016), OECD Economic Survey: Indonesia, OECD Publishing, Paris, http://dx.doi.org/10.1787/eco_surveys-idn-2016-en.
OJK (2016), Indonesia Banking Statistics (database), Financial Services Authority of Indonesia, www.ojk.go.id/en/kanal/perbankan/data-dan-statistik/statistik-perbankan-indonesia/Default.aspx.
S&P Global Market Intelligence (2016), S&P Capital IQ Platform (database), https://marketintelligence.spglobal.com/client-solutions/products/platforms/s-p-capital-iq-platform.
Wall Street Journal (2017), SRI-KEHATI INDEX, http://quotes.wsj.com/index/XX/XIDX/SRI-KEHATI.
World Bank (2017), World Development Indicators (database), World Bank, Washington, DC, http://data.worldbank.org/indicator/EN.ATM.CO2E.KT.
WWF (2017), Sustainable Banking in ASEAN: Addressing ASEAN’s forests, landscapes, climate, water, societies, World Wide Fund for Nature, https://www.wwf.org.uk/sites/default/files/2017-10/WWF_Sustainable%20Finance%20Report%202017_V3%20WEB.pdf.
(cont.)
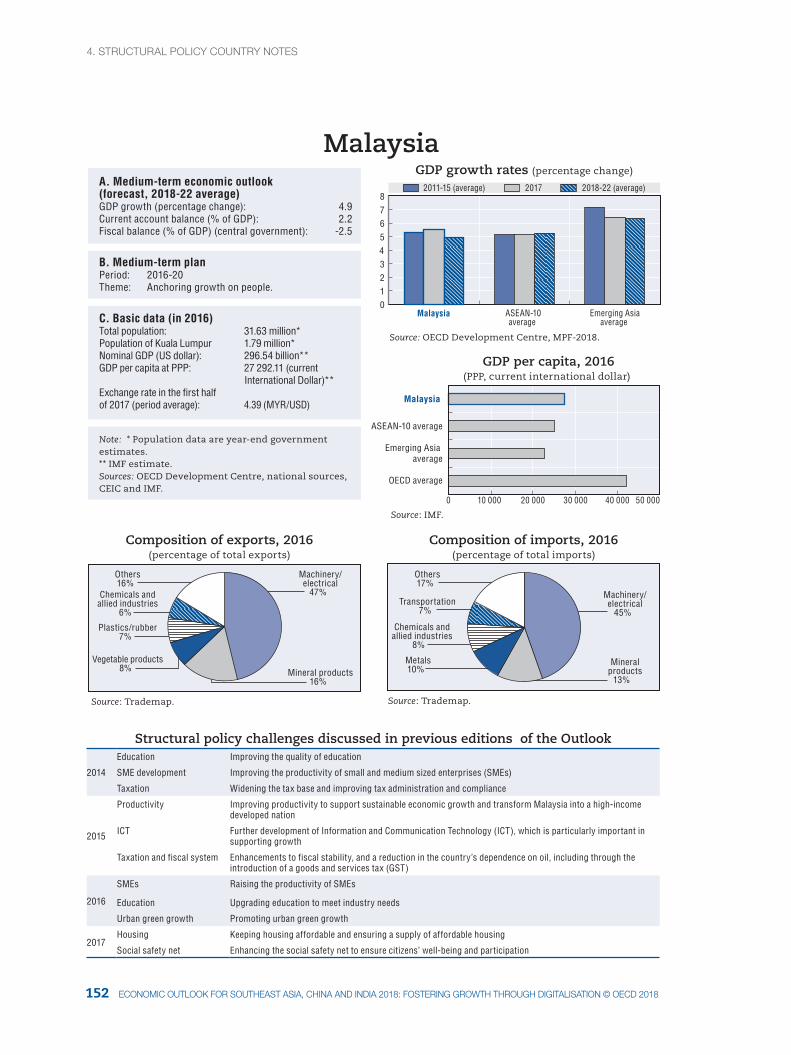
4. StrUctUral pOlIcY cOUNtrY NOteS
153152 ecONOMIc OUtlOOK fOr SOUtHeaSt aSIa, cHINa aNd INdIa 2018: fOSterINg grOWtH tHrOUgH dIgItalISatION © Oecd 2018
0 10 000 20 000 30 000 40 000 50 000
2011-15 (average) 2017 2018-22 (average)
Machinery/electrical
47%
Mineral products16%
Vegetable products8%
Plastics/rubber7%
Chemicals andallied industries
6%
Others16%
Machinery/electrical
45%
Mineralproducts
13%
Metals10%
Chemicals andallied industries
8%
Transportation7%
Others17%
Malaysia ASEAN-10average
Emerging Asiaaverage
GDP growth rates (percentage change)GDP growth rates (percentage change)
Source: OECD Development Centre, MPF-2018.
Source: IMF.
Source: Trademap. Source: Trademap.
OECD average
Emerging Asia average
ASEAN-10 average
Malaysia
GDP per capita, 2016(PPP, current international dollar)
Composition of exports, 2016(percentage of total exports)
Composition of imports, 2016(percentage of total imports)
MalaysiaA. Medium-term economic outlook (forecast, 2018-22 average) GDP growth (percentage change): 4.9Current account balance (% of GDP): 2.2Fiscal balance (% of GDP) (central government): -2.5
B. Medium-term planPeriod: 2016-20Theme: Anchoring growth on people.
C. Basic data (in 2016)Total population: 31.63 million*Population of Kuala Lumpur 1.79 million*Nominal GDP (US dollar): 296.54 billion**GDP per capita at PPP: 27 292.11 (current International Dollar)**Exchange rate in the first half of 2017 (period average): 4.39 (MYR/USD)
Note: * Population data are year-end government estimates. ** IMF estimate.Sources: OECD Development Centre, national sources, CEIC and IMF.
0 1 2 3 4 5 6 7 8
Structural policy challenges discussed in previous editions of the Outlook
2014
Education Improving the quality of education
SME development Improving the productivity of small and medium sized enterprises (SMEs)
Taxation Widening the tax base and improving tax administration and compliance
2015
Productivity Improving productivity to support sustainable economic growth and transform Malaysia into a high-income developed nation
ICT Further development of Information and Communication Technology (ICT), which is particularly important in supporting growth
Taxation and fiscal system Enhancements to fiscal stability, and a reduction in the country’s dependence on oil, including through the introduction of a goods and services tax (GST)
2016
SMEs Raising the productivity of SMEs
Education Upgrading education to meet industry needs
Urban green growth Promoting urban green growth
2017Housing Keeping housing affordable and ensuring a supply of affordable housing
Social safety net Enhancing the social safety net to ensure citizens’ well-being and participation
4. StrUctUral pOlIcY cOUNtrY NOteS4. StrUctUral pOlIcY cOUNtrY NOteS
153ecONOMIc OUtlOOK fOr SOUtHeaSt aSIa, cHINa aNd INdIa 2018: fOSterINg grOWtH tHrOUgH dIgItalISatION © Oecd 2018
Recent developments in policy areas covered by previous editions of the Outlook
Education: Promoting holistic development with a comprehensive, three-wave plan
• The Malaysia Education Blueprint was launched in 2013 and comprises three main waves of transformation. The first of these ran from 2013-15, with the second wave running from 2016-20, and the third scheduled for 2021-25. The vision is to create an education system that promotes child development holistically, through a comprehensive plan. The first wave focused on strengthening the current system whereas the second implements structural changes. The final wave will focus on scaling up these structural changes. Five aspirations run throughout the three waves of the plan, forming a common objective: access to education, equity for all students, a high international standard of quality, unity among students and more efficient delivery.
SME development: Introducing new assistance in the 2017 budget
• The 2017 budget highlighted the extension, until 2025, of guarantees of up to 15 billion ringgit (MYR) provided under various schemes run by Syarikat Jaminan Pembiayaan Perniagaan (SJPP), a subsidiary of the finance ministry. To encourage export-oriented SMEs to grow, they receive a 2% rebate on the interest rate they pay under the SJPP scheme. This rebate has a total funding envelope of MYR 1 billion. Moreover, a reduction in the corporate tax rate for SMEs on their first MYR 500 000 of chargeable income, from 19% to 18%, comes into effect in 2017.
ICT: Developing the sector through additional public investment
• The government is investing in a more competitive and advanced broadband infrastructure. A new price structure for broadband was also introduced, which foresees a 50% price cut within two years for users of the upgraded network. The government will also increase the speed of Ethernet broadband in public universities to up to 100 gigabits per second in 2017. Moreover, two new kinds of location-based initiative to promote ICT development will come into service: the Malaysian Digital Hub and Digital Free-Trade Zone (DFTZ).
POLICY FOCUS
Enhancing trade growth by strengthening the halal sector
Based on the latest available data, Malaysia is the leading exporter of halal products among member countries of the Organisation of Islamic Cooperation. As of 2016, however, halal exports only represented 5% of Malaysia’s total exports. Addressing the challenges the industry continues to face will be key to boosting trade in this niche sector, as Malaysia pursues its goal of becoming a halal hub by 2025.
Malaysia’s exports of halal products
Halal is an Arabic term that, in Islamic contexts, means lawful or permissible. When it comes to food, halal refers to products that can be eaten in accordance with Islamic sharia law. When applied to a particular industry, halal encompasses all levels of the production value chain, from beginning to end. This, especially when it comes to halal
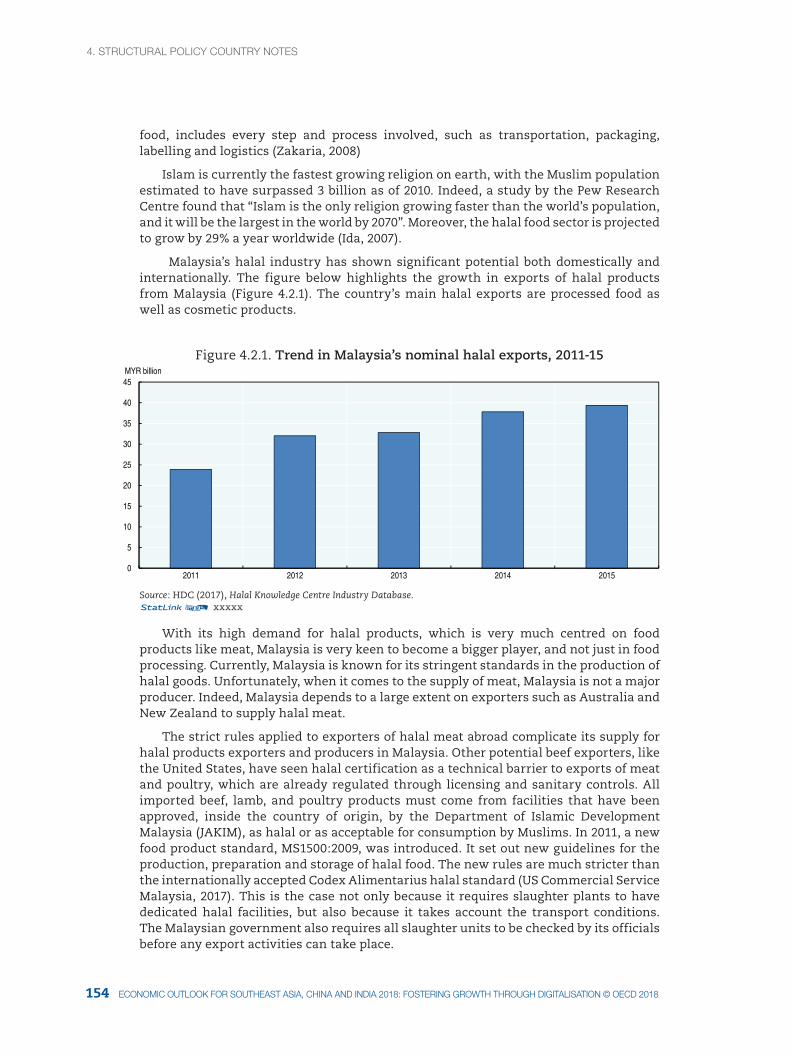
4. StrUctUral pOlIcY cOUNtrY NOteS
155154 ecONOMIc OUtlOOK fOr SOUtHeaSt aSIa, cHINa aNd INdIa 2018: fOSterINg grOWtH tHrOUgH dIgItalISatION © Oecd 2018
food, includes every step and process involved, such as transportation, packaging, labelling and logistics (Zakaria, 2008)
Islam is currently the fastest growing religion on earth, with the Muslim population estimated to have surpassed 3 billion as of 2010. Indeed, a study by the Pew Research Centre found that “Islam is the only religion growing faster than the world’s population, and it will be the largest in the world by 2070”. Moreover, the halal food sector is projected to grow by 29% a year worldwide (Ida, 2007).
Malaysia’s halal industry has shown significant potential both domestically and internationally. The figure below highlights the growth in exports of halal products from Malaysia (Figure 4.2.1). The country’s main halal exports are processed food as well as cosmetic products.
Figure 4.2.1. Trend in Malaysia’s nominal halal exports, 2011-15
0
5
10
15
20
25
30
35
40
45
2011 2012 2013 2014 2015
MYR billion
Source: HDC (2017), Halal Knowledge Centre Industry Database.12 xxxxx
With its high demand for halal products, which is very much centred on food products like meat, Malaysia is very keen to become a bigger player, and not just in food processing. Currently, Malaysia is known for its stringent standards in the production of halal goods. Unfortunately, when it comes to the supply of meat, Malaysia is not a major producer. Indeed, Malaysia depends to a large extent on exporters such as Australia and New Zealand to supply halal meat.
The strict rules applied to exporters of halal meat abroad complicate its supply for halal products exporters and producers in Malaysia. Other potential beef exporters, like the United States, have seen halal certification as a technical barrier to exports of meat and poultry, which are already regulated through licensing and sanitary controls. All imported beef, lamb, and poultry products must come from facilities that have been approved, inside the country of origin, by the Department of Islamic Development Malaysia (JAKIM), as halal or as acceptable for consumption by Muslims. In 2011, a new food product standard, MS1500:2009, was introduced. It set out new guidelines for the production, preparation and storage of halal food. The new rules are much stricter than the internationally accepted Codex Alimentarius halal standard (US Commercial Service Malaysia, 2017). This is the case not only because it requires slaughter plants to have dedicated halal facilities, but also because it takes account the transport conditions. The Malaysian government also requires all slaughter units to be checked by its officials before any export activities can take place.
4. StrUctUral pOlIcY cOUNtrY NOteS4. StrUctUral pOlIcY cOUNtrY NOteS
155ecONOMIc OUtlOOK fOr SOUtHeaSt aSIa, cHINa aNd INdIa 2018: fOSterINg grOWtH tHrOUgH dIgItalISatION © Oecd 2018
In January 2012, in a bid to boost halal practices in the pharmaceutical industry, the Malaysian Department of Standards implemented the MS 2424:2012 standard, setting out the country’s general guidelines on halal pharmaceuticals, a voluntary certification scheme. These guidelines have enabled manufacturers of pharmaceutical products in Malaysia to apply for halal certification. Furthermore, they define the basic requirements for the manufacture and handling of these products.
To date, the top two destinations for halal exports from Malaysia are within the local region, namely China and Singapore. Since 2012, the United States has been one of Malaysia’s three main trading partners for halal products. Within the Association of Southeast Asian Nations (ASEAN) region, meanwhile, Indonesia, Thailand, and the Philippines figures were among the top ten export destinations for Malaysian halal goods. Interestingly the Netherlands was among the top five destinations for Malaysia’s halal exports in 2012, but had fallen to ninth position by 2015, a year in which Japan stood in fifth place.
Table 4.2.1. Malaysia’s top ten export destinations for halal productsRank 2012 2013 2014 2015
1 China China China China
2 Singapore Singapore Singapore Singapore
3 USA USA USA USA
4 Indonesia Indonesia Indonesia Indonesia
5 Netherlands Japan Japan Japan
6 Thailand Thailand Netherlands Thailand
7 Japan Netherlands Thailand Australia
8 India India India Philippines
9 Korea Korea Korea Netherlands
10 Philippines Australia Australia India
Source: HDC (2017), Halal Knowledge Centre Industry Database.
Continued efforts to promote Malaysia as a halal hub
Considering the huge potential of the global halal industry, whose estimated value is around USD 2.1 trillion, the Malaysian government has introduced the three-phase Halal Industry Master Plan, with the aim of making Malaysia a halal hub by 2025. The main objective of the first phase, which ran from 2008-10, was to establish certification and support centres. This phase had a short timeframe, as Malaysia has been strong in the area of certification since the 1980s. The development of a body of halal law in the country has enabled the food processing sector to grow in line with demand from Malaysia’s Muslim-majority population. The plan’s second phase ran from 2011 to 2015. During this phase, Malaysia was promoted intensively as a halal hub and as a go-to destination for halal business. Since 2016 the government has dedicated greater resources to increasing exports of halal products.
To achieve the Halal Industry Master Plan’s objectives, the government has allocated specific roles to different authorities to ensure a smooth implementation. The Department of Islamic Development Malaysia (JAKIM) has played a crucial role both at home and abroad in issuing halal certifications, and in monitoring their dissemination. To date, JAKIM has recognised 67 Islamic bodies in 40 countries around the world as being competent to certify products destined for Malaysia.
The Halal Industry Development Corporation (HDC) was established in 2006 under the auspices of Malaysia’s Ministry of International Trade and Industry. In addition to
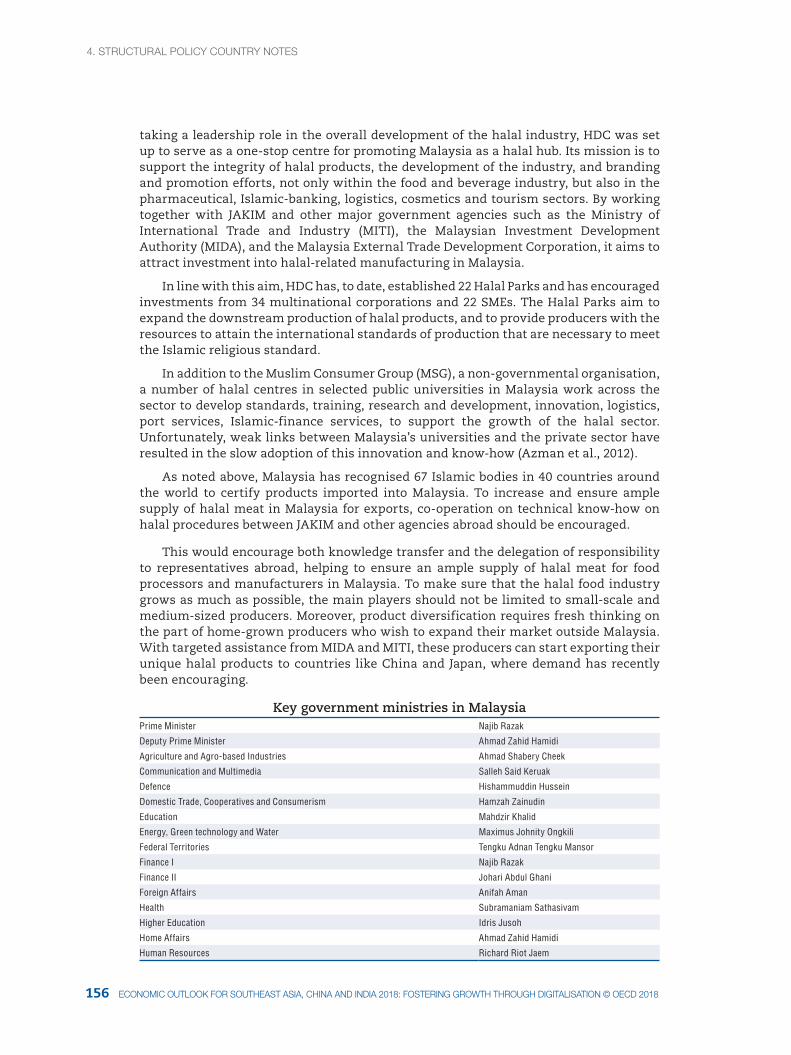
4. StrUctUral pOlIcY cOUNtrY NOteS
157156 ecONOMIc OUtlOOK fOr SOUtHeaSt aSIa, cHINa aNd INdIa 2018: fOSterINg grOWtH tHrOUgH dIgItalISatION © Oecd 2018
taking a leadership role in the overall development of the halal industry, HDC was set up to serve as a one-stop centre for promoting Malaysia as a halal hub. Its mission is to support the integrity of halal products, the development of the industry, and branding and promotion efforts, not only within the food and beverage industry, but also in the pharmaceutical, Islamic-banking, logistics, cosmetics and tourism sectors. By working together with JAKIM and other major government agencies such as the Ministry of International Trade and Industry (MITI), the Malaysian Investment Development Authority (MIDA), and the Malaysia External Trade Development Corporation, it aims to attract investment into halal-related manufacturing in Malaysia.
In line with this aim, HDC has, to date, established 22 Halal Parks and has encouraged investments from 34 multinational corporations and 22 SMEs. The Halal Parks aim to expand the downstream production of halal products, and to provide producers with the resources to attain the international standards of production that are necessary to meet the Islamic religious standard.
In addition to the Muslim Consumer Group (MSG), a non-governmental organisation, a number of halal centres in selected public universities in Malaysia work across the sector to develop standards, training, research and development, innovation, logistics, port services, Islamic-finance services, to support the growth of the halal sector. Unfortunately, weak links between Malaysia’s universities and the private sector have resulted in the slow adoption of this innovation and know-how (Azman et al., 2012).
As noted above, Malaysia has recognised 67 Islamic bodies in 40 countries around the world to certify products imported into Malaysia. To increase and ensure ample supply of halal meat in Malaysia for exports, co-operation on technical know-how on halal procedures between JAKIM and other agencies abroad should be encouraged.
This would encourage both knowledge transfer and the delegation of responsibility to representatives abroad, helping to ensure an ample supply of halal meat for food processors and manufacturers in Malaysia. To make sure that the halal food industry grows as much as possible, the main players should not be limited to small-scale and medium-sized producers. Moreover, product diversification requires fresh thinking on the part of home-grown producers who wish to expand their market outside Malaysia. With targeted assistance from MIDA and MITI, these producers can start exporting their unique halal products to countries like China and Japan, where demand has recently been encouraging.
Key government ministries in MalaysiaPrime Minister Najib Razak
Deputy Prime Minister Ahmad Zahid Hamidi
Agriculture and Agro-based Industries Ahmad Shabery Cheek
Communication and Multimedia Salleh Said Keruak
Defence Hishammuddin Hussein
Domestic Trade, Cooperatives and Consumerism Hamzah Zainudin
Education Mahdzir Khalid
Energy, Green technology and Water Maximus Johnity Ongkili
Federal Territories Tengku Adnan Tengku Mansor
Finance I Najib Razak
Finance II Johari Abdul Ghani
Foreign Affairs Anifah Aman
Health Subramaniam Sathasivam
Higher Education Idris Jusoh
Home Affairs Ahmad Zahid Hamidi
Human Resources Richard Riot Jaem
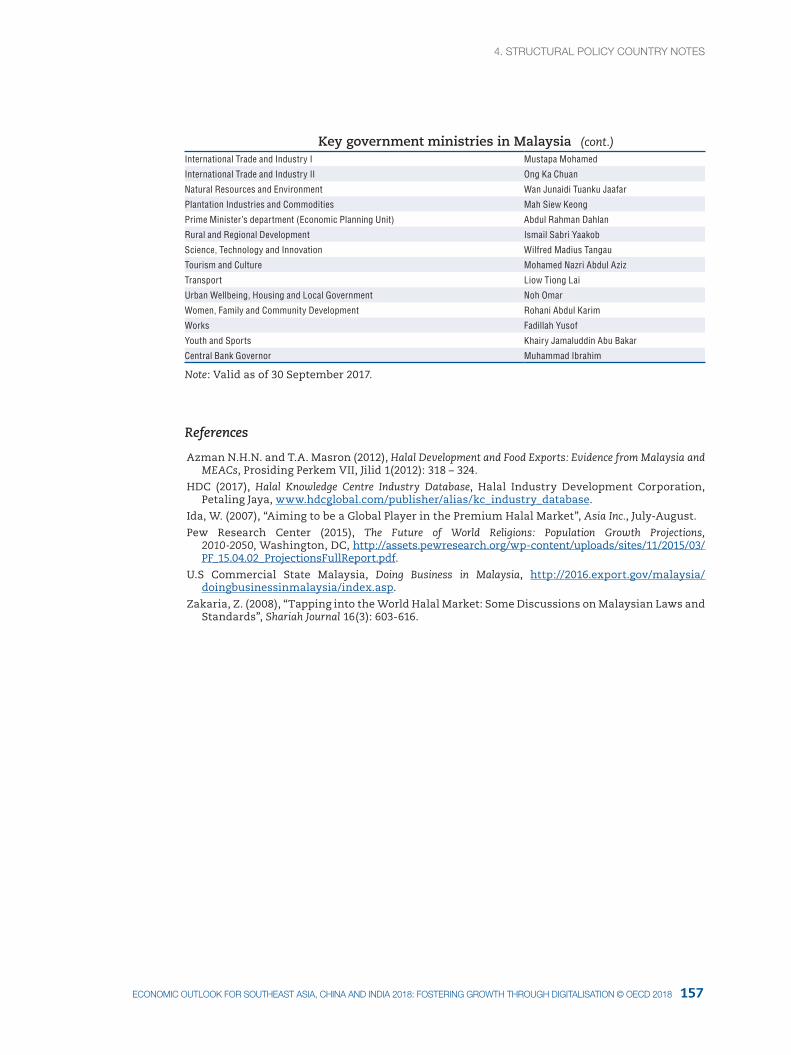
4. StrUctUral pOlIcY cOUNtrY NOteS4. StrUctUral pOlIcY cOUNtrY NOteS
157ecONOMIc OUtlOOK fOr SOUtHeaSt aSIa, cHINa aNd INdIa 2018: fOSterINg grOWtH tHrOUgH dIgItalISatION © Oecd 2018
Key government ministries in MalaysiaInternational Trade and Industry I Mustapa Mohamed
International Trade and Industry II Ong Ka Chuan
Natural Resources and Environment Wan Junaidi Tuanku Jaafar
Plantation Industries and Commodities Mah Siew Keong
Prime Minister’s department (Economic Planning Unit) Abdul Rahman Dahlan
Rural and Regional Development Ismail Sabri Yaakob
Science, Technology and Innovation Wilfred Madius Tangau
Tourism and Culture Mohamed Nazri Abdul Aziz
Transport Liow Tiong Lai
Urban Wellbeing, Housing and Local Government Noh Omar
Women, Family and Community Development Rohani Abdul Karim
Works Fadillah Yusof
Youth and Sports Khairy Jamaluddin Abu Bakar
Central Bank Governor Muhammad Ibrahim
Note: Valid as of 30 September 2017.
References
Azman N.H.N. and T.A. Masron (2012), Halal Development and Food Exports: Evidence from Malaysia and MEACs, Prosiding Perkem VII, Jilid 1(2012): 318 – 324.
HDC (2017), Halal Knowledge Centre Industry Database, Halal Industry Development Corporation, Petaling Jaya, www.hdcglobal.com/publisher/alias/kc_industry_database.
Ida, W. (2007), “Aiming to be a Global Player in the Premium Halal Market”, Asia Inc., July-August.
Pew Research Center (2015), The Future of World Religions: Population Growth Projections, 2010-2050, Washington, DC, http://assets.pewresearch.org/wp-content/uploads/sites/11/2015/03/PF_15.04.02_ProjectionsFullReport.pdf.
U.S Commercial State Malaysia, Doing Business in Malaysia, http://2016.export.gov/malaysia/doingbusinessinmalaysia/index.asp.
Zakaria, Z. (2008), “Tapping into the World Halal Market: Some Discussions on Malaysian Laws and Standards”, Shariah Journal 16(3): 603-616.
(cont.)
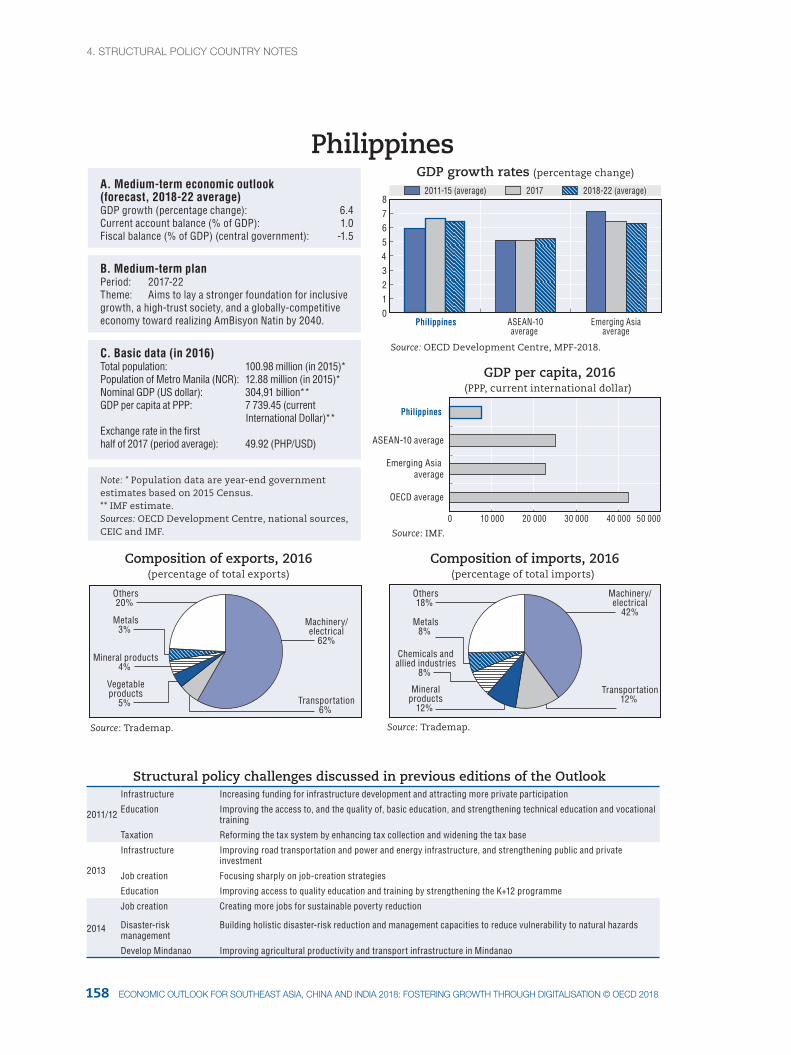
4. StrUctUral pOlIcY cOUNtrY NOteS
159158 ecONOMIc OUtlOOK fOr SOUtHeaSt aSIa, cHINa aNd INdIa 2018: fOSterINg grOWtH tHrOUgH dIgItalISatION © Oecd 2018
0
Machinery/electrical
62%
Vegetableproducts
5%
Mineral products4%
Metals3%
Others20%
Transportation6%
Machinery/electrical
42%
Transportation12%
Mineralproducts
12%
Chemicals andallied industries
8%
Metals8%
Others18%
0
1
2
3
4
5
6
7
8
10 000 20 000 30 000 40 000 50 000
Philippines ASEAN-10average
Emerging Asiaaverage
GDP growth rates (percentage change)
Source: OECD Development Centre, MPF-2018.
Source: IMF.
OECD average
Emerging Asia average
ASEAN-10 average
Philippines
Source: Trademap. Source: Trademap.
Composition of exports, 2016(percentage of total exports)
Composition of imports, 2016(percentage of total imports)
PhilippinesA. Medium-term economic outlook (forecast, 2018-22 average) GDP growth (percentage change): 6.4Current account balance (% of GDP): 1.0Fiscal balance (% of GDP) (central government): -1.5
B. Medium-term planPeriod: 2017-22Theme: Aims to lay a stronger foundation for inclusive growth, a high-trust society, and a globally-competitive economy toward realizing AmBisyon Natin by 2040.
C. Basic data (in 2016) Total population: 100.98 million (in 2015)*Population of Metro Manila (NCR): 12.88 million (in 2015)*Nominal GDP (US dollar): 304,91 billion**GDP per capita at PPP: 7 739.45 (current International Dollar)**Exchange rate in the first half of 2017 (period average): 49.92 (PHP/USD)
Note: * Population data are year-end government estimates based on 2015 Census. ** IMF estimate.Sources: OECD Development Centre, national sources,CEIC and IMF.
A. Medium-term economic outlook (forecast, 2018-22 average) GDP growth (percentage change): 6.4Current account balance (% of GDP): 1.0Fiscal balance (% of GDP) (central government): -1.5
B. Medium-term planPeriod: 2017-22Theme: Aims to lay a stronger foundation for inclusive growth, a high-trust society, and a globally-competitive economy toward realizing AmBisyon Natin by 2040.
C. Basic data (in 2016) Total population: 100.98 million (in 2015)*Population of Metro Manila (NCR): 12.88 million (in 2015)*Nominal GDP (US dollar): 304,91 billion**GDP per capita at PPP: 7 739.45 (current International Dollar)**Exchange rate in the first half of 2017 (period average): 49.92 (PHP/USD)
Note: * Population data are year-end government estimates based on 2015 Census. ** IMF estimate.Sources: OECD Development Centre, national sources,CEIC and IMF.
2011-15 (average) 2017 2018-22 (average)
GDP per capita, 2016(PPP, current international dollar)
Structural policy challenges discussed in previous editions of the Outlook
2011/12
Infrastructure Increasing funding for infrastructure development and attracting more private participation
Education Improving the access to, and the quality of, basic education, and strengthening technical education and vocational training
Taxation Reforming the tax system by enhancing tax collection and widening the tax base
2013
Infrastructure Improving road transportation and power and energy infrastructure, and strengthening public and private investment
Job creation Focusing sharply on job-creation strategies
Education Improving access to quality education and training by strengthening the K+12 programme
2014
Job creation Creating more jobs for sustainable poverty reduction
Disaster-risk management
Building holistic disaster-risk reduction and management capacities to reduce vulnerability to natural hazards
Develop Mindanao Improving agricultural productivity and transport infrastructure in Mindanao
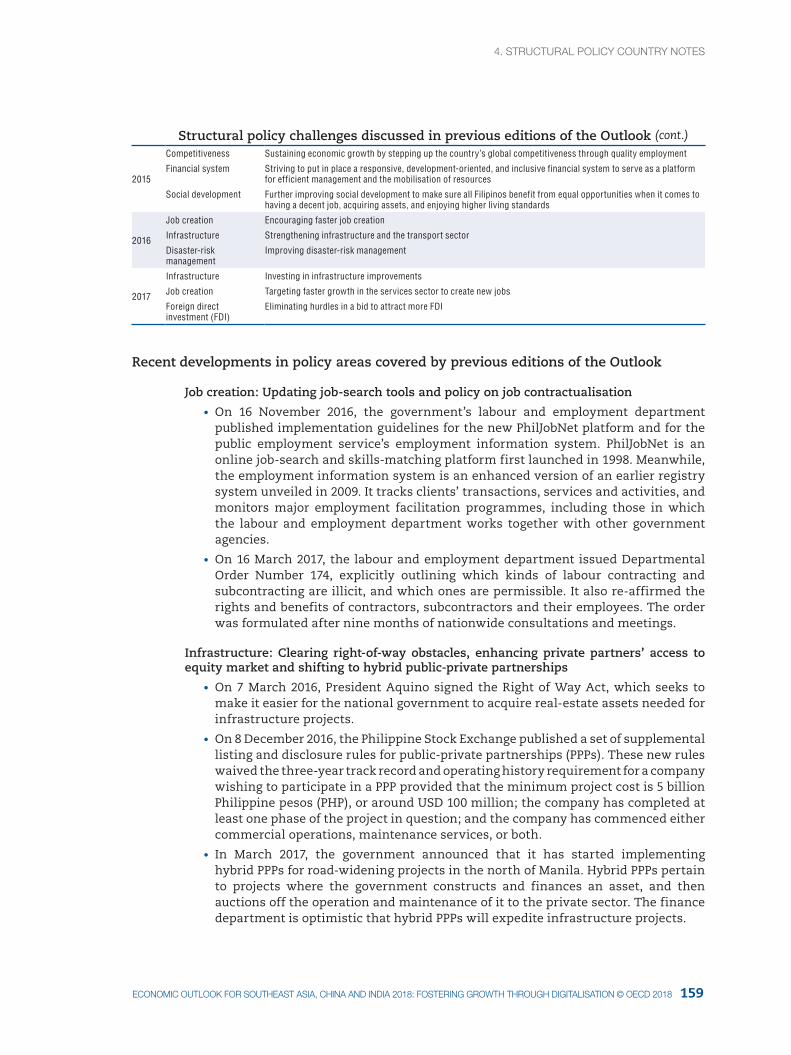
4. StrUctUral pOlIcY cOUNtrY NOteS4. StrUctUral pOlIcY cOUNtrY NOteS
159ecONOMIc OUtlOOK fOr SOUtHeaSt aSIa, cHINa aNd INdIa 2018: fOSterINg grOWtH tHrOUgH dIgItalISatION © Oecd 2018
Structural policy challenges discussed in previous editions of the Outlook
2015
Competitiveness Sustaining economic growth by stepping up the country’s global competitiveness through quality employment
Financial system Striving to put in place a responsive, development-oriented, and inclusive financial system to serve as a platform for efficient management and the mobilisation of resources
Social development Further improving social development to make sure all Filipinos benefit from equal opportunities when it comes to having a decent job, acquiring assets, and enjoying higher living standards
2016
Job creation Encouraging faster job creation
Infrastructure Strengthening infrastructure and the transport sector
Disaster-risk management
Improving disaster-risk management
2017
Infrastructure Investing in infrastructure improvements
Job creation Targeting faster growth in the services sector to create new jobs
Foreign direct investment (FDI)
Eliminating hurdles in a bid to attract more FDI
Recent developments in policy areas covered by previous editions of the Outlook
Job creation: Updating job-search tools and policy on job contractualisation
• On 16 November 2016, the government’s labour and employment department published implementation guidelines for the new PhilJobNet platform and for the public employment service’s employment information system. PhilJobNet is an online job-search and skills-matching platform first launched in 1998. Meanwhile, the employment information system is an enhanced version of an earlier registry system unveiled in 2009. It tracks clients’ transactions, services and activities, and monitors major employment facilitation programmes, including those in which the labour and employment department works together with other government agencies.
• On 16 March 2017, the labour and employment department issued Departmental Order Number 174, explicitly outlining which kinds of labour contracting and subcontracting are illicit, and which ones are permissible. It also re-affirmed the rights and benefits of contractors, subcontractors and their employees. The order was formulated after nine months of nationwide consultations and meetings.
Infrastructure: Clearing right-of-way obstacles, enhancing private partners’ access to equity market and shifting to hybrid public-private partnerships
• On 7 March 2016, President Aquino signed the Right of Way Act, which seeks to make it easier for the national government to acquire real-estate assets needed for infrastructure projects.
• On 8 December 2016, the Philippine Stock Exchange published a set of supplemental listing and disclosure rules for public-private partnerships (PPPs). These new rules waived the three-year track record and operating history requirement for a company wishing to participate in a PPP provided that the minimum project cost is 5 billion Philippine pesos (PHP), or around USD 100 million; the company has completed at least one phase of the project in question; and the company has commenced either commercial operations, maintenance services, or both.
• In March 2017, the government announced that it has started implementing hybrid PPPs for road-widening projects in the north of Manila. Hybrid PPPs pertain to projects where the government constructs and finances an asset, and then auctions off the operation and maintenance of it to the private sector. The finance department is optimistic that hybrid PPPs will expedite infrastructure projects.
(cont.)
4. StrUctUral pOlIcY cOUNtrY NOteS
161160 ecONOMIc OUtlOOK fOr SOUtHeaSt aSIa, cHINa aNd INdIa 2018: fOSterINg grOWtH tHrOUgH dIgItalISatION © Oecd 2018
Disaster-risk management: Continuing work on disaster science
• On 23 February 2017, five days before its scheduled termination, the University of the Philippines decided to take over the Nationwide Operational Assessment of Hazards (Project NOAH). The initiative was set up in 2012 under the aegis of the science and technology department. Its purpose is to undertake disaster-science research using up-to-date technologies, and to provide information to assist the science and technology department and other government agencies with their efforts to prevent and mitigate disasters.
Competitiveness: Extending the life of competitiveness enhancement fund
• On 23 May 2016, President Aquino signed a law extending the implementation period of Agricultural Competitiveness Enhancement Fund (ACEF) to 2022. ACEF, which was first instituted in 1996, consists of all duties collected from the importation of agricultural products under the minimum access volume mechanism and earmarked for initiatives to increase the productivity of farmers and fishermen such as support in terms of access to credit, machinery and research.
Financial system: Widening SMEs’ access to finance and encouraging foreign investment
• On 6 February 2016, the legislative bill that creates and organises Credit Surety Fund lapsed into law. Its purpose is to provide access to bank credit to micro, small and medium-sized enterprises, cooperatives and non-governmental organisations, to enhance their sustainability and growth.
• On 2 June 2016, President Aquino’s executive order number 208 formalised the status of the Financial Inclusion Steering Committee. It has a mandate to provide strategic direction and guidance and to oversee the country’s national strategy for financial inclusion.
• On 17 July 2016, a bill that fully opens up lending and financing companies, investment houses, and insurance-claim adjustment companies to foreign investors lapsed into law. The law essentially abrogates the requirement that Filipino investors should hold at least 60% of the capital stock of adjustment companies, 51% of lending companies and 40% of financing companies and investment houses.
Develop Mindanao: Promoting investment, trade and business
• At the conclusion of the country’s 42nd Philippine Business Conference on 12 October 2016, the Mindanao Development Authority and the Philippine Chamber of Commerce agreed to promote investments in Mindanao. The agreement also seeks to facilitate trade, and to enhance the business environment in the area.
Education: Waiving tuition in public tertiary institutions and vocational schools• On 3 August 2017, President Duterte signed a law which waives tertiary education
tuition and other scholastic fees in public universities, public colleges and state-run technical-vocational institutions. It also established a tertiary education subsidy and student loan programme.
Taxation: Implementing tax reform
• On 31 May 2017, the House of Representatives passed a bill containing the first phase of a comprehensive package of tax reforms. The approved Tax Reform for Acceleration and Inclusion bill seeks to lower personal income tax rates, raise excise tax for fuel and automobiles and reform the excise-tax system, impose excise tax on sweetened beverages, broaden the base for value-added tax and remove the tax exemption on state lottery winnings. The Department of Finance
4. StrUctUral pOlIcY cOUNtrY NOteS4. StrUctUral pOlIcY cOUNtrY NOteS
161ecONOMIc OUtlOOK fOr SOUtHeaSt aSIa, cHINa aNd INdIa 2018: fOSterINg grOWtH tHrOUgH dIgItalISatION © Oecd 2018
(2017) estimates that the measure will yield revenue amounting to 0.9% of GDP in 2018 which the President mainly intends to channel to infrastructure projects. The Senate is expected to pass its own version of the bill before the end of 2017.
Foreign direct investment: Addressing foreign restrictions in public services
• In March 2017, the Philippine Competition Commission, completed its first national review of competition policy. The agency, which was created in February 2016 by a competition law passed the previous year, submitted legislative recommendations that were incorporated into the 2017-22 national development plan. These include an easing of restrictions on foreign participation in certain economic activities covered by the Public Service Act, notably telecommunications and transportation, amendments to the country’s negative list for foreign investment and a law setting up a central body to make investment regulations more competitive and coherent.
POLICY FOCUS
Optimising infrastructure financing
The Philippine Development Plan (PDP) 2017-22, which was launched in February 2017, is candid about the inadequacy of infrastructure in the Philippines, notably in the areas of transport, telecommunications, energy, health, education, water supply and sanitation. Moreover, the quality of the country’s infrastructure continues to fare poorly compared to its neighbours.1 Government initiatives have made some headway in addressing the infrastructure gap over the past six years or so. However, meeting the demand for infrastructure in the Philippines, in line with the average annual economic growth rate of 7% that the government is targeting from 2017 to 2022, will require considerable capital, and a more efficient utilisation of the available financial resources.
Based on estimates of the Asian Development Bank (ADB, 2017), between 2016 and 2030 Southeast Asia will need to raise between USD 2.76 billion and USD 3.15 billion, or between 5% and 5.7% of gross domestic product (GDP), to meet domestic demand for infrastructure in four key areas alone. These are power, water and sanitation, transport and telecommunications. Assuming that these regional projections hold true for the Philippines, and based on 2015 prices, the government would need raising between PHP 17.2 trillion and PHP 19.6 trillion from 2017 to 2030, or around USD 340.7 billion to USD 391.8 billion. In terms of current prices, this would rise to between PHP 23.7 trillion and PHP 27.0 trillion, or around USD 473.6 billion to USD 540.0 billion.2
The government is keen to raise spending, but public funds are inadequate
This kind of infrastructure spending may be a tall order for the Philippine government at this point. Government revenue collection has been a little less than 15% of GDP on average from 2011 to 2016. Moreover, capital markets are not deep in the Philippines. Nonetheless, the country’s current administration is keen on narrowing the infrastructure gap through reforms in fiscal policy, partnership with the private sector and official development assistance. In 2016, official data put public infrastructure spending at 5.1% of GDP. This represents a marked improvement from 2.7% on average between 2011 and 2015 based on budget data. The government targets raising the ratio to 7% in the coming years.
Interestingly, the infrastructure item in the budget contains a few nuances (Figure 4.3.1). Official aggregate spending data on public infrastructure encompasses the capital outlays of all public institutions, including items like land improvements,
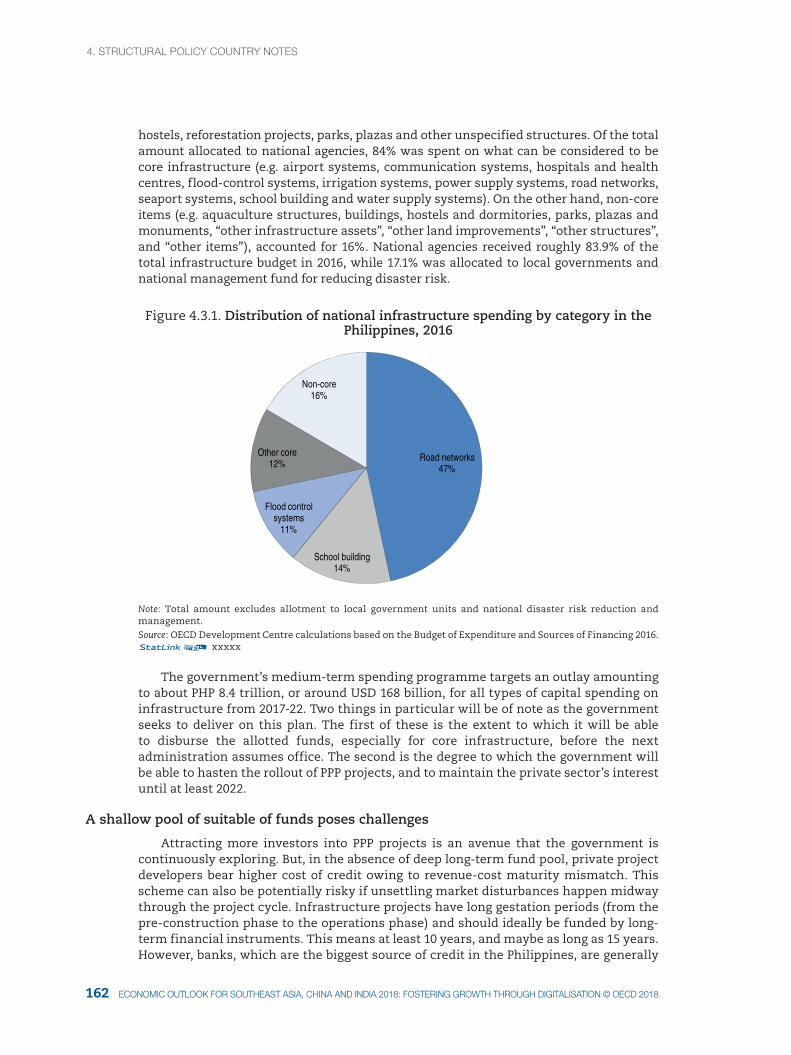
4. StrUctUral pOlIcY cOUNtrY NOteS
163162 ecONOMIc OUtlOOK fOr SOUtHeaSt aSIa, cHINa aNd INdIa 2018: fOSterINg grOWtH tHrOUgH dIgItalISatION © Oecd 2018
hostels, reforestation projects, parks, plazas and other unspecified structures. Of the total amount allocated to national agencies, 84% was spent on what can be considered to be core infrastructure (e.g. airport systems, communication systems, hospitals and health centres, flood-control systems, irrigation systems, power supply systems, road networks, seaport systems, school building and water supply systems). On the other hand, non-core items (e.g. aquaculture structures, buildings, hostels and dormitories, parks, plazas and monuments, “other infrastructure assets”, “other land improvements”, “other structures”, and “other items”), accounted for 16%. National agencies received roughly 83.9% of the total infrastructure budget in 2016, while 17.1% was allocated to local governments and national management fund for reducing disaster risk.
Figure 4.3.1. Distribution of national infrastructure spending by category in the Philippines, 2016
Road networks47%
School building14%
Flood control systems
11%
Other core12%
Non-core16%
Note: Total amount excludes allotment to local government units and national disaster risk reduction and management.Source: OECD Development Centre calculations based on the Budget of Expenditure and Sources of Financing 2016.12 xxxxx
The government’s medium-term spending programme targets an outlay amounting to about PHP 8.4 trillion, or around USD 168 billion, for all types of capital spending on infrastructure from 2017-22. Two things in particular will be of note as the government seeks to deliver on this plan. The first of these is the extent to which it will be able to disburse the allotted funds, especially for core infrastructure, before the next administration assumes office. The second is the degree to which the government will be able to hasten the rollout of PPP projects, and to maintain the private sector’s interest until at least 2022.
A shallow pool of suitable of funds poses challenges
Attracting more investors into PPP projects is an avenue that the government is continuously exploring. But, in the absence of deep long-term fund pool, private project developers bear higher cost of credit owing to revenue-cost maturity mismatch. This scheme can also be potentially risky if unsettling market disturbances happen midway through the project cycle. Infrastructure projects have long gestation periods (from the pre-construction phase to the operations phase) and should ideally be funded by long-term financial instruments. This means at least 10 years, and maybe as long as 15 years. However, banks, which are the biggest source of credit in the Philippines, are generally
4. StrUctUral pOlIcY cOUNtrY NOteS4. StrUctUral pOlIcY cOUNtrY NOteS
163ecONOMIc OUtlOOK fOr SOUtHeaSt aSIa, cHINa aNd INdIa 2018: fOSterINg grOWtH tHrOUgH dIgItalISatION © Oecd 2018
unable to provide long-term instruments in bulk, mainly because their resources consist mostly of demand deposits.
In this context, it is encouraging that the country’s central bank continues to play an active and catalytic role in boosting infrastructure financing. For instance, in December 2010 the central bank, Bangko Sentral ng Pilipinas (BSP), in a bid to boost the investor-appeal of PPP projects, issued circular number 700, allowing banks to account for PPP projects separately with respect to the statutory single borrower limit of 25% of the net worth of the lending bank or quasi-bank. In June 2016, the BSP issued another circular, number 914, which increased the ceiling of bank lending to related parties involved in PPP projects. It did so both in terms of the individual lending limit, which it raised from 10% to 25% of the net worth of the lending bank, and also in terms of the unsecured component of the loan, which it increased from 5% to 12.5%. The definitions of related interest, of subsidiary, and of affiliate, were also loosened. Moreover, a recently-implemented full liberalisation of the banking sector, coupled with an ongoing process of consolidation, might also help in significantly increasing the amount of funds available for loans, and also the efficiency of the way they flow. However, the banking sector can only cover part of the infrastructure financing that the country needs.
The bond market provides an alternative source of financing. However, based on data from AsianBondsOnline, the total outstanding value of local-currency bonds in the Philippines was only about 33.7% of GDP as of December 2016. Even by regional standards, this ratio is small. By comparison, Thailand’s bond market is roughly 75.6% of GDP, while that of Malaysia equates to about 95% of GDP. The bond market in the Philippines also heavily favours government debt, which accounts for 81.7% of the total, over private debt, which makes up just 18.3%. Meanwhile, bonds with an original maturity of over ten years make up just about a third of the bond market’s total value, representing roughly 11.4% of GDP in 2016. Around 98.9% of these long-term bonds are issued by the government, and only 1.1% of them are private. Although there have been initiatives to create a market for specific infrastructure bonds, or a special class of project bonds, such a market has not picked up significantly in the Philippines (ADB, 2016). Meanwhile, capital raised from the equity markets through initial public offerings, follow-up offers, and other placements, has equated on average to less than PHP 200 billion per year over the past five years based on the annual reports of the Philippine Stock Exchange. This amounts to only about 1.38 % of 2016 GDP. This figure is for all listed companies, and for all types of corporate use.
Inefficiency in spending raises the cost of infrastructure in many ways
An inefficient utilisation of funding continues to prevail in terms of targeting, the approval cycle and output quality. This is the case when it comes to projects that are funded entirely from the public purse especially at the subnational level. The imperfect integrity of the way the country’s institutions operate underscores these shortcomings. For instance, if contractors only get to spend 40% to 70% on projects that should have received 90% of the total bid cost (assuming a 10% profit margin), the resulting outputs are most likely to be sub-standard, either in terms of their lifespan, or of their scale.
Inefficient spending has also tended to occur as a result of a number of other factors. These include delays in project implementation and procurement, changes in the rules of the game midway through a project (usually due to leadership changes in the relevant government departments), and also lawsuits. Moreover, unpredictable decisions, such as the removal from the PPP pipeline of projects that had been there for a while, can also undermine the government’s credibility in its efforts to get the private sector more
4. StrUctUral pOlIcY cOUNtrY NOteS
165164 ecONOMIc OUtlOOK fOr SOUtHeaSt aSIa, cHINa aNd INdIa 2018: fOSterINg grOWtH tHrOUgH dIgItalISatION © Oecd 2018
involved in infrastructure development. Bureaucratic issues aside, this also stems from limited number of technically capable personnel in some of the agencies involved.
All these factors increase the financing cost for infrastructure projects. A general decline in overall corruption in the Philippines over the past 10 years, as evidenced by data from Transparency International on the perception of corruption, bodes well for the country in this respect. Furthermore, undertakings that enhance the technical capability of personnel in the agencies that implement infrastructure projects are also playing an important role. Nevertheless, there is still much work to do in tackling the above-mentioned sources of inefficiencies.
Pushing through with procurement reforms and strengthening the PPP Center
In the short run, the public sector will continue to shoulder most of the burden in terms of infrastructure spending. Thus, it is imperative to improve the quality of how the government spends money on such projects, which means greater discipline in the prioritisation of projects, a more streamlined project cycle, and also a rigorous insistence upon post-construction audit. Adoption of some measures which intend to hasten project-approval proceedings should be a boon to the investment climate (NEDA, 2016). These include lowering the economic hurdle rate – the rate of return expected – from 15% to 10%; raising the threshold for investments that must undergo a review by the Investment Coordination Committee (ICC) from PHP 1 billion, or around USD 20 million, to PHP 5 billion, or around USD 100 million; and streamlining the ICC’s approval system, as well as the composition of both the ICC and the board of the National Economic and Development Authority. Adjustments to the existing procurement law to reduce disbursement bottlenecks, and to strengthen the post-construction audit mechanism, would also help.
Furthermore, the government should continue to strengthen the PPP Center (PPPC), both in terms of its resources and its mandate. The high regard for the PPPC, which has won international recognition for the system that it has set up to bring in private partners, endows the PPP programme in the Philippines with a certain degree of promise. The PPPC also has the scope to be a focal point for improving the technical capability of the other agencies involved in implementing infrastructure projects. Another of the PPPC’s initiatives that has won praise is the creation of the project development and monitoring facility in 2011. This unit is a financing facility focusing on the sort of pre-investment activities that can pave the way to PPP projects and ensure their quality (PPPC, 2011). A number of other systems that support the PPPC have also been well received. These include the strategic support fund for the acquisition of rights of way; the viability-gap funding, which helps to make borderline projects commercially viable; and the risk-management programme, which includes payment in the event of a government default. Aside from the successes of the PPPC, the passage of the Right of Way Act in March 2016, and the reinstitution of a three-year rolling infrastructure programme that makes sure priority projects get the appropriate allocation in the budget, have also been welcome developments.
Considering alternative financing schemes and developing capital markets
Beyond the traditional tools it can use to raise revenue, the government could also consider levies that capture the appreciation in land value that results from the infrastructure built in the area. Another measure worth considering would be the
4. StrUctUral pOlIcY cOUNtrY NOteS4. StrUctUral pOlIcY cOUNtrY NOteS
165ecONOMIc OUtlOOK fOr SOUtHeaSt aSIa, cHINa aNd INdIa 2018: fOSterINg grOWtH tHrOUgH dIgItalISatION © Oecd 2018
specific allocation of infrastructure user fees to pay for maintenance costs. In addition, the government should evaluate the possibility of becoming a party in funded cross-currency swap agreements with multilateral development institutions (MDIs), or highly-rated private financial enterprises (PFEs), to finance infrastructure.
Cross-currency swaps can give local private-sector companies access to local-currency financing from MDIs or PFEs at a lower rate, possibly over a longer period, and without having to bear the exchange-rate risk. Essentially, in such a framework, MDIs and PFEs can raise capital from the international market (making use of their good credit ratings), and exchange the hard currency they obtain with local currency from the central bank. The central bank does not need to print new money, since it can make use of the statutory local currency reserves that commercial banks are required to keep in their central bank accounts. The International Financial Corporation, for example, has been lending in long-term local currency since 1997, by utilising swaps (IFC, 2015). The Philippine government has expressed interest in a swap agreement with the Asian Development Bank at least twice before, in 2004 and 2011. However, the plan did not push through on both occasions.
Over the medium to long-term, it would be prudent for the government to follow up on its capital-market development plan for 2013-17. Incidentally, capital market development issues are not discussed in detail in the Philippine Development Plan 2017-22, and delivery of progress reports on the capital-market development plan seems, according to information on the website of the Securities and Exchange Commission, to have ceased in December 2014. Although the central bank helps harness more bank resources for this purpose through its regulations (as mentioned earlier), traditional bank loans will not considerably close the funding gap unless domestic loan syndication activity gains traction. Domestic bond and equity markets in the Philippines need at least to catch up in terms of depth with the country’s regional peers.
The signing of the law that relaxes foreign ownership in financial enterprises in July 2016, sends a positive market signal in this respect. The creation of the Philippine Investment Alliance for Infrastructure, a 10-year closed-end fund set up in 2012, which involved one of the state pension funds, is another promising initiative that the government can build on. The recently-revived possibility of a merger between the Philippine Stock Exchange (PSE) and the Philippine Dealing System (PDS) could potentially lead to some beneficial synergies in the capital market. Notably, the initiatives on the part of one of these two systems to attract more investors may have positive spillover effects on the other. Multilateral undertakings, such as the Asian Bond Market Initiative and the Asian Bond Fund, are also helpful in this regard. Along these lines, the government should consider collaborating with the PSE and PDS in opening satellite offices that would cater to potential capital-market investors in areas outside the Manila area. Such an approach would be superior to relying on occasional regional roadshows and seminars. At the moment, the points of engagement for investors in bonds and equities are selected domestic bank branches and online trading platforms. The presence of PSE and PDS in provinces outside Manila would bring information closer to those who require it. Moreover, BSP has some room to enhance its programmes on financial literacy. For instance, according to the Standard & Poor’s Ratings Services Global Financial Literacy Survey for 2015 Filipinos are relatively less informed about financial-market matters than their neighbours in Indonesia, Malaysia, Singapore and Thailand.
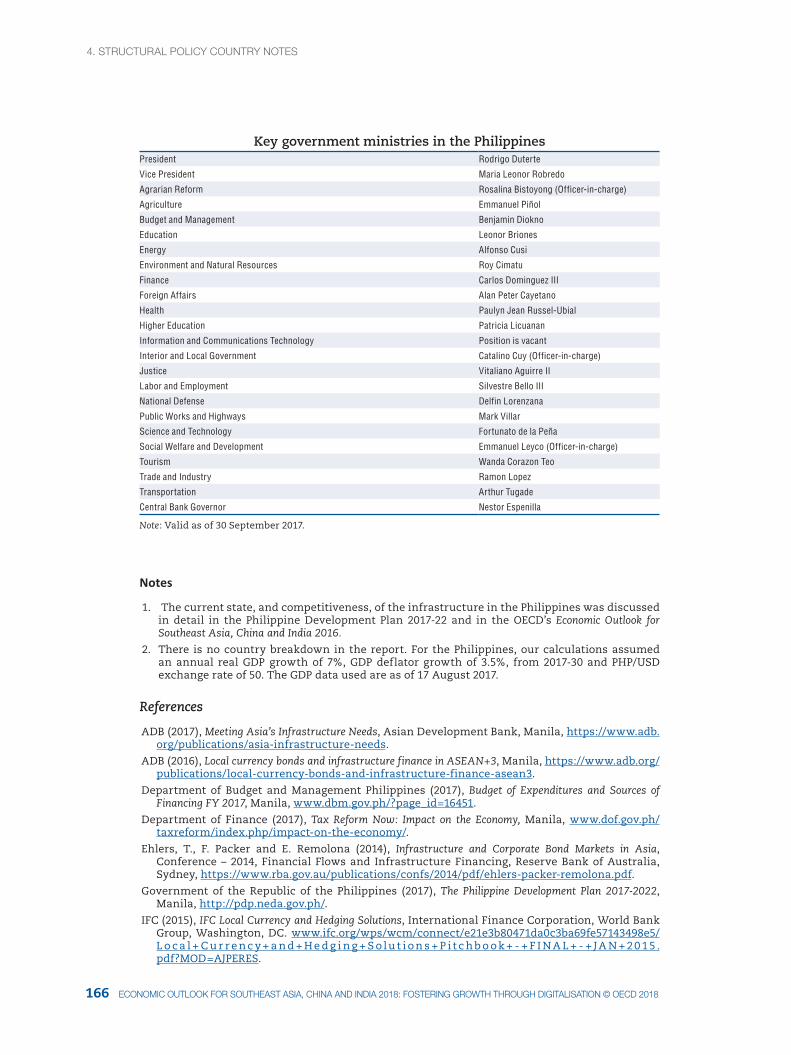
4. StrUctUral pOlIcY cOUNtrY NOteS
167166 ecONOMIc OUtlOOK fOr SOUtHeaSt aSIa, cHINa aNd INdIa 2018: fOSterINg grOWtH tHrOUgH dIgItalISatION © Oecd 2018
Key government ministries in the PhilippinesPresident Rodrigo Duterte
Vice President Maria Leonor Robredo
Agrarian Reform Rosalina Bistoyong (Officer-in-charge)
Agriculture Emmanuel Piñol
Budget and Management Benjamin Diokno
Education Leonor Briones
Energy Alfonso Cusi
Environment and Natural Resources Roy Cimatu
Finance Carlos Dominguez III
Foreign Affairs Alan Peter Cayetano
Health Paulyn Jean Russel-Ubial
Higher Education Patricia Licuanan
Information and Communications Technology Position is vacant
Interior and Local Government Catalino Cuy (Officer-in-charge)
Justice Vitaliano Aguirre II
Labor and Employment Silvestre Bello III
National Defense Delfin Lorenzana
Public Works and Highways Mark Villar
Science and Technology Fortunato de la Peña
Social Welfare and Development Emmanuel Leyco (Officer-in-charge)
Tourism Wanda Corazon Teo
Trade and Industry Ramon Lopez
Transportation Arthur Tugade
Central Bank Governor Nestor Espenilla
Note: Valid as of 30 September 2017.
Notes
1. The current state, and competitiveness, of the infrastructure in the Philippines was discussed in detail in the Philippine Development Plan 2017-22 and in the OECD’s Economic Outlook for Southeast Asia, China and India 2016.
2. There is no country breakdown in the report. For the Philippines, our calculations assumed an annual real GDP growth of 7%, GDP deflator growth of 3.5%, from 2017-30 and PHP/USD exchange rate of 50. The GDP data used are as of 17 August 2017.
References
ADB (2017), Meeting Asia’s Infrastructure Needs, Asian Development Bank, Manila, https://www.adb.org/publications/asia-infrastructure-needs.
ADB (2016), Local currency bonds and infrastructure finance in ASEAN+3, Manila, https://www.adb.org/publications/local-currency-bonds-and-infrastructure-finance-asean3.
Department of Budget and Management Philippines (2017), Budget of Expenditures and Sources of Financing FY 2017, Manila, www.dbm.gov.ph/?page_id=16451.
Department of Finance (2017), Tax Reform Now: Impact on the Economy, Manila, www.dof.gov.ph/taxreform/index.php/impact-on-the-economy/.
Ehlers, T., F. Packer and E. Remolona (2014), Infrastructure and Corporate Bond Markets in Asia, Conference – 2014, Financial Flows and Infrastructure Financing, Reserve Bank of Australia, Sydney, https://www.rba.gov.au/publications/confs/2014/pdf/ehlers-packer-remolona.pdf.
Government of the Republic of the Philippines (2017), The Philippine Development Plan 2017-2022, Manila, http://pdp.neda.gov.ph/.
IFC (2015), IFC Local Currency and Hedging Solutions, International Finance Corporation, World Bank Group, Washington, DC. www.ifc.org/wps/wcm/connect/e21e3b80471da0c3ba69fe57143498e5/L o c a l + C u r r e n c y + a n d + H e d g i n g + S o l ut i o n s + P i t c h b o o k + - + F I N A L + - + J A N + 2 0 1 5 .pdf?MOD=AJPERES.
4. StrUctUral pOlIcY cOUNtrY NOteS4. StrUctUral pOlIcY cOUNtrY NOteS
167ecONOMIc OUtlOOK fOr SOUtHeaSt aSIa, cHINa aNd INdIa 2018: fOSterINg grOWtH tHrOUgH dIgItalISatION © Oecd 2018
Klapper, L., A. Lusardi and P. van Oudheusden (2015), Financial Literacy Around the World: Insights from the Standard and Poor’s Ratings Services Global Financial Literacy Survey, Global Financial Literacy Excellence Center – The George Washington University School of Business, Washington, DC, http://gflec.org/wp-content/uploads/2015/11/Finlit_paper_16_F2_singles.pdf.
National Economic and Development Authority (NEDA) (2016), NEDA Board approves nine projects in first meeting: Changes in the Investment Coordination Committee (ICC) review policies also green-lighted, Manila, www.neda.gov.ph/2016/09/15/neda-board-approves-nine-projects-in-first-meeting-changes-in-the-investment-coordination-committee-icc-review-policies-also-green-lighted/.
OECD (2017), Economic Outlook for Southeast Asia, China and India 2017: Addressing Energy Challenges, OECD Publishing, Paris, http://dx.doi.org/10.1787/saeo-2017-en.
Philippine Stock Exchange (various years), Annual Reports, Manila, http://pse.com.ph/investorRelations/financial-reports.html.
PPPC (2011), Project Development and Monitoring Facility Guidelines, Public Private Partnership Center, Manila, https://ppp.gov.ph/wp-content/uploads/2013/07/PDMF-Guidelines-June-2013.pdf.
Securities and Exchange Commission (2013), Capital Market Development Plan (CMDP) Blueprint 2013-2017, Manila, www.sec.gov.ph/about/plans-and-programs/capital-market-development-plan/.
Transparency International (various years), Corruption Perceptions Index, https://www.transparency.org/research/cpi/overview.
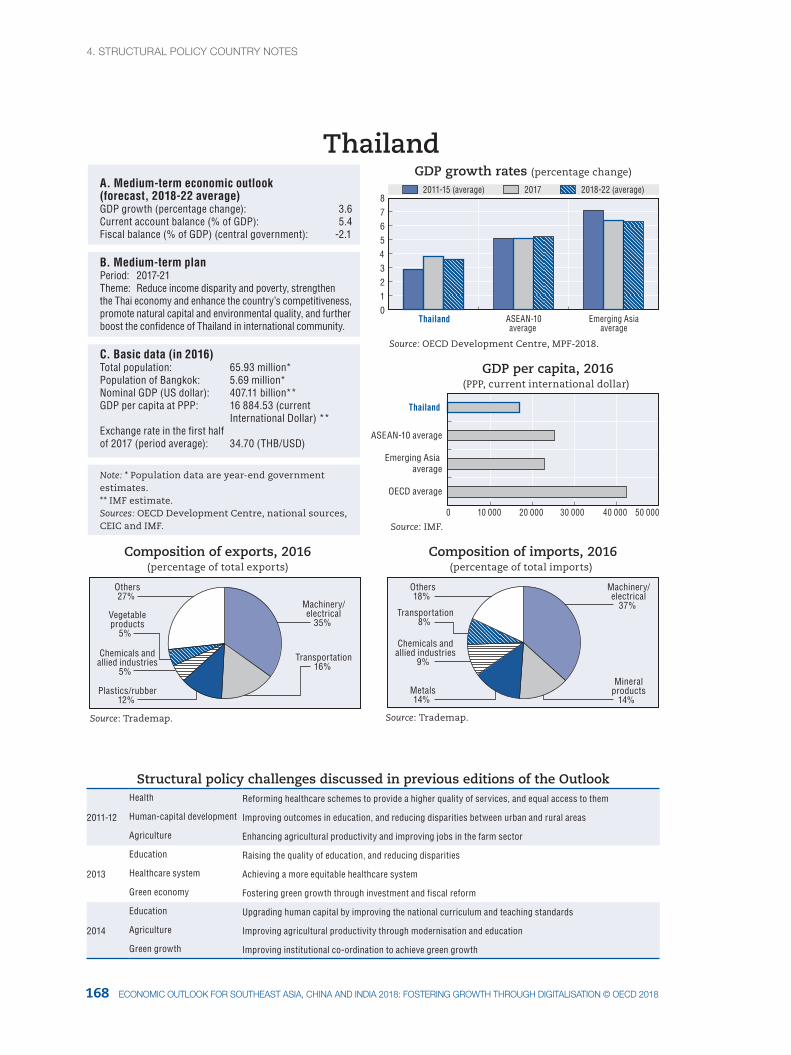
4. StrUctUral pOlIcY cOUNtrY NOteS
169168 ecONOMIc OUtlOOK fOr SOUtHeaSt aSIa, cHINa aNd INdIa 2018: fOSterINg grOWtH tHrOUgH dIgItalISatION © Oecd 2018
Thailand
0 10 000 20 000 30 000 40 000 50 000
Machinery/electrical
35%
Transportation16%
Plastics/rubber12%
Chemicals andallied industries
5%
Vegetableproducts
5%
Others27%
Machinery/electrical
37%
Mineralproducts
14% Metals14%
Chemicals andallied industries
9%
Transportation8%
Others18%
0
1
2
3
4
5
6
7
8
Thailand ASEAN-10average
Emerging Asiaaverage
Source: IMF.
OECD average
Emerging Asia average
ASEAN-10 average
Thailand
Source: Trademap. Source: Trademap.
Composition of exports, 2016(percentage of total exports)
Composition of imports, 2016(percentage of total imports)
A. Medium-term economic outlook (forecast, 2018-22 average) GDP growth (percentage change): 3.6Current account balance (% of GDP): 5.4Fiscal balance (% of GDP) (central government): -2.1
B. Medium-term planPeriod: 2017-21Theme: Reduce income disparity and poverty, strengthen the Thai economy and enhance the country’s competitiveness, promote natural capital and environmental quality, and further boost the confidence of Thailand in international community.
C. Basic data (in 2016) Total population: 65.93 million*Population of Bangkok: 5.69 million*Nominal GDP (US dollar): 407.11 billion**GDP per capita at PPP: 16 884.53 (current International Dollar) **Exchange rate in the first half of 2017 (period average): 34.70 (THB/USD)
Note: * Population data are year-end government estimates. ** IMF estimate.Sources: OECD Development Centre, national sources, CEIC and IMF.
Source: OECD Development Centre, MPF-2018.
2011-15 (average) 2017 2018-22 (average)
GDP growth rates (percentage change)
GDP per capita, 2016(PPP, current international dollar)
Structural policy challenges discussed in previous editions of the Outlook
2011-12
Health Reforming healthcare schemes to provide a higher quality of services, and equal access to them
Human-capital development Improving outcomes in education, and reducing disparities between urban and rural areas
Agriculture Enhancing agricultural productivity and improving jobs in the farm sector
2013
Education Raising the quality of education, and reducing disparities
Healthcare system Achieving a more equitable healthcare system
Green economy Fostering green growth through investment and fiscal reform
2014
Education Upgrading human capital by improving the national curriculum and teaching standards
Agriculture Improving agricultural productivity through modernisation and education
Green growth Improving institutional co-ordination to achieve green growth
4. StrUctUral pOlIcY cOUNtrY NOteS4. StrUctUral pOlIcY cOUNtrY NOteS
169ecONOMIc OUtlOOK fOr SOUtHeaSt aSIa, cHINa aNd INdIa 2018: fOSterINg grOWtH tHrOUgH dIgItalISatION © Oecd 2018
Structural policy challenges discussed in previous editions of the Outlook
2015
Productivity Accelerating improvements in productivity to ensure sustainable economic growth and enhance competitiveness
Environment Making further efforts in environmental management in order to support green growth
Governance Deepening good governance, with a particular emphasis on corruption and transparency, to reduce obstacles to growth
2016
Macro-economic performance
Using macro-economic policies to revive growth
Tourism Strengthening sustainable tourism
2017Digital economy Developing the digital economy as a new engine of growth
Human capital Developing human capital through education to make the most of the country’s economic potential
Recent developments in policy areas covered by previous editions of the Outlook
Constitutional law: Fixing development goals for the next 20 years
• On 6 April 2017, Thailand enacted its 20th constitution. The new constitution stipulates two tasks: the development of a long-term national strategy and the reform of the nation as envisioned in the strategy. Accordingly, a 20-year national strategy has been prepared for 2017-36. It sets out a strategic framework to ensure continuity while the government implements a sequence of five-year national plans for economic and social development.
• The bill introducing this long-term plan was approved later in April 2017. It set out a vision of Thailand as a “developed nation with stability, prosperity and sustainability”. The plan consists of six areas, six primary strategies, and four supporting strategies. The six primary strategies are framed around the six areas, which are: security, competitiveness, human-resource development, social equality, green growth, and a sixth strategy spanning both economic rebalancing and public-sector development. The four supporting strategies, which target an effective national development, consist of infrastructural development, research and innovation, international co-operation, and the development of urban, regional and economic zones.
• Thailand entered into its 12th Development Plan (2017-21) which is also the first implementation period of the 20-year national strategy. This Plan set strategies to reduce disparities and enhance competitiveness while keeping social development at the heart of the progresses.
• In accordance with the national strategy, Thailand 4.0 was launched to transform the country from a manufacturing-based economy into a more innovation-led, technology-driven economy.
Health: Moving towards a more equitable and sustainable healthcare system
• For the fiscal year of 2017, Thailand’s integrated development programme for the health insurance system received a budget allocation of 200 billion Thai baht (THB). The programme’s goal is to increase the quality of health insurance, reducing disparities in service quality between different parts of the system, and integrating the management of the three insurance schemes. These comprise a medical-benefits scheme for civil servants, a social-security scheme and a universal-coverage scheme.
• Technology often plays an important role in coping with an ageing population. The government is implementing a number of pilot projects to monitor the health of
(cont.)
4. StrUctUral pOlIcY cOUNtrY NOteS
171170 ecONOMIc OUtlOOK fOr SOUtHeaSt aSIa, cHINa aNd INdIa 2018: fOSterINg grOWtH tHrOUgH dIgItalISatION © Oecd 2018
elderly patients using smart devices and sensors in residential accommodation. In addition to continual monitoring, data are also collected for analysis and proper treatment in case of emergencies. In January 2016, one such project, targeting over 150 houses, started up in Saensuk, in the province of Chon Buri. More than 10% of Saensuk’s population is of retirement age. These projects should help medical personnel, such as nurses, to promptly respond to patients’ needs, and to determine the cause of any abrupt fall or death.
Education: Improving quality
• For the fiscal year of 2017, Thailand’s programme of integrated improvements in education and life-long learning received a budget allocation of THB 8 billion. The programme seeks to improve the quality of education so that it can keep pace with the country’s development. One example of this is making sure that the overall education system matches up with the STEM (Science, Technology, Engineering and Mathematics) education programme. Programmes of dual vocational training, where students work and study in parallel, and distance-learning programmes, will also receive support.
• The education ministry has launched a 20-year strategic plan for 2017-36, setting out a clear direction of long-term development for education policies. The plan, which aligns with Thailand’s 20-year national strategy, targets short-term goals such as improving students’ performance, as well as long-term goals, such as decreasing educational inequality between urban and rural areas. Officials are also formulating a plan, which they expect to deliver before the fourth quarter of 2017, for the provinces near Thailand’s southern border, which have a distinctive culture.
Agriculture: Boosting competitiveness and organic agriculture
• For the fiscal year of 2017, the government budget allocated THB 32 billion to support reforms in the agriculture sector that seek to increase efficiency and develop the capacity of farmers. An example of these measures has been the development of an “Agri Map” that helps farmers to identify the crops that are most suitable for their farmland. Another example is the establishment of learning centres, whose goal is to increase the efficiency of production. The centres place particular emphasis on following international standards, so that farmers may become more competitive in the world market.
• In April 2017, the cabinet approved a national strategy for the development of organic agriculture for 2017-21. It consists of promoting research and innovation, spreading knowledge more widely, and developing organic products and services. The strategy also targets an extension of organic farm areas by 530 000 acres, and over 96 000 more organic farmers, by 2021.
POLICY FOCUS
Strengthening information and communications technology (ICT) skills to develop the digital economy
Initiatives to promote the digital economy
The country has a vision of transforming itself into a “Digital Thailand”, or “Thailand 4.0”. Indeed, Thailand’s approach is to maximise the use of digital technologies in all socio-economic activities. In so doing, the country seeks to develop infrastructure,
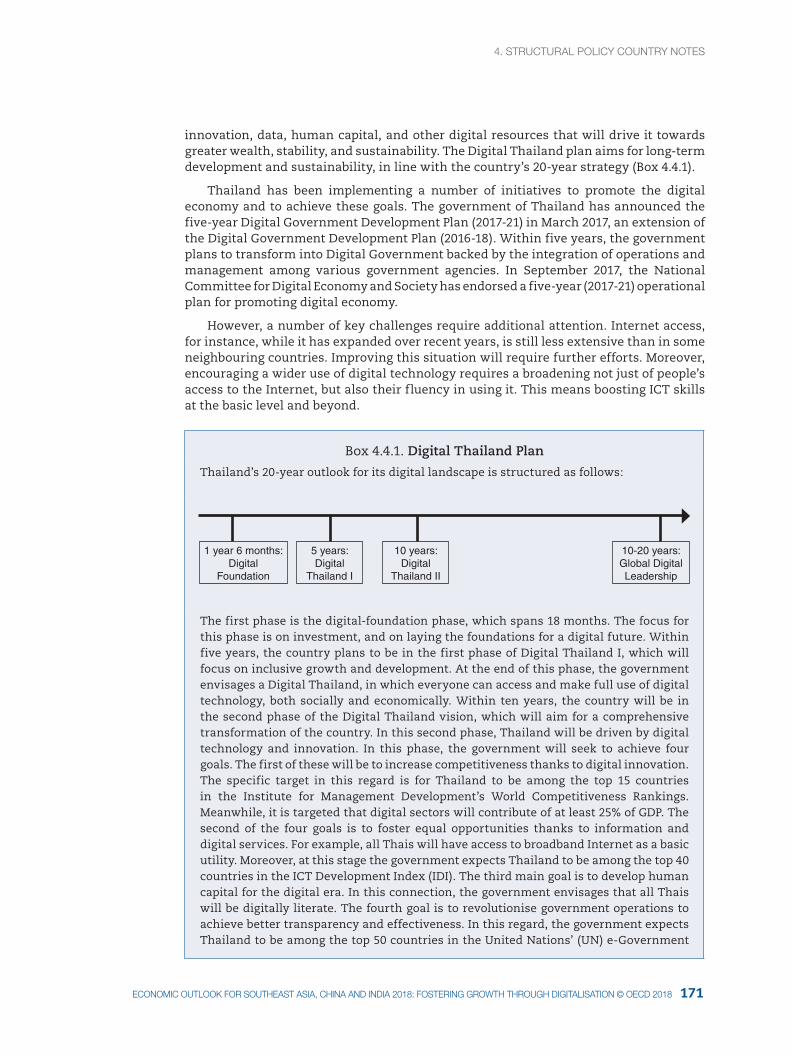
4. StrUctUral pOlIcY cOUNtrY NOteS4. StrUctUral pOlIcY cOUNtrY NOteS
171ecONOMIc OUtlOOK fOr SOUtHeaSt aSIa, cHINa aNd INdIa 2018: fOSterINg grOWtH tHrOUgH dIgItalISatION © Oecd 2018
innovation, data, human capital, and other digital resources that will drive it towards greater wealth, stability, and sustainability. The Digital Thailand plan aims for long-term development and sustainability, in line with the country’s 20-year strategy (Box 4.4.1).
Thailand has been implementing a number of initiatives to promote the digital economy and to achieve these goals. The government of Thailand has announced the five-year Digital Government Development Plan (2017-21) in March 2017, an extension of the Digital Government Development Plan (2016-18). Within five years, the government plans to transform into Digital Government backed by the integration of operations and management among various government agencies. In September 2017, the National Committee for Digital Economy and Society has endorsed a five-year (2017-21) operational plan for promoting digital economy.
However, a number of key challenges require additional attention. Internet access, for instance, while it has expanded over recent years, is still less extensive than in some neighbouring countries. Improving this situation will require further efforts. Moreover, encouraging a wider use of digital technology requires a broadening not just of people’s access to the Internet, but also their fluency in using it. This means boosting ICT skills at the basic level and beyond.
Box 4.4.1. Digital Thailand Plan
Thailand’s 20-year outlook for its digital landscape is structured as follows:
1 year 6 months: Digital
Foundation
5 years: Digital
Thailand I
10 years: Digital
Thailand II
10-20 years:Global DigitalLeadership
The first phase is the digital-foundation phase, which spans 18 months. The focus for this phase is on investment, and on laying the foundations for a digital future. Within five years, the country plans to be in the first phase of Digital Thailand I, which will focus on inclusive growth and development. At the end of this phase, the government envisages a Digital Thailand, in which everyone can access and make full use of digital technology, both socially and economically. Within ten years, the country will be in the second phase of the Digital Thailand vision, which will aim for a comprehensive transformation of the country. In this second phase, Thailand will be driven by digital technology and innovation. In this phase, the government will seek to achieve four goals. The first of these will be to increase competitiveness thanks to digital innovation. The specific target in this regard is for Thailand to be among the top 15 countries in the Institute for Management Development’s World Competitiveness Rankings. Meanwhile, it is targeted that digital sectors will contribute of at least 25% of GDP. The second of the four goals is to foster equal opportunities thanks to information and digital services. For example, all Thais will have access to broadband Internet as a basic utility. Moreover, at this stage the government expects Thailand to be among the top 40 countries in the ICT Development Index (IDI). The third main goal is to develop human capital for the digital era. In this connection, the government envisages that all Thais will be digitally literate. The fourth goal is to revolutionise government operations to achieve better transparency and effectiveness. In this regard, the government expects Thailand to be among the top 50 countries in the United Nations’ (UN) e-Government
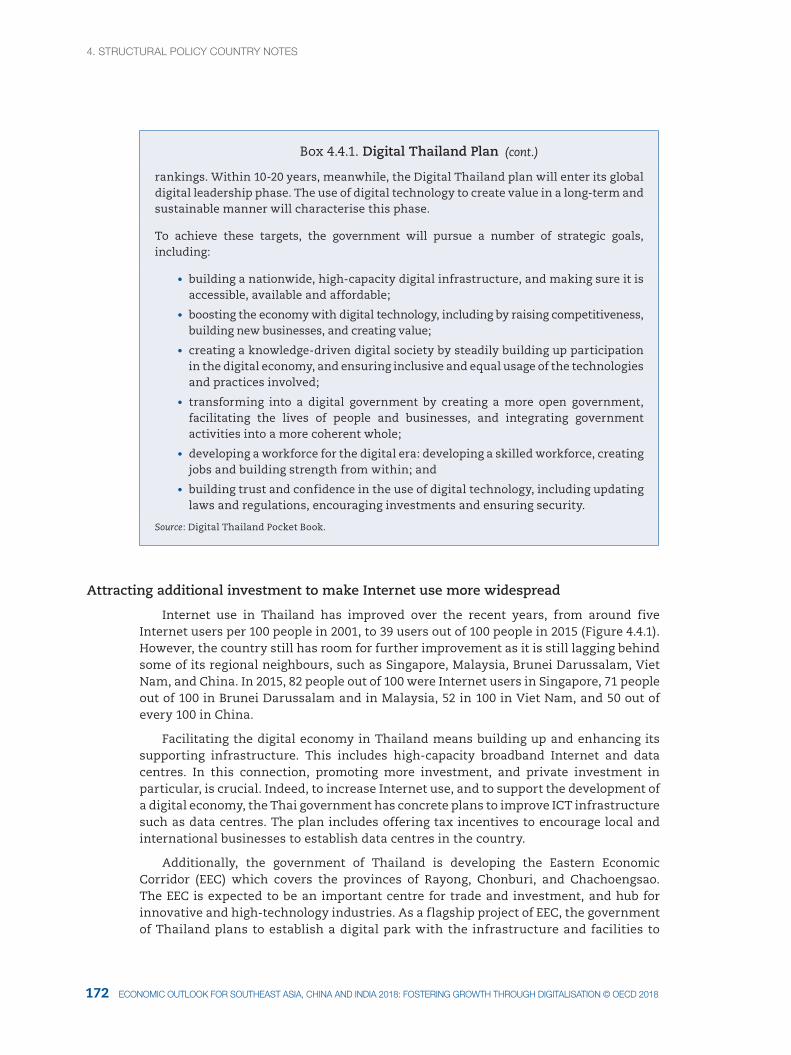
4. StrUctUral pOlIcY cOUNtrY NOteS
173172 ecONOMIc OUtlOOK fOr SOUtHeaSt aSIa, cHINa aNd INdIa 2018: fOSterINg grOWtH tHrOUgH dIgItalISatION © Oecd 2018
Box 4.4.1. Digital Thailand Plan
rankings. Within 10-20 years, meanwhile, the Digital Thailand plan will enter its global digital leadership phase. The use of digital technology to create value in a long-term and sustainable manner will characterise this phase.
To achieve these targets, the government will pursue a number of strategic goals, including:
• building a nationwide, high-capacity digital infrastructure, and making sure it is accessible, available and affordable;
• boosting the economy with digital technology, including by raising competitiveness, building new businesses, and creating value;
• creating a knowledge-driven digital society by steadily building up participation in the digital economy, and ensuring inclusive and equal usage of the technologies and practices involved;
• transforming into a digital government by creating a more open government, facilitating the lives of people and businesses, and integrating government activities into a more coherent whole;
• developing a workforce for the digital era: developing a skilled workforce, creating jobs and building strength from within; and
• building trust and confidence in the use of digital technology, including updating laws and regulations, encouraging investments and ensuring security.
Source: Digital Thailand Pocket Book.
Attracting additional investment to make Internet use more widespread
Internet use in Thailand has improved over the recent years, from around five Internet users per 100 people in 2001, to 39 users out of 100 people in 2015 (Figure 4.4.1). However, the country still has room for further improvement as it is still lagging behind some of its regional neighbours, such as Singapore, Malaysia, Brunei Darussalam, Viet Nam, and China. In 2015, 82 people out of 100 were Internet users in Singapore, 71 people out of 100 in Brunei Darussalam and in Malaysia, 52 in 100 in Viet Nam, and 50 out of every 100 in China.
Facilitating the digital economy in Thailand means building up and enhancing its supporting infrastructure. This includes high-capacity broadband Internet and data centres. In this connection, promoting more investment, and private investment in particular, is crucial. Indeed, to increase Internet use, and to support the development of a digital economy, the Thai government has concrete plans to improve ICT infrastructure such as data centres. The plan includes offering tax incentives to encourage local and international businesses to establish data centres in the country.
Additionally, the government of Thailand is developing the Eastern Economic Corridor (EEC) which covers the provinces of Rayong, Chonburi, and Chachoengsao. The EEC is expected to be an important centre for trade and investment, and hub for innovative and high-technology industries. As a flagship project of EEC, the government of Thailand plans to establish a digital park with the infrastructure and facilities to
(cont.)
4. StrUctUral pOlIcY cOUNtrY NOteS4. StrUctUral pOlIcY cOUNtrY NOteS
173ecONOMIc OUtlOOK fOr SOUtHeaSt aSIa, cHINa aNd INdIa 2018: fOSterINg grOWtH tHrOUgH dIgItalISatION © Oecd 2018
support digital businesses. The government will provide companies investing in this digital park with special incentives. These include tax incentives for companies and individuals working at the park, as well as non-tax incentives, such as simplified visa and work-permit procedures. The government plans to open this park by 2018, in the province of Chon Buri. It will include work spaces for innovation, a digital theme park, an animation and movie town, an international Internet gateway, a satellite and space centre, and a digital-data hub. The digital space area will be next to universities and living space. Overall, the government aims to promote Thailand as the digital infrastructure hub in the Association of Southeast Asian Nations (ASEAN). Aside from initiatives such as the digital park, it will also be crucial to ensure that adequate ICT infrastructure and facilities are available throughout the country, rather than being focused in a certain area.
Figure 4.4.1. Internet users per 100 people in Emerging Asia, 2001-15
0
10
20
30
40
50
60
70
80
90
2001 2002 2003 2004 2005 2006 2007 2008 2009 2010 2011 2012 2013 2014 2015
Brunei Darussalam Cambodia Indonesia Lao PDRMalaysia Myanmar Philippines SingaporeThailand Viet Nam China India
Source: World Bank (2017), World Development Indicators (database).12 xxxxx
Implementing more targeted and customised programmes to improve ICT literacy
Besides increasing investment to improve infrastructure, it is also important to expand Internet use. One way of doing this is to enhance ICT literacy and knowledge of the digital economy among the people of Thailand. According to a survey from the National Statistical Office of Thailand, respondents stated that not knowing how to use the Internet is the main reason for not using it (Figure 4.4.2). To promote the digital economy throughout the country, people need, at the very least, to know how to use the Internet at a basic level. Moreover, knowledge of how to use the Internet will be particularly necessary for e-commerce. In the survey, meanwhile, a number of respondents also said they do not use the Internet because they see it as unnecessary, or because they are not interested in it. Further efforts will therefore be needed to address these issues.
4. StrUctUral pOlIcY cOUNtrY NOteS
175174 ecONOMIc OUtlOOK fOr SOUtHeaSt aSIa, cHINa aNd INdIa 2018: fOSterINg grOWtH tHrOUgH dIgItalISatION © Oecd 2018
Figure 4.4.2. Top reasons for not using Internet in Thailand, 2016 Percentage of total non-Internet users
67.80
29.59
1.590.82 0.21
Do not know how to use
Unnecessary/disinterested/waste of time
No equipment/expensive equipment
Too expensive
Others
Source: National Statistical Office of Thailand (2016), Information and Communication Technology Survey of Households in 2016.12 xxxxx
Internet access and online activities in Thailand are currently dominated by smartphones. A survey by the National Statistical Office of Thailand showed that more than 90% of total respondents used their smartphones to access the Internet (Figure 4.4.3). In Southeast Asia, Thailand has one of the highest levels, among smartphone users, of data consumption and daily spent time with one’s device. Still, despite the high rate of smartphone users, and the increasing number of people using the Internet over recent years, a closer look at the profile of Internet users suggests a need for further efforts in the country. Factors like income and geography influence the use of smartphones and the Internet, and it varies across different regions. For instance, the number of smartphone users is higher in Bangkok than in other parts of the country, such as north-eastern and northern Thailand. The government should take all of these factors into account as it seeks to expand and improve Internet use, and more targeted policies could address the challenges more effectively.
Education and training have the scope to improve ICT literacy. More specifically, workshops in local communities could help improve people’s knowledge of, and familiarity with, computers and the Internet. Additionally, to further encourage people to use the Internet, and to increase people’s interest in it, it is crucial to communicate its benefits effectively, through information-sharing or social advertisements. However, considering that Internet activities vary across regions, and among different levels of income, programmes could be customised depending on people’s needs in each particular area. Implementing customised programmes would allow the government to respond better to these different needs, rather than rolling out a standardised programme to all areas.
4. StrUctUral pOlIcY cOUNtrY NOteS4. StrUctUral pOlIcY cOUNtrY NOteS
175ecONOMIc OUtlOOK fOr SOUtHeaSt aSIa, cHINa aNd INdIa 2018: fOSterINg grOWtH tHrOUgH dIgItalISatION © Oecd 2018
Figure 4.4.3. Information-technology devices used to access the Internet in Thailand, 2016
Percentage of total Internet users
0
10
20
30
40
50
60
70
80
90
100
Smartphone Computer Notebook Tablet Feature phone Others (incl. smart TV)
%
Source: National Statistical Office of Thailand (2016), Information and Communication Technology Survey of Households in 2016.12 xxxxx
Promoting ICT skills beyond basic knowledge
Measures to improve people’s basic knowledge of using the Internet, such as sending emails and using web browsers, will not be enough to address inadequate ICT use where it remains a problem – it will be necessary to develop ICT skills beyond this initial set of basic abilities. Some skills, such as using the Internet to pay for e-commerce transactions, or developing a website, are particularly crucial for SMEs, local businesses, women and young entrepreneurs, to allow them to conduct online transactions, and thus to widen the reach of their businesses. However, the requirement of Internet knowledge goes beyond the question of how to use it. Indeed, it is also important to know and understand the risks involved, and how to avoid them. With regard to e-commerce, for example, both customers and businesses need to understand the security aspects of online payment.
Furthermore, Thailand will need to address ICT challenges to develop its labour market. The growing trend towards digitalisation will translate into a growing need for workers with the appropriate ICT skills. Moreover, the country needs to make additional efforts to overcome a shortage of labour with the specialised skills that technologically advanced industries require, and that produce higher value-added goods and services. This means training more information technology (IT) staff, engineers, technicians and digital marketers (OECD, 2017). According to a survey by Robert Walters, digital marketers were, for example, among the top five in-demand talents in Thailand in 2016 (Walters, 2017). Moreover, the information and communications sector offers relatively high salaries in the country (Figure 4.4.4). However, the sector still does not attract enough new talent to satisfy the needs of the market. For example, although hiring activity slowed across most markets in Thailand in 2016, there was a strong demand for IT talent, including full-stack software developers, and professionals with a strong knowledge of digital and e-commerce platforms (Robert Walters, 2017).
To address these challenges, Thailand needs to pay more attention to improving the ICT sector’s attractiveness to new recruits. This includes encouraging more students to specialise in subjects related to this sector. It is also crucial for the education system
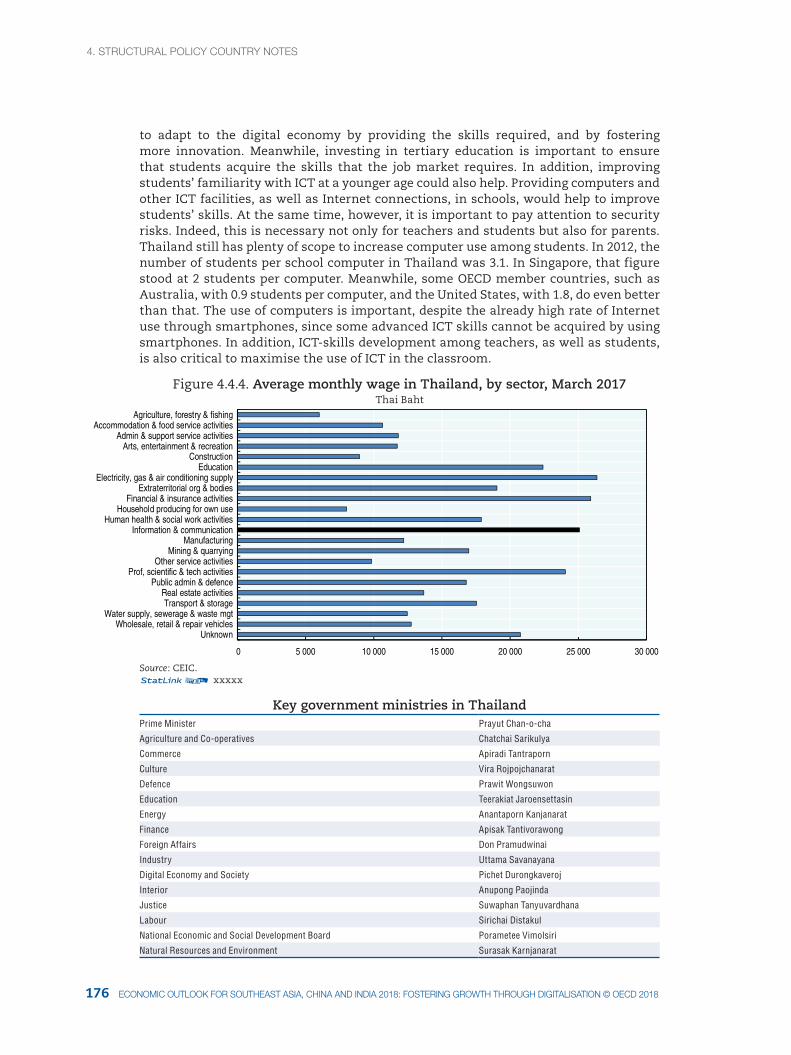
4. StrUctUral pOlIcY cOUNtrY NOteS
177176 ecONOMIc OUtlOOK fOr SOUtHeaSt aSIa, cHINa aNd INdIa 2018: fOSterINg grOWtH tHrOUgH dIgItalISatION © Oecd 2018
to adapt to the digital economy by providing the skills required, and by fostering more innovation. Meanwhile, investing in tertiary education is important to ensure that students acquire the skills that the job market requires. In addition, improving students’ familiarity with ICT at a younger age could also help. Providing computers and other ICT facilities, as well as Internet connections, in schools, would help to improve students’ skills. At the same time, however, it is important to pay attention to security risks. Indeed, this is necessary not only for teachers and students but also for parents. Thailand still has plenty of scope to increase computer use among students. In 2012, the number of students per school computer in Thailand was 3.1. In Singapore, that figure stood at 2 students per computer. Meanwhile, some OECD member countries, such as Australia, with 0.9 students per computer, and the United States, with 1.8, do even better than that. The use of computers is important, despite the already high rate of Internet use through smartphones, since some advanced ICT skills cannot be acquired by using smartphones. In addition, ICT-skills development among teachers, as well as students, is also critical to maximise the use of ICT in the classroom.
Figure 4.4.4. Average monthly wage in Thailand, by sector, March 2017Thai Baht
0 5 000 10 000 15 000 20 000 25 000 30 000
Agriculture, forestry & fishingAccommodation & food service activities
Admin & support service activities Arts, entertainment & recreation
ConstructionEducation
Electricity, gas & air conditioning supplyExtraterritorial org & bodies
Financial & insurance activitiesHousehold producing for own use
Human health & social work activitiesInformation & communication
ManufacturingMining & quarrying
Other service activitiesProf, scientific & tech activities
Public admin & defenceReal estate activitiesTransport & storage
Water supply, sewerage & waste mgtWholesale, retail & repair vehicles
Unknown
Source: CEIC.12 xxxxx
Key government ministries in ThailandPrime Minister Prayut Chan-o-cha
Agriculture and Co-operatives Chatchai Sarikulya
Commerce Apiradi Tantraporn
Culture Vira Rojpojchanarat
Defence Prawit Wongsuwon
Education Teerakiat Jaroensettasin
Energy Anantaporn Kanjanarat
Finance Apisak Tantivorawong
Foreign Affairs Don Pramudwinai
Industry Uttama Savanayana
Digital Economy and Society Pichet Durongkaveroj
Interior Anupong Paojinda
Justice Suwaphan Tanyuvardhana
Labour Sirichai Distakul
National Economic and Social Development Board Porametee Vimolsiri
Natural Resources and Environment Surasak Karnjanarat
4. StrUctUral pOlIcY cOUNtrY NOteS
177ecONOMIc OUtlOOK fOr SOUtHeaSt aSIa, cHINa aNd INdIa 2018: fOSterINg grOWtH tHrOUgH dIgItalISatION © Oecd 2018
Key government ministries in ThailandPublic Health Piyasakol Sakolsatayadorn
Science and Technology Atchaka Sibunruang
Social Development and Human Security Adul Sangsingkeo
Tourism and Sports Kobkarn Wattanavrangkul
Transport Arkhom Termpittayapaisith
Central Bank Governor Veerathai Santiprabhob
Note: Valid as of 30 September 2017.
References
OECD (2017), Economic Outlook for Southeast Asia, China and India 2017: Addressing Energy Challenges, OECD Publishing, Paris, http://dx.doi.org/10.1787/saeo-2017-en.
OECD (2015), Students, Computers and Learning: Making the Connection, PISA, OECD Publishing, Paris, http://dx.doi.org/10.1787/9789264239555-en.
Robert Walters (2017), Salary Survey 2017, Robert Walters Group, https://www.robertwalters.fr/content/dam/salary-survey-2017.pdf.
(cont.)
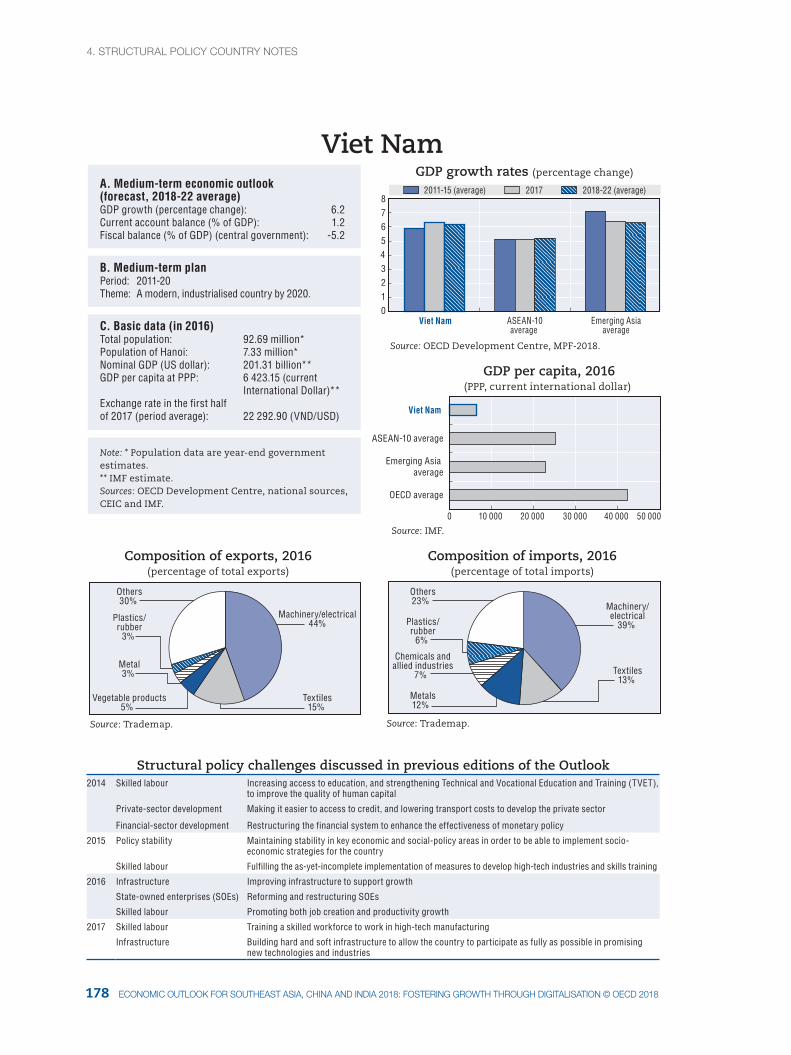
4. StrUctUral pOlIcY cOUNtrY NOteS
179178 ecONOMIc OUtlOOK fOr SOUtHeaSt aSIa, cHINa aNd INdIa 2018: fOSterINg grOWtH tHrOUgH dIgItalISatION © Oecd 2018
0 10 000 20 000 30 000 40 000 50 000
Machinery/electrical
39%
Textiles13%
Metals12%
Chemicals andallied industries
7%
Plastics/rubber
6%
Others23%
2011-15 (average) 2017 2018-22 (average)
Machinery/electrical44%
Textiles15%
Vegetable products5%
Metal3%
Plastics/rubber
3%
Others30%
0 1 2 3 4 5 6 7 8
Viet Nam ASEAN-10average
Emerging Asiaaverage
Source: OECD Development Centre, MPF-2018.
Source: IMF.
OECD average
Emerging Asia average
ASEAN-10 average
Viet Nam
Source: Trademap. Source: Trademap.
Composition of exports, 2016(percentage of total exports)
Composition of imports, 2016(percentage of total imports)
Viet NamA. Medium-term economic outlook (forecast, 2018-22 average) GDP growth (percentage change): 6.2Current account balance (% of GDP): 1.2Fiscal balance (% of GDP) (central government): -5.2
B. Medium-term planPeriod: 2011-20Theme: A modern, industrialised country by 2020.
C. Basic data (in 2016) Total population: 92.69 million* Population of Hanoi: 7.33 million* Nominal GDP (US dollar): 201.31 billion**GDP per capita at PPP: 6 423.15 (current International Dollar)**Exchange rate in the first half of 2017 (period average): 22 292.90 (VND/USD)
Note: * Population data are year-end government estimates. ** IMF estimate.Sources: OECD Development Centre, national sources, CEIC and IMF.
GDP growth rates (percentage change)
GDP per capita, 2016(PPP, current international dollar)
Structural policy challenges discussed in previous editions of the Outlook2014 Skilled labour Increasing access to education, and strengthening Technical and Vocational Education and Training (TVET),
to improve the quality of human capital
Private-sector development Making it easier to access to credit, and lowering transport costs to develop the private sector
Financial-sector development Restructuring the financial system to enhance the effectiveness of monetary policy
2015 Policy stability Maintaining stability in key economic and social-policy areas in order to be able to implement socio-economic strategies for the country
Skilled labour Fulfilling the as-yet-incomplete implementation of measures to develop high-tech industries and skills training
2016 Infrastructure Improving infrastructure to support growth
State-owned enterprises (SOEs) Reforming and restructuring SOEs
Skilled labour Promoting both job creation and productivity growth
2017 Skilled labour Training a skilled workforce to work in high-tech manufacturing
Infrastructure Building hard and soft infrastructure to allow the country to participate as fully as possible in promising new technologies and industries
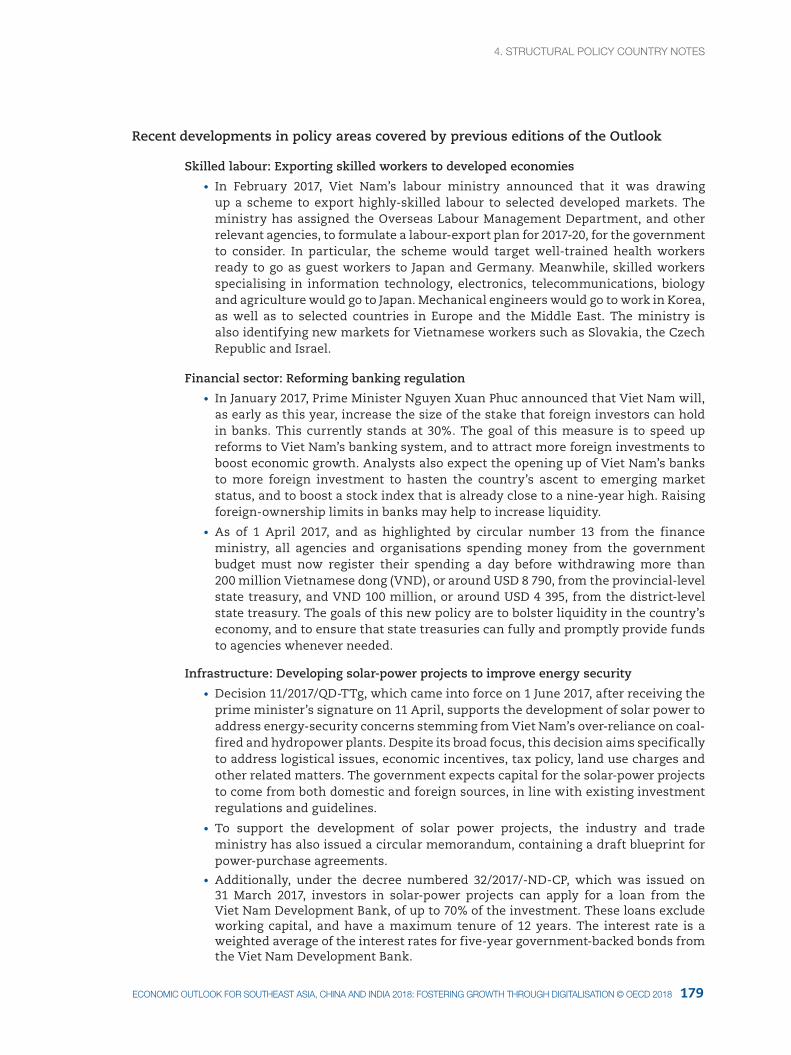
4. StrUctUral pOlIcY cOUNtrY NOteS4. StrUctUral pOlIcY cOUNtrY NOteS
179ecONOMIc OUtlOOK fOr SOUtHeaSt aSIa, cHINa aNd INdIa 2018: fOSterINg grOWtH tHrOUgH dIgItalISatION © Oecd 2018
Recent developments in policy areas covered by previous editions of the Outlook
Skilled labour: Exporting skilled workers to developed economies
• In February 2017, Viet Nam’s labour ministry announced that it was drawing up a scheme to export highly-skilled labour to selected developed markets. The ministry has assigned the Overseas Labour Management Department, and other relevant agencies, to formulate a labour-export plan for 2017-20, for the government to consider. In particular, the scheme would target well-trained health workers ready to go as guest workers to Japan and Germany. Meanwhile, skilled workers specialising in information technology, electronics, telecommunications, biology and agriculture would go to Japan. Mechanical engineers would go to work in Korea, as well as to selected countries in Europe and the Middle East. The ministry is also identifying new markets for Vietnamese workers such as Slovakia, the Czech Republic and Israel.
Financial sector: Reforming banking regulation
• In January 2017, Prime Minister Nguyen Xuan Phuc announced that Viet Nam will, as early as this year, increase the size of the stake that foreign investors can hold in banks. This currently stands at 30%. The goal of this measure is to speed up reforms to Viet Nam’s banking system, and to attract more foreign investments to boost economic growth. Analysts also expect the opening up of Viet Nam’s banks to more foreign investment to hasten the country’s ascent to emerging market status, and to boost a stock index that is already close to a nine-year high. Raising foreign-ownership limits in banks may help to increase liquidity.
• As of 1 April 2017, and as highlighted by circular number 13 from the finance ministry, all agencies and organisations spending money from the government budget must now register their spending a day before withdrawing more than 200 million Vietnamese dong (VND), or around USD 8 790, from the provincial-level state treasury, and VND 100 million, or around USD 4 395, from the district-level state treasury. The goals of this new policy are to bolster liquidity in the country’s economy, and to ensure that state treasuries can fully and promptly provide funds to agencies whenever needed.
Infrastructure: Developing solar-power projects to improve energy security
• Decision 11/2017/QD-TTg, which came into force on 1 June 2017, after receiving the prime minister’s signature on 11 April, supports the development of solar power to address energy-security concerns stemming from Viet Nam’s over-reliance on coal-fired and hydropower plants. Despite its broad focus, this decision aims specifically to address logistical issues, economic incentives, tax policy, land use charges and other related matters. The government expects capital for the solar-power projects to come from both domestic and foreign sources, in line with existing investment regulations and guidelines.
• To support the development of solar power projects, the industry and trade ministry has also issued a circular memorandum, containing a draft blueprint for power-purchase agreements.
• Additionally, under the decree numbered 32/2017/-ND-CP, which was issued on 31 March 2017, investors in solar-power projects can apply for a loan from the Viet Nam Development Bank, of up to 70% of the investment. These loans exclude working capital, and have a maximum tenure of 12 years. The interest rate is a weighted average of the interest rates for five-year government-backed bonds from the Viet Nam Development Bank.
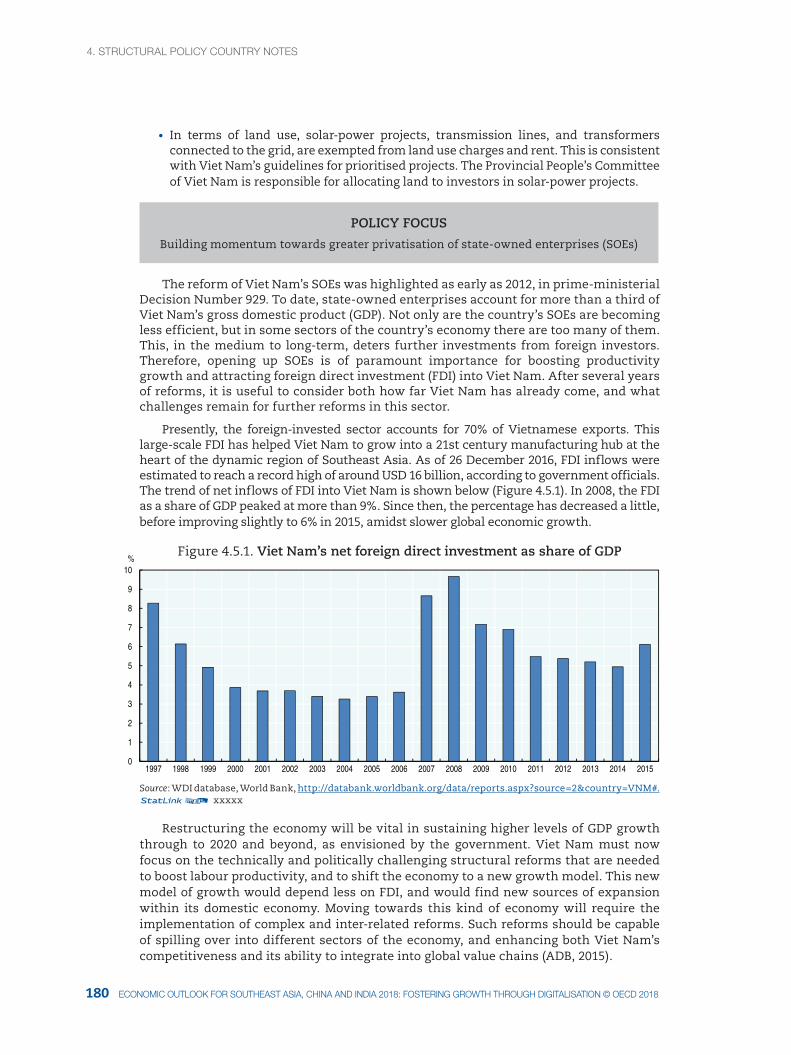
4. StrUctUral pOlIcY cOUNtrY NOteS
181180 ecONOMIc OUtlOOK fOr SOUtHeaSt aSIa, cHINa aNd INdIa 2018: fOSterINg grOWtH tHrOUgH dIgItalISatION © Oecd 2018
• In terms of land use, solar-power projects, transmission lines, and transformers connected to the grid, are exempted from land use charges and rent. This is consistent with Viet Nam’s guidelines for prioritised projects. The Provincial People’s Committee of Viet Nam is responsible for allocating land to investors in solar-power projects.
POLICY FOCUS
Building momentum towards greater privatisation of state-owned enterprises (SOEs)
The reform of Viet Nam’s SOEs was highlighted as early as 2012, in prime-ministerial Decision Number 929. To date, state-owned enterprises account for more than a third of Viet Nam’s gross domestic product (GDP). Not only are the country’s SOEs are becoming less efficient, but in some sectors of the country’s economy there are too many of them. This, in the medium to long-term, deters further investments from foreign investors. Therefore, opening up SOEs is of paramount importance for boosting productivity growth and attracting foreign direct investment (FDI) into Viet Nam. After several years of reforms, it is useful to consider both how far Viet Nam has already come, and what challenges remain for further reforms in this sector.
Presently, the foreign-invested sector accounts for 70% of Vietnamese exports. This large-scale FDI has helped Viet Nam to grow into a 21st century manufacturing hub at the heart of the dynamic region of Southeast Asia. As of 26 December 2016, FDI inflows were estimated to reach a record high of around USD 16 billion, according to government officials. The trend of net inflows of FDI into Viet Nam is shown below (Figure 4.5.1). In 2008, the FDI as a share of GDP peaked at more than 9%. Since then, the percentage has decreased a little, before improving slightly to 6% in 2015, amidst slower global economic growth.
Figure 4.5.1. Viet Nam’s net foreign direct investment as share of GDP
0
1
2
3
4
5
6
7
8
9
10
1997 1998 1999 2000 2001 2002 2003 2004 2005 2006 2007 2008 2009 2010 2011 2012 2013 2014 2015
%
Source: WDI database, World Bank, http://databank.worldbank.org/data/reports.aspx?source=2&country=VNM#.12 xxxxx
Restructuring the economy will be vital in sustaining higher levels of GDP growth through to 2020 and beyond, as envisioned by the government. Viet Nam must now focus on the technically and politically challenging structural reforms that are needed to boost labour productivity, and to shift the economy to a new growth model. This new model of growth would depend less on FDI, and would find new sources of expansion within its domestic economy. Moving towards this kind of economy will require the implementation of complex and inter-related reforms. Such reforms should be capable of spilling over into different sectors of the economy, and enhancing both Viet Nam’s competitiveness and its ability to integrate into global value chains (ADB, 2015).
4. StrUctUral pOlIcY cOUNtrY NOteS4. StrUctUral pOlIcY cOUNtrY NOteS
181ecONOMIc OUtlOOK fOr SOUtHeaSt aSIa, cHINa aNd INdIa 2018: fOSterINg grOWtH tHrOUgH dIgItalISatION © Oecd 2018
Reforming SOEs is a priority for boosting productivity and competitiveness among firms
Reforming the country’s SOEs is a crucial pillar of the government’s agenda for structural reform and raising productivity. International experience has shown that, unless all firms are able to compete on an equal footing, productivity and economic competitiveness will suffer (OECD, 2015). At the moment, SOEs in Viet Nam represent a dominant share of the country’s economic activities. Indeed, the SOE sector accounts for around 38% of Viet Nam’s GDP. This is more than in China, where they represent around 30% of GDP. Moreover, the fiscal revenues brought in by SOEs in Viet Nam hover at around 25-30% of the total. In light of the very large size of Viet Nam’s SOE sector as a share of the broader economy, prime-ministerial Decision Number 929 of 2012 required government-linked companies to prepare detailed restructuring plans. The plans encouraged SOEs to adopt more reasonable production and business structures, concentrating on their core business lines. Moreover, they had to limit themselves to providing essential public services and products for society, national defence, and security. This is crucial, because it will address the problem of SOEs crowding out private competitors and the impact of unfair business practices for both local and international firms in Viet Nam.
By 2014, the prime minister had approved restructuring and privatisation plans for 17 SOEs in the category of economic groups. Moreover, the relevant ministries have now approved around 50 restructuring plans for SOEs in the category of general corporations. In April 2017, nine firms were approved for conversion into listed companies. The total value of these firms is recorded at VND 2 470 billion, or around USD 109.3 million. The government planned to sell stakes valued at VND 347.3 billion, or around USD 15.4 million, to strategic investors.
Further reforms are underway to turn a selection of large SOEs into listed companies
There has been a drive to open up the banking sector by allowing foreign investors to own larger stakes in banks, and at the same time the government of Viet Nam is divesting state companies outside the financial sector. Divesting large SOEs in this manner is one of the main ways for the government to restructure them. To date, the government is planning to divest its entire stakes in the country’s two top breweries, namely the Saigon Beer Alcohol Beverage Corporation and Hanoi Beer Alcohol Beverage Corporation. As recently as this year, meanwhile, Viet Nam’s State Capital Investment Corporation sold 78.4 million shares in Vietnam Dairy Products JSC, which is also the nation’s largest company, and is known to the public as Vinamilk.
The momentum of reforms has been continuous. In early 2017, the finance ministry recorded a gain of VND 12 200 billion, or around USD 540 million, thanks to the government’s programme of divestments. One of the big reformers has been the national wealth fund, State Capital Investment Corporation (SCIC), which sold shares worth around VND 1 353 billion, or about USD 59.9 million, in 16 different companies. The SCIC was created in 2005 to speed up the privatisation and reform of Viet Nam’s SOEs, to separate regulatory and business functions, to make the management and investment of state assets and capital more effective, and to promote the introduction of best practices in corporate governance. (OECD, 2010)
In April 2017, the SCIC also produced a list of 100 SOEs and government-owned stakes that it has earmarked for divestment. Among the companies on the list is the telecommunications giant FPT, in which the government holds a 6% stake, making it the second largest shareholder. In 2016 alone, 56 government-linked companies were included in the privatisation list. The collective overall value of these firms stood at VND 34 trillion, or around USD 1.5 billion. Of this overall value, up to VND 24.4 trillion, or about USD 1.1 billion, consisted of state capital.
4. StrUctUral pOlIcY cOUNtrY NOteS
183182 ecONOMIc OUtlOOK fOr SOUtHeaSt aSIa, cHINa aNd INdIa 2018: fOSterINg grOWtH tHrOUgH dIgItalISatION © Oecd 2018
At the same time as it has been pushing ahead with privatisation, the government has been seeking to bolster Viet Nam’s attractiveness as one of the top four investment destinations in South East Asia. Moreover, it is also developing initiatives to improve the country’s investment environment, with goals that include increasing protection for intellectual property, offering tax breaks, and providing better access to electricity and land for new investors. The goal is to make sure that all market participants can enjoy a level playing field.
Notwithstanding the promising progress that Viet Nam has made towards privatisation and divestment, concerns persist that momentum has slowed down in recent years. The SOEs that the government is currently seeking to privatise are rather larger than some of those already divested. Indeed, smaller SOEs were privatised in the early years, as the government saw them as the low-hanging fruit on the path to privatisation. Smaller SOEs are easier to divest, as they are less complicated structurally. Moreover, they do not tend to be large conglomerate corporations that encompass various economic interests. Since smaller SOEs are structurally less complex, the process of privatisation can take place more smoothly, and in less time than it would take for large SOEs. Furthermore, finding feasible investors for the large SOEs has proven to be very challenging. Even with the limited shares and stakes being offered to investors, the market has not been very responsive. Moreover, the complexity of the structures of larger SOEs, and of the various entities they encompass, has made the process of privatising them very time-consuming.
Privatisation and divestment are far from being the only measures government needs to take to reform Viet Nam’s SOE sector. Indeed, because their presence in Viet Nam’s economy remains quite dominant, transparency on the part of SOEs is an important issue to address (World Bank, 2012). A survey in this report found that respondents viewed improving transparency as the most effective solution for successfully restructuring SOEs, in parallel with an acceleration of the privatisation programme. The second-placed solution in the survey was making audits more independent. Meanwhile, survey respondents saw ending privileged access to bank credit, and declining to offer government guarantees as the least effective of the solutions listed in the questionnaire.
In pursuing a programme of privatisation with a view to reforming the SOE sector, it is important to make sure privatisation leads to a deep managerial and administrative restructuring, to improve efficiency and productivity. When SOEs are privatised, their financial and management practices are placed under greater scrutiny. This process is vital to economic growth because it strengthens accountability and generates incentives for efficiency. SOE privatisation and ownership restructuring, when accompanied by effectively designed corporate governance, can be a powerful tool for boosting economic growth in transition economies (Trien and Hartley, 2016).
Electing a board of directors drawn from the private sector and from among non-governmental officials is, moreover, a vital step towards ensuring transparency in corporate governance in a newly-privatised SOE. This kind of diversity at the top of the company promotes a transparent structure of corporate governance, which is vital to the growth and health of these firms. Furthermore, transparency in corporate governance comes about as newly-privatised firms meet requirements such as providing relevant financial information to the investing public.
According to recommendations on transparency from the OECD on the corporate governance of state-owned enterprises in Asia, it is imperative, first and foremost, to clarify a list of non-commercial obligations performed by SOEs. This includes a clear disclosure of the objectives of these non-commercial activities, along with costing and funding plans for them (OECD, 2015). This promotes both transparency and a level playing field for competitors. Second, to uphold the highest level of integrity within SOEs, the
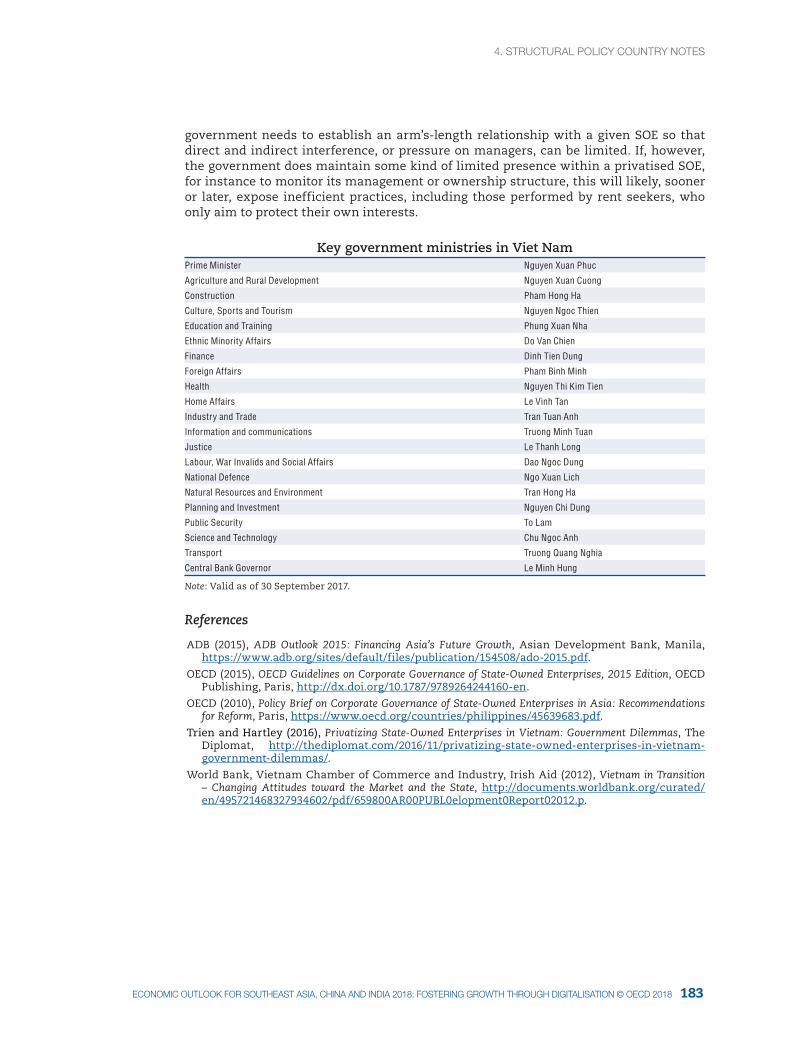
4. StrUctUral pOlIcY cOUNtrY NOteS4. StrUctUral pOlIcY cOUNtrY NOteS
183ecONOMIc OUtlOOK fOr SOUtHeaSt aSIa, cHINa aNd INdIa 2018: fOSterINg grOWtH tHrOUgH dIgItalISatION © Oecd 2018
government needs to establish an arm’s-length relationship with a given SOE so that direct and indirect interference, or pressure on managers, can be limited. If, however, the government does maintain some kind of limited presence within a privatised SOE, for instance to monitor its management or ownership structure, this will likely, sooner or later, expose inefficient practices, including those performed by rent seekers, who only aim to protect their own interests.
Key government ministries in Viet NamPrime Minister Nguyen Xuan Phuc
Agriculture and Rural Development Nguyen Xuan Cuong
Construction Pham Hong Ha
Culture, Sports and Tourism Nguyen Ngoc Thien
Education and Training Phung Xuan Nha
Ethnic Minority Affairs Do Van Chien
Finance Dinh Tien Dung
Foreign Affairs Pham Binh Minh
Health Nguyen Thi Kim Tien
Home Affairs Le Vinh Tan
Industry and Trade Tran Tuan Anh
Information and communications Truong Minh Tuan
Justice Le Thanh Long
Labour, War Invalids and Social Affairs Dao Ngoc Dung
National Defence Ngo Xuan Lich
Natural Resources and Environment Tran Hong Ha
Planning and Investment Nguyen Chi Dung
Public Security To Lam
Science and Technology Chu Ngoc Anh
Transport Truong Quang Nghia
Central Bank Governor Le Minh Hung
Note: Valid as of 30 September 2017.
References
ADB (2015), ADB Outlook 2015: Financing Asia’s Future Growth, Asian Development Bank, Manila, https://www.adb.org/sites/default/files/publication/154508/ado-2015.pdf.
OECD (2015), OECD Guidelines on Corporate Governance of State-Owned Enterprises, 2015 Edition, OECD Publishing, Paris, http://dx.doi.org/10.1787/9789264244160-en.
OECD (2010), Policy Brief on Corporate Governance of State-Owned Enterprises in Asia: Recommendations for Reform, Paris, https://www.oecd.org/countries/philippines/45639683.pdf.
Trien and Hartley (2016), Privatizing State-Owned Enterprises in Vietnam: Government Dilemmas, The Diplomat, http://thediplomat.com/2016/11/privatizing-state-owned-enterprises-in-vietnam-government-dilemmas/.
World Bank, Vietnam Chamber of Commerce and Industry, Irish Aid (2012), Vietnam in Transition – Changing Attitudes toward the Market and the State, http://documents.worldbank.org/curated/en/495721468327934602/pdf/659800AR00PUBL0elopment0Report02012.p.

185
4. StrUctUral pOlIcY cOUNtrY NOteS
185ecONOMIc OUtlOOK fOr SOUtHeaSt aSIa, cHINa aNd INdIa 2018: fOSterINg grOWtH tHrOUgH dIgItalISatION © Oecd 2018
BRUNEI DARUSSALAM
AND SINGAPORE
BRUNEI DARUSSALAM AND SINGAPORE
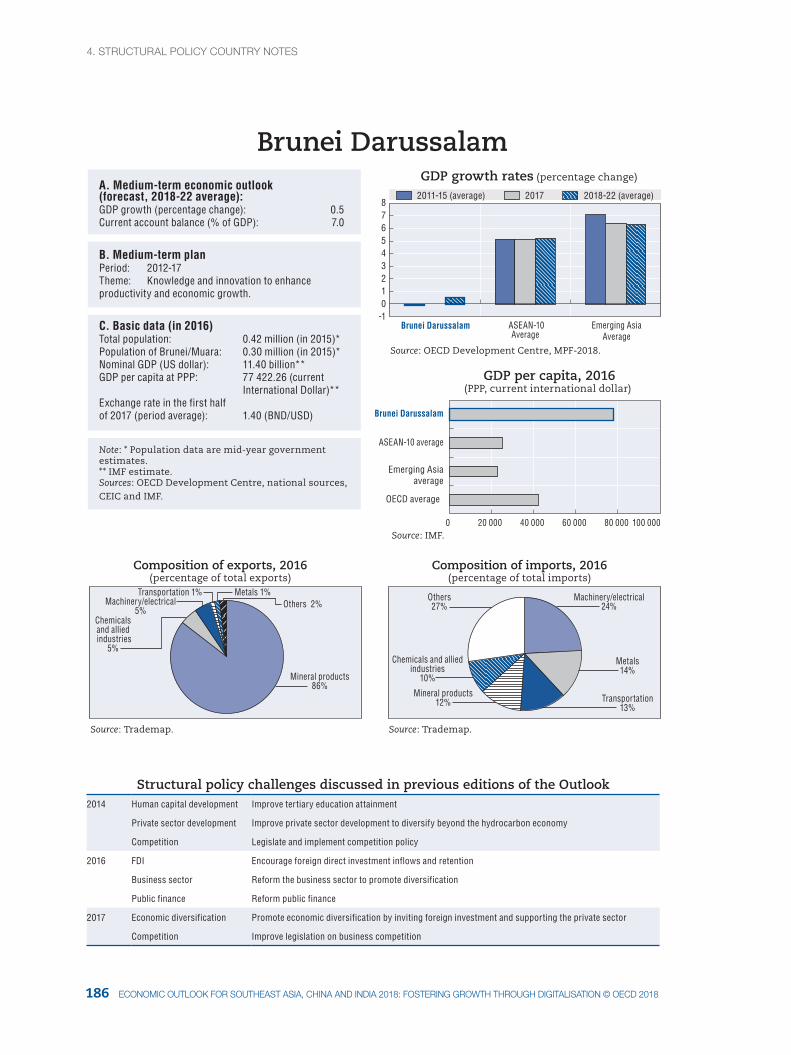
4. StrUctUral pOlIcY cOUNtrY NOteS
187186 ecONOMIc OUtlOOK fOr SOUtHeaSt aSIa, cHINa aNd INdIa 2018: fOSterINg grOWtH tHrOUgH dIgItalISatION © Oecd 2018
2011-15 (average) 2017 2018-22 (average)
Brunei Darussalam ASEAN-10Average
Emerging AsiaAverage
Brunei DarussalamGDP growth rates (percentage change)
Source: IMF.
Source: Trademap. Source: Trademap.
Composition of exports, 2016(percentage of total exports)
Composition of imports, 2016(percentage of total imports)
Source: OECD Development Centre, MPF-2018.
0
Mineral products86%
Chemicals and allied industries
5%
Machinery/electrical5%
Transportation 1% Metals 1%Others 2%
Machinery/electrical24%
Metals14%
Transportation13%
Mineral products12%
Chemicals and alliedindustries
10%
Others27%
A. Medium-term economic outlook (forecast, 2018-22 average):GDP growth (percentage change): 0.5Current account balance (% of GDP): 7.0
B. Medium-term planPeriod: 2012-17Theme: Knowledge and innovation to enhance productivity and economic growth.
C. Basic data (in 2016)Total population: 0.42 million (in 2015)*Population of Brunei/Muara: 0.30 million (in 2015)*Nominal GDP (US dollar): 11.40 billion**GDP per capita at PPP: 77 422.26 (current International Dollar)** Exchange rate in the first half of 2017 (period average): 1.40 (BND/USD)
Note: * Population data are mid-year government estimates. ** IMF estimate.Sources: OECD Development Centre, national sources, CEIC and IMF.
GDP per capita, 2016(PPP, current international dollar)
20 000 40 000 60 000 80 000 100 000
-1012345678
OECD average
Emerging Asiaaverage
ASEAN-10 average
Brunei Darussalam
Structural policy challenges discussed in previous editions of the Outlook2014 Human capital development Improve tertiary education attainment
Private sector development Improve private sector development to diversify beyond the hydrocarbon economy
Competition Legislate and implement competition policy
2016 FDI Encourage foreign direct investment inflows and retention
Business sector Reform the business sector to promote diversification
Public finance Reform public finance
2017 Economic diversification Promote economic diversification by inviting foreign investment and supporting the private sector
Competition Improve legislation on business competition
4. StrUctUral pOlIcY cOUNtrY NOteS4. StrUctUral pOlIcY cOUNtrY NOteS
187ecONOMIc OUtlOOK fOr SOUtHeaSt aSIa, cHINa aNd INdIa 2018: fOSterINg grOWtH tHrOUgH dIgItalISatION © Oecd 2018
Recent developments in policy areas covered by previous editions of the Outlook
Competition and business: Making it easier to do business and tackling cartels
• Businesses are exempted from applying for a Miscellaneous Licence and Business Licence since 2015 and 2016 respectively. The changes to the business regulation give businesses one less business process to worry about, eliminate the BND 50 fee thus, improving the ease of starting up a business in Brunei Darussalam.
• In 2016, an amendment was made via the Companies Act (Amendment) Order, 2016, which introduced provision on personal remedies in cases of oppression and injustice which allows aggrieved shareholders to make an application to the court.
• In 2017, an amendment was made via the Companies Act (Amendment) Order, 2017, which introduced derivative actions. Provisions were also introduced to increase companies’ disclosure requirements.
• The introduction of the Insolvency Order (2016) gives greater emphasis on reviewing and rehabilitating companies that are facing shortfall and difficulties. With the provisions on Company Voluntary Arrangement, this allows a company to do restructuring of debts or restructuring the ownership or management for better decision making and management. Struggling companies may thus be able to take advantage of the rescue mechanisms as an alternative to liquidation.
Education: 2017 university applications underway with PPP deal and 2018 PISA
• The implementation of the first round of Brunei Darussalam’s Higher Education Centralised Admission System (HECAS) 2017 online application procedure for higher education institutions is underway, with the Ministry of Education having reached a PPP deal to develop an electronic system.
• In February 2017, the Ministry of Education updated posters and brochures for 2018 for the Programme for International Student Assessment (PISA), which is organised by the OECD. This programme provides an opportunity to monitor and compare practices internationally, and improve learning outcomes.
Investment: Attracting new partners from abroad, and diversifying the economy
• Brunei Darussalam’s national development vision, Wawasan Brunei 2035, aims to attract foreign direct investment (FDI) and to diversify the economy. In 2016, the Prime Minister’s Office selected five priority business sectors namely halal, technology and the creative industry, business services, tourism, and downstream oil and gas. Under this initiative, these five sectors benefit from a favourable tax climate, including zero taxes on personal income, payroll, goods and services, and capital gains. In addition, they also benefit from a corporate income tax of 18.5% and are able to own up to 100% of their business.
POLICY FOCUS
Attracting FDI for economic diversification and job creation
Brunei Darussalam is committed over the long term to attracting FDI and diversifying the economy. As part of its bid to diversify, and to boost job creation, Brunei Darussalam has taken steps to attract FDI into sectors outside of the oil and gas sector, which has traditionally dominated the economy. Moreover, the government’s pursuit both of privatisation and public-private partnerships, which is well under way, has considerable
4. StrUctUral pOlIcY cOUNtrY NOteS
189188 ecONOMIc OUtlOOK fOr SOUtHeaSt aSIa, cHINa aNd INdIa 2018: fOSterINg grOWtH tHrOUgH dIgItalISatION © Oecd 2018
potential to attract more foreign direct investment (FDI) into the country. Another positive development is that Brunei Darussalam has been climbing up the World Bank’s Doing Business rankings, rising to 72nd place in 2017, from 97th in 2016.
Recent reforms and initiatives that are helping to improve the business environment in Brunei Darussalam include the development of Muara Port as an international and regional hub, operated by Muara Port Company Sdn Bhd (MPC); the implementation of the Building Control Order to ensure building safety while streamlining the process for obtaining occupational permits; enhancements to the Brunei Darussalam National Single Window (BDNSW), an online portal for documentary requirements related to import and export; the introduction of the Sutera Lane Merchant Scheme (SLMS) in September 2017 to assist importers and exporters; the streamlining of procedures in access electricity by the Department of Electrical Services (DES) and improved monitoring of power supply; an improved legal framework to facilitate lending, through the enforcement of the Secured Transaction Order (STO) and the launching of the Collateral Registry System in 2016; and improvements in the commercial court, such as the introduction of automatic discontinuance (Order 21) and use of the Judiciary Case Management System (JCMS) with improved features such as Electronic Filing System (EFS).
FDI has already contributed to economic diversification and jobs growth
As already noted, attracting FDI into the country is a key element of Brunei Darussalam’s long-term vision through to 2035 for diversifying the economy. Moreover, as well as using FDI to encourage diversification away from such an emphatic reliance on oil and gas, attracting foreign investment is also very much about creating jobs. Indeed, the government understands that greater FDI inflows into various sectors appear to be a key driver of job creation, both inside and outside of the oil and gas industries. One such effort has been to promote services such as scientific and technical activities outside of the oil and gas industry. The Prime Minister’s Office has identified five priority clusters of activity to benefit from a raft of special arrangements to encourage investment. The goal of these special dispositions for this range of key sectors, mentioned above, is to foster FDI in value-added, export-oriented, and high-tech industries.
Although the total amount of FDI flowing into Brunei Darussalam has been declining in the past few years, the portion of these investment inflows going into “other activities”1
rather than oil and gas has increased significantly, in line with the government’s aim for a more diversified economy. According to statistics from the economic development department at the prime minister’s office, FDI into “other activities” rather than oil and gas has risen from 2% of the total in 2012, to 32% in 2015. Moreover, according to World Bank statistics for 2017, Brunei Darussalam has seen jobs growth in its services sector, with a shift from industry and agriculture to the services sector between 2005 and 2014. In 2015, meanwhile, FDI from countries other than those in ASEAN and Europe accounted for around a quarter of the total inflows entering the country. This increased the diversity of FDI in terms of the sectors it flows into, and the countries it comes from, may be a reflection of Brunei Darussalam’s recent diversification efforts.
On 4 October 2016, Brunei Darussalam and its neighbour Malaysia held their 20th annual leaders’ consultation to discuss a wide range of bilateral issues. These included technical talks to improve connectivity between Malaysia and Brunei Darussalam thanks to the pan-Borneo highway project. So far, and despite Brunei Darussalam’s involvement, all 11 work packages, worth a combined 16.49 billion Malaysian ringgit (MYR), have gone to Malaysian developers.
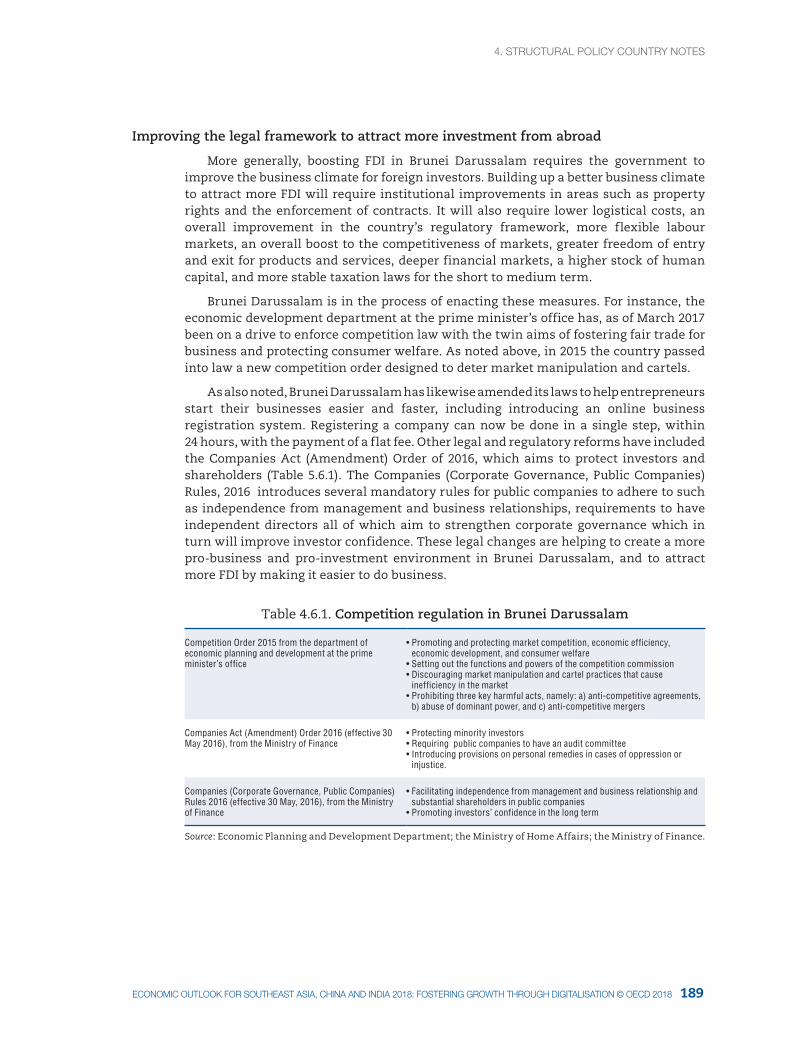
4. StrUctUral pOlIcY cOUNtrY NOteS4. StrUctUral pOlIcY cOUNtrY NOteS
189ecONOMIc OUtlOOK fOr SOUtHeaSt aSIa, cHINa aNd INdIa 2018: fOSterINg grOWtH tHrOUgH dIgItalISatION © Oecd 2018
Improving the legal framework to attract more investment from abroad
More generally, boosting FDI in Brunei Darussalam requires the government to improve the business climate for foreign investors. Building up a better business climate to attract more FDI will require institutional improvements in areas such as property rights and the enforcement of contracts. It will also require lower logistical costs, an overall improvement in the country’s regulatory framework, more flexible labour markets, an overall boost to the competitiveness of markets, greater freedom of entry and exit for products and services, deeper financial markets, a higher stock of human capital, and more stable taxation laws for the short to medium term.
Brunei Darussalam is in the process of enacting these measures. For instance, the economic development department at the prime minister’s office has, as of March 2017 been on a drive to enforce competition law with the twin aims of fostering fair trade for business and protecting consumer welfare. As noted above, in 2015 the country passed into law a new competition order designed to deter market manipulation and cartels.
As also noted, Brunei Darussalam has likewise amended its laws to help entrepreneurs start their businesses easier and faster, including introducing an online business registration system. Registering a company can now be done in a single step, within 24 hours, with the payment of a flat fee. Other legal and regulatory reforms have included the Companies Act (Amendment) Order of 2016, which aims to protect investors and shareholders (Table 5.6.1). The Companies (Corporate Governance, Public Companies) Rules, 2016 introduces several mandatory rules for public companies to adhere to such as independence from management and business relationships, requirements to have independent directors all of which aim to strengthen corporate governance which in turn will improve investor confidence. These legal changes are helping to create a more pro-business and pro-investment environment in Brunei Darussalam, and to attract more FDI by making it easier to do business.
Table 4.6.1. Competition regulation in Brunei Darussalam
Competition Order 2015 from the department of economic planning and development at the prime minister’s office
• Promoting and protecting market competition, economic efficiency, economic development, and consumer welfare
• Setting out the functions and powers of the competition commission • Discouraging market manipulation and cartel practices that cause
inefficiency in the market• Prohibiting three key harmful acts, namely: a) anti-competitive agreements,
b) abuse of dominant power, and c) anti-competitive mergers
Companies Act (Amendment) Order 2016 (effective 30 May 2016), from the Ministry of Finance
• Protecting minority investors • Requiring public companies to have an audit committee• Introducing provisions on personal remedies in cases of oppression or
injustice.
Companies (Corporate Governance, Public Companies) Rules 2016 (effective 30 May, 2016), from the Ministry of Finance
• Facilitating independence from management and business relationship and substantial shareholders in public companies
• Promoting investors’ confidence in the long term
Source: Economic Planning and Development Department; the Ministry of Home Affairs; the Ministry of Finance.
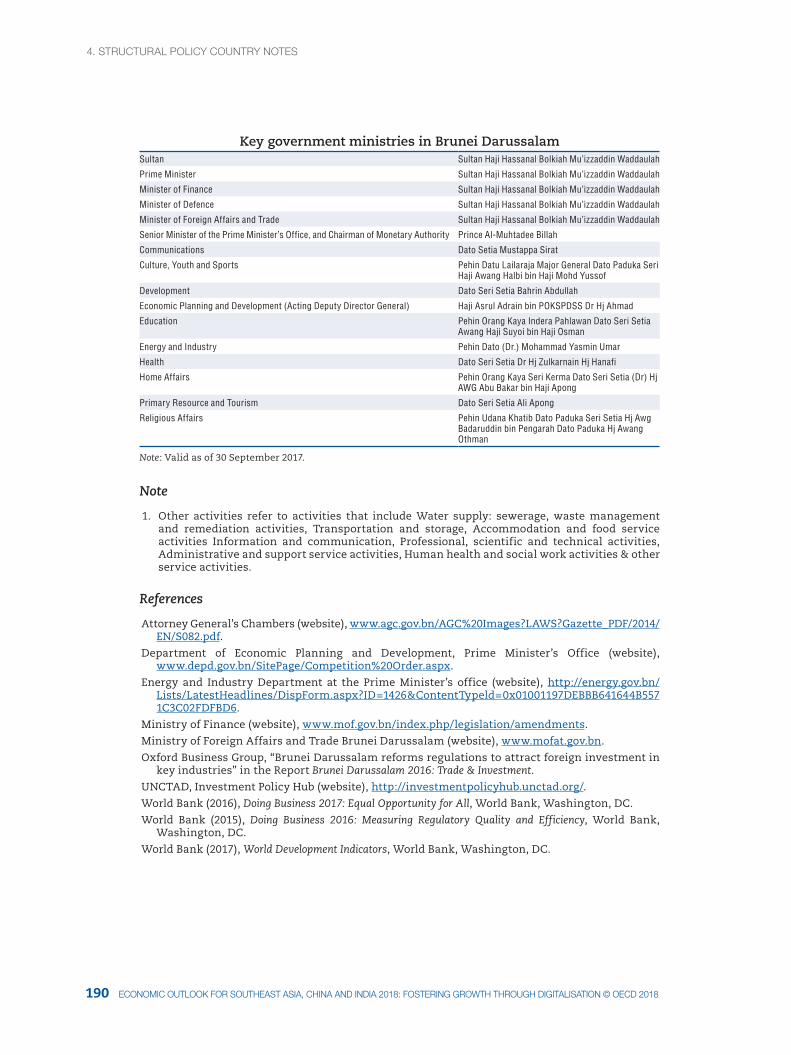
4. StrUctUral pOlIcY cOUNtrY NOteS
191190 ecONOMIc OUtlOOK fOr SOUtHeaSt aSIa, cHINa aNd INdIa 2018: fOSterINg grOWtH tHrOUgH dIgItalISatION © Oecd 2018
Key government ministries in Brunei DarussalamSultan Sultan Haji Hassanal Bolkiah Mu’izzaddin Waddaulah
Prime Minister Sultan Haji Hassanal Bolkiah Mu’izzaddin Waddaulah
Minister of Finance Sultan Haji Hassanal Bolkiah Mu’izzaddin Waddaulah
Minister of Defence Sultan Haji Hassanal Bolkiah Mu’izzaddin Waddaulah
Minister of Foreign Affairs and Trade Sultan Haji Hassanal Bolkiah Mu’izzaddin Waddaulah
Senior Minister of the Prime Minister’s Office, and Chairman of Monetary Authority Prince Al-Muhtadee Billah
Communications Dato Setia Mustappa Sirat
Culture, Youth and Sports Pehin Datu Lailaraja Major General Dato Paduka Seri Haji Awang Halbi bin Haji Mohd Yussof
Development Dato Seri Setia Bahrin Abdullah
Economic Planning and Development (Acting Deputy Director General) Haji Asrul Adrain bin POKSPDSS Dr Hj Ahmad
Education Pehin Orang Kaya Indera Pahlawan Dato Seri Setia Awang Haji Suyoi bin Haji Osman
Energy and Industry Pehin Dato (Dr.) Mohammad Yasmin Umar
Health Dato Seri Setia Dr Hj Zulkarnain Hj Hanafi
Home Affairs Pehin Orang Kaya Seri Kerma Dato Seri Setia (Dr) Hj AWG Abu Bakar bin Haji Apong
Primary Resource and Tourism Dato Seri Setia Ali Apong
Religious Affairs Pehin Udana Khatib Dato Paduka Seri Setia Hj Awg Badaruddin bin Pengarah Dato Paduka Hj Awang Othman
Note: Valid as of 30 September 2017.
Note
1. Other activities refer to activities that include Water supply: sewerage, waste management and remediation activities, Transportation and storage, Accommodation and food service activities Information and communication, Professional, scientific and technical activities, Administrative and support service activities, Human health and social work activities & other service activities.
References
Attorney General’s Chambers (website), www.agc.gov.bn/AGC%20Images?LAWS?Gazette_PDF/2014/EN/S082.pdf.
Department of Economic Planning and Development, Prime Minister’s Office (website), www.depd.gov.bn/SitePage/Competition%20Order.aspx.
Energy and Industry Department at the Prime Minister’s office (website), http://energy.gov.bn/Lists/LatestHeadlines/DispForm.aspx?ID=1426&ContentTypeld=0x01001197DEBBB641644B5571C3C02FDFBD6.
Ministry of Finance (website), www.mof.gov.bn/index.php/legislation/amendments.
Ministry of Foreign Affairs and Trade Brunei Darussalam (website), www.mofat.gov.bn.
Oxford Business Group, “Brunei Darussalam reforms regulations to attract foreign investment in key industries” in the Report Brunei Darussalam 2016: Trade & Investment.
UNCTAD, Investment Policy Hub (website), http://investmentpolicyhub.unctad.org/.
World Bank (2016), Doing Business 2017: Equal Opportunity for All, World Bank, Washington, DC.
World Bank (2015), Doing Business 2016: Measuring Regulatory Quality and Efficiency, World Bank, Washington, DC.
World Bank (2017), World Development Indicators, World Bank, Washington, DC.
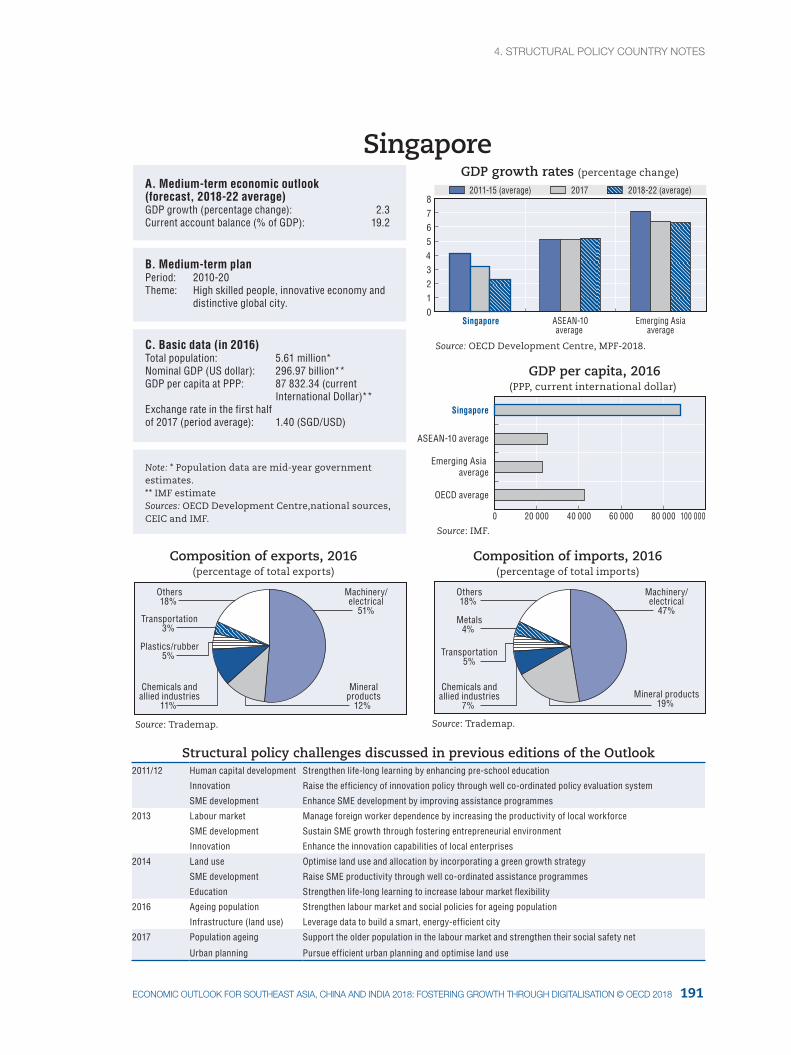
4. StrUctUral pOlIcY cOUNtrY NOteS4. StrUctUral pOlIcY cOUNtrY NOteS
191ecONOMIc OUtlOOK fOr SOUtHeaSt aSIa, cHINa aNd INdIa 2018: fOSterINg grOWtH tHrOUgH dIgItalISatION © Oecd 2018
Singapore
0 20 000 40 000 60 000 80 000 100 000
Source: OECD Development Centre, MPF-2018.
2011-15 (average) 2017 2018-22 (average)
Machinery/electrical
51%
Mineralproducts
12%
Chemicals andallied industries
11%
Plastics/rubber5%
Transportation3%
Others18%
Machinery/electrical
47%
Mineral products19%
Chemicals andallied industries
7%
Transportation5%
Metals4%
Others18%
0 1 2 3 4 5 6 7 8
Singapore ASEAN-10average
Emerging Asiaaverage
Source: IMF.
OECD average
Emerging Asia average
ASEAN-10 average
Singapore
Source: Trademap. Source: Trademap.
Composition of exports, 2016(percentage of total exports)
Composition of imports, 2016(percentage of total imports)
A. Medium-term economic outlook (forecast, 2018-22 average) GDP growth (percentage change): 2.3Current account balance (% of GDP): 19.2
B. Medium-term planPeriod: 2010-20Theme: High skilled people, innovative economy and distinctive global city.
C. Basic data (in 2016) Total population: 5.61 million*Nominal GDP (US dollar): 296.97 billion**GDP per capita at PPP: 87 832.34 (current International Dollar)**Exchange rate in the first half of 2017 (period average): 1.40 (SGD/USD)
Note: * Population data are mid-year government estimates. ** IMF estimateSources: OECD Development Centre,national sources, CEIC and IMF.
GDP growth rates (percentage change)
GDP per capita, 2016(PPP, current international dollar)
Structural policy challenges discussed in previous editions of the Outlook
2011/12 Human capital development Strengthen life-long learning by enhancing pre-school education
Innovation Raise the efficiency of innovation policy through well co-ordinated policy evaluation system
SME development Enhance SME development by improving assistance programmes
2013 Labour market Manage foreign worker dependence by increasing the productivity of local workforce
SME development Sustain SME growth through fostering entrepreneurial environment
Innovation Enhance the innovation capabilities of local enterprises
2014 Land use Optimise land use and allocation by incorporating a green growth strategy
SME development Raise SME productivity through well co-ordinated assistance programmes
Education Strengthen life-long learning to increase labour market flexibility
2016 Ageing population Strengthen labour market and social policies for ageing population
Infrastructure (land use) Leverage data to build a smart, energy-efficient city
2017 Population ageing Support the older population in the labour market and strengthen their social safety net
Urban planning Pursue efficient urban planning and optimise land use
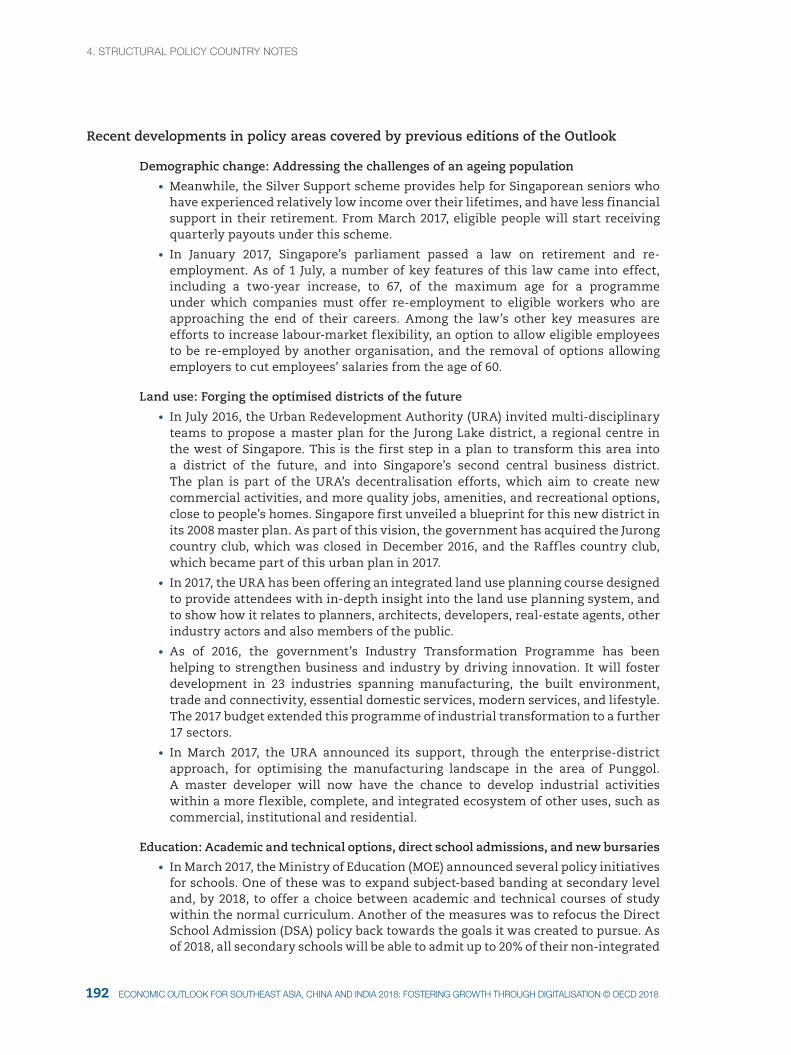
4. StrUctUral pOlIcY cOUNtrY NOteS
193192 ecONOMIc OUtlOOK fOr SOUtHeaSt aSIa, cHINa aNd INdIa 2018: fOSterINg grOWtH tHrOUgH dIgItalISatION © Oecd 2018
Recent developments in policy areas covered by previous editions of the Outlook
Demographic change: Addressing the challenges of an ageing population
• Meanwhile, the Silver Support scheme provides help for Singaporean seniors who have experienced relatively low income over their lifetimes, and have less financial support in their retirement. From March 2017, eligible people will start receiving quarterly payouts under this scheme.
• In January 2017, Singapore’s parliament passed a law on retirement and re-employment. As of 1 July, a number of key features of this law came into effect, including a two-year increase, to 67, of the maximum age for a programme under which companies must offer re-employment to eligible workers who are approaching the end of their careers. Among the law’s other key measures are efforts to increase labour-market flexibility, an option to allow eligible employees to be re-employed by another organisation, and the removal of options allowing employers to cut employees’ salaries from the age of 60.
Land use: Forging the optimised districts of the future
• In July 2016, the Urban Redevelopment Authority (URA) invited multi-disciplinary teams to propose a master plan for the Jurong Lake district, a regional centre in the west of Singapore. This is the first step in a plan to transform this area into a district of the future, and into Singapore’s second central business district. The plan is part of the URA’s decentralisation efforts, which aim to create new commercial activities, and more quality jobs, amenities, and recreational options, close to people’s homes. Singapore first unveiled a blueprint for this new district in its 2008 master plan. As part of this vision, the government has acquired the Jurong country club, which was closed in December 2016, and the Raffles country club, which became part of this urban plan in 2017.
• In 2017, the URA has been offering an integrated land use planning course designed to provide attendees with in-depth insight into the land use planning system, and to show how it relates to planners, architects, developers, real-estate agents, other industry actors and also members of the public.
• As of 2016, the government’s Industry Transformation Programme has been helping to strengthen business and industry by driving innovation. It will foster development in 23 industries spanning manufacturing, the built environment, trade and connectivity, essential domestic services, modern services, and lifestyle. The 2017 budget extended this programme of industrial transformation to a further 17 sectors.
• In March 2017, the URA announced its support, through the enterprise-district approach, for optimising the manufacturing landscape in the area of Punggol. A master developer will now have the chance to develop industrial activities within a more flexible, complete, and integrated ecosystem of other uses, such as commercial, institutional and residential.
Education: Academic and technical options, direct school admissions, and new bursaries
• In March 2017, the Ministry of Education (MOE) announced several policy initiatives for schools. One of these was to expand subject-based banding at secondary level and, by 2018, to offer a choice between academic and technical courses of study within the normal curriculum. Another of the measures was to refocus the Direct School Admission (DSA) policy back towards the goals it was created to pursue. As of 2018, all secondary schools will be able to admit up to 20% of their non-integrated
4. StrUctUral pOlIcY cOUNtrY NOteS4. StrUctUral pOlIcY cOUNtrY NOteS
193ecONOMIc OUtlOOK fOr SOUtHeaSt aSIa, cHINa aNd INdIa 2018: fOSterINg grOWtH tHrOUgH dIgItalISatION © Oecd 2018
programme secondary-level intake via the DSA. This will give students more options and opportunities to access secondary schools. The MOE’s new measures also included efforts to make sure secondary education is open to all, as well as an increase in financial support for post-secondary students. From 2019, students will be able to apply for the DSA through a centralised application portal with a common application form. Two bursaries – one from the MOE, and another provided jointly by the Community Development Council and the Citizens’ Consultative Committee – will be effective as of the 2017 academic year. The goal is to broaden the funding options for full-time Singaporean students in the country’s publicly-funded post-secondary institutions.
Small and medium-sized enterprises (SMEs): Promoting digitisation, technology, and innovation
• In February 2017, the finance minister allocated over 80 million Singapore dollars (SGD) in the 2017 budget for measures including helping companies to strengthen their corporate capabilities, and a new programme called SMEs Go Digital. The goal of this initiative is to build up an SME technology hub, set up by the Info-communications Media Development Authority. This initiative complements Singapore’s existing network of SME Centres, where firms can get free business advice and can access information on government schemes. Therefore, the government’s initiative will help strengthen capabilities in data and cybersecurity, increase innovation and encourage an overall scaling-up of activities, improve better access to intellectual property, the new Tech Access Initiative and International Partnership Fund, and finance for local companies participating in overseas infrastructure projects. There was also the SME Day on 20 April 2017, which promoted ready-to-go solutions for improving productivity and business performance. It also highlighted effective Internet Protocol management practices, new licensing opportunities, and collaborative opportunities to co-innovate new products and services.
Research and development (R&D): Grants system evolves amid investment
• Singapore’s Productivity and Innovation Credit (PIC) Scheme will expire in 2018, with some businesses set for an exit from the system as early as January 2017. The research and development tax incentive, meanwhile, will continue. However, its benefits and scope will decline due to the expiration of the PIC, and it has to be reviewed. Meanwhile, a capability-development grant covers up to 70% of projects that qualify for funding. It helps to cover costs such as consultancy, training, certification, spending on equipment to increase productivity, process improvement, product development and market access.
• By February 2017, Virtual Singapore had already conducted a research briefing for
its second Grant Call, and the process was open to applications as of April.
POLICY FOCUS
Optimising the use of Singapore’s limited land
Land use planning should be updated
In its approach to urban planning, the government seeks to optimise the use and allocation of Singapore’s limited supply of land, as its population continues to grow. In doing so, it places a particular emphasis on ways of maximising people’s work-life balance.
4. StrUctUral pOlIcY cOUNtrY NOteS
195194 ecONOMIc OUtlOOK fOr SOUtHeaSt aSIa, cHINa aNd INdIa 2018: fOSterINg grOWtH tHrOUgH dIgItalISatION © Oecd 2018
According to a 2013 white paper, Singapore’s population will increase to between 6.5 million and 6.9 million by 2030. To support this growing population on limited land, the government should pursue a number of measures. The first of these is to reclaim more land from the sea. Second, the government should develop some of Singapore’s reserve areas. Third, it should intensify new developments. Finally, it should also recycle land with lower-intensity uses, such as old industrial areas and some golf courses, to achieve higher productivity.
In its approach to land distribution, the development ministry’s master plan uses the categories of business, residential, infrastructure and defence. By 2030, the government plans for more than half of the land to be used for working and living, about 20% for mobility within Singapore and connectivity with the rest of the world, and another 20% for defence. The master plan is the statutory land use plan in Singapore, and it guides the country’s medium-term development over the next 10 to 15 years. Singapore introduced this core method of public urban planning in 1958, and has updated it every five years.
An example of the strategic impetus that this plan provides is, as noted above, the vision of transforming Singapore’s Jurong Lake area into a district of the future and a second central business district. The 350 kilometre high-speed rail link with Kuala Lumpur will have a terminal in Jurong, connecting it with another seven terminals in Malaysia: Kuala Lumpur, Putrajaya, Seremban, Ayer Keroh, Muar, Batu Pahat and Iskandar Puteri. This ambitious plan is the reason why the government acquired the Jurong and Raffles country clubs, as also noted above.
This current master plan needs to be flexible enough to take account of the way the business environment, and the overall structure of the economy, are changing. These changes notably include the way in which more manufacturing companies have targeted innovation-led growth as the Singaporean economy has focused increasingly on services. An example of the government’s efforts to encourage this kind of change is the industrial transformation programme that it launched in 2016. By driving innovation, this initiative helps to strengthen enterprises and industry, and accelerates recent business trends. The goal is to boost development in the sectors of manufacturing, the built environment, trade and connectivity, essential domestic services, modern services, and lifestyle.
In addition to extending the reach of the government’s industrial transformation programme, the 2017 budget aims, as previously noted, to strengthen corporate capacities. It aims in particular to boost capacity for digitalisation, data, and cybersecurity. In short, government industrial policy is seeking to reflect and embrace the changes businesses are experiencing both locally and in the global marketplace.
Making urban planning more responsive to a changing economy
As the economy has witnessed these structural changes, there has been a degree of mismatch between the relatively short period of time in which innovation takes place, and a longer timescale when it comes to revising regulations to keep up with these changes. In order to help synchronise these aspects in a more satisfactory manner, the government has been revising Singapore’s land rules to accommodate changes in the structure of the economy.
The government’s master plan looks at business zoning in terms of overarching categories. The Business 1 category encompasses sectors ranging from computer software to distribution services. Meanwhile, the Business 2 category spans from biotechnology to the manufacture of electrical goods and supplies. Other planning parameters include a 60-40 rule that requires at least 60% of space to be used for industrial activities.
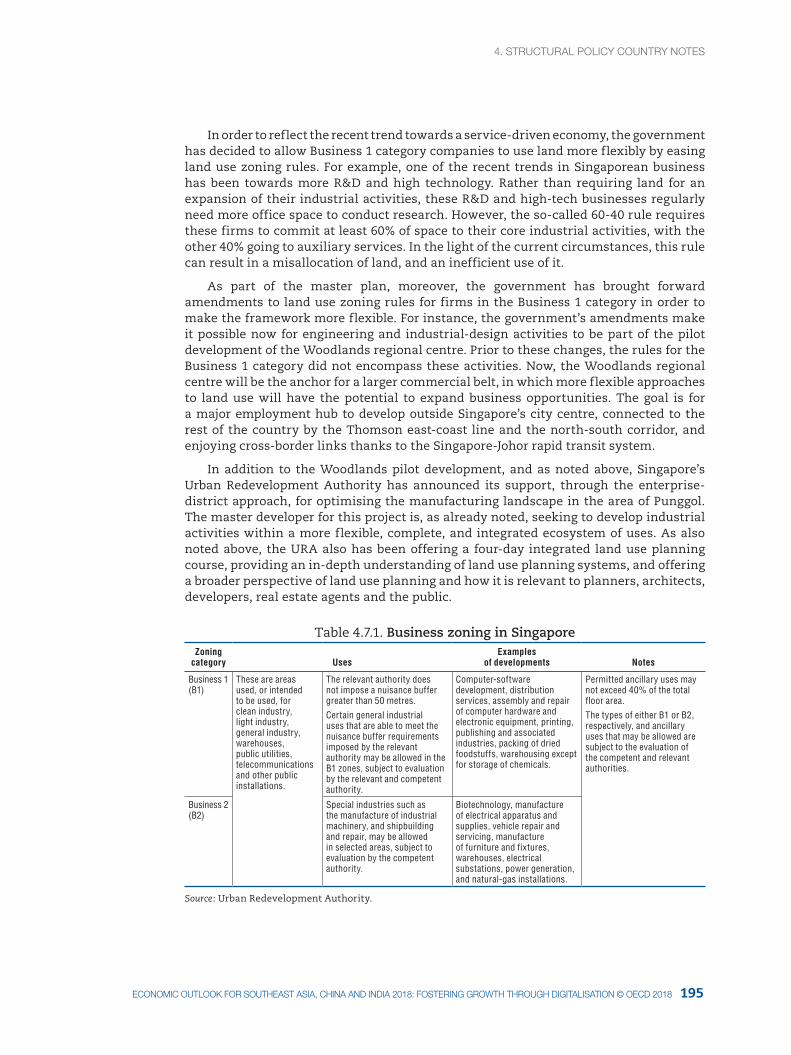
4. StrUctUral pOlIcY cOUNtrY NOteS4. StrUctUral pOlIcY cOUNtrY NOteS
195ecONOMIc OUtlOOK fOr SOUtHeaSt aSIa, cHINa aNd INdIa 2018: fOSterINg grOWtH tHrOUgH dIgItalISatION © Oecd 2018
In order to reflect the recent trend towards a service-driven economy, the government has decided to allow Business 1 category companies to use land more flexibly by easing land use zoning rules. For example, one of the recent trends in Singaporean business has been towards more R&D and high technology. Rather than requiring land for an expansion of their industrial activities, these R&D and high-tech businesses regularly need more office space to conduct research. However, the so-called 60-40 rule requires these firms to commit at least 60% of space to their core industrial activities, with the other 40% going to auxiliary services. In the light of the current circumstances, this rule can result in a misallocation of land, and an inefficient use of it.
As part of the master plan, moreover, the government has brought forward amendments to land use zoning rules for firms in the Business 1 category in order to make the framework more flexible. For instance, the government’s amendments make it possible now for engineering and industrial-design activities to be part of the pilot development of the Woodlands regional centre. Prior to these changes, the rules for the Business 1 category did not encompass these activities. Now, the Woodlands regional centre will be the anchor for a larger commercial belt, in which more flexible approaches to land use will have the potential to expand business opportunities. The goal is for a major employment hub to develop outside Singapore’s city centre, connected to the rest of the country by the Thomson east-coast line and the north-south corridor, and enjoying cross-border links thanks to the Singapore-Johor rapid transit system.
In addition to the Woodlands pilot development, and as noted above, Singapore’s Urban Redevelopment Authority has announced its support, through the enterprise-district approach, for optimising the manufacturing landscape in the area of Punggol. The master developer for this project is, as already noted, seeking to develop industrial activities within a more flexible, complete, and integrated ecosystem of uses. As also noted above, the URA also has been offering a four-day integrated land use planning course, providing an in-depth understanding of land use planning systems, and offering a broader perspective of land use planning and how it is relevant to planners, architects, developers, real estate agents and the public.
Table 4.7.1. Business zoning in SingaporeZoning
category UsesExamples
of developments Notes
Business 1 (B1)
These are areas used, or intended to be used, for clean industry, light industry, general industry, warehouses, public utilities, telecommunications and other public installations.
The relevant authority does not impose a nuisance buffer greater than 50 metres.
Certain general industrial uses that are able to meet the nuisance buffer requirements imposed by the relevant authority may be allowed in the B1 zones, subject to evaluation by the relevant and competent authority.
Computer-software development, distribution services, assembly and repair of computer hardware and electronic equipment, printing, publishing and associated industries, packing of dried foodstuffs, warehousing except for storage of chemicals.
Permitted ancillary uses may not exceed 40% of the total floor area.
The types of either B1 or B2, respectively, and ancillary uses that may be allowed are subject to the evaluation of the competent and relevant authorities.
Business 2 (B2)
Special industries such as the manufacture of industrial machinery, and shipbuilding and repair, may be allowed in selected areas, subject to evaluation by the competent authority.
Biotechnology, manufacture of electrical apparatus and supplies, vehicle repair and servicing, manufacture of furniture and fixtures, warehouses, electrical substations, power generation, and natural-gas installations.
Source: Urban Redevelopment Authority.
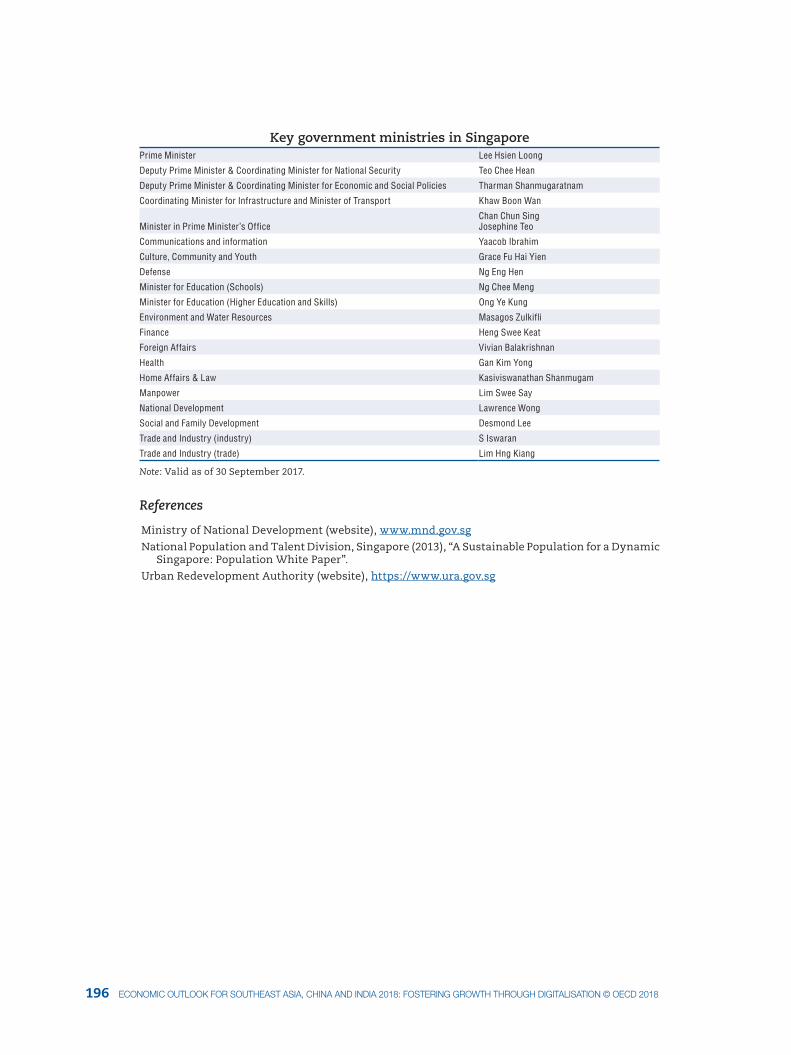
197196 ecONOMIc OUtlOOK fOr SOUtHeaSt aSIa, cHINa aNd INdIa 2018: fOSterINg grOWtH tHrOUgH dIgItalISatION © Oecd 2018
Key government ministries in SingaporePrime Minister Lee Hsien Loong
Deputy Prime Minister & Coordinating Minister for National Security Teo Chee Hean
Deputy Prime Minister & Coordinating Minister for Economic and Social Policies Tharman Shanmugaratnam
Coordinating Minister for Infrastructure and Minister of Transport Khaw Boon Wan
Minister in Prime Minister’s OfficeChan Chun SingJosephine Teo
Communications and information Yaacob Ibrahim
Culture, Community and Youth Grace Fu Hai Yien
Defense Ng Eng Hen
Minister for Education (Schools) Ng Chee Meng
Minister for Education (Higher Education and Skills) Ong Ye Kung
Environment and Water Resources Masagos Zulkifli
Finance Heng Swee Keat
Foreign Affairs Vivian Balakrishnan
Health Gan Kim Yong
Home Affairs & Law Kasiviswanathan Shanmugam
Manpower Lim Swee Say
National Development Lawrence Wong
Social and Family Development Desmond Lee
Trade and Industry (industry) S Iswaran
Trade and Industry (trade) Lim Hng Kiang
Note: Valid as of 30 September 2017.
References
Ministry of National Development (website), www.mnd.gov.sg
National Population and Talent Division, Singapore (2013), “A Sustainable Population for a Dynamic Singapore: Population White Paper”.
Urban Redevelopment Authority (website), https://www.ura.gov.sg

197ecONOMIc OUtlOOK fOr SOUtHeaSt aSIa, cHINa aNd INdIa 2018: fOSterINg grOWtH tHrOUgH dIgItalISatION © Oecd 2018
CLMCLM
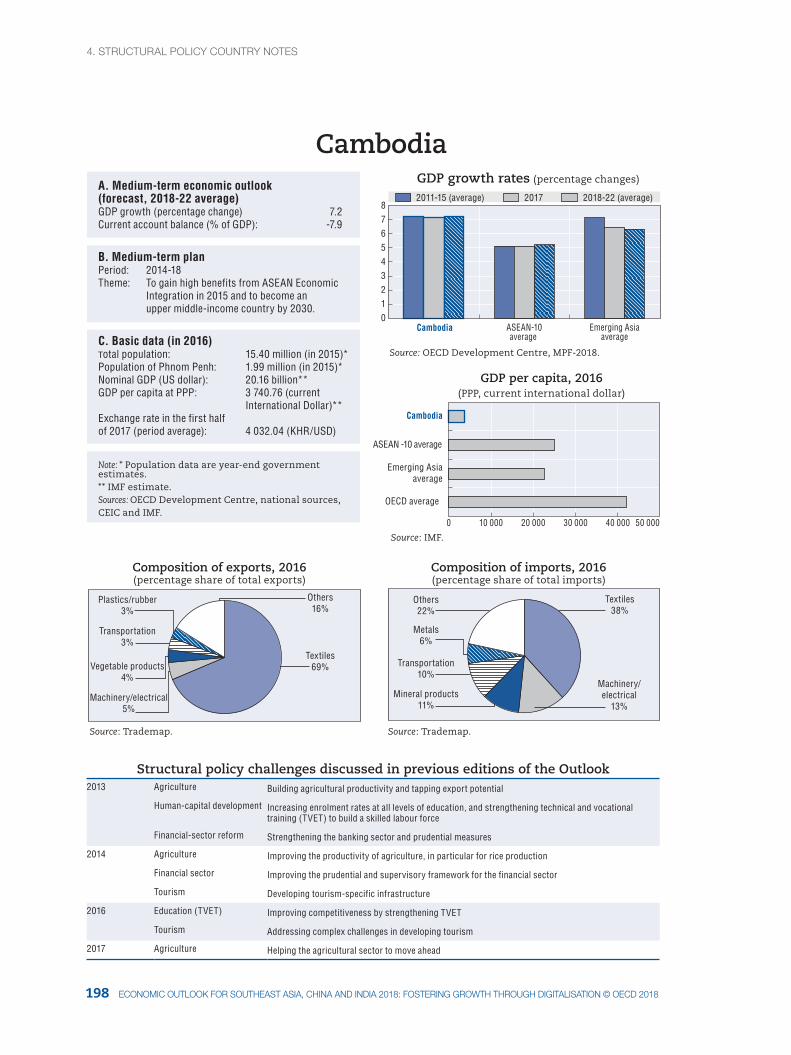
4. StrUctUral pOlIcY cOUNtrY NOteS
199198 ecONOMIc OUtlOOK fOr SOUtHeaSt aSIa, cHINa aNd INdIa 2018: fOSterINg grOWtH tHrOUgH dIgItalISatION © Oecd 2018
2011-15 (average) 2017 2018-22 (average)
Cambodia
CambodiaGDP growth rates (percentage changes)
Source: IMF.
0
Emerging Asiaaverage
OECD average
ASEAN -10 average
Cambodia
GDP per capita, 2016 (PPP, current international dollar)
Source: Trademap. Source: Trademap.
Composition of exports, 2016(percentage share of total exports)
Composition of imports, 2016(percentage share of total imports)
Textiles69%
Machinery/electrical5%
Vegetable products4%
Transportation3%
Plastics/rubber3%
Others16%
Textiles38%
Machinery/electrical
13%Mineral products
11%
Metals6%
Transportation10%
Others22%
A. Medium-term economic outlook(forecast, 2018-22 average)GDP growth (percentage change) 7.2Current account balance (% of GDP): -7.9
B. Medium-term planPeriod: 2014-18Theme: To gain high benefits from ASEAN Economic Integration in 2015 and to become an upper middle-income country by 2030.
C. Basic data (in 2016)Total population: 15.40 million (in 2015)*Population of Phnom Penh: 1.99 million (in 2015)*Nominal GDP (US dollar): 20.16 billion**GDP per capita at PPP: 3 740.76 (current International Dollar)**Exchange rate in the first half of 2017 (period average): 4 032.04 (KHR/USD)
Note: * Population data are year-end government estimates. ** IMF estimate.Sources: OECD Development Centre, national sources, CEIC and IMF.
0 1 2 3 4 5 6 7 8
Source: OECD Development Centre, MPF-2018.
ASEAN-10average
Emerging Asiaaverage
10 000 20 000 30 000 40 000 50 000
Structural policy challenges discussed in previous editions of the Outlook2013 Agriculture Building agricultural productivity and tapping export potential
Human-capital development Increasing enrolment rates at all levels of education, and strengthening technical and vocational training (TVET) to build a skilled labour force
Financial-sector reform Strengthening the banking sector and prudential measures
2014 Agriculture Improving the productivity of agriculture, in particular for rice production
Financial sector Improving the prudential and supervisory framework for the financial sector
Tourism Developing tourism-specific infrastructure
2016 Education (TVET) Improving competitiveness by strengthening TVET
Tourism Addressing complex challenges in developing tourism
2017 Agriculture Helping the agricultural sector to move ahead
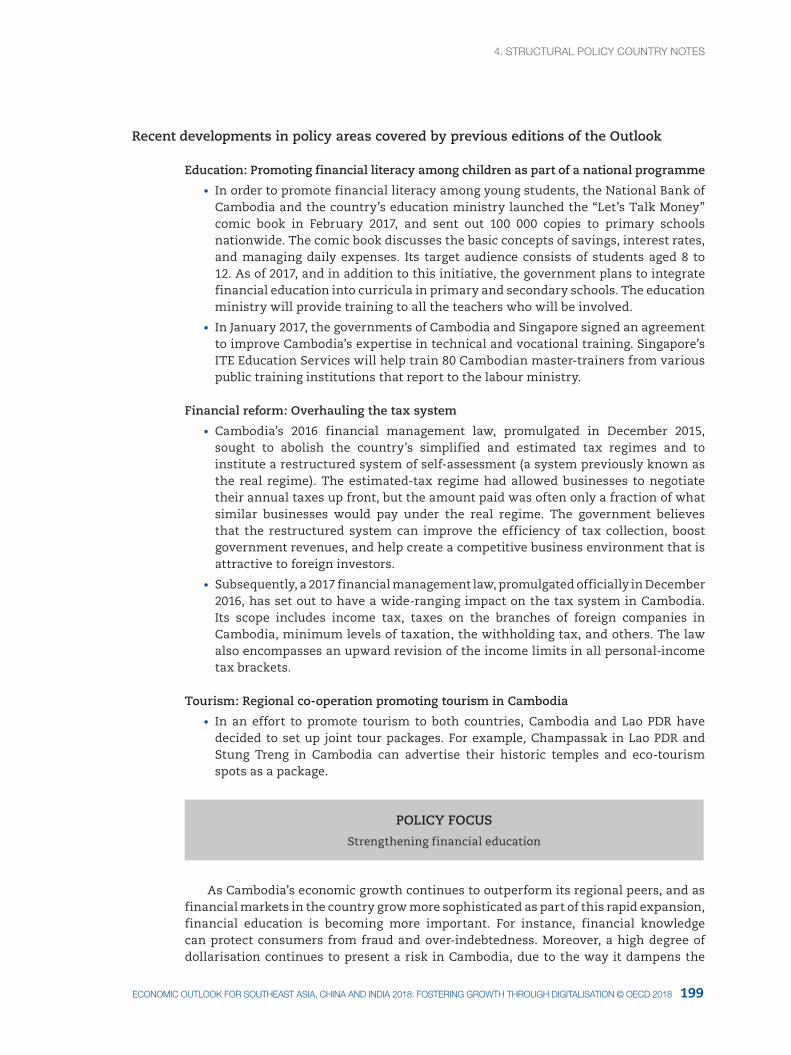
4. StrUctUral pOlIcY cOUNtrY NOteS4. StrUctUral pOlIcY cOUNtrY NOteS
199ecONOMIc OUtlOOK fOr SOUtHeaSt aSIa, cHINa aNd INdIa 2018: fOSterINg grOWtH tHrOUgH dIgItalISatION © Oecd 2018
Recent developments in policy areas covered by previous editions of the Outlook
Education: Promoting financial literacy among children as part of a national programme
• In order to promote financial literacy among young students, the National Bank of Cambodia and the country’s education ministry launched the “Let’s Talk Money” comic book in February 2017, and sent out 100 000 copies to primary schools nationwide. The comic book discusses the basic concepts of savings, interest rates, and managing daily expenses. Its target audience consists of students aged 8 to 12. As of 2017, and in addition to this initiative, the government plans to integrate financial education into curricula in primary and secondary schools. The education ministry will provide training to all the teachers who will be involved.
• In January 2017, the governments of Cambodia and Singapore signed an agreement to improve Cambodia’s expertise in technical and vocational training. Singapore’s ITE Education Services will help train 80 Cambodian master-trainers from various public training institutions that report to the labour ministry.
Financial reform: Overhauling the tax system
• Cambodia’s 2016 financial management law, promulgated in December 2015, sought to abolish the country’s simplified and estimated tax regimes and to institute a restructured system of self-assessment (a system previously known as the real regime). The estimated-tax regime had allowed businesses to negotiate their annual taxes up front, but the amount paid was often only a fraction of what similar businesses would pay under the real regime. The government believes that the restructured system can improve the efficiency of tax collection, boost government revenues, and help create a competitive business environment that is attractive to foreign investors.
• Subsequently, a 2017 financial management law, promulgated officially in December 2016, has set out to have a wide-ranging impact on the tax system in Cambodia. Its scope includes income tax, taxes on the branches of foreign companies in Cambodia, minimum levels of taxation, the withholding tax, and others. The law also encompasses an upward revision of the income limits in all personal-income tax brackets.
Tourism: Regional co-operation promoting tourism in Cambodia
• In an effort to promote tourism to both countries, Cambodia and Lao PDR have decided to set up joint tour packages. For example, Champassak in Lao PDR and Stung Treng in Cambodia can advertise their historic temples and eco-tourism spots as a package.
POLICY FOCUS
Strengthening financial education
As Cambodia’s economic growth continues to outperform its regional peers, and as financial markets in the country grow more sophisticated as part of this rapid expansion, financial education is becoming more important. For instance, financial knowledge can protect consumers from fraud and over-indebtedness. Moreover, a high degree of dollarisation continues to present a risk in Cambodia, due to the way it dampens the
4. StrUctUral pOlIcY cOUNtrY NOteS
201200 ecONOMIc OUtlOOK fOr SOUtHeaSt aSIa, cHINa aNd INdIa 2018: fOSterINg grOWtH tHrOUgH dIgItalISatION © Oecd 2018
effectiveness of monetary and exchange-rate policies (Box 4.8.1). Financial education can help to promote the greater use of local currency as a means of payment, and to encourage people to set up local-currency bank accounts and invest in local currency financial products.
Box 4.8.1. Dollarisation remains a risk in Cambodia
Foreign currency continues to be used nationwide in Cambodia, with the US dollar still widely preferred as a medium of exchange. Use of the local Cambodian riel (KHR) remains limited to rural trade in agricultural goods, and the payment of taxes and public utility bills (OECD, 2013). Dollarisation, measured by the ratio of foreign currency deposits to broad money (M2), was only 36% in 1993. The ratio grew to 70% in 2003, after a large amount of US dollars were brought into Cambodia by the United Nations Transitional Authority in Cambodia as it conducted a peace operation in the country. It further increased to 80% in 2013, due to inflows of foreign aid funding, various other types of foreign assistance and foreign direct investment (FDI).
Despite benefits such as price stability for consumers, and attracting foreign investors, the high degree of dollarisation presents a number of risks for Cambodia. These include limiting the flexibility of exchange rate policy in the event of external shocks, dampening the effectiveness of the central bank’s monetary policies due to its reduced influence over the money supply, and hampering the development of financial markets. Therefore, de-dollarisation is a desirable long-term goal.
In the past, people in Cambodia have used foreign currencies because of macroeconomic instability, and due to the country’s low level of development in its financial and banking sector and its monetary system. As the financial sector in Cambodia continues to develop and improve, the government could start encouraging more widespread use of the Cambodian riel by building confidence in the local currency, and by seeking to change people’s habit of using the US dollar. Well-planned financial education could help in achieving this goal.
Financial literacy is low among most Cambodians
Despite the development of financial markets in recent years, a report has shown that most Cambodians still do not possess basic financial knowledge. The 2014 S&P Global Financial Literacy Survey, which is supported by the World Bank and other international organisations, measures financial literacy around the globe by probing people’s knowledge of four basic financial concepts: risk diversification, inflation, numeracy and compound interest. About 40% of respondents in Cambodia were able to answer questions related to the calculation of simple and compound interest, but only 21% were able to answer questions on investment diversification (The Phnom Penh Post, 2015). Only 18% of adults are considered financially literate in Cambodia, placing the country 135th out of 144 surveyed nations, and the lowest among the Southeast Asian countries included in the survey (Figure 4.8.1).
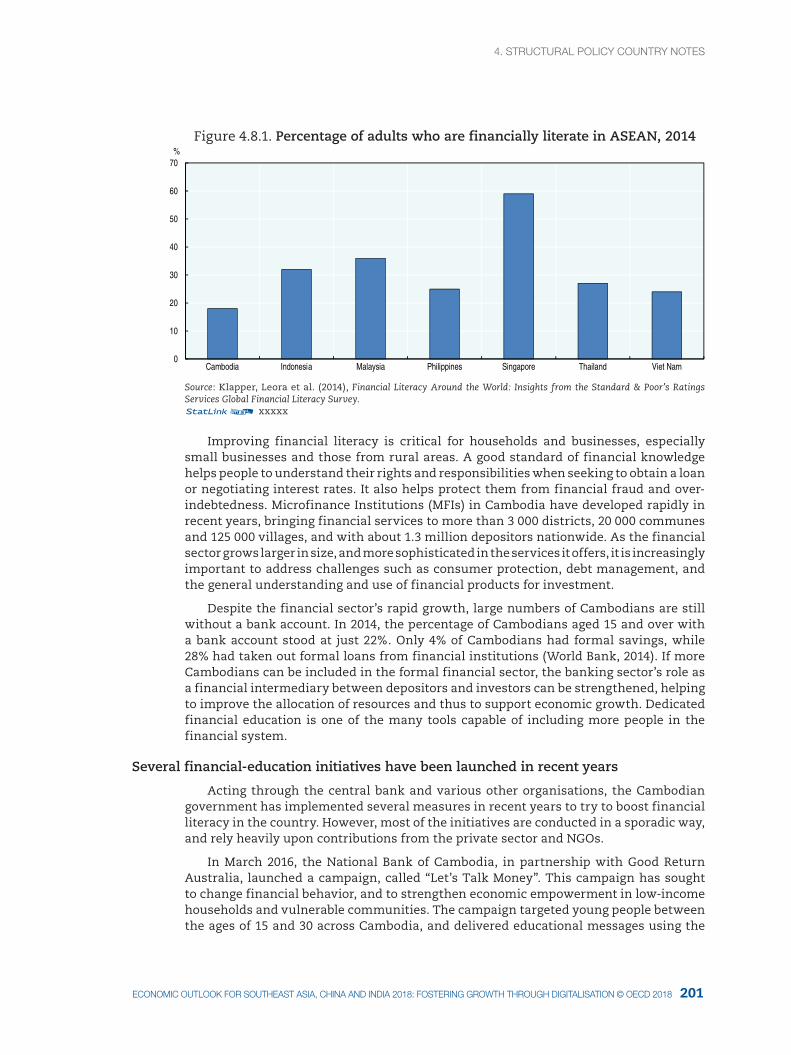
4. StrUctUral pOlIcY cOUNtrY NOteS4. StrUctUral pOlIcY cOUNtrY NOteS
201ecONOMIc OUtlOOK fOr SOUtHeaSt aSIa, cHINa aNd INdIa 2018: fOSterINg grOWtH tHrOUgH dIgItalISatION © Oecd 2018
Figure 4.8.1. Percentage of adults who are financially literate in ASEAN, 2014
0
10
20
30
40
50
60
70
Cambodia Indonesia Malaysia Philippines Singapore Thailand Viet Nam
%
Source: Klapper, Leora et al. (2014), Financial Literacy Around the World: Insights from the Standard & Poor’s Ratings Services Global Financial Literacy Survey.12 xxxxx
Improving financial literacy is critical for households and businesses, especially small businesses and those from rural areas. A good standard of financial knowledge helps people to understand their rights and responsibilities when seeking to obtain a loan or negotiating interest rates. It also helps protect them from financial fraud and over-indebtedness. Microfinance Institutions (MFIs) in Cambodia have developed rapidly in recent years, bringing financial services to more than 3 000 districts, 20 000 communes and 125 000 villages, and with about 1.3 million depositors nationwide. As the financial sector grows larger in size, and more sophisticated in the services it offers, it is increasingly important to address challenges such as consumer protection, debt management, and the general understanding and use of financial products for investment.
Despite the financial sector’s rapid growth, large numbers of Cambodians are still without a bank account. In 2014, the percentage of Cambodians aged 15 and over with a bank account stood at just 22%. Only 4% of Cambodians had formal savings, while 28% had taken out formal loans from financial institutions (World Bank, 2014). If more Cambodians can be included in the formal financial sector, the banking sector’s role as a financial intermediary between depositors and investors can be strengthened, helping to improve the allocation of resources and thus to support economic growth. Dedicated financial education is one of the many tools capable of including more people in the financial system.
Several financial-education initiatives have been launched in recent years
Acting through the central bank and various other organisations, the Cambodian government has implemented several measures in recent years to try to boost financial literacy in the country. However, most of the initiatives are conducted in a sporadic way, and rely heavily upon contributions from the private sector and NGOs.
In March 2016, the National Bank of Cambodia, in partnership with Good Return Australia, launched a campaign, called “Let’s Talk Money”. This campaign has sought to change financial behavior, and to strengthen economic empowerment in low-income households and vulnerable communities. The campaign targeted young people between the ages of 15 and 30 across Cambodia, and delivered educational messages using the
4. StrUctUral pOlIcY cOUNtrY NOteS
203202 ecONOMIc OUtlOOK fOr SOUtHeaSt aSIa, cHINa aNd INdIa 2018: fOSterINg grOWtH tHrOUgH dIgItalISatION © Oecd 2018
Internet, SMS messages on telephones, printed materials and conventional media. These messages contain four main themes: how to choose the right financial services and products, how to use them properly, how to negotiate better terms, and how to communicate with service providers and authorities. In February 2017, the Cambodian government launched a related campaign, with the same educational messages, to provide financial education to Cambodian children aged 8 to 12 by using the “Let’s Talk Money” comic book.
In July 2016, Maybank foundation, an affiliate of the Malaysian bank Malayan Banking Berhad, launched a programme to increase financial literacy among school children in Cambodia. It will provide financial lessons from trained teachers using animated cartoons, in more than 50 schools over a period of three years. The programme will teach the importance of saving money, developing positive spending habits, and making smart investments. The Australia-based international aid agency CUFA operates a similar programme. This children’s financial-literacy programme offers classroom lessons for students aged 6 to 12, as well as training and support for teachers. It includes at-home visits to these students’ families.
Challenges remain for financial education initiatives in Cambodia
First among the challenges for financial education initiatives in Cambodia, there is not enough government support for financial education, and many programmes are conducted by the private sector, or by NGOs. This may just be due to the lack of public resources, but the fact that financial education and financial literacy are not mentioned at all in Cambodia’s national strategic development plan for 2014-18 may be evidence of a lack of interest at the highest level of government.
Second, there is still room for improvement in the effectiveness of some government initiatives. In comparison to broadcasting educational messages in the media, and issuing a voluntary call for action, it may be more effective and efficient to invest in mandatory financial education for young people in the classroom, and in targeted workshops to improve financial literacy among adults. The National Bank of Cambodia is reported to be working, in co-operation with the education ministry, on a new financial-education syllabus for inclusion in the general curriculum across the country. This would be a significant step in the right direction, but so far there is no news about when this could be implemented.
Third, Cambodia currently lacks a comprehensive national strategy for financial education. Financial education is mentioned only briefly in the government’s financial-sector development strategy for the period from 2011 to 2020. While this strategy recognises that a lack of financial literacy is a problem for the development of the financial sector, especially for Microfinance Institutions due to their focus on serving the poor and less educated, no concrete project has been proposed on how to solve this problem. Having a national strategy for financial education is important for co-ordinating the efforts of different stakeholders, and for improving efficiency.
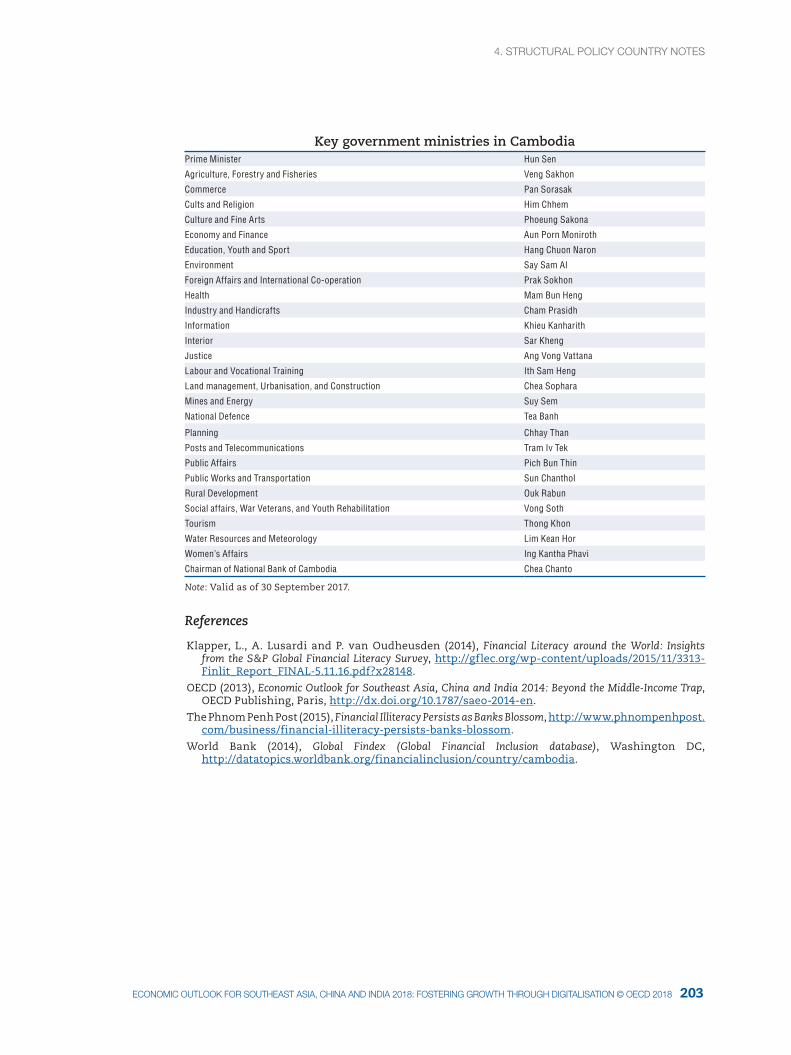
4. StrUctUral pOlIcY cOUNtrY NOteS4. StrUctUral pOlIcY cOUNtrY NOteS
203ecONOMIc OUtlOOK fOr SOUtHeaSt aSIa, cHINa aNd INdIa 2018: fOSterINg grOWtH tHrOUgH dIgItalISatION © Oecd 2018
Key government ministries in CambodiaPrime Minister Hun Sen
Agriculture, Forestry and Fisheries Veng Sakhon
Commerce Pan Sorasak
Cults and Religion Him Chhem
Culture and Fine Arts Phoeung Sakona
Economy and Finance Aun Porn Moniroth
Education, Youth and Sport Hang Chuon Naron
Environment Say Sam Al
Foreign Affairs and International Co-operation Prak Sokhon
Health Mam Bun Heng
Industry and Handicrafts Cham Prasidh
Information Khieu Kanharith
Interior Sar Kheng
Justice Ang Vong Vattana
Labour and Vocational Training Ith Sam Heng
Land management, Urbanisation, and Construction Chea Sophara
Mines and Energy Suy Sem
National Defence Tea Banh
Planning Chhay Than
Posts and Telecommunications Tram Iv Tek
Public Affairs Pich Bun Thin
Public Works and Transportation Sun Chanthol
Rural Development Ouk Rabun
Social affairs, War Veterans, and Youth Rehabilitation Vong Soth
Tourism Thong Khon
Water Resources and Meteorology Lim Kean Hor
Women’s Affairs Ing Kantha Phavi
Chairman of National Bank of Cambodia Chea Chanto
Note: Valid as of 30 September 2017.
References
Klapper, L., A. Lusardi and P. van Oudheusden (2014), Financial Literacy around the World: Insights from the S&P Global Financial Literacy Survey, http://gflec.org/wp-content/uploads/2015/11/3313-Finlit_Report_FINAL-5.11.16.pdf?x28148.
OECD (2013), Economic Outlook for Southeast Asia, China and India 2014: Beyond the Middle-Income Trap, OECD Publishing, Paris, http://dx.doi.org/10.1787/saeo-2014-en.
The Phnom Penh Post (2015), Financial Illiteracy Persists as Banks Blossom, http://www.phnompenhpost.com/business/financial-illiteracy-persists-banks-blossom.
World Bank (2014), Global Findex (Global Financial Inclusion database), Washington DC, http://datatopics.worldbank.org/financialinclusion/country/cambodia.
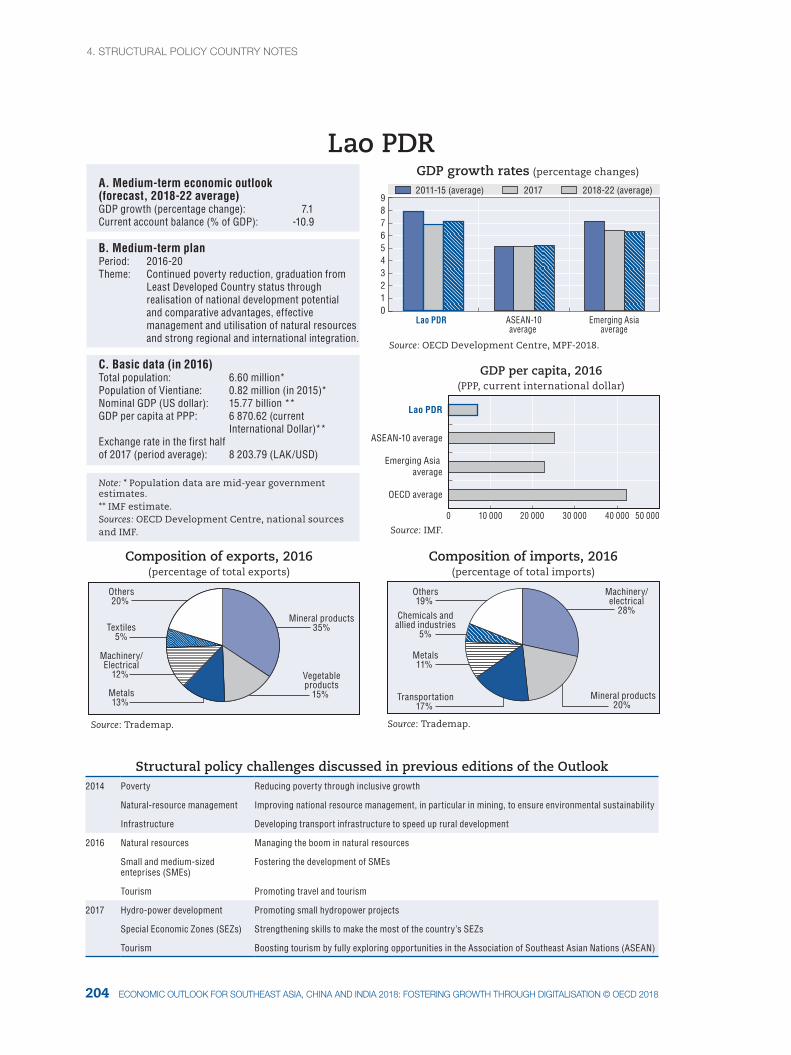
4. StrUctUral pOlIcY cOUNtrY NOteS
205204 ecONOMIc OUtlOOK fOr SOUtHeaSt aSIa, cHINa aNd INdIa 2018: fOSterINg grOWtH tHrOUgH dIgItalISatION © Oecd 2018
0 10 000 20 000 30 000 50 00040 000
2011-15 (average) 2017 2018-22 (average)
GDP growth rates (percentage changes)
0 1 2 3 4 5 6 7
9 8
Source: OECD Development Centre, MPF-2018.
ASEAN-10average
Emerging Asiaaverage
Mineral products35%
Vegetableproducts
15% Metals13%
Machinery/Electrical
12%
Textiles5%
Others20%
Composition of imports, 2016(percentage of total imports)
Machinery/electrical
28%
Mineral products20%
Transportation17%
Metals11%
Chemicals andallied industries
5%
Others19%
Source: IMF.
Source: Trademap. Source: Trademap.
Composition of exports, 2016(percentage of total exports)
Lao PDR
Lao PDR
OECD average
Emerging Asia average
A. Medium-term economic outlook (forecast, 2018-22 average) GDP growth (percentage change): 7.1Current account balance (% of GDP): -10.9
B. Medium-term plan Period: 2016-20Theme: Continued poverty reduction, graduation from Least Developed Country status through realisation of national development potential and comparative advantages, effective management and utilisation of natural resources and strong regional and international integration.
C. Basic data (in 2016) Total population: 6.60 million*Population of Vientiane: 0.82 million (in 2015)*Nominal GDP (US dollar): 15.77 billion **GDP per capita at PPP: 6 870.62 (current International Dollar)**Exchange rate in the first half of 2017 (period average): 8 203.79 (LAK/USD)
Note: * Population data are mid-year government estimates.** IMF estimate.Sources: OECD Development Centre, national sources and IMF.
ASEAN-10 average
Lao PDR
GDP per capita, 2016 (PPP, current international dollar)
Structural policy challenges discussed in previous editions of the Outlook2014 Poverty Reducing poverty through inclusive growth
Natural-resource management Improving national resource management, in particular in mining, to ensure environmental sustainability
Infrastructure Developing transport infrastructure to speed up rural development
2016 Natural resources Managing the boom in natural resources
Small and medium-sized enteprises (SMEs)
Fostering the development of SMEs
Tourism Promoting travel and tourism
2017 Hydro-power development Promoting small hydropower projects
Special Economic Zones (SEZs) Strengthening skills to make the most of the country’s SEZs
Tourism Boosting tourism by fully exploring opportunities in the Association of Southeast Asian Nations (ASEAN)
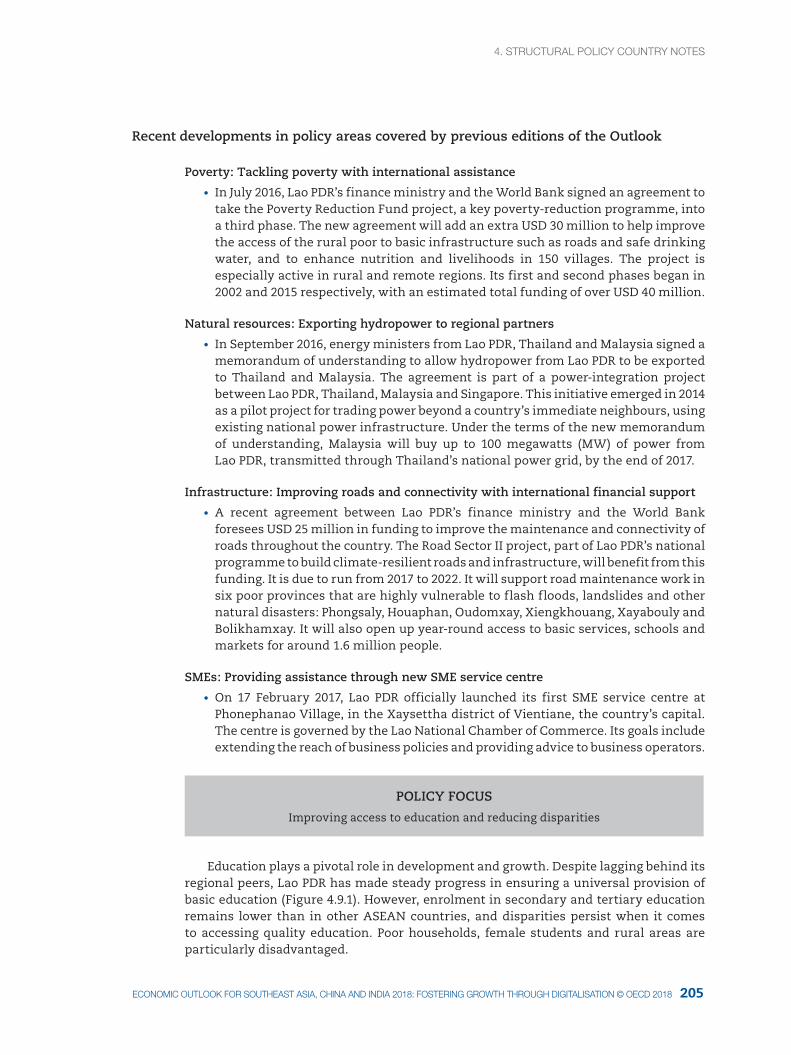
4. StrUctUral pOlIcY cOUNtrY NOteS4. StrUctUral pOlIcY cOUNtrY NOteS
205ecONOMIc OUtlOOK fOr SOUtHeaSt aSIa, cHINa aNd INdIa 2018: fOSterINg grOWtH tHrOUgH dIgItalISatION © Oecd 2018
Recent developments in policy areas covered by previous editions of the Outlook
Poverty: Tackling poverty with international assistance
• In July 2016, Lao PDR’s finance ministry and the World Bank signed an agreement to take the Poverty Reduction Fund project, a key poverty-reduction programme, into a third phase. The new agreement will add an extra USD 30 million to help improve the access of the rural poor to basic infrastructure such as roads and safe drinking water, and to enhance nutrition and livelihoods in 150 villages. The project is especially active in rural and remote regions. Its first and second phases began in 2002 and 2015 respectively, with an estimated total funding of over USD 40 million.
Natural resources: Exporting hydropower to regional partners
• In September 2016, energy ministers from Lao PDR, Thailand and Malaysia signed a memorandum of understanding to allow hydropower from Lao PDR to be exported to Thailand and Malaysia. The agreement is part of a power-integration project between Lao PDR, Thailand, Malaysia and Singapore. This initiative emerged in 2014 as a pilot project for trading power beyond a country’s immediate neighbours, using existing national power infrastructure. Under the terms of the new memorandum of understanding, Malaysia will buy up to 100 megawatts (MW) of power from Lao PDR, transmitted through Thailand’s national power grid, by the end of 2017.
Infrastructure: Improving roads and connectivity with international financial support
• A recent agreement between Lao PDR’s finance ministry and the World Bank foresees USD 25 million in funding to improve the maintenance and connectivity of roads throughout the country. The Road Sector II project, part of Lao PDR’s national programme to build climate-resilient roads and infrastructure, will benefit from this funding. It is due to run from 2017 to 2022. It will support road maintenance work in six poor provinces that are highly vulnerable to flash floods, landslides and other natural disasters: Phongsaly, Houaphan, Oudomxay, Xiengkhouang, Xayabouly and Bolikhamxay. It will also open up year-round access to basic services, schools and markets for around 1.6 million people.
SMEs: Providing assistance through new SME service centre
• On 17 February 2017, Lao PDR officially launched its first SME service centre at Phonephanao Village, in the Xaysettha district of Vientiane, the country’s capital. The centre is governed by the Lao National Chamber of Commerce. Its goals include extending the reach of business policies and providing advice to business operators.
POLICY FOCUS
Improving access to education and reducing disparities
Education plays a pivotal role in development and growth. Despite lagging behind its regional peers, Lao PDR has made steady progress in ensuring a universal provision of basic education (Figure 4.9.1). However, enrolment in secondary and tertiary education remains lower than in other ASEAN countries, and disparities persist when it comes to accessing quality education. Poor households, female students and rural areas are particularly disadvantaged.
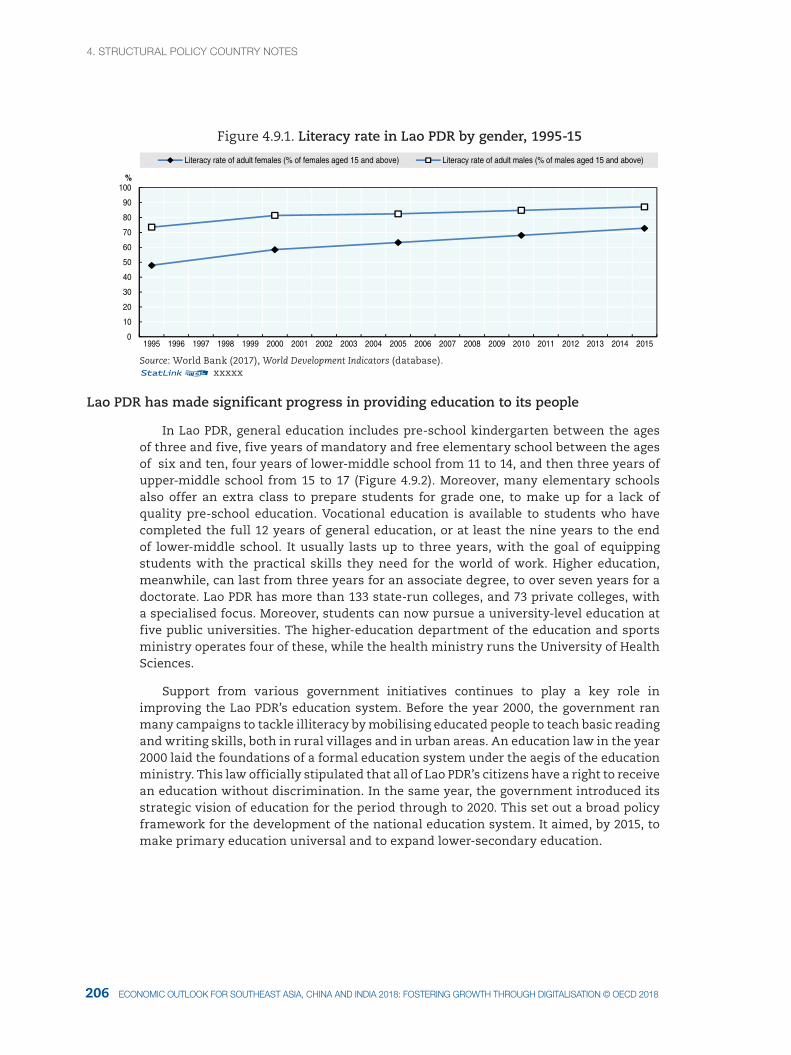
4. StrUctUral pOlIcY cOUNtrY NOteS
207206 ecONOMIc OUtlOOK fOr SOUtHeaSt aSIa, cHINa aNd INdIa 2018: fOSterINg grOWtH tHrOUgH dIgItalISatION © Oecd 2018
Figure 4.9.1. Literacy rate in Lao PDR by gender, 1995-15
0
10
20
30
40
50
60
70
80
90
100
1995 1996 1997 1998 1999 2000 2001 2002 2003 2004 2005 2006 2007 2008 2009 2010 2011 2012 2013 2014 2015
%
Literacy rate of adult females (% of females aged 15 and above) Literacy rate of adult males (% of males aged 15 and above)
Source: World Bank (2017), World Development Indicators (database).12 xxxxx
Lao PDR has made significant progress in providing education to its people
In Lao PDR, general education includes pre-school kindergarten between the ages of three and five, five years of mandatory and free elementary school between the ages of six and ten, four years of lower-middle school from 11 to 14, and then three years of upper-middle school from 15 to 17 (Figure 4.9.2). Moreover, many elementary schools also offer an extra class to prepare students for grade one, to make up for a lack of quality pre-school education. Vocational education is available to students who have completed the full 12 years of general education, or at least the nine years to the end of lower-middle school. It usually lasts up to three years, with the goal of equipping students with the practical skills they need for the world of work. Higher education, meanwhile, can last from three years for an associate degree, to over seven years for a doctorate. Lao PDR has more than 133 state-run colleges, and 73 private colleges, with a specialised focus. Moreover, students can now pursue a university-level education at five public universities. The higher-education department of the education and sports ministry operates four of these, while the health ministry runs the University of Health Sciences.
Support from various government initiatives continues to play a key role in improving the Lao PDR’s education system. Before the year 2000, the government ran many campaigns to tackle illiteracy by mobilising educated people to teach basic reading and writing skills, both in rural villages and in urban areas. An education law in the year 2000 laid the foundations of a formal education system under the aegis of the education ministry. This law officially stipulated that all of Lao PDR’s citizens have a right to receive an education without discrimination. In the same year, the government introduced its strategic vision of education for the period through to 2020. This set out a broad policy framework for the development of the national education system. It aimed, by 2015, to make primary education universal and to expand lower-secondary education.
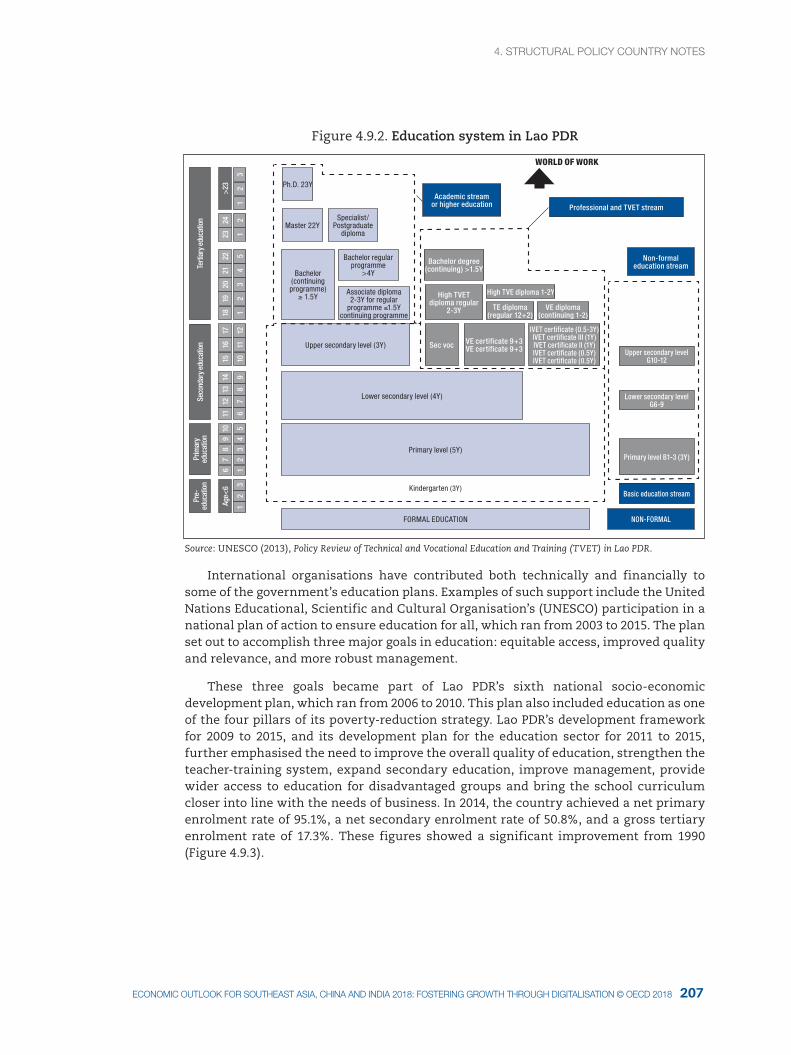
4. StrUctUral pOlIcY cOUNtrY NOteS4. StrUctUral pOlIcY cOUNtrY NOteS
207ecONOMIc OUtlOOK fOr SOUtHeaSt aSIa, cHINa aNd INdIa 2018: fOSterINg grOWtH tHrOUgH dIgItalISatION © Oecd 2018
Figure 4.9.2. Education system in Lao PDR
WORLD OF WORK
Academic stream or higher education
Ph.D. 23Y
Master 22YSpecialist/
Postgraduate diploma
Bachelor regular programme
>4Y
Associate diploma 2-3Y for regular
programme ≤1.5Y continuing programme
Bachelor (continuing programme)
≥ 1.5Y
Professional and TVET stream
Non-formal education stream
Basic education stream
NON-FORMAL
Pre-
educ
atio
n
Age<
6
Prim
ary
educ
atio
nSe
cond
ary e
duca
tion
Terti
ary e
duca
tion
>23 2
13
21
2423
21
34
5
1918
2021
22
1110
127
68
92
13
45
21
3
76
89
1012
1113
1416
1517
Upper secondary level (3Y)
Lower secondary level (4Y)
Primary level (5Y)
FORMAL EDUCATION
Kindergarten (3Y)
Sec voc VE certificate 9+3 VE certificate 9+3
IVET certificate (0.5-3Y)IVET certificate III (1Y)IVET certificate II (1Y)IVET certificate (0.5Y)IVET certificate (0.5Y)
Bachelor degree (continuing) >1.5Y
High TVE diploma 1-2Y
TE diploma (regular 12+2)
VE diploma (continuing 1-2)
High TVET diploma regular
2-3Y
Upper secondary level G10-12
Lower secondary level G6-9
Primary level B1-3 (3Y)
Source: UNESCO (2013), Policy Review of Technical and Vocational Education and Training (TVET) in Lao PDR.
International organisations have contributed both technically and financially to some of the government’s education plans. Examples of such support include the United Nations Educational, Scientific and Cultural Organisation’s (UNESCO) participation in a national plan of action to ensure education for all, which ran from 2003 to 2015. The plan set out to accomplish three major goals in education: equitable access, improved quality and relevance, and more robust management.
These three goals became part of Lao PDR’s sixth national socio-economic development plan, which ran from 2006 to 2010. This plan also included education as one of the four pillars of its poverty-reduction strategy. Lao PDR’s development framework for 2009 to 2015, and its development plan for the education sector for 2011 to 2015, further emphasised the need to improve the overall quality of education, strengthen the teacher-training system, expand secondary education, improve management, provide wider access to education for disadvantaged groups and bring the school curriculum closer into line with the needs of business. In 2014, the country achieved a net primary enrolment rate of 95.1%, a net secondary enrolment rate of 50.8%, and a gross tertiary enrolment rate of 17.3%. These figures showed a significant improvement from 1990 (Figure 4.9.3).
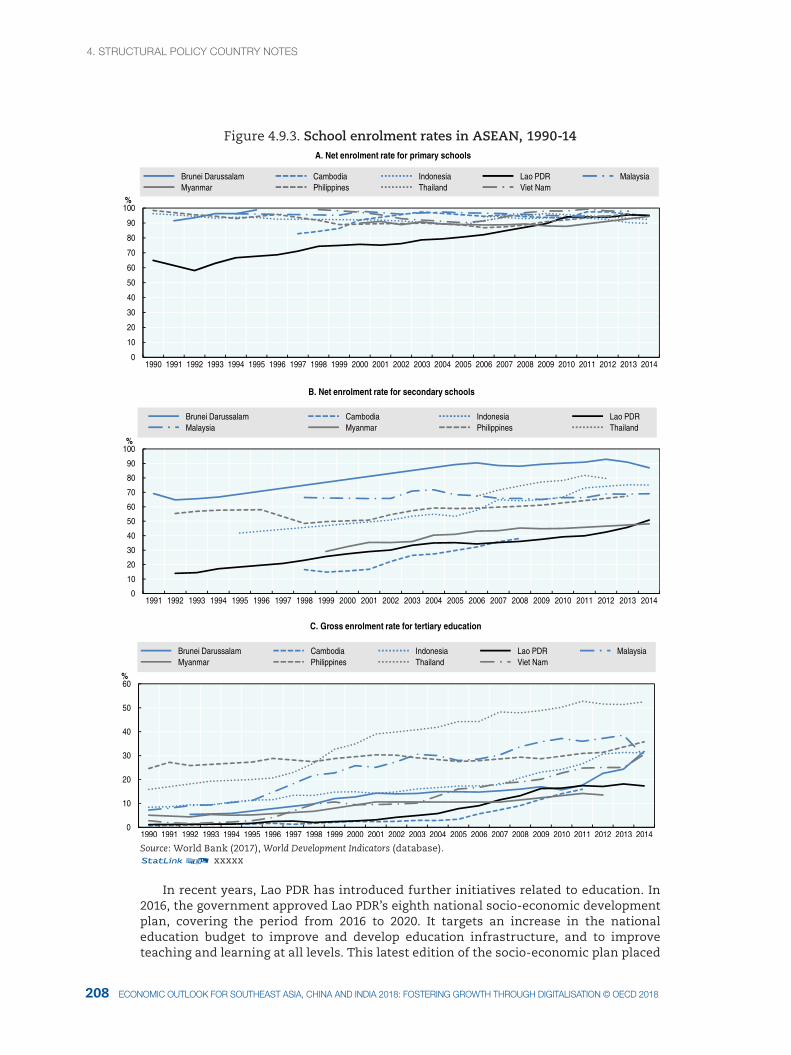
4. StrUctUral pOlIcY cOUNtrY NOteS
209208 ecONOMIc OUtlOOK fOr SOUtHeaSt aSIa, cHINa aNd INdIa 2018: fOSterINg grOWtH tHrOUgH dIgItalISatION © Oecd 2018
Figure 4.9.3. School enrolment rates in ASEAN, 1990-14
0
10
20
30
40
50
60
70
80
90
100
1990 1991 1992 1993 1994 1995 1996 1997 1998 1999 2000 2001 2002 2003 2004 2005 2006 2007 2008 2009 2010 2011 2012 2013 2014
%
Brunei Darussalam Cambodia Indonesia Lao PDR MalaysiaMyanmar Philippines Thailand Viet Nam
A. Net enrolment rate for primary schools
0
10
20
30
40
50
60
70
80
90
100
1991 1992 1993 1994 1995 1996 1997 1998 1999 2000 2001 2002 2003 2004 2005 2006 2007 2008 2009 2010 2011 2012 2013 2014
%
Brunei Darussalam Cambodia Indonesia Lao PDRMalaysia Myanmar Philippines Thailand
B. Net enrolment rate for secondary schools
0
10
20
30
40
50
60
1990 1991 1992 1993 1994 1995 1996 1997 1998 1999 2000 2001 2002 2003 2004 2005 2006 2007 2008 2009 2010 2011 2012 2013 2014
%
Brunei Darussalam Cambodia Indonesia Lao PDR MalaysiaMyanmar Philippines Thailand Viet Nam
C. Gross enrolment rate for tertiary education
Source: World Bank (2017), World Development Indicators (database).12 xxxxx
In recent years, Lao PDR has introduced further initiatives related to education. In 2016, the government approved Lao PDR’s eighth national socio-economic development plan, covering the period from 2016 to 2020. It targets an increase in the national education budget to improve and develop education infrastructure, and to improve teaching and learning at all levels. This latest edition of the socio-economic plan placed
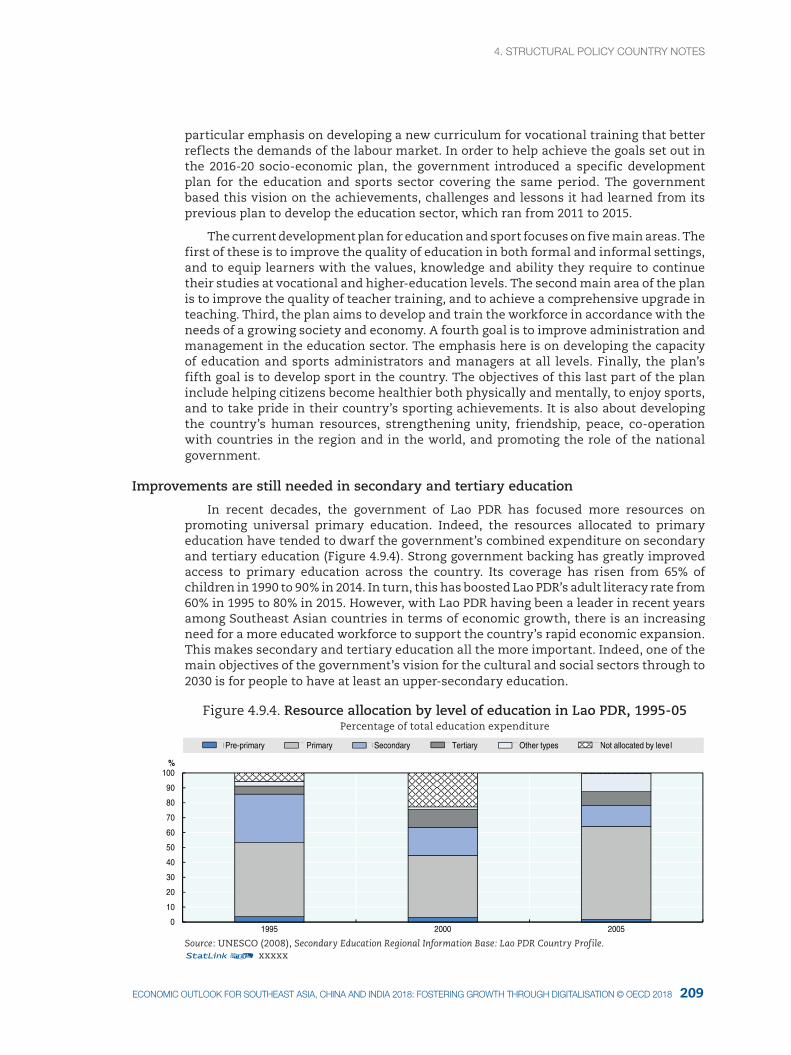
4. StrUctUral pOlIcY cOUNtrY NOteS4. StrUctUral pOlIcY cOUNtrY NOteS
209ecONOMIc OUtlOOK fOr SOUtHeaSt aSIa, cHINa aNd INdIa 2018: fOSterINg grOWtH tHrOUgH dIgItalISatION © Oecd 2018
particular emphasis on developing a new curriculum for vocational training that better reflects the demands of the labour market. In order to help achieve the goals set out in the 2016-20 socio-economic plan, the government introduced a specific development plan for the education and sports sector covering the same period. The government based this vision on the achievements, challenges and lessons it had learned from its previous plan to develop the education sector, which ran from 2011 to 2015.
The current development plan for education and sport focuses on five main areas. The first of these is to improve the quality of education in both formal and informal settings, and to equip learners with the values, knowledge and ability they require to continue their studies at vocational and higher-education levels. The second main area of the plan is to improve the quality of teacher training, and to achieve a comprehensive upgrade in teaching. Third, the plan aims to develop and train the workforce in accordance with the needs of a growing society and economy. A fourth goal is to improve administration and management in the education sector. The emphasis here is on developing the capacity of education and sports administrators and managers at all levels. Finally, the plan’s fifth goal is to develop sport in the country. The objectives of this last part of the plan include helping citizens become healthier both physically and mentally, to enjoy sports, and to take pride in their country’s sporting achievements. It is also about developing the country’s human resources, strengthening unity, friendship, peace, co-operation with countries in the region and in the world, and promoting the role of the national government.
Improvements are still needed in secondary and tertiary education
In recent decades, the government of Lao PDR has focused more resources on promoting universal primary education. Indeed, the resources allocated to primary education have tended to dwarf the government’s combined expenditure on secondary and tertiary education (Figure 4.9.4). Strong government backing has greatly improved access to primary education across the country. Its coverage has risen from 65% of children in 1990 to 90% in 2014. In turn, this has boosted Lao PDR’s adult literacy rate from 60% in 1995 to 80% in 2015. However, with Lao PDR having been a leader in recent years among Southeast Asian countries in terms of economic growth, there is an increasing need for a more educated workforce to support the country’s rapid economic expansion. This makes secondary and tertiary education all the more important. Indeed, one of the main objectives of the government’s vision for the cultural and social sectors through to 2030 is for people to have at least an upper-secondary education.
Figure 4.9.4. Resource allocation by level of education in Lao PDR, 1995-05Percentage of total education expenditure
0
10
20
30
40
50
60
70
80
90
100
1995 2000 2005
%
Pre-primary Primary Secondary Tertiary Other types Not allocated by level
Source: UNESCO (2008), Secondary Education Regional Information Base: Lao PDR Country Profile.12 xxxxx
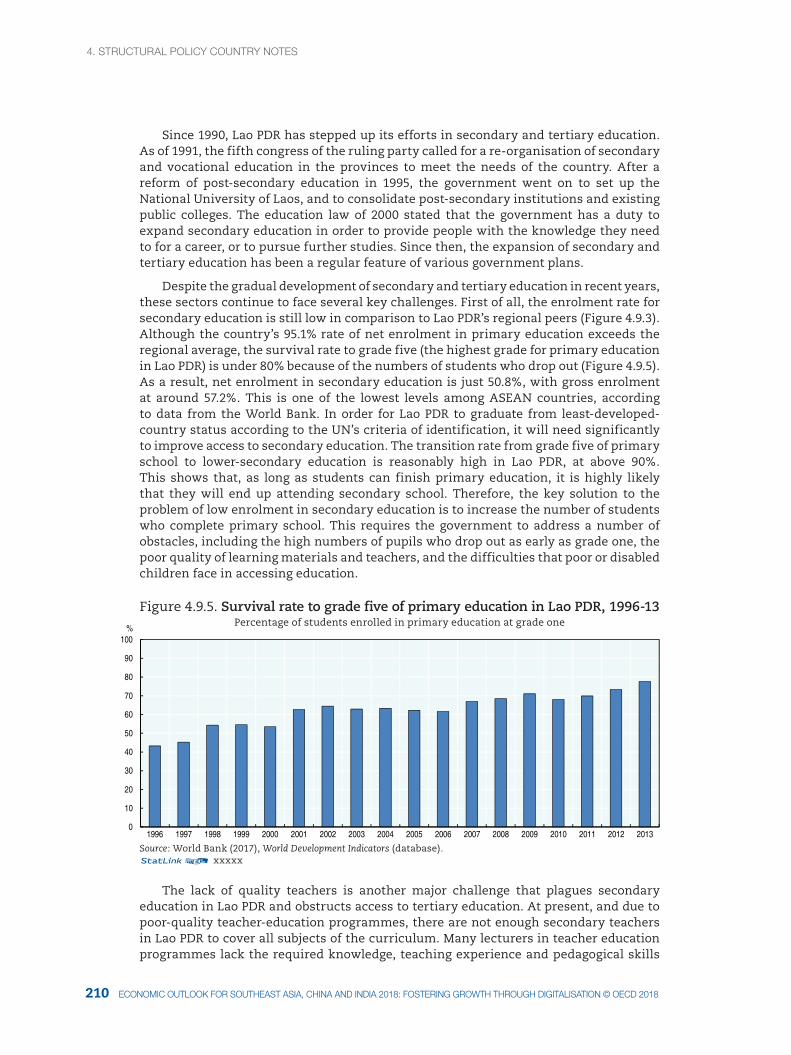
4. StrUctUral pOlIcY cOUNtrY NOteS
211210 ecONOMIc OUtlOOK fOr SOUtHeaSt aSIa, cHINa aNd INdIa 2018: fOSterINg grOWtH tHrOUgH dIgItalISatION © Oecd 2018
Since 1990, Lao PDR has stepped up its efforts in secondary and tertiary education. As of 1991, the fifth congress of the ruling party called for a re-organisation of secondary and vocational education in the provinces to meet the needs of the country. After a reform of post-secondary education in 1995, the government went on to set up the National University of Laos, and to consolidate post-secondary institutions and existing public colleges. The education law of 2000 stated that the government has a duty to expand secondary education in order to provide people with the knowledge they need to for a career, or to pursue further studies. Since then, the expansion of secondary and tertiary education has been a regular feature of various government plans.
Despite the gradual development of secondary and tertiary education in recent years, these sectors continue to face several key challenges. First of all, the enrolment rate for secondary education is still low in comparison to Lao PDR’s regional peers (Figure 4.9.3). Although the country’s 95.1% rate of net enrolment in primary education exceeds the regional average, the survival rate to grade five (the highest grade for primary education in Lao PDR) is under 80% because of the numbers of students who drop out (Figure 4.9.5). As a result, net enrolment in secondary education is just 50.8%, with gross enrolment at around 57.2%. This is one of the lowest levels among ASEAN countries, according to data from the World Bank. In order for Lao PDR to graduate from least-developed-country status according to the UN’s criteria of identification, it will need significantly to improve access to secondary education. The transition rate from grade five of primary school to lower-secondary education is reasonably high in Lao PDR, at above 90%. This shows that, as long as students can finish primary education, it is highly likely that they will end up attending secondary school. Therefore, the key solution to the problem of low enrolment in secondary education is to increase the number of students who complete primary school. This requires the government to address a number of obstacles, including the high numbers of pupils who drop out as early as grade one, the poor quality of learning materials and teachers, and the difficulties that poor or disabled children face in accessing education.
Figure 4.9.5. Survival rate to grade five of primary education in Lao PDR, 1996-13Percentage of students enrolled in primary education at grade one
0
10
20
30
40
50
60
70
80
90
100
1996 1997 1998 1999 2000 2001 2002 2003 2004 2005 2006 2007 2008 2009 2010 2011 2012 2013
%
Source: World Bank (2017), World Development Indicators (database).12 xxxxx
The lack of quality teachers is another major challenge that plagues secondary education in Lao PDR and obstructs access to tertiary education. At present, and due to poor-quality teacher-education programmes, there are not enough secondary teachers in Lao PDR to cover all subjects of the curriculum. Many lecturers in teacher education programmes lack the required knowledge, teaching experience and pedagogical skills
4. StrUctUral pOlIcY cOUNtrY NOteS4. StrUctUral pOlIcY cOUNtrY NOteS
211ecONOMIc OUtlOOK fOr SOUtHeaSt aSIa, cHINa aNd INdIa 2018: fOSterINg grOWtH tHrOUgH dIgItalISatION © Oecd 2018
to deliver the curricula they are supposed to teach. Moreover, pre-service and in-service teacher-education programmes are not fully aligned with the requirements of the actual school curriculum, and student teachers in pre-service training lack opportunities to practice what they have learned and to improve their teaching skills through trainee work placements. To address this issue, it is vital to improve the pre-service and in-service teacher education programmes by improving the quality of the teacher-trainers themselves, by better aligning teacher-education curricula with school curricula, and by giving student teachers more opportunities for practice during the training process. In addition, it would be useful to develop competency-based national standards for teachers as a benchmark against which to measure and improve their performance.
For tertiary education, the most notable challenge is the misalignment between what is taught in the universities and what is required by the labour market. Currently, higher-education curricula and textbooks are not consistent with the demands of the labour market. Surveys of employers and graduates in 2014 showed, in general, that the quality of graduate students did not meet the demands of employers. Graduate students still lack professional skills, including competencies of management and analytical work. A mismatch between education and market demand is common among developing countries. To address this problem, the government should encourage closer co-operation between universities and industry so that the educators and students have up-to-date information about what the market needs. Work experience and workplace learning are key to allowing students to develop relevant skills, and should be an integral part of curricula. Students should be able to gain academic credit for their work experience, and its quality should be assured. Such experience is precious for students, as it allows them to acquire the practical skills they need and to be better prepared for employment by the time they graduate. Moreover, the government should strengthen vocational education, and improve its quality, so that more students are willing to enroll. This offers an alternative path to those secondary-school graduates who are keen to place a greater emphasis on practical working skills.
Disparities exist in access to quality education
In order to achieve its objective of universal access to quality education, the government of Lao PDR needs to address the disparities in access to education that currently exist between rich and poor, male and female students, students of different ethnicities, and residents of urban and rural areas.
Despite rapid economic growth in recent years, Lao PDR is still predominantly a rural country with a large agricultural sector. Therefore, reducing poverty remains a top priority for the government. The financial costs involved in studying are one of the principal causes of disparities in accessing education. In order to increase access to general education, the government began offering primary education free of charge in 1996. Secondary education and vocational education became free following the education law of 2000.
However, households still have to bear other education costs that are not financed by the government. These include direct costs such as purchasing a school uniform and study equipment, paying for transport to and from school, and providing pocket money. More importantly still, there are also indirect expenses to overcome, such as the opportunity cost of sending a child to school rather than to work. The additional costs may be insignificant for relatively well-off households, but they can be a considerable burden for poor families. Indeed, poorer families often live in remote rural areas, far away from the nearest schools, and where children often have to support their family financially by working from an early age. In a bid to keep the direct and indirect costs
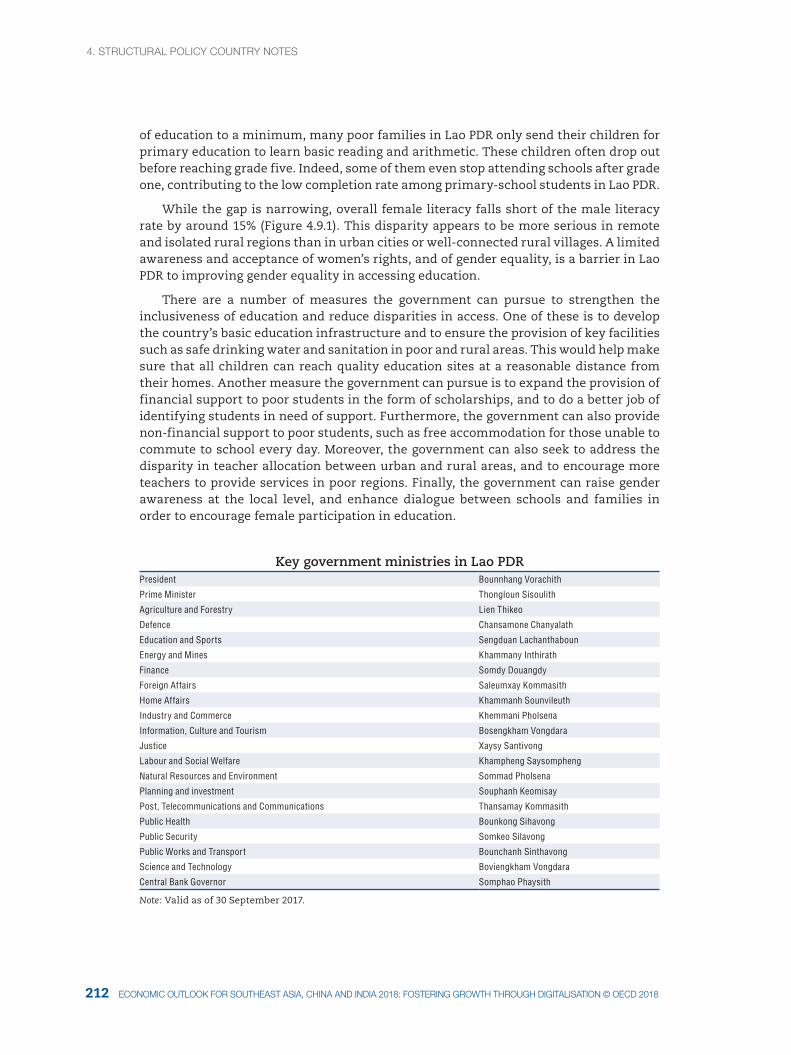
4. StrUctUral pOlIcY cOUNtrY NOteS
213212 ecONOMIc OUtlOOK fOr SOUtHeaSt aSIa, cHINa aNd INdIa 2018: fOSterINg grOWtH tHrOUgH dIgItalISatION © Oecd 2018
of education to a minimum, many poor families in Lao PDR only send their children for primary education to learn basic reading and arithmetic. These children often drop out before reaching grade five. Indeed, some of them even stop attending schools after grade one, contributing to the low completion rate among primary-school students in Lao PDR.
While the gap is narrowing, overall female literacy falls short of the male literacy rate by around 15% (Figure 4.9.1). This disparity appears to be more serious in remote and isolated rural regions than in urban cities or well-connected rural villages. A limited awareness and acceptance of women’s rights, and of gender equality, is a barrier in Lao PDR to improving gender equality in accessing education.
There are a number of measures the government can pursue to strengthen the inclusiveness of education and reduce disparities in access. One of these is to develop the country’s basic education infrastructure and to ensure the provision of key facilities such as safe drinking water and sanitation in poor and rural areas. This would help make sure that all children can reach quality education sites at a reasonable distance from their homes. Another measure the government can pursue is to expand the provision of financial support to poor students in the form of scholarships, and to do a better job of identifying students in need of support. Furthermore, the government can also provide non-financial support to poor students, such as free accommodation for those unable to commute to school every day. Moreover, the government can also seek to address the disparity in teacher allocation between urban and rural areas, and to encourage more teachers to provide services in poor regions. Finally, the government can raise gender awareness at the local level, and enhance dialogue between schools and families in order to encourage female participation in education.
Key government ministries in Lao PDRPresident Bounnhang Vorachith
Prime Minister Thongloun Sisoulith
Agriculture and Forestry Lien Thikeo
Defence Chansamone Chanyalath
Education and Sports Sengduan Lachanthaboun
Energy and Mines Khammany Inthirath
Finance Somdy Douangdy
Foreign Affairs Saleumxay Kommasith
Home Affairs Khammanh Sounvileuth
Industry and Commerce Khemmani Pholsena
Information, Culture and Tourism Bosengkham Vongdara
Justice Xaysy Santivong
Labour and Social Welfare Khampheng Saysompheng
Natural Resources and Environment Sommad Pholsena
Planning and investment Souphanh Keomisay
Post, Telecommunications and Communications Thansamay Kommasith
Public Health Bounkong Sihavong
Public Security Somkeo Silavong
Public Works and Transport Bounchanh Sinthavong
Science and Technology Boviengkham Vongdara
Central Bank Governor Somphao Phaysith
Note: Valid as of 30 September 2017.
4. StrUctUral pOlIcY cOUNtrY NOteS4. StrUctUral pOlIcY cOUNtrY NOteS
213ecONOMIc OUtlOOK fOr SOUtHeaSt aSIa, cHINa aNd INdIa 2018: fOSterINg grOWtH tHrOUgH dIgItalISatION © Oecd 2018
References
UNESCO (2015), Education for All 2015 National Review Report: Lao PDR, United Nations Educational, Scientific and Cultural Organization, Paris.
UNESCO (2013), Policy Review of TVET in Lao PDR, United Nations Educational, Scientific and Cultural Organization, Paris.
UNESCO (2008), Secondary Education Regional Information Base: Lao PDR Country Profile, United Nations Educational, Scientific and Cultural Organization, Paris.
World Bank (2017), World Development Indicators (database), World Bank, Washington, DC.
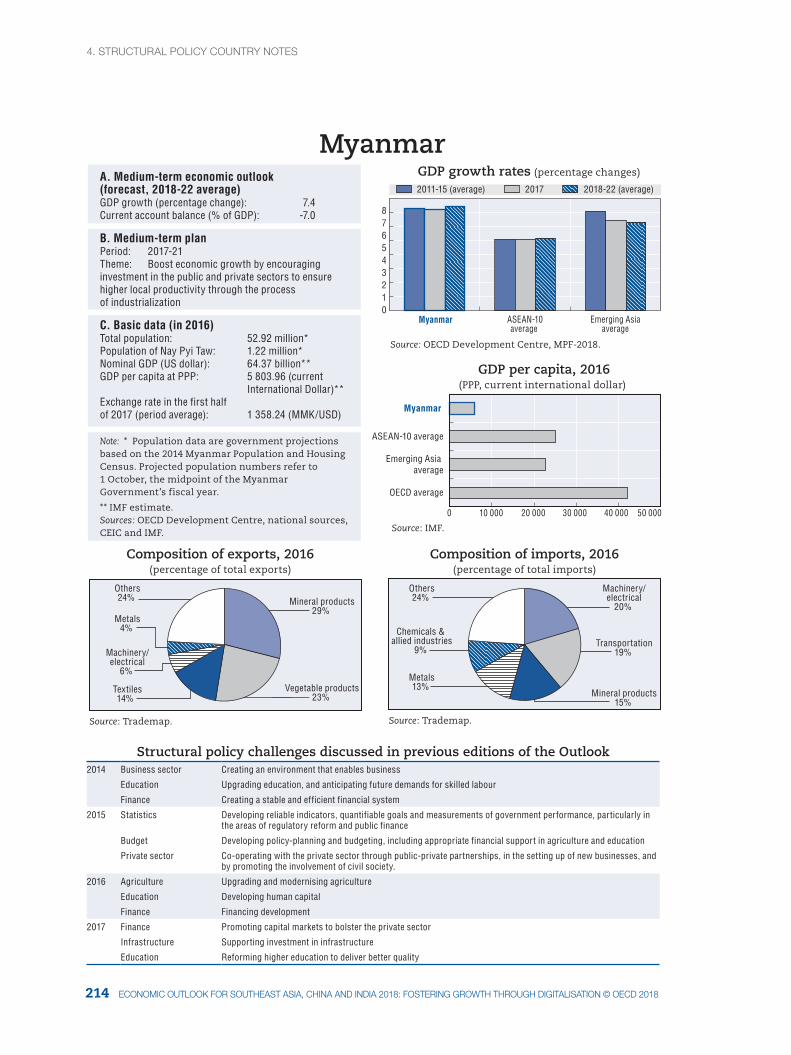
4. StrUctUral pOlIcY cOUNtrY NOteS
215214 ecONOMIc OUtlOOK fOr SOUtHeaSt aSIa, cHINa aNd INdIa 2018: fOSterINg grOWtH tHrOUgH dIgItalISatION © Oecd 2018
0 10 000 20 000 30 000 40 000 50 000
Mineral products29%
Vegetable products23%
Textiles14%
Machinery/electrical
6%
Metals4%
Others24%
Machinery/electrical
20%
Transportation19%
Mineral products15%
Metals13%
Chemicals & allied industries
9%
Others24%
Myanmar
2011-15 (average) 2017 2018-22 (average)
GDP growth rates (percentage changes)
ASEAN-10average
Emerging Asiaaverage
0 1 2 3 4 5 6 7 8
Source: OECD Development Centre, MPF-2018.
Source: IMF.
Source: Trademap. Source: Trademap.
OECD average
Emerging Asia average
ASEAN-10 average
Myanmar
Composition of exports, 2016(percentage of total exports)
Composition of imports, 2016(percentage of total imports)
MyanmarA. Medium-term economic outlook (forecast, 2018-22 average) GDP growth (percentage change): 7.4Current account balance (% of GDP): -7.0
B. Medium-term planPeriod: 2017-21Theme: Boost economic growth by encouraging investment in the public and private sectors to ensure higher local productivity through the process of industrialization
C. Basic data (in 2016)Total population: 52.92 million* Population of Nay Pyi Taw: 1.22 million*Nominal GDP (US dollar): 64.37 billion**GDP per capita at PPP: 5 803.96 (current International Dollar)**Exchange rate in the first half of 2017 (period average): 1 358.24 (MMK/USD)
Note: * Population data are government projections based on the 2014 Myanmar Population and Housing Census. Projected population numbers refer to 1 October, the midpoint of the Myanmar Government’s fiscal year.
** IMF estimate. Sources: OECD Development Centre, national sources,CEIC and IMF.
GDP per capita, 2016(PPP, current international dollar)
Structural policy challenges discussed in previous editions of the Outlook2014 Business sector Creating an environment that enables business
Education Upgrading education, and anticipating future demands for skilled labour
Finance Creating a stable and efficient financial system
2015 Statistics Developing reliable indicators, quantifiable goals and measurements of government performance, particularly in the areas of regulatory reform and public finance
Budget Developing policy-planning and budgeting, including appropriate financial support in agriculture and education
Private sector Co-operating with the private sector through public-private partnerships, in the setting up of new businesses, and by promoting the involvement of civil society.
2016 Agriculture Upgrading and modernising agriculture
Education Developing human capital
Finance Financing development
2017 Finance Promoting capital markets to bolster the private sector
Infrastructure Supporting investment in infrastructure
Education Reforming higher education to deliver better quality
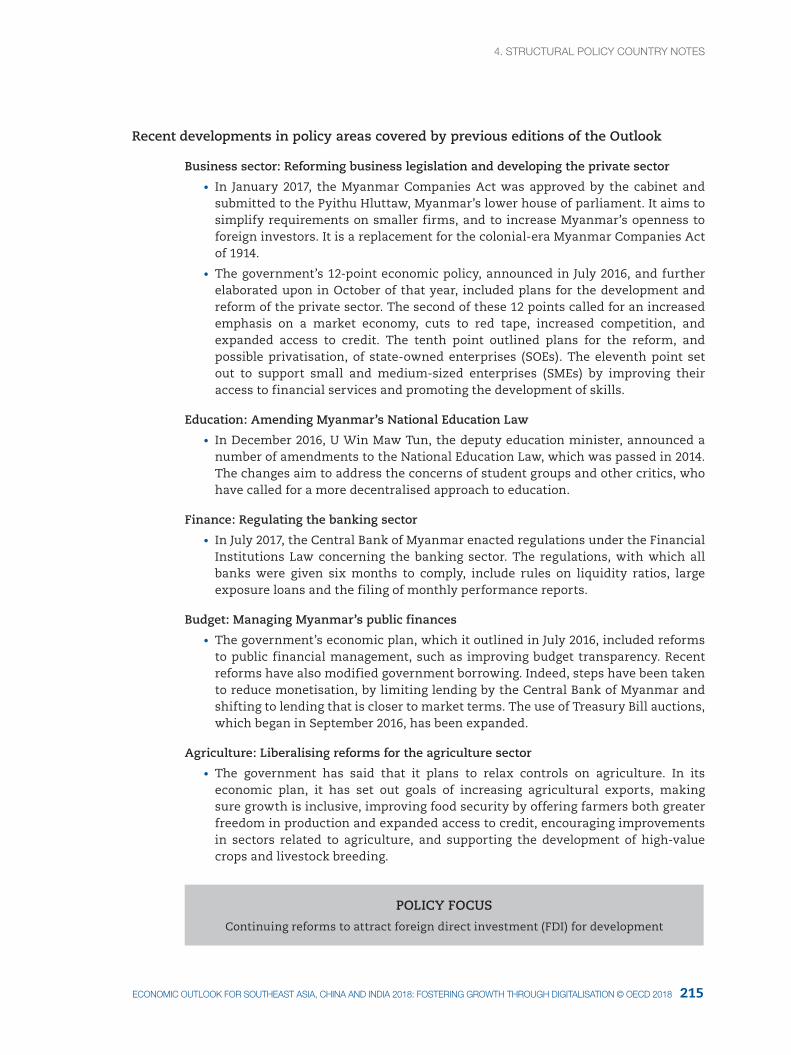
4. StrUctUral pOlIcY cOUNtrY NOteS4. StrUctUral pOlIcY cOUNtrY NOteS
215ecONOMIc OUtlOOK fOr SOUtHeaSt aSIa, cHINa aNd INdIa 2018: fOSterINg grOWtH tHrOUgH dIgItalISatION © Oecd 2018
Recent developments in policy areas covered by previous editions of the Outlook
Business sector: Reforming business legislation and developing the private sector
• In January 2017, the Myanmar Companies Act was approved by the cabinet and submitted to the Pyithu Hluttaw, Myanmar’s lower house of parliament. It aims to simplify requirements on smaller firms, and to increase Myanmar’s openness to foreign investors. It is a replacement for the colonial-era Myanmar Companies Act of 1914.
• The government’s 12-point economic policy, announced in July 2016, and further elaborated upon in October of that year, included plans for the development and reform of the private sector. The second of these 12 points called for an increased emphasis on a market economy, cuts to red tape, increased competition, and expanded access to credit. The tenth point outlined plans for the reform, and possible privatisation, of state-owned enterprises (SOEs). The eleventh point set out to support small and medium-sized enterprises (SMEs) by improving their access to financial services and promoting the development of skills.
Education: Amending Myanmar’s National Education Law
• In December 2016, U Win Maw Tun, the deputy education minister, announced a number of amendments to the National Education Law, which was passed in 2014. The changes aim to address the concerns of student groups and other critics, who have called for a more decentralised approach to education.
Finance: Regulating the banking sector
• In July 2017, the Central Bank of Myanmar enacted regulations under the Financial Institutions Law concerning the banking sector. The regulations, with which all banks were given six months to comply, include rules on liquidity ratios, large exposure loans and the filing of monthly performance reports.
Budget: Managing Myanmar’s public finances
• The government’s economic plan, which it outlined in July 2016, included reforms to public financial management, such as improving budget transparency. Recent reforms have also modified government borrowing. Indeed, steps have been taken to reduce monetisation, by limiting lending by the Central Bank of Myanmar and shifting to lending that is closer to market terms. The use of Treasury Bill auctions, which began in September 2016, has been expanded.
Agriculture: Liberalising reforms for the agriculture sector
• The government has said that it plans to relax controls on agriculture. In its economic plan, it has set out goals of increasing agricultural exports, making sure growth is inclusive, improving food security by offering farmers both greater freedom in production and expanded access to credit, encouraging improvements in sectors related to agriculture, and supporting the development of high-value crops and livestock breeding.
POLICY FOCUS
Continuing reforms to attract foreign direct investment (FDI) for development
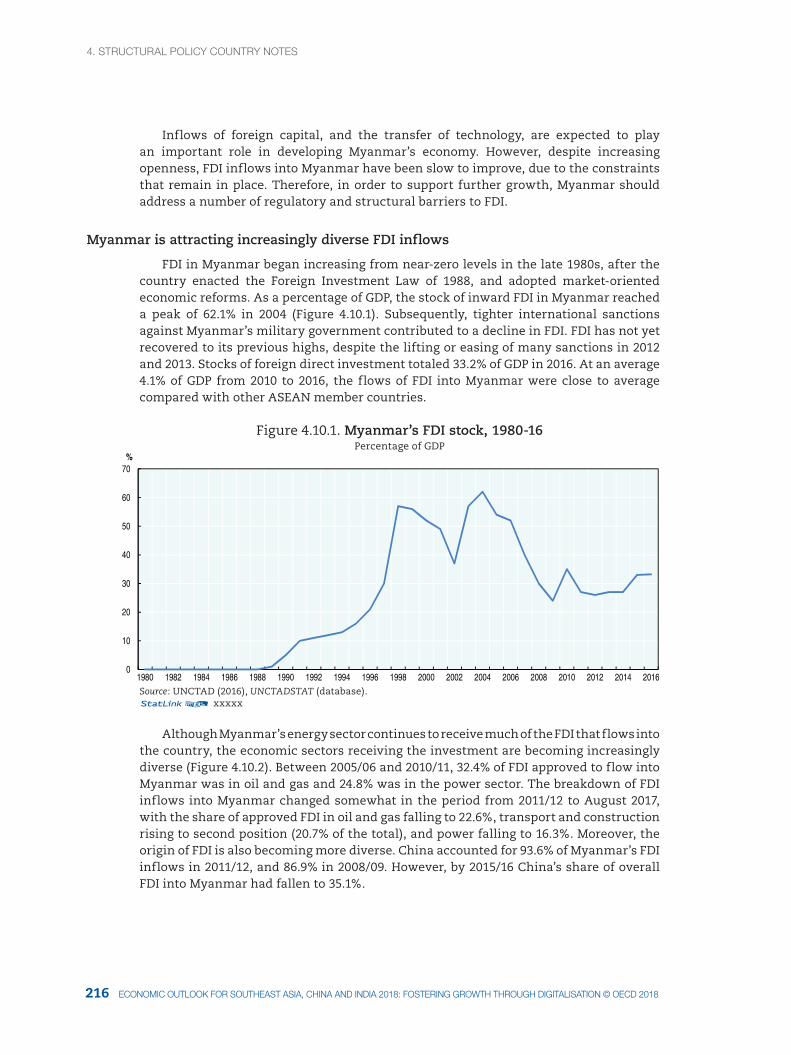
4. StrUctUral pOlIcY cOUNtrY NOteS
217216 ecONOMIc OUtlOOK fOr SOUtHeaSt aSIa, cHINa aNd INdIa 2018: fOSterINg grOWtH tHrOUgH dIgItalISatION © Oecd 2018
Inflows of foreign capital, and the transfer of technology, are expected to play an important role in developing Myanmar’s economy. However, despite increasing openness, FDI inflows into Myanmar have been slow to improve, due to the constraints that remain in place. Therefore, in order to support further growth, Myanmar should address a number of regulatory and structural barriers to FDI.
Myanmar is attracting increasingly diverse FDI inflows
FDI in Myanmar began increasing from near-zero levels in the late 1980s, after the country enacted the Foreign Investment Law of 1988, and adopted market-oriented economic reforms. As a percentage of GDP, the stock of inward FDI in Myanmar reached a peak of 62.1% in 2004 (Figure 4.10.1). Subsequently, tighter international sanctions against Myanmar’s military government contributed to a decline in FDI. FDI has not yet recovered to its previous highs, despite the lifting or easing of many sanctions in 2012 and 2013. Stocks of foreign direct investment totaled 33.2% of GDP in 2016. At an average 4.1% of GDP from 2010 to 2016, the flows of FDI into Myanmar were close to average compared with other ASEAN member countries.
Figure 4.10.1. Myanmar’s FDI stock, 1980-16Percentage of GDP
0
10
20
30
40
50
60
70
1980 1982 1984 1986 1988 1990 1992 1994 1996 1998 2000 2002 2004 2006 2008 2010 2012 2014 2016
%
Source: UNCTAD (2016), UNCTADSTAT (database).12 xxxxx
Although Myanmar’s energy sector continues to receive much of the FDI that flows into the country, the economic sectors receiving the investment are becoming increasingly diverse (Figure 4.10.2). Between 2005/06 and 2010/11, 32.4% of FDI approved to flow into Myanmar was in oil and gas and 24.8% was in the power sector. The breakdown of FDI inflows into Myanmar changed somewhat in the period from 2011/12 to August 2017, with the share of approved FDI in oil and gas falling to 22.6%, transport and construction rising to second position (20.7% of the total), and power falling to 16.3%. Moreover, the origin of FDI is also becoming more diverse. China accounted for 93.6% of Myanmar’s FDI inflows in 2011/12, and 86.9% in 2008/09. However, by 2015/16 China’s share of overall FDI into Myanmar had fallen to 35.1%.
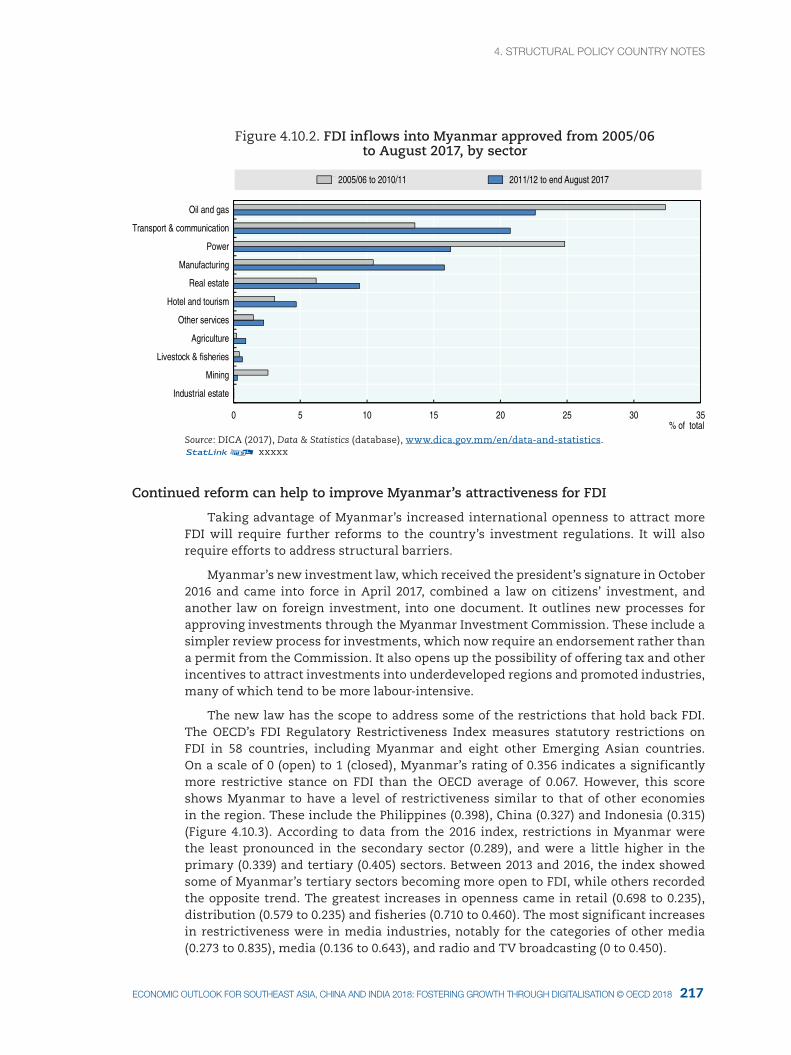
4. StrUctUral pOlIcY cOUNtrY NOteS4. StrUctUral pOlIcY cOUNtrY NOteS
217ecONOMIc OUtlOOK fOr SOUtHeaSt aSIa, cHINa aNd INdIa 2018: fOSterINg grOWtH tHrOUgH dIgItalISatION © Oecd 2018
Figure 4.10.2. FDI inflows into Myanmar approved from 2005/06 to August 2017, by sector
0 5 10 15 20 25 30 35
Industrial estate
Mining
Livestock & fisheries
Agriculture
Other services
Hotel and tourism
Real estate
Manufacturing
Power
Transport & communication
Oil and gas
% of total
2005/06 to 2010/11 2011/12 to end August 2017
Source: DICA (2017), Data & Statistics (database), www.dica.gov.mm/en/data-and-statistics. 12 xxxxx
Continued reform can help to improve Myanmar’s attractiveness for FDI
Taking advantage of Myanmar’s increased international openness to attract more FDI will require further reforms to the country’s investment regulations. It will also require efforts to address structural barriers.
Myanmar’s new investment law, which received the president’s signature in October 2016 and came into force in April 2017, combined a law on citizens’ investment, and another law on foreign investment, into one document. It outlines new processes for approving investments through the Myanmar Investment Commission. These include a simpler review process for investments, which now require an endorsement rather than a permit from the Commission. It also opens up the possibility of offering tax and other incentives to attract investments into underdeveloped regions and promoted industries, many of which tend to be more labour-intensive.
The new law has the scope to address some of the restrictions that hold back FDI. The OECD’s FDI Regulatory Restrictiveness Index measures statutory restrictions on FDI in 58 countries, including Myanmar and eight other Emerging Asian countries. On a scale of 0 (open) to 1 (closed), Myanmar’s rating of 0.356 indicates a significantly more restrictive stance on FDI than the OECD average of 0.067. However, this score shows Myanmar to have a level of restrictiveness similar to that of other economies in the region. These include the Philippines (0.398), China (0.327) and Indonesia (0.315) (Figure 4.10.3). According to data from the 2016 index, restrictions in Myanmar were the least pronounced in the secondary sector (0.289), and were a little higher in the primary (0.339) and tertiary (0.405) sectors. Between 2013 and 2016, the index showed some of Myanmar’s tertiary sectors becoming more open to FDI, while others recorded the opposite trend. The greatest increases in openness came in retail (0.698 to 0.235), distribution (0.579 to 0.235) and fisheries (0.710 to 0.460). The most significant increases in restrictiveness were in media industries, notably for the categories of other media (0.273 to 0.835), media (0.136 to 0.643), and radio and TV broadcasting (0 to 0.450).
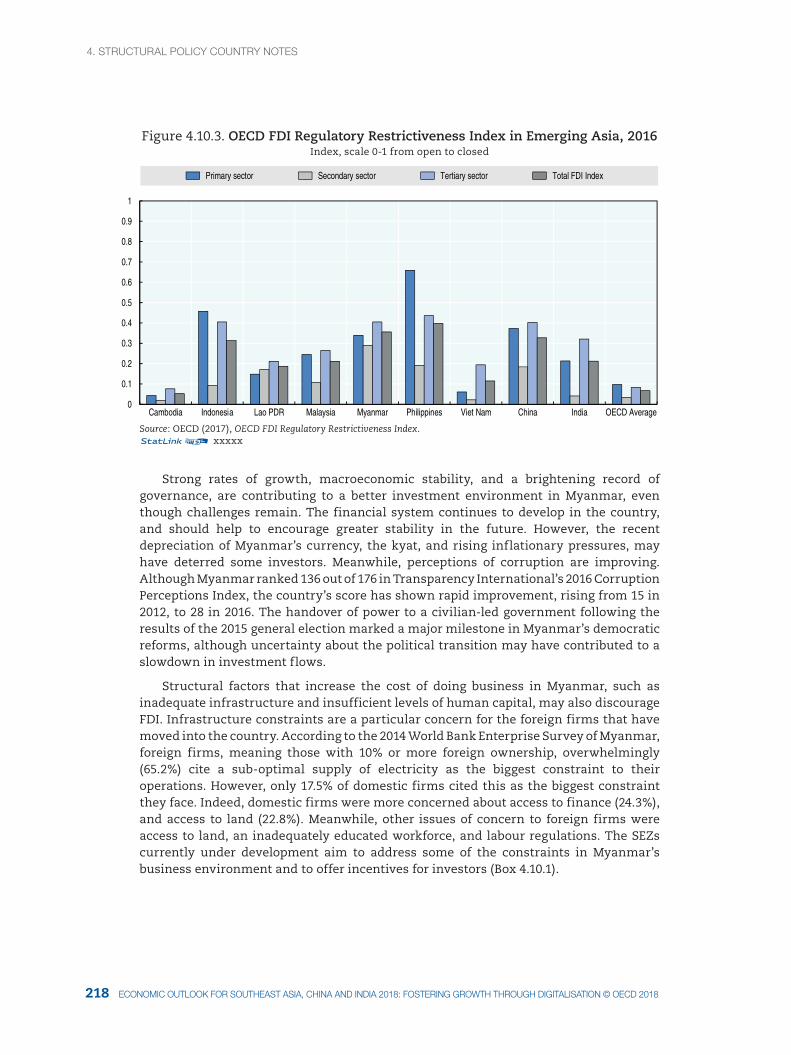
4. StrUctUral pOlIcY cOUNtrY NOteS
219218 ecONOMIc OUtlOOK fOr SOUtHeaSt aSIa, cHINa aNd INdIa 2018: fOSterINg grOWtH tHrOUgH dIgItalISatION © Oecd 2018
Figure 4.10.3. OECD FDI Regulatory Restrictiveness Index in Emerging Asia, 2016Index, scale 0-1 from open to closed
0
0.1
0.2
0.3
0.4
0.5
0.6
0.7
0.8
0.9
1
Cambodia Indonesia Lao PDR Malaysia Myanmar Philippines Viet Nam China India OECD Average
Primary sector Secondary sector Tertiary sector Total FDI Index
Source: OECD (2017), OECD FDI Regulatory Restrictiveness Index.12 xxxxx
Strong rates of growth, macroeconomic stability, and a brightening record of governance, are contributing to a better investment environment in Myanmar, even though challenges remain. The financial system continues to develop in the country, and should help to encourage greater stability in the future. However, the recent depreciation of Myanmar’s currency, the kyat, and rising inflationary pressures, may have deterred some investors. Meanwhile, perceptions of corruption are improving. Although Myanmar ranked 136 out of 176 in Transparency International’s 2016 Corruption Perceptions Index, the country’s score has shown rapid improvement, rising from 15 in 2012, to 28 in 2016. The handover of power to a civilian-led government following the results of the 2015 general election marked a major milestone in Myanmar’s democratic reforms, although uncertainty about the political transition may have contributed to a slowdown in investment flows.
Structural factors that increase the cost of doing business in Myanmar, such as inadequate infrastructure and insufficient levels of human capital, may also discourage FDI. Infrastructure constraints are a particular concern for the foreign firms that have moved into the country. According to the 2014 World Bank Enterprise Survey of Myanmar, foreign firms, meaning those with 10% or more foreign ownership, overwhelmingly (65.2%) cite a sub-optimal supply of electricity as the biggest constraint to their operations. However, only 17.5% of domestic firms cited this as the biggest constraint they face. Indeed, domestic firms were more concerned about access to finance (24.3%), and access to land (22.8%). Meanwhile, other issues of concern to foreign firms were access to land, an inadequately educated workforce, and labour regulations. The SEZs currently under development aim to address some of the constraints in Myanmar’s business environment and to offer incentives for investors (Box 4.10.1).
4. StrUctUral pOlIcY cOUNtrY NOteS4. StrUctUral pOlIcY cOUNtrY NOteS
219ecONOMIc OUtlOOK fOr SOUtHeaSt aSIa, cHINa aNd INdIa 2018: fOSterINg grOWtH tHrOUgH dIgItalISatION © Oecd 2018
Box 4.10.1. Special Economic Zones (SEZs) will play a role in attracting further FDI inflows
SEZs are being developed under the 2014 Special Economic Zone Law, and are set to play a significant role in attracting investment into industry and services in Myanmar. The law allows for the establishment of free zones, which are deemed to be situated outside of the country. Their main focus is on export markets, although they do contain manufacturing, transportation and wholesale areas. It also allows for the establishment of promotion zones, whose main focus is the domestic market, and for a range of other types of zones. Incentives offered include exemptions on income, commercial and value-added taxes, as well as on customs duties and import taxes. These tax incentives are subject to certain conditions and to defined maximum time periods. The management, administration and supervision of SEZs are the responsibility of the Central Working Body and Management Committee, formed under the law.
Three SEZs are currently under development, at Thilawa, in the Yangon Region, Dawei, in the Tanintharyi Region, and Kyauk Phyu, in Rakhine State. Phase one of the development of the Kyauk Phyu Special Economic Zone began in 2014, developed by a Singapore-based consortium led by CPG Consultants. The Dawei Special Economic Zone, which is set to be the largest industrial complex in Asia when it is completed, is being developed through a joint venture by Italian-Thai Development Public Company Limited and Rojana Industrial Park Public Company Limited. The Thilawa Special Economic Zone is the furtherst-advanced SEZ in the country. It is being developed by Myanmar Japan Thilawa Development Limited, a company owned jointly by the governments of Myanmar and Japan and private consortia from the two countries. By late 2016, USD 903 million in foreign investment had poured in to the Thilawa SEZ, with 75 businesses from 17 countries receiving approval to invest, and 19 factories already in operation. Most foreign investment has gone into industrial production (76.5%), followed by transport (8%), services (7.5%), trading (6%) and real estate (2%).
While SEZs are not an appropriate substitute for improving the attractiveness of the investment climate generally, they can be useful as testing grounds for new policy strategies, and for attracting more FDI to Myanmar. As things currently stand, however, the current legal framework in Myanmar may be limiting opportunities for such flexibility and experimentation. For example, the Thilawa SEZ Management Committee is made up of representatives from the Central Bank of Myanmar and from central and regional government, but without representation from the private sector. A lack of autonomy and responsiveness to businesses has also created challenges for SEZs in other countries in the region (OECD, 2014).
One advantage of SEZs is that they can encourage technological upgrades in host economies thanks both to the spill-over of new ideas, and to the new direct linkages that can emerge between domestic suppliers and customers. The development of local infrastructure, and the provision of training and business-advisory services, may help in maximising their impact. An effective enforcement of contracts, as well as protection for intellectual property rights, are also necessary to encourage business relationships and licensing activities. Some countries, such as Malaysia, have also offered incentives to encourage SMEs to supply foreign firms. Moreover, training for workers, combined with requirements in the SEZ law on hiring Myanmar citizens, could help to develop human capital.
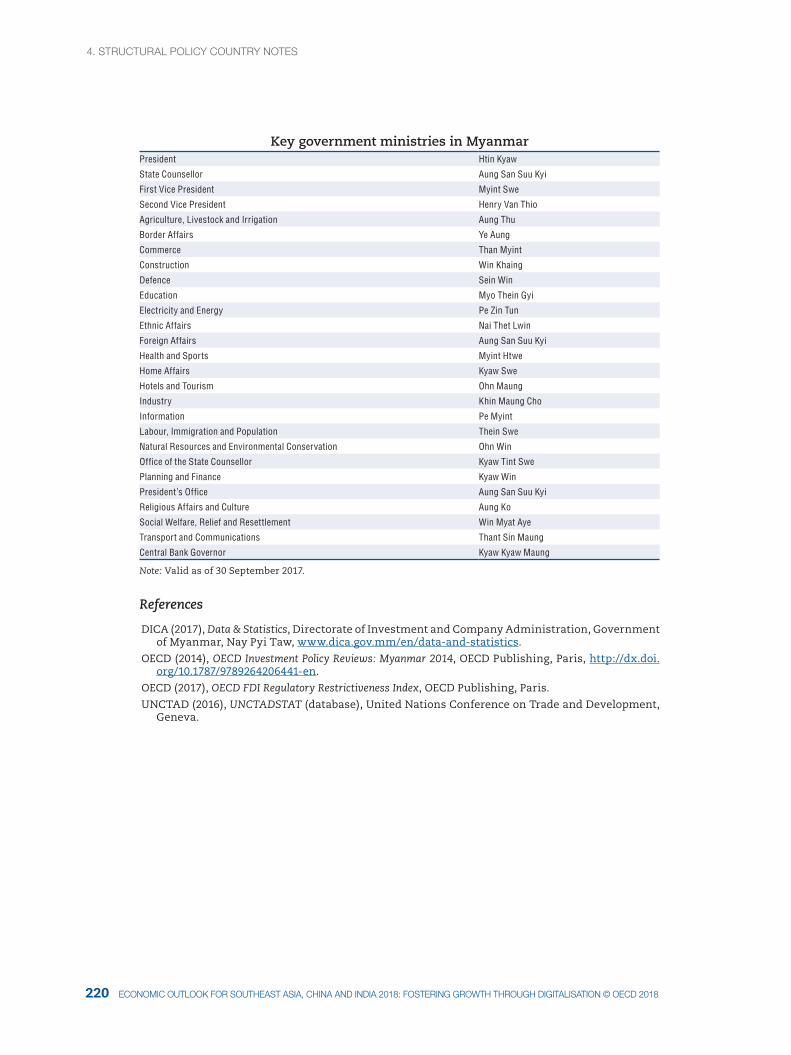
4. StrUctUral pOlIcY cOUNtrY NOteS
221220 ecONOMIc OUtlOOK fOr SOUtHeaSt aSIa, cHINa aNd INdIa 2018: fOSterINg grOWtH tHrOUgH dIgItalISatION © Oecd 2018
Key government ministries in MyanmarPresident Htin Kyaw
State Counsellor Aung San Suu Kyi
First Vice President Myint Swe
Second Vice President Henry Van Thio
Agriculture, Livestock and Irrigation Aung Thu
Border Affairs Ye Aung
Commerce Than Myint
Construction Win Khaing
Defence Sein Win
Education Myo Thein Gyi
Electricity and Energy Pe Zin Tun
Ethnic Affairs Nai Thet Lwin
Foreign Affairs Aung San Suu Kyi
Health and Sports Myint Htwe
Home Affairs Kyaw Swe
Hotels and Tourism Ohn Maung
Industry Khin Maung Cho
Information Pe Myint
Labour, Immigration and Population Thein Swe
Natural Resources and Environmental Conservation Ohn Win
Office of the State Counsellor Kyaw Tint Swe
Planning and Finance Kyaw Win
President’s Office Aung San Suu Kyi
Religious Affairs and Culture Aung Ko
Social Welfare, Relief and Resettlement Win Myat Aye
Transport and Communications Thant Sin Maung
Central Bank Governor Kyaw Kyaw Maung
Note: Valid as of 30 September 2017.
References
DICA (2017), Data & Statistics, Directorate of Investment and Company Administration, Government of Myanmar, Nay Pyi Taw, www.dica.gov.mm/en/data-and-statistics.
OECD (2014), OECD Investment Policy Reviews: Myanmar 2014, OECD Publishing, Paris, http://dx.doi.org/10.1787/9789264206441-en.
OECD (2017), OECD FDI Regulatory Restrictiveness Index, OECD Publishing, Paris.
UNCTAD (2016), UNCTADSTAT (database), United Nations Conference on Trade and Development, Geneva.

4. StrUctUral pOlIcY cOUNtrY NOteS
221ecONOMIc OUtlOOK fOr SOUtHeaSt aSIa, cHINa aNd INdIa 2018: fOSterINg grOWtH tHrOUgH dIgItalISatION © Oecd 2018
CHINA AND
INDIACHINA AND INDIA
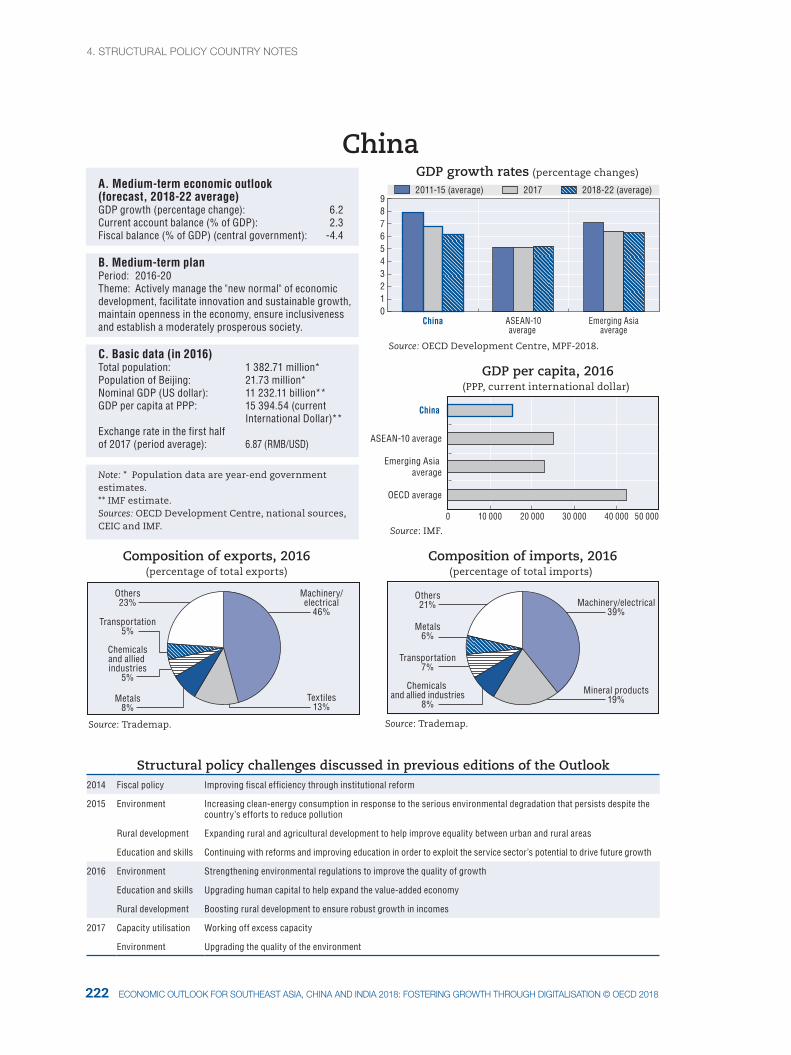
4. StrUctUral pOlIcY cOUNtrY NOteS
223222 ecONOMIc OUtlOOK fOr SOUtHeaSt aSIa, cHINa aNd INdIa 2018: fOSterINg grOWtH tHrOUgH dIgItalISatION © Oecd 2018
0
Machinery/electrical
46%
Textiles13%
Metals8%
Chemicalsand allied industries
5%
Transportation5%
Others23% Machinery/electrical
39%
Mineral products19%
Chemicals and allied industries
8%
Transportation7%
Metals6%
Others21%
China
2011-15 (average) 2017 2018-22 (average)
GDP growth rates (percentage changes)
ASEAN-10average
Emerging Asiaaverage
0 1 2 3 4 5 6 7
9
Source: OECD Development Centre, MPF-2018.
8
10 000 20 000 30 000 40 000 50 000
Source: IMF.
OECD average
Emerging Asia average
ASEAN-10 average
China
GDP per capita, 2016(PPP, current international dollar)
Source: Trademap. Source: Trademap.
Composition of exports, 2016(percentage of total exports)
Composition of imports, 2016(percentage of total imports)
ChinaA. Medium-term economic outlook (forecast, 2018-22 average) GDP growth (percentage change): 6.2Current account balance (% of GDP): 2.3Fiscal balance (% of GDP) (central government): -4.4
B. Medium-term planPeriod: 2016-20Theme: Actively manage the "new normal" of economic development, facilitate innovation and sustainable growth, maintain openness in the economy, ensure inclusiveness and establish a moderately prosperous society.
C. Basic data (in 2016) Total population: 1 382.71 million*Population of Beijing: 21.73 million*Nominal GDP (US dollar): 11 232.11 billion**GDP per capita at PPP: 15 394.54 (current International Dollar)**Exchange rate in the first half of 2017 (period average): 6.87 (RMB/USD)
Note: * Population data are year-end government estimates.** IMF estimate.Sources: OECD Development Centre, national sources, CEIC and IMF.
Structural policy challenges discussed in previous editions of the Outlook2014 Fiscal policy Improving fiscal efficiency through institutional reform
2015 Environment Increasing clean-energy consumption in response to the serious environmental degradation that persists despite the country’s efforts to reduce pollution
Rural development Expanding rural and agricultural development to help improve equality between urban and rural areas
Education and skills Continuing with reforms and improving education in order to exploit the service sector’s potential to drive future growth
2016 Environment Strengthening environmental regulations to improve the quality of growth
Education and skills Upgrading human capital to help expand the value-added economy
Rural development Boosting rural development to ensure robust growth in incomes
2017 Capacity utilisation Working off excess capacity
Environment Upgrading the quality of the environment
4. StrUctUral pOlIcY cOUNtrY NOteS4. StrUctUral pOlIcY cOUNtrY NOteS
223ecONOMIc OUtlOOK fOr SOUtHeaSt aSIa, cHINa aNd INdIa 2018: fOSterINg grOWtH tHrOUgH dIgItalISatION © Oecd 2018
Recent developments in policy areas covered by previous editions of the Outlook
Fiscal policy: Allowing businesses to claim VAT refunds on inputs, and clarifying the responsibilities of local and central government
• The conversion of the business tax into a value-added tax (VAT), which was completed in 2016, is considered to be the most significant tax reform in China in recent decades. Historically, manufacturing and other industrial firms were already included in the VAT system so that they could claim a refund of the value added tax they paid on their inputs and services firms could claim a VAT refund also on their goods inputs. Now, instead of business tax, services firms are also subject to VAT. As a result, all firms can now claim a VAT refund on their services inputs. This reform is part of the Chinese government’s efforts to ensure a successful transition from being a manufacturing-oriented economy to a service-oriented one. Its role as part of these efforts is to create a level playing field in input taxation.
• Over the past two decades, there has been a mismatch between local governments’ expenditure mandates and their revenues, including both their own revenues and funds allocated to them by the central government. This has posed a challenge in terms of the relationships between different levels of government. In August 2016, guidelines from the State Council kick-started a long awaited fiscal reform, which clarified the spending responsibilities of the national and local levels of government, and sought to reduce overlap. The reform will increase the central government’s spending responsibilities in the areas of public security and equality, while giving local governments the authority to manage a number of public services that meet local needs.
Environment: Implementing strict standards and new rules on licensing and taxation
• In December 2016, China’s State Council published a national plan for improving the environment, for the period of the country’s 13th five-year plan, which runs from 2016-20. It vowed to improve the quality of environment by implementing the strictest of environmental protection policies, by cleaning up pollution in the air, water and soil, and by reducing the concentration of atmospheric particulate matter of less than 2.5 micrometers in diameter.
• China’s Ministry of Environmental Protection has published a new policy on the discharge of pollutants. It requires operators to obtain a discharge licence for all stationary sources of pollution by 2020. These emitters of pollution, which include power plants fired by fossil fuels, are the principal sources of pollution China. By issuing discharge licences, environmental authorities will be able to specify the location and number of these stationary sources of pollution. They will likewise identify how, and in what direction, these sources emit pollutants. This measure will also allow authorities to set ceilings on the variety, concentration and amount of pollutants.
• In late 2016, the standing committee of China’s National People’s Congress promulgated a tax law on environmental protection, which will come into effect on 1 January 2018. This new law will abolish the existing system, under which local governments collect discharge fees on various pollutants, and will replace it with an environmental protection tax. The new law should limit the ability of local authorities to provide special treatment to enterprises located within their jurisdictions.
4. StrUctUral pOlIcY cOUNtrY NOteS
225224 ecONOMIc OUtlOOK fOr SOUtHeaSt aSIa, cHINa aNd INdIa 2018: fOSterINg grOWtH tHrOUgH dIgItalISatION © Oecd 2018
Rural development: Changing rural land rights
• In October 2016, the State Council published guidelines on separating the ownership of rural land from land-contracting and land-management rights. Under the new system of property rights, the ownership of land belongs to the government, the right of land-contracting belongs to farmers, and farmers can delegate the right of land management to other parties. These other parties can then operate and utilise farmlands, providing economic benefits to the farmers in exchange.
• In recent years, the agriculture ministry has been pushing ahead with shareholding reform, aiming to replace the existing system of collectively-owned rural assets with a shareholding-based cooperative system. According to guidelines released jointly, in early 2017, by the Communist Party of China’s Central Committee and the State Council, farmers can now voluntarily turn their rights in collective operating assets into shares, and can acquire any corresponding revenue.
Education: Expanding the reach of secondary schooling, and improving quality
• China aims to increase the nationwide coverage of secondary education to at least 90% by 2020, from 87.5% in 2016, according to guidelines from the education ministry released in April 2017. Despite a rise in the gross enrolment rate in the country’s high schools, poor areas in central and western China still face a shortage of educational resources, and they experience slower development in the sectors of secondary and vocational education, than do other parts of the country. The plan calls for more spending, especially in the nine regions that the government in Beijing has flagged as being prone to poverty.
• In early 2017, China’s State Council issued a plan on educational development for the period of the country’s 2016-20 five-year plan. It outlined several key goals, including improving the quality and fairness of education, and optimising the allocation of resources. The plan calls for improvements in ideological and moral education, and for efforts to raise students’ sense of social responsibility and their practical skills and abilities in innovation. It also specifies that more resources should go to poor and remote areas, and that equal access for the children of migrant workers and impoverished families should be guaranteed.
Capacity utilisation: Paring back substandard production
• An executive meeting of the State Council in May 2017 confirmed that China will continue to retire sub-standard production capacity, especially in steel and iron, coal-mining, and coal-fired power plants, to keep up with targets set for the year. The government work report in March of 2017 set out targets for cutting over-capacity in steel and iron by 50 million tonnes, and coal mining by 150 million tonnes, within the year, and also to phase out over 50 million kilowatts of coal-fired power-generation capacity. At its meeting in May, the State Council also decided to eliminate illegal production altogether, and to prevent production units that have been shut down from restarting.
POLICY FOCUS
Unlocking synergies with the Belt and Road Initiative
The scope of the Belt and Road Initiative is expanding beyond initial expectations
Originally inspired by the ancient Silk Road that connected Asia and Europe, the Belt and Road Initiative is a strategy with several dimensions. First of all, it is a project
4. StrUctUral pOlIcY cOUNtrY NOteS4. StrUctUral pOlIcY cOUNtrY NOteS
225ecONOMIc OUtlOOK fOr SOUtHeaSt aSIa, cHINa aNd INdIa 2018: fOSterINg grOWtH tHrOUgH dIgItalISatION © Oecd 2018
of economic integration on an unprecedented scale. With 65 countries already having signed up, two-thirds of the world’s population and one-third of its gross domestic product (GDP) are now involved in it. It aims at tighter integration not just between the two extremities of Asia and Europe, but also among all of the other countries along the sea and land routes in between. Many of these countries are not yet integrated into global economic arteries due to their location, or to their low degree of openness. The Belt and Road Initiative will deliver the benefits of involving more countries in trade and investment.
However, the initiative also goes well beyond trade and investment. For example, it will enhance the connectivity of transport and energy infrastructures, thereby boosting overall productivity. The initiative also advances co-ordination and harmonisation in a large number of other dimensions, including disaster prevention, environmental protection, and innovation, all with the aim of economising on costs and reaping the benefits of common standards and joint action.
Moreover, the initiative is also expected to help inland regions of China along the Belt and Road, most of which tend to lag behind the more developed coastal areas, to catch up. In this way it is also a vehicle for pursuing more co-ordinated, and more balanced, regional development within China. This accelerated convergence is also likely to help with poverty reduction, which is another important goal for the government.
The Belt and Road Initiative chimes with the keywords in China’s current five-year plan
Although the Belt and Road Initiative and the 13th five-year plan began in different years, the major advances of the former are likely to coincide with the span of the latter. Moreover, the Belt and Road Initiative matches up very well with the keywords of the current five-year plan, which are opening up, sharing, co-ordination, green development and innovation.
Co-operation along the sea and land routes that lie at the heart of this initiative should increase openness thanks to more intensive trade relations, an expansion of foreign direct investment (FDI), and tighter collaboration across a wide range of areas, including financial stability and regulatory harmonisation. Trade integration will lower tariff and non-tariff trade barriers, which in turn should increase trade flows and enhance consumer choice. The availability of a greater choice of goods will also exert pressure on domestic producers to supply the goods that consumers want, thereby enhancing consumer welfare. By the same token, FDI can be an important source of competitive pressure, as very often it is foreign investors who first challenge the position of an incumbent. Within China, judging from lower mark-ups over marginal costs, competitive pressures are relatively fierce in manufacturing. In contrast, mark-ups are high in some service industries, implying low competitive pressure. This can stem from entry restrictions, or from other impediments to competition in product markets. Thus, opening up industries and regions through trade and investment can be an important driver of productivity gains, both within China and along the Belt and the Road.
As the inter-dependence of the countries and regions along the Belt and the Road increases, there will be greater incentives to share the gains that come from development. A crucial prerequisite to enhanced integration along the Belt and Road is an expansion of infrastructure and an improvement in its quality. More and better infrastructure has the scope to make the countries and regions involved in the initiative more inter-dependent in trade, investment and other areas. Moreover, demand for infrastructure in Asia is insatiable, and the development of infrastructure features in national visions and development strategies across the continent. Creating infrastructure boosts growth
4. StrUctUral pOlIcY cOUNtrY NOteS
227226 ecONOMIc OUtlOOK fOr SOUtHeaSt aSIa, cHINa aNd INdIa 2018: fOSterINg grOWtH tHrOUgH dIgItalISatION © Oecd 2018
not only by contributing to the capital stock, but also by enhancing the efficiency with which factors of production can combine. Thus, investment in infrastructure has a very significant productivity-boosting impact.
Obviously, the collaboration across and within China’s borders that will stem from the Belt and Road Initiative needs to be co-ordinated for the benefit of all. This is not least because it proposes a large-scale creation of infrastructure, and this must complement existing infrastructure and bring the greatest possible benefits to future users. Investment is usually associated with uncertainty, and all the more so with infrastructure investment, particularly when it crosses national borders. By reducing regulatory uncertainty, tighter integration would significantly mitigate the risks related to cross-border infrastructure investment. Meanwhile, reducing regulatory uncertainty would, in turn, also result in more investment, simply because many projects that would otherwise have been unviable would now become profitable. Furthermore, co-ordination has the potential to create a spirit of working together rather than one of zero-sum competition. Moreover, co-ordination across economies and regions will also enhance their resilience to external shocks.
There is also potential for growth to become greener. This would occur both as participating countries learn from each other about how to promote more environmentally-responsible behaviour, and because integration makes it is easier to deal with the spill-over of negative externalities such as pollution. Working together more can also spread an understanding of the environment as a common good. Indeed, many countries along the Belt and the Road share common environmental concerns. Sandstorms and dust from Northern Africa cause land degradation and desertification in a number of countries. Moreover, building a green Silk Road also means fighting climate change, preserving biodiversity and promoting ecological protection. It will be necessary to manage ecosystems in an integrated fashion, promote sustainable agriculture, manage land and water resources, tackle shifting sand dunes, boost local capacities to respond to emergencies, and improve ecological conservation.
No less importantly, the Belt and Road Initiative can also boost innovation. Population ageing has begun to affect many countries along its routes, and not just developed ones. The only way to ensure long-term sustainable growth is by boosting productivity, which in turn can only be achieved by continuous innovation. Within the Belt and Road Initiative, countries have already discussed a blueprint for working more closely together on intellectual property, opening up a new dimension of the project. Indeed, research and development (R&D), and making innovation happen, typically tend to be shared activities. International experience shows that most innovations are the result of collaboration. Joint research, and other ways of working together, will enhance potential spillovers across regions, thereby increasing productivity and, ultimately, economic growth as well. By contrast, a significant divergence in terms of intellectual-property systems currently constitutes what amount to non-tariff barriers. The results of such barriers include an increase in the costs of mutual trade, and a slower pace of integration. With patent systems, for instance, differences come into sharp relief in terms of patent laws, patent-office organisation, and the handling of patents with regard to innovation and competition (Hall and Harhoff, 2012). Therefore, a harmonisation of intellectual property systems across countries creates a more even playing field, which,
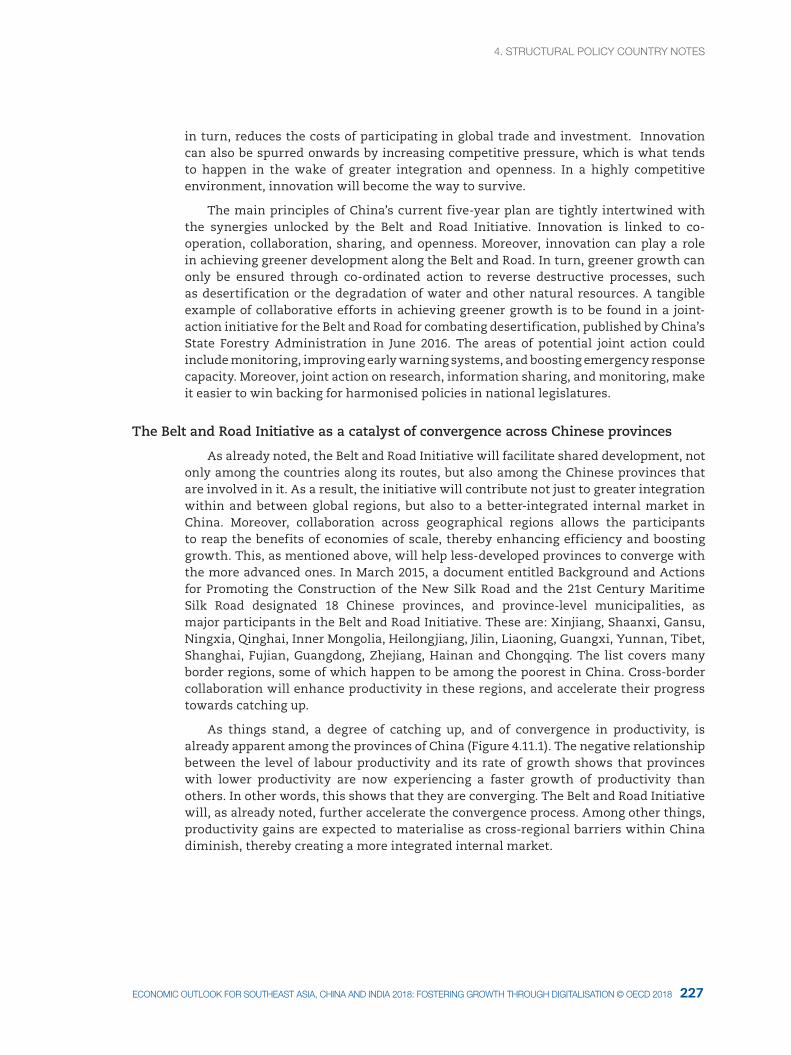
4. StrUctUral pOlIcY cOUNtrY NOteS4. StrUctUral pOlIcY cOUNtrY NOteS
227ecONOMIc OUtlOOK fOr SOUtHeaSt aSIa, cHINa aNd INdIa 2018: fOSterINg grOWtH tHrOUgH dIgItalISatION © Oecd 2018
in turn, reduces the costs of participating in global trade and investment. Innovation can also be spurred onwards by increasing competitive pressure, which is what tends to happen in the wake of greater integration and openness. In a highly competitive environment, innovation will become the way to survive.
The main principles of China’s current five-year plan are tightly intertwined with the synergies unlocked by the Belt and Road Initiative. Innovation is linked to co-operation, collaboration, sharing, and openness. Moreover, innovation can play a role in achieving greener development along the Belt and Road. In turn, greener growth can only be ensured through co-ordinated action to reverse destructive processes, such as desertification or the degradation of water and other natural resources. A tangible example of collaborative efforts in achieving greener growth is to be found in a joint-action initiative for the Belt and Road for combating desertification, published by China’s State Forestry Administration in June 2016. The areas of potential joint action could include monitoring, improving early warning systems, and boosting emergency response capacity. Moreover, joint action on research, information sharing, and monitoring, make it easier to win backing for harmonised policies in national legislatures.
The Belt and Road Initiative as a catalyst of convergence across Chinese provinces
As already noted, the Belt and Road Initiative will facilitate shared development, not only among the countries along its routes, but also among the Chinese provinces that are involved in it. As a result, the initiative will contribute not just to greater integration within and between global regions, but also to a better-integrated internal market in China. Moreover, collaboration across geographical regions allows the participants to reap the benefits of economies of scale, thereby enhancing efficiency and boosting growth. This, as mentioned above, will help less-developed provinces to converge with the more advanced ones. In March 2015, a document entitled Background and Actions for Promoting the Construction of the New Silk Road and the 21st Century Maritime Silk Road designated 18 Chinese provinces, and province-level municipalities, as major participants in the Belt and Road Initiative. These are: Xinjiang, Shaanxi, Gansu, Ningxia, Qinghai, Inner Mongolia, Heilongjiang, Jilin, Liaoning, Guangxi, Yunnan, Tibet, Shanghai, Fujian, Guangdong, Zhejiang, Hainan and Chongqing. The list covers many border regions, some of which happen to be among the poorest in China. Cross-border collaboration will enhance productivity in these regions, and accelerate their progress towards catching up.
As things stand, a degree of catching up, and of convergence in productivity, is already apparent among the provinces of China (Figure 4.11.1). The negative relationship between the level of labour productivity and its rate of growth shows that provinces with lower productivity are now experiencing a faster growth of productivity than others. In other words, this shows that they are converging. The Belt and Road Initiative will, as already noted, further accelerate the convergence process. Among other things, productivity gains are expected to materialise as cross-regional barriers within China diminish, thereby creating a more integrated internal market.
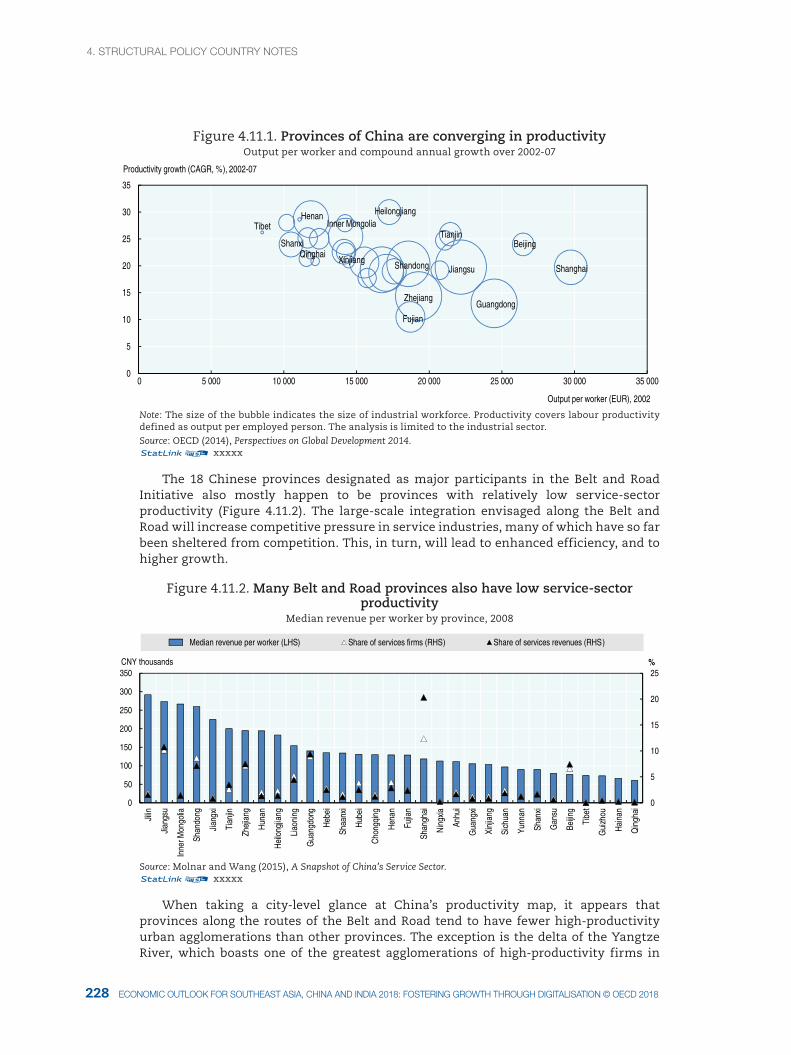
4. StrUctUral pOlIcY cOUNtrY NOteS
229228 ecONOMIc OUtlOOK fOr SOUtHeaSt aSIa, cHINa aNd INdIa 2018: fOSterINg grOWtH tHrOUgH dIgItalISatION © Oecd 2018
Figure 4.11.1. Provinces of China are converging in productivity Output per worker and compound annual growth over 2002-07
0
5
10
15
20
25
30
35
0 5 000 10 000 15 000 20 000 25 000 30 000 35 000
Output per worker (EUR), 2002
Productivity growth (CAGR, %), 2002-07
HeilongjiangHenanInner MongoliaTibet
ShanxiQinghai
XinjiangShandong
Zhejiang
Fujian
Tianjin
Jiangsu
Guangdong
Beijing
Shanghai
Note: The size of the bubble indicates the size of industrial workforce. Productivity covers labour productivity defined as output per employed person. The analysis is limited to the industrial sector.Source: OECD (2014), Perspectives on Global Development 2014.12 xxxxx
The 18 Chinese provinces designated as major participants in the Belt and Road Initiative also mostly happen to be provinces with relatively low service-sector productivity (Figure 4.11.2). The large-scale integration envisaged along the Belt and Road will increase competitive pressure in service industries, many of which have so far been sheltered from competition. This, in turn, will lead to enhanced efficiency, and to higher growth.
Figure 4.11.2. Many Belt and Road provinces also have low service-sector productivity
Median revenue per worker by province, 2008
0
5
10
15
20
25
0
50
100
150
200
250
300
350
Jilin
Jian
gsu
Inne
r Mon
golia
Shan
dong
Jian
gxi
Tian
jin
Zhej
iang
Hun
an
Hei
long
jiang
Liao
ning
Gua
ngdo
ng
Heb
ei
Shaa
nxi
Hub
ei
Cho
ngqi
ng
Hen
an
Fujia
n
Shan
ghai
Nin
gxia
Anhu
i
Gua
ngxi
Xinj
iang
Sich
uan
Yunn
an
Shan
xi
Gan
su
Beijin
g
Tibe
t
Gui
zhou
Hai
nan
Qin
ghai
%CNY thousands
Median revenue per worker (LHS) Share of services firms (RHS) Share of services revenues (RHS)
Source: Molnar and Wang (2015), A Snapshot of China’s Service Sector.12 xxxxx
When taking a city-level glance at China’s productivity map, it appears that provinces along the routes of the Belt and Road tend to have fewer high-productivity urban agglomerations than other provinces. The exception is the delta of the Yangtze River, which boasts one of the greatest agglomerations of high-productivity firms in
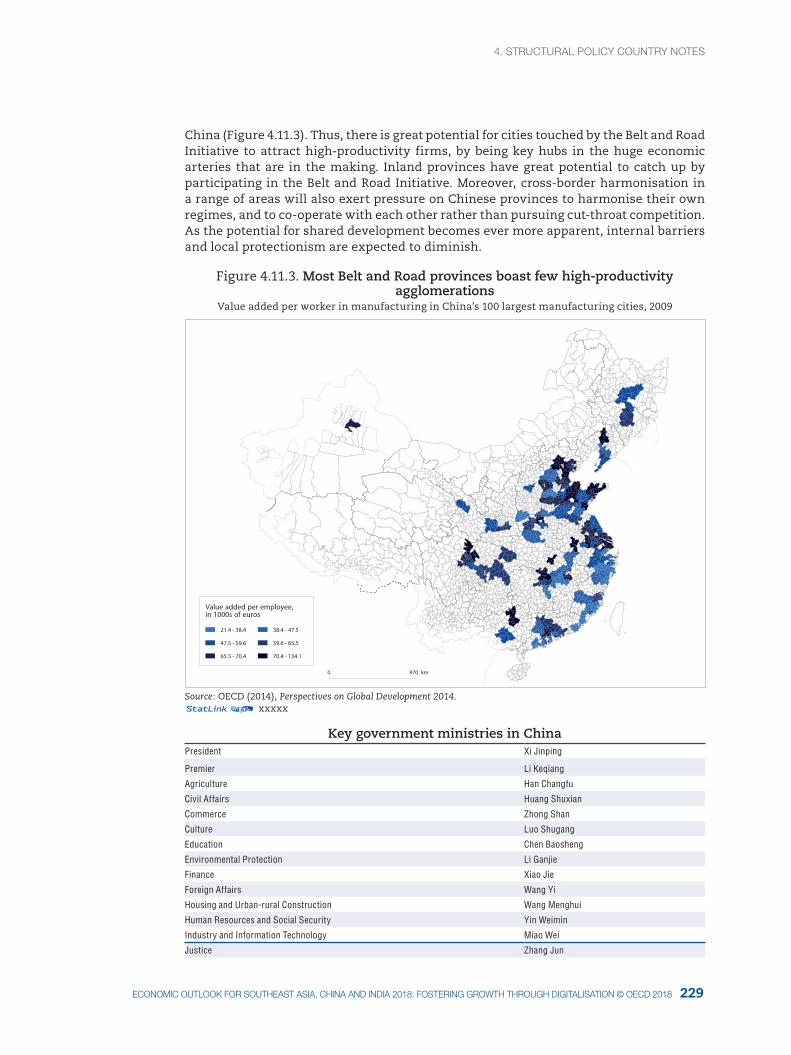
4. StrUctUral pOlIcY cOUNtrY NOteS4. StrUctUral pOlIcY cOUNtrY NOteS
229ecONOMIc OUtlOOK fOr SOUtHeaSt aSIa, cHINa aNd INdIa 2018: fOSterINg grOWtH tHrOUgH dIgItalISatION © Oecd 2018
China (Figure 4.11.3). Thus, there is great potential for cities touched by the Belt and Road Initiative to attract high-productivity firms, by being key hubs in the huge economic arteries that are in the making. Inland provinces have great potential to catch up by participating in the Belt and Road Initiative. Moreover, cross-border harmonisation in a range of areas will also exert pressure on Chinese provinces to harmonise their own regimes, and to co-operate with each other rather than pursuing cut-throat competition. As the potential for shared development becomes ever more apparent, internal barriers and local protectionism are expected to diminish.
Figure 4.11.3. Most Belt and Road provinces boast few high-productivity agglomerations
Value added per worker in manufacturing in China’s 100 largest manufacturing cities, 2009
Value added per employee,in 1000s of euros
21.4 - 38.4 38.4 - 47.5
47.5 - 59.6 59.6 - 65.5
65.5 - 70.4 70.4 - 134.1
0 970 km
Source: OECD (2014), Perspectives on Global Development 2014.12 xxxxx
Key government ministries in ChinaPresident Xi Jinping
Premier Li Keqiang
Agriculture Han Changfu
Civil Affairs Huang Shuxian
Commerce Zhong Shan
Culture Luo Shugang
Education Chen Baosheng
Environmental Protection Li Ganjie
Finance Xiao Jie
Foreign Affairs Wang Yi
Housing and Urban-rural Construction Wang Menghui
Human Resources and Social Security Yin Weimin
Industry and Information Technology Miao Wei
Justice Zhang Jun
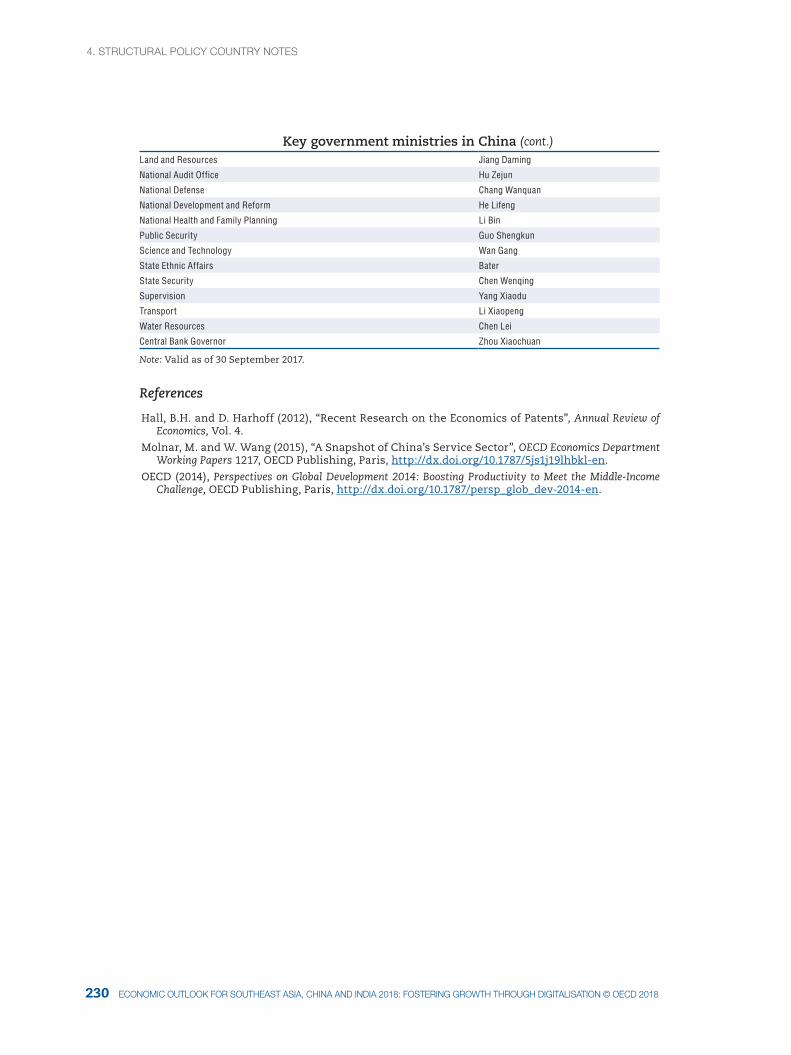
4. StrUctUral pOlIcY cOUNtrY NOteS
231230 ecONOMIc OUtlOOK fOr SOUtHeaSt aSIa, cHINa aNd INdIa 2018: fOSterINg grOWtH tHrOUgH dIgItalISatION © Oecd 2018
Key government ministries in ChinaLand and Resources Jiang Daming
National Audit Office Hu Zejun
National Defense Chang Wanquan
National Development and Reform He Lifeng
National Health and Family Planning Li Bin
Public Security Guo Shengkun
Science and Technology Wan Gang
State Ethnic Affairs Bater
State Security Chen Wenqing
Supervision Yang Xiaodu
Transport Li Xiaopeng
Water Resources Chen Lei
Central Bank Governor Zhou Xiaochuan
Note: Valid as of 30 September 2017.
References
Hall, B.H. and D. Harhoff (2012), “Recent Research on the Economics of Patents”, Annual Review of Economics, Vol. 4.
Molnar, M. and W. Wang (2015), “A Snapshot of China’s Service Sector”, OECD Economics Department Working Papers 1217, OECD Publishing, Paris, http://dx.doi.org/10.1787/5js1j19lhbkl-en.
OECD (2014), Perspectives on Global Development 2014: Boosting Productivity to Meet the Middle-Income Challenge, OECD Publishing, Paris, http://dx.doi.org/10.1787/persp_glob_dev-2014-en.
(cont.)
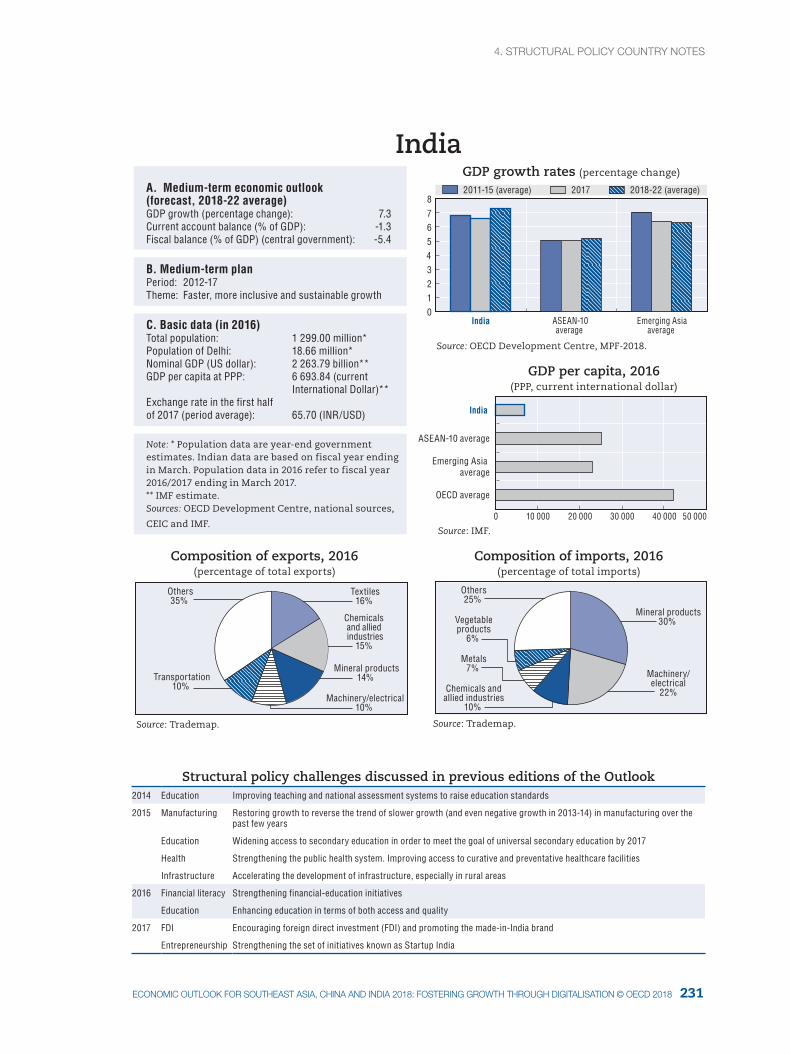
4. StrUctUral pOlIcY cOUNtrY NOteS4. StrUctUral pOlIcY cOUNtrY NOteS
231ecONOMIc OUtlOOK fOr SOUtHeaSt aSIa, cHINa aNd INdIa 2018: fOSterINg grOWtH tHrOUgH dIgItalISatION © Oecd 2018
0
ASEAN-10average
Emerging Asiaaverage
GDP growth rates (percentage change)
Source: OECD Development Centre, MPF-2018.
0 1 2 3 4 5 6 7 8
10 000 20 000 30 000 40 000 50 000
2011-15 (average) 2017 2018-22 (average)
India
Source: IMF.
OECD average
Emerging Asia average
ASEAN-10 average
India
Source: Trademap. Source: Trademap.
Composition of exports, 2016(percentage of total exports)
Composition of imports, 2016(percentage of total imports)
IndiaA. Medium-term economic outlook (forecast, 2018-22 average)GDP growth (percentage change): 7.3Current account balance (% of GDP): -1.3Fiscal balance (% of GDP) (central government): -5.4
B. Medium-term planPeriod: 2012-17Theme: Faster, more inclusive and sustainable growth
C. Basic data (in 2016) Total population: 1 299.00 million*Population of Delhi: 18.66 million*Nominal GDP (US dollar): 2 263.79 billion**GDP per capita at PPP: 6 693.84 (current International Dollar)**Exchange rate in the first half of 2017 (period average): 65.70 (INR/USD)
Note: * Population data are year-end government estimates. Indian data are based on fiscal year ending in March. Population data in 2016 refer to fiscal year 2016/2017 ending in March 2017. ** IMF estimate.Sources: OECD Development Centre, national sources,
CEIC and IMF.
GDP per capita, 2016 (PPP, current international dollar)
Textiles16%
Chemicals and allied industries
15%
Mineral products14%
Machinery/electrical10%
Transportation10%
Others35%
Mineral products30%
Machinery/electrical
22%Chemicals andallied industries
10%
Metals7%
Vegetableproducts
6%
Others25%
Structural policy challenges discussed in previous editions of the Outlook2014 Education Improving teaching and national assessment systems to raise education standards
2015 Manufacturing Restoring growth to reverse the trend of slower growth (and even negative growth in 2013-14) in manufacturing over the past few years
Education Widening access to secondary education in order to meet the goal of universal secondary education by 2017
Health Strengthening the public health system. Improving access to curative and preventative healthcare facilities
Infrastructure Accelerating the development of infrastructure, especially in rural areas
2016 Financial literacy Strengthening financial-education initiatives
Education Enhancing education in terms of both access and quality
2017 FDI Encouraging foreign direct investment (FDI) and promoting the made-in-India brand
Entrepreneurship Strengthening the set of initiatives known as Startup India
4. StrUctUral pOlIcY cOUNtrY NOteS
233232 ecONOMIc OUtlOOK fOr SOUtHeaSt aSIa, cHINa aNd INdIa 2018: fOSterINg grOWtH tHrOUgH dIgItalISatION © Oecd 2018
Recent developments in policy areas covered by previous editions of the Outlook
Education: Consulting on a new national approach
• In April 2015, India’s Ministry of Human Resource Development announced the beginning of a consultation process for a new education policy. The ministry planned over 275 000 direct consultations, and online collections of citizen input, on a range of topics affecting school-level and higher education in the country. The ministry accepted contributions until the end of September 2015. Prime Minister Modi has asked the ministry to finalise the policy by the end of 2017, for it to be implemented as of the 2018-19 academic year. India’s current national education policy was framed in 1986 and modified in 1992.
Health: Implementing a new national policy and expanding coverage
• In March 2017, India’s government approved a new national health policy, which had been pending for two years. The new policy targets increased access, improvements in quality, and lower costs in delivering healthcare, while at the same time supporting India’s progress towards the Sustainable Development Goals of the United Nations. Among other reforms, the policy expands the coverage of India’s network of Primary Health Centres to include screening of non-communicable diseases and other new services.
Infrastructure: Increasing funding and pursuing new approaches for rail
• In its 2017-18 budget, the government allocated a record 3.96 trillion rupees (INR) to infrastructure projects, a 24% increase on the previous year. The railways budget was also included in the general budget for the first time. A new metro rail policy on standards and procurement for the expansion of networks in cities across the country was approved by the government in August 2017.
FDI: Developing reforms and new initiatives for attracting FDI
• In May 2017, the Cabinet approved phasing-out the Foreign Investment Promotion Board (FIPB). In place of this inter-ministerial body, concerned ministries or departments will be responsible for processing FDI applications, in consultation with the Ministry of Commerce and Industry’s Department of Industrial Policy and Promotion (DIPP).
• In August 2017, the Consolidated FDI Policy Circular of 2017 was released by the DIPP. Notably, a separate section was included for startups for the first time, allowing them to raise money from venture capital funds and other foreign investors.
POLICY FOCUS
Fostering inclusive innovation to boost growth and development
Expanding the scope of innovation in India is an important way of ensuring that the country continues to enjoy economic growth. While innovation has become more common in India, and there have been increasing numbers of applications for patents, significant barriers remain to be addressed. There is also scope for policy makers to encourage the kind of innovation that is as inclusive as possible, both in its reach and the kind of growth it leads to. Reducing the challenges faced by smaller firms would be an important part of such a strategy.
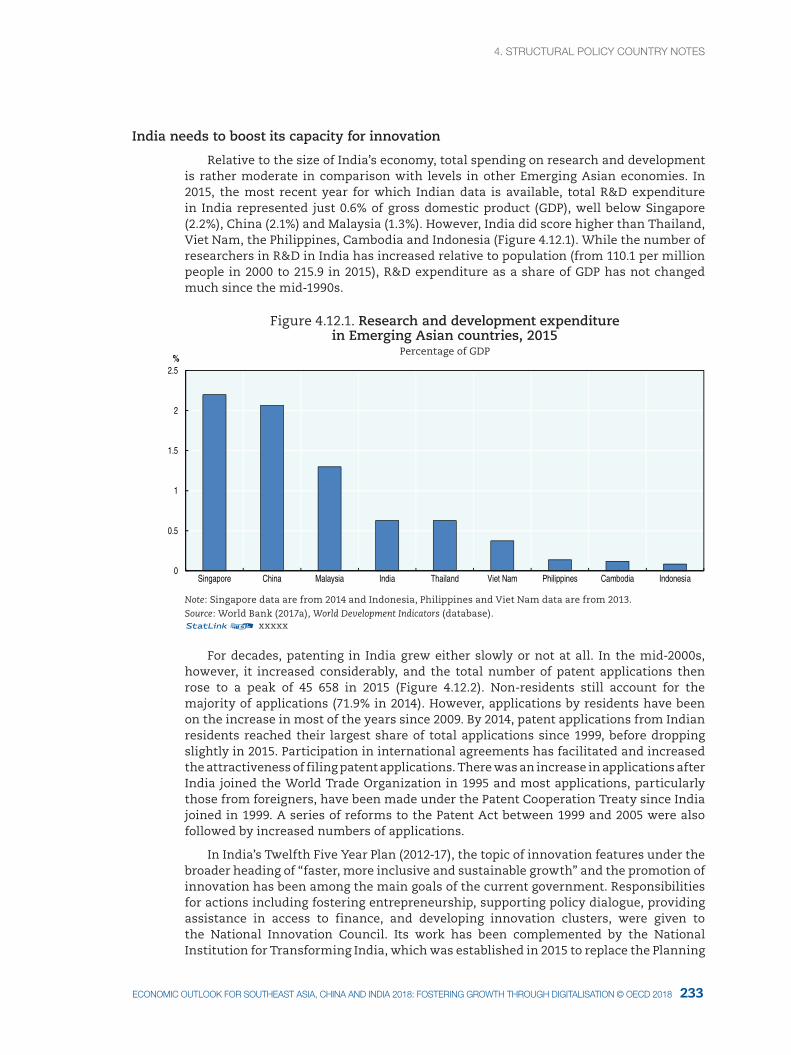
4. StrUctUral pOlIcY cOUNtrY NOteS4. StrUctUral pOlIcY cOUNtrY NOteS
233ecONOMIc OUtlOOK fOr SOUtHeaSt aSIa, cHINa aNd INdIa 2018: fOSterINg grOWtH tHrOUgH dIgItalISatION © Oecd 2018
India needs to boost its capacity for innovation
Relative to the size of India’s economy, total spending on research and development is rather moderate in comparison with levels in other Emerging Asian economies. In 2015, the most recent year for which Indian data is available, total R&D expenditure in India represented just 0.6% of gross domestic product (GDP), well below Singapore (2.2%), China (2.1%) and Malaysia (1.3%). However, India did score higher than Thailand, Viet Nam, the Philippines, Cambodia and Indonesia (Figure 4.12.1). While the number of researchers in R&D in India has increased relative to population (from 110.1 per million people in 2000 to 215.9 in 2015), R&D expenditure as a share of GDP has not changed much since the mid-1990s.
Figure 4.12.1. Research and development expenditure in Emerging Asian countries, 2015
Percentage of GDP
0
0.5
1
1.5
2
2.5
Singapore China Malaysia India Thailand Viet Nam Philippines Cambodia Indonesia
%
Note: Singapore data are from 2014 and Indonesia, Philippines and Viet Nam data are from 2013.Source: World Bank (2017a), World Development Indicators (database).12 xxxxx
For decades, patenting in India grew either slowly or not at all. In the mid-2000s, however, it increased considerably, and the total number of patent applications then rose to a peak of 45 658 in 2015 (Figure 4.12.2). Non-residents still account for the majority of applications (71.9% in 2014). However, applications by residents have been on the increase in most of the years since 2009. By 2014, patent applications from Indian residents reached their largest share of total applications since 1999, before dropping slightly in 2015. Participation in international agreements has facilitated and increased the attractiveness of filing patent applications. There was an increase in applications after India joined the World Trade Organization in 1995 and most applications, particularly those from foreigners, have been made under the Patent Cooperation Treaty since India joined in 1999. A series of reforms to the Patent Act between 1999 and 2005 were also followed by increased numbers of applications.
In India’s Twelfth Five Year Plan (2012-17), the topic of innovation features under the broader heading of “faster, more inclusive and sustainable growth” and the promotion of innovation has been among the main goals of the current government. Responsibilities for actions including fostering entrepreneurship, supporting policy dialogue, providing assistance in access to finance, and developing innovation clusters, were given to the National Innovation Council. Its work has been complemented by the National Institution for Transforming India, which was established in 2015 to replace the Planning
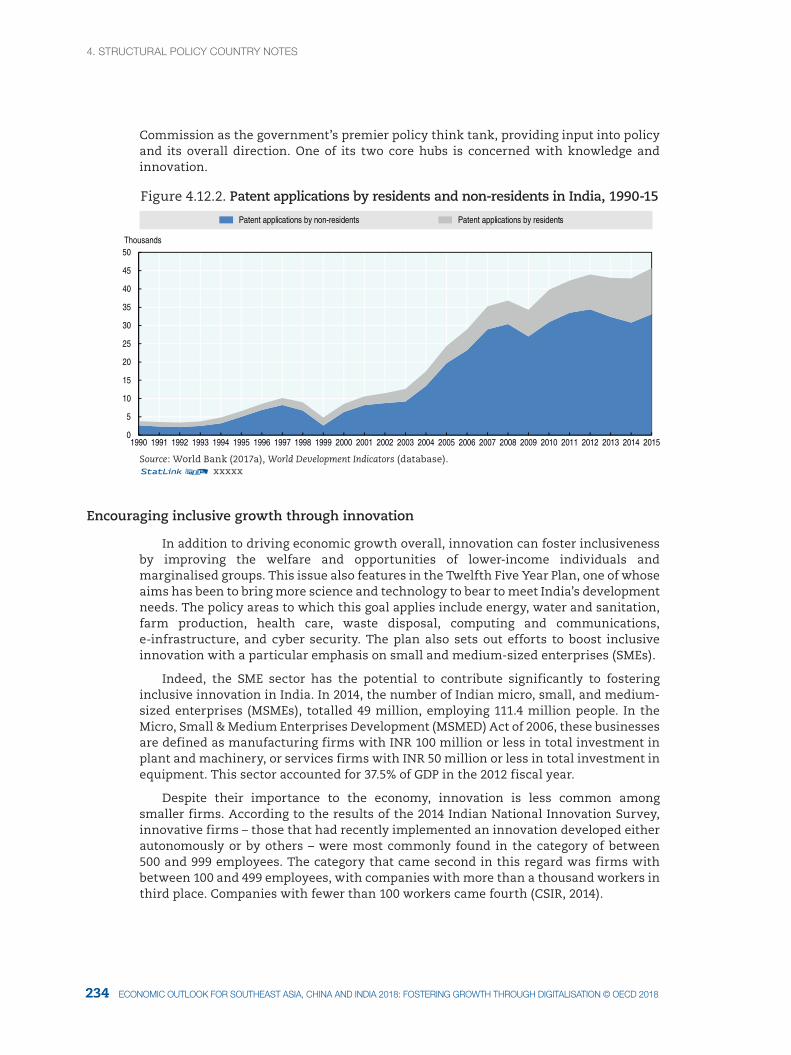
4. StrUctUral pOlIcY cOUNtrY NOteS
235234 ecONOMIc OUtlOOK fOr SOUtHeaSt aSIa, cHINa aNd INdIa 2018: fOSterINg grOWtH tHrOUgH dIgItalISatION © Oecd 2018
Commission as the government’s premier policy think tank, providing input into policy and its overall direction. One of its two core hubs is concerned with knowledge and innovation.
Figure 4.12.2. Patent applications by residents and non-residents in India, 1990-15
0
5
10
15
20
25
30
35
40
45
50
1990 1991 1992 1993 1994 1995 1996 1997 1998 1999 2000 2001 2002 2003 2004 2005 2006 2007 2008 2009 2010 2011 2012 2013 2014 2015
Thousands
Patent applications by non-residents Patent applications by residents
Source: World Bank (2017a), World Development Indicators (database).12 xxxxx
Encouraging inclusive growth through innovation
In addition to driving economic growth overall, innovation can foster inclusiveness by improving the welfare and opportunities of lower-income individuals and marginalised groups. This issue also features in the Twelfth Five Year Plan, one of whose aims has been to bring more science and technology to bear to meet India’s development needs. The policy areas to which this goal applies include energy, water and sanitation, farm production, health care, waste disposal, computing and communications, e-infrastructure, and cyber security. The plan also sets out efforts to boost inclusive innovation with a particular emphasis on small and medium-sized enterprises (SMEs).
Indeed, the SME sector has the potential to contribute significantly to fostering inclusive innovation in India. In 2014, the number of Indian micro, small, and medium-sized enterprises (MSMEs), totalled 49 million, employing 111.4 million people. In the Micro, Small & Medium Enterprises Development (MSMED) Act of 2006, these businesses are defined as manufacturing firms with INR 100 million or less in total investment in plant and machinery, or services firms with INR 50 million or less in total investment in equipment. This sector accounted for 37.5% of GDP in the 2012 fiscal year.
Despite their importance to the economy, innovation is less common among smaller firms. According to the results of the 2014 Indian National Innovation Survey, innovative firms – those that had recently implemented an innovation developed either autonomously or by others – were most commonly found in the category of between 500 and 999 employees. The category that came second in this regard was firms with between 100 and 499 employees, with companies with more than a thousand workers in third place. Companies with fewer than 100 workers came fourth (CSIR, 2014).
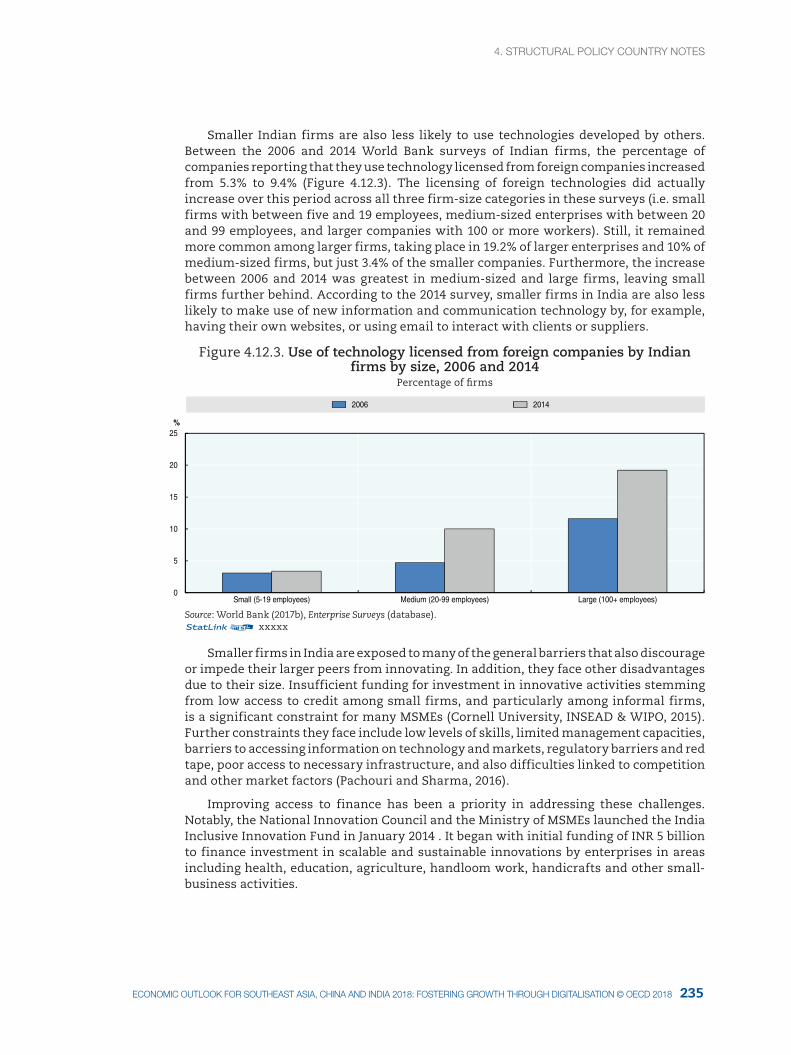
4. StrUctUral pOlIcY cOUNtrY NOteS4. StrUctUral pOlIcY cOUNtrY NOteS
235ecONOMIc OUtlOOK fOr SOUtHeaSt aSIa, cHINa aNd INdIa 2018: fOSterINg grOWtH tHrOUgH dIgItalISatION © Oecd 2018
Smaller Indian firms are also less likely to use technologies developed by others. Between the 2006 and 2014 World Bank surveys of Indian firms, the percentage of companies reporting that they use technology licensed from foreign companies increased from 5.3% to 9.4% (Figure 4.12.3). The licensing of foreign technologies did actually increase over this period across all three firm-size categories in these surveys (i.e. small firms with between five and 19 employees, medium-sized enterprises with between 20 and 99 employees, and larger companies with 100 or more workers). Still, it remained more common among larger firms, taking place in 19.2% of larger enterprises and 10% of medium-sized firms, but just 3.4% of the smaller companies. Furthermore, the increase between 2006 and 2014 was greatest in medium-sized and large firms, leaving small firms further behind. According to the 2014 survey, smaller firms in India are also less likely to make use of new information and communication technology by, for example, having their own websites, or using email to interact with clients or suppliers.
Figure 4.12.3. Use of technology licensed from foreign companies by Indian firms by size, 2006 and 2014
Percentage of firms
0
5
10
15
20
25
Small (5-19 employees) Medium (20-99 employees) Large (100+ employees)
%
2006 2014
Source: World Bank (2017b), Enterprise Surveys (database). 12 xxxxx
Smaller firms in India are exposed to many of the general barriers that also discourage or impede their larger peers from innovating. In addition, they face other disadvantages due to their size. Insufficient funding for investment in innovative activities stemming from low access to credit among small firms, and particularly among informal firms, is a significant constraint for many MSMEs (Cornell University, INSEAD & WIPO, 2015). Further constraints they face include low levels of skills, limited management capacities, barriers to accessing information on technology and markets, regulatory barriers and red tape, poor access to necessary infrastructure, and also difficulties linked to competition and other market factors (Pachouri and Sharma, 2016).
Improving access to finance has been a priority in addressing these challenges. Notably, the National Innovation Council and the Ministry of MSMEs launched the India Inclusive Innovation Fund in January 2014 . It began with initial funding of INR 5 billion to finance investment in scalable and sustainable innovations by enterprises in areas including health, education, agriculture, handloom work, handicrafts and other small-business activities.
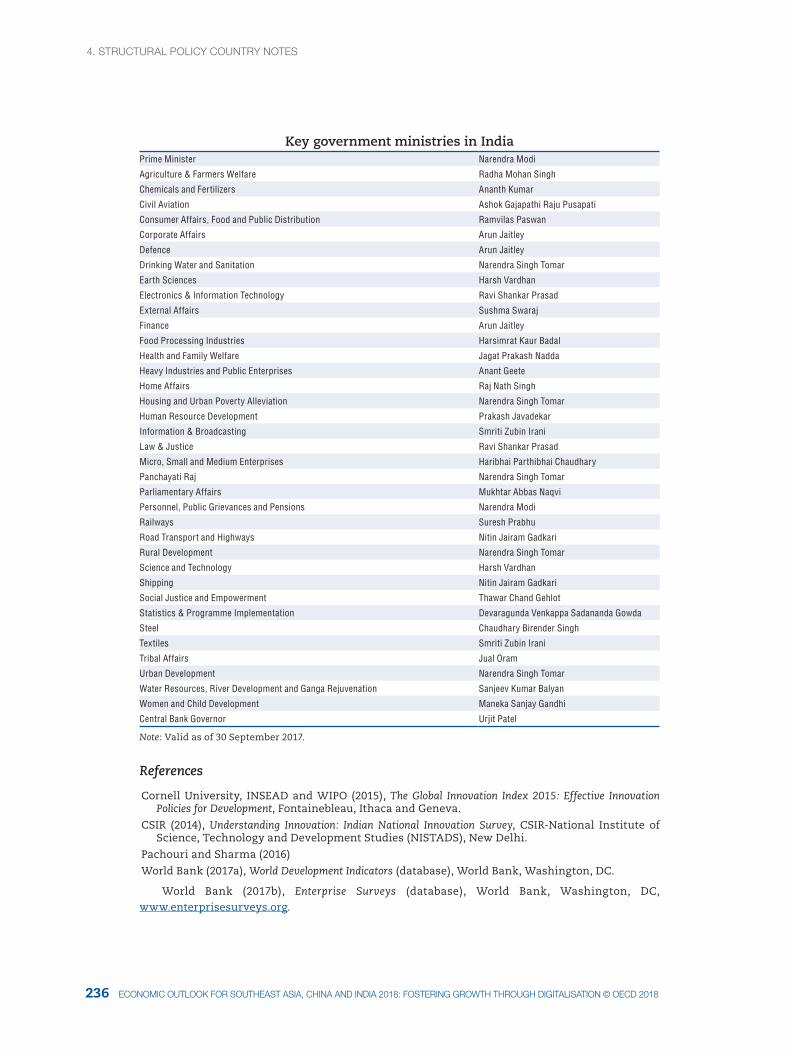
4. StrUctUral pOlIcY cOUNtrY NOteS
NP236 ecONOMIc OUtlOOK fOr SOUtHeaSt aSIa, cHINa aNd INdIa 2018: fOSterINg grOWtH tHrOUgH dIgItalISatION © Oecd 2018
Key government ministries in IndiaPrime Minister Narendra Modi
Agriculture & Farmers Welfare Radha Mohan Singh
Chemicals and Fertilizers Ananth Kumar
Civil Aviation Ashok Gajapathi Raju Pusapati
Consumer Affairs, Food and Public Distribution Ramvilas Paswan
Corporate Affairs Arun Jaitley
Defence Arun Jaitley
Drinking Water and Sanitation Narendra Singh Tomar
Earth Sciences Harsh Vardhan
Electronics & Information Technology Ravi Shankar Prasad
External Affairs Sushma Swaraj
Finance Arun Jaitley
Food Processing Industries Harsimrat Kaur Badal
Health and Family Welfare Jagat Prakash Nadda
Heavy Industries and Public Enterprises Anant Geete
Home Affairs Raj Nath Singh
Housing and Urban Poverty Alleviation Narendra Singh Tomar
Human Resource Development Prakash Javadekar
Information & Broadcasting Smriti Zubin Irani
Law & Justice Ravi Shankar Prasad
Micro, Small and Medium Enterprises Haribhai Parthibhai Chaudhary
Panchayati Raj Narendra Singh Tomar
Parliamentary Affairs Mukhtar Abbas Naqvi
Personnel, Public Grievances and Pensions Narendra Modi
Railways Suresh Prabhu
Road Transport and Highways Nitin Jairam Gadkari
Rural Development Narendra Singh Tomar
Science and Technology Harsh Vardhan
Shipping Nitin Jairam Gadkari
Social Justice and Empowerment Thawar Chand Gehlot
Statistics & Programme Implementation Devaragunda Venkappa Sadananda Gowda
Steel Chaudhary Birender Singh
Textiles Smriti Zubin Irani
Tribal Affairs Jual Oram
Urban Development Narendra Singh Tomar
Water Resources, River Development and Ganga Rejuvenation Sanjeev Kumar Balyan
Women and Child Development Maneka Sanjay Gandhi
Central Bank Governor Urjit Patel
Note: Valid as of 30 September 2017.
References
Cornell University, INSEAD and WIPO (2015), The Global Innovation Index 2015: Effective Innovation Policies for Development, Fontainebleau, Ithaca and Geneva.
CSIR (2014), Understanding Innovation: Indian National Innovation Survey, CSIR-National Institute of Science, Technology and Development Studies (NISTADS), New Delhi.
Pachouri and Sharma (2016)
World Bank (2017a), World Development Indicators (database), World Bank, Washington, DC.
World Bank (2017b), Enterprise Surveys (database), World Bank, Washington, DC,
www.enterprisesurveys.org.
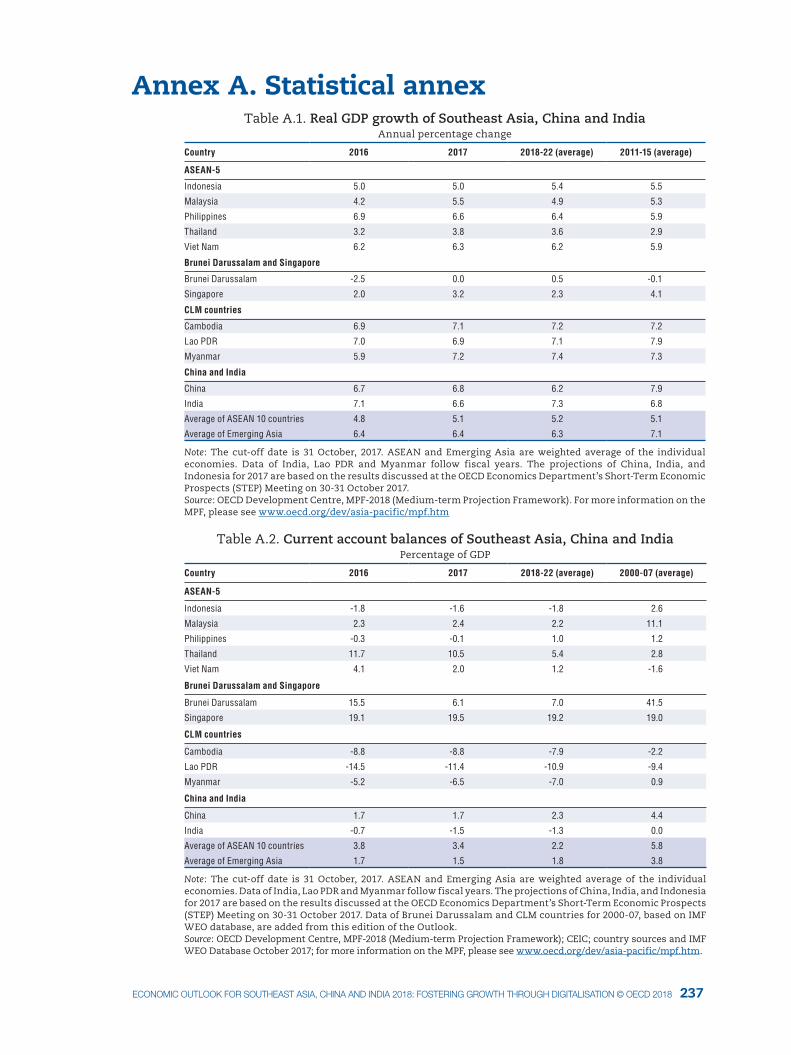
1. <Header left page - cHapter>
237ecONOMIc OUtlOOK fOr SOUtHeaSt aSIa, cHINa aNd INdIa 2018: fOSterINg grOWtH tHrOUgH dIgItalISatION © Oecd 2018
Annex A. Statistical annexTable A.1. Real GDP growth of Southeast Asia, China and India
Annual percentage change
Country 2016 2017 2018-22 (average) 2011-15 (average)
ASEAN-5
Indonesia 5.0 5.0 5.4 5.5
Malaysia 4.2 5.5 4.9 5.3
Philippines 6.9 6.6 6.4 5.9
Thailand 3.2 3.8 3.6 2.9
Viet Nam 6.2 6.3 6.2 5.9
Brunei Darussalam and Singapore
Brunei Darussalam -2.5 0.0 0.5 -0.1
Singapore 2.0 3.2 2.3 4.1
CLM countries
Cambodia 6.9 7.1 7.2 7.2
Lao PDR 7.0 6.9 7.1 7.9
Myanmar 5.9 7.2 7.4 7.3
China and India
China 6.7 6.8 6.2 7.9
India 7.1 6.6 7.3 6.8
Average of ASEAN 10 countries 4.8 5.1 5.2 5.1
Average of Emerging Asia 6.4 6.4 6.3 7.1
Note: The cut-off date is 31 October, 2017. ASEAN and Emerging Asia are weighted average of the individual economies. Data of India, Lao PDR and Myanmar follow fiscal years. The projections of China, India, and Indonesia for 2017 are based on the results discussed at the OECD Economics Department’s Short-Term Economic Prospects (STEP) Meeting on 30-31 October 2017. Source: OECD Development Centre, MPF-2018 (Medium-term Projection Framework). For more information on the MPF, please see www.oecd.org/dev/asia-pacific/mpf.htm
Table A.2. Current account balances of Southeast Asia, China and IndiaPercentage of GDP
Country 2016 2017 2018-22 (average) 2000-07 (average)
ASEAN-5
Indonesia -1.8 -1.6 -1.8 2.6
Malaysia 2.3 2.4 2.2 11.1
Philippines -0.3 -0.1 1.0 1.2
Thailand 11.7 10.5 5.4 2.8
Viet Nam 4.1 2.0 1.2 -1.6
Brunei Darussalam and Singapore
Brunei Darussalam 15.5 6.1 7.0 41.5
Singapore 19.1 19.5 19.2 19.0
CLM countries
Cambodia -8.8 -8.8 -7.9 -2.2
Lao PDR -14.5 -11.4 -10.9 -9.4
Myanmar -5.2 -6.5 -7.0 0.9
China and India
China 1.7 1.7 2.3 4.4
India -0.7 -1.5 -1.3 0.0
Average of ASEAN 10 countries 3.8 3.4 2.2 5.8
Average of Emerging Asia 1.7 1.5 1.8 3.8
Note: The cut-off date is 31 October, 2017. ASEAN and Emerging Asia are weighted average of the individual economies. Data of India, Lao PDR and Myanmar follow fiscal years. The projections of China, India, and Indonesia for 2017 are based on the results discussed at the OECD Economics Department’s Short-Term Economic Prospects (STEP) Meeting on 30-31 October 2017. Data of Brunei Darussalam and CLM countries for 2000-07, based on IMF WEO database, are added from this edition of the Outlook. Source: OECD Development Centre, MPF-2018 (Medium-term Projection Framework); CEIC; country sources and IMF WEO Database October 2017; for more information on the MPF, please see www.oecd.org/dev/asia-pacific/mpf.htm.
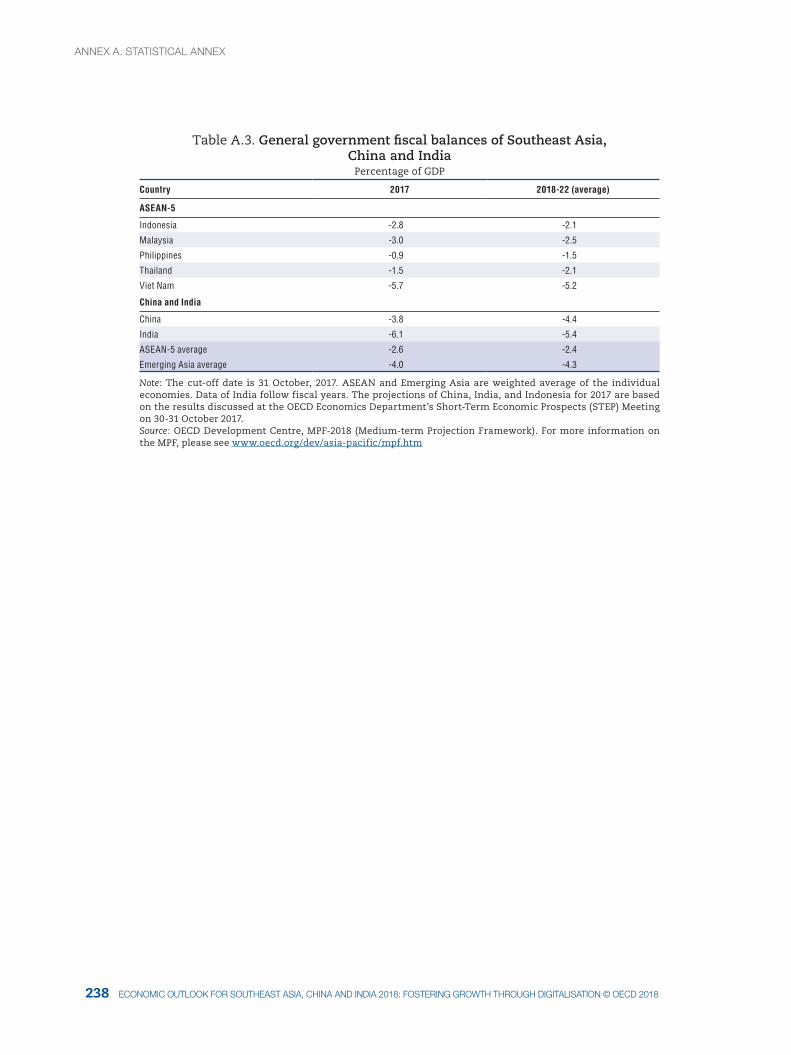
1. aNNeX a. StatIStIcal aNNeX
NP238 ecONOMIc OUtlOOK fOr SOUtHeaSt aSIa, cHINa aNd INdIa 2018: fOSterINg grOWtH tHrOUgH dIgItalISatION © Oecd 2018
Table A.3. General government fiscal balances of Southeast Asia, China and India
Percentage of GDP
Country 2017 2018-22 (average)
ASEAN-5
Indonesia -2.8 -2.1
Malaysia -3.0 -2.5
Philippines -0.9 -1.5
Thailand -1.5 -2.1
Viet Nam -5.7 -5.2
China and India
China -3.8 -4.4
India -6.1 -5.4
ASEAN-5 average -2.6 -2.4
Emerging Asia average -4.0 -4.3
Note: The cut-off date is 31 October, 2017. ASEAN and Emerging Asia are weighted average of the individual economies. Data of India follow fiscal years. The projections of China, India, and Indonesia for 2017 are based on the results discussed at the OECD Economics Department’s Short-Term Economic Prospects (STEP) Meeting on 30-31 October 2017. Source: OECD Development Centre, MPF-2018 (Medium-term Projection Framework). For more information on the MPF, please see www.oecd.org/dev/asia-pacific/mpf.htm
aNNeX a. StatIStIcal aNNeX
Eco
nom
ic Ou
tloo
k for S
ou
theast A
sia, Ch
ina an
d In
dia 2018
FOS
TE
RIN
G G
RO
WT
H T
HR
OU
GH
DIG
ITAL
ISA
TIO
N
Consult this publication on line at http://dx.doi.org/9789264286184-en
This work is published on the OECD iLibrary, which gathers all OECD books, periodicals and statistical databases. Visit www.oecd-ilibrary.org for more information.
Economic Outlook for Southeast Asia, China and India 2018FOSTERING GROWTH THROUGH DIGITALISATIONThe Economic Outlook for Southeast Asia, China and India is a bi-annual publication on regional economic growth, development and regional integration in Emerging Asia. It focuses on the economic conditions of Association of Southeast Asian Nations (ASEAN) member countries: Brunei Darussalam, Cambodia, Indonesia, Lao PDR, Malaysia, Myanmar, the Philippines, Singapore, Thailand and Viet Nam. It also addresses relevant economic issues in China and India to fully reflect economic developments in the region. Each edition of the Outlook comprises four main parts, each highlighting a particular dimension of recent economic developments in the region. The first part presents the regional economic monitor, depicting the economic outlook and macroeconomic challenges in the region. The second part takes stock of recent progress made in key aspects of regional integration. The third part consists of a special thematic chapter addressing a major issue facing the region. The 2018 edition focuses on fostering growth through digitalisation. And the fourth part includes structural policy country notes offering country-specific reviews and recommendations.
Contents
Chapter 1: Macroeconomic assessments and economic outlook for Emerging Asia
Chapter 2: Progress and challenges of regional integration in ASEAN and Emerging Asia
Chapter 3: Digitalisation in manufacturing and services in Emerging Asia
Chapter 4: Structural policy country notes
ISBN: 978-92-64-286177
41 2017 24 1 P1
Economic Outlook for Southeast Asia, China and India 2018FOSTERING GROWTH THROUGH DIGITALISATION
2018