Fostering Computational Thinking Through Data ...
18
Journal of Universal Computer Science, vol. 27, no. 3 (2021), 285-302 submitted: 15/10/2020, accepted: 7/3/2021, appeared: 28/3/2021 CC BY-ND 4.0 Fostering Computational Thinking Through Data Visualization and Design on Secondary School Students Güldem Alev Özkök (Hacettepe University, Ankara, Turkey, https://orcid.org/0000-0003-4519-6521, [email protected]) Abstract: This research aims to model the process of data visualization (DV) and design to facilitate computational thinking (CT) of secondary-level students. As an interdisciplinary method for visualizing complex data, creating data visualizations requires learners to analyze data from knowledge of pure and applied science. This study investigates creating DV to facilitate CT as an interdisciplinary method which combines mathematics and information technology. The study was carried out using synthesised design-based research (DBR) method by conducting two cycles comprised of five phases: problem analysis within real-life context, design solution, develop solution, evaluate in practice and reflection. CT dimensions (decomposition, pattern recognition, abstraction, and algorithm design) were tested by using the Computational Thinking through Data Visualization Rubric and reflection form acquired during implementation. The sample consisted of secondary school students in the data visualization creation process with 27 in the first cycle and 31 in the second cycle. This research proposes a model to facilitate development of CT by DV with the analysis of complex data, creating an effective method by enabling analytics and visualizing data. The proposed DV development process facilitating CT has the potential to inform research on interdisciplinary learning environments. Keywords: Computational thinking, Data visualization, Design-based research, Algorithmic thinking, Decomposition, Pattern recognition, Abstraction, Algorithm design Categories: H.4.1, H.5.1, H.5.2, H.5.3, H.5.4 DOI: 10.3897/jucs.66265 1 Introduction Since the 1800s, the world has been subjected to a gradual technological transformation commonly referred to as the Industrial Revolution [Mian et al. 2020]. The emergence of Industry 4.0, also referred as the fourth industrial revolution (4IR), has caused radical changes to every facet of our lives, transforming traditional human society of the last two centuries to a modern knowledge-based society. The 4IR includes cutting-edge technologies comprised of cloud computing, augmented reality, artificial intelligence, data analytics, internet of things, cybersecurity, robotics, etc. Despite 4IR’s promising benefits in terms of higher productivity and sustainable development its implementation is constrained by the requirements of 21 st century competencies lacking in the workforce. The technologies in the 4IR require an education system sufficiently geared to equip learners with 21st century skills, including cognitive abilities, analytical thinking, decision-making ability, organizational skills, social intelligence, systems and technical expertise, logical reasoning, troubleshooting, etc., associated with the 4IR [Assante et al. 2019; Fitsumbirhan et al. 2020].
Transcript of Fostering Computational Thinking Through Data ...
Journal of Universal Computer Science, vol. 27, no. 3 (2021), 285-302 submitted: 15/10/2020, accepted: 7/3/2021, appeared: 28/3/2021 CC BY-ND 4.0
Fostering Computational Thinking Through Data Visualization and Design on Secondary School Students
Güldem Alev Özkök (Hacettepe University, Ankara, Turkey,
https://orcid.org/0000-0003-4519-6521, [email protected])
Abstract: This research aims to model the process of data visualization (DV) and design to facilitate computational thinking (CT) of secondary-level students. As an interdisciplinary method for visualizing complex data, creating data visualizations requires learners to analyze data from knowledge of pure and applied science. This study investigates creating DV to facilitate CT as an interdisciplinary method which combines mathematics and information technology. The study was carried out using synthesised design-based research (DBR) method by conducting two cycles comprised of five phases: problem analysis within real-life context, design solution, develop solution, evaluate in practice and reflection. CT dimensions (decomposition, pattern recognition, abstraction, and algorithm design) were tested by using the Computational Thinking through Data Visualization Rubric and reflection form acquired during implementation. The sample consisted of secondary school students in the data visualization creation process with 27 in the first cycle and 31 in the second cycle. This research proposes a model to facilitate development of CT by DV with the analysis of complex data, creating an effective method by enabling analytics and visualizing data. The proposed DV development process facilitating CT has the potential to inform research on interdisciplinary learning environments. Keywords: Computational thinking, Data visualization, Design-based research, Algorithmic thinking, Decomposition, Pattern recognition, Abstraction, Algorithm design Categories: H.4.1, H.5.1, H.5.2, H.5.3, H.5.4 DOI: 10.3897/jucs.66265
1 Introduction
Since the 1800s, the world has been subjected to a gradual technological transformation commonly referred to as the Industrial Revolution [Mian et al. 2020]. The emergence of Industry 4.0, also referred as the fourth industrial revolution (4IR), has caused radical changes to every facet of our lives, transforming traditional human society of the last two centuries to a modern knowledge-based society. The 4IR includes cutting-edge technologies comprised of cloud computing, augmented reality, artificial intelligence, data analytics, internet of things, cybersecurity, robotics, etc. Despite 4IR’s promising benefits in terms of higher productivity and sustainable development its implementation is constrained by the requirements of 21st century competencies lacking in the workforce. The technologies in the 4IR require an education system sufficiently geared to equip learners with 21st century skills, including cognitive abilities, analytical thinking, decision-making ability, organizational skills, social intelligence, systems and technical expertise, logical reasoning, troubleshooting, etc., associated with the 4IR [Assante et al. 2019; Fitsumbirhan et al. 2020].
286
Özkök G.A.: Fostering Computational Thinking Through Data Visualization and Design...
Nowadays, one of the greatest challenges educational institutions are facing is how to empower students with the 21st century skills required for the 4IR and how to provide a learning setting so students can creatively solve complex problems using computation through establishing relationships among disciplines [Abdi and Sharyati 2019]. To maintain a competitive advantage in the 4IR educational institutions must provide students with opportunities to acquire and practice 21st century skills [Çalişkan 2020]. Today's students will need high order thinking skills in cutting-edge technologies in the 4IR which depends heavily on educational policies and practices for teaching 21st century skills. In the future the students will need to exceed basic Information and Communication Technologies (ICT) usage skills be able to effectively use higher order thinking skills in the 4IR. As a result, several organizations such as the International Society for Technology in Education (ISTE), the Partnership for 21st Century Skills [P21 2011], the College Board, the Committee on Science Education, the Computing at School, and the Computer Science Teacher Association [CSTA 2016], among others, have extensively addressed the need to equip students with high order thinking skills which challenge cutting-edge technologies in the 4IR [Skordialos and Baralis 2018].
1.1 Purpose of the Research
Based on computational thinking theory, the aim of this study was to model a process to facilitate the development of computational thinking through the creation of data visualization in accordance with two successive implementations of synthesised design-based research that were carried out with 11th grade students.
The main research question and two sub-questions guided the study are: How should we model a process of data visualization to facilitate development of
computational thinking? • To what extent did the decomposition, pattern recognition, abstraction and algorithm design skills of students improve during data visualization development?
• What are the insights of the students about their computational thinking levels during the data visualization developing process?
2 Theoretical Framework
Computational thinking has been advocated as one for the fundamental 21st century skills, students should possess to develop higher order thinking skills such as decomposition, pattern recognition, abstraction, and algorithm design using principles from computer science [Kim et al. 2014; Lye and Koh 2004; Selby 2015; Shailaja and Sridaran 2015; Shute et al. 2017].
The development of computational thinking in students is a core challenge in today’s education. Moreover, students must develop logical thinking skills and transfer them into different contexts to be able to overcome more challenging problems in real life [Voogt et al. 2015]. Computational thinking provides insights in many areas of the curriculum and influences work at the cutting edge of a wide range of disciplines [Berry, 2013]. For instance, through data visualization students learn to generalize abstractions, process information, and detect errors systematically, compose and
287
Özkök G.A.: Fostering Computational Thinking Through Data Visualization and Design...
decompose problems structurally, and think in iterative, recursive, and parallel ways [Türkkan 2020].
The 2023 Education Vision document of the Turkish Ministry of National Education [MoNE 2019] emphasizes that CT skills are crucial for all learners [Özgür 2020]. In order to provide students, practice with higher-order computational thinking skills it is important to offer interdisciplinary learning strategies like programming, coding, and data visualization, which have been emphasized in updated Turkish information technology curriculum [MoNE 2017]. Likewise, others have presented numerous ways to implement CT in educational settings [Etemi and Uzunboylu 2020; Krauss and Prottsman 2016; Lye and Koh 2014; Bhar 2019; Senin and Nasri 2019; Septiyanti et al. 2020].
2.1 Computational Thinking (CT)
Computational thinking is comprehensive thinking that includes mathematical thinking, engineering thinking and scientific thinking [Korkmaz and Bai 2019; Adeniyi and Kuku 2020]. More broadly, an initial and extensive definition of computational thinking by Wing [2006; 2008] describes a process that involves solving problems, designing systems, and understanding human behavior, by drawing on the concepts fundamental to computer science. This wide-ranging description proposed a multitude-part definition with little consensus. However, there is broad agreement that it specified the essence of the framework - computational thinking relies on solving complex problems [Shute et al. 2017; Weintrop et al. 2016].
[Krauss and Prottsman 2016] specified a four-stage approach for educational programs to pose and have students solve problems for computation-oriented thinking. It consists of:
Decomposition: breaking down large and complex problems into manageable sub-components.
Pattern recognition: the ability to recognize parts of solutions applied in previous problems that might be reused or reapplied to similar but new problems. Pattern recognition describes the identification of patterns and commonalities in problems.
Abstraction: the core element of computational thinking is the ability to reduce problem complexity by removing unnecessary details and create the right model of the problem.
Algorithm design: designing systems to solve a given problem to formulate the step-by-step instructions to solve problems.
2.2 Data Visualization (DV)
Data visualization is the graphical representation of data [Sharma and Singh 2015], a field that is generating growing interest in data analytics and digital learning settings. Visualization, in this context, is not just the picture representing the data but also a two-way interaction between humans and their information resources for the purposes of knowledge discovery, verification, and the sharing of knowledge with others [Thomas et al. 2001]. The concept of data visualization, which can be defined in different ways in different disciplines, is defined by [Bikakis 2018:1] as…
…the presentation of data in a pictorial or graphical format, and a data visualization tool is the software that generates this presentation. Data visualization provides
288
Özkök G.A.: Fostering Computational Thinking Through Data Visualization and Design...
users with intuitive means to interactively explore and analyze data, enabling them to effectively identify interesting patterns, infer correlations and causalities, and supports sense-making activities. The use of visual aids is a well-established practice to help humans define,
understand, analyze, explore and navigate their way through tasks and problems in order to understand “situation” and make informed decisions [Varga et al. 2021].
Despite high interest, the adaptation of data visualization in education is a new and rapidly growing field. The educational uses of data visualization can vary widely across disciplines but fundamentally consists of learning from numbers via visual patterns [Krum 2013]. A visualization enables the students to more easily interpret the information, rather than being given a single numerical value summarizing the assessments carried out so far, a method which fails to convey the idea of a trajectory and a position within a cohort of students [Valentín et al. 2015]. Data visualization combines graphics and numerical data to create information that can be used to enhance students’ computational thinking.
3 Methodology
3.1 Research Model and Design
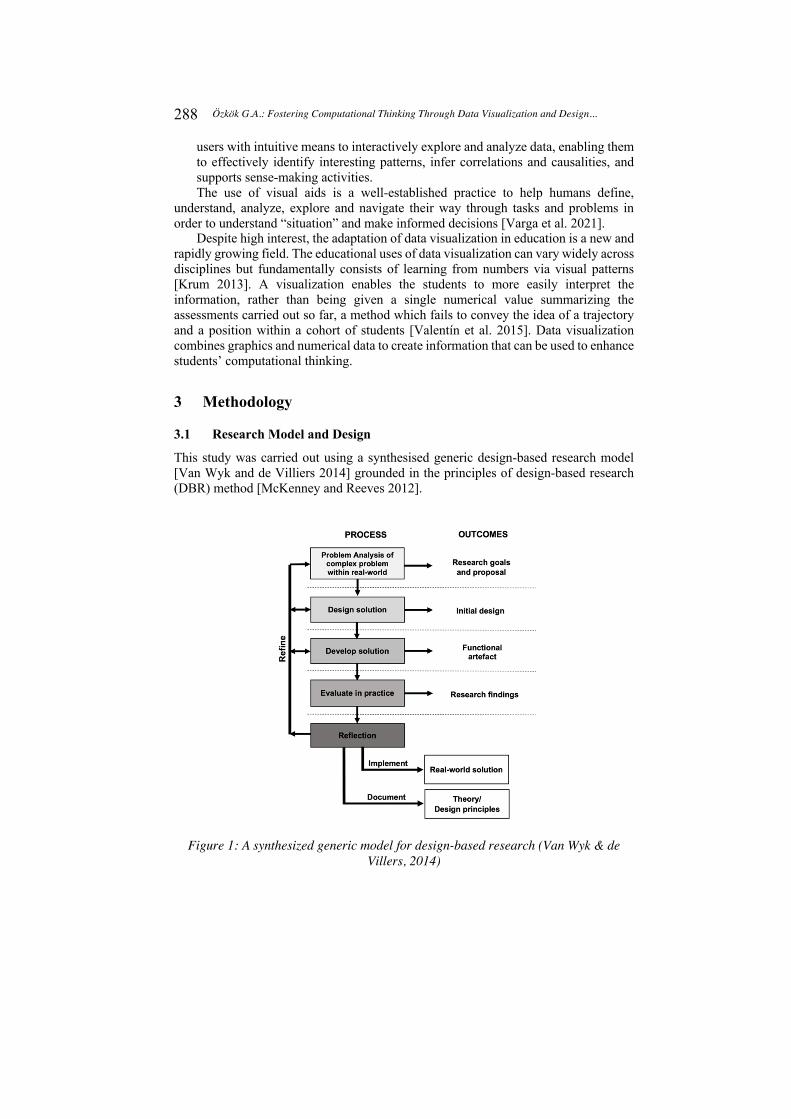
This study was carried out using a synthesised generic design-based research model [Van Wyk and de Villiers 2014] grounded in the principles of design-based research (DBR) method [McKenney and Reeves 2012].
Figure 1: A synthesized generic model for design-based research (Van Wyk & de Villers, 2014)
289
Özkök G.A.: Fostering Computational Thinking Through Data Visualization and Design...
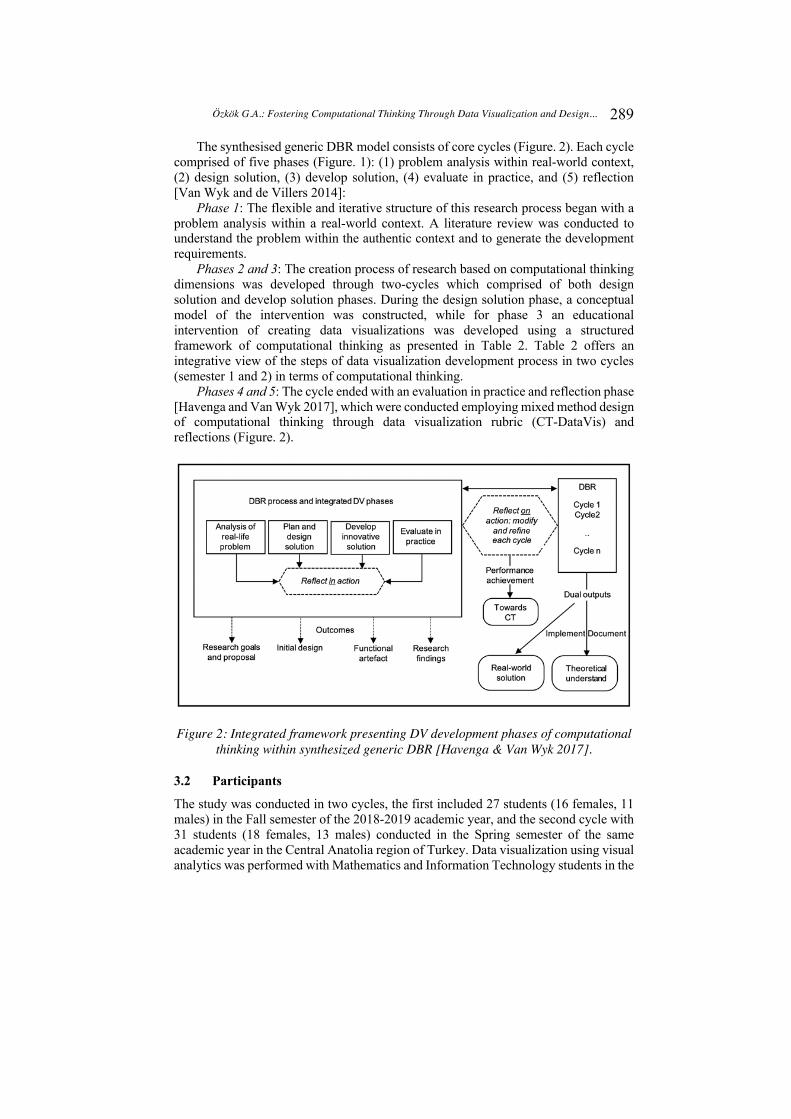
The synthesised generic DBR model consists of core cycles (Figure. 2). Each cycle comprised of five phases (Figure. 1): (1) problem analysis within real-world context, (2) design solution, (3) develop solution, (4) evaluate in practice, and (5) reflection [Van Wyk and de Villers 2014]:
Phase 1: The flexible and iterative structure of this research process began with a problem analysis within a real-world context. A literature review was conducted to understand the problem within the authentic context and to generate the development requirements.
Phases 2 and 3: The creation process of research based on computational thinking dimensions was developed through two-cycles which comprised of both design solution and develop solution phases. During the design solution phase, a conceptual model of the intervention was constructed, while for phase 3 an educational intervention of creating data visualizations was developed using a structured framework of computational thinking as presented in Table 2. Table 2 offers an integrative view of the steps of data visualization development process in two cycles (semester 1 and 2) in terms of computational thinking.
Phases 4 and 5: The cycle ended with an evaluation in practice and reflection phase [Havenga and Van Wyk 2017], which were conducted employing mixed method design of computational thinking through data visualization rubric (CT-DataVis) and reflections (Figure. 2).
Figure 2: Integrated framework presenting DV development phases of computational thinking within synthesized generic DBR [Havenga & Van Wyk 2017].
3.2 Participants
The study was conducted in two cycles, the first included 27 students (16 females, 11 males) in the Fall semester of the 2018-2019 academic year, and the second cycle with 31 students (18 females, 13 males) conducted in the Spring semester of the same academic year in the Central Anatolia region of Turkey. Data visualization using visual analytics was performed with Mathematics and Information Technology students in the
290
Özkök G.A.: Fostering Computational Thinking Through Data Visualization and Design...
11th grade who had encountered data visualization and visual analytics for the first time. Each cycle consisted of four weeks with two class hours each week.
3.3 Data Collection Tools
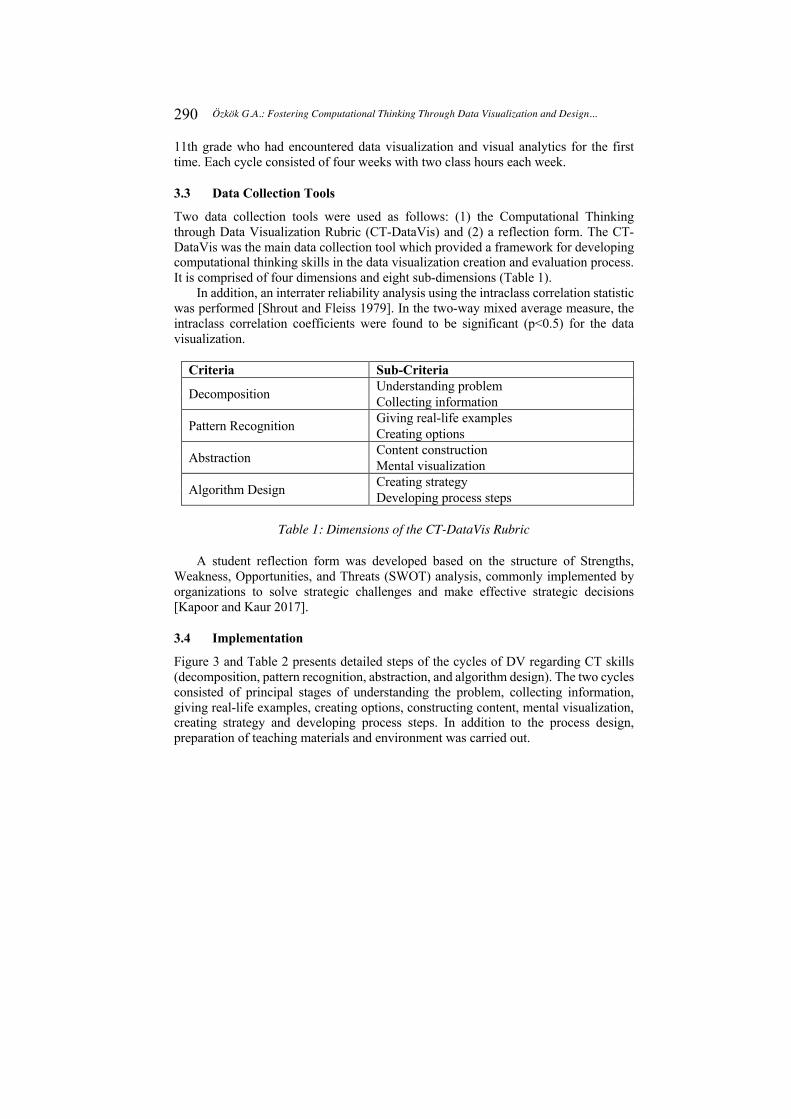
Two data collection tools were used as follows: (1) the Computational Thinking through Data Visualization Rubric (CT-DataVis) and (2) a reflection form. The CT-DataVis was the main data collection tool which provided a framework for developing computational thinking skills in the data visualization creation and evaluation process. It is comprised of four dimensions and eight sub-dimensions (Table 1).
In addition, an interrater reliability analysis using the intraclass correlation statistic was performed [Shrout and Fleiss 1979]. In the two-way mixed average measure, the intraclass correlation coefficients were found to be significant (p<0.5) for the data visualization.
Criteria Sub-Criteria
Decomposition Understanding problem Collecting information
Pattern Recognition Giving real-life examples Creating options
Abstraction Content construction Mental visualization
Algorithm Design Creating strategy Developing process steps
Table 1: Dimensions of the CT-DataVis Rubric
A student reflection form was developed based on the structure of Strengths, Weakness, Opportunities, and Threats (SWOT) analysis, commonly implemented by organizations to solve strategic challenges and make effective strategic decisions [Kapoor and Kaur 2017].
3.4 Implementation
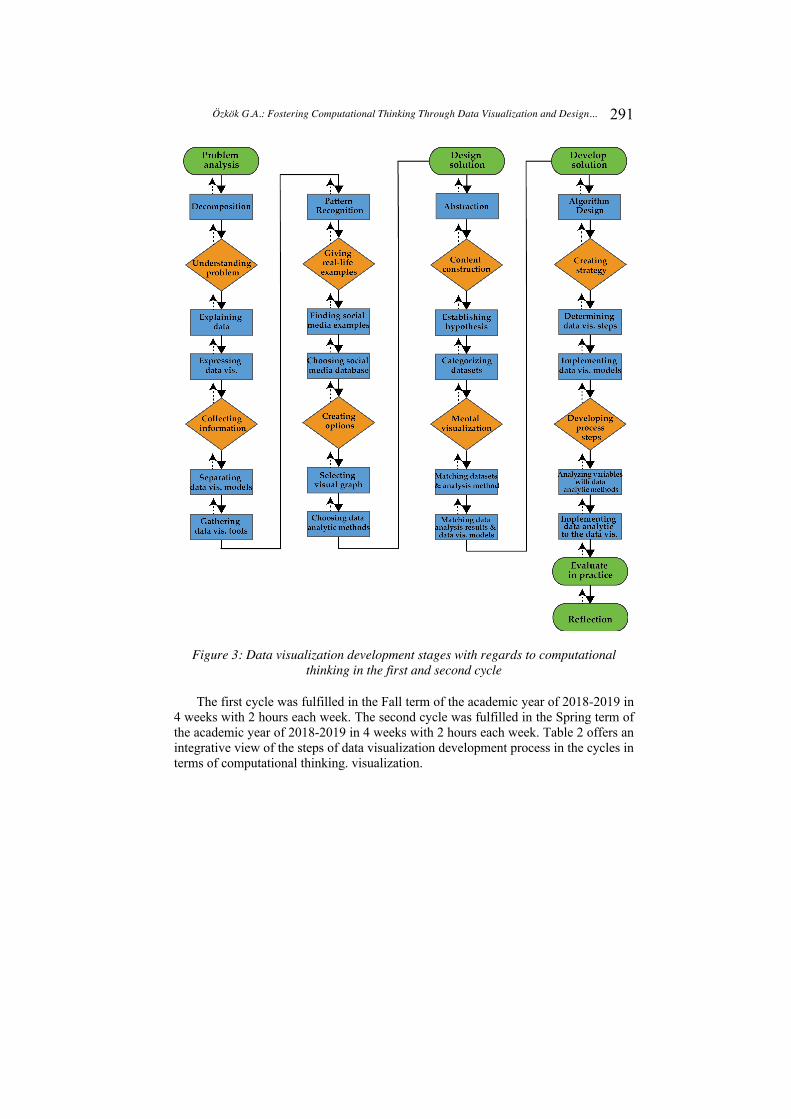
Figure 3 and Table 2 presents detailed steps of the cycles of DV regarding CT skills (decomposition, pattern recognition, abstraction, and algorithm design). The two cycles consisted of principal stages of understanding the problem, collecting information, giving real-life examples, creating options, constructing content, mental visualization, creating strategy and developing process steps. In addition to the process design, preparation of teaching materials and environment was carried out.
291
Özkök G.A.: Fostering Computational Thinking Through Data Visualization and Design...
Figure 3: Data visualization development stages with regards to computational thinking in the first and second cycle
The first cycle was fulfilled in the Fall term of the academic year of 2018-2019 in 4 weeks with 2 hours each week. The second cycle was fulfilled in the Spring term of the academic year of 2018-2019 in 4 weeks with 2 hours each week. Table 2 offers an integrative view of the steps of data visualization development process in the cycles in terms of computational thinking. visualization.
292
Özkök G.A.: Fostering Computational Thinking Through Data Visualization and Design...
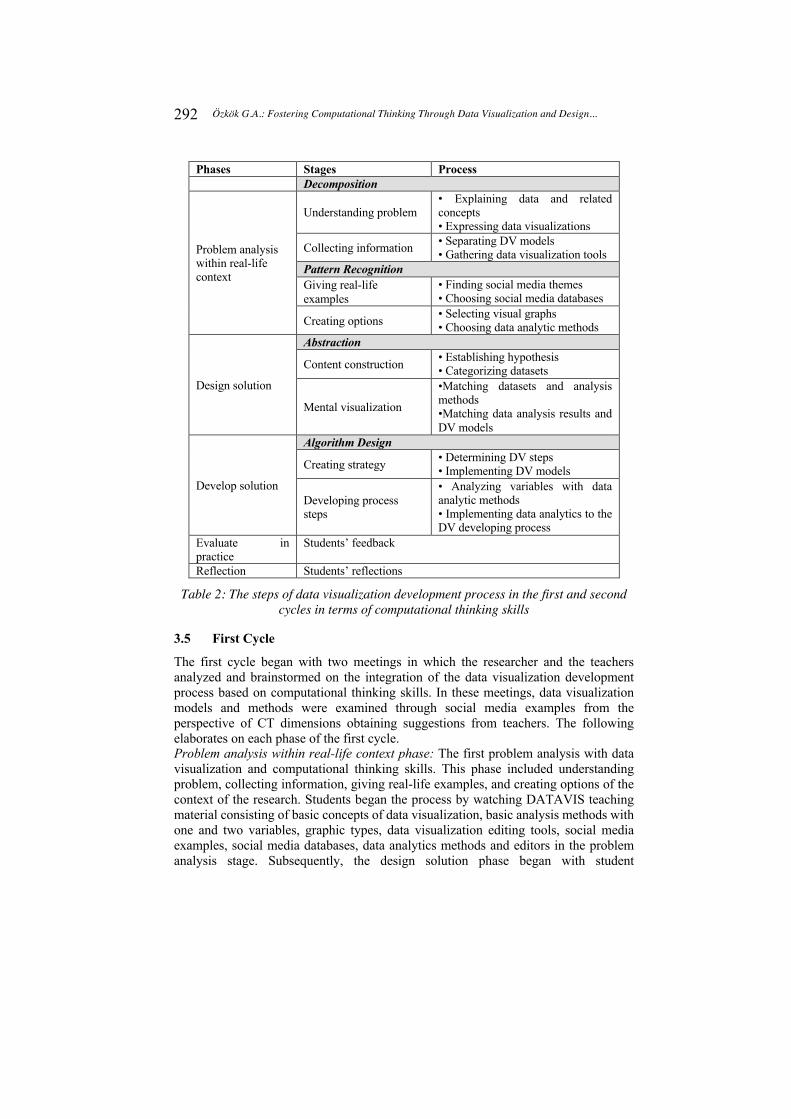
Phases Stages Process Decomposition
Problem analysis within real-life context
Understanding problem • Explaining data and related concepts • Expressing data visualizations
Collecting information • Separating DV models • Gathering data visualization tools
Pattern Recognition Giving real-life examples
• Finding social media themes • Choosing social media databases
Creating options • Selecting visual graphs • Choosing data analytic methods
Design solution
Abstraction
Content construction • Establishing hypothesis • Categorizing datasets
Mental visualization
•Matching datasets and analysis methods •Matching data analysis results and DV models
Develop solution
Algorithm Design
Creating strategy • Determining DV steps • Implementing DV models
Developing process steps
• Analyzing variables with data analytic methods • Implementing data analytics to the DV developing process
Evaluate in practice
Students’ feedback
Reflection Students’ reflections
Table 2: The steps of data visualization development process in the first and second cycles in terms of computational thinking skills
3.5 First Cycle
The first cycle began with two meetings in which the researcher and the teachers analyzed and brainstormed on the integration of the data visualization development process based on computational thinking skills. In these meetings, data visualization models and methods were examined through social media examples from the perspective of CT dimensions obtaining suggestions from teachers. The following elaborates on each phase of the first cycle. Problem analysis within real-life context phase: The first problem analysis with data visualization and computational thinking skills. This phase included understanding problem, collecting information, giving real-life examples, and creating options of the context of the research. Students began the process by watching DATAVIS teaching material consisting of basic concepts of data visualization, basic analysis methods with one and two variables, graphic types, data visualization editing tools, social media examples, social media databases, data analytics methods and editors in the problem analysis stage. Subsequently, the design solution phase began with student
293
Özkök G.A.: Fostering Computational Thinking Through Data Visualization and Design...
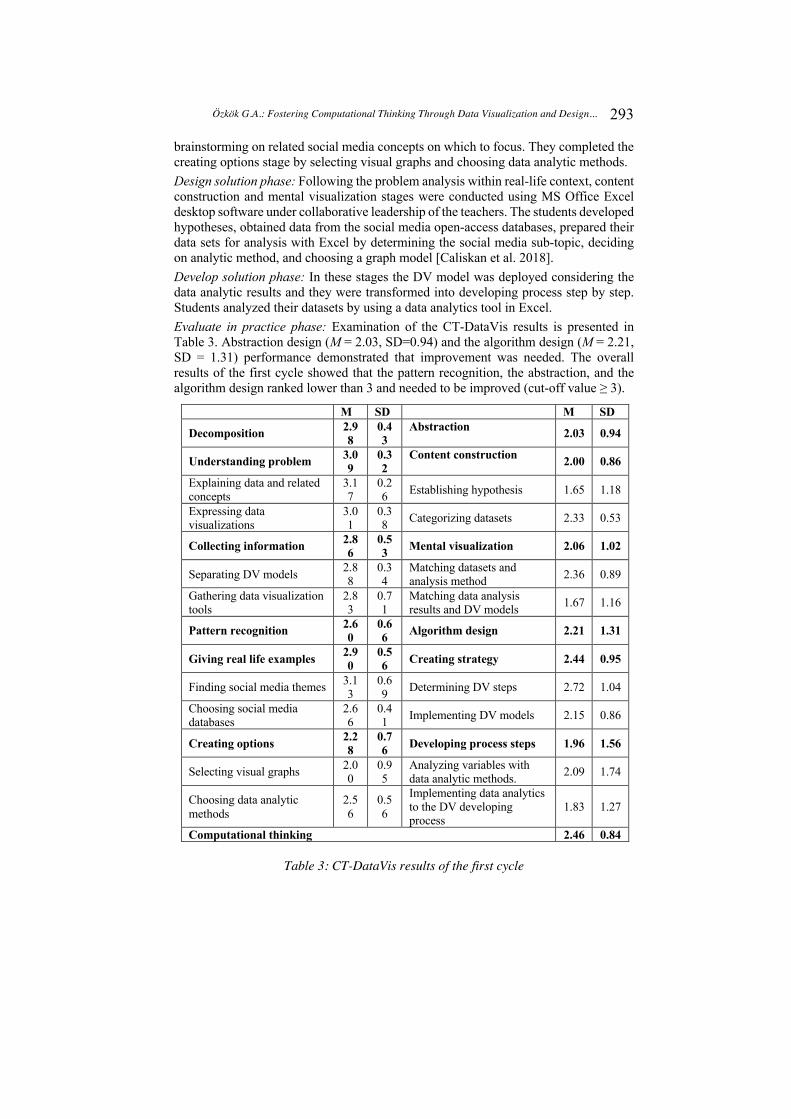
brainstorming on related social media concepts on which to focus. They completed the creating options stage by selecting visual graphs and choosing data analytic methods. Design solution phase: Following the problem analysis within real-life context, content construction and mental visualization stages were conducted using MS Office Excel desktop software under collaborative leadership of the teachers. The students developed hypotheses, obtained data from the social media open-access databases, prepared their data sets for analysis with Excel by determining the social media sub-topic, deciding on analytic method, and choosing a graph model [Caliskan et al. 2018]. Develop solution phase: In these stages the DV model was deployed considering the data analytic results and they were transformed into developing process step by step. Students analyzed their datasets by using a data analytics tool in Excel. Evaluate in practice phase: Examination of the CT-DataVis results is presented in Table 3. Abstraction design (M = 2.03, SD=0.94) and the algorithm design (M = 2.21, SD = 1.31) performance demonstrated that improvement was needed. The overall results of the first cycle showed that the pattern recognition, the abstraction, and the algorithm design ranked lower than 3 and needed to be improved (cut‐off value ≥ 3).
M SD M SD
Decomposition 2.98
0.43
Abstraction 2.03 0.94
Understanding problem 3.09
0.32
Content construction 2.00 0.86
Explaining data and related concepts
3.17
0.26 Establishing hypothesis 1.65 1.18
Expressing data visualizations
3.01
0.38 Categorizing datasets 2.33 0.53
Collecting information 2.86
0.53 Mental visualization 2.06 1.02
Separating DV models 2.88
0.34
Matching datasets and analysis method 2.36 0.89
Gathering data visualization tools
2.83
0.71
Matching data analysis results and DV models 1.67 1.16
Pattern recognition 2.60
0.66 Algorithm design 2.21 1.31
Giving real life examples 2.90
0.56 Creating strategy 2.44 0.95
Finding social media themes 3.13
0.69 Determining DV steps 2.72 1.04
Choosing social media databases
2.66
0.41 Implementing DV models 2.15 0.86
Creating options 2.28
0.76 Developing process steps 1.96 1.56
Selecting visual graphs 2.00
0.95
Analyzing variables with data analytic methods. 2.09 1.74
Choosing data analytic methods
2.56
0.56
Implementing data analytics to the DV developing process
1.83 1.27
Computational thinking 2.46 0.84
Table 3: CT-DataVis results of the first cycle
294
Özkök G.A.: Fostering Computational Thinking Through Data Visualization and Design...
Reflection: Sixty percent of the students stated in their reflections that they could carry out and understand the basic concepts of data visualization (data, data analytics, DV models, DV tools) while 76.4% stated they did not feel competent about establishing hypotheses. Meanwhile, 69.2% stated they could not match their data sets with a data analysis method, and 63.8% stated they could not match their data analysis results with graph types. Further, 66.4% stated they could not associate data visualization models with data analysis results well and 78.2% stated they were not good at implementing data analysis results to their data visualization developing process. In contrast, 49.7% emphasized that working with step-by-step DATAVIS teaching material following subsequent steps made the developing processes easier. However, 78.3% of them stated that inadequate time and the MS Office Excel spreadsheet made the development processes boring and difficult.
3.6 Second Cycle
The second cycle was initiated after we analyzed the CT-DataVis rubric and reflections results that indicated where student difficulties were. Thus, we rearranged the DATAVIS teaching material and guide. The most important change in the structure of the process was creating the DataVis interactive guide including a step-by-step explanation of processes starting from the planning phase and extending to the creation phase. The aim of this was to prevent students from focusing on the editor before developing their work.
According on the CT-DataVis rubric and reflections of the first implementation cycle, the development was strengthened by arranging the structure of the process through the reorganization of the steps. The content of the data visualization process was also shifted to a level which secondary school students could comprehend. The revision also refaced on two essential points: (1) how to help students establish meaningful interdisciplinary cooperation and (2) how to help them become more literate about data visualization. In order to establish a meaningful interdisciplinary cooperation between the Mathematics and the Information Technology lessons, the second cycle began with the preparation of an online learning module and an online data visualization library was also created to provide content support. In addition, since the data visualization development process required an intensive and lengthy data analysis process, we prepared ready-to-use social media datasets on spreadsheets for students. Thus, the cycle two data visualization development process began with the distribution of datasets, formulation of data and determining analysis method.
The first cycle demonstrated that the abstraction and algorithm design dimensions needed simplification before being offered to students. In addition, in light of the reflections, an open source, interactive, entertaining data visualization tool was implemented in the second cycle, instead of the MS Office Excel spreadsheet. Problem analysis within real-life context phase: The cycle two data visualization development process began with students watching DATAVIS material on data visualization creation steps and by evaluating data visualization examples. Students began content construction by brainstorming on a topic and data visualization was initiated by watching DATAVIS presentation on how to use open-source software (Orange3).
295
Özkök G.A.: Fostering Computational Thinking Through Data Visualization and Design...
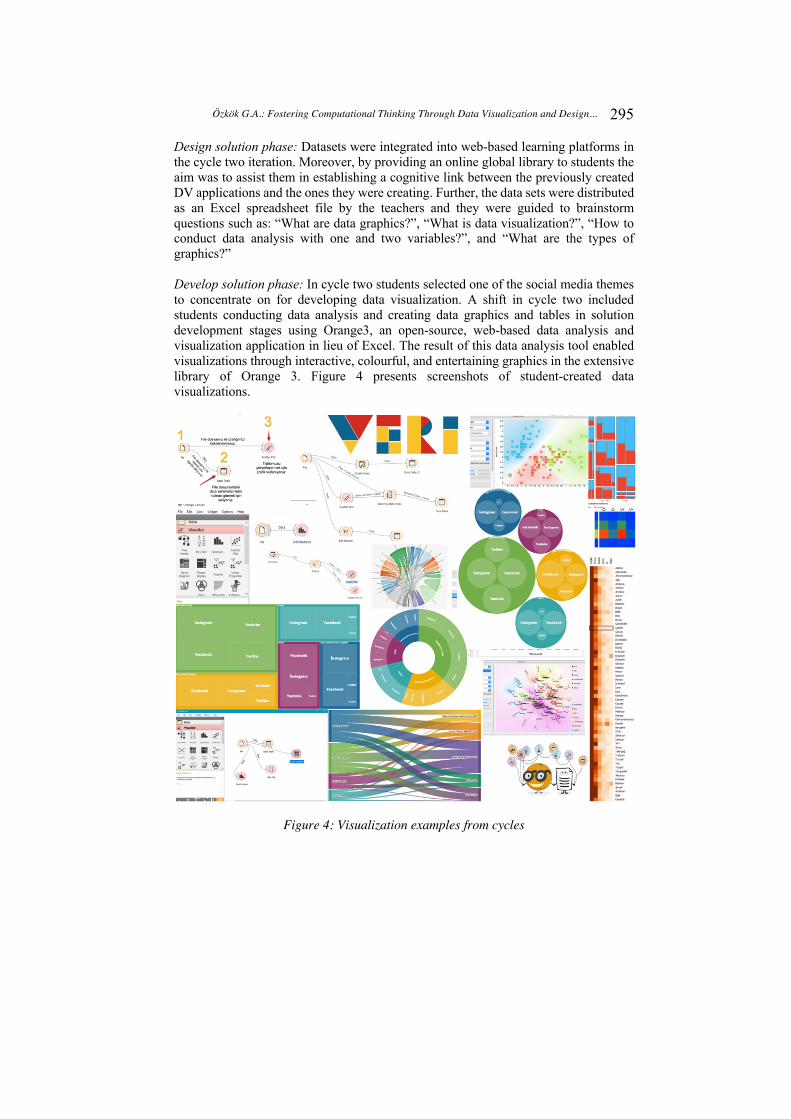
Design solution phase: Datasets were integrated into web-based learning platforms in the cycle two iteration. Moreover, by providing an online global library to students the aim was to assist them in establishing a cognitive link between the previously created DV applications and the ones they were creating. Further, the data sets were distributed as an Excel spreadsheet file by the teachers and they were guided to brainstorm questions such as: “What are data graphics?”, “What is data visualization?”, “How to conduct data analysis with one and two variables?”, and “What are the types of graphics?” Develop solution phase: In cycle two students selected one of the social media themes to concentrate on for developing data visualization. A shift in cycle two included students conducting data analysis and creating data graphics and tables in solution development stages using Orange3, an open-source, web-based data analysis and visualization application in lieu of Excel. The result of this data analysis tool enabled visualizations through interactive, colourful, and entertaining graphics in the extensive library of Orange 3. Figure 4 presents screenshots of student-created data visualizations.
Figure 4: Visualization examples from cycles
296
Özkök G.A.: Fostering Computational Thinking Through Data Visualization and Design...
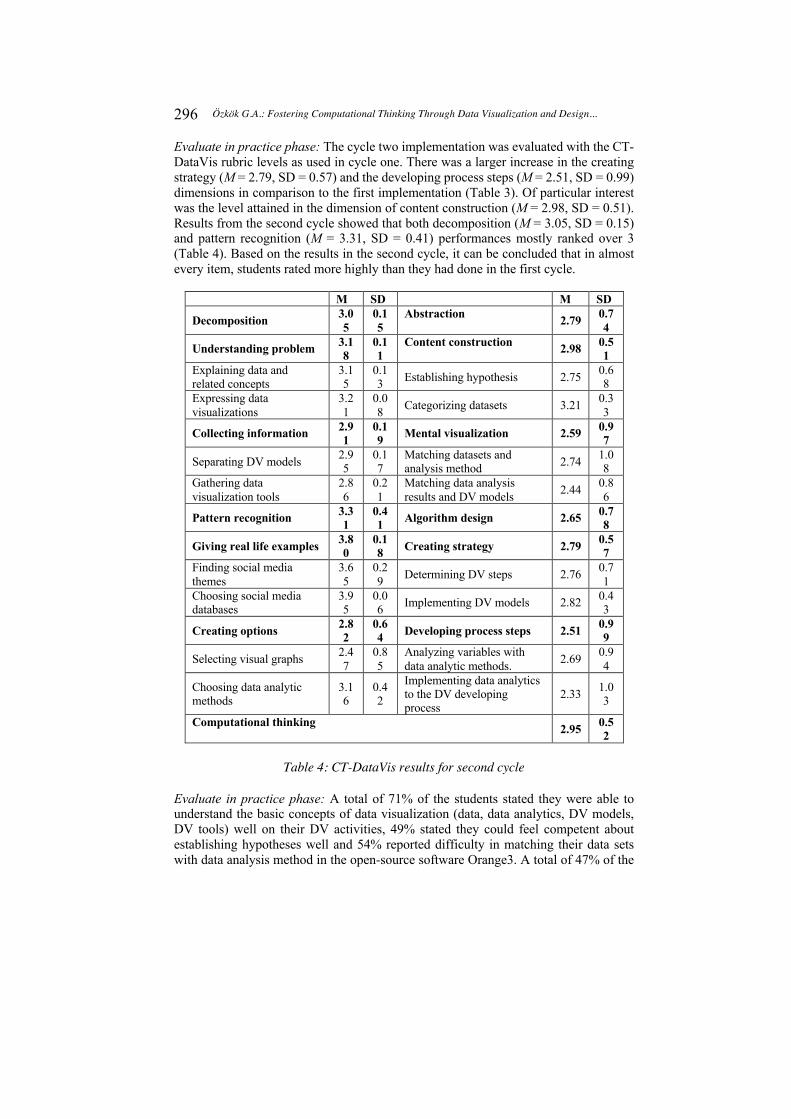
Evaluate in practice phase: The cycle two implementation was evaluated with the CT-DataVis rubric levels as used in cycle one. There was a larger increase in the creating strategy (M = 2.79, SD = 0.57) and the developing process steps (M = 2.51, SD = 0.99) dimensions in comparison to the first implementation (Table 3). Of particular interest was the level attained in the dimension of content construction (M = 2.98, SD = 0.51). Results from the second cycle showed that both decomposition (M = 3.05, SD = 0.15) and pattern recognition (M = 3.31, SD = 0.41) performances mostly ranked over 3 (Table 4). Based on the results in the second cycle, it can be concluded that in almost every item, students rated more highly than they had done in the first cycle.
M SD M SD
Decomposition 3.05
0.15
Abstraction 2.79 0.74
Understanding problem 3.18
0.11
Content construction 2.98 0.51
Explaining data and related concepts
3.15
0.13 Establishing hypothesis 2.75 0.6
8 Expressing data visualizations
3.21
0.08 Categorizing datasets 3.21 0.3
3
Collecting information 2.91
0.19 Mental visualization 2.59 0.9
7
Separating DV models 2.95
0.17
Matching datasets and analysis method 2.74 1.0
8 Gathering data visualization tools
2.86
0.21
Matching data analysis results and DV models 2.44 0.8
6
Pattern recognition 3.31
0.41 Algorithm design 2.65 0.7
8
Giving real life examples 3.80
0.18 Creating strategy 2.79 0.5
7 Finding social media themes
3.65
0.29 Determining DV steps 2.76 0.7
1 Choosing social media databases
3.95
0.06 Implementing DV models 2.82 0.4
3
Creating options 2.82
0.64 Developing process steps 2.51 0.9
9
Selecting visual graphs 2.47
0.85
Analyzing variables with data analytic methods. 2.69 0.9
4
Choosing data analytic methods
3.16
0.42
Implementing data analytics to the DV developing process
2.33 1.03
Computational thinking 2.95 0.52
Table 4: CT-DataVis results for second cycle
Evaluate in practice phase: A total of 71% of the students stated they were able to understand the basic concepts of data visualization (data, data analytics, DV models, DV tools) well on their DV activities, 49% stated they could feel competent about establishing hypotheses well and 54% reported difficulty in matching their data sets with data analysis method in the open-source software Orange3. A total of 47% of the
297
Özkök G.A.: Fostering Computational Thinking Through Data Visualization and Design...
students reported Orange3 made the matching of their data analysis results with graph types process easier, while 31% reported that their insufficient knowledge of the operation of the open-source software was a factor that made the process more difficult.
4 Results
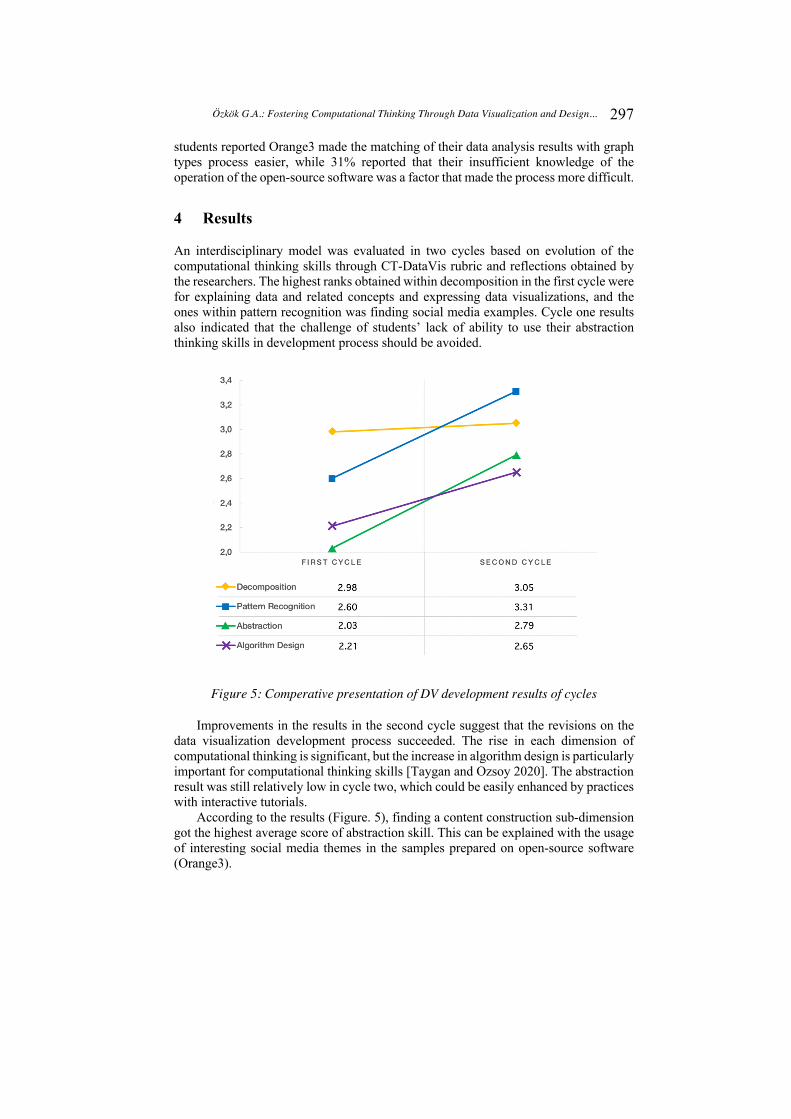
An interdisciplinary model was evaluated in two cycles based on evolution of the computational thinking skills through CT-DataVis rubric and reflections obtained by the researchers. The highest ranks obtained within decomposition in the first cycle were for explaining data and related concepts and expressing data visualizations, and the ones within pattern recognition was finding social media examples. Cycle one results also indicated that the challenge of students’ lack of ability to use their abstraction thinking skills in development process should be avoided.
Figure 5: Comperative presentation of DV development results of cycles
Improvements in the results in the second cycle suggest that the revisions on the data visualization development process succeeded. The rise in each dimension of computational thinking is significant, but the increase in algorithm design is particularly important for computational thinking skills [Taygan and Ozsoy 2020]. The abstraction result was still relatively low in cycle two, which could be easily enhanced by practices with interactive tutorials.
According to the results (Figure. 5), finding a content construction sub-dimension got the highest average score of abstraction skill. This can be explained with the usage of interesting social media themes in the samples prepared on open-source software (Orange3).
298
Özkök G.A.: Fostering Computational Thinking Through Data Visualization and Design...
5 Discussion
According to the results of the first and second cycles, the model had a noticeable effect on enhancing students’ computational thinking skills. The improvement on the quality of the students’ computational thinking skills through data visualizations during both cycles can be interpreted as good indications of research results that meet research expectations. The observed improvement of students’ computational thinking skills is another indication that could be a starting point for future studies [Pascu et al. 2019].
Furthermore, the improved data visualization creation results from the first to second cycle indicated that the proposed data visualization model could be used to demonstrate complex datasets by students visualizing data in a visual form. The process could also provide learning situations to construct data in a learning setting, and then present that constructed data visually by using data analytics tools. As emphasized by [Krauss and Prottsman 2016], this study combines computational thinking and data visualization, and proposes data visualization activity for gain computational thinking skills. Beyond previous studies on computational thinking [Dyjur and Li 2015; Gallicano et al. 2014; Matrix and Hodson 2014; Mendenhall and Summers 2015; Thompson 2015] this study handles data visualization creation to improve students’ computational thinking skills. Previous studies have shown that computational thinking led to improved outputs. This study was built on those results to show the effectiveness of the data visualization model.
Adding a DATAVIS guide on how to create data visualization, including data visualization step-by-step development tutorials and extended interactive DATAVIS presentation and offering open-source data analytic software in the second cycle were the main modifications.
Examining the data visualization development scores from the perspective of CT-DataVis demonstrates that the students’ CT skills improved in the second cycle except for a minor decrease in mental visualization dimension.
It can be stated that the most significant reason behind these improvements was replacing commercial software (MS Office Excel), which was employed in the first cycle, with open-source software (Orange3) in the second cycle. On the other hand, improvement in the content construction dimension was especially apparent from the activities that were included in the preparation phase of the creation process in the second cycle that was intended to improve the creating strategy and developing process steps stages.
The results of CT-DataVis of both cycles show there was a partial increase in the sub-criteria of finding an interesting novel situation and giving real-life examples in the second cycle; however, there was a remarkable increase in all of the other criteria.
Likewise, using an open-source software affected the increase in all of the other sub-criteria. The increase in the algorithm design dimension of the second cycle resulted from the practical activities conducted through an open-source data analysis software in the process of creating strategy and developing process steps stages [Gulluoglu et al. 2020]. Students’ perception of open-source data analysis software as an entertaining and interesting one eased the development process, while working in an innovative environment and the inadequacy of reinforcing practices of establishing relationships among graphics through data analysis hardened it.
299
Özkök G.A.: Fostering Computational Thinking Through Data Visualization and Design...
Further, one of the most important changes in the second cycle, in line with the evaluation, was creating activities to increase students’ knowledge and skills in establishing a hypothesis. Graphics developed in the second cycle show that using an open-source data analysis software affected students’ competence in analysing variables with data analysis methods.
6 Conclusions
The relative elevation in the algorithm design dimension compared to the first cycle resulted from the supporting instructions which provided step-by-step guidance with a DATAVIS guide for students during the process starting from transferring the data sets to the open-source data analysis software to turning the data into graphics.
In future studies, implementations conducted with different open-source tools can be observed to further adjust the data visualization model. The responses that students provided for the rubric questions indicated an increase in the average of finding a mental visualization sub-dimension. The skill of finding a mental visualization means that students can offer new practical ideas or new solutions to problems.
Data visualization implementations students made through social media examples in various subjects helped them see new situations and create novel ideas. Meanwhile, the reflections of teachers obtained in the end of the second cycle indicated that using an open-source data visualization software, differing from the first cycle, was more entertaining and had an impact on increasing the score of algorithm design dimension. The data visualization applications which were developed by the students revealed that interdisciplinary data visualization applications could be used in learning and teaching processes as an alternative learning model considering the findings and development of computational thinking skills in both cycles.
This research suggests that data visualization creation processes are an effective computational thinking learning method for secondary school students. We can recommend that teachers collaborate on the fields of data analysis and data graphics in order to implement the interdisciplinary data visualization model targeting to improve computational thinking skills. Collaborative activities which are not included in the data visualization development process in this research could be a focus of further study for its potential in development process.
References
[Abdi and Sharyati 2019] Abdi, M., Sharyati, A.: “Comparing the Training Effects of Problem-solving and Coping Skills with Stress”; Global Journal of Psychology Research: New Trends and Issues, 9,1 (2019), 16–22. [Adeniyi and Kuku 2020] Adeniyi, S. O., Kuku, O. O.: “Impact of Learning Interventions on Mathematics Achievement Among Learners with Hearing İmpairment”; Contemporary Educational Researches Journal, 10, 4 (2020), 131–143. [Assante et al. 2019] Assante, D., Caforio, A., Flamini, M. and Romano, E.: “Smart Education in the Context of Industry 4.0”; Proc. IEEE Global Engineering Education Conference (EDUCON), United Arab Emirates (2019), 1140–1145.
300
Özkök G.A.: Fostering Computational Thinking Through Data Visualization and Design...
[Berry 2013] Berry, M.: “Computing in the National Curriculum. A Guide for Primary Teachers”; Computing at School and NAACE, Electronic-only journal: www.computingatschool.org.uk/ primary, accessed: 02.24.2021
[Bhar 2019] Bhar, A. K.: “Design & Implementation of a Personal Cash Flow Program Using Microsoft Excel®”; Global Journal of Business, Economics and Management, 9, 1 (2019), 29–40.
[Bikakis 2018] Bikakis, N.: “Big Data Visualization Tools”; arXiv preprint (2018), arXiv: arxiv.org/abs/1801.08336
[Caliskan et al. 2018] Caliskan, S., Uzunboylu, H., Tugun, N.: “Pre-service Teachers' Views on the Use of Social Network Sites”; Journal for Educators, Teachers and Trainers, 9, 2 (2018), 109–117.
[Çalişkan 2020] Çalişkan, E.: “The Effects of Robotics Programming on Secondary School Students’ Problem-solving Skills”; World Journal on Educational Technology: Current Issues, 12, 4 (2020), 217–230.
[CSTA 2016] CSTA: “K-12 Computer Science Standards”; (2016), Electronic-only journal: https//c.ymcdn.com/sites/www.csteachers.org/resource/resmgr/Docs/Standards/2016Standards Revision/INTERIM_Standards FINAL_07222.pdf, accessed: 02.24.2021
[Dyjur and Li 2015] Dyjur, P., Li, L.: “Learning 21st Century Skills by Engaging in an Infographics Assessment”; Proc. IDEAS: Designing Responsive Pedagogy Conference, Calgary, Canada (2015), 62–71.
Etemi and Uzunboylu 2020] Etemi, B.P., Uzunboylu, H.: “The Effects of Flipped Learning Method on Student’s Perception and Learning of Java Programming”; International Journal of Engineering Education, 36, 4(2020), 1372–1382.
[Fitsumbirhan et al. 2020] Fitsumbirhan, G., Kelkay, A. D., Asrat, A.: “Data-based Decision-making Practices in Secondary Schools of North Gondar”; Global Journal of Guidance and Counseling in Schools: Current Perspectives, Ethiopia, 10, 1(2020), 36–48.
[Gallicano et al. 2014] Gallicano, T. D., Ekachai, D., Freberg, K.: “The Infographics Assignment: A Qualitative Study of Students’ and Professionals’ Perspectives”; Public Relations Journal, 8, 4 (2014), 1–22, Electronic-only journal: http://mistymfall2105.weebly.com/uploads/4/7/1/5/47154733/infographics_research_article_3.pdf, accessed: 02.24.2021
[Gulluoglu et al. 2020] Gulluoglu, B., Arifoglu, E., Karahoca, A. and Karahoca, D.: “Customer Segmentation for Churn Management by Using Ant Colony Algorithm”; Global Journal of Computer Sciences: Theory and Research, 10, 1(2020), 18–26.
[Havenga and Van Wyk 2017] Havenga, M., Van Wyk, M. M.: “A Conceptualised Design-based Research Framework for a Problem-based Learning Approach in a First-year Engineering Course”; Global Journal of Engineering Education; 19, 3(2017), 200–206.
[Kapoor and Kaur 2017] Kapoor, S., Kaur, M.: “Basel III Norms: A SWOT and TOWS Approach”; Vision, 21, 3(2017), 250–258.
[Kim et al. 2014] Kim, Y. C., Kwon, D. Y., Lee, W. G.: “Computational Modeling and Simulation for Learning an Automation Concept in Programming Course”; International Journal of Computer Theory and Engineering, 6, (2014), 341–345.
[Korkmaz and Bai 2019] Korkmaz, Ö., Bai, X.: “Adapting Computational Thinking Scale (CTS) for Chinese High School Students and Their Thinking Scale Skills Level”; Participatory Educational Research (Per), 6, 1(2019),10–26.
301
Özkök G.A.: Fostering Computational Thinking Through Data Visualization and Design...
[Krauss and Prottsman 2016] Krauss, J., Prottsman, K.: “Computational Thinking and Coding for Every Student: The Teacher's Getting-Started Guide”; Corwin Press (2016).
[Krum 2013] Krum, R.: “Cool Infographics: Effective Communication with Data Visualization and Design”; Indianapolis, IN: John Wiley & Sons (2013).
[Lye and Koh 2014] Lye, S. Y. and Koh, J. H. L.: “Review on Teaching and Learning of Computational Thinking Through Programming: What is next for k-12?”; Computers in Human Behavior, 41, (2014), 51–61.
[Matrix and Hodson 2014] Matrix, S., Hodson, J.: “Teaching with Infographics: Practicing New Digital Competencies and Visual Literacies”; Journal of Pedagogic Development, 3, 2 (2014), 17–27.
[McKenney and Reeves 2012] McKenney, S., Reeves, T. C.: “Conducting Educational Design Research: What it is, How we do it, and Why”; London: Routledge, (2012), 1–256.
[Mendenhall and Summers 2015] Mendenhall, S., Summers, S.: “Designing Research: Using Infographics to Teach Design Thinking in Composition”; In Journal of Global Literacies, Technologies, and Emerging Pedagogies, 3, 1(2015), 359–371.
[Mian et al. 2020] Mian, S. H., Salah, B., Ameen, W., Moiduddin, K. and Alkhalefah, H.: “Adapting Universities for Sustainability Education in Industry 4.0: Channel of Challenges and Opportunities”; MDPI AG, Sustainability, 12, 15(2020), 6100.
[MoNE 2017] MoNE: “Computer Science Course Curriculum”; Electronic-only journal: http://mufredat.meb.gov.tr/ProgramDetay.aspx?PID=335, (2017), accessed: 02.24.2021
[MoNE 2019] MoNE: “Turkey’s Education Vision 2023”; Electronic-only journal: http://2023vizyonu.meb.gov.tr/doc/2023_VIZYON_ENG.pdf, (2019), accessed: 02.24.2021
[Özgür 2020] Özgür, H.: “Relationships Between Computational Thinking Skills, Ways of Thinking and Demographic Variables: A Structural Equation Modelling”; International Journal of Research in Education and Science (IJRES), 6, 2(2020), 299–314.
[P21 2011] Partnership for 21st Century Skills (P21): “P21 Common Core Toolkit”; Electronic-only journal: https://files.eric.ed.gov/fulltext/ED543030.pdf, (2011), accessed: 02.24.2021
[Pascu, Simo and Vernica 2019] Pascu, L., Simo, A., Vernica, A. M.: “Integrating Microsoft IoT, Machine Learning in a Large-scale Power Meter Reading”; International Journal of New Trends in Social Sciences, 3, 1(2019), 10–16.
[Selby 2015] Selby, C.: “Relationships: Computational Thinking, Pedagogy of Programming, and Bloom's Taxonomy”; Proc. Workshop in Primary and Secondary Computing Education (WiPSCE '15). ACM, New York, USA, (2015), 80–87.
[Senin and Nasri 2019] Senin, S., Nasri, N. M.: “Teachers’ Concern Towards Applying Computational Thinking Skills in Teaching and Learning Teachers’ Concern Towards Applying Computational Thinking Skills in Teaching and Learning”; International Journal of Academic Research in Business and Social Sciences, 9, 1(2019), 296–310.
[Septiyanti et al. 2020] Septiyanti, N. D., Shih, J., Zakarijah, M.: “Fostering Computational Thinking Through Unplugged and Robotic Collaborative Game-Based Learning on Primary School Students”; American Journal of Educational Research, 8, 11(2020), 866–872.
[Shailaja and Sridaran 2015] Shailaja, J., Sridaran, R.: “Computational Thinking the Intellectual Thinking for the 21st Century”; International Journal of Advanced Networking & Applications, Special Issue, (2015), 39–46.
302
Özkök G.A.: Fostering Computational Thinking Through Data Visualization and Design...
[Sharma and Singh 2015] Sharma, A., Singh, P.: “Data Visualization and Techniques”; Binary Journal of Data Mining & Networking, 5, 1(2015), 13–15.
[Shrout and Fleiss 1979] Shrout, P. E., Fleiss, J. L.: “Intraclass Correlations: Uses in Assessing Rater Reliability”; Psychological Bulletin, 86, 2(1979), 420–428.
[Shute et al. 2017] Shute, V. J., Sun, C., Clarke, J., A.: “Demystifying Computational Thinking”; Educational Research Review, 22, (2017), 142–158.
[Skordialos and Baralis 2018] Skordialos, E., Baralis, G.: “A Teaching Approach of Geometric Shapes’ Properties with the Use of Online Educational Tools in Greek Primary School”; New Trends and Issues Proceedings on Humanities and Social Sciences, 4, 9(2018), 101–109.
[Taygan and Ozsoy 2020] Taygan, U., Ozsoy, A.: “Performance Analysis and GPU Parallelisation of ECO Object Tracking Algorithm”; New Trends and Issues Proceedings on Advances in Pure and Applied Sciences, 12, (2020), 109–118.
[Thomas et al. 2001] Thomas, J., Cowley, P., Kuchar, O., Nowell, L., Thomson, J., Wong, P.C.: “Discovering Knowledge Through Visual Analysis”; Journal of Universal Computer Science, 7, 6(2001), 517–529.
[Thompson 2015] Thompson, C. M.: “Creating “Visual Legacies”: Infographics as a Means of Interpreting and Sharing Research”; Communication Teacher, 29, (2015), 91–101.
[Türkkan 2020] Türkkan, H.: “The Significance of Typography in Data Visualisation”; Global Journal of Arts Education, 10, 1(2020), 75–84.
[Van Wyk and de Villiers 2014] Van Wyk, M., M., and de Villiers, M. R.: “Applying Design-based Research for Developing Virtual Reality Training in the South African Mining Industry”; Proc. SAICSIT Annual Conf. of Southern African Institute for Computer Scientist and Infor. Technologists, Centurion, South Africa, (2014), 70–81.
[Valentín et al. 2015] Valentín, L. F., Pardo, A., Hernández, F., L., Burgos, D.: “A Visual Analytics Method for Score Estimation in Learning Courses”; Journal of Universal Computer Science, 21, 1 (2015), 134–155.
[Varga et al. 2021] Varga, M., Webb, H., Krilavičius, T., Maiden, M.: “Visualization and Visual Analytics in Knowledge Landscapes”; Navigating Digital Health Landscapes: A Multidisciplinary Analysis, Springer Singapore, (2021), 297–318.
[Voogt et al. 2015] Voogt, J., Fisser, P., Good, J., Mishra, P. and Yadav, A.: “Computational Thinking in Compulsory Education: Towards an Agenda for Research and Practice”; Education and Information Technologies, 20, 4, (2015),715–728.
[Weintrop et al. 2016] Weintrop, D., Beheshti, E., Horn, M., Orton, K., Jona, K., Trouille, L. and Wilensky, U.: Defining Computational Thinking for Mathematics and Science Classrooms; Journal of Science Education and Technology, 25, 1(2016), 127–147.
[Wing 2006] Wing, J. M.: “Computational thinking”; Communications of the ACM,49, 3(2006), 33–35.
[Wing 2008] Wing, J. M.: “Computational thinking and thinking about computing”; Philosophical transactions of the royal society of London A: mathematical, physical, and engineering sciences, 366, 1881(2008), 3717–3725.