
forward thinking - Maple Leaf Foods thinking Maple Leaf Foods Inc. 30 St. Clair Avenue West, Suite...
96
forward thinking Maple Leaf Foods Inc. annual report 2009
Transcript of forward thinking - Maple Leaf Foods thinking Maple Leaf Foods Inc. 30 St. Clair Avenue West, Suite...
forward thinking
Maple Leaf Foods Inc. 30 St. Clair Avenue West, Suite 1500Toronto, Ontario, Canada m4v 3a2www.mapleleaf.com
Maple Leaf Foods Inc. annual report 2009
MLF_AR_ENG_CVR.indd 1 16/03/10 7:16 AM
at a glance
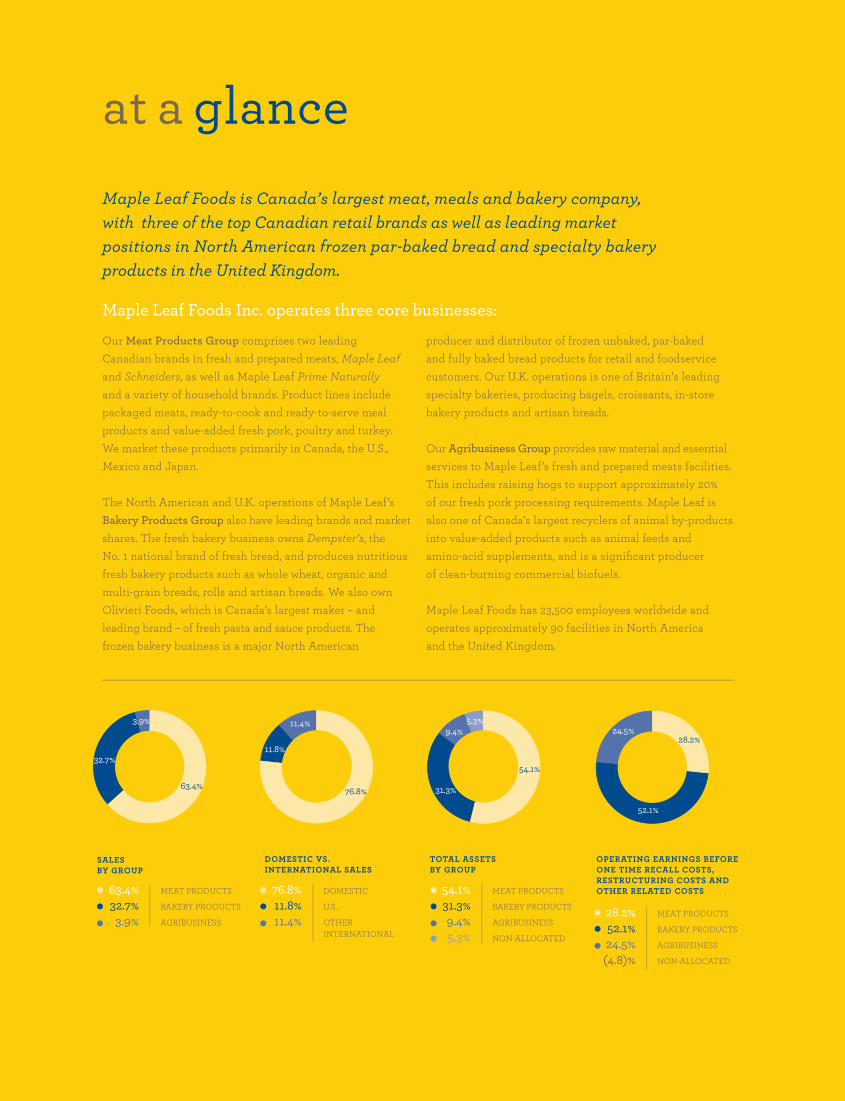
Our Meat Products Group comprises two leading Canadian brands in fresh and prepared meats, Maple Leaf and Schneiders, as well as Maple Leaf Prime Naturally and a variety of household brands. Product lines include packaged meats, ready-to-cook and ready-to-serve meal products and value-added fresh pork, poultry and turkey. We market these products primarily in Canada, the U.S., Mexico and Japan.
The North American and U.K. operations of Maple Leaf’s Bakery Products Group also have leading brands and market shares. The fresh bakery business owns Dempster’s, the No. 1 national brand of fresh bread, and produces nutritious fresh bakery products such as whole wheat, organic and multi-grain breads, rolls and artisan breads. We also ownOlivieri Foods, which is Canada’s largest maker – and leading brand – of fresh pasta and sauce products. The frozen bakery business is a major North American
producer and distributor of frozen unbaked, par-baked and fully baked bread products for retail and foodservice customers. Our U.K. operations is one of Britain’s leading specialty bakeries, producing bagels, croissants, in-store bakery products and artisan breads.
Our Agribusiness Group provides raw material and essential services to Maple Leaf’s fresh and prepared meats facilities. This includes raising hogs to support approximately 20% of our fresh pork processing requirements. Maple Leaf is also one of Canada’s largest recyclers of animal by-products into value-added products such as animal feeds and amino-acid supplements, and is a signifi cant producer of clean-burning commercial biofuels.
Maple Leaf Foods has 23,500 employees worldwide and operates approximately 90 facilities in North America and the United Kingdom.
Maple Leaf Foods is Canada’s largest meat, meals and bakery company, with three of the top Canadian retail brands as well as leading market positions in North American frozen par-baked bread and specialty bakery products in the United Kingdom.
TOTAL ASSETS BY GROUP
SALES BY GROUP
DOMESTIC VS. INTERNATIONAL SALES
OPERATING EARNINGS BEFORE ONE TIME RECALL COSTS, RESTRUCTURING COSTS AND OTHER RELATED COSTS
76.8%
11.8%
11.4%
28.2%
52.1%
24.5%
54.1%
31.3%
9.4%5.3%
28.2% MEAT PRODUCTS
52.1% BAKERY PRODUCTS
24.5% AGRIBUSINESS
(4.8)% NON-ALLOCATED
54.1% MEAT PRODUCTS
31.3% BAKERY PRODUCTS
9.4% AGRIBUSINESS
5.3% NON-ALLOCATED
76.8% DOMESTIC
11.8% U.S.
11.4% OTHER INTERNATIONAL
63.4% MEAT PRODUCTS
32.7% BAKERY PRODUCTS
3.9% AGRIBUSINESS
3.9%
32.7%
63.4%
Maple Leaf Foods Inc. operates three core businesses:
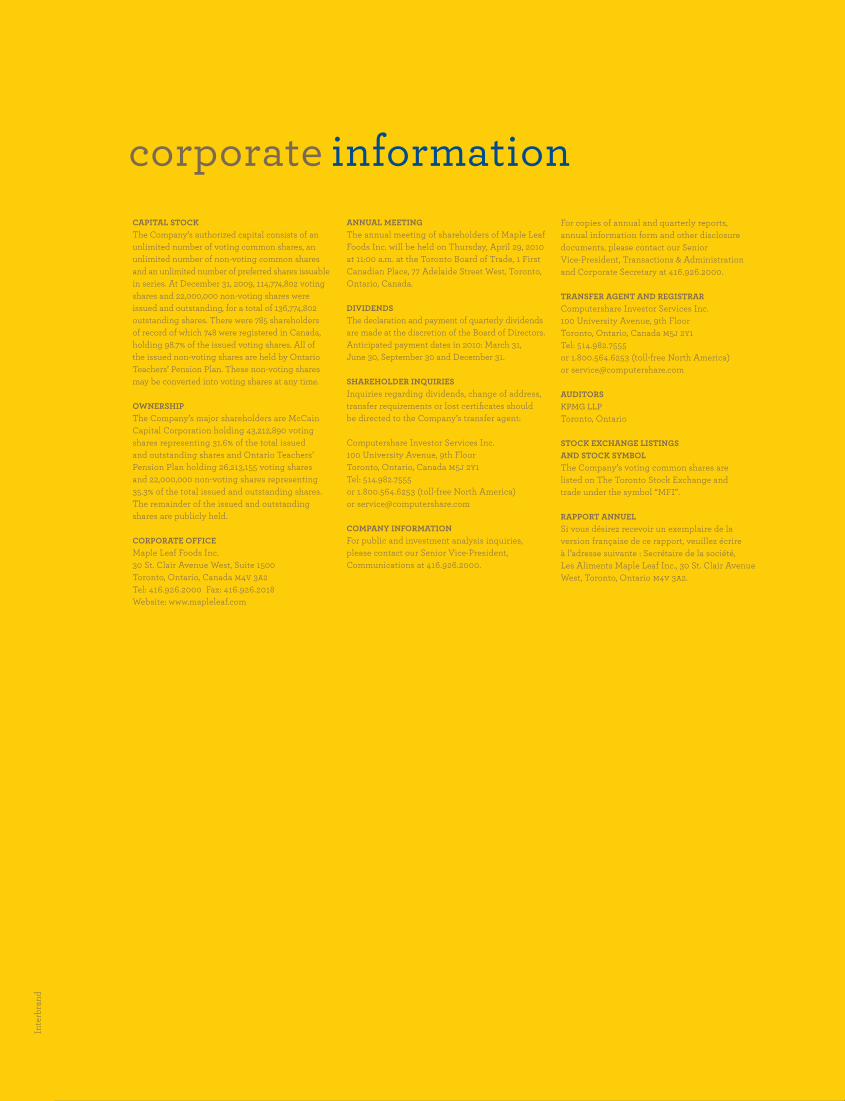
CAPITAL STOCKThe Company’s authorized capital consists of an unlimited number of voting common shares, an unlimited number of non-voting common shares and an unlimited number of preferred shares issuable in series. At December 31, 2009, 114,774,802 voting shares and 22,000,000 non-voting shares were issued and outstanding, for a total of 136,774,802 outstanding shares. There were 785 shareholders of record of which 748 were registered in Canada, holding 98.7% of the issued voting shares. All of the issued non-voting shares are held by Ontario Teachers’ Pension Plan. These non-voting shares may be converted into voting shares at any time.
OWNERSHIP The Company’s major shareholders are McCain Capital Corporation holding 43,212,890 voting shares representing 31.6% of the total issued and outstanding shares and Ontario Teachers’ Pension Plan holding 26,213,155 voting shares and 22,000,000 non-voting shares representing 35.3% of the total issued and outstanding shares. The remainder of the issued and outstanding shares are publicly held.
CORPORATE OFFICEMaple Leaf Foods Inc.30 St. Clair Avenue West, Suite 1500Toronto, Ontario, Canada m4v 3a2Tel: 416.926.2000 Fax: 416.926.2018Website: www.mapleleaf.com
ANNUAL MEETINGThe annual meeting of shareholders of Maple Leaf Foods Inc. will be held on Thursday, April 29, 2010 at 11:00 a.m. at the Toronto Board of Trade, 1 First Canadian Place, 77 Adelaide Street West, Toronto, Ontario, Canada.
DIVIDENDSThe declaration and payment of quarterly dividends are made at the discretion of the Board of Directors. Anticipated payment dates in 2010: March 31, June 30, September 30 and December 31.
SHAREHOLDER INQUIRIESInquiries regarding dividends, change of address, transfer requirements or lost certifi cates should be directed to the Company’s transfer agent:
Computershare Investor Services Inc.100 University Avenue, 9th FloorToronto, Ontario, Canada m5j 2y1Tel: 514.982.7555or 1.800.564.6253 (toll-free North America)or [email protected]
COMPANY INFORMATIONFor public and investment analysis inquiries, please contact our Senior Vice-President, Communications at 416.926.2000.
For copies of annual and quarterly reports, annual information form and other disclosure documents, please contact our Senior Vice-President, Transactions & Administration and Corporate Secretary at 416.926.2000.
TRANSFER AGENT AND REGISTRARComputershare Investor Services Inc.100 University Avenue, 9th FloorToronto, Ontario, Canada m5j 2y1Tel: 514.982.7555or 1.800.564.6253 (toll-free North America)or [email protected]
AUDITORSKPMG LLP Toronto, Ontario
STOCK EXCHANGE LISTINGS AND STOCK SYMBOLThe Company’s voting common shares are listed on The Toronto Stock Exchange and trade under the symbol “MFI”.
RAPPORT ANNUELSi vous désirez recevoir un exemplaire de la version française de ce rapport, veuillez écrire à l’adresse suivante : Secrétaire de la société, Les Aliments Maple Leaf Inc., 30 St. Clair Avenue West, Toronto, Ontario m4v 3a2.
corporate information
Inte
rbra
nd
MLF_AR_ENG_CVR.indd 2 16/03/10 7:16 AM
MAPLE LEAF FOODS INC. 1
Our goal is to deliver EBITDA margins of 10% to 12%, consistent with our peers in the global consumer packaged goods industry. We deliver these returns today in our bakery group. We will achieve them in our meat and meals businesses.
Over the past three years, we have restructured our meat operations to not only reduce the impact of commodity markets but also build scale effi ciencies. That is enabling us to focus more of our resources on producing higher-margin branded food products that meet the evolving needs of our customers and consumers.
We are building on Maple Leaf’s considerable strengths – dominant brands, leading market shares, innovative products and geographic scale in our core categories and markets – to deliver excellent value to shareholders, driven by clear, forward-thinking strategies that leverage our strengths.
forward thinking
55587_MLF_AR_ENG.indd 1 15/03/10 10:43 AM
2 MAPLE LEAF FOODS INC.
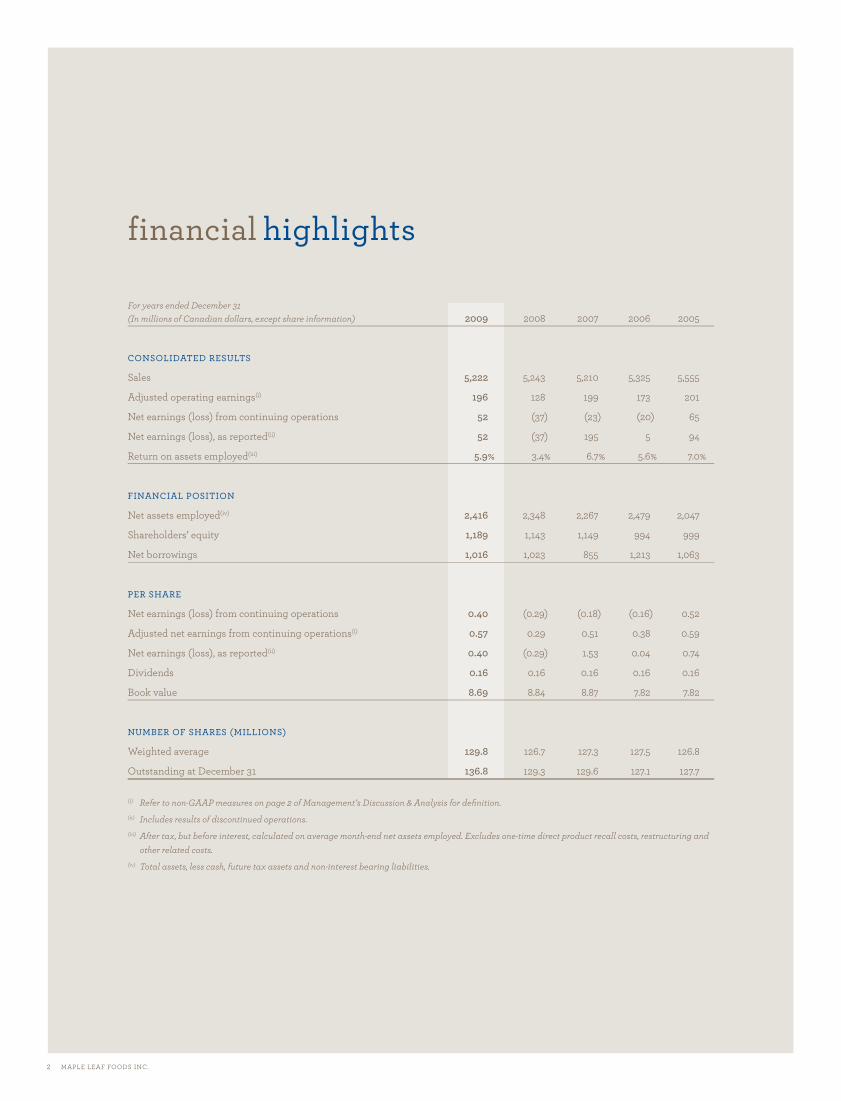
For years ended December 31 (In millions of Canadian dollars, except share information) 2009 2008 2007 2006 2005
CONSOLIDATED RESULTS
Sales 5,222 5,243 5,210 5,325 5,555
Adjusted operating earnings(i) 196 128 199 173 201
Net earnings (loss) from continuing operations 52 (37) (23) (20) 65
Net earnings (loss), as reported(ii) 52 (37) 195 5 94
Return on assets employed(iii) 5.9% 3.4% 6.7% 5.6% 7.0%
FINANCIAL POSITION
Net assets employed(iv) 2,416 2,348 2,267 2,479 2,047
Shareholders’ equity 1,189 1,143 1,149 994 999
Net borrowings 1,016 1,023 855 1,213 1,063
PER SHARE
Net earnings (loss) from continuing operations 0.40 (0.29) (0.18) (0.16) 0.52
Adjusted net earnings from continuing operations(i) 0.57 0.29 0.51 0.38 0.59
Net earnings (loss), as reported(ii) 0.40 (0.29) 1.53 0.04 0.74
Dividends 0.16 0.16 0.16 0.16 0.16
Book value 8.69 8.84 8.87 7.82 7.82
NUMBER OF SHARES (MILLIONS)
Weighted average 129.8 126.7 127.3 127.5 126.8
Outstanding at December 31 136.8 129.3 129.6 127.1 127.7
(i) Refer to non-GAAP measures on page 2 of Management’s Discussion & Analysis for defi nition.(ii) Includes results of discontinued operations.(iii) After tax, but before interest, calculated on average month-end net assets employed. Excludes one-time direct product recall costs, restructuring and
other related costs.(iv) Total assets, less cash, future tax assets and non-interest bearing liabilities.
financial highlights
55587_MLF_AR_ENG.indd 2 15/03/10 10:43 AM

MAPLE LEAF FOODS INC. 3
segmented operating results
Protein Group(In millions of Canadian dollars) 2009 2008 % Change
MEAT PRODUCTS GROUP
Sales 3,310 3,304 0%
Adjusted Operating Earnings(i) 55 29 88%Total Assets 1,653 1,675 (1)%
AGRIBUSINESS GROUP
Sales 206 233 (12)%Adjusted Operating Earnings(i) 48 30 59%Total Assets 287 302 (5)%
TOTAL PROTEIN GROUP
Sales 3,516 3,537 (1)%Adjusted Operating Earnings(i) 103 60 74%Total Assets 1,940 1,977 (2)%
Protein Group: The Meat Products Group comprises value-added packaged meats; chilled meal entrees and lunch kits; and value-added fresh pork,poultry and turkey products. The Agribusiness Group operations include hog production and animal by-products recycling.
Bakery Products Group(In millions of Canadian dollars) 2009 2008 % Change
TOTAL BAKERY PRODUCTS GROUP
Sales 1,705 1,706 0%Adjusted Operating Earnings(i) 102 83 23%Total Assets 955 1,004 (5)%
The Bakery Products Group is comprised of Maple Leaf’s 89.8% ownership in Canada Bread Company, Limited (“Canada Bread”), a producer of fresh and frozen value-added bakery products, and specialty pasta and sauces.
(i) Earnings from continuing operations before one-time direct product recall, restructuring and other related costs and other income (expense).
55587_MLF_AR_ENG.indd 3 15/03/10 10:43 AM

4 MAPLE LEAF FOODS INC.
55587_MLF_AR_ENG.indd 4 15/03/10 10:43 AM

MAPLE LEAF FOODS INC. 5
liste
ning
Driving higher levels of growth is one of our core objectives, and innovation is one of the primary ways to achieve this goal.
Our customers and consumers look to us for a steady stream of new ideas, whether it’s by broadening existing categories, developing new ones, or fi nding more eff ective packaging solutions. That’s why we launched ThinkFOOD! in early 2009 as the hub of our creativity and innovation. As the foremost food innovation centre in Canada, the facility is designed to drive collaboration between our product developers and customers and to sharpen our consumer insights. In the fi rst nine months of operation, ThinkFOOD! held over 65 customer sessions and supported more than 40 new product launches.
Great new ideas all emanate from listening to the consumer. We’re continually reaching out to learn what more we can do – or do better. We comb the world for food trends and successful products and then look for the best opportunities to adapt these to our own markets. In 2009, we launched over 100 new product innovations. Some of the best included Dempster’s Oven Fresh, an artisan-quality fresh bread, ready to fi nish, bake and serve; a new line of seasoned and ready-to-cook Maple Leaf Prime® fresh chicken products; and Maple Leaf Prime® Gourmet ready-to-bake fresh chicken and pork entrees. We’re listening!
Photo: Maple Leaf Prime® Seasoned Flattened Chicken with Wild Garlic & Herbs and Garlic Bread with Asiago Cheese prepared with Dempster’s Oven Fresh baguette (for recipe visit mapleleaf.com).
55587_MLF_AR_ENG.indd 555587_MLF_AR_ENG.indd 5 15/03/10 10:43 AM15/03/10 10:43 AM
6 MAPLE LEAF FOODS INC.
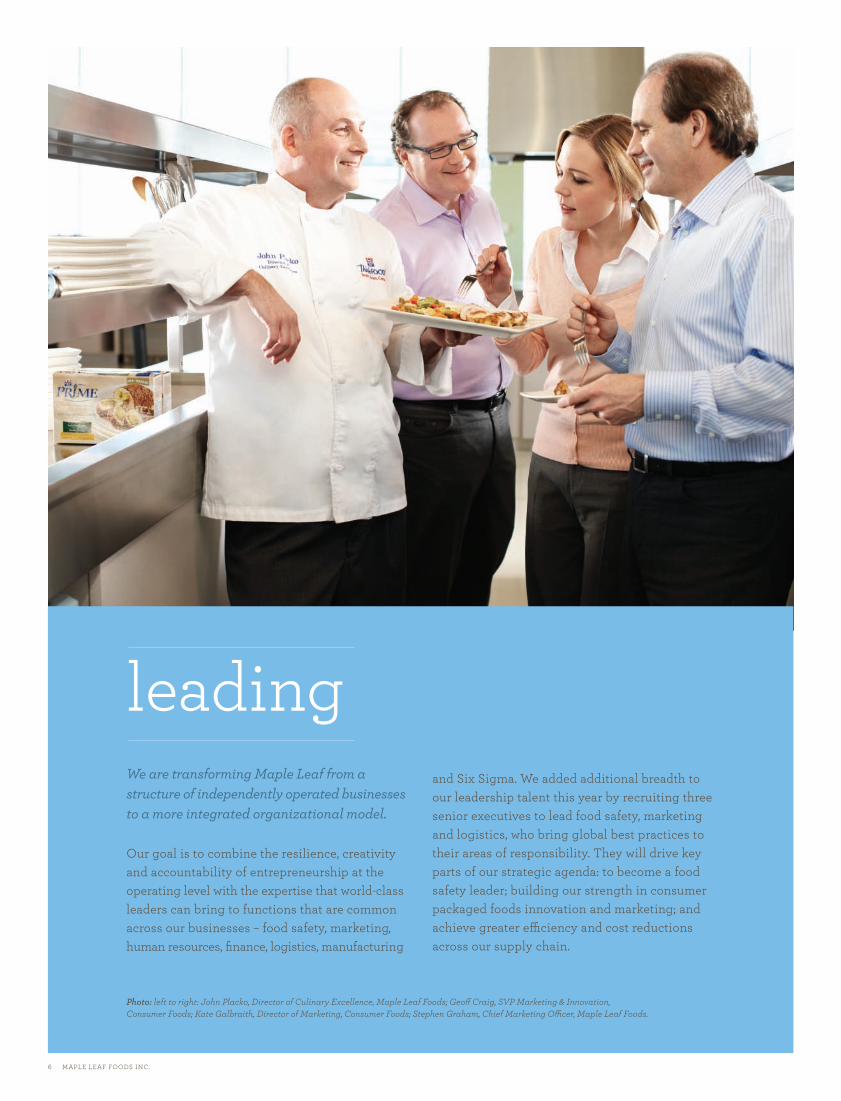
leadingWe are transforming Maple Leaf from a structure of independently operated businesses to a more integrated organizational model.
Our goal is to combine the resilience, creativity and accountability of entrepreneurship at the operating level with the expertise that world-class leaders can bring to functions that are common across our businesses – food safety, marketing, human resources, fi nance, logistics, manufacturing
and Six Sigma. We added additional breadth to our leadership talent this year by recruiting three senior executives to lead food safety, marketing and logistics, who bring global best practices to their areas of responsibility. They will drive key parts of our strategic agenda: to become a food safety leader; building our strength in consumer packaged foods innovation and marketing; and achieve greater effi ciency and cost reductions across our supply chain.
Photo: left to right: John Placko, Director of Culinary Excellence, Maple Leaf Foods; Geoff Craig, SVP Marketing & Innovation, Consumer Foods; Kate Galbraith, Director of Marketing, Consumer Foods; Stephen Graham, Chief Marketing Offi cer, Maple Leaf Foods.
55587_MLF_AR_ENG.indd 655587_MLF_AR_ENG.indd 6 15/03/10 10:43 AM15/03/10 10:43 AM
MAPLE LEAF FOODS INC. 7
investing
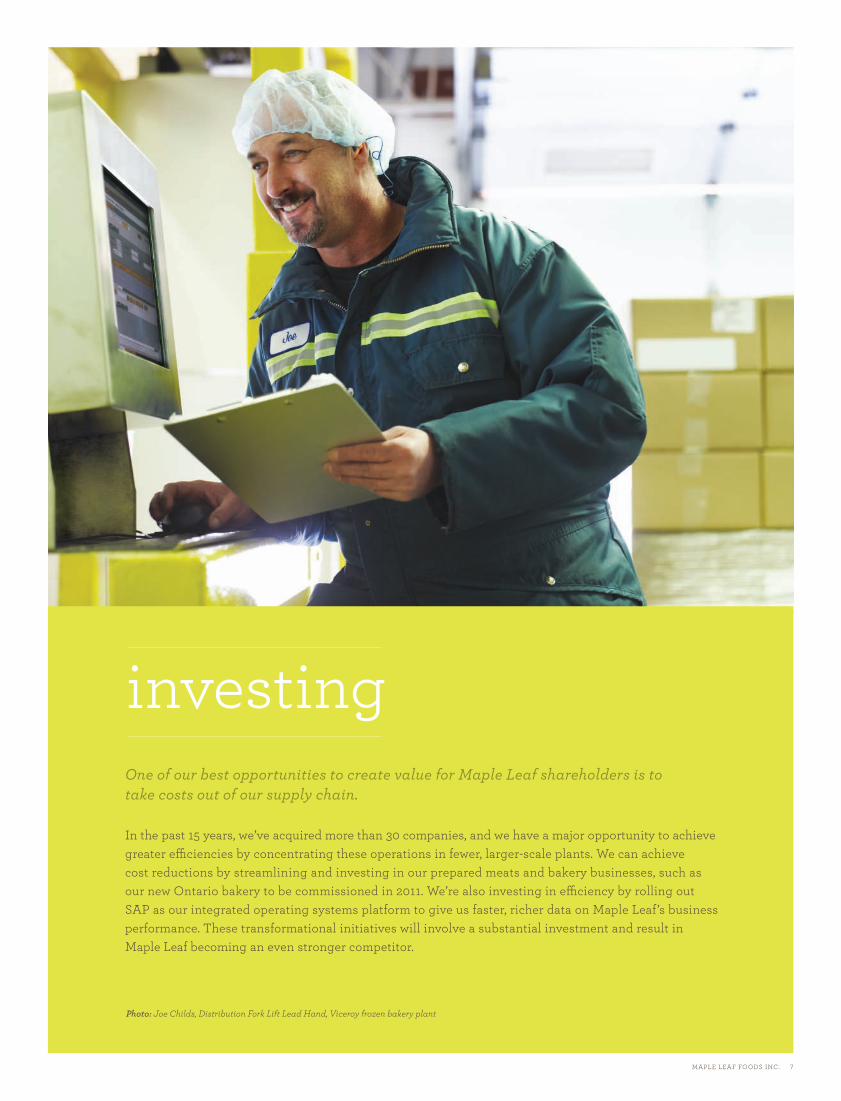
In the past 15 years, we’ve acquired more than 30 companies, and we have a major opportunity to achieve greater effi ciencies by concentrating these operations in fewer, larger-scale plants. We can achieve cost reductions by streamlining and investing in our prepared meats and bakery businesses, such as our new Ontario bakery to be commissioned in 2011. We’re also investing in effi ciency by rolling out SAP as our integrated operating systems platform to give us faster, richer data on Maple Leaf’s business performance. These transformational initiatives will involve a substantial investment and result in Maple Leaf becoming an even stronger competitor.
One of our best opportunities to create value for Maple Leaf shareholders is to take costs out of our supply chain.
Photo: Joe Childs, Distribution Fork Lift Lead Hand, Viceroy frozen bakery plant
55587_MLF_AR_ENG.indd 755587_MLF_AR_ENG.indd 7 15/03/10 10:43 AM15/03/10 10:43 AM
message from
the chairman
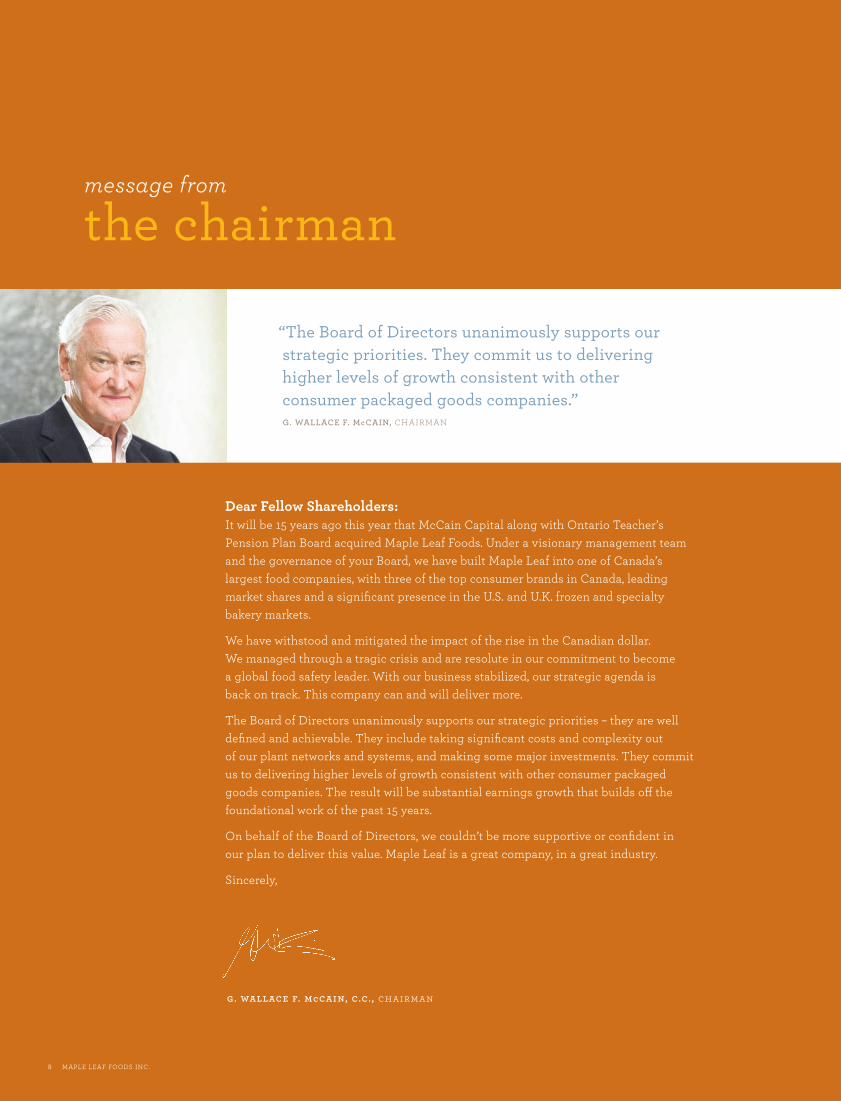
“The Board of Directors unanimously supports our strategic priorities. They commit us to delivering higher levels of growth consistent with other consumer packaged goods companies.”
G. WALLACE F. McCAIN, CHAIRMAN
8 MAPLE LEAF FOODS INC.
Dear Fellow Shareholders:It will be 15 years ago this year that McCain Capital along with Ontario Teacher’s Pension Plan Board acquired Maple Leaf Foods. Under a visionary management team and the governance of your Board, we have built Maple Leaf into one of Canada’s largest food companies, with three of the top consumer brands in Canada, leading market shares and a signifi cant presence in the U.S. and U.K. frozen and specialty bakery markets.
We have withstood and mitigated the impact of the rise in the Canadian dollar. We managed through a tragic crisis and are resolute in our commitment to become a global food safety leader. With our business stabilized, our strategic agenda is back on track. This company can and will deliver more.
The Board of Directors unanimously supports our strategic priorities – they are well defi ned and achievable. They include taking signifi cant costs and complexity out of our plant networks and systems, and making some major investments. They commit us to delivering higher levels of growth consistent with other consumer packaged goods companies. The result will be substantial earnings growth that builds off the foundational work of the past 15 years.
On behalf of the Board of Directors, we couldn’t be more supportive or confi dent in our plan to deliver this value. Maple Leaf is a great company, in a great industry.
Sincerely,
g. wallace f. mccain, c.c., chairman
55587_MLF_AR_ENG.indd 855587_MLF_AR_ENG.indd 8 15/03/10 10:43 AM15/03/10 10:43 AM
message to
shareholders
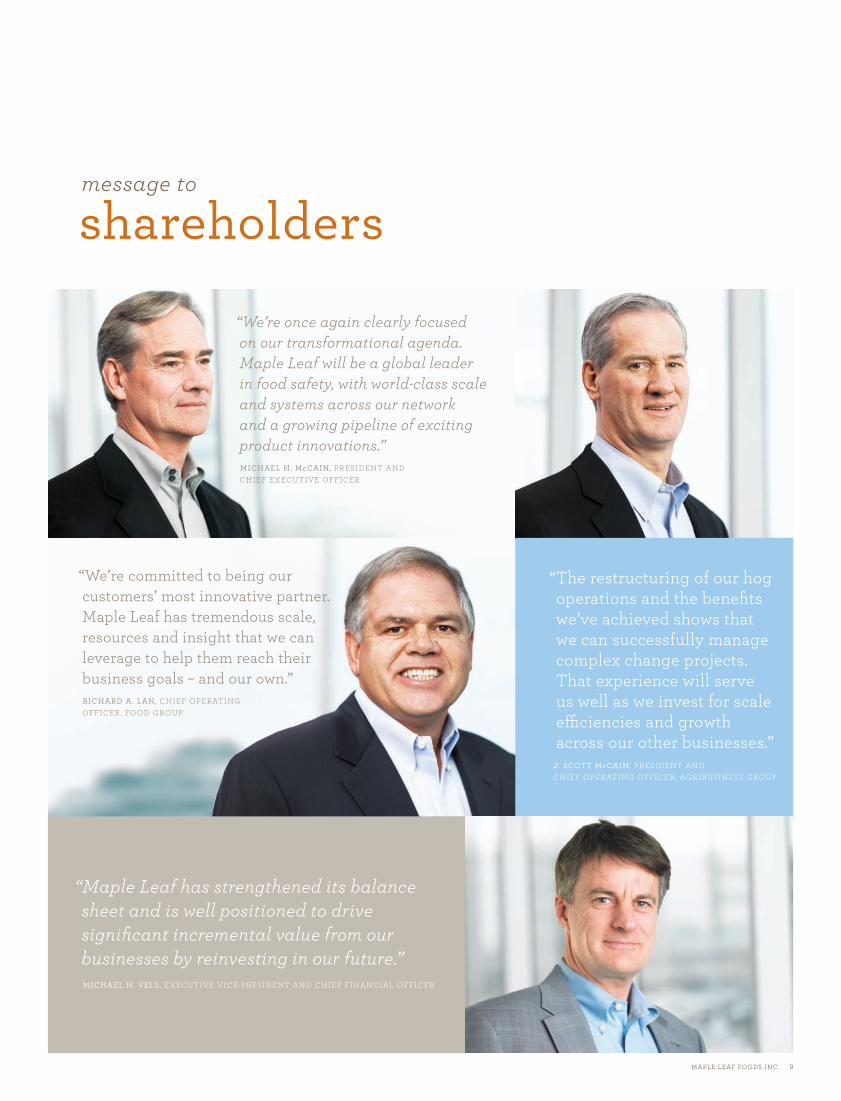
“We’re committed to being our customers’ most innovative partner. Maple Leaf has tremendous scale, resources and insight that we can leverage to help them reach their business goals – and our own.”
RICHARD A. LAN, CHIEF OPERATING OFFICER, FOOD GROUP
“We’re once again clearly focused on our transformational agenda. Maple Leaf will be a global leader in food safety, with world-class scale and systems across our network and a growing pipeline of exciting product innovations.”
MICHAEL H. McCAIN, PRESIDENT AND CHIEF EXECUTIVE OFFICER
“The restructuring of our hog operations and the benefi ts we’ve achieved shows that we can successfully manage complex change projects. That experience will serve us well as we invest for scale effi ciencies and growth across our other businesses.”
J. SCOTT McCAIN, PRESIDENT AND CHIEF OPERATING OFFICER, AGRIBUSINESS GROUP
“Maple Leaf has strengthened its balance sheet and is well positioned to drive signifi cant incremental value from our businesses by reinvesting in our future.”
MICHAEL H. VELS, EXECUTIVE VICE-PRESIDENT AND CHIEF FINANCIAL OFFICER
MAPLE LEAF FOODS INC. 9
55587_MLF_AR_ENG.indd 955587_MLF_AR_ENG.indd 9 15/03/10 10:44 AM15/03/10 10:44 AM
10 MAPLE LEAF FOODS INC.
To My Fellow Shareholders:
We have our footing again! We entered 2009 with an imperative to restore fi nancial stability and deal responsibly with the eff ects of a debilitating and tragic product recall in late 2008. While not fully complete, the recovery is on track and we are looking forward to accomplishing our most important short-term goal – achieving the full earnings potential of the business!
There is work yet to do, but we have an excellent foundation to build from and a clear path forward. We are confi dent that a rewarding outcome lies ahead.
The food industry, and specifi cally protein and bakery, is stable and profi table. Fuelled by high levels of product innovation, it can deliver excellent, consistent growth. Maple Leaf is one of Canada’s largest food companies and owns three of the top national brands. We have leading market positions in most of our categories. And our brand, product and customer diversity provides a strong and balanced business portfolio. These are powerful levers to generate shareholder returns well above our historical levels, which we have a well-defi ned plan to achieve.
We also have a strong shared interest with investors. Our management team, together with McCain Capital Corporation, owns well over 30% of the outstanding shares so our fi nancial futures are closely tied to value creation at Maple Leaf Foods. We are a team that expects to win, and there is a great deal of earnings horsepower in this company that we can and will deliver.
fi nancial highlights:• Sales were $5.2 billion; consistent with last year • Adjusted operating earnings increased 53% to
$196 million* • Adjusted earnings per share from continuing
operations increased 98% to $0.57 • Operating cash fl ow from continuing operations
decreased 54% to $89 million • Capital expenditures of $163 million decreased
21% from last year• Return on net assets was 5.9% compared to 3.4% in 2008 • Our debt to EBITDA ratio at year end was 2.9x
compared to 3.4x at the end of 2008 and well within our internal target range of 2.5x to 3.5x
• Share price at year-end was $11.67, which underperformed the 2009 S&P Food index by 10%
* Adjusted operating earnings is a measure of performance that excludes one-time direct product recall, restructuring and other related costs and other income (expense)
our bakery products group – a growing global business Maple Leaf operates in two diff erent sectors of the food industry – meat and meals, and bakery. In the bakery industry, through more than 19 acquisitions in the past 15 years, we have established ourselves as Canada’s largest fresh bakery, the leading specialty bakery in the U.K., and one of the largest frozen bakery companies in the U.S. Overall, the Bakery business generates stable and healthy returns. Our trailing three-year EBITDA margins were 10% on average, consistent with premium North America bakery companies. We are very satisfi ed with our performance in this business.
55587_MLF_AR_ENG.indd 1055587_MLF_AR_ENG.indd 10 15/03/10 10:44 AM15/03/10 10:44 AM
Maple Leaf’s fresh bakery business, which operates exclusively in Canada, is heavily weighted towards whole wheat, whole grain and higher nutrition products, all of which are faster-growing areas of the bread market. We also own the premium brand in fresh bakery – Dempster’s – as well as leading regional brands. We span the country with bakeries and distribution depots that enable us to deliver fresh bread to all major population centres within hours. We have leading market shares and high capacity utilization at our facilities. In sum, this is an excellent business, with lots of opportunity for sales and margin growth.
Our North American frozen bakery operations provide frozen, partially or fully-baked artisan and premium breads and rolls to retail and foodservice customers. While this is a more fragmented industry, we have healthy market shares in the retail par-baked market. We have increased profi tability through capital investments that reduce our costs and by focusing our plants and resources to meet the needs of more strategic customers. Premium and artisan breads are one of the highest growth segments of the bakery industry, and we plan to grow this business through investment and/or acquisitions.
While the smallest operation in the Bakery Products Group, our fresh pasta and sauce business is on a growth trajectory. We have merged this business with our fresh sandwich operations as a new ‘Food to Go’ business. Our goal is to become a leading provider of fresh, nutritious convenience foods to Canadian retail and convenience channels. We are also identifying opportunities to capitalize on the strength of the Olivieri® brand by expanding it from pasta and sauces to other fresh prepared food categories.
Our U.K. bakery business has been aff ected by the deep recession in the U.K. and softer demand for premium bakery products. That said, this business produced high earnings growth rates in the past and will again. We have made large investments in plant infrastructure to reduce costs and improve production effi ciencies. During 2010, we will increase our spend on marketing and brand building to reinforce our leadership in bagels, specialty hearth breads and morning goods, such as croissants and pastries.
a very successful restructuring of our protein operations The meat and meals side of our business has had a much more challenged earnings track record, as the fi ve-year chart on the next page shows. The rise in the Canadian dollar since 2003 impaired our hog production and pork processing businesses and made them increasingly uncompetitive in global markets. Responding to this, we acted decisively. Over the past three years, we have restructured these businesses, which have the most exposure to commodity and
MAPLE LEAF FOODS INC. 11
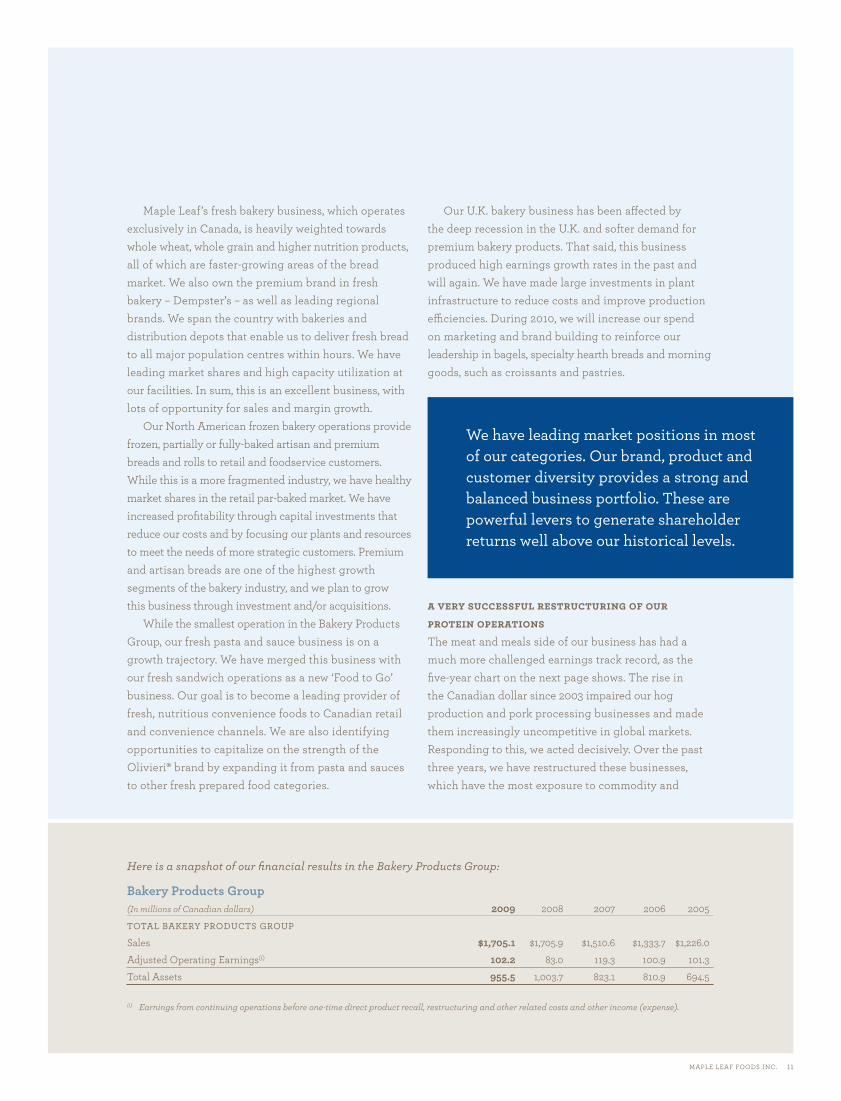
Here is a snapshot of our fi nancial results in the Bakery Products Group:
Bakery Products Group(In millions of Canadian dollars) 2009 2008 2007 2006 2005TOTAL BAKERY PRODUCTS GROUP
Sales $1,705.1 $1,705.9 $1,510.6 $1,333.7 $1,226.0 Adjusted Operating Earnings(i) 102.2 83.0 119.3 100.9 101.3 Total Assets 955.5 1,003.7 823.1 810.9 694.5
(i) Earnings from continuing operations before one-time direct product recall, restructuring and other related costs and other income (expense).
We have leading market positions in most of our categories. Our brand, product and customer diversity provides a strong and balanced business portfolio. These are powerful levers to generate shareholder returns well above our historical levels.
55587_MLF_AR_ENG.indd 1155587_MLF_AR_ENG.indd 11 15/03/10 10:44 AM15/03/10 10:44 AM
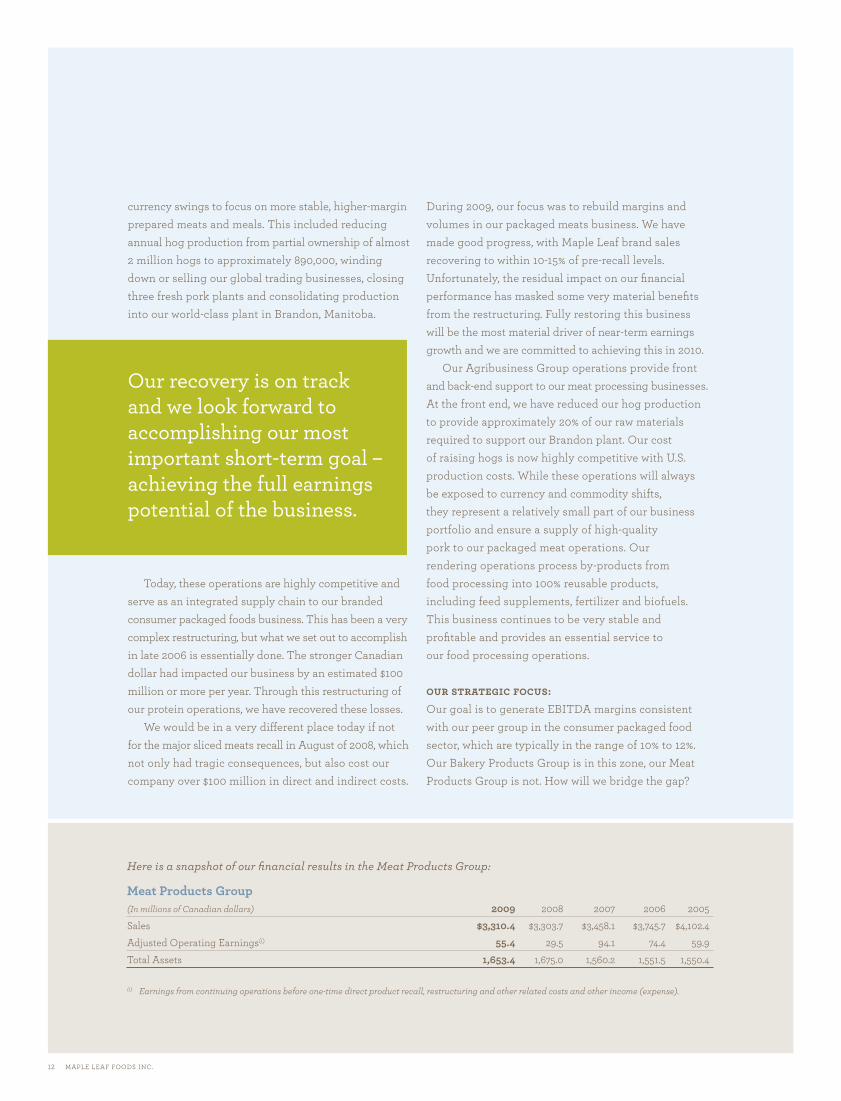
Here is a snapshot of our fi nancial results in the Meat Products Group:
Meat Products Group(In millions of Canadian dollars) 2009 2008 2007 2006 2005Sales $3,310.4 $3,303.7 $3,458.1 $3,745.7 $4,102.4 Adjusted Operating Earnings(i) 55.4 29.5 94.1 74.4 59.9 Total Assets 1,653.4 1,675.0 1,560.2 1,551.5 1,550.4
(i) Earnings from continuing operations before one-time direct product recall, restructuring and other related costs and other income (expense).
12 MAPLE LEAF FOODS INC.
currency swings to focus on more stable, higher-margin prepared meats and meals. This included reducing annual hog production from partial ownership of almost 2 million hogs to approximately 890,000, winding down or selling our global trading businesses, closing three fresh pork plants and consolidating production into our world-class plant in Brandon, Manitoba.
Today, these operations are highly competitive and serve as an integrated supply chain to our branded consumer packaged foods business. This has been a very complex restructuring, but what we set out to accomplish in late 2006 is essentially done. The stronger Canadian dollar had impacted our business by an estimated $100 million or more per year. Through this restructuring of our protein operations, we have recovered these losses.
We would be in a very diff erent place today if not for the major sliced meats recall in August of 2008, which not only had tragic consequences, but also cost our company over $100 million in direct and indirect costs.
During 2009, our focus was to rebuild margins and volumes in our packaged meats business. We have made good progress, with Maple Leaf brand sales recovering to within 10-15% of pre-recall levels. Unfortunately, the residual impact on our fi nancial performance has masked some very material benefi ts from the restructuring. Fully restoring this business will be the most material driver of near-term earnings growth and we are committed to achieving this in 2010.
Our Agribusiness Group operations provide front and back-end support to our meat processing businesses. At the front end, we have reduced our hog production to provide approximately 20% of our raw materials required to support our Brandon plant. Our cost of raising hogs is now highly competitive with U.S. production costs. While these operations will always be exposed to currency and commodity shifts, they represent a relatively small part of our business portfolio and ensure a supply of high-quality pork to our packaged meat operations. Our rendering operations process by-products from food processing into 100% reusable products, including feed supplements, fertilizer and biofuels. This business continues to be very stable and profi table and provides an essential service to our food processing operations.
our strategic focus:Our goal is to generate EBITDA margins consistent with our peer group in the consumer packaged food sector, which are typically in the range of 10% to 12%. Our Bakery Products Group is in this zone, our Meat Products Group is not. How will we bridge the gap?
Our recovery is on track and we look forward to accomplishing our most important short-term goal – achieving the full earnings potential of the business.
55587_MLF_AR_ENG.indd 1255587_MLF_AR_ENG.indd 12 15/03/10 10:44 AM15/03/10 10:44 AM
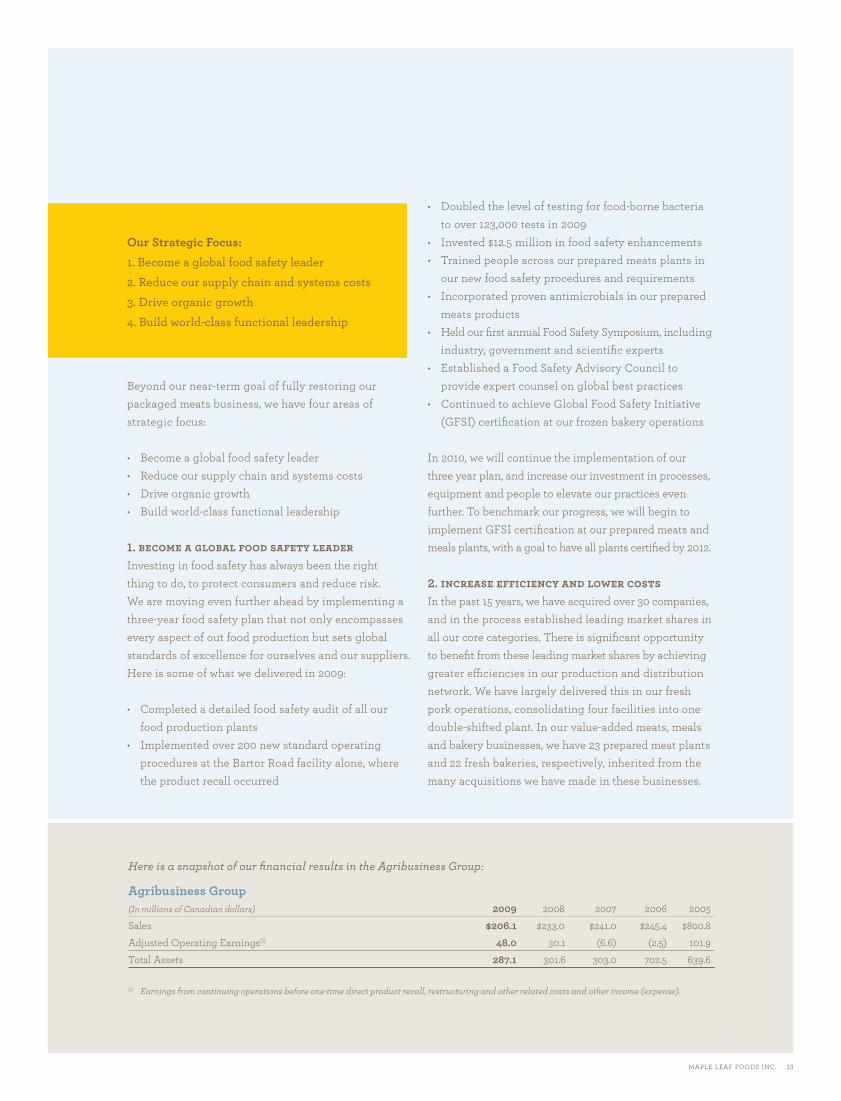
Here is a snapshot of our fi nancial results in the Agribusiness Group:
Agribusiness Group(In millions of Canadian dollars) 2009 2008 2007 2006 2005Sales $206.1 $233.0 $241.0 $245.4 $800.8 Adjusted Operating Earnings(i) 48.0 30.1 (6.6) (2.5) 101.9 Total Assets 287.1 301.6 303.0 702.5 639.6
(i) Earnings from continuing operations before one-time direct product recall, restructuring and other related costs and other income (expense).
MAPLE LEAF FOODS INC. 13
Beyond our near-term goal of fully restoring our packaged meats business, we have four areas of strategic focus:
• Become a global food safety leader• Reduce our supply chain and systems costs • Drive organic growth • Build world-class functional leadership
1. become a global food safety leaderInvesting in food safety has always been the right thing to do, to protect consumers and reduce risk. We are moving even further ahead by implementing a three-year food safety plan that not only encompasses every aspect of out food production but sets global standards of excellence for ourselves and our suppliers. Here is some of what we delivered in 2009:
• Completed a detailed food safety audit of all our food production plants
• Implemented over 200 new standard operating procedures at the Bartor Road facility alone, where the product recall occurred
• Doubled the level of testing for food-borne bacteria to over 123,000 tests in 2009
• Invested $12.5 million in food safety enhancements • Trained people across our prepared meats plants in
our new food safety procedures and requirements • Incorporated proven antimicrobials in our prepared
meats products • Held our fi rst annual Food Safety Symposium, including
industry, government and scientifi c experts • Established a Food Safety Advisory Council to
provide expert counsel on global best practices • Continued to achieve Global Food Safety Initiative
(GFSI) certifi cation at our frozen bakery operations
In 2010, we will continue the implementation of our three year plan, and increase our investment in processes, equipment and people to elevate our practices even further. To benchmark our progress, we will begin to implement GFSI certifi cation at our prepared meats and meals plants, with a goal to have all plants certifi ed by 2012.
2. increase effi ciency and lower costsIn the past 15 years, we have acquired over 30 companies, and in the process established leading market shares in all our core categories. There is signifi cant opportunity to benefi t from these leading market shares by achieving greater effi ciencies in our production and distribution network. We have largely delivered this in our fresh pork operations, consolidating four facilities into one double-shifted plant. In our value-added meats, meals and bakery businesses, we have 23 prepared meat plants and 22 fresh bakeries, respectively, inherited from the many acquisitions we have made in these businesses.
Our Strategic Focus:
1. Become a global food safety leader2. Reduce our supply chain and systems costs3. Drive organic growth4. Build world-class functional leadership
55587_MLF_AR_ENG.indd 1355587_MLF_AR_ENG.indd 13 15/03/10 10:44 AM15/03/10 10:44 AM
We plan to make signifi cant capital investments over the next several years to establish a smaller number of large-scale plants that can compete on a cost basis with the best in North America. We announced the fi rst of these initiatives in early 2010, with a planned capital investment of approximately $100 million to construct a new bakery in southwestern Ontario. We expect to commission this new facility by late 2011. It will be by far the largest and most effi cient bakery in Canada and
among the leading bakeries in North America. We believe this is a sound strategic investment: the returns from investing in infrastructure improvements are excellent and far more predictable than acquisitions or high-risk growth initiatives.
The other major platform for increasing effi ciency is implementing SAP as our new integrated systems platform. SAP powers most of the leading global consumer packaged food companies, providing rich and immediate information on business performance that enables better insights and operating improvements. During 2009, we established the footprint and rolled out the system in corporate functions and several smaller businesses or areas of the business. This phased-in approach is enabling us to obtain critical learning before we launch in our larger businesses and ultimately in our customer-facing functions. Following this strategy, we have completed eight successful implementations by the end of February 2010. In 2010, we are beginning to install the SAP system in both our fresh and prepared meats and fresh bakery operations. We expect to fully implement SAP across our manufacturing and distribution facilities by 2012.
3. driving organic growthOutstanding consumer food companies deliver strong rates of organic growth, powered by great brands and a constant fl ow of innovative new products. We have
launched important initiatives to accelerate growth that are transforming our culture and approach to the market.
First, we commissioned ThinkFOOD!, a $12 million food innovation centre. ThinkFOOD! brings together our product development teams and customers in a world-class facility that includes retail and food service product development kitchens, demonstration areas, sensory labs and training facilities. In its fi rst nine months of operation we hosted over 65 customer sessions at ThinkFOOD!, delivered over one dozen training workshops and ideation sessions with our people and supported the launch of over 40 new products.
To fuel innovation we are escalating our global intelligence activities by identifying new products and categories that can be rapidly adapted to our home markets. Powerful consumer trends such as health and wellness, demographic shifts, and convenience are driving higher levels of growth. In 2010, we will be launching a variety of exciting new products and programs that build our leadership in these and other areas.
Also last year, working with senior sales leaders across the company, we moved from planning to implementation of a new framework for developing deeper, more strategic customer relationships. Maple Leaf’s scale, market knowledge and product diversity are tremendous assets that can deliver major benefi ts to our customers. We are harnessing these assets more eff ectively by developing heightened understanding of our customer strategies and better mobilizing our people, plants and fi nancial resources to support their business goals. For Maple Leaf, developing more strategic, less transactional customer relationships means effi cient utilization of our resources, which in turn drives sales and margin growth.
4. build world-class functional leadershipIn addition to our business strategies, we are formatively changing the structure of Maple Leaf by moving from a number of independently operated businesses to a more integrated organizational model. We are establishing strong functional leadership that brings global best practices to functions that are common across our businesses, including food safety, logistics, manufacturing, marketing, fi nance, human resources and Six Sigma. Some are already in place,
14 MAPLE LEAF FOODS INC.
Powerful consumer trends such as health and wellness, demographic shifts and convenience are driving higher levels of growth in our markets.
55587_MLF_AR_ENG.indd 1455587_MLF_AR_ENG.indd 14 15/03/10 10:44 AM15/03/10 10:44 AM

MAPLE LEAF FOODS INC. 15
while others are new to the organization. We made signifi cant progress in 2009, beginning
with the appointment of Dr. Randall Huff man as our new Chief Food Safety Offi cer. One of the foremost food safety experts in North America, Randy is leading our commitment to becoming a global food safety leader. William Kaldis later joined us in the new role of Vice- President, Logistics. Bill has over 20 years experience leading supply and manufacturing networks, applying technologies and expertise to increase effi ciencies and reduce costs. In early 2010, Stephen Graham joined Maple Leaf as our Chief Marketing Offi cer. Stephen has international experience transforming companies into customer driven, growth focused organizations. This role is critical to driving our growth agenda.
investing in our people and communitiesOne of our core values is to Do What’s Right. This goes to the heart of our relationship with our people and our communities. Starting with workplace safety, 2009 was our ninth consecutive year of continuous improvement in reportable injury frequency, with overall improvement of nearly 18% across all Maple Leaf operations. Leading the list was our Laval bakery, with over 150,000 hours logged without a reportable injury. Our Burlington and Lagimodiere meat plants both received the CEO Gold Award for operating 1,000,000 hours without a lost time injury – an amazing result! We are committed to being an industry leader in workplace safety.
The thrust of our community outreach is leveraging our skills and capabilities as a food company to help people in need. In 2009, we donated nearly $4 million, including cash and in-kind food products, to food banks and social service organizations. Working with Food Banks Canada, we provided a nutritious meal to over 100,000 needy Canadians during the December holiday season. We launched a new partnership with Wellspring, Canada’s largest cancer support group, by funding a new kitchen at the Sunnybrook Expansion project where patients and their families can learn about healthy food preparation. Through the eff orts of our employees, we supported community and international eff orts to Kenya and Haiti, providing food relief where it is needed most. These are snapshots of a great many activities that refl ect an ongoing commitment
to deeply connect with our people and communities through actions that make a diff erence.
On the sustainability front, for the third year we will be reporting our 2009 carbon inventory to the Carbon Disclosure Project, a non-government organization that acts on behalf of more than 500 institutional investors holding more than $64 trillion in assets under management to collect high quality information on climate change. We have also measured the quantities of waste we generate at a representative snapshot of our manufacturing facilities to determine how much of it is diverted from landfi ll. Our studies show that 93% of the waste generated in our manufacturing facilities is diverted from landfi ll, with much of it recycled into such benefi cial uses as animal feed, cosmetics or biodiesel. There is much more we can and must do to reduce our environmental footprint. A detailed three-year strategy has been prepared that defi nes targets for the fi ve areas where we can have most impact – energy, greenhouse gas reduction, solid waste reduction, water conservation and packaging. We expect to implement this plan starting this year.
looking ahead Maple Leaf has all the right fundamentals and strategic focus to deliver sustained earnings growth, consistent with other global branded food companies, and we plan to deliver these returns. Our business performance is recovering and we demonstrated substantial traction in implementing our strategic agenda. The blueprint is clearer than ever; the commitment of thousands of passionate people more intense than ever. Together, we will deliver.
Sincerely,
Richard A. Lan J. Scott McCainChief Operating Offi cer, President and Food Group Chief Operating Offi cer, Agribusiness Group
Michael H. Vels Michael H. McCainExecutive Vice-President and President andChief Financial Offi cer Chief Executive Offi cer
55587_MLF_AR_ENG.indd 1555587_MLF_AR_ENG.indd 15 15/03/10 10:44 AM15/03/10 10:44 AM

we have
OF THE TOP CANADIAN BRANDS
W E L A U N C H M O R E T H A N
100 new
productseach year in a
continual eff ort to revitalize
product categories or create new ones.
Ours is a values-based and action-oriented culture that is rich in leadership development and continuous improvement.
23,500 WE EMP LOY
peopleWe operate 90+
facilities globally.
Maple Leaf Foods is one of Canada’s largest
consumer packaged food companies with
sales across North America, the United Kingdom
and Asia.
100 yearsMaple Leaf Foods can trace its roots back over 100 years through the amalgamation of some of Canada’s premier food companies.
Our new website, www.mapleleaf.com, is fully interactive, offering expert tips, techniques and recipes.
did you know?
55587_MLF_AR_ENG.indd 1655587_MLF_AR_ENG.indd 16 15/03/10 10:44 AM15/03/10 10:44 AM
at a glance
Our Meat Products Group comprises two leading Canadian brands in fresh and prepared meats, Maple Leaf and Schneiders, as well as Maple Leaf Prime Naturally and a variety of household brands. Product lines include packaged meats, ready-to-cook and ready-to-serve meal products and value-added fresh pork, poultry and turkey. We market these products primarily in Canada, the U.S., Mexico and Japan.
The North American and U.K. operations of Maple Leaf’s Bakery Products Group also have leading brands and market shares. The fresh bakery business owns Dempster’s, the No. 1 national brand of fresh bread, and produces nutritious fresh bakery products such as whole wheat, organic and multi-grain breads, rolls and artisan breads. We also ownOlivieri Foods, which is Canada’s largest maker – and leading brand – of fresh pasta and sauce products. The frozen bakery business is a major North American
producer and distributor of frozen unbaked, par-baked and fully baked bread products for retail and foodservice customers. Our U.K. operations is one of Britain’s leading specialty bakeries, producing bagels, croissants, in-store bakery products and artisan breads.
Our Agribusiness Group provides raw material and essential services to Maple Leaf’s fresh and prepared meats facilities. This includes raising hogs to support approximately 20% of our fresh pork processing requirements. Maple Leaf is also one of Canada’s largest recyclers of animal by-products into value-added products such as animal feeds and amino-acid supplements, and is a signifi cant producer of clean-burning commercial biofuels.
Maple Leaf Foods has 23,500 employees worldwide and operates approximately 90 facilities in North America and the United Kingdom.
Maple Leaf Foods is Canada’s largest meat, meals and bakery company, with three of the top Canadian retail brands as well as leading market positions in North American frozen par-baked bread and specialty bakery products in the United Kingdom.
TOTAL ASSETS BY GROUP
SALES BY GROUP
DOMESTIC VS. INTERNATIONAL SALES
OPERATING EARNINGS BEFORE ONE TIME RECALL COSTS, RESTRUCTURING COSTS AND OTHER RELATED COSTS
76.8%
11.8%
11.4%
28.2%
52.1%
24.5%
54.1%
31.3%
9.4%5.3%
28.2% MEAT PRODUCTS
52.1% BAKERY PRODUCTS
24.5% AGRIBUSINESS
(4.8)% NON-ALLOCATED
54.1% MEAT PRODUCTS
31.3% BAKERY PRODUCTS
9.4% AGRIBUSINESS
5.3% NON-ALLOCATED
76.8% DOMESTIC
11.8% U.S.
11.4% OTHER INTERNATIONAL
63.4% MEAT PRODUCTS
32.7% BAKERY PRODUCTS
3.9% AGRIBUSINESS
3.9%
32.7%
63.4%
Maple Leaf Foods Inc. operates three core businesses:
CAPITAL STOCKThe Company’s authorized capital consists of an unlimited number of voting common shares, an unlimited number of non-voting common shares and an unlimited number of preferred shares issuable in series. At December 31, 2009, 114,774,802 voting shares and 22,000,000 non-voting shares were issued and outstanding, for a total of 136,774,802 outstanding shares. There were 785 shareholders of record of which 748 were registered in Canada, holding 98.7% of the issued voting shares. All of the issued non-voting shares are held by Ontario Teachers’ Pension Plan. These non-voting shares may be converted into voting shares at any time.
OWNERSHIP The Company’s major shareholders are McCain Capital Corporation holding 43,212,890 voting shares representing 31.6% of the total issued and outstanding shares and Ontario Teachers’ Pension Plan holding 26,213,155 voting shares and 22,000,000 non-voting shares representing 35.3% of the total issued and outstanding shares. The remainder of the issued and outstanding shares are publicly held.
CORPORATE OFFICEMaple Leaf Foods Inc.30 St. Clair Avenue West, Suite 1500Toronto, Ontario, Canada m4v 3a2Tel: 416.926.2000 Fax: 416.926.2018Website: www.mapleleaf.com
ANNUAL MEETINGThe annual meeting of shareholders of Maple Leaf Foods Inc. will be held on Thursday, April 29, 2010 at 11:00 a.m. at the Toronto Board of Trade, 1 First Canadian Place, 77 Adelaide Street West, Toronto, Ontario, Canada.
DIVIDENDSThe declaration and payment of quarterly dividends are made at the discretion of the Board of Directors. Anticipated payment dates in 2010: March 31, June 30, September 30 and December 31.
SHAREHOLDER INQUIRIESInquiries regarding dividends, change of address, transfer requirements or lost certifi cates should be directed to the Company’s transfer agent:
Computershare Investor Services Inc.100 University Avenue, 9th FloorToronto, Ontario, Canada m5j 2y1Tel: 514.982.7555or 1.800.564.6253 (toll-free North America)or [email protected]
COMPANY INFORMATIONFor public and investment analysis inquiries, please contact our Senior Vice-President, Communications at 416.926.2000.
For copies of annual and quarterly reports, annual information form and other disclosure documents, please contact our Senior Vice-President, Transactions & Administration and Corporate Secretary at 416.926.2000.
TRANSFER AGENT AND REGISTRARComputershare Investor Services Inc.100 University Avenue, 9th FloorToronto, Ontario, Canada m5j 2y1Tel: 514.982.7555or 1.800.564.6253 (toll-free North America)or [email protected]
AUDITORSKPMG LLP Toronto, Ontario
STOCK EXCHANGE LISTINGS AND STOCK SYMBOLThe Company’s voting common shares are listed on The Toronto Stock Exchange and trade under the symbol “MFI”.
RAPPORT ANNUELSi vous désirez recevoir un exemplaire de la version française de ce rapport, veuillez écrire à l’adresse suivante : Secrétaire de la société, Les Aliments Maple Leaf Inc., 30 St. Clair Avenue West, Toronto, Ontario m4v 3a2.
corporate information
Inte
rbra
nd
MLF_AR_ENG_CVR.indd 2 16/03/10 7:16 AM

forward thinking
Maple Leaf Foods Inc. 30 St. Clair Avenue West, Suite 1500Toronto, Ontario, Canada m4v 3a2www.mapleleaf.com
Maple Leaf Foods Inc. annual report 2009
MLF_AR_ENG_CVR.indd 1 16/03/10 7:16 AM
09forward thinking
fi nancial review
Maple Leaf Foods Inc. annual report 2009
MLF_Financials_ENG.indd 2 16/03/10 8:09 AM
This Management Discussion and Analysis (“MD&A”) provides management’s perspective on the results of operations and fi nancial condition for Maple Leaf Foods Inc. This MD&A should be read in conjunction with the audited annual fi nancial statements and notes presented in this report.
The Board of Directors, on the advice of its Audit Committee, approved the contents on this MD&A on February 23, 2010.
MLF_Financials_ENG.indd 3 16/03/10 8:09 AM
MAPLE LEAF FOODS INC. 1
management’s discussion and analysis
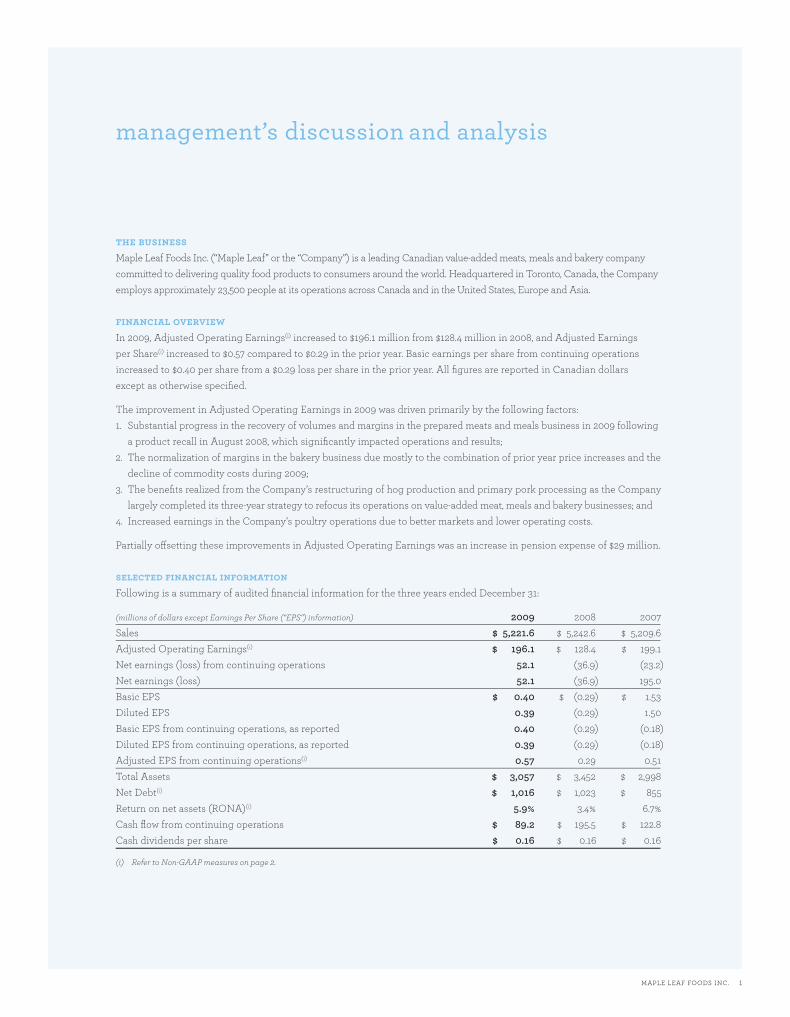
the businessMaple Leaf Foods Inc. (“Maple Leaf” or the “Company”) is a leading Canadian value-added meats, meals and bakery company committed to delivering quality food products to consumers around the world. Headquartered in Toronto, Canada, the Company employs approximately 23,500 people at its operations across Canada and in the United States, Europe and Asia.
fi nancial overviewIn 2009, Adjusted Operating Earnings(i) increased to $196.1 million from $128.4 million in 2008, and Adjusted Earnings per Share(i) increased to $0.57 compared to $0.29 in the prior year. Basic earnings per share from continuing operations increased to $0.40 per share from a $0.29 loss per share in the prior year. All fi gures are reported in Canadian dollars except as otherwise specifi ed.
The improvement in Adjusted Operating Earnings in 2009 was driven primarily by the following factors:1. Substantial progress in the recovery of volumes and margins in the prepared meats and meals business in 2009 following
a product recall in August 2008, which signifi cantly impacted operations and results; 2. The normalization of margins in the bakery business due mostly to the combination of prior year price increases and the
decline of commodity costs during 2009; 3. The benefi ts realized from the Company’s restructuring of hog production and primary pork processing as the Company
largely completed its three-year strategy to refocus its operations on value-added meat, meals and bakery businesses; and4. Increased earnings in the Company’s poultry operations due to better markets and lower operating costs.
Partially off setting these improvements in Adjusted Operating Earnings was an increase in pension expense of $29 million.
selected fi nancial informationFollowing is a summary of audited fi nancial information for the three years ended December 31:
(millions of dollars except Earnings Per Share (“EPS”) information) 2009 2008 2007Sales $ 5,221.6 $ 5,242.6 $ 5,209.6Adjusted Operating Earnings(i) $ 196.1 $ 128.4 $ 199.1Net earnings (loss) from continuing operations 52.1 (36.9) (23.2)Net earnings (loss) 52.1 (36.9) 195.0Basic EPS $ 0.40 $ (0.29) $ 1.53Diluted EPS 0.39 (0.29) 1.50Basic EPS from continuing operations, as reported 0.40 (0.29) (0.18)Diluted EPS from continuing operations, as reported 0.39 (0.29) (0.18)Adjusted EPS from continuing operations(i) 0.57 0.29 0.51Total Assets $ 3,057 $ 3,452 $ 2,998Net Debt(i) $ 1,016 $ 1,023 $ 855Return on net assets (RONA)(i) 5.9% 3.4% 6.7%Cash fl ow from continuing operations $ 89.2 $ 195.5 $ 122.8Cash dividends per share $ 0.16 $ 0.16 $ 0.16
(i) Refer to Non-GAAP measures on page 2.
MLF_Financials_ENG.indd 4 16/03/10 8:09 AM
2 MAPLE LEAF FOODS INC.
management’s discussion and analysis
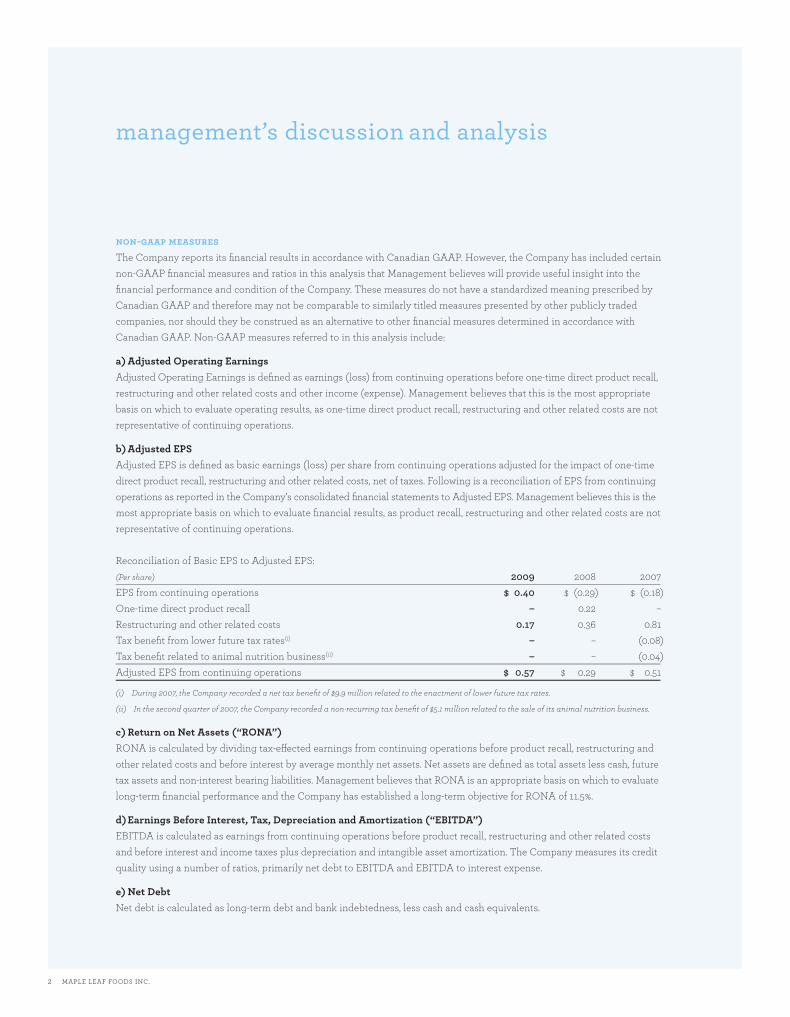
non-gaap measuresThe Company reports its fi nancial results in accordance with Canadian GAAP. However, the Company has included certain non-GAAP fi nancial measures and ratios in this analysis that Management believes will provide useful insight into the fi nancial performance and condition of the Company. These measures do not have a standardized meaning prescribed by Canadian GAAP and therefore may not be comparable to similarly titled measures presented by other publicly traded companies, nor should they be construed as an alternative to other fi nancial measures determined in accordance with Canadian GAAP. Non-GAAP measures referred to in this analysis include:
a) Adjusted Operating EarningsAdjusted Operating Earnings is defi ned as earnings (loss) from continuing operations before one-time direct product recall, restructuring and other related costs and other income (expense). Management believes that this is the most appropriate basis on which to evaluate operating results, as one-time direct product recall, restructuring and other related costs are not representative of continuing operations.
b) Adjusted EPSAdjusted EPS is defi ned as basic earnings (loss) per share from continuing operations adjusted for the impact of one-time direct product recall, restructuring and other related costs, net of taxes. Following is a reconciliation of EPS from continuing operations as reported in the Company’s consolidated fi nancial statements to Adjusted EPS. Management believes this is the most appropriate basis on which to evaluate fi nancial results, as product recall, restructuring and other related costs are not representative of continuing operations. Reconciliation of Basic EPS to Adjusted EPS:(Per share) 2009 2008 2007EPS from continuing operations $ 0.40 $ (0.29) $ (0.18)One-time direct product recall – 0.22 –Restructuring and other related costs 0.17 0.36 0.81Tax benefi t from lower future tax rates(i) – – (0.08)Tax benefi t related to animal nutrition business(ii) – – (0.04)Adjusted EPS from continuing operations $ 0.57 $ 0.29 $ 0.51
(i) During 2007, the Company recorded a net tax benefi t of $9.9 million related to the enactment of lower future tax rates.
(ii) In the second quarter of 2007, the Company recorded a non-recurring tax benefi t of $5.1 million related to the sale of its animal nutrition business.
c) Return on Net Assets (“RONA”)RONA is calculated by dividing tax-eff ected earnings from continuing operations before product recall, restructuring and other related costs and before interest by average monthly net assets. Net assets are defi ned as total assets less cash, future tax assets and non-interest bearing liabilities. Management believes that RONA is an appropriate basis on which to evaluate long-term fi nancial performance and the Company has established a long-term objective for RONA of 11.5%.
d) Earnings Before Interest, Tax, Depreciation and Amortization (“EBITDA”)EBITDA is calculated as earnings from continuing operations before product recall, restructuring and other related costs and before interest and income taxes plus depreciation and intangible asset amortization. The Company measures its credit quality using a number of ratios, primarily net debt to EBITDA and EBITDA to interest expense.
e) Net DebtNet debt is calculated as long-term debt and bank indebtedness, less cash and cash equivalents.
MLF_Financials_ENG.indd 5 16/03/10 8:09 AM
MAPLE LEAF FOODS INC. 3
management’s discussion and analysis
discussion of factors impacting the company’s operations and results
Fluctuating Input Prices“Food for Fuel” initiatives sponsored by the U.S. Government have resulted in increased demand for grains, in particular corn that is used for ethanol production, and decreased land set aside for other crops such as wheat.
Combined with strong demand from export markets and shortfalls in world crops, this resulted in unprecedented increases during 2007 and early 2008 in the prices of commodities including wheat, corn, barley, soybeans, and crude oil. In the last months of 2008, commodity and fuel prices started to decline, and remained lower throughout 2009 compared to 2008. Crude oil prices progressively and steadily increased throughout 2009, although not to the extent of the mid-2008 increase, which refl ected expectations of a global economic recovery and overall higher oil consumption.
As a result, overall input costs and freight and distribution costs were lower in 2009, which contributed to the restoration of the Company’s cost structure and margins closer to historical expectations.
Market prices for hogs declined in 2009. Diffi cult markets and industry-wide losses for hog producers in North America were partially off set by reduced corn and barley prices which lowered feed costs. Hog producers also benefi ted from a weaker Canadian dollar compared to average rates in 2008, which increased the value of Canadian hogs.
The decline in commodity prices, particularly soybeans and soy oil, resulted in lower selling prices in the rendering by-products business.
Reduced fresh meat prices, and in particular reduced fresh pork values, lowered input costs of the Company’s further processed meats and meals business. The extent of this decline was partially off set by a weaker Canadian dollar in the fi rst nine months of 2009 as it increased the Canadian cost of ingredients priced in U.S. dollars.
The bakery business benefi ted from lower input costs in 2009, mostly due to a reduction in wheat, dairy and fuel prices, which constitute the main input costs in these businesses.
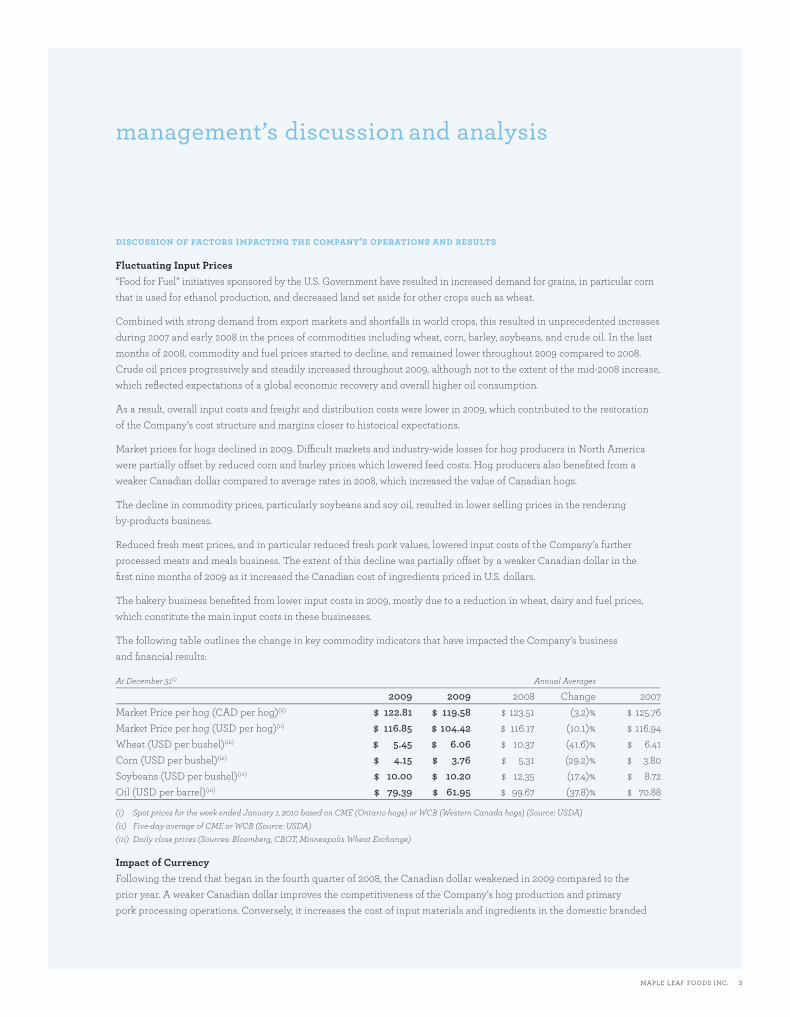
The following table outlines the change in key commodity indicators that have impacted the Company’s business and fi nancial results:
At December 31(i) Annual Averages
2009 2009 2008 Change 2007Market Price per hog (CAD per hog)(ii) $ 122.81 $ 119.58 $ 123.51 (3.2)% $ 125.76Market Price per hog (USD per hog)(ii) $ 116.85 $ 104.42 $ 116.17 (10.1)% $ 116.94Wheat (USD per bushel)(iii) $ 5.45 $ 6.06 $ 10.37 (41.6)% $ 6.41Corn (USD per bushel)(iii) $ 4.15 $ 3.76 $ 5.31 (29.2)% $ 3.80Soybeans (USD per bushel)(iii) $ 10.00 $ 10.20 $ 12.35 (17.4)% $ 8.72Oil (USD per barrel)(iii) $ 79.39 $ 61.95 $ 99.67 (37.8)% $ 70.88
(i) Spot prices for the week ended January 1, 2010 based on CME (Ontario hogs) or WCB (Western Canada hogs) (Source: USDA)(ii) Five-day average of CME or WCB (Source: USDA)(iii) Daily close prices (Sources: Bloomberg, CBOT, Minneapolis Wheat Exchange)
Impact of CurrencyFollowing the trend that began in the fourth quarter of 2008, the Canadian dollar weakened in 2009 compared to the prior year. A weaker Canadian dollar improves the competitiveness of the Company’s hog production and primary pork processing operations. Conversely, it increases the cost of input materials and ingredients in the domestic branded
MLF_Financials_ENG.indd 6 16/03/10 8:09 AM

4 MAPLE LEAF FOODS INC.
management’s discussion and analysis
and private label prepared meats and meals, and fresh bakery businesses. Over time, these businesses have the ability to react to changes in relative competitiveness by price management, reducing costs or investing in value-added products.
Hog production operations are exposed to the U.S. dollar, as the sales value of hogs is pegged to the U.S. dollar. A weaker Canadian dollar in 2009 increased the selling price of Canadian hogs compared to the prior year; however, the benefi ts were realized on a reduced number of hogs in 2009.
The weaker Canadian dollar in 2009 contributed to higher earnings recorded in the Company’s primary pork processing operations as the Company continues to export a signifi cant amount of its fresh pork, pending the sale of two of its three remaining primary processing facilities, in Burlington, Ontario and Lethbridge, Alberta. The completion of these divestitures will materially reduce the Company’s number of hogs processed, and the Company’s exposure to currency-aff ected exports.
The incremental costs of U.S. dollar-based raw materials and ingredients due to a weaker Canadian dollar in 2009 were not fully recovered in the prepared meats and meals business as these operations were focused on recovering from operational disruptions following a product recall in 2008.
The following table outlines the change in key currency indicators that have aff ected the Company’s business and fi nancial results:
Average rate change (i)
Canadian dollar strengthened/(weakened) Between 2009 Between 2009Against and 2008 and 2002the U.S. dollar by: (7)% 38%the Japanese yen by: (16)% 3%
(i) % change in average rate calculated using daily closing rates (Source: Bank of Canada)
Economic DownturnManagement does not believe that the economic downturn had a material impact on the Company’s operations and earnings in 2009. The Company did experience a decline in the sales of premium specialty items in its U.K. bakery operations. The Company is not able to predict whether the economic environment will change in 2010, and whether it will positively or negatively impact the Company’s results in the coming periods.
Completion of the Protein Group ReorganizationIn October 2006, the Company began the execution of a comprehensive strategy to signifi cantly increase the profi tability of its meat products portfolio by shifting focus to growth in its value-added meats and meals business and away from primary processing and agricultural-based businesses. This strategy, formulated in part as a response to material changes in the Company’s competitive position as a result of the strengthening Canadian dollar, was materially complete by the end of 2009. The Company had initially estimated that the protein restructuring would deliver incremental annualized earnings of over $100 million. This incremental earnings target was achieved in 2009 as the majority of the restructuring initiatives had been completed.
The following initiatives were the key drivers of the transformational change and contribution to earnings:• The consolidation of four primary pork processing plants into one state-of-the-art facility in Brandon, generating
scale effi ciencies and enabling the closure of three facilities. • The expansion of a competitive ham-boning facility in Winnipeg close to the Brandon pork processing facility
enabled consolidation of all ham-boning into a single facility, driving synergies and reduced costs.
MLF_Financials_ENG.indd 7 16/03/10 8:09 AM
MAPLE LEAF FOODS INC. 5
management’s discussion and analysis
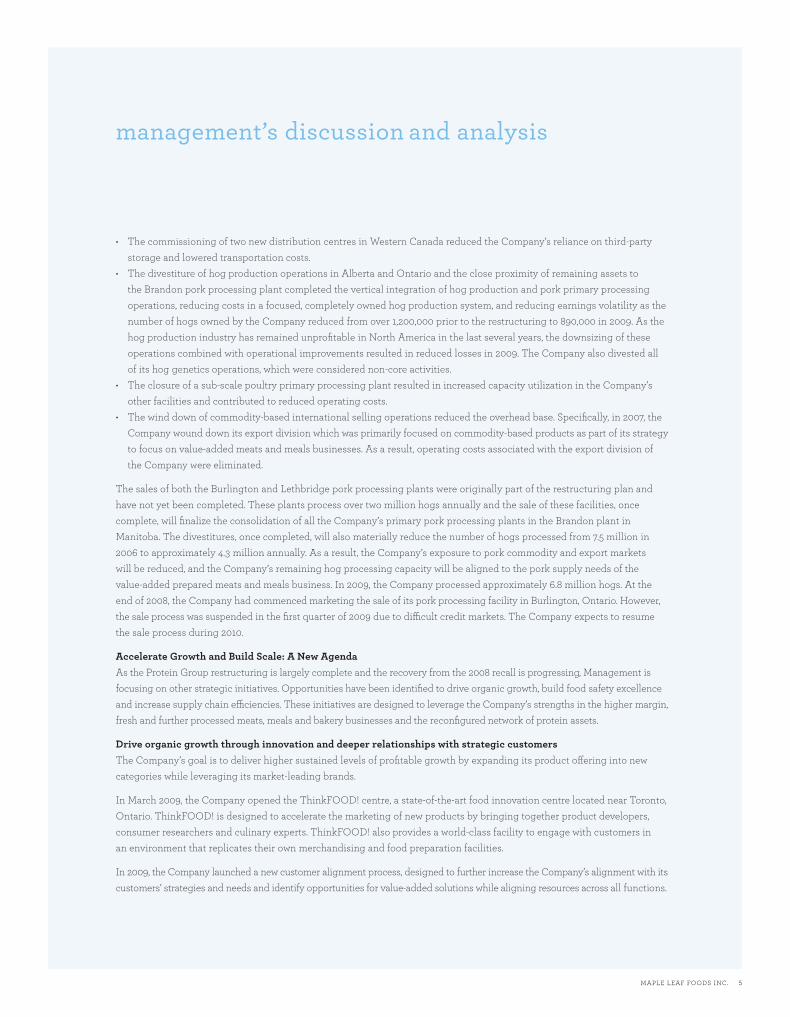
• The commissioning of two new distribution centres in Western Canada reduced the Company’s reliance on third-party storage and lowered transportation costs.
• The divestiture of hog production operations in Alberta and Ontario and the close proximity of remaining assets to the Brandon pork processing plant completed the vertical integration of hog production and pork primary processing operations, reducing costs in a focused, completely owned hog production system, and reducing earnings volatility as the number of hogs owned by the Company reduced from over 1,200,000 prior to the restructuring to 890,000 in 2009. As the hog production industry has remained unprofi table in North America in the last several years, the downsizing of these operations combined with operational improvements resulted in reduced losses in 2009. The Company also divested all of its hog genetics operations, which were considered non-core activities.
• The closure of a sub-scale poultry primary processing plant resulted in increased capacity utilization in the Company’s other facilities and contributed to reduced operating costs.
• The wind down of commodity-based international selling operations reduced the overhead base. Specifi cally, in 2007, the Company wound down its export division which was primarily focused on commodity-based products as part of its strategy to focus on value-added meats and meals businesses. As a result, operating costs associated with the export division of the Company were eliminated.
The sales of both the Burlington and Lethbridge pork processing plants were originally part of the restructuring plan and have not yet been completed. These plants process over two million hogs annually and the sale of these facilities, once complete, will fi nalize the consolidation of all the Company’s primary pork processing plants in the Brandon plant in Manitoba. The divestitures, once completed, will also materially reduce the number of hogs processed from 7.5 million in 2006 to approximately 4.3 million annually. As a result, the Company’s exposure to pork commodity and export markets will be reduced, and the Company’s remaining hog processing capacity will be aligned to the pork supply needs of the value-added prepared meats and meals business. In 2009, the Company processed approximately 6.8 million hogs. At the end of 2008, the Company had commenced marketing the sale of its pork processing facility in Burlington, Ontario. However, the sale process was suspended in the fi rst quarter of 2009 due to diffi cult credit markets. The Company expects to resume the sale process during 2010.
Accelerate Growth and Build Scale: A New AgendaAs the Protein Group restructuring is largely complete and the recovery from the 2008 recall is progressing, Management is focusing on other strategic initiatives. Opportunities have been identifi ed to drive organic growth, build food safety excellence and increase supply chain effi ciencies. These initiatives are designed to leverage the Company’s strengths in the higher margin, fresh and further processed meats, meals and bakery businesses and the reconfi gured network of protein assets.
Drive organic growth through innovation and deeper relationships with strategic customersThe Company’s goal is to deliver higher sustained levels of profi table growth by expanding its product off ering into new categories while leveraging its market-leading brands.
In March 2009, the Company opened the ThinkFOOD! centre, a state-of-the-art food innovation centre located near Toronto, Ontario. ThinkFOOD! is designed to accelerate the marketing of new products by bringing together product developers, consumer researchers and culinary experts. ThinkFOOD! also provides a world-class facility to engage with customers in an environment that replicates their own merchandising and food preparation facilities.
In 2009, the Company launched a new customer alignment process, designed to further increase the Company’s alignment with its customers’ strategies and needs and identify opportunities for value-added solutions while aligning resources across all functions.
MLF_Financials_ENG.indd 8 16/03/10 8:09 AM
6 MAPLE LEAF FOODS INC.
management’s discussion and analysis
Continue to build on food safety excellenceIn 2009, the Company performed an extensive review of its food safety procedures and of worldwide best practices. Following this review, the Company launched several initiatives:
• A new food safety organizational structure was established. This new structure is designed to build expertise, share knowledge and ensure a consistent approach across the Company.
• Increased testing and sanitation processes were implemented, primarily in the prepared meats operations. The Company also started to use food safety technologies such as ultra high pressure and introduced antimicrobial ingredients in its prepared meats products.
Other initiatives were identifi ed, including complying with the Global Food Safety Initiative, a recognized food safety global standard, ensuring suppliers and co-packers adhere to the Company’s standards, the promotion of regulations and practices that raise food safety standards across the industry and an increase in public education and outreach.
Increase effi ciency and optimize supply chainThe value-added meats and meals and the fresh bakery businesses have largely grown due to acquisitions completed over the last decade. This has resulted in extensive plant networks across Canada which off er opportunities for consolidation. Over the next few years, the Company expects to reduce costs through investments that build scale, and drive higher operating effi ciencies, while providing the capacity to support organic growth and the evolving needs of customers.
In January 2010, the Company announced its plan to build a new scale fresh bakery plant in southwestern Ontario, which will ultimately replace three existing older and smaller facilities located in Ontario. Management expects that the investments required to build the new plant will be approximately $100 million, with an additional $25 million of restructuring and other one-time costs for decommissioning and employee severance payments. The new plant is expected to start operations within a year of beginning construction while the closure of the existing older plants is expected to start towards the end of 2011.
Systems ConversionThe Company has embarked on an initiative to consolidate all of its information technology systems on to a single platform, in order to standardize processes, reduce costs and create a consolidated shared services platform. At the end of 2008, Management selected SAP software as its new platform and carefully designed an implementation plan to reduce risks and disruptions to the Company’s operations during the conversion.
In 2009, the Company successfully completed the installation of three SAP modules and installed the software in its North American Frozen Bakery operations with no material operational disruptions. Further operational installations, which will involve larger and more complex operations in the prepared meats and meals, and fresh bakery businesses, are planned for 2010.
Management expects that the installation of the new systems will be substantially complete by the end of 2012.
operating segmentsThe Company reports in three segments: the Meat Products Group, the Agribusiness Group and the Bakery Products Group.
The Meat Products Group comprises value-added packaged meats; chilled meal entrees and lunch kits; and value-added fresh pork, poultry and turkey products. The Agribusiness Group operations include hog production and animal by-products recycling.
The combination of the Company’s Meat Products Group and the Agribusiness Group comprises the Protein Group, which refl ects the results of producing and marketing animal protein-based products.
MLF_Financials_ENG.indd 9 16/03/10 8:09 AM
MAPLE LEAF FOODS INC. 7
management’s discussion and analysis
The Bakery Products Group comprises Maple Leaf’s 89.8% ownership in Canada Bread Company, Limited (“Canada Bread”), a producer of fresh and frozen value-added bakery products, and specialty pasta and sauces.
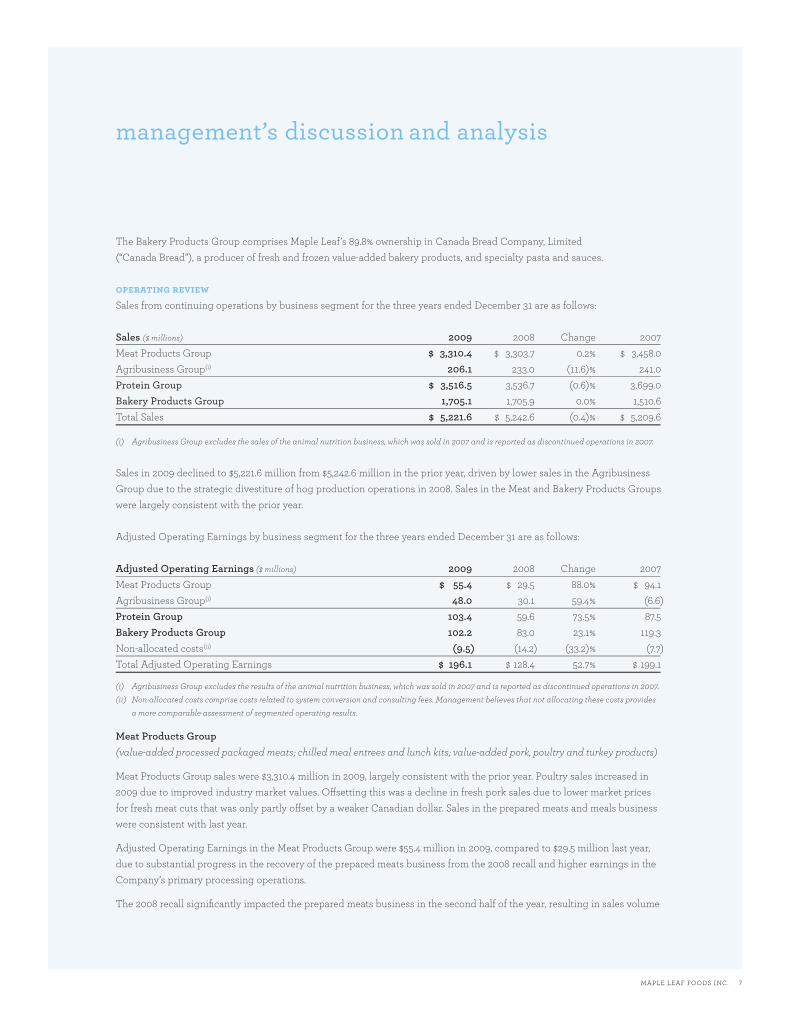
operating reviewSales from continuing operations by business segment for the three years ended December 31 are as follows:
Sales ($ millions) 2009 2008 Change 2007Meat Products Group $ 3,310.4 $ 3,303.7 0.2% $ 3,458.0Agribusiness Group(i) 206.1 233.0 (11.6)% 241.0Protein Group $ 3,516.5 3,536.7 (0.6)% 3,699.0Bakery Products Group 1,705.1 1,705.9 0.0% 1,510.6Total Sales $ 5,221.6 $ 5,242.6 (0.4)% $ 5,209.6
(i) Agribusiness Group excludes the sales of the animal nutrition business, which was sold in 2007 and is reported as discontinued operations in 2007.
Sales in 2009 declined to $5,221.6 million from $5,242.6 million in the prior year, driven by lower sales in the Agribusiness Group due to the strategic divestiture of hog production operations in 2008. Sales in the Meat and Bakery Products Groups were largely consistent with the prior year.
Adjusted Operating Earnings by business segment for the three years ended December 31 are as follows:
Adjusted Operating Earnings ($ millions) 2009 2008 Change 2007Meat Products Group $ 55.4 $ 29.5 88.0% $ 94.1Agribusiness Group(i) 48.0 30.1 59.4% (6.6)Protein Group 103.4 59.6 73.5% 87.5Bakery Products Group 102.2 83.0 23.1% 119.3Non-allocated costs(ii) (9.5) (14.2) (33.2)% (7.7)Total Adjusted Operating Earnings $ 196.1 $ 128.4 52.7% $ 199.1
(i) Agribusiness Group excludes the results of the animal nutrition business, which was sold in 2007 and is reported as discontinued operations in 2007. (ii) Non-allocated costs comprise costs related to system conversion and consulting fees. Management believes that not allocating these costs provides
a more comparable assessment of segmented operating results.
Meat Products Group(value-added processed packaged meats; chilled meal entrees and lunch kits; value-added pork, poultry and turkey products)
Meat Products Group sales were $3,310.4 million in 2009, largely consistent with the prior year. Poultry sales increased in 2009 due to improved industry market values. Off setting this was a decline in fresh pork sales due to lower market prices for fresh meat cuts that was only partly off set by a weaker Canadian dollar. Sales in the prepared meats and meals business were consistent with last year.
Adjusted Operating Earnings in the Meat Products Group were $55.4 million in 2009, compared to $29.5 million last year, due to substantial progress in the recovery of the prepared meats business from the 2008 recall and higher earnings in the Company’s primary processing operations.
The 2008 recall signifi cantly impacted the prepared meats business in the second half of the year, resulting in sales volume
MLF_Financials_ENG.indd 10 16/03/10 8:09 AM
8 MAPLE LEAF FOODS INC.
management’s discussion and analysis
declines and supply chain disruptions. Additionally, the impact of rising input costs could not be passed through, while the Company was in the midst of business recovery. In 2009, signifi cant focus and resources were committed to selling and operational initiatives to support the recovery of this business. Volumes recovered close to pre-recall levels in the fi rst half of 2009, and have remained close to those levels in the second half. While featuring and promotional activities were increased at the start of 2009 to support volume recovery, the depth and frequency of these activities returned to normal levels by the third quarter of 2009, resulting in improved margins in the second half of 2009. In 2010, Management is focusing on growing volumes and expanding sustainable margins in prepared meats and the Maple Leaf brand. Signifi cant progress is still required in meat products to achieve the full potential of the Protein Group.
The Company’s primary pork processing operations realized a signifi cant increase in earnings compared to 2008, mostly driven by the benefi ts of restructuring initiatives that were completed in 2007 and 2008. The fully double-shifted Brandon scale facility and the expansion of the Lagimodiere Road plant in Winnipeg signifi cantly improved effi ciencies and contributed to reduced operating costs. In addition, a weaker Canadian dollar partly off set poor industry market conditions in the fi rst nine months of 2009.
Earnings in the Company’s poultry operations also increased in 2009, mostly driven by improved market conditions, better yields and lower operating and feed costs.
In 2009, the Company delayed certain strategic initiatives to focus on the recovery of the prepared meats business. As substantial progress was made in the recovery of volumes and margins in this business, the Company has resumed its strategic agenda for 2010. Strategic initiatives in the coming years will focus on faster and stronger innovation, accelerated sales growth, and supply chain optimization.
Agribusiness Group(hog production and animal by-products recycling)
Sales in the Agribusiness Group decreased 11.6% to $206.1 million in 2009 from $233.0 million last year due to the sale or exit of the Company’s hog production operations in Alberta and Ontario, and its hog genetics business in 2008. Sales of rendered by-products also decreased due to reduced sales values as commodity prices declined from 2008 levels.
Adjusted Operating Earnings for the Agribusiness Group increased to $48.0 million from $30.1 million last year.
Despite poor market conditions, hog production results improved significantly over the prior year as 2009 operating earnings included the full annualized benefits from the strategic divestitures and exit of non-core activities completed in 2008. Hog production in North America continued to be unprofitable in 2009 due to depressed market prices. In this environment, the reduction in the number of hogs the Company produced resulted in lower operating losses. The annual number of hogs produced was approximately 890,000 compared to an annual run rate of 1,270,000 hogs prior to restructuring.
The decline in feed costs from peak levels reached in 2008, excellent results in herd health management and effi ciencies in feed usage contributed to reduce operating costs. Concurrently, the Company’s hog production operations benefi ted from a weaker Canadian dollar compared to the prior year, which increased the market value of hogs in Canadian dollars. Included in earnings are $9.2 million (2008: $11.8 million) related to government support to compensate hog producers for losses in prior periods.
Results in the rendering by-products and bio diesel business declined from their 2008 record levels as the normalization of commodity prices resulted in lower sales values in 2009. This was partially off set by lower operating and utility costs. Lower rendered by-product earnings were partially off set by increased bio-diesel earnings, which were supported by higher
MLF_Financials_ENG.indd 11 16/03/10 8:09 AM
MAPLE LEAF FOODS INC. 9
management’s discussion and analysis
sales volumes and lower operating costs. Earnings during 2009 included $12.6 million of eco-energy credits received from the Canadian government as part of its policy to support the development of renewable energies (2008: $4.7 million). The year-over-year increase refl ects a structural change in the value of such credits to renewable energy producers that should improve industry-wide economics.
Bakery Products Group(fresh, frozen and branded value-added bakery products, including frozen par-baked bakery products, sandwiches and specialty pasta and sauces)
Sales in the Bakery Products Group were $1,705.1 million in 2009, largely consistent with the prior year. Sales increased in the fresh and frozen bakeries, and fresh pasta and sauces businesses due to price increases implemented in 2008 in response to escalating input costs; higher volumes in the fresh bakery, and fresh pasta and sauces businesses; and the favourable impact of a weaker Canadian dollar on the U.S. dollar-denominated sales. However, these increases were off set by the impact of a weaker British pound on the translation of British pound-denominated sales, lower sales volumes and an unfavourable mix shift that primarily impacted sales in the U.K. bakery operations, and lower sales volumes of fresh sandwiches. The U.K. operations were impacted by the economic downturn, more than other businesses in the Company’s portfolio, as its product mix has traditionally been more focused towards premium and specialty bakery products.
Adjusted Operating Earnings in the Bakery Products Group were $102.2 million compared to $83.0 million in the prior year. Earnings in 2008 were aff ected by sharply higher commodity and energy prices that were not fully recovered by higher prices. In 2009, the combination of price increases implemented in the prior year and a decline in commodity costs to more usual levels helped to restore margins in the North American bakeries. The weaker Canadian dollar, which increases the cost of U.S. dollar priced fl our and other ingredients, partially off set the impact of the decline in commodity input costs.
Earnings growth in the fresh bakery, and pasta and sauces businesses was also supported by increased sales volumes and capital investments. The fresh sandwich business did not meet expectations due to lower sales and higher operating costs. Management considers this business to be an important part of its growth strategy and is actively working on initiatives to improve profi tability.
A reduced cost base and higher manufacturing effi ciencies contributed to improved earnings in the North American frozen bakery business. These improvements resulted from the closure of a bagel facility in Toronto, Ontario, in late 2008, and the transfer of bagel production to Roanoke, Virginia, in 2009. The Roanoke bagel line was commissioned during the fi rst quarter of 2009 and was operating at full capacity by the end of the year. Partially off setting improved earnings in this business was the impact of sales volume softness and unfavorable product mix. Earnings in the U.K. bakery operations declined compared to 2008, driven by lower sales volumes, the related impact on manufacturing overheads and supply chain investments. In 2009, the Company received the fi nal installments of insurance proceeds of $2.5 million (recorded in Other Income), compared to $14.7 million in 2008. These insurance proceeds covered business interruption losses and operating impacts resulting from an oven fi re which occurred in 2008. A new oven was commissioned in the summer of 2008 and was operating at full capacity by the fi rst half of 2009. Concurrently, bagel demand was restored to historical levels.
During the year, marketing and selling expenses increased mainly in support of innovation and volume growth. Several unique fresh bakery products were launched throughout 2009. The Healthy Way ® with ProCardio Recipe™ line was launched in early 2009. It is the fi rst line of fresh bakery products specifi cally targeting the heart health segment. Cadbury Snack Cakes were launched late in 2009, and target the premium snack category, while Oven Fresh™, an innovative line of white and multigrain fresh and par-baked breads aimed at capturing the under-developed dinner bread market was also introduced. Additionally, the focus on improving the results of the fresh sandwich business led to an increase in overall management costs compared to last year.
MLF_Financials_ENG.indd 12 16/03/10 8:09 AM
10 MAPLE LEAF FOODS INC.
management’s discussion and analysis
gross marginOverall, gross margin increased to $734.2 million from $620.2 million in the prior year as a result of increased gross margins across all segments. As a percentage of sales, gross margin increased to 14.1% from 11.8% in 2008. Improved gross margin in the Protein Group refl ected the continuing recovery in prepared meats, the restructuring benefi ts in the Company’s pork primary processing and hog production operations, and improved operations and markets in the poultry operations. Gross margins in the Bakery Products Group were restored to historical levels primarily due to the combination of lower prices for commodities and prior year price increases.
selling, general and administrative expenses Selling, general and administrative expenses increased to $538.1 million in 2009 from $491.8 million in the prior year, primarily as a result of a $29.2 million increase in pension expense. Also contributing to the increase were selling and marketing expenses in the Bakery Products Group and increased other expenses. Partially off setting higher costs was the impact of cost containment initiatives implemented in the Meat Products Group during the year. These initiatives included some staff reduction and the elimination of vacant positions that were made redundant by the restructuring and the reduction in administrative costs.
other incomeOther income for the year decreased to $3.6 million from $24.9 million last year. Other income mostly comprised insurance proceeds of $2.5 million in 2009 (2008: $14.7 million) received for business interruption losses in the U.K. bakery business following an oven fi re in early 2008. In 2008, other income also included insurance proceeds received for business interruption losses in the U.K. bakery business and net proceeds of $4.3 million related to a gain on disposal of a redundant warehouse facility located in Calgary, Alberta.
other mattersIn July 2009, the Company was advised by its two largest shareholders, the Ontario Teachers Pension Plan Board (“Ontario Teachers”) and McCain Capital Corporation (“MCC”), that Ontario Teachers had delivered notice to MCC to terminate, eff ective June 30, 2010, the shareholders agreement that has existed between them since 2001. The Company had been advised and previously reported that the agreement provides that the board of directors of the Company will consist of three nominees of MCC, two nominees of Ontario Teachers, the Chief Executive Offi cer of the Company and seven independent directors to be mutually agreed to by MCC and Ontario Teachers. Accordingly, absent earlier termination or amendment by the parties, the shareholders agreement will no longer be eff ective after June 30, 2010.
In March 2009, the courts approved a settlement agreement between the plaintiff s of class action lawsuits related to a product recall which occurred in August 2008 and the Company. The deadlines for plaintiff s to opt out of the class action settlement and pursue an independent action has passed as has the deadline for plaintiff s to fi le claims under the class action settlement. The settlement amount provided that the Company will pay between $25 million and $27 million, to the extent claims and costs may exceed $25 million, in full and fi nal settlement of all claims, applicable taxes, class counsel fees and expenses, subrogation claims by provincial health insurers, trustee fees and expenses, arbitration fees and expenses and claim administration fee and expenses. The settlement amount was paid by the Company’s liability insurers in 2009. The class counsel has appointed an independent administrator who is administering the compensation to be paid from the settlement amount under the supervision of the court.
MLF_Financials_ENG.indd 13 16/03/10 8:09 AM
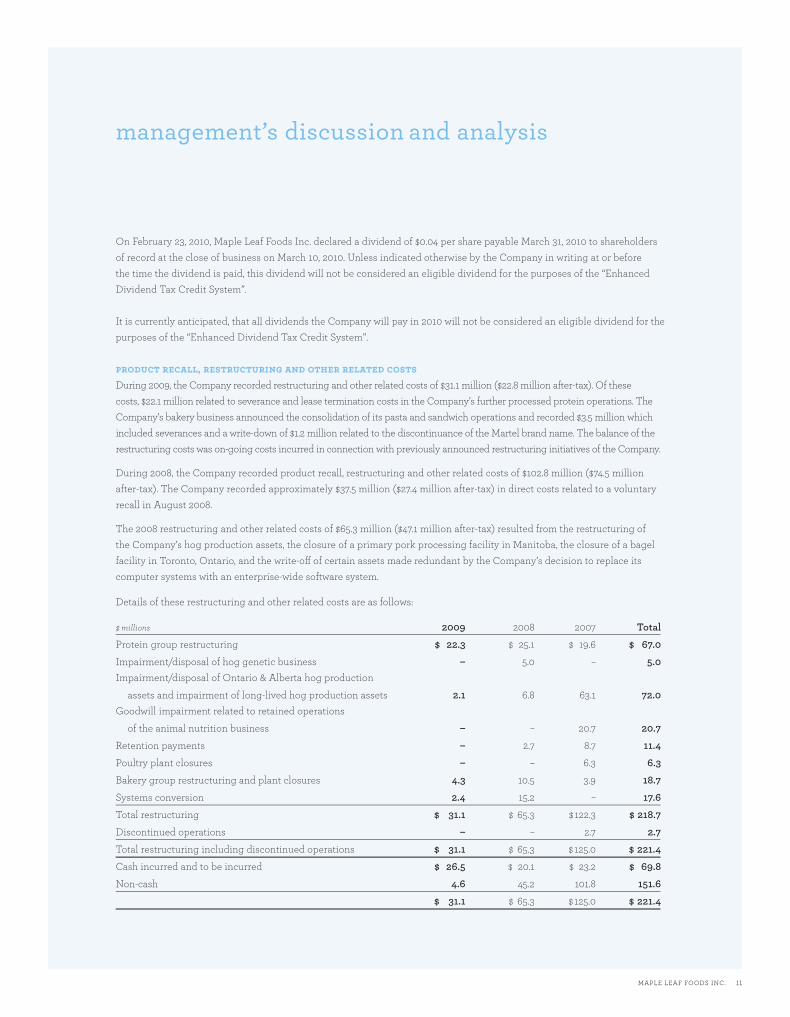
MAPLE LEAF FOODS INC. 11
management’s discussion and analysis
On February 23, 2010, Maple Leaf Foods Inc. declared a dividend of $0.04 per share payable March 31, 2010 to shareholders of record at the close of business on March 10, 2010. Unless indicated otherwise by the Company in writing at or before the time the dividend is paid, this dividend will not be considered an eligible dividend for the purposes of the “Enhanced Dividend Tax Credit System”.
It is currently anticipated, that all dividends the Company will pay in 2010 will not be considered an eligible dividend for the purposes of the “Enhanced Dividend Tax Credit System”.
product recall, restructuring and other related costsDuring 2009, the Company recorded restructuring and other related costs of $31.1 million ($22.8 million after-tax). Of these costs, $22.1 million related to severance and lease termination costs in the Company’s further processed protein operations. The Company’s bakery business announced the consolidation of its pasta and sandwich operations and recorded $3.5 million which included severances and a write-down of $1.2 million related to the discontinuance of the Martel brand name. The balance of the restructuring costs was on-going costs incurred in connection with previously announced restructuring initiatives of the Company.
During 2008, the Company recorded product recall, restructuring and other related costs of $102.8 million ($74.5 million after-tax). The Company recorded approximately $37.5 million ($27.4 million after-tax) in direct costs related to a voluntary recall in August 2008.
The 2008 restructuring and other related costs of $65.3 million ($47.1 million after-tax) resulted from the restructuring of the Company’s hog production assets, the closure of a primary pork processing facility in Manitoba, the closure of a bagel facility in Toronto, Ontario, and the write-off of certain assets made redundant by the Company’s decision to replace its computer systems with an enterprise-wide software system.
Details of these restructuring and other related costs are as follows:
$ millions 2009 2008 2007 TotalProtein group restructuring $ 22.3 $ 25.1 $ 19.6 $ 67.0Impairment/disposal of hog genetic business – 5.0 – 5.0Impairment/disposal of Ontario & Alberta hog production
assets and impairment of long-lived hog production assets 2.1 6.8 63.1 72.0Goodwill impairment related to retained operations
of the animal nutrition business – – 20.7 20.7Retention payments – 2.7 8.7 11.4Poultry plant closures – – 6.3 6.3Bakery group restructuring and plant closures 4.3 10.5 3.9 18.7Systems conversion 2.4 15.2 – 17.6Total restructuring $ 31.1 $ 65.3 $122.3 $ 218.7Discontinued operations – – 2.7 2.7Total restructuring including discontinued operations $ 31.1 $ 65.3 $125.0 $ 221.4Cash incurred and to be incurred $ 26.5 $ 20.1 $ 23.2 $ 69.8Non-cash 4.6 45.2 101.8 151.6 $ 31.1 $ 65.3 $ 125.0 $ 221.4
MLF_Financials_ENG.indd 14 16/03/10 8:09 AM
12 MAPLE LEAF FOODS INC.
managements discussion and analysismanagement’s discussion and analysis
interest expenseInterest expense for the year decreased to $81.2 million compared to $88.7 million last year. The decrease is primarily due to lower short-term interest rates. The Company’s average borrowing rate for 2009 was 5.1% (2008: 6.0%). As at December 31, 2009, 57.0% of indebtedness was fi xed and not exposed to interest fl uctuations (2008: 70.0%).
income taxes Income tax expense for the year was $27.3 million versus a recovery of $8.5 million in 2008. A reconciliation between statutory tax rates and the Company’s eff ective tax rate is provided in Note 18 of the Consolidated Financial Statements. The following is a discussion of certain reconciling amounts:
• During the year, the Company recorded restructuring and other related costs of $31.1 million (2008: $102.8 million) that had a tax eff ect of $8.3 million (2008: $28.4 million), for an eff ective tax rate of 26.8%. The lower tax rate was primarily driven by lower tax rates applied to deductions expected to be claimed in future years.
• During the third quarter of 2006, the Company recorded a tax expense of $21.2 million to write-down future tax assets related to its U.S. frozen bakery business. The total valuation allowance recorded on the losses related to the U.S. frozen bakery business is $24.1 million as of the end of 2009.
• The Company’s income tax rate varies and could increase or decrease based on the amounts of taxable income derived and from which source, any amendments to tax laws and income tax rates and changes in assumptions and estimates used for tax assets or liabilities.
pension expensePension expense for the year was $17.8 million compared to pension income of $11.5 million in 2008. Components of pension expense are provided in Note 19 of the Consolidated Financial Statements.
The Company operates both defi ned contribution and defi ned benefi t plans. The assets of the defi ned benefi t plans are invested primarily in foreign and domestic fi xed income and equity securities that are subject to fl uctuations in market prices. Discount rates used to measure plan liabilities are based on long-term market interest rates. Fluctuations in these market prices and rates can impact pension expense and funding requirements. During 2008, both equity and fi xed income markets suff ered signifi cant losses worldwide. As a result, the asset return in the Company’s defi ned benefi t pension plans averaged a loss of approximately 14.5% for 2008. The eff ect of these investment losses began to be refl ected in 2009 and was the principal driver of the $29.2 million increase in pension expense as compared to 2008.
During 2009, both equity and fi xed income investments and markets experienced a recovery and the Company’s defi ned benefi t pension plans averaged a gain of approximately 17.4%. While the markets experienced a recovery, long-term market interest rates decreased impacting the discount rate used to measure the plan liabilities.
The Company’s contributions are funded through cash fl ows generated from operations. Management anticipates that future cash fl ows from operations will be suffi cient to fund expected future contributions.
MLF_Financials_ENG.indd 15 16/03/10 8:09 AM
MAPLE LEAF FOODS INC. 13
management’s discussion and analysis
acquisitions and divestituresIn December 2008, the Company sold its hog genetics business. The loss on disposal is included in restructuring and other related costs for 2008.
On January 29, 2008, the Company acquired the shares of Aliments Martel Inc. (“Martel”), a manufacturer and distributor of sandwiches, meals and sweet goods based in Quebec for an initial purchase price of $44.6 million plus contingent consi–deration of up to $22.6 million, based on fi nancial performance over three years post-acquisition. During the fi rst quarter of 2009, the Company fi nalized the purchase price allocation for this acquisition, allocating $15.4 million to the identifi able net tangible assets of Martel at the acquisition date and $29.2 million to goodwill and intangible assets. The acquired intangible assets include $1.5 million allocated to trademarks that are being amortized on a straight-line basis over ten years and $1.7 million allocated to customer relationships that are being amortized on a straight-line basis over 20 years. No amounts have been paid to the vendors in respect of contingent consideration.
On January 14, 2008, the Company purchased the assets of Central By-Products (“CBP”), a rendering business located near London, Ontario for $18.1 million. During the fi rst quarter of 2009, the Company fi nalized the purchase price allocation for this acquisition and allocated $6.0 million to the net identifi able assets of CBP at the acquisition date and $12.1 million to goodwill.
In the fi rst quarter of 2008, the Company sold its Ontario hog production operations and all of its wholly owned production investments in Alberta. The loss on these disposals had previously been recognized in the fourth quarter of 2007.
There were no acquisitions or divestitures in 2009.
investments in canada bread company, limitedOn July 17, 2008, the Company purchased 458,000 additional shares in Canada Bread Company, Limited (“Canada Bread”) for cash consideration of $32.6 million, increasing the Company’s ownership interest in Canada Bread from 88.0% to 89.8%. During the second quarter of 2009, the Company fi nalized the purchase price allocation for these purchases, allocating $11.4 million of the purchase price to the net tangible assets of Canada Bread at the acquisition date, $1.1 million to intangible assets and $20.1 million to goodwill.
capital resourcesThe food industry segments in which the Company operates are generally characterized by high sales volume and rapid turnover of inventories and accounts receivable. In general, accounts receivable and inventories are readily convertible into cash. Investment in working capital is aff ected by fl uctuations in the prices of raw materials, seasonal and other market-related fl uctuations. For example, although an increase or decrease in pork or grain commodity prices may not aff ect margins, they can have a material eff ect on investment in working capital, primarily inventory and accounts receivable. Due to its diversity of operations, the Company has in the past consistently generated a strong base level of operating cash fl ow, even in periods of higher commodity prices and restructuring of its operations. These operating cash fl ows provide a base of underlying liquidity that the Company supplements with credit facilities to provide longer-term funding and to fi nance fl uctuations in working capital levels.
Total debt, net of cash balances, as at December 31, 2009 was $1,015.6 million, compared to $1,022.8 million as at December 31, 2008. The decrease in debt for the year is due to cash fl ow from operations and the impact of changes in foreign exchange rates on the U.S. dollar-denominated debt, off set by investment in property and equipment.
MLF_Financials_ENG.indd 16 16/03/10 8:09 AM

14 MAPLE LEAF FOODS INC.
managements discussion and analysismanagement’s discussion and analysis
Cash balances as at the end of the year were $29.3 million (2008: $365.5 million). Most of the 2008 cash balances were used to fund the Company’s 2009 capital requirements and debt maturities.
Cash fl ow from continuing operations for the year was $89.2 million compared to $195.5 million last year. Cash generated from operating earnings was lower due to higher working capital levels. In 2008 the Company signifi cantly reduced its working capital levels in response to the 2008 product recall, while working capital returned to more normalized levels during 2009.
capital expendituresCapital expenditures for 2009 were $162.9 million compared to $206.2 million in 2008.
A large portion of the investment made by the Company in 2009 was related to the implementation of SAP, which will replace and harmonize the Company’s systems across all its businesses. Additionally, the Company continued to invest in initiatives that were started in prior years to generate effi ciencies in manufacturing, and which were fully completed in 2009. This included additional investment in the Company’s double-shifted scale pork processing facility in Brandon, distribution and warehouse facilities in Western Canada, and the commissioning and ramp up of a new bagel production line in the Company’s frozen bakery facility in Roanoke, Virginia. During the year, the Company completed the construction of a new state-of-the art food innovation centre, which is designed to support the Company’s product development and consumer research. The construction of this new building also enabled the Company to locate all the support staff of the Company’s protein operations in a single location.
As the Company focuses on internal growth and innovation, other investments were made to support the development and launch of new products. In some cases, such as new deli and sliced meat products sold in a resealable packaging, new technologies or investment in production lines were required. Other investments included capacity expansion in the Company’s fresh pasta and sauce operations.
Overall, the Company’s investment in capital assets in 2009 was curtailed as Management was focused on restoring earnings and cash fl ow in the Company’s prepared meats and meals business following the product recall in August 2008. In 2009, the Company made substantial progress in the recovery of this business and also realized the targeted benefi ts from its protein restructuring. As earnings and cash fl ow generation continues to improve, capital investment will be targeted in the coming years to support the Company’s new focus on supply chain optimization in its meats and meals, and fresh bakery operations.
debt facilitiesThe Company is exposed to fluctuations in the prices of raw materials, seasonal and other market-related price changes. Due to the high sales volumes and rapid turnover of inventories, the impact of these price fluctuations is generally short-term. When commodity price increases are significant, it can increase the funding required for investments in working capital. These cash flow requirements are funded from current operating cash flow and existing credit facilities. Management is of the opinion that its operating cash flow and existing credit facilities provide the Company with sufficient resources to finance ongoing business requirements and its capital investment program for at least the next twelve months.
The Company’s debt facilities are subject to certain restrictions and require the maintenance of certain debt and cash fl ow ratios. The Company was in compliance with all of the requirements of its lending agreements during 2009. At the end of the year, net debt to EBITDA was 2.9x (2008: 3.4x). Management has a long-term target range for this ratio between 2.5x and 3.5x.
MLF_Financials_ENG.indd 17 16/03/10 8:09 AM
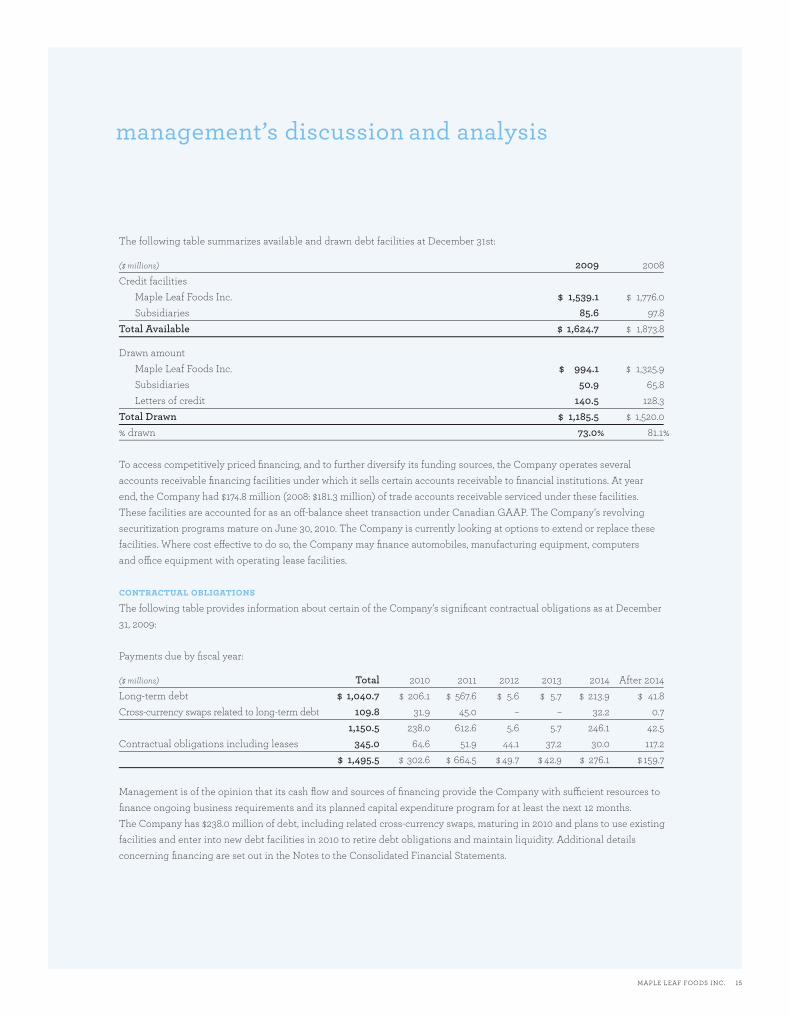
MAPLE LEAF FOODS INC. 15
management’s discussion and analysis
The following table summarizes available and drawn debt facilities at December 31st:
($ millions) 2009 2008Credit facilities
Maple Leaf Foods Inc. $ 1,539.1 $ 1,776.0Subsidiaries 85.6 97.8
Total Available $ 1,624.7 $ 1,873.8
Drawn amount Maple Leaf Foods Inc. $ 994.1 $ 1,325.9Subsidiaries 50.9 65.8 Letters of credit 140.5 128.3
Total Drawn $ 1,185.5 $ 1,520.0% drawn 73.0% 81.1%
To access competitively priced fi nancing, and to further diversify its funding sources, the Company operates several accounts receivable fi nancing facilities under which it sells certain accounts receivable to fi nancial institutions. At year end, the Company had $174.8 million (2008: $181.3 million) of trade accounts receivable serviced under these facilities. These facilities are accounted for as an off -balance sheet transaction under Canadian GAAP. The Company’s revolving securitization programs mature on June 30, 2010. The Company is currently looking at options to extend or replace these facilities. Where cost eff ective to do so, the Company may fi nance automobiles, manufacturing equipment, computers and offi ce equipment with operating lease facilities.
contractual obligationsThe following table provides information about certain of the Company’s signifi cant contractual obligations as at December 31, 2009:
Payments due by fi scal year:
($ millions) Total 2010 2011 2012 2013 2014 After 2014Long-term debt $ 1,040.7 $ 206.1 $ 567.6 $ 5.6 $ 5.7 $ 213.9 $ 41.8Cross-currency swaps related to long-term debt 109.8 31.9 45.0 – – 32.2 0.7 1,150.5 238.0 612.6 5.6 5.7 246.1 42.5 Contractual obligations including leases 345.0 64.6 51.9 44.1 37.2 30.0 117.2 $ 1,495.5 $ 302.6 $ 664.5 $ 49.7 $ 42.9 $ 276.1 $ 159.7
Management is of the opinion that its cash fl ow and sources of fi nancing provide the Company with suffi cient resources to fi nance ongoing business requirements and its planned capital expenditure program for at least the next 12 months. The Company has $238.0 million of debt, including related cross-currency swaps, maturing in 2010 and plans to use existing facilities and enter into new debt facilities in 2010 to retire debt obligations and maintain liquidity. Additional details concerning fi nancing are set out in the Notes to the Consolidated Financial Statements.
MLF_Financials_ENG.indd 18 16/03/10 8:09 AM
16 MAPLE LEAF FOODS INC.
managements discussion and analysismanagement’s discussion and analysis
fi nancial instruments and risk management activities(i)
Through normal course of business the Company is exposed to fi nancial and market risks that have the potential to aff ect its operating results. In order to manage these risks the Company operates under risk management policies and guidelines which govern the hedging of price and market risk in the foreign exchange, interest rate and commodity markets as well as funding and investing activities.
The Company engages in hedging to manage price and market risk associated with core operating exposures, and does not engage in signifi cant trading activity of a speculative nature.
The Company’s Risk Management Committee meets frequently to discuss current market conditions, review current hedging programs and trading activity, and approve any new hedging or trading strategies.
In order to limit the impact of market price fl uctuations on operating results, all core hedging programs are designated as hedging relationships and managed as part of Company’s hedging accounting portfolio.
CapitalThe Company’s objective is to maintain a cost-eff ective capital structure that supports its long-term growth strategy and maximizes operating fl exibility. In allocating capital to investments to support its earnings goals, the Company establishes internal hurdle return rates for capital initiatives. Capital projects are generally fi nanced with senior debt and internal cash fl ows.
The Company uses leverage in its capital structure to reduce the cost of capital. The Company’s goal is to maintain its primary credit ratios and leverage at levels that are designed to provide continued access to investment grade credit pricing and terms. The Company measures its credit profi le using a number of metrics, primarily net debt to EBITDA(ii) and EBITDA(ii) to interest expense.
In addition to senior debt and equity, the Company may use operating leases and limited recourse accounts receivable securitization programs as additional sources of fi nancing.
The Company has maintained a stable dividend distribution that is based on the sustainable net earnings base. From time to time, the Company has purchased shares for cancellation pursuant to normal course issuer bids and to satisfy awards under its Restricted Share Unit plan, an equity compensation program established in 2006.
For the year ended December 31, 2009, total equity increased by $46.1 million to $1,189.1 million. During the same period, total debt net of cash and cash equivalents decreased by $7.2 million to $1,015.6 million.
Credit RiskCredit risk refers to the risk of losses due to failure of the Company’s customers and counterparties to meet their payment obligations.
In the normal course of business, the Company is exposed to credit risk from its customers, substantially all of which are in the grocery and foodservice markets. The Company performs ongoing credit evaluations of new and existing customers’ fi nancial condition and reviews the collectibility of its trade and other accounts receivable in order to mitigate any possible credit losses. The Company maintains an allowance for uncollectible accounts that represents its estimate of uncollectible amounts. The components of this allowance include a provision related to specifi c losses estimated on individually signifi cant exposures and a provision based on historical trends of collections. As at December 31, 2009, the Company believes that the allowance for uncollectible accounts suffi ciently covers any credit risk related to past due or impaired accounts receivable balances.
(i) For a comprehensive discussion on the Company’s risk management practices and derivative exposures, please refer to the Financial Instruments note in the Financial Statements.
(ii) Refer to non-GAAP measures on page 2.
MLF_Financials_ENG.indd 19 16/03/10 8:09 AM
MAPLE LEAF FOODS INC. 17
management’s discussion and analysis
Management believes concentrations of credit risk with respect to accounts receivable is limited due to the credit quality of the Company’s major customers, as well as the large number and geographic dispersion of smaller customers. The Company does, however, conduct a signifi cant amount of business with a small number of large grocery retailers. The Company’s fi ve largest customers comprise approximately 43% of consolidated accounts receivable at December 31, 2009 (2008: 30%) and the two largest customers comprise approximately 23% (2008: 23%) of consolidated sales.
The Company is exposed to credit risk on its cash and cash equivalents (comprising primarily deposits and short-term placements with Canadian chartered banks) and non-exchange-traded derivatives contracts. The Company mitigates this credit risk by only dealing with counterparties that are major international fi nancial institutions with long-term debt ratings of single A or better.
The Company’s maximum exposure to credit risk at the balance sheet date consists primarily of the carrying value of non-derivative fi nancial assets and non-exchange-traded derivatives with positive fair values.
Liquidity RiskLiquidity risk is the risk that the Company will encounter diffi culty in meeting obligations associated with fi nancial liabilities.
The Company manages liquidity risk by monitoring forecasted and actual cash fl ows, reducing reliance on any single source of credit, maintaining suffi cient undrawn committed credit facilities and managing the maturity profi les of fi nancial assets and fi nancial liabilities to minimize re-fi nancing risk.
As at December 31, 2009, the Company had available undrawn committed credit of $393.4 million under the terms of its principal banking arrangements as well as $29.3 million in cash balances. These banking arrangements, which mature in May 2011, are subject to certain covenants and other restrictions.
Market RiskInterest Rate RiskInterest rate risk refers to the risk that the value of a fi nancial instrument or cash fl ows associated with the instrument will fl uctuate due to changes in market interest rates. The Company does from time to time enter into interest rate swaps to manage its current and anticipated market exposure, and to achieve an overall desired borrowing rate.
The Company’s interest rate risk arises from short and long-term borrowings issued at fi xed rates that create fair value interest rate risk, and variable rate borrowings that create cash fl ow interest rate risk. The Company actively monitors the market to ensure that the desired overall funding rate, as well as the targeted proportionate fi xed to variable debt mix is achieved.
As at December 31, 2009, 57% of the Company’s outstanding debt was not exposed to interest rate movements (2008: 70%).
Foreign Exchange RiskForeign exchange risk refers to the risk that the value of fi nancial instruments or cash fl ows associated with the instruments will fl uctuate due to changes in foreign exchange rates. The Company enters into currency derivative agreements to manage its current and anticipated exposures in the foreign exchange markets.
The Company’s foreign exchange risk arises primarily from transactions in currencies other than Canadian dollars. The primary currencies that the Company is exposed to are the U.S. dollar through U.S.-denominated sales and borrowings, and the British pound and Japanese yen.
The Company uses cross-currency interest rate swaps to mitigate its exposure to changes in exchange rates related to U.S. dollar-denominated debt. These swaps are used primarily to eff ectively convert fi xed rate U.S. dollar-denominated notes payable to fi xed rate notes denominated in Canadian dollars, and are accounted for as cash fl ow hedges.
MLF_Financials_ENG.indd 20 16/03/10 8:09 AM

18 MAPLE LEAF FOODS INC.
managements discussion and analysismanagement’s discussion and analysis
The Company uses foreign exchange forward contracts to manage exposures arising from product sales in the U.S. and Japan. All forward contracts in U.S. dollars and Japanese yen that are designated as hedges within the Company’s hedge accounting portfolio and accounted for as cash fl ow hedges.
Commodity Price RiskThe Company is directly exposed to price fl uctuations in commodities such as wheat, live hogs, fuel costs and the purchase of other agricultural commodities used as raw materials such as feed grains and wheat. In order to minimize the impact of these price fl uctuations on the Company’s operating results, the Company may use fi xed price contracts with suppliers exchange-traded futures and options, and over-the-counter derivative products.
Derivatives designated as a hedge of an anticipated or forecasted transaction are accounted for either as cash fl ow or fair value hedges, and managed within the Company’s hedge accounting portfolio.
The Company applies the “normal purchase” classifi cation in Canadian GAAP to certain contracts that are entered into for the purpose of procuring commodities to be used in production.
seasonalityThe Company is suffi ciently large and diversifi ed that seasonal factors within each operation and business tend to off set each other and in isolation do not have a material impact on the Company’s consolidated earnings. For example, pork processing margins tend to be higher in the last half of the year when hog prices historically decline, and as a result, earnings from hog production operations tend to be lower. Strong demand for grilled meat products positively aff ects the fresh and processed meats operations in the summer, while back-to-school promotions support increased sales of bakery, sliced meats and lunch items in the fall. Higher demand for turkey and ham products occurs in the spring and fourth quarter holiday seasons.
share capital and dividendsDuring the second quarter of 2009, the Company amended its articles to change its authorized capital by creating an unlimited number of preference shares issuable in one or more series. No preference shares have been issued.
During 2008, the Company repurchased for cancellation 1,023,000 common shares pursuant to a normal course issuer bid at an average purchase price of $11.55. The excess of the purchase cost over the book value of the shares was charged to retained earnings.
As at December 31, 2009, there were 114,774,802 voting common shares issued and outstanding (2008: 107,258,681) and 22,000,000 non-voting common shares issued and outstanding (2008: 22,000,000). The non-voting common shares carry rights identical to those of the voting common shares, except that they have no voting rights other than as specifi ed in the Canada Business Corporations Act. Each non-voting common share is convertible at any time into one voting common share at the option of the holder. Holders of non-voting common shares have a separate class vote on any amendment to the articles of the Company, if the non-voting common shares would be aff ected by such amendment in a manner that is di ff erent from the holders of voting common shares.
In each of the quarters of 2009, the Company declared and paid cash dividends of $0.04 per common share (voting and non-voting). This represents a total dividend of $0.16 per common share (voting and non-voting) and aggregate dividend payments of $20.9 million (2008: $20.8 million).
MLF_Financials_ENG.indd 21 16/03/10 8:09 AM
MAPLE LEAF FOODS INC. 19
management’s discussion and analysis
private placementOn December 16, 2008 the Company completed the issuance, on a private placement basis, of 7,368,421 units at a price of $9.50 per unit for aggregate gross proceeds of $70 million. Each unit consisted of one subscription receipt for common shares and 0.4 common share purchase warrant. Each subscription receipt entitled the holder to receive one common share of the Company on August 4, 2009 or, at the election of the Company, the return in cash of $9.50 per subscription receipt. Each whole common share purchase warrant is exercisable into one common share of the Company until December 16, 2010 at a price of $9.50 per common share. The net proceeds after issuance costs were used for general corporate purposes.
On August 4, 2009, the Company issued 7,368,421 common shares in satisfaction of the subscription receipts that were issued on December 16, 2008. This decision, made by an independent committee of the board of directors, refl ected the Company’s approach to ensuring that it maintains an appropriate mix of equity and debt in its capital structure and that these levels are maintained over time.
environmentMaple Leaf is committed to maintaining high standards of environmental responsibility and positive relationships in the communities where it operates. Each of its businesses operates within the framework of an environmental policy entitled “Our Environmental Commitment” that is approved by the Board of Directors’ Environment, Health and Safety Committee. The Company’s environmental program is monitored on a regular basis by the Committee, including compliance with regulatory requirements, the use of internal environmental specialists and independent, external environmental experts. In 2009, the Company completed deployment of its Environmental Excellence program at more than 85% of its manufacturing facilities. This program establishes a standard environmental management system across the Company’s various business interests. The Company continues to invest in environmental infrastructure related to water, waste and air emissions to ensure that environmental standards continue to be met or exceeded, while implementing procedures to reduce the impact of operations on the environment. Expenditures related to current environmental requirements are not expected to have a material effect on the financial position or earnings of the Company. However, there can be no assurance that certain events will not occur that will cause expenditures related to the environment to be significant and have a material adverse effect on the Company’s financial condition or results of operations. Such events could include, but not be limited to additional environmental regulation or the occurrence of an adverse event at one of the Company’s locations.
As a large food company, there are health, environmental and social issues that go beyond short-term profitability that Management believes must shape its business if the Company is to realize a sustainable future. On the environmental front, the Company is undertaking multiple initiatives in conjunction with key customers to reduce packaging, track greenhouse gas emissions and the mileage it takes to produce and deliver food products. Increasingly sound environmental practices are becoming a key component of maintaining a competitive advantage. In 2009, the Company completed a comprehensive planning process to establish its environmental sustainability priorities and develop longer-term environmental objectives. While this process was briefly delayed due to product recall activities, priorities such as greenhouse gas and energy management, water conservation, waste reduction, packaging and supply chain environmental sustainability were established.
MLF_Financials_ENG.indd 22 16/03/10 8:09 AM
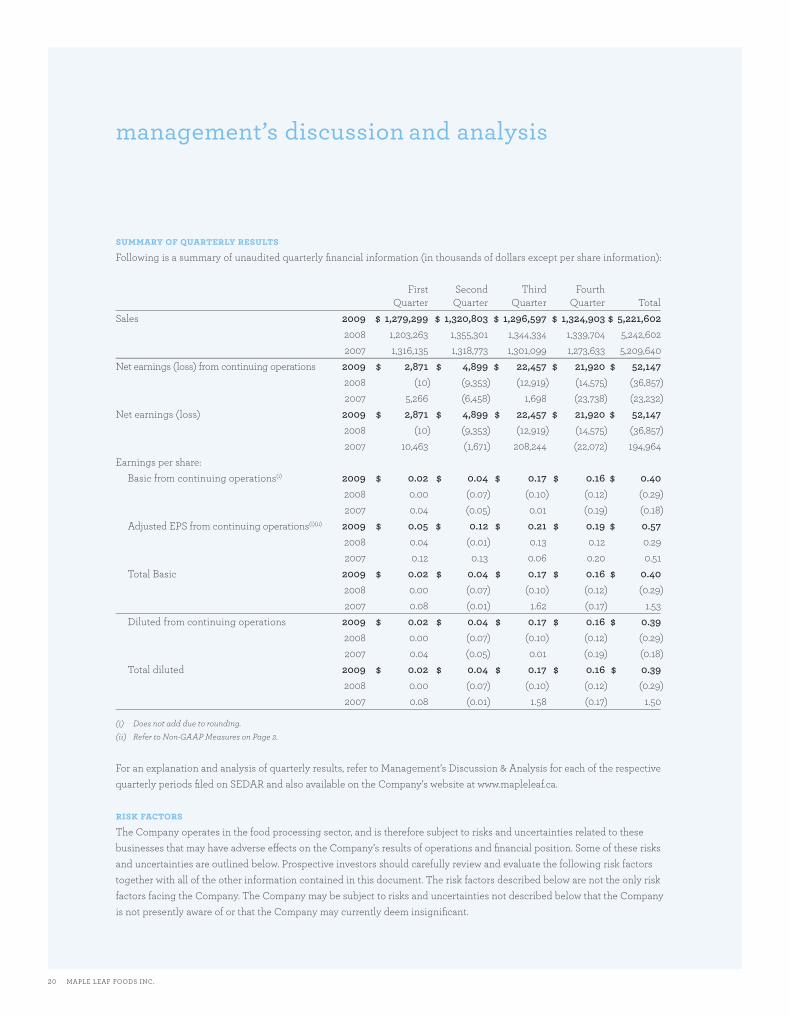
20 MAPLE LEAF FOODS INC.
management’s discussion and analysis
summary of quarterly resultsFollowing is a summary of unaudited quarterly fi nancial information (in thousands of dollars except per share information):
First Second Third Fourth Quarter Quarter Quarter Quarter TotalSales 2009 $ 1,279,299 $ 1,320,803 $ 1,296,597 $ 1,324,903 $ 5,221,602 2008 1,203,263 1,355,301 1,344,334 1,339,704 5,242,602 2007 1,316,135 1,318,773 1,301,099 1,273,633 5,209,640Net earnings (loss) from continuing operations 2009 $ 2,871 $ 4,899 $ 22,457 $ 21,920 $ 52,147 2008 (10) (9,353) (12,919) (14,575) (36,857) 2007 5,266 (6,458) 1,698 (23,738) (23,232)Net earnings (loss) 2009 $ 2,871 $ 4,899 $ 22,457 $ 21,920 $ 52,147 2008 (10) (9,353) (12,919) (14,575) (36,857) 2007 10,463 (1,671) 208,244 (22,072) 194,964Earnings per share: Basic from continuing operations(i) 2009 $ 0.02 $ 0.04 $ 0.17 $ 0.16 $ 0.40 2008 0.00 (0.07) (0.10) (0.12) (0.29) 2007 0.04 (0.05) 0.01 (0.19) (0.18) Adjusted EPS from continuing operations(i)(ii) 2009 $ 0.05 $ 0.12 $ 0.21 $ 0.19 $ 0.57 2008 0.04 (0.01) 0.13 0.12 0.29 2007 0.12 0.13 0.06 0.20 0.51 Total Basic 2009 $ 0.02 $ 0.04 $ 0.17 $ 0.16 $ 0.40 2008 0.00 (0.07) (0.10) (0.12) (0.29) 2007 0.08 (0.01) 1.62 (0.17) 1.53 Diluted from continuing operations 2009 $ 0.02 $ 0.04 $ 0.17 $ 0.16 $ 0.39 2008 0.00 (0.07) (0.10) (0.12) (0.29) 2007 0.04 (0.05) 0.01 (0.19) (0.18) Total diluted 2009 $ 0.02 $ 0.04 $ 0.17 $ 0.16 $ 0.39 2008 0.00 (0.07) (0.10) (0.12) (0.29) 2007 0.08 (0.01) 1.58 (0.17) 1.50
(i) Does not add due to rounding.(ii) Refer to Non-GAAP Measures on Page 2.
For an explanation and analysis of quarterly results, refer to Management’s Discussion & Analysis for each of the respective quarterly periods fi led on SEDAR and also available on the Company’s website at www.mapleleaf.ca.
risk factorsThe Company operates in the food processing sector, and is therefore subject to risks and uncertainties related to these businesses that may have adverse eff ects on the Company’s results of operations and fi nancial position. Some of these risks and uncertainties are outlined below. Prospective investors should carefully review and evaluate the following risk factors together with all of the other information contained in this document. The risk factors described below are not the only risk factors facing the Company. The Company may be subject to risks and uncertainties not described below that the Company is not presently aware of or that the Company may currently deem insignifi cant.
MLF_Financials_ENG.indd 23 16/03/10 8:09 AM
MAPLE LEAF FOODS INC. 21
management’s discussion and analysis
Protein Business Strategic Transformation The transformation of the Company’s protein operations that commenced in 2006 is substantially complete. The remaining initiatives are the sales of the Burlington, Ontario and Lethbridge, Alberta primary pork processing facilities. While the Company started the process of divesting the Burlington pork processing plant in 2008, the process was suspended in April 2009 due to the economic conditions and deteriorating credit markets. In 2010 the process for the divestiture of the Burlington and Lethbridge pork processing plants may restart. While the Company has invested considerable eff ort in developing and executing these remaining elements of the strategy, there can be no guarantee that the Company will be successful or that its business will not be disrupted. If the strategy is unsuccessful or implemented or executed incorrectly or if the benefi ts of the transformation are not fully achieved, it could have a material adverse eff ect on the Company’s fi nancial condition and results of operations.
Systems Conversion and StandardizationThe Company regularly implements process improvement initiatives to simplify and harmonize its systems and processes to optimize performance. The Company is currently undertaking an initiative to replace its information systems with SAP, an integrated ERP system. The Company has dedicated considerable resources to the implementation of SAP and carefully designed an implementation plan to reduce operational disruptions. However, there can be no guarantee that the implementation will not disrupt the Company’s operations, or be completed within the identifi ed period of time and budget. In addition, there cannot be any guarantee that the implementation will improve current processes or operating results. Any of these failures could have a material adverse impact on the Company’s fi nancial condition and results of operations.
Food Safety and Consumer Health The Company is subject to risks that aff ect the food industry in general, including risks posed by food spoilage, accidental contamination, product tampering, consumer product liability, and the potential costs and disruptions of a product recall. The Company’s products are susceptible to contamination by disease producing organisms, or pathogens. Because these pathogens are generally found in the environment, there is a risk that they, as a result of food processing, could be present in the Company’s products. The Company actively manages these risks by maintaining strict and rigorous controls and processes in its manufacturing facilities and distribution systems and by maintaining prudent levels of insurance. However, the Company cannot assure that such systems, even when working eff ectively, will eliminate the risks related to food safety. The Company could be required to recall certain of its products in the event of contamination, adverse test results or as precautionary measures. Any product contamination could subject the Company to product liability claims, adverse publicity and government scrutiny, investigation or intervention, resulting in increased costs and decreased sales. Any of these events could have a material adverse impact on the Company’s operations and fi nancial results.
Leverage and Availability of Capital The Company’s ability to raise fi nancing has historically depended on its ability to access the debt capital and bank credit markets. The worldwide fi nancial crisis that unfolded in 2008 has, in general, restricted access to the credit markets. As a result, the Company’s ability to refi nance credit facilities that mature in 2010, and the ability to secure additional short or long-term fi nancing on terms acceptable to the Company, could negatively aff ect the Company’s liquidity. In addition, a downgrade in the Company’s credit quality would likely increase the Company’s borrowing costs for both short-term and long-term debt, which could have a material adverse impact on the Company’s operations and fi nancial results.
Business Acquisitions and Capital Expansion ProjectsWhile the Company’s focus has shifted from acquisitions to integration of existing operations and supply chain optimization, the Company may continue to review opportunities for strategic growth through acquisitions in the future. These acquisitions may involve large transactions or realignment of existing investments, and present fi nancial, managerial and operational
MLF_Financials_ENG.indd 24 16/03/10 8:09 AM
22 MAPLE LEAF FOODS INC.
management’s discussion and analysis
challenges, which if not successfully overcome may reduce the Company’s profi tability. These risks include the diversion of management attention from existing core businesses, diffi culties integrating or separating personnel and fi nancial and other systems, adverse eff ects on existing business relationships with suppliers and customers, inaccurate estimates of fair value made in the accounting for acquisitions and amortization of acquired intangible assets which would reduce future reported earnings, potential loss of customers or key employees of acquired businesses, and indemnities and potential disputes with the buyers or sellers. Any of these activities could materially aff ect the Company’s product sales, fi nancial condition and results of operations.
In January 2010, the Company announced its intent to construct a new scale fresh bakery plant and close three older plants in Ontario. The start up of new plants presents a number of risks including: errors in the assessment of labour rates and other operating costs, cost overruns in construction, delays in completion of the project, disruptions to service levels during the construction period, loss of reputation with customers and adverse impacts on the quality of the Company’s products. The closure of existing plants carries risks such as inaccurate assessments of the costs of decommissioning, disruptions in service during closure and errors in the estimates of residual value of the assets. Altogether, these risks could result in a material impact to the Company’s sales, fi nancial condition and results of operations.
Pension Plan Assets and Liabilities In the normal course of business, the Company provides post-retirement pension benefi ts to its employees under both defi ned contribution and defi ned benefi t pension plan arrangements. The funded status of the plans signifi cantly aff ects the net periodic benefi t costs of the Company’s pension plans and the ongoing funding requirements of those plans. Among other factors, changes in interest rates, mortality rates, early retirement rates, investment returns and the market value of plan assets can aff ect the level of plan funding, cause volatility in the net periodic pension cost and increase the Company’s future funding requirements. Furthermore, the Company has merged and is in the process of merging a number of its defi ned benefi t pension plans. The funding status of the individual plans depends in part on whether the mergers are approved. Failure by the regulators to approve the mergers could also result in an increase to the Company’s funding requirements. Any increase in pension expense or funding requirements could have a material adverse impact on the Company’s fi nancial condition and results of operations.
Hog and Pork Market Cyclicality The Company’s results of operations and fi nancial condition are partially dependent upon the cost and supply of hogs and the selling prices for fresh meat products, both of which are infl uenced by constantly changing market forces of supply and demand over which the Company has little or no control. These prices for the most part are denominated in or related to U.S. dollars which add further variability due to fl uctuations in exchange rates. The North American primary pork processing markets are highly competitive, with major and regional companies competing in each market. The market prices for pork products regularly experience periods of supply and demand imbalance, and are sensitive to changes in industry processing capacity. Other factors that can infl uence the supply and market price of live hogs include fl uctuations in the size of herds maintained by North American hog suppliers, environmental and conservation regulations, economic conditions, the relative cost of feed for hogs, weather and livestock diseases.
There can be no assurance that all or part of increased costs experienced by the Company from time to time can be passed along to consumers of the Company’s products directly or in a timely manner. As a result, there is no assurance that the occurrence of these events will not have a material adverse eff ect on the Company’s fi nancial condition and results of operations.
Livestock The Company’s operations and the demand for the Company’s products can be signifi cantly aff ected by outbreaks of disease among livestock, or attributed to livestock whether it occurs within the Company’s production operations or outside.
MLF_Financials_ENG.indd 25 16/03/10 8:09 AM
MAPLE LEAF FOODS INC. 23
management’s discussion and analysis
The Company monitors herd health status and has strict bio-security procedures and employee training programs throughout its hog production system. However, there is no guarantee these processes will not fail. In addition, not all livestock procured by the Company may be subject to these processes, as the majority of hog and poultry livestock processed by the Company is purchased from independent third parties. In addition to risks associated with maintaining the health of the Company’s livestock, any outbreak of disease elsewhere in the world, could reduce consumer confi dence in the meat products aff ected by the particular disease and generate adverse publicity. Accordingly, there can be no assurance that an outbreak of animal disease in Canada will not have a material adverse eff ect on the Company’s fi nancial condition and results of operations.
Maple Leaf has developed a comprehensive internal contingency plan for dealing with animal disease occurrences or a more broad-based pandemic and has taken steps to support the Canadian government in enhancing both the country’s prevention measures and preparedness plans. There can be no assurance, however, that these prevention measures or plans will be successful in minimizing or containing the impact of an outbreak of animal disease and that such outbreak will not have a material adverse eff ect on the Company’s fi nancial condition and results of operations.
Foreign Currencies A signifi cant amount of the Company’s revenues and costs are either denominated in or directly linked to other currencies (primarily U.S. dollars and Japanese yen). In periods when the Canadian dollar has appreciated both rapidly and materially against these foreign currencies, revenues linked to U.S. dollars or Japanese yen are immediately reduced while the Company’s ability to change prices or realize natural hedges may lag the immediate currency change. The eff ect of such sudden changes in exchange rates can have a signifi cant immediate impact on the Company’s earnings. Due to the diversity of the Company’s operations, normal fl uctuations in other currencies do not generally have a material impact on the Company’s profi tability in the short-term due to either natural hedges and off setting currency exposures (for example, when revenues and costs are both linked to other currencies) or the ability in the near-term to change prices of its products to off set adverse currency movements. However, as the Company competes in international markets, and faces competition in its domestic markets from U.S. competitors, signifi cant changes in the Canadian to U.S. dollar exchange rate can and have had signifi cant eff ects on the Company’s relative competitiveness in its domestic and international markets which can have, and have had, signifi cant eff ects on the Company’s fi nancial condition and results of operations. The conversion of the Company’s United Kingdom operations may also be aff ected in a similar manner, adversely or favourably, by changes in exchange rates between the Canadian dollar and the British pound.
Commodities The Company is a purchaser of certain commodities, such as wheat, feed grains, livestock and energy (fuel, natural gas and electricity), in the course of normal operations. Commodity prices are subject to fl uctuation and such fl uctuations are sometimes severe. The Company may use commodity futures and options for hedging purposes to reduce the eff ect of changing prices in the short-term but such hedges may not be successful in mitigating this commodity price risk. On a longer-term basis, the Company manages the risk of increases in commodities and other input costs by increasing the prices it charges to its customers. Any fl uctuations in commodity prices that the Company is unable to properly hedge or mitigate could have a material adverse eff ect on the Company’s fi nancial condition and results of operations.
International Trade The Company exports signifi cant amounts of its products to customers outside Canada and certain of its inputs are aff ected by global commodity prices. The Company’s international operations are subject to inherent risks, including change in the free fl ow of food products between countries, fl uctuations in currency values, discriminatory fi scal policies, unexpected changes in local regulations and laws and the uncertainty of enforcement of remedies in foreign jurisdictions. In addition,
MLF_Financials_ENG.indd 26 16/03/10 8:09 AM
24 MAPLE LEAF FOODS INC.
management’s discussion and analysis
foreign jurisdictions could impose tariff s, quotas, trade barriers and other similar restrictions on the Company’s international sales and subsidize competing agricultural products. All of these risks could result in increased costs or decreased revenues, either of which could adversely aff ect the Company’s profi tability in a material way.
RegulationThe Company’s operations are subject to extensive regulation by government agencies in the countries in which it operates, including the Canadian Food Inspection Agency and the Ministry of Agriculture in Canada. These agencies regulate the processing, packaging, storage, distribution, advertising and labeling of the Company’s products, including food safety standards. The Company’s manufacturing facilities and products are subject to inspection by federal, provincial and local authorities. The Company strives to maintain material compliance with all laws and regulations and maintains all material permits and licenses relating to its operations. Nevertheless, there can be no assurance that the Company is in compliance with such laws and regulations or that it will be able to comply with such laws and regulations in the future. Failure by the Company to comply with applicable laws and regulations could subject the Company to civil remedies, including fi nes, injunctions, recalls or seizures, as well as potential criminal sanctions, which could have a material adverse eff ect on the Company’s fi nancial condition and results of operations. Various governments throughout the world are considering regulatory proposals relating to genetically modifi ed organisms, drug residues or food ingredients, food safety and market and environmental regulation that, if adopted, may increase the Company’s costs. There can be no assurance that additional regulation will not be enacted. In fact, new regulations and standards were enacted to address the risks associated with certain pathogens in response to the Company’s August 2008 recall of ready-to–eat meat products. If any of these or other proposals or regulations are enacted, the Company could experience a disruption in the supply or distribution of its products, increased operating costs and signifi cant additional cost for capital improvements. The Company may not be unable to pass on the cost increases associated with such increased regulatory burden to its customers without incurring volume loss as a result of higher prices. Any of these events could have a material adverse eff ect on the Company’s fi nancial condition and results of operations.
Legal Matters In the normal course of its operations, the Company becomes involved in various legal actions relating to its commercial relationships, employment matters, and product liabilities. The Company believes that the resolution of these claims will not have a material eff ect on the Company, based in part on the availability of insurance. However, the fi nal outcome with respect to actions outstanding, pending or with respect to future claims cannot be predicted with certainty. Therefore there can be no assurance that their resolution will not have a material adverse eff ect on the Company’s fi nancial condition or results of operations.
Consumer Trends Success of the Company depends in part on the Company’s ability to respond to market trends and produce innovative products that anticipate and respond to the changing tastes and dietary habits of consumers. From time to time, certain products are deemed more healthy or less healthy and this can impact consumer buying patterns. The Company’s failure to anticipate, identify or react to these changes or to innovate could result in declining demand for the Company’s products, which in turn could cause a material adverse eff ect on the Company’s fi nancial condition and results of operations.
Environmental Regulation The Company’s operations are subject to extensive environmental laws and regulations pertaining to the discharge of materials into the environment and the handling and disposition of wastes (including solid and hazardous wastes) or otherwise relating to protection of the environment. Failure to comply could have serious consequences, such as criminal as well as civil penalties, liability for damages, and negative publicity for the Company. No assurances can be given that additional environmental issues relating to presently known matters or identifi ed sites or to other matters or sites will not require additional expenditures, or that requirements applicable to the Company will not be altered in ways that will require
MLF_Financials_ENG.indd 27 16/03/10 8:09 AM
MAPLE LEAF FOODS INC. 25
management’s discussion and analysis
the Company to incur signifi cant additional costs. In addition, certain of the Company’s facilities have been in operation for many years and, over time, the Company and other prior operators of such facilities may have generated and disposed of waste which is or may be considered to be hazardous. Future discovery of previously unknown contamination of property underlying or in the vicinity of the Company’s present or former properties or manufacturing facilities and/or waste disposal sites could require the Company to incur material unforeseen expenses. Occurrences of any such events may have a material adverse eff ect on the Company’s fi nancial condition and results of operations.
Consolidating Customer Environment As the retail grocery and foodservice trades continue to consolidate and customers grow larger, the Company is required to adjust to changes in purchasing practices and changing customer requirements, as failure to do so could result in losing sales volumes and market share. The Company’s net sales and profi tability could also be aff ected by deterioration in the fi nancial condition of, or other adverse developments in the relationship with, one or more of its major customers.
Employment Matters The Company and its subsidiaries have approximately 23,500 full and part-time employees, which include salaried and union employees, many of whom are covered by collective agreements. These employees are located in various jurisdictions around the world, each such jurisdiction having diff ering employment laws and practices and diff ering liabilities for employment violations, which may result in punitive or extraordinary damages. While the Company maintains systems and procedures to comply with the applicable requirements, there is a risk that failures or lapses by individual managers could result in a violation or cause of action that could have a material adverse eff ect on the Company’s fi nancial condition and results of operations. Furthermore, if a collective agreement covering a signifi cant number of employees or involving certain key employees were to expire leading to a work stoppage, there can be no assurance that such work stoppage would not have a material adverse eff ect on the Company’s fi nancial condition and results of operations.
Direct Store Delivery DisruptionsA signifi cant portion of the Company’s fresh bakery products are distributed through direct store delivery systems using independent distributors. Although appropriate contractual arrangements are in place with these distributors, a negative change in the Company’s relations with them, changes in regulations or an adverse ruling by regulatory agencies regarding the Company’s independent distributorship program or claims against the Company for the actions of the independent distributors could materially aff ect the Company’s results of operations and fi nancial condition.
Competitive Industry EnvironmentThe food industry is intensely competitive. Competition is based on product availability, product quality, price, eff ective promotions and the ability to target changing consumer preferences. The Company experiences price pressure from time to time as a result of a competitor’s promotional eff orts. Increased competition could result in reduced sales, margins, profi ts and market share, all of which could have a material adverse aff ect on the Company’s results of operation and fi nancial condition.
critical accounting estimatesThe preparation of the Company’s consolidated fi nancial statements requires Management to make certain estimates and assumptions. The estimates and assumptions are based on the Company’s experience combined with Management’s understanding of facts and circumstances at the time. These estimates may diff er from actual results, and certain estimates are considered critical as they are both important to refl ect the Company’s fi nancial position and results of operations and require a signifi cant or complex judgement on the part of Management. The following is a summary of certain accounting estimates or policies considered to be critical and that require signifi cant or complex judgement by the Management of the Company.
MLF_Financials_ENG.indd 28 16/03/10 8:09 AM
26 MAPLE LEAF FOODS INC.
management’s discussion and analysis
Goodwill and Intangible Assets Valuation Goodwill is tested for impairment annually in the second quarter and otherwise as required if events occur that indicate that it is more likely than not that the carrying value of a reporting unit has been impaired. Impairment of goodwill is tested at the reporting unit level by comparing the reporting unit’s carrying amount to its fair value. The Company determines the fair value of its reporting units for accounting purposes based on a capitalization of earnings approach, corroborated by other techniques such as comparison to market values. The estimates of earnings used in the evaluation of goodwill are consistent with plans and estimates that are presented annually to the board of directors. Indefi nite life intangibles are tested for impairment annually in the fourth quarter and, also as required, if events occur that indicate it is more likely than not the carrying value has been impaired. The fair value of indefi nite life intangibles is determined based on a “royalty savings approach”, that is a discounted cash fl ow method. The estimates of fair value include projected future sales, terminal growth rates, royalty rates and discount rates. The impairment tests for indefi nite life intangible assets and goodwill were performed in 2009 and no impairment was identifi ed.
Reserve for Bad Debts The Company establishes an appropriate provision for uncollectible or doubtful accounts. Estimates of recoverable amounts are based on Management’s best estimate of a customer’s ability to settle its obligations, and actual amounts received may be aff ected by various factors, including industry conditions and changes in individual customer fi nancial condition. To the extent that actual losses on uncollectible accounts diff er from those estimated in the Company’s provision, both accounts receivable and operating earnings will be aff ected.
Provisions for Inventory Management makes estimates as to the future customer demand for our products when establishing the appropriate provisions for inventory. In making these estimates, Management considers product life of inventory, and the profi tability of recent sales of inventory. In many cases, product sold by the Company turns quickly and inventory values are lower, thus reducing the risk of material misstatement in realizable value. However, in the fresh and prepared meats businesses, code dates are very important in the determination of realizable value, and inventory values are signifi cant. Management ensures that systems are in place to highlight and properly value inventory that may be approaching best before code dates. To the extent that actual losses on inventory diff er from those estimated, both inventory and operating earnings will be aff ected.
Trade Merchandise Allowances and Other Trade Discounts The Company provides for estimated payments to customers based on various trade programs and contracts that in many cases include payments that are contingent upon attainment of specifi ed sales volumes. Signifi cant estimates used to determine these liabilities include the projected level of volume sales for the relevant period and the historical promotional expenditure rate compared to contracted rates. As such arrangements are complex and there are a signifi cant number of customers and products aff ected, Management has systems and processes in place to estimate and value provisions incurred to value these contingent obligations. To the extent that payments on trade discounts diff er from estimates of the related liability, both accrued liabilities and operating earnings will be aff ected.
Employee Benefi t Plans The cost of pensions and other retirement benefi ts earned by employees is actuarially determined using the projected benefi t method pro-rated on service and Management’s best estimate of expected plan investment performance, salary escalation, retirement ages of employees and expected heath care costs. Discount rates used in actuarial calculations are
MLF_Financials_ENG.indd 29 16/03/10 8:09 AM
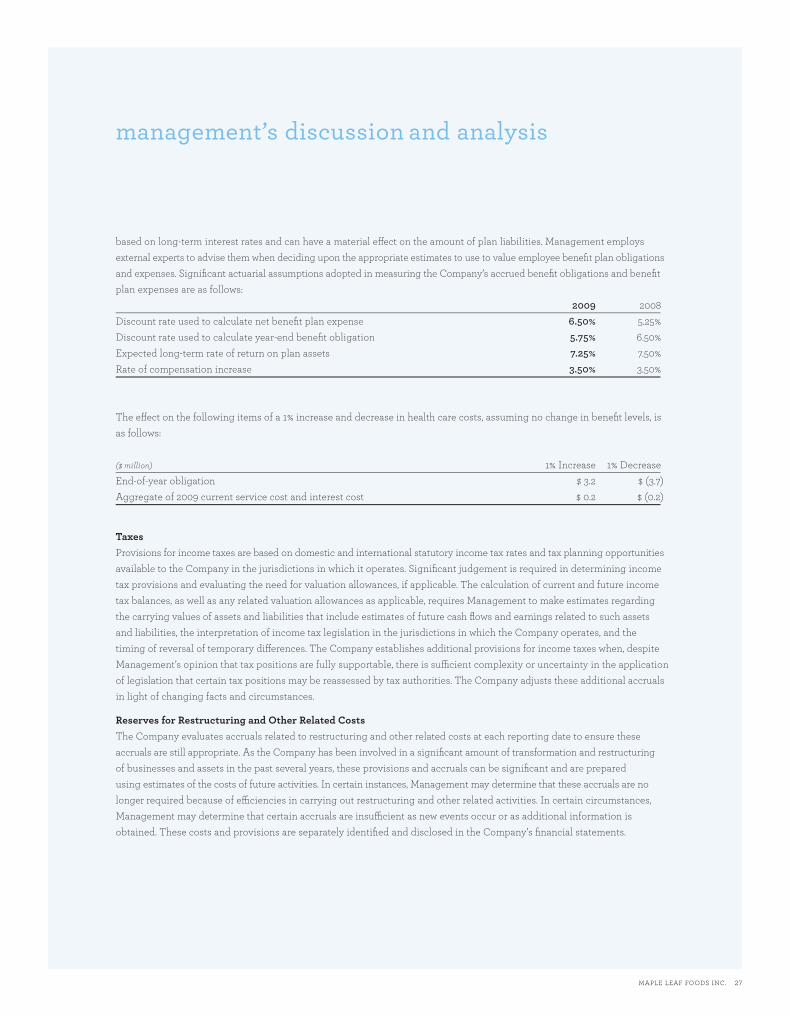
MAPLE LEAF FOODS INC. 27
management’s discussion and analysis
based on long-term interest rates and can have a material eff ect on the amount of plan liabilities. Management employs external experts to advise them when deciding upon the appropriate estimates to use to value employee benefi t plan obligations and expenses. Signifi cant actuarial assumptions adopted in measuring the Company’s accrued benefi t obligations and benefi t plan expenses are as follows: 2009 2008Discount rate used to calculate net benefi t plan expense 6.50% 5.25%Discount rate used to calculate year-end benefi t obligation 5.75% 6.50%Expected long-term rate of return on plan assets 7.25% 7.50%Rate of compensation increase 3.50% 3.50%
The eff ect on the following items of a 1% increase and decrease in health care costs, assuming no change in benefi t levels, is as follows:
($ million) 1% Increase 1% DecreaseEnd-of-year obligation $ 3.2 $ (3.7)Aggregate of 2009 current service cost and interest cost $ 0.2 $ (0.2)
Taxes Provisions for income taxes are based on domestic and international statutory income tax rates and tax planning opportunities available to the Company in the jurisdictions in which it operates. Signifi cant judgement is required in determining income tax provisions and evaluating the need for valuation allowances, if applicable. The calculation of current and future income tax balances, as well as any related valuation allowances as applicable, requires Management to make estimates regarding the carrying values of assets and liabilities that include estimates of future cash fl ows and earnings related to such assets and liabilities, the interpretation of income tax legislation in the jurisdictions in which the Company operates, and the timing of reversal of temporary diff erences. The Company establishes additional provisions for income taxes when, despite Management’s opinion that tax positions are fully supportable, there is suffi cient complexity or uncertainty in the application of legislation that certain tax positions may be reassessed by tax authorities. The Company adjusts these additional accruals in light of changing facts and circumstances.
Reserves for Restructuring and Other Related Costs The Company evaluates accruals related to restructuring and other related costs at each reporting date to ensure these accruals are still appropriate. As the Company has been involved in a signifi cant amount of transformation and restructuring of businesses and assets in the past several years, these provisions and accruals can be signifi cant and are prepared using estimates of the costs of future activities. In certain instances, Management may determine that these accruals are no longer required because of effi ciencies in carrying out restructuring and other related activities. In certain circumstances, Management may determine that certain accruals are insuffi cient as new events occur or as additional information is obtained. These costs and provisions are separately identifi ed and disclosed in the Company’s fi nancial statements.
MLF_Financials_ENG.indd 30 16/03/10 8:09 AM
28 MAPLE LEAF FOODS INC.
management’s discussion and analysis
changes in accounting policiesEff ective January 1, 2009, the Company adopted Emerging Issues Committee Abstract 173, “Credit Risk and the Fair Value of Financial Assets and Financial Liabilities” (“EIC 173”). EIC 173 requires the Company to consider its own credit risk and the credit risk of the counterparty in determining the fair value of fi nancial assets and fi nancial liabilities, including derivative instruments. The adoption of EIC 173, which was adopted on a retrospective basis without restatement of prior periods, did not have a material impact on the Company’s fi nancial statements.
In 2008, the Canadian Institute of Chartered Accountants (“CICA”) issued Handbook Section 3064, “Goodwill and Intangible Assets” (“CICA 3064”). CICA 3064, which replaces Section 3062, “Goodwill and Other Intangible Assets”, and Section 3450, “Research and Development Costs”, establishes standards for the recognition, measurement and disclosure of goodwill and intangible assets. The Company adopted this standard on a retrospective basis on January 1, 2009. The adoption of the new standard did not have a material impact on the Company’s fi nancial statements.
In June 2009, the CICA amended Section 3862, “Financial Instruments – Disclosures”, to include additional disclosure requirements about fair value measurement for fi nancial instruments and liquidity risk disclosures. These amendments require a three-level hierarchy that refl ects the signifi cance of the inputs used in making the fair value measurements. Each level is based on the transparency of the inputs used to measure the fair values of assets and liabilities:
Level 1 – inputs are unadjusted quoted prices of identical instruments in active markets.Level 2 – inputs other than quoted prices included in Level 1 that are observable for the asset or liability, either directly or indirectly.Level 3 – one or more signifi cant inputs used in a valuation technique are unobservable in determining fair values of the instruments.
Determination of fair value and the resulting hierarchy requires the use of observable market data whenever available. The classifi cation of a fi nancial instrument in the hierarchy is based upon the lowest level of input that is signifi cant to the measurement of fair value. The Company has complied with the new disclosure requirements beginning in 2009 and this disclosure is presented in Note 10.
recent accounting pronouncementsIn January 2009, the CICA issued Handbook Section 1582, “Business Combinations” (“CICA 1582”). CICA 1582 requires that all assets and liabilities of an acquired business will be recorded at fair value at acquisition and is consistent with International Financial Reporting Standards (“IFRS”). Obligations for contingent considerations and contingencies will also be recorded at fair value at the acquisition date. The standard also states that acquisition-related costs will be expensed as incurred and that restructuring charges will be expensed in the periods after the acquisition date. The section applies prospectively to business combinations for which the acquisition date is on or after the beginning of the fi rst annual reporting period on or after January 1, 2011 with earlier adoption permitted.
In January 2009, the CICA issued Handbook Section 1601, “Consolidations” (“CICA 1601”), and Section 1602, “Non-controlling Interests” (“CICA 1602”). CICA 1601 establishes standards for the preparation of consolidated fi nancial statements. CICA 1602 establishes standards for accounting for a non-controlling interest in a subsidiary in consolidated fi nancial statements subsequent to a business combination. These standards apply to interim and annual consolidated fi nancial statements relating to fi scal years beginning on or after January 1, 2011 with earlier adoption permitted. The Company is currently assessing the impact of the new standard on its fi nancial statements.
MLF_Financials_ENG.indd 31 16/03/10 8:09 AM
MAPLE LEAF FOODS INC. 29
management’s discussion and analysis
In February 2008, the CICA announced that Canadian public companies will be required to prepare their fi nancial statements in accordance with IFRS for fi scal years beginning on or after January 1, 2011. The Company will issue its fi nancial statements in the fi rst quarter of 2011 in accordance with IFRS, including comparative data for 2010.
disclosure controls and internal controls over fi nancial reporting The Company’s disclosure controls and procedures are designed to provide reasonable assurance that material information relating to the Company, including its consolidated subsidiaries, is made known to Management in a timely manner so that information required to be disclosed by the Company under securities legislation is recorded, processed, summarized and reported within the time periods specifi ed in applicable securities legislation.
The Company’s Management, under the direction and supervision of the Company’s Chief Executive Offi cer and Chief Financial Offi cer, are also responsible for establishing and maintaining internal control over fi nancial reporting. These controls are designed to provide reasonable assurance regarding the reliability of fi nancial reporting and the preparation of fi nancial statements for external purposes in accordance with Canadian GAAP.
The Company’s Chief Executive Offi cer and Chief Financial Offi cer, have evaluated, or caused to be evaluated under their supervision, the eff ectiveness of the Company’s internal control over fi nancial reporting and disclosure controls and procedures as at December 31, 2009 and have concluded that such controls and procedures are eff ective.
international fi nancial reporting standardsFor fi scal years beginning on or after January 1, 2011, Canadian public companies will be required to prepare their fi nancial statements in accordance with IFRS. While IFRS uses a conceptual framework similar to Canadian GAAP, there are signifi cant diff erences in accounting policies that must be evaluated. IFRS will also require more disclosures than Canadian GAAP. The Company will issue its fi nancial statements in the fi rst quarter of 2011 in accordance with IFRS including comparative data for 2010.
In order to meet the requirement of transition to IFRS, in 2008 the Company established an enterprise-wide project team and project plan. The project philosophy is to align with current accounting practices and policies, where possible, to minimize the impact of any changes to the business. Regular reporting of the progress on the IFRS conversion project is provided to senior management and the Audit Committee of the Board of Directors.
The Company’s IFRS conversion project plan is comprised of three main phases: initial diagnostic assessment, design, and implementation. The Company has completed the initial assessment phase of the plan and has identifi ed and documented the key accounting and disclosure diff erences between Canadian GAAP and IFRS. The detailed assessment of the diff erences is substantially complete and the design and development of business process changes to meet the requirements of IFRS has commenced. The Company has reviewed policy alternatives under IFRS, including certain exemptions and elections available on transition under IFRS 1. Outlined below are the IFRS 1 elections the Company expects to make on transition to IFRS.
IFRS 1 Optional ExemptionsBusiness combinations IFRS 1 provides an exemption that allows an entity to elect not to retrospectively restate business combinations prior to the Transition Date (January 1, 2010) in accordance with IFRS 3, Business Combinations. The Company will elect not to retrospectively restate those business combinations that occurred prior to the transition date.
MLF_Financials_ENG.indd 32 16/03/10 8:09 AM
30 MAPLE LEAF FOODS INC.
management’s discussion and analysis
Fair value as deemed cost IFRS 1 allows an entity to elect to measure property, plant and equipment at fair value in the opening IFRS balance sheet. Fair value would then become the deemed cost of the item. Alternatively, an entity can retrospectively apply the historical cost model in International Accounting Standard (“IAS”) 16, “Property, Plant and Equipment”, to arrive at the carrying value of property, plant and equipment on the transition date. The Company expects to retroactively apply the cost model for property, plant and equipment for IFRS purposes on the transition date.
Employee Benefi tsIn accordance with IAS 19, “Employee Benefi ts”, an entity may elect to use a “corridor” approach that leaves some actuarial gains and losses unrecognized. Retrospective application of this approach requires an entity to split the cumulative actuarial gains and losses from the inception of the plan until the date of transition to IFRS into a recognized portion and an unrecognized portion. Alternatively, an entity may elect to recognize all cumulative actuarial gains and losses at the date of transition to IFRS, even if it uses the corridor approach for later actuarial gains and losses, recognized after the transition date. The Company will elect to recognize all cumulative actuarial gains and losses that existed at the transition date in retained earnings for all of the Company’s employee benefi t plans.
Cumulative translation diff erences Retrospective application of IFRS would require the Company to determine cumulative currency translation diff erences in accordance with IAS 21, “The Eff ects of Changes in Foreign Exchange Rates”, from the date a foreign subsidiary or associate was formed or acquired. IFRS 1 allows an entity to elect not to calculate the translation diff erence retrospectively. Where this election is made, the cumulative translation balance for all foreign operations is set to zero at the transition date. The Company will elect not to retrospectively calculate the cumulative translation balances, so all of these balances will be reset to zero on the Transition Date.
Share-based payment transactions IFRS 1 allows an entity to elect to be exempt from retrospectively applying the requirements of IFRS 2, “Share Based Payments” for awards that are vested or settled prior to the transition date. There are several diff erences between IFRS 2 and Canadian GAAP. For example, when a share-based award vests in installments over the vesting period (graded vesting), IFRS 2 requires each installment to be accounted for as a separate arrangement. Canadian GAAP allows an entity to treat the entire award as a pool, determine fair value using the average life of the instruments and then recognize the compensation expense on a straight-line basis over the vesting period. Since the Company recorded share-based payment transactions in this manner, retrospective application of IFRS 2 would require the Company to revalue all of its prior share-based payment transactions. Therefore, the Company will elect to apply this exemption.
Decommissioning liabilities included in the cost of property, plant and equipment IFRS 1 allows an entity to elect not to retrospectively apply the requirements of IFRIC 1, “Changes in Existing Decommissioning, Restoration and Similar Liabilities”. The Company will elect not to retrospectively recognize changes to these liabilities under IFRIC 1 that may have occurred prior to the transition date.
Borrowing costs IAS 23, “Borrowing Costs”, requires an entity to capitalize borrowing costs relating to qualifying assets. Under IFRS 1, an entity may elect to apply the transitional provisions of IAS 23, which allow an entity to choose the date to apply the
MLF_Financials_ENG.indd 33 16/03/10 8:09 AM
MAPLE LEAF FOODS INC. 31
management’s discussion and analysis
capitalization of borrowing costs relating to all qualifying assets as either the transition date (January 1, 2010 for the Company) or an earlier date. The Company will elect to apply the transitional provisions of IAS 23 and will choose the Transition Date as the date to commence the capitalization of borrowing costs to all qualifying assets.
IFRS 1 Mandatory ExemptionsHedge accounting Hedge accounting may only be applied prospectively from the transition date to transactions that meet the hedge accounting criteria in IAS 39, Financial Instruments – Recognition and Measurement, at that date. Hedging relationships cannot be designated retrospectively and the supporting documentation cannot be created retrospectively.
Non-controlling interests An entity must apply the requirements of IAS 27, Consolidated and Separate Financial Statements, which relate to non-controlling interests prospectively from the Transition Date.
Estimates Estimates previously determined under Canadian GAAP cannot be revised due to the application of IFRS except where necessary to refl ect diff erences in accounting policies.
Key Accounting Differences between Canadian GAAP and IFRSChanges in accounting policies upon adoption of IFRS are likely, but at this time the Company cannot quantify the total or net impact that the future adoption of IFRS will have on its consolidated fi nancial statements and operating performance measures. The International Accounting Standards Board has signifi cant ongoing projects that could aff ect the ultimate diff erences between Canadian GAAP and IFRS and the impact on the Company’s consolidated fi nancial statements. Outlined below are the key areas where changes in accounting policy are expected that may aff ect the Company’s consolidated fi nancial statements.
Securitization programs IFRS has diff erent requirements than Canadian GAAP to allow off - balance sheet treatment of accounts receivable securitization programs. Absent restructuring of the agreements, the Company’s current programs may not qualify for off -balance sheet treatment under IFRS.
Biological assets Under Canadian GAAP, the Company’s livestock assets are considered inventory and, in general, are recorded at cost. Under IFRS, livestock is considered a separate asset class called biological assets which must be carried at fair value less costs to sell. This change will result in periodic adjustments to the valuation of the Company’s inventory which will create volatility in earnings. The Company is not able to estimate the periodic impact of this change on future earnings.
Employee benefi ts IAS 19, Employee Benefi ts, requires past service costs of defi ned benefi t pension plans to be expensed on an accelerated basis, with vested past service costs expensed immediately and unvested past service costs recognized on a straight-line basis until the benefi ts become vested. Under Canadian GAAP, past service costs are generally amortized on a straight-line basis over the average remaining service period of employees active at the date of the amendment.
MLF_Financials_ENG.indd 34 16/03/10 8:09 AM
32 MAPLE LEAF FOODS INC.
management’s discussion and analysis
IAS 19 also requires an entity to make an accounting policy choice regarding the recognition of actuarial gains and losses. The three options that are available are as follows: delayed recognition using a “corridor” approach; immediate recognition through the income statement; and, immediate recognition through Other Comprehensive Income. The Company has not yet fi nalized this accounting policy choice.
Borrowing costs IAS 23, Borrowing Costs, requires the capitalization of borrowing costs directly attributable to the acquisition, construction or production of a qualifying asset as part of the cost of that asset. Under Canadian GAAP, the Company’s accounting policy is to expense these borrowing costs as incurred. The impact of this change will be a periodic reduction in interest expense during periods where signifi cant capital projects are under way. The Company is not able to estimate the impact of this change on future fi nancial results.
Business combinations IFRS 3, Business Combinations, does not allow the accrual of restructuring provisions pursuant to an acquisition. On transition to IFRS, any existing restructuring accruals that were the result of an acquisition will be written off through Retained Earnings. There will be no change on transition as a result of the IFRS 1 elections taken by the Company. The Company is not able to estimate the impact of this change on future fi nancial results.
Income Taxes IAS 12, Income Taxes, requires a balance sheet liability approach in assessing future income taxes very similar to CICA HB Section 3465 with some noticeable diff erences. Under IAS 12, deferred tax assets or liabilities are recognized for the diff erences in tax bases on inter-company transfers. Deferred taxes are calculated using the purchaser’s tax rate and any current taxes payable/recoverable of the seller are recognized and not deferred. The Company will likely be aff ected by this diff erence but is unable to quantify the impact at this time.
Impairment of assets Canadian GAAP generally uses a two-step approach to impairment testing, fi rst comparing asset carrying values with undiscounted future cash fl ows to determine whether impairment exists, and then measuring any impairment by comparing asset carrying values with their fair values. IAS 36, Impairment of Assets, uses a one-step approach to determine if impairment exists and for measuring that impairment, by comparing asset carrying values to the higher of fair value less costs to sell and value in use (determined using discounted future cash fl ows). This can potentially result in asset impairments, where the carrying values of assets were previously supported under Canadian GAAP on an undiscounted cash fl ow basis, but would not be supported on a discounted cash fl ow basis. The Company cannot quantify the impact, if any, of this diff erence at this time.
Additionally, for the purposes of asset impairment testing, Canadian GAAP requires assets to be grouped at the lowest level for which identifi able cash fl ows are largely independent of the cash fl ows of other assets and liabilities. IFRS requires that assets be tested for impairment at the level of the cash generating unit, which is the lowest level of assets that generate largely independent cash infl ows. In many cases, this requirement will result in a lower level grouping of assets, which could result in the identifi cation of impairment under IFRS for assets that were not considered impaired under Canadian GAAP. The Company is not able to estimate the impact of this potential change in measurement criteria to its fi nancial results at this time.
MLF_Financials_ENG.indd 35 16/03/10 8:09 AM
MAPLE LEAF FOODS INC. 33
management’s discussion and analysis
forward-looking statementsThis document contains, and the Company’s oral and written public communications often contain, forward-looking statements that are based on current expectations, estimates, forecasts and projections about the industries in which the Company operates and beliefs and assumptions made by the Management of the Company. Such statements include, but are not limited to, statements with respect to expectations regarding the sale of the Company’s facilities in Burlington, Ontario and Lethbridge, Alberta, the timing and costs of the Company’s plans to build a new scale fresh bakery plan in Southwestern Ontario and the closure of three existing older and smaller facilities located in Ontario, the timing and eff ectiveness of the completion of the installation of the new SAP systems software, sources of funds for ongoing business requirements and capital investments, expectations regarding suffi ciency of the allowance for uncollectible accounts, expectations regarding covenant compliance, impact of recently adopted accounting pronouncements and expectations, the decrease in pension expenses, the material reduction in the number of hogs produced and the reduced exposure to the pork commodity and export markets, the Company’s expectations regarding the impact on the Company of the changeover from Canadian GAAP to IFRS, and the Company’s objectives and goals, as well as statements with respect to the Company’s beliefs, plans, objectives, expectations, anticipations, estimates and intentions. Words such as “expect”, “anticipate”, “intend”, “attempt”, “may”, “will”, “plan”, “believe”, “seek”, “estimate”, and variations of such words and similar expressions are intended to identify such forward-looking statements. These statements are not guarantees of future performance and involve assumptions and risks and uncertainties that are diffi cult to predict.
In particular, these forward-looking statements are based on a variety of factors and assumptions including, but not limited to: the condition of the Canadian, British, Japanese and United States economies; the rate of exchange of the Canadian dollar to the U.S. dollar, British pound and the Japanese yen; expected recovery of sales following the product recall; the availability and prices of raw materials, energy and supplies; product pricing; the availability of insurance; the competitive environment and related market conditions; improvement of operating effi ciencies whether as a result of the protein business transformation or otherwise; continued access to capital; the cost of compliance with environmental and health standards; no adverse results from ongoing litigation; no unexpected actions of domestic and foreign governments; and the general assumption that none of the risks identifi ed below or elsewhere in this document will materialize. These assumptions have been derived from information currently available to the Company including information obtained by the Company from third-party sources. These assumptions may prove to be incorrect in whole or in part. In addition, actual results may diff er materially from those expressed, implied or forecasted in such forward-looking statements, which refl ect the Company’s expectations only as of the date hereof.
Factors that could cause actual results or outcomes to diff er materially from the results expressed or implied by forward-looking statements include, among other things: • the risks associated with implementing and executing the protein business transformation;• the risks associated with changes in the Company’s shared systems and processes;• the risks posed by food contamination, consumer liability and product recalls; • the risks associated with the Company’s outstanding indebtedness; • the impact on pension expense and funding requirements of fl uctuations in the market prices of fi xed income and equity
securities and changes in interest rates;• the risks associated with acquisitions and capital expansion projects;
MLF_Financials_ENG.indd 36 16/03/10 8:09 AM
34 MAPLE LEAF FOODS INC.
management’s discussion and analysis
• the cyclical nature of the cost and supply of hogs and the competitive nature of the pork market generally; • the risks related to the health status of livestock; • the impact of a pandemic on the Company’s operations;• the Company’s exposure to currency exchange risks; • the ability of the Company to hedge against the eff ect of commodity price changes through the
use of commodity futures and options;• the impact of international events on commodity prices and the free fl ow of goods; • the risks associated with a consolidating retail environment; • the risks posed by compliance with extensive government regulation; • the risks posed by litigation;• the impact of changes in consumer tastes and buying patterns;• the impact of extensive environmental regulation and potential environmental liabilities; • the risks associated with complying with diff ering employment laws and practices globally and the
potential for work stoppages due to non-renewal of collective agreements;• the risks associated with the Company’s independent distributors; and • the risks posed by competition.
The Company cautions the reader that the foregoing list of factors is not exhaustive. These factors are discussed in more detail under the heading “Risk Factors” presented previously in this document. The reader should review such section in detail. The Company does not intend, and the Company disclaims any obligation to update any forward-looking statements, whether written or oral, or whether as a result of new information, future events or otherwise except as required by law. Additional information concerning the Company, including the Company’s Annual Information Form, is available on SEDAR at www.sedar.com
MLF_Financials_ENG.indd 37 16/03/10 8:09 AM
MAPLE LEAF FOODS INC. 35
management’s statement of responsibility
auditors’ report to the shareholders
We have audited the consolidated balance sheets of Maple Leaf Foods Inc. as at December 31, 2009 and 2008 and the consolidated statements of earnings, comprehensive income (loss), retained earnings and cash fl ows for the years then ended. These fi nancial statements are the responsibility of the Company’s management. Our responsibility is to express an opinion on these fi nancial statements based on our audits.
We conducted our audits in accordance with Canadian generally accepted auditing standards. Those standards require that we plan and perform an audit to obtain reasonable assurance whether the fi nancial statements are free of material misstatement. An audit includes examining, on a test basis, evidence supporting the amounts and disclosures in the fi nancial statements. An audit also includes assessing the accounting principles used and
signifi cant estimates made by management, as well as evaluating the overall fi nancial statement presentation.
In our opinion, these consolidated fi nancial statements present fairly, in all material respects, the fi nancial position of the Company as at December 31, 2009 and 2008 and the results of its operations and its cash fl ows for the years then ended in accordance with Canadian generally accepted accounting principles.
Chartered Accountants, Licensed Public AccountantsToronto, CanadaFebruary 23, 2010
Management recognizes its responsibility for conducting the Company’s aff airs in the best interests of all its shareholders. The Consolidated Financial Statements and related information in the annual report are the responsibility of Management. The Consolidated Financial Statements have been prepared in accordance with Canadian generall accepted accounting principles, which involve the use of judgement and estimates in applying the accounting principles selected. Other fi nancial information in the annual report is consistent with that in the Consolidated Financial Statements.
The Company maintains systems of internal controls, which are designed to provide reasonable assurance that accounting records are reliable, and to safeguard the Company’s assets. The Company’s independent auditors, KPMG llp, Chartered Accountants, have audited and reported on the Company’s Consolidated Financial Statements. Their opinion is based upon audits conducted by them in accordance with Canadian generally accepted auditing standards to obtain reasonable assurance that the Consolidated
Financial Statements are free of material misstatement.
The Audit Committee of the Board of Directors, all of whom are independent of the Company or any of its affi liates, meets periodically with the independent external auditors, the internal auditors and management representatives to review the internal accounting controls, the consolidated quarterly and annual fi nancial statements and other fi nancial reporting matters. Both the internal and independent external auditors have unrestricted access to the Audit Committee. The Audit Committee reports its fi ndings and makes recommendations to the Board of Directors.
February 23, 2010
m. h. mccain m. h. velsPresident and Executive Vice-President andChief Executive Offi cer Chief Financial Offi cer
cain m. h. velscain m. h. vels
MLF_Financials_ENG.indd 38 16/03/10 8:09 AM
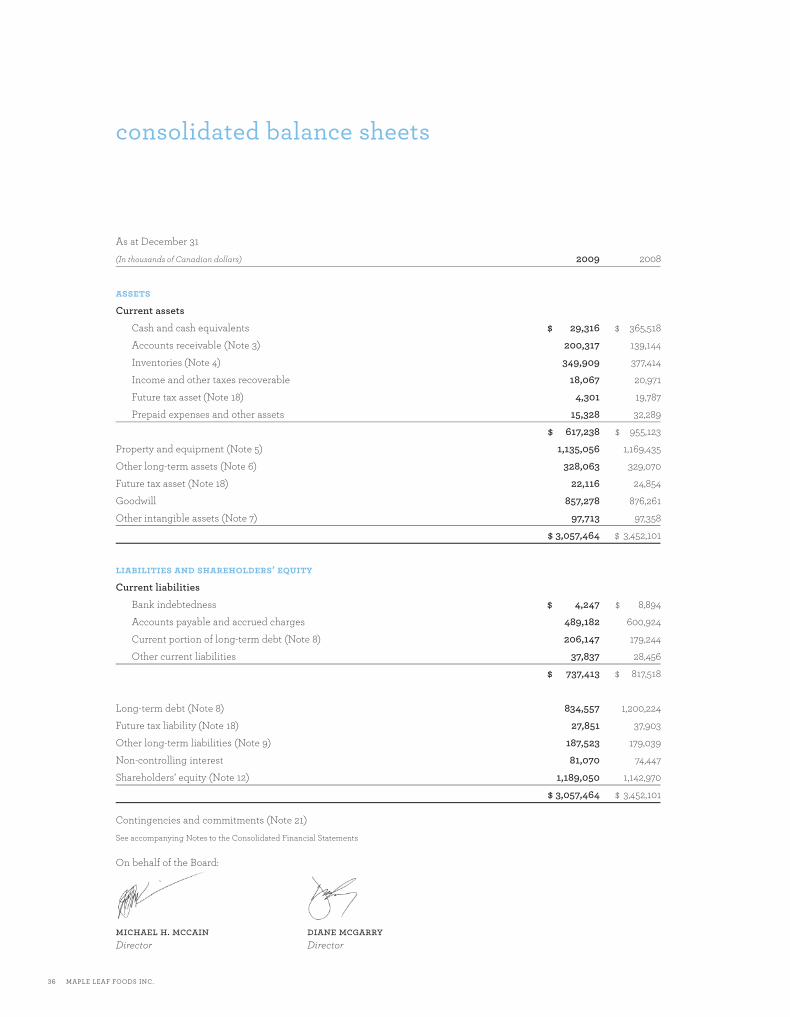
36 MAPLE LEAF FOODS INC.
consolidated balance sheets
As at December 31
(In thousands of Canadian dollars) 2009 2008
assets
Current assetsCash and cash equivalents $ 29,316 $ 365,518
Accounts receivable (Note 3) 200,317 139,144
Inventories (Note 4) 349,909 377,414
Income and other taxes recoverable 18,067 20,971
Future tax asset (Note 18) 4,301 19,787
Prepaid expenses and other assets 15,328 32,289
$ 617,238 $ 955,123
Property and equipment (Note 5) 1,135,056 1,169,435
Other long-term assets (Note 6) 328,063 329,070
Future tax asset (Note 18) 22,116 24,854
Goodwill 857,278 876,261
Other intangible assets (Note 7) 97,713 97,358
$ 3,057,464 $ 3,452,101
liabilities and shareholders’ equity
Current liabilitiesBank indebtedness $ 4,247 $ 8,894
Accounts payable and accrued charges 489,182 600,924
Current portion of long-term debt (Note 8) 206,147 179,244
Other current liabilities 37,837 28,456
$ 737,413 $ 817,518
Long-term debt (Note 8) 834,557 1,200,224
Future tax liability (Note 18) 27,851 37,903
Other long-term liabilities (Note 9) 187,523 179,039
Non-controlling interest 81,070 74,447
Shareholders’ equity (Note 12) 1,189,050 1,142,970
$ 3,057,464 $ 3,452,101
Contingencies and commitments (Note 21)
See accompanying Notes to the Consolidated Financial Statements
On behalf of the Board:
michael h. mccain diane mcgarryDirector Director
MLF_Financials_ENG.indd 39 16/03/10 8:09 AM
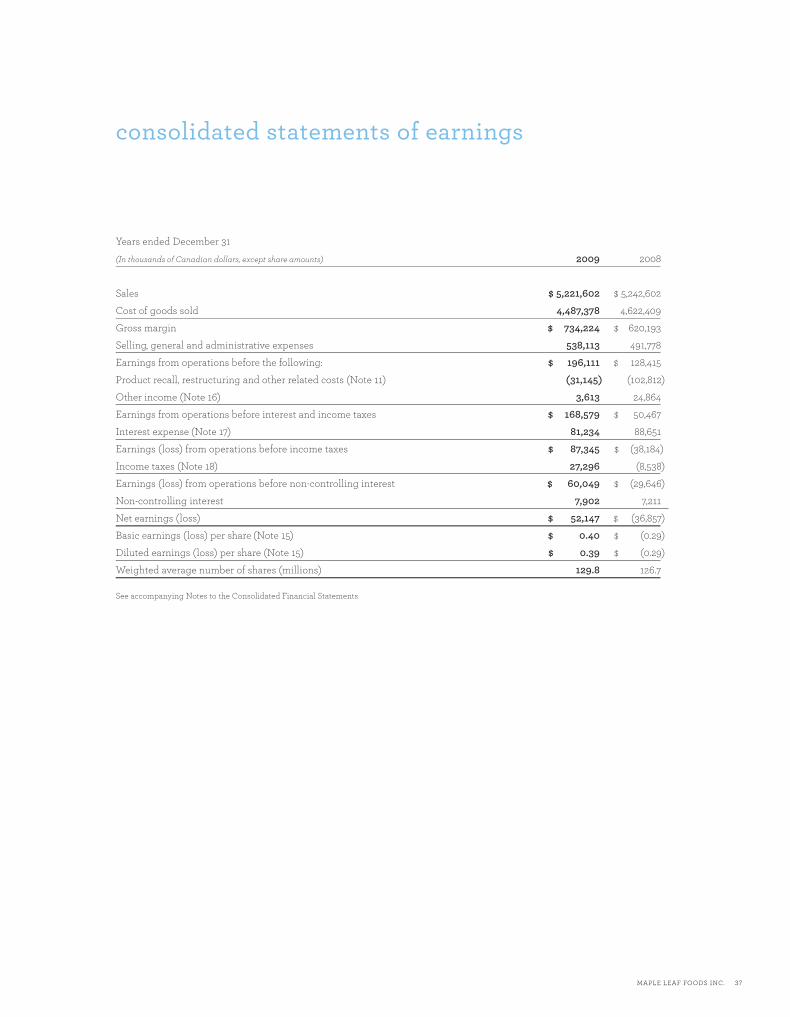
MAPLE LEAF FOODS INC. 37
consolidated statements of earnings
Years ended December 31
(In thousands of Canadian dollars, except share amounts) 2009 2008
Sales $ 5,221,602 $ 5,242,602
Cost of goods sold 4,487,378 4,622,409
Gross margin $ 734,224 $ 620,193
Selling, general and administrative expenses 538,113 491,778
Earnings from operations before the following: $ 196,111 $ 128,415
Product recall, restructuring and other related costs (Note 11) (31,145) (102,812)
Other income (Note 16) 3,613 24,864
Earnings from operations before interest and income taxes $ 168,579 $ 50,467
Interest expense (Note 17) 81,234 88,651
Earnings (loss) from operations before income taxes $ 87,345 $ (38,184)
Income taxes (Note 18) 27,296 (8,538)
Earnings (loss) from operations before non-controlling interest $ 60,049 $ (29,646)
Non-controlling interest 7,902 7,211
Net earnings (loss) $ 52,147 $ (36,857)
Basic earnings (loss) per share (Note 15) $ 0.40 $ (0.29)
Diluted earnings (loss) per share (Note 15) $ 0.39 $ (0.29)
Weighted average number of shares (millions) 129.8 126.7
See accompanying Notes to the Consolidated Financial Statements
MLF_Financials_ENG.indd 40 16/03/10 8:09 AM
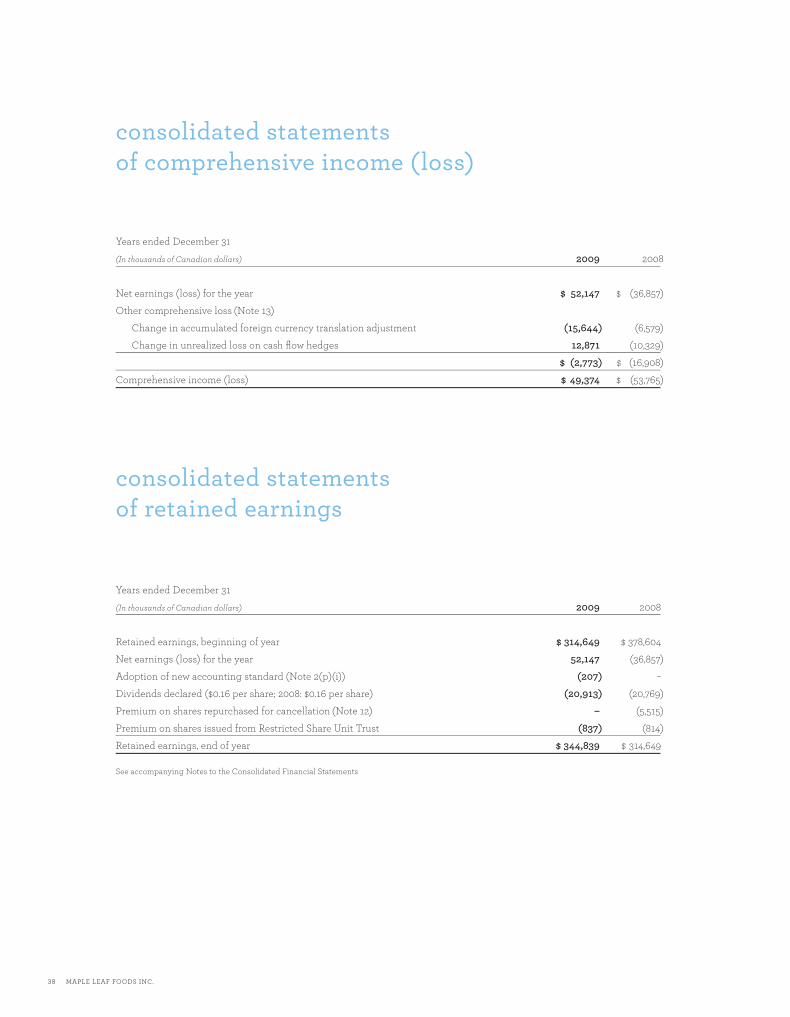
38 MAPLE LEAF FOODS INC.
consolidated statements of comprehensive income (loss)
consolidated statements of retained earnings
Years ended December 31
(In thousands of Canadian dollars) 2009 2008
Net earnings (loss) for the year $ 52,147 $ (36,857)
Other comprehensive loss (Note 13)
Change in accumulated foreign currency translation adjustment (15,644) (6,579)
Change in unrealized loss on cash fl ow hedges 12,871 (10,329)
$ (2,773) $ (16,908)
Comprehensive income (loss) $ 49,374 $ (53,765)
Years ended December 31
(In thousands of Canadian dollars) 2009 2008
Retained earnings, beginning of year $ 314,649 $ 378,604
Net earnings (loss) for the year 52,147 (36,857)
Adoption of new accounting standard (Note 2(p)(i)) (207) –
Dividends declared ($0.16 per share; 2008: $0.16 per share) (20,913) (20,769)
Premium on shares repurchased for cancellation (Note 12) – (5,515)
Premium on shares issued from Restricted Share Unit Trust (837) (814)
Retained earnings, end of year $ 344,839 $ 314,649
See accompanying Notes to the Consolidated Financial Statements
MLF_Financials_ENG.indd 41 16/03/10 8:09 AM
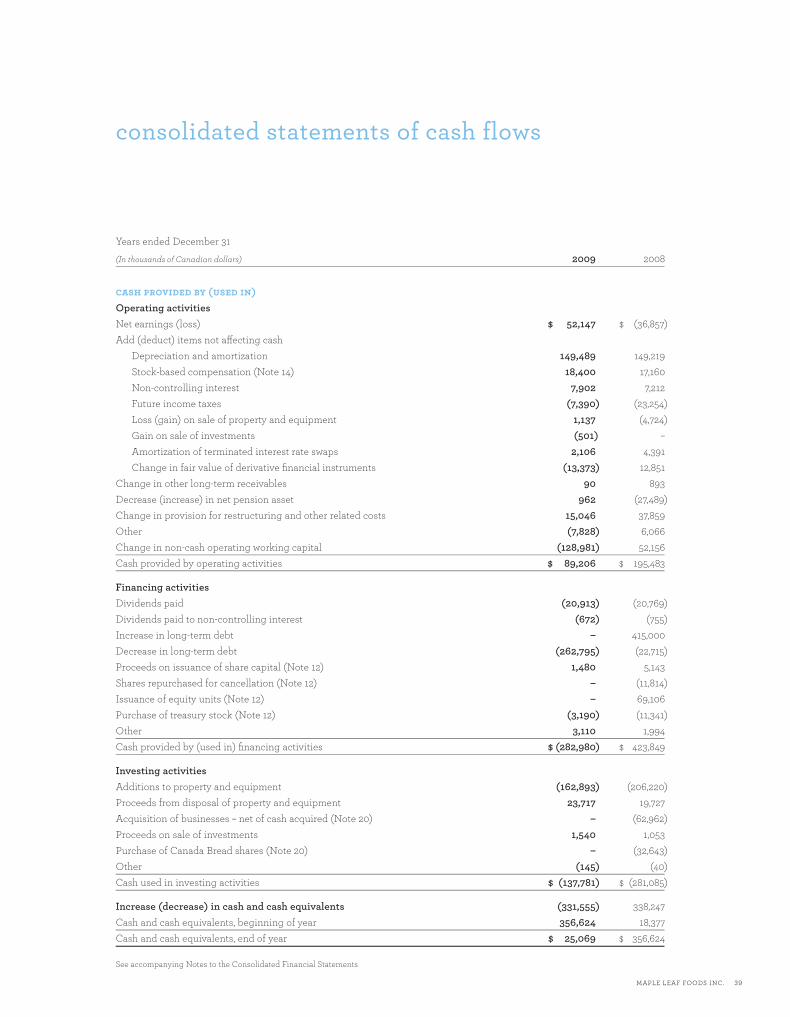
MAPLE LEAF FOODS INC. 39
consolidated statements of cash flows
Years ended December 31
(In thousands of Canadian dollars) 2009 2008
cash provided by (used in)Operating activitiesNet earnings (loss) $ 52,147 $ (36,857)Add (deduct) items not aff ecting cash
Depreciation and amortization 149,489 149,219Stock-based compensation (Note 14) 18,400 17,160Non-controlling interest 7,902 7,212Future income taxes (7,390) (23,254)Loss (gain) on sale of property and equipment 1,137 (4,724)Gain on sale of investments (501) –Amortization of terminated interest rate swaps 2,106 4,391Change in fair value of derivative fi nancial instruments (13,373) 12,851
Change in other long-term receivables 90 893Decrease (increase) in net pension asset 962 (27,489)Change in provision for restructuring and other related costs 15,046 37,859Other (7,828) 6,066Change in non-cash operating working capital (128,981) 52,156Cash provided by operating activities $ 89,206 $ 195,483
Financing activitiesDividends paid (20,913) (20,769)Dividends paid to non-controlling interest (672) (755)Increase in long-term debt – 415,000Decrease in long-term debt (262,795) (22,715)Proceeds on issuance of share capital (Note 12) 1,480 5,143Shares repurchased for cancellation (Note 12) – (11,814)Issuance of equity units (Note 12) – 69,106Purchase of treasury stock (Note 12) (3,190) (11,341)Other 3,110 1,994Cash provided by (used in) fi nancing activities $ (282,980) $ 423,849
Investing activitiesAdditions to property and equipment (162,893) (206,220)Proceeds from disposal of property and equipment 23,717 19,727Acquisition of businesses – net of cash acquired (Note 20) – (62,962)Proceeds on sale of investments 1,540 1,053Purchase of Canada Bread shares (Note 20) – (32,643)Other (145) (40)Cash used in investing activities $ (137,781) $ (281,085)
Increase (decrease) in cash and cash equivalents (331,555) 338,247Cash and cash equivalents, beginning of year 356,624 18,377Cash and cash equivalents, end of year $ 25,069 $ 356,624
See accompanying Notes to the Consolidated Financial Statements
MLF_Financials_ENG.indd 42 16/03/10 8:09 AM
40 MAPLE LEAF FOODS INC.
notes to the consolidated financial statements(Tabular amounts in thousands of Canadian dollars, except share amounts)
Years ended December 31, 2009 and 2008
1. the company
Maple Leaf Foods Inc. (“Maple Leaf Foods” or the “Company”) is a leading Canadian-based value-added meat, meals and bakery
company, serving wholesale, retail and foodservice customers across North America and internationally. The Company’s
results are organized into three segments: Meat Products Group, Agribusiness Group and Bakery Products Group.
2. signifi cant accounting policies
The following are the signifi cant accounting policies of the Company, which are in accordance with Canadian Generally
Accepted Accounting Principles (“GAAP”).
(a) Principles of consolidation
The consolidated fi nancial statements include the accounts of the Company and its subsidiaries. Investments in associated
companies over which the Company exercises signifi cant infl uence, are accounted for by the equity method. Variable Interest
Entities (“VIEs”), as defi ned by Accounting Guideline 15 – “Consolidation of Variable Interest Entities” are consolidated by the
Company when it is determined that the Company will, as the primary benefi ciary, absorb the majority of the VIEs’ expected
losses and/or expected residual returns. Investments in equity securities of entities over which the Company does not exert
signifi cant infl uence are accounted for at cost or at fair value depending on whether such investments are publicly traded.
(b) Use of estimates
The preparation of periodic fi nancial statements necessarily involves the use of estimates. Estimates are used when
accounting for items and matters such as allowances for uncollectible accounts, sales of receivables, inventory obsolescence,
depreciation and amortization, asset valuations, impairment assessments, employee benefi ts, pensions, taxes and any
corresponding valuation allowances, restructuring and other related costs, stock-based compensation and contingencies.
Should the underlying assumptions change, the actual amounts could diff er from those estimates.
(c) Translation of foreign currencies
The accounts of the Company are presented in Canadian dollars. The fi nancial statements of foreign subsidiaries whose unit
of measure is not the Canadian dollar are translated into Canadian dollars using the exchange rate in eff ect at the year-end
for assets and liabilities and the average exchange rates for the period for revenue, expenses and cash fl ows. Exchange gains
or losses on translation of foreign subsidiaries are included in accumulated other comprehensive income, a component of
shareholders’ equity until realized.
(d) Revenue recognition
The Company recognizes revenues from product sales upon transfer of title to customers. Revenue is recorded at the invoice
price for each product. An estimate of sales incentives provided to customers is also recognized at the time of sale and is
classifi ed as a reduction in reported sales. Sales incentives include various rebate and promotional programs provided to the
Company’s customers.
(e) Financial instruments
The Company’s fi nancial assets and fi nancial liabilities are classifi ed as held-for-trading, available-for-sale, held-to-maturity,
loans and receivables or other fi nancial liabilities. The classifi cation depends on the purpose for which the fi nancial
instruments were acquired and their characteristics. Held-for-trading is the required classifi cation for all derivative fi nancial
instruments unless they are specifi cally designated within an eff ective hedge relationship. Held-for-trading fi nancial
instruments are measured at fair value with changes in fair value recognized in net earnings in the period in which they
MLF_Financials_ENG.indd 43 16/03/10 8:09 AM

MAPLE LEAF FOODS INC. 41
notes to the consolidated financial statements
arise. Available-for-sale fi nancial assets are measured at fair value with changes in fair value recognized in other
comprehensive income in the period in which they arise. Held-to-maturity, loans and receivables and other fi nancial
liabilities are initially recorded at fair value and are subsequently measured at amortized cost.
(f) Hedge accountingThe Company uses derivatives and other non-derivative fi nancial instruments to manage its exposures to fl uctuations in interest rates, foreign exchange rates and commodity prices.
At the inception of a hedging relationship, the Company designates and formally documents the relationship between the hedging instrument and the hedged item, its risk management objective and its strategy for undertaking the hedge. The documentation identifi es the specifi c asset, liability or anticipated cash fl ows being hedged, the risk that is being hedged, the type of hedging instrument used and how eff ectiveness will be assessed.
The Company also formally assesses, both at inception and at least quarterly thereafter, whether or not the derivatives that are used in hedging transactions are highly eff ective in off setting the changes attributable to the hedged risks in the fair values or cash fl ows of the hedged items. If a hedge relationship becomes ineff ective, it no longer qualifi es for hedge accounting and any subsequent change in the fair value of the hedging instrument is recognized in earnings.
When hedge accounting is appropriate, the hedging relationship is designated as a cash fl ow hedge, a fair value hedge or a hedge of foreign currency exposure of a net investment in a self-sustaining foreign operation.
In a cash fl ow hedge, the change in fair value of the hedging instrument is recorded, to the extent it is eff ective, in other comprehensive income until the hedged item aff ects net earnings. The Company uses cash fl ow hedges primarily to convert fi xed rate U.S. dollar-denominated notes payable to fi xed rate notes denominated in Canadian dollars. The Company also uses cash fl ow hedges to mitigate the risk from variable cash fl ows associated with forecasted foreign currency denominated cash fl ows and forecasted purchases and sales of various commodities.
In a fair value hedge, the change in fair value of the hedging derivative is off set in the consolidated statement of earnings by the change in fair value of the hedged item relating to the hedged risk.
In a net investment hedge, the change in fair value of the hedging instruments recorded, to the extent eff ective, directly in other comprehensive income. These amounts are recognized in income when the corresponding cumulative translation adjustments from self-sustaining foreign operations are recognized in income. The Company has designated certain U.S. dollar-denominated notes payable as net investment hedges of U.S. operations.
Hedge ineff ectiveness is measured and recorded in current period earnings in the consolidated statement of earnings. When either a fair value hedge or cash fl ow hedge is discontinued, any cumulative adjustment to either the hedged item or other comprehensive income is recognized in earnings as the hedged item aff ects earnings, or when the hedged item is derecognized. If a designated hedge is no longer eff ective, the associated derivative instrument is subsequently carried at fair value through earnings without any off set from the hedged item.
Changes in the fair value of derivatives that do not qualify for hedge accounting are carried at fair value in the consolidated balance sheet, and subsequent changes in their fair value are recorded in the consolidated statement of earnings.
(g) Inventories
Inventories are valued at the lower of cost and net realizable value, with cost being determined substantially on a fi rst-in,
fi rst-out basis. Included in the cost of inventory are direct product costs, direct labour and an allocation of variable and fi xed
manufacturing overhead including depreciation.
MLF_Financials_ENG.indd 44 16/03/10 8:09 AM
42 MAPLE LEAF FOODS INC.
notes to the consolidated financial statements
(h) Impairment or disposal of long-lived assets
The Company reviews long-lived assets or asset groups held and used including property and equipment and intangible
assets subject to amortization for recoverability whenever events or changes in circumstances indicate that their carrying
amount may not be recoverable. Recoverability of assets to be held and used is measured by comparing the carrying amount
of the asset to the sum of the undiscounted cash fl ows expected to result from the use and eventual disposal of the asset or
asset group. An impairment loss is recognized when the carrying amount is not recoverable and exceeds the fair value of the
asset or asset group. Long-lived assets are classifi ed as held for sale when certain criteria are met and the sale is expected to
be completed within one year. The assets to be disposed of are separately presented in the balance sheet and reported at the
lower of their carrying amount or fair value less costs to sell, and are no longer depreciated.
(i) Property and equipment
Property and equipment are recorded at cost including, where applicable, interest capitalized during the construction or
development period. Construction in process assets are capitalized during construction and depreciation commences when
the asset is available for use. Depreciation is calculated using the straight-line basis at the following rates, which are based
on the expected useful lives of the assets:
Buildings 2.5% to 6%
Machinery and equipment 10% to 33%
(j) Financing costs
Costs incurred to obtain long-term debt fi nancing are amortized over the term of such debt and the amount amortized is
included in interest expense for the year.
(k) Goodwill and other intangible assetsGoodwill is the residual amount that results when the purchase price of an acquired business exceeds the sum of the amounts allocated to identifi able assets acquired, less liabilities assumed, based on their fair values. Goodwill is allocated as of the date of the business combination to the Company’s reporting units that are expected to benefi t from the synergies of the business combination. The Company assigns value to certain acquired identifi able intangible assets, primarily brands, customer relationships, poultry production quota and delivery routes.
Defi nite life intangible assets are amortized on a straight-line basis over their estimated useful lives. Goodwill is not amortized and is tested for impairment annually in the second quarter and otherwise as required if events occur that indicate that it is more likely than not that the carrying value of a reporting unit has been impaired. Impairment of goodwill is tested at the reporting unit level by comparing the reporting unit’s carrying amount to its fair value. Indefi nite life intangibles are tested for impairment annually in the fourth quarter and, as required, if events occur that indicate it is more likely than not the carrying value has been impaired. The impairment tests for indefi nite life intangible assets and goodwill were performed in 2009 and 2008 and no impairments were identifi ed.
(l) Income taxes
The Company uses the asset and liability method of accounting for income taxes. Accordingly, future tax assets and liabilities
are recognized for the future tax consequences attributable to diff erences between the fi nancial statement carrying amounts
of assets and liabilities and their respective tax bases. Future tax assets and liabilities are measured using enacted or
MLF_Financials_ENG.indd 45 16/03/10 8:09 AM
MAPLE LEAF FOODS INC. 43
notes to the consolidated financial statements
substantively enacted tax rates expected to apply to taxable income in the years in which those temporary diff erences are
expected to be recovered or settled. In addition, the eff ect on future tax assets and liabilities of a change in tax rates is
recognized in income in the year that includes the enactment or substantive enactment date. A valuation allowance is
recognized against future tax assets when it is more likely than not that all or some part of the asset will not be realized.
(m) Employee benefi t plans
The Company accrues obligations and costs in respect of employee benefi t plans. The cost of pensions and other retirement
benefi ts earned by employees is actuarially determined using the projected benefi t method pro-rated on service and
Management’s best estimate of expected plan investment performance, salary escalation, retirement ages of employees and
expected health care costs. Changes in these assumptions could aff ect future pension expense. For the purpose of calculating the
expected return on plan assets, those assets are valued at fair value. Past service costs arising from plan amendments are
amortized on a straight-line basis over the average remaining service period of employees active at the date of amendment.
Actuarial gains and losses in excess of 10% of the greater of the actuarial liabilities and the fair value of assets at the
beginning of the year and all gains and losses due to changes in plan provisions are amortized on a straight-line basis over
the expected average remaining service period of the active plan members. When a restructuring of a benefi t plan gives
rise to both a curtailment and settlement of obligations, the curtailment is accounted for prior to the settlement.
(n) Stock-based compensation
The Company applies the fair value method of accounting for its stock-based compensation. The fair value at grant date of
stock options (“options”) is estimated using the Black-Scholes option-pricing model. The fair value of restricted stock units
(“RSUs”) is measured based on the fair value of the underlying shares on the grant date. Compensation cost is recognized on
a straight-line basis over the expected vesting period of the stock-based compensation. The Company estimates forfeitures
at the grant date and revises the estimate as necessary if subsequent information indicates that actual forfeitures diff er
signifi cantly from the original estimate.
(o) Statement of cash fl ows
Cash and cash equivalents are defi ned as cash and short-term securities with maturities less than 90 days at the date of
acquisition, less bank indebtedness.
(p) Accounting changes
(i) Eff ective January 1, 2009, the Company adopted Emerging Issues Committee Abstract 173, “Credit Risk and the
Fair Value of Financial Assets and Financial Liabilities” (“EIC 173”). EIC 173 requires the Company to consider its
own credit risk and the credit risk of the counterparty in determining the fair value of fi nancial assets and fi nancial
liabilities, including derivative instruments. The adoption of EIC 173, which was adopted on a retrospective basis
without restatement of prior periods did not have a material impact on the Company’s fi nancial statements.
(ii) In 2008, the Canadian Institute of Chartered Accountants (“CICA”) issued Handbook Section 3064, “Goodwill and
Intangible Assets” (“CICA 3064”). CICA 3064, which replaces Section 3062, “Goodwill and Other Intangible Assets”,
and Section 3450, “Research and Development Costs”, establishes standards for the recognition, measurement and
disclosure of goodwill and intangible assets. The Company adopted this standard on a retrospective basis on January 1,
2009. The adoption of the new standard did not have a material impact on the Company’s fi nancial statements.
MLF_Financials_ENG.indd 46 16/03/10 8:09 AM
44 MAPLE LEAF FOODS INC.
notes to the consolidated financial statements
(iii) In June 2009, the CICA amended Section 3862, “Financial Instruments – Disclosures”, to include additional disclosure
requirements about fair value measurement for fi nancial instruments and liquidity risk disclosures. These amendments
require a three-level hierarchy that refl ects the signifi cance of the inputs used in making the fair value measurements.
Each level is based on the transparency of the inputs used to measure the fair values of assets and liabilities:
Level 1 – inputs are unadjusted quoted prices of identical instruments in active markets.
Level 2 – inputs other than quoted prices included in Level 1 that are observable for the asset
or liability, either directly or indirectly.
Level 3 – one or more signifi cant inputs used in a valuation technique are unobservable in
determining fair values of the instruments.
Determination of fair value and the resulting hierarchy requires the use of observable market data whenever available.
The classifi cation of a fi nancial instrument in the hierarchy is based upon the lowest level of input that is signifi cant to the
measurement of fair value. The Company has complied with the new disclosure requirements beginning in 2009 and this
disclosure is presented in Note 10.
(q) Recent accounting pronouncementsIn January 2009, the CICA issued Handbook Section 1582, “Business Combinations” (“CICA 1582”). CICA 1582 requires that all assets and liabilities of an acquired business will be recorded at fair value on the acquisition date and is consistent with International Financial Reporting Standards (“IFRS”). Obligations for contingent considerations and contingencies will also be recorded at fair value at the acquisition date. The standard also states that acquisition-related costs will be expensed as incurred and that restructuring charges will be expensed in the periods after the acquisition date. The Section applies prospectively to business combinations for which the acquisition date is on or after the beginning of the fi rst annual reporting period on or after January 1, 2011 with earlier adoption permitted.
In January 2009, the CICA issued Handbook Section 1601, “Consolidations” (“CICA 1601”), and Section 1602, “Non-controlling Interests” (“CICA 1602”). CICA 1601 establishes standards for the preparation of consolidated fi nancial statements. CICA 1602 establishes standards for accounting for a non-controlling interest in a subsidiary in consolidated fi nancial statements subsequent to a business combination. These standards apply to interim and annual consolidated fi nancial statements relating to fi scal years beginning on or after January 1, 2011 with earlier adoption permitted. The Company is currently assessing the impact of the new standard on its fi nancial statements.
In February 2008, the CICA announced that Canadian public companies will be required to prepare their fi nancial statements in accordance with IFRS for fi scal years beginning on or after January 1, 2011. The Company will issue its fi nancial statements in the fi rst quarter of 2011 in accordance with IFRS including comparative data for 2010.
(r) Comparative fi gures
Certain 2008 comparative fi gures have been reclassifi ed to conform with the fi nancial statement presentation adopted in 2009.
MLF_Financials_ENG.indd 47 16/03/10 8:09 AM
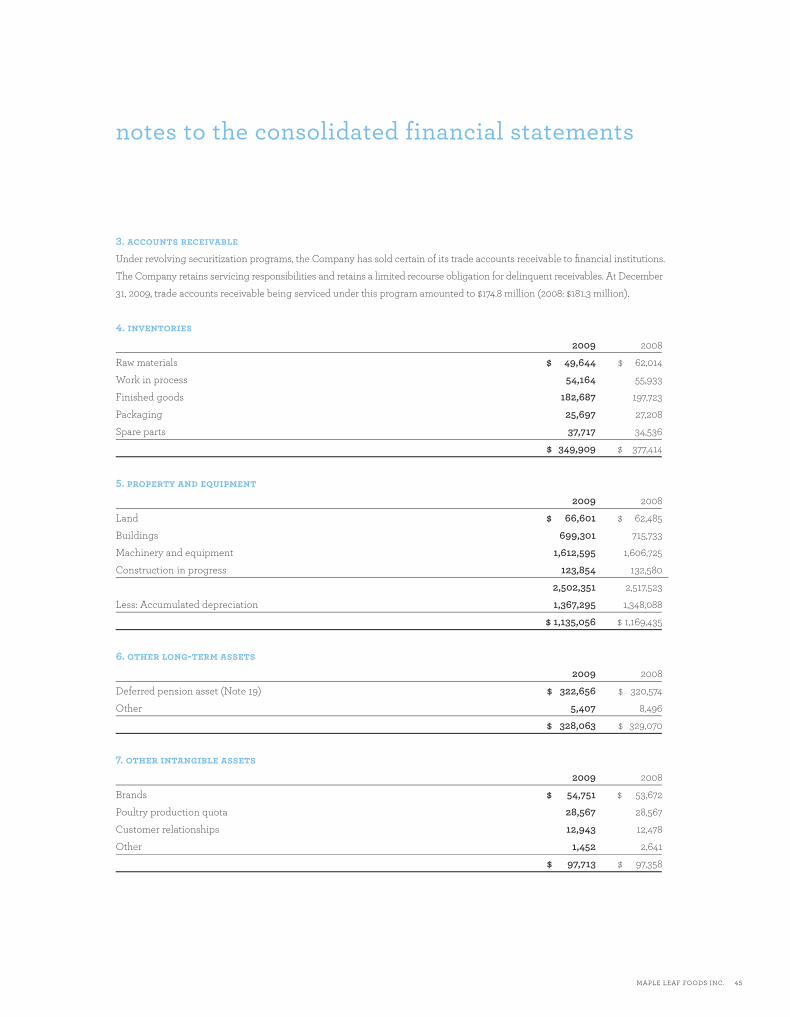
MAPLE LEAF FOODS INC. 45
notes to the consolidated financial statements
3. accounts receivable
Under revolving securitization programs, the Company has sold certain of its trade accounts receivable to fi nancial institutions.
The Company retains servicing responsibilities and retains a limited recourse obligation for delinquent receivables. At December
31, 2009, trade accounts receivable being serviced under this program amounted to $174.8 million (2008: $181.3 million).
4. inventories
2009 2008
Raw materials $ 49,644 $ 62,014
Work in process 54,164 55,933
Finished goods 182,687 197,723
Packaging 25,697 27,208
Spare parts 37,717 34,536
$ 349,909 $ 377,414
5. property and equipment
2009 2008
Land $ 66,601 $ 62,485
Buildings 699,301 715,733
Machinery and equipment 1,612,595 1,606,725
Construction in progress 123,854 132,580
2,502,351 2,517,523
Less: Accumulated depreciation 1,367,295 1,348,088
$ 1,135,056 $ 1,169,435
6. other long-term assets
2009 2008
Deferred pension asset (Note 19) $ 322,656 $ 320,574
Other 5,407 8,496
$ 328,063 $ 329,070
7. other intangible assets
2009 2008
Brands $ 54,751 $ 53,672
Poultry production quota 28,567 28,567
Customer relationships 12,943 12,478
Other 1,452 2,641
$ 97,713 $ 97,358
MLF_Financials_ENG.indd 48 16/03/10 8:09 AM
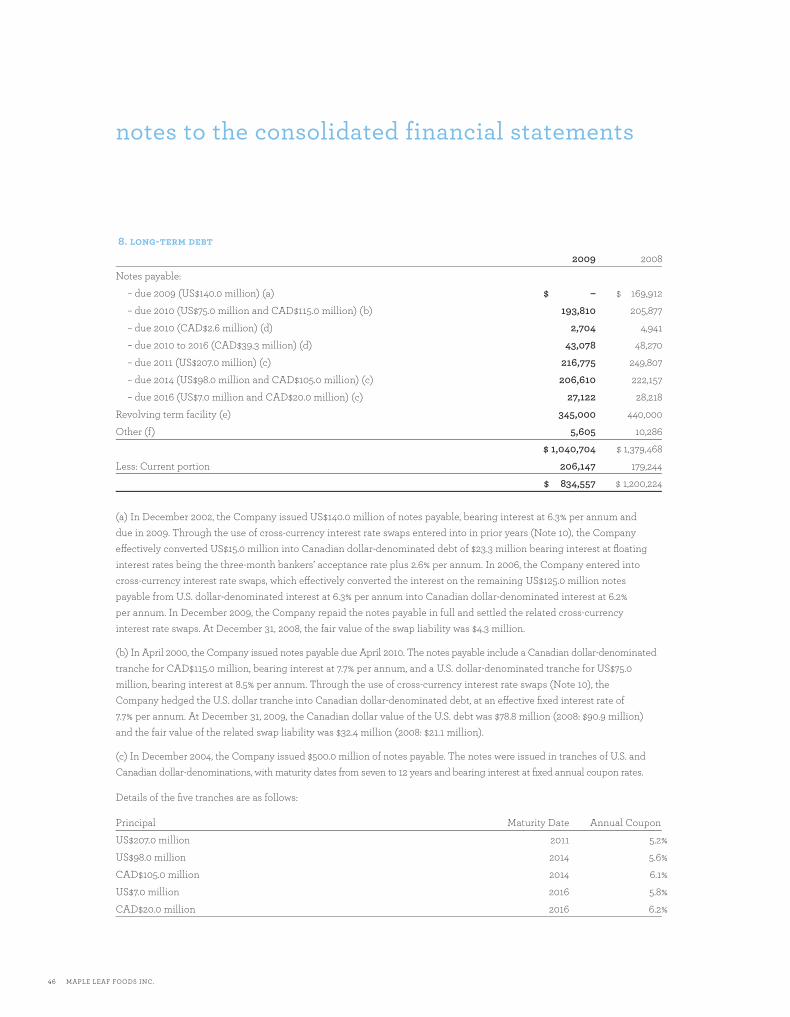
46 MAPLE LEAF FOODS INC.
notes to the consolidated financial statements
8. long-term debt
2009 2008
Notes payable:
– due 2009 (US$140.0 million) (a) $ – $ 169,912
– due 2010 (US$75.0 million and CAD$115.0 million) (b) 193,810 205,877
– due 2010 (CAD$2.6 million) (d) 2,704 4,941
– due 2010 to 2016 (CAD$39.3 million) (d) 43,078 48,270
– due 2011 (US$207.0 million) (c) 216,775 249,807
– due 2014 (US$98.0 million and CAD$105.0 million) (c) 206,610 222,157
– due 2016 (US$7.0 million and CAD$20.0 million) (c) 27,122 28,218
Revolving term facility (e) 345,000 440,000
Other (f) 5,605 10,286
$ 1,040,704 $ 1,379,468
Less: Current portion 206,147 179,244
$ 834,557 $ 1,200,224
(a) In December 2002, the Company issued US$140.0 million of notes payable, bearing interest at 6.3% per annum and due in 2009. Through the use of cross-currency interest rate swaps entered into in prior years (Note 10), the Company eff ectively converted US$15.0 million into Canadian dollar-denominated debt of $23.3 million bearing interest at fl oating interest rates being the three-month bankers’ acceptance rate plus 2.6% per annum. In 2006, the Company entered into cross-currency interest rate swaps, which eff ectively converted the interest on the remaining US$125.0 million notes payable from U.S. dollar-denominated interest at 6.3% per annum into Canadian dollar-denominated interest at 6.2% per annum. In December 2009, the Company repaid the notes payable in full and settled the related cross-currency interest rate swaps. At December 31, 2008, the fair value of the swap liability was $4.3 million.
(b) In April 2000, the Company issued notes payable due April 2010. The notes payable include a Canadian dollar-denominated tranche for CAD$115.0 million, bearing interest at 7.7% per annum, and a U.S. dollar-denominated tranche for US$75.0 million, bearing interest at 8.5% per annum. Through the use of cross-currency interest rate swaps (Note 10), the Company hedged the U.S. dollar tranche into Canadian dollar-denominated debt, at an eff ective fi xed interest rate of 7.7% per annum. At December 31, 2009, the Canadian dollar value of the U.S. debt was $78.8 million (2008: $90.9 million) and the fair value of the related swap liability was $32.4 million (2008: $21.1 million).
(c) In December 2004, the Company issued $500.0 million of notes payable. The notes were issued in tranches of U.S. and Canadian dollar-denominations, with maturity dates from seven to 12 years and bearing interest at fi xed annual coupon rates.
Details of the fi ve tranches are as follows:
Principal Maturity Date Annual Coupon
US$207.0 million 2011 5.2%
US$98.0 million 2014 5.6%
CAD$105.0 million 2014 6.1%
US$7.0 million 2016 5.8%
CAD$20.0 million 2016 6.2%
MLF_Financials_ENG.indd 49 16/03/10 8:09 AM
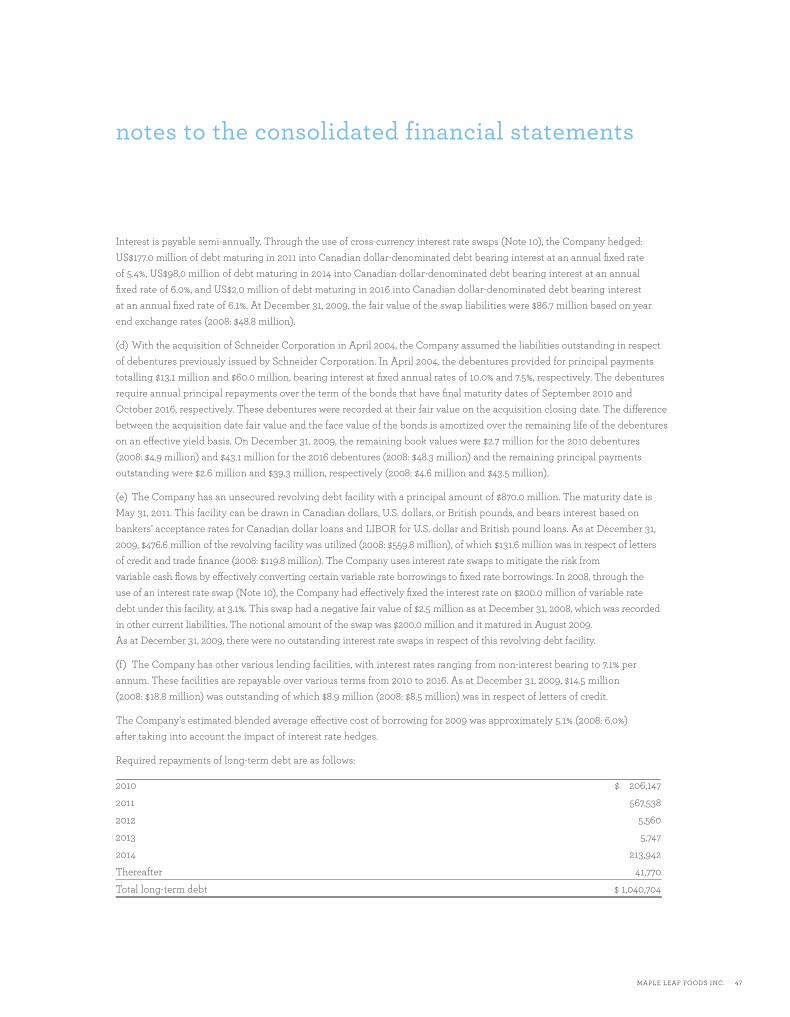
MAPLE LEAF FOODS INC. 47
notes to the consolidated financial statements
Interest is payable semi-annually. Through the use of cross-currency interest rate swaps (Note 10), the Company hedged: US$177.0 million of debt maturing in 2011 into Canadian dollar-denominated debt bearing interest at an annual fi xed rate of 5.4%, US$98.0 million of debt maturing in 2014 into Canadian dollar-denominated debt bearing interest at an annual fi xed rate of 6.0%, and US$2.0 million of debt maturing in 2016 into Canadian dollar-denominated debt bearing interest at an annual fi xed rate of 6.1%. At December 31, 2009, the fair value of the swap liabilities were $86.7 million based on year end exchange rates (2008: $48.8 million).
(d) With the acquisition of Schneider Corporation in April 2004, the Company assumed the liabilities outstanding in respect of debentures previously issued by Schneider Corporation. In April 2004, the debentures provided for principal payments totalling $13.1 million and $60.0 million, bearing interest at fi xed annual rates of 10.0% and 7.5%, respectively. The debentures require annual principal repayments over the term of the bonds that have fi nal maturity dates of September 2010 and October 2016, respectively. These debentures were recorded at their fair value on the acquisition closing date. The diff erence between the acquisition date fair value and the face value of the bonds is amortized over the remaining life of the debentures on an eff ective yield basis. On December 31, 2009, the remaining book values were $2.7 million for the 2010 debentures (2008: $4.9 million) and $43.1 million for the 2016 debentures (2008: $48.3 million) and the remaining principal payments outstanding were $2.6 million and $39.3 million, respectively (2008: $4.6 million and $43.5 million).
(e) The Company has an unsecured revolving debt facility with a principal amount of $870.0 million. The maturity date is May 31, 2011. This facility can be drawn in Canadian dollars, U.S. dollars, or British pounds, and bears interest based on bankers’ acceptance rates for Canadian dollar loans and LIBOR for U.S. dollar and British pound loans. As at December 31, 2009, $476.6 million of the revolving facility was utilized (2008: $559.8 million), of which $131.6 million was in respect of letters of credit and trade fi nance (2008: $119.8 million). The Company uses interest rate swaps to mitigate the risk from variable cash fl ows by eff ectively converting certain variable rate borrowings to fi xed rate borrowings. In 2008, through the use of an interest rate swap (Note 10), the Company had eff ectively fi xed the interest rate on $200.0 million of variable rate debt under this facility, at 3.1%. This swap had a negative fair value of $2.5 million as at December 31, 2008, which was recorded in other current liabilities. The notional amount of the swap was $200.0 million and it matured in August 2009. As at December 31, 2009, there were no outstanding interest rate swaps in respect of this revolving debt facility.
(f) The Company has other various lending facilities, with interest rates ranging from non-interest bearing to 7.1% per annum. These facilities are repayable over various terms from 2010 to 2016. As at December 31, 2009, $14.5 million (2008: $18.8 million) was outstanding of which $8.9 million (2008: $8.5 million) was in respect of letters of credit.
The Company’s estimated blended average eff ective cost of borrowing for 2009 was approximately 5.1% (2008: 6.0%) after taking into account the impact of interest rate hedges.
Required repayments of long-term debt are as follows:
2010 $ 206,147
2011 567,538
2012 5,560
2013 5,747
2014 213,942
Thereafter 41,770
Total long-term debt $ 1,040,704
MLF_Financials_ENG.indd 50 16/03/10 8:09 AM
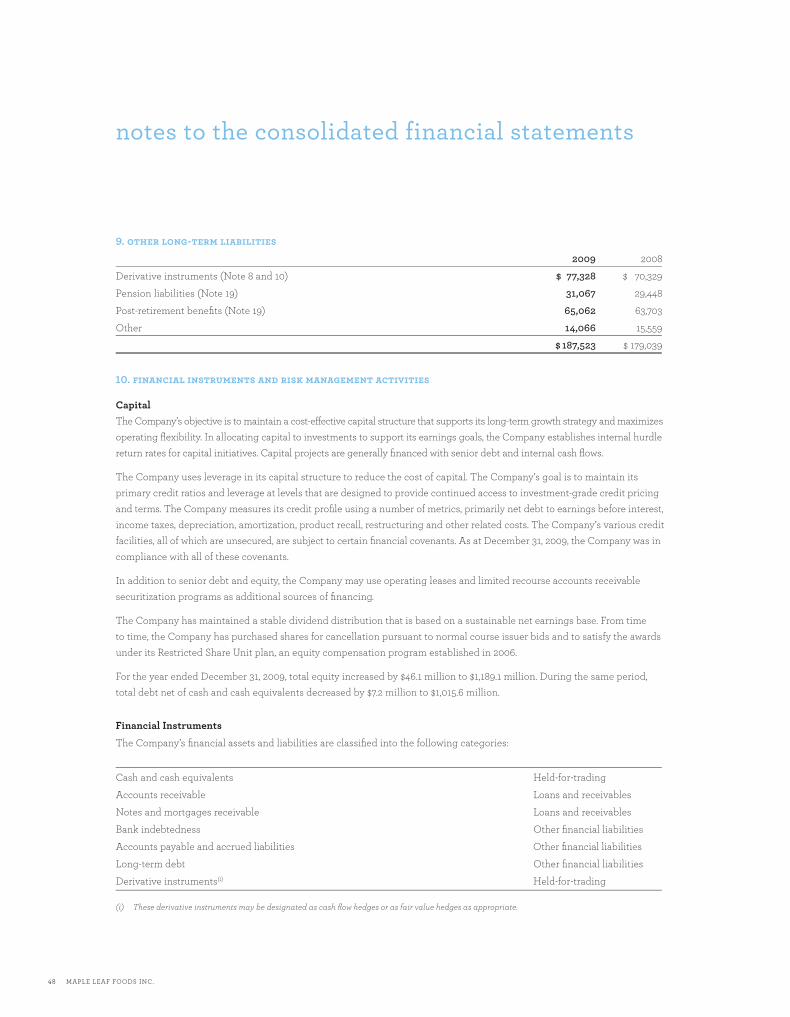
48 MAPLE LEAF FOODS INC.
notes to the consolidated financial statements
9. other long-term liabilities
2009 2008
Derivative instruments (Note 8 and 10) $ 77,328 $ 70,329
Pension liabilities (Note 19) 31,067 29,448
Post-retirement benefi ts (Note 19) 65,062 63,703
Other 14,066 15,559
$ 187,523 $ 179,039
10. fi nancial instruments and risk management activities
Capital The Company’s objective is to maintain a cost-eff ective capital structure that supports its long-term growth strategy and maximizes operating fl exibility. In allocating capital to investments to support its earnings goals, the Company establishes internal hurdle return rates for capital initiatives. Capital projects are generally fi nanced with senior debt and internal cash fl ows.
The Company uses leverage in its capital structure to reduce the cost of capital. The Company’s goal is to maintain its primary credit ratios and leverage at levels that are designed to provide continued access to investment-grade credit pricing and terms. The Company measures its credit profi le using a number of metrics, primarily net debt to earnings before interest, income taxes, depreciation, amortization, product recall, restructuring and other related costs. The Company’s various credit facilities, all of which are unsecured, are subject to certain fi nancial covenants. As at December 31, 2009, the Company was in compliance with all of these covenants.
In addition to senior debt and equity, the Company may use operating leases and limited recourse accounts receivable securitization programs as additional sources of fi nancing.
The Company has maintained a stable dividend distribution that is based on a sustainable net earnings base. From time to time, the Company has purchased shares for cancellation pursuant to normal course issuer bids and to satisfy the awards under its Restricted Share Unit plan, an equity compensation program established in 2006.
For the year ended December 31, 2009, total equity increased by $46.1 million to $1,189.1 million. During the same period, total debt net of cash and cash equivalents decreased by $7.2 million to $1,015.6 million.
Financial Instruments
The Company’s fi nancial assets and liabilities are classifi ed into the following categories:
Cash and cash equivalents Held-for-trading
Accounts receivable Loans and receivables
Notes and mortgages receivable Loans and receivables
Bank indebtedness Other fi nancial liabilities
Accounts payable and accrued liabilities Other fi nancial liabilities
Long-term debt Other fi nancial liabilities
Derivative instruments(i) Held-for-trading
(i) These derivative instruments may be designated as cash fl ow hedges or as fair value hedges as appropriate.
MLF_Financials_ENG.indd 51 16/03/10 8:09 AM
MAPLE LEAF FOODS INC. 49
notes to the consolidated financial statements
The fair value of fi nancial assets and liabilities classifi ed as loans and receivables and other fi nancial liabilities (excluding long-term debt) approximate their carrying value due to their short-term nature. Financial assets and liabilities classifi ed as held-for-trading and all derivative fi nancial instruments are recorded at fair value. The fair value of long-term debt as at December 31, 2009 was $1,040.2 million as compared to its carrying value of $1,040.7 million on the consolidated balance sheet.
The fair value of the Company’s long-term debt was estimated based on discounted future cash fl ows using current rates for similar fi nancial instruments subject to similar risks and maturities. The fair values of the Company’s interest rate and foreign exchange derivative fi nancial instruments were estimated using current market measures for interest rates and foreign exchange rates. Commodity futures and options contracts are exchange-traded and fair value is determined based on exchange prices.
The risks associated with the Company’s fi nancial instruments and policies for managing these risks are detailed below.
Credit RiskCredit risk refers to the risk of losses due to failure of the Company’s customers or other counterparties to meet their payment obligations.
In the normal course of business, the Company is exposed to credit risk from its customers, substantially all of which are in the grocery and foodservice markets. The Company performs ongoing credit evaluations of new and existing customers’ fi nancial condition and reviews the collectibility of its trade and other accounts receivable in order to mitigate any possible credit losses. The Company maintains an allowance for doubtful accounts that represents its estimate of uncollectible amounts. The components of this allowance include a provision related to specifi c losses estimated on individually signifi cant exposures and a provision based on historical trends of collections. Average accounts receivable days sales outstanding for the year is consistent with historic trends. There are no impaired receivables that have not been provided for in the allowance for doubtful accounts. As at December 31, 2009, the Company believes that the allowance for doubtful accounts suffi ciently covers any credit risk related to past due or impaired accounts receivable balances.
Management believes concentrations of credit risk with respect to accounts receivable is limited due to the generally high credit quality of the Company’s major customers, as well as the large number and geographic dispersion of smaller customers. The Company does, however, conduct a signifi cant amount of business with a small number of large grocery retailers. The Company’s fi ve largest customers comprise approximately 43% (2008: 30%) of consolidated accounts receivable at December 31, 2009 and the two largest customers comprise approximately 23% (2008: 23%) of consolidated sales.
The Company is exposed to credit risk on its cash and cash equivalents (comprising primarily deposits and short-term placements with Canadian chartered banks) and non-exchange-traded derivatives contracts. The Company mitigates this credit risk by only dealing with counterparties that are major international fi nancial institutions with long-term debt ratings of single A or better.
The Company’s maximum exposure to credit risk at the balance sheet date consisted primarily of the carrying value of non-derivative fi nancial assets and non-exchange-traded derivatives with positive fair values.
MLF_Financials_ENG.indd 52 16/03/10 8:09 AM
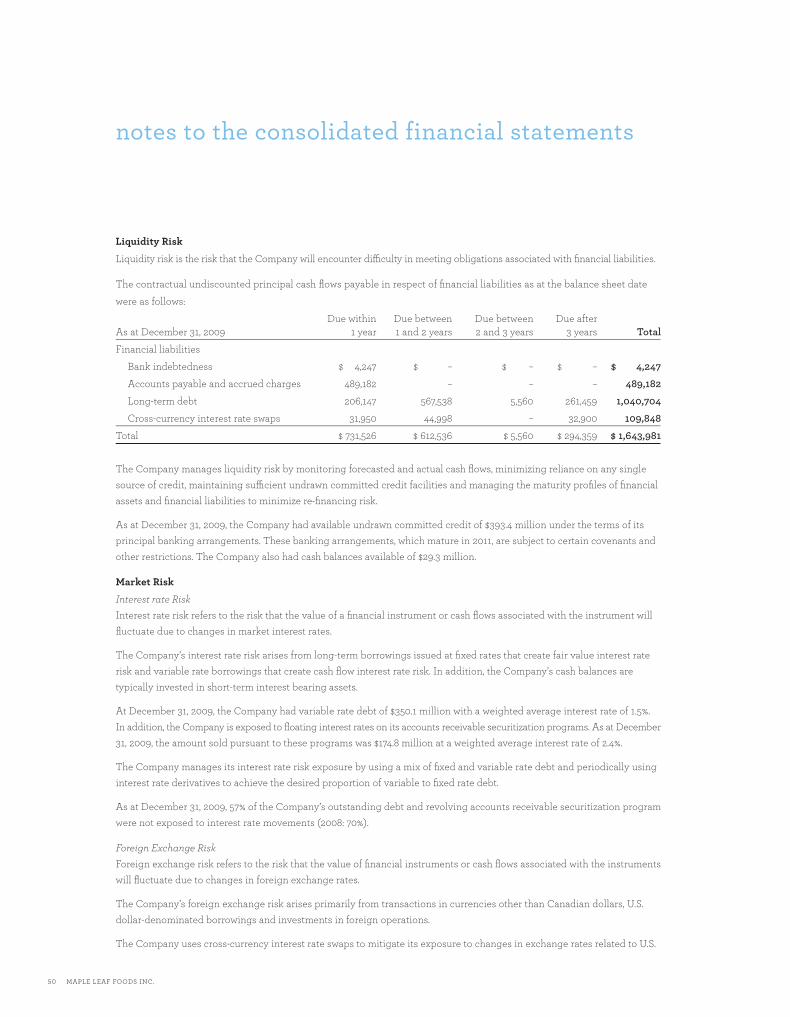
50 MAPLE LEAF FOODS INC.
notes to the consolidated financial statements
Liquidity Risk
Liquidity risk is the risk that the Company will encounter diffi culty in meeting obligations associated with fi nancial liabilities.
The contractual undiscounted principal cash fl ows payable in respect of fi nancial liabilities as at the balance sheet date
were as follows:
Due within Due between Due between Due after As at December 31, 2009 1 year 1 and 2 years 2 and 3 years 3 years TotalFinancial liabilities
Bank indebtedness $ 4,247 $ – $ – $ – $ 4,247 Accounts payable and accrued charges 489,182 – – – 489,182 Long-term debt 206,147 567,538 5,560 261,459 1,040,704 Cross-currency interest rate swaps 31,950 44,998 – 32,900 109,848Total $ 731,526 $ 612,536 $ 5,560 $ 294,359 $ 1,643,981
The Company manages liquidity risk by monitoring forecasted and actual cash fl ows, minimizing reliance on any single source of credit, maintaining suffi cient undrawn committed credit facilities and managing the maturity profi les of fi nancial assets and fi nancial liabilities to minimize re-fi nancing risk.
As at December 31, 2009, the Company had available undrawn committed credit of $393.4 million under the terms of its principal banking arrangements. These banking arrangements, which mature in 2011, are subject to certain covenants and other restrictions. The Company also had cash balances available of $29.3 million.
Market Risk
Interest rate RiskInterest rate risk refers to the risk that the value of a fi nancial instrument or cash fl ows associated with the instrument will fl uctuate due to changes in market interest rates.
The Company’s interest rate risk arises from long-term borrowings issued at fi xed rates that create fair value interest rate risk and variable rate borrowings that create cash fl ow interest rate risk. In addition, the Company’s cash balances are typically invested in short-term interest bearing assets.
At December 31, 2009, the Company had variable rate debt of $350.1 million with a weighted average interest rate of 1.5%. In addition, the Company is exposed to fl oating interest rates on its accounts receivable securitization programs. As at December 31, 2009, the amount sold pursuant to these programs was $174.8 million at a weighted average interest rate of 2.4%.
The Company manages its interest rate risk exposure by using a mix of fi xed and variable rate debt and periodically using interest rate derivatives to achieve the desired proportion of variable to fi xed rate debt.
As at December 31, 2009, 57% of the Company’s outstanding debt and revolving accounts receivable securitization program were not exposed to interest rate movements (2008: 70%).
Foreign Exchange RiskForeign exchange risk refers to the risk that the value of fi nancial instruments or cash fl ows associated with the instruments will fl uctuate due to changes in foreign exchange rates.
The Company’s foreign exchange risk arises primarily from transactions in currencies other than Canadian dollars, U.S. dollar-denominated borrowings and investments in foreign operations.
The Company uses cross-currency interest rate swaps to mitigate its exposure to changes in exchange rates related to U.S.
MLF_Financials_ENG.indd 53 16/03/10 8:09 AM
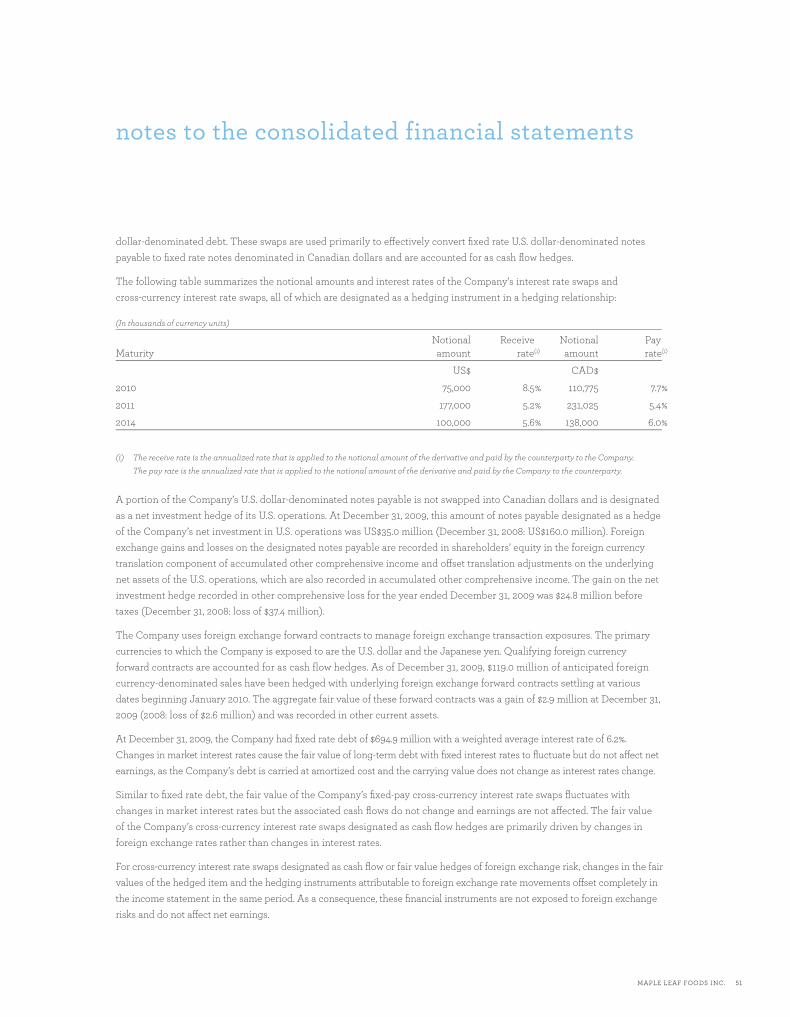
MAPLE LEAF FOODS INC. 51
notes to the consolidated financial statements
dollar-denominated debt. These swaps are used primarily to eff ectively convert fi xed rate U.S. dollar-denominated notes payable to fi xed rate notes denominated in Canadian dollars and are accounted for as cash fl ow hedges.
The following table summarizes the notional amounts and interest rates of the Company’s interest rate swaps and cross-currency interest rate swaps, all of which are designated as a hedging instrument in a hedging relationship:
(In thousands of currency units)
Notional Receive Notional PayMaturity amount rate(i) amount rate(i)
US$ CAD$
2010 75,000 8.5% 110,775 7.7%
2011 177,000 5.2% 231,025 5.4%
2014 100,000 5.6% 138,000 6.0%
(i) The receive rate is the annualized rate that is applied to the notional amount of the derivative and paid by the counterparty to the Company. The pay rate is the annualized rate that is applied to the notional amount of the derivative and paid by the Company to the counterparty.
A portion of the Company’s U.S. dollar-denominated notes payable is not swapped into Canadian dollars and is designated as a net investment hedge of its U.S. operations. At December 31, 2009, this amount of notes payable designated as a hedge of the Company’s net investment in U.S. operations was US$35.0 million (December 31, 2008: US$160.0 million). Foreign exchange gains and losses on the designated notes payable are recorded in shareholders’ equity in the foreign currency translation component of accumulated other comprehensive income and off set translation adjustments on the underlying net assets of the U.S. operations, which are also recorded in accumulated other comprehensive income. The gain on the net investment hedge recorded in other comprehensive loss for the year ended December 31, 2009 was $24.8 million before taxes (December 31, 2008: loss of $37.4 million).
The Company uses foreign exchange forward contracts to manage foreign exchange transaction exposures. The primary currencies to which the Company is exposed to are the U.S. dollar and the Japanese yen. Qualifying foreign currency forward contracts are accounted for as cash flow hedges. As of December 31, 2009, $119.0 million of anticipated foreign currency-denominated sales have been hedged with underlying foreign exchange forward contracts settling at various dates beginning January 2010. The aggregate fair value of these forward contracts was a gain of $2.9 million at December 31, 2009 (2008: loss of $2.6 million) and was recorded in other current assets.
At December 31, 2009, the Company had fi xed rate debt of $694.9 million with a weighted average interest rate of 6.2%. Changes in market interest rates cause the fair value of long-term debt with fi xed interest rates to fl uctuate but do not aff ect net earnings, as the Company’s debt is carried at amortized cost and the carrying value does not change as interest rates change.
Similar to fi xed rate debt, the fair value of the Company’s fi xed-pay cross-currency interest rate swaps fl uctuates with changes in market interest rates but the associated cash fl ows do not change and earnings are not aff ected. The fair value of the Company’s cross-currency interest rate swaps designated as cash fl ow hedges are primarily driven by changes in foreign exchange rates rather than changes in interest rates.
For cross-currency interest rate swaps designated as cash fl ow or fair value hedges of foreign exchange risk, changes in the fair values of the hedged item and the hedging instruments attributable to foreign exchange rate movements off set completely in the income statement in the same period. As a consequence, these fi nancial instruments are not exposed to foreign exchange risks and do not aff ect net earnings.
MLF_Financials_ENG.indd 54 16/03/10 8:09 AM
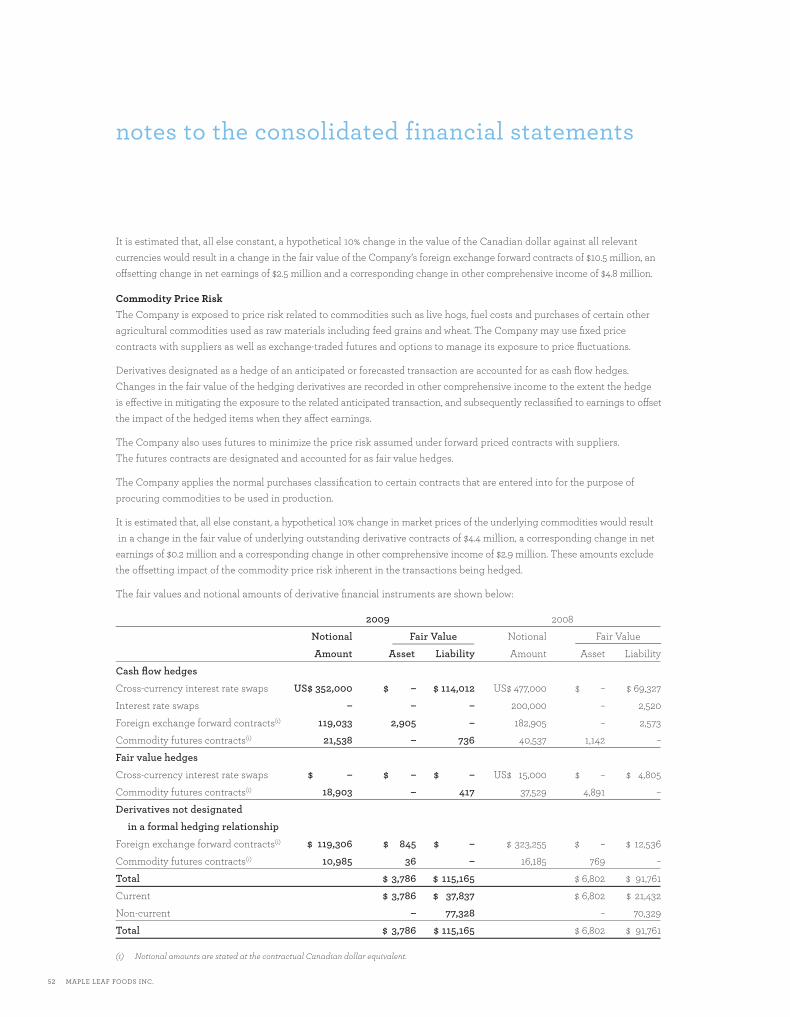
52 MAPLE LEAF FOODS INC.
notes to the consolidated financial statements
It is estimated that, all else constant, a hypothetical 10% change in the value of the Canadian dollar against all relevant currencies would result in a change in the fair value of the Company’s foreign exchange forward contracts of $10.5 million, an off setting change in net earnings of $2.5 million and a corresponding change in other comprehensive income of $4.8 million.
Commodity Price RiskThe Company is exposed to price risk related to commodities such as live hogs, fuel costs and purchases of certain other agricultural commodities used as raw materials including feed grains and wheat. The Company may use fi xed price contracts with suppliers as well as exchange-traded futures and options to manage its exposure to price fl uctuations.
Derivatives designated as a hedge of an anticipated or forecasted transaction are accounted for as cash fl ow hedges. Changes in the fair value of the hedging derivatives are recorded in other comprehensive income to the extent the hedge is eff ective in mitigating the exposure to the related anticipated transaction, and subsequently reclassifi ed to earnings to off set the impact of the hedged items when they aff ect earnings.
The Company also uses futures to minimize the price risk assumed under forward priced contracts with suppliers. The futures contracts are designated and accounted for as fair value hedges.
The Company applies the normal purchases classifi cation to certain contracts that are entered into for the purpose of procuring commodities to be used in production.
It is estimated that, all else constant, a hypothetical 10% change in market prices of the underlying commodities would result in a change in the fair value of underlying outstanding derivative contracts of $4.4 million, a corresponding change in net earnings of $0.2 million and a corresponding change in other comprehensive income of $2.9 million. These amounts exclude the off setting impact of the commodity price risk inherent in the transactions being hedged.
The fair values and notional amounts of derivative fi nancial instruments are shown below:
2009 2008
Notional Fair Value Notional Fair Value
Amount Asset Liability Amount Asset Liability
Cash fl ow hedgesCross-currency interest rate swaps US$ 352,000 $ – $ 114,012 US$ 477,000 $ – $ 69,327
Interest rate swaps – – – 200,000 – 2,520
Foreign exchange forward contracts(i) 119,033 2,905 – 182,905 – 2,573
Commodity futures contracts(i) 21,538 – 736 40,537 1,142 –
Fair value hedgesCross-currency interest rate swaps $ – $ – $ – US$ 15,000 $ – $ 4,805
Commodity futures contracts(i) 18,903 – 417 37,529 4,891 –
Derivatives not designated in a formal hedging relationshipForeign exchange forward contracts(i) $ 119,306 $ 845 $ – $ 323,255 $ – $ 12,536
Commodity futures contracts(i) 10,985 36 – 16,185 769 –
Total $ 3,786 $ 115,165 $ 6,802 $ 91,761
Current $ 3,786 $ 37,837 $ 6,802 $ 21,432
Non-current – 77,328 – 70,329
Total $ 3,786 $ 115,165 $ 6,802 $ 91,761
(i) Notional amounts are stated at the contractual Canadian dollar equivalent.
MLF_Financials_ENG.indd 55 16/03/10 8:09 AM
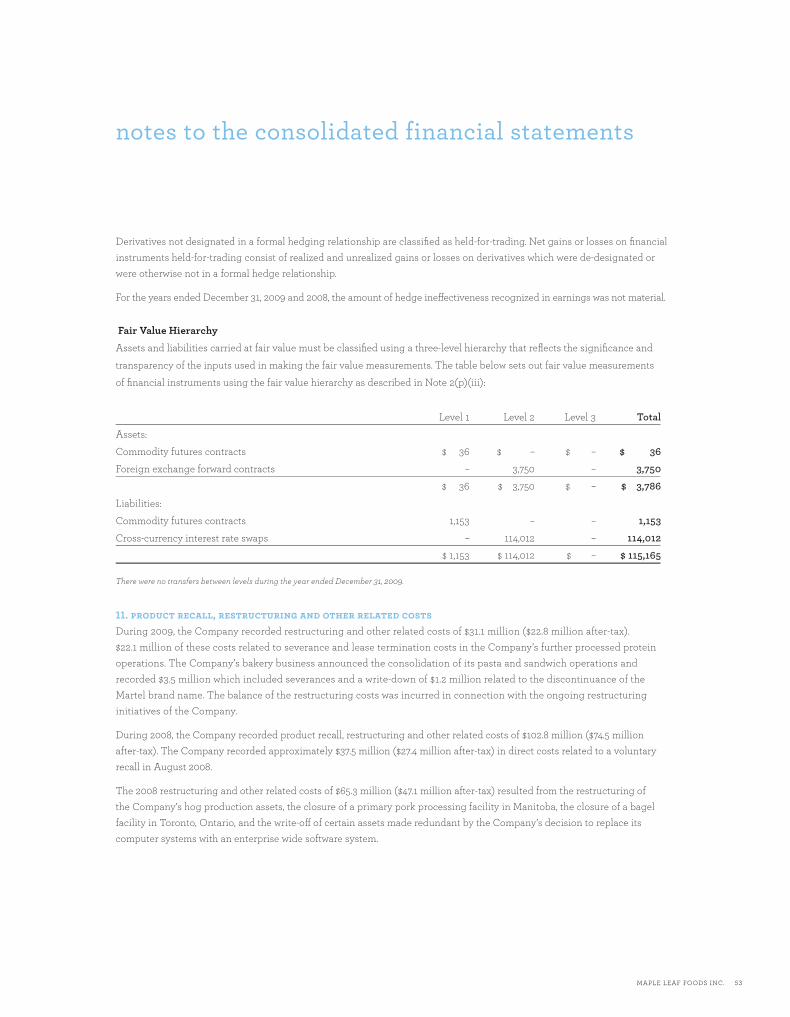
MAPLE LEAF FOODS INC. 53
notes to the consolidated financial statements
Derivatives not designated in a formal hedging relationship are classifi ed as held-for-trading. Net gains or losses on fi nancial instruments held-for-trading consist of realized and unrealized gains or losses on derivatives which were de-designated or were otherwise not in a formal hedge relationship.
For the years ended December 31, 2009 and 2008, the amount of hedge ineff ectiveness recognized in earnings was not material.
Fair Value Hierarchy
Assets and liabilities carried at fair value must be classifi ed using a three-level hierarchy that refl ects the signifi cance and
transparency of the inputs used in making the fair value measurements. The table below sets out fair value measurements
of fi nancial instruments using the fair value hierarchy as described in Note 2(p)(iii):
Level 1 Level 2 Level 3 TotalAssets:
Commodity futures contracts $ 36 $ – $ – $ 36Foreign exchange forward contracts – 3,750 – 3,750 $ 36 $ 3,750 $ – $ 3,786Liabilities:
Commodity futures contracts 1,153 – – 1,153Cross-currency interest rate swaps – 114,012 – 114,012 $ 1,153 $ 114,012 $ – $ 115,165
There were no transfers between levels during the year ended December 31, 2009.
11. product recall, restructuring and other related costsDuring 2009, the Company recorded restructuring and other related costs of $31.1 million ($22.8 million after-tax). $22.1 million of these costs related to severance and lease termination costs in the Company’s further processed protein operations. The Company’s bakery business announced the consolidation of its pasta and sandwich operations and recorded $3.5 million which included severances and a write-down of $1.2 million related to the discontinuance of the Martel brand name. The balance of the restructuring costs was incurred in connection with the ongoing restructuring initiatives of the Company.
During 2008, the Company recorded product recall, restructuring and other related costs of $102.8 million ($74.5 million after-tax). The Company recorded approximately $37.5 million ($27.4 million after-tax) in direct costs related to a voluntary recall in August 2008.
The 2008 restructuring and other related costs of $65.3 million ($47.1 million after-tax) resulted from the restructuring of the Company’s hog production assets, the closure of a primary pork processing facility in Manitoba, the closure of a bagel facility in Toronto, Ontario, and the write-off of certain assets made redundant by the Company’s decision to replace its computer systems with an enterprise wide software system.
MLF_Financials_ENG.indd 56 16/03/10 8:09 AM
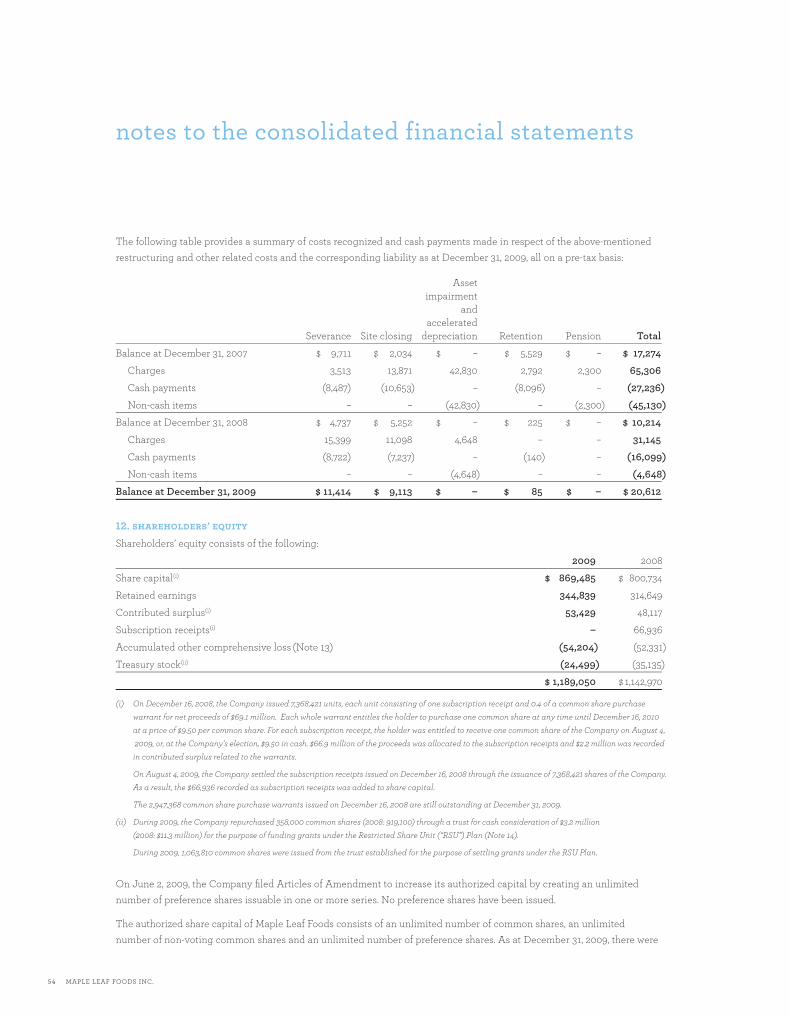
54 MAPLE LEAF FOODS INC.
notes to the consolidated financial statements
The following table provides a summary of costs recognized and cash payments made in respect of the above-mentioned restructuring and other related costs and the corresponding liability as at December 31, 2009, all on a pre-tax basis:
Asset impairment and accelerated Severance Site closing depreciation Retention Pension TotalBalance at December 31, 2007 $ 9,711 $ 2,034 $ – $ 5,529 $ – $ 17,274 Charges 3,513 13,871 42,830 2,792 2,300 65,306 Cash payments (8,487) (10,653) – (8,096) – (27,236) Non-cash items – – (42,830) – (2,300) (45,130)Balance at December 31, 2008 $ 4,737 $ 5,252 $ – $ 225 $ – $ 10,214 Charges 15,399 11,098 4,648 – – 31,145 Cash payments (8,722) (7,237) – (140) – (16,099) Non-cash items – – (4,648) – – (4,648)Balance at December 31, 2009 $ 11,414 $ 9,113 $ – $ 85 $ – $ 20,612
12. shareholders’ equity
Shareholders’ equity consists of the following:
2009 2008
Share capital(i) $ 869,485 $ 800,734
Retained earnings 344,839 314,649
Contributed surplus(i) 53,429 48,117
Subscription receipts(i) – 66,936
Accumulated other comprehensive loss (Note 13) (54,204) (52,331)
Treasury stock(ii) (24,499) (35,135)
$ 1,189,050 $ 1,142,970
(i) On December 16, 2008, the Company issued 7,368,421 units, each unit consisting of one subscription receipt and 0.4 of a common share purchase warrant for net proceeds of $69.1 million. Each whole warrant entitles the holder to purchase one common share at any time until December 16, 2010 at a price of $9.50 per common share. For each subscription receipt, the holder was entitled to receive one common share of the Company on August 4, 2009, or, at the Company’s election, $9.50 in cash. $66.9 million of the proceeds was allocated to the subscription receipts and $2.2 million was recorded in contributed surplus related to the warrants.
On August 4, 2009, the Company settled the subscription receipts issued on December 16, 2008 through the issuance of 7,368,421 shares of the Company. As a result, the $66,936 recorded as subscription receipts was added to share capital.
The 2,947,368 common share purchase warrants issued on December 16, 2008 are still outstanding at December 31, 2009.
(ii) During 2009, the Company repurchased 358,000 common shares (2008: 919,100) through a trust for cash consideration of $3.2 million (2008: $11.3 million) for the purpose of funding grants under the Restricted Share Unit (“RSU”) Plan (Note 14).
During 2009, 1,063,810 common shares were issued from the trust established for the purpose of settling grants under the RSU Plan.
On June 2, 2009, the Company fi led Articles of Amendment to increase its authorized capital by creating an unlimited number of preference shares issuable in one or more series. No preference shares have been issued.
The authorized share capital of Maple Leaf Foods consists of an unlimited number of common shares, an unlimited number of non-voting common shares and an unlimited number of preference shares. As at December 31, 2009, there were
MLF_Financials_ENG.indd 57 16/03/10 8:09 AM
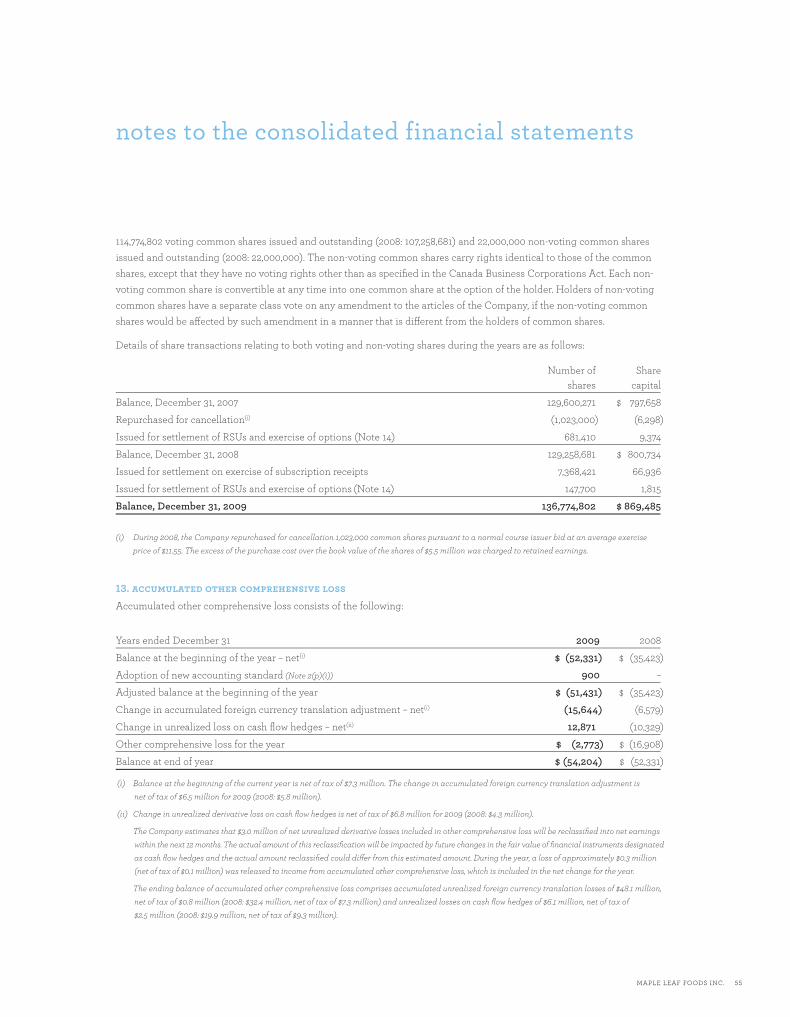
MAPLE LEAF FOODS INC. 55
notes to the consolidated financial statements
114,774,802 voting common shares issued and outstanding (2008: 107,258,681) and 22,000,000 non-voting common shares issued and outstanding (2008: 22,000,000). The non-voting common shares carry rights identical to those of the common shares, except that they have no voting rights other than as specifi ed in the Canada Business Corporations Act. Each non-voting common share is convertible at any time into one common share at the option of the holder. Holders of non-voting common shares have a separate class vote on any amendment to the articles of the Company, if the non-voting common shares would be aff ected by such amendment in a manner that is diff erent from the holders of common shares.
Details of share transactions relating to both voting and non-voting shares during the years are as follows:
Number of Share shares capital
Balance, December 31, 2007 129,600,271 $ 797,658
Repurchased for cancellation(i) (1,023,000) (6,298)
Issued for settlement of RSUs and exercise of options (Note 14) 681,410 9,374
Balance, December 31, 2008 129,258,681 $ 800,734
Issued for settlement on exercise of subscription receipts 7,368,421 66,936
Issued for settlement of RSUs and exercise of options (Note 14) 147,700 1,815
Balance, December 31, 2009 136,774,802 $ 869,485
(i) During 2008, the Company repurchased for cancellation 1,023,000 common shares pursuant to a normal course issuer bid at an average exercise price of $11.55. The excess of the purchase cost over the book value of the shares of $5.5 million was charged to retained earnings.
13. accumulated other comprehensive loss
Accumulated other comprehensive loss consists of the following:
Years ended December 31 2009 2008
Balance at the beginning of the year – net(i) $ (52,331) $ (35,423)
Adoption of new accounting standard (Note 2(p)(i)) 900 –
Adjusted balance at the beginning of the year $ (51,431) $ (35,423)
Change in accumulated foreign currency translation adjustment – net(i) (15,644) (6,579)
Change in unrealized loss on cash fl ow hedges – net(ii) 12,871 (10,329)
Other comprehensive loss for the year $ (2,773) $ (16,908)
Balance at end of year $ (54,204) $ (52,331)
(i) Balance at the beginning of the current year is net of tax of $7.3 million. The change in accumulated foreign currency translation adjustment is net of tax of $6.5 million for 2009 (2008: $5.8 million).
(ii) Change in unrealized derivative loss on cash fl ow hedges is net of tax of $6.8 million for 2009 (2008: $4.3 million).
The Company estimates that $3.0 million of net unrealized derivative losses included in other comprehensive loss will be reclassifi ed into net earnings within the next 12 months. The actual amount of this reclassifi cation will be impacted by future changes in the fair value of fi nancial instruments designated as cash fl ow hedges and the actual amount reclassifi ed could diff er from this estimated amount. During the year, a loss of approximately $0.3 million (net of tax of $0.1 million) was released to income from accumulated other comprehensive loss, which is included in the net change for the year.
The ending balance of accumulated other comprehensive loss comprises accumulated unrealized foreign currency translation losses of $48.1 million, net of tax of $0.8 million (2008: $32.4 million, net of tax of $7.3 million) and unrealized losses on cash fl ow hedges of $6.1 million, net of tax of $2.5 million (2008: $19.9 million, net of tax of $9.3 million).
MLF_Financials_ENG.indd 58 16/03/10 8:09 AM
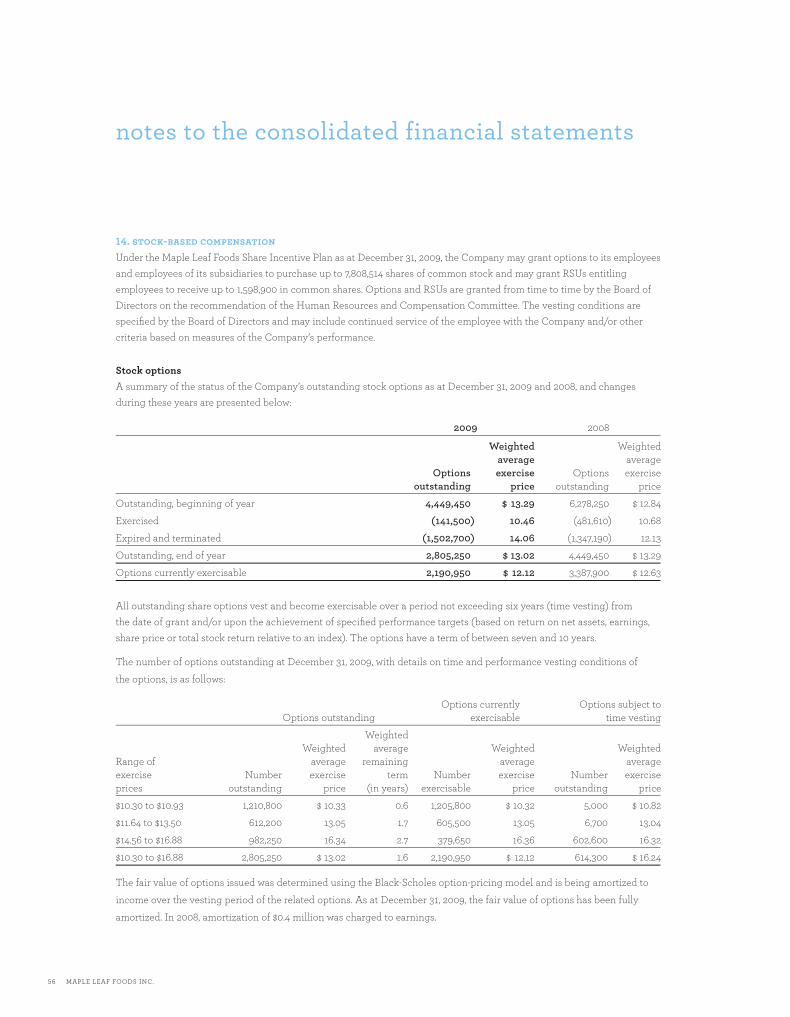
56 MAPLE LEAF FOODS INC.
notes to the consolidated financial statements
14. stock-based compensationUnder the Maple Leaf Foods Share Incentive Plan as at December 31, 2009, the Company may grant options to its employees and employees of its subsidiaries to purchase up to 7,808,514 shares of common stock and may grant RSUs entitling employees to receive up to 1,598,900 in common shares. Options and RSUs are granted from time to time by the Board of Directors on the recommendation of the Human Resources and Compensation Committee. The vesting conditions are specifi ed by the Board of Directors and may include continued service of the employee with the Company and/or other criteria based on measures of the Company’s performance.
Stock optionsA summary of the status of the Company’s outstanding stock options as at December 31, 2009 and 2008, and changes during these years are presented below:
2009 2008
Weighted Weighted average average Options exercise Options exercise outstanding price outstanding price
Outstanding, beginning of year 4,449,450 $ 13.29 6,278,250 $ 12.84
Exercised (141,500) 10.46 (481,610) 10.68
Expired and terminated (1,502,700) 14.06 (1,347,190) 12.13
Outstanding, end of year 2,805,250 $ 13.02 4,449,450 $ 13.29
Options currently exercisable 2,190,950 $ 12.12 3,387,900 $ 12.63
All outstanding share options vest and become exercisable over a period not exceeding six years (time vesting) from the date of grant and/or upon the achievement of specifi ed performance targets (based on return on net assets, earnings, share price or total stock return relative to an index). The options have a term of between seven and 10 years.
The number of options outstanding at December 31, 2009, with details on time and performance vesting conditions of
the options, is as follows:
Options currently Options subject to Options outstanding exercisable time vesting
Weighted Weighted average Weighted Weighted Range of average remaining average averageexercise Number exercise term Number exercise Number exercise prices outstanding price (in years) exercisable price outstanding price
$10.30 to $10.93 1,210,800 $ 10.33 0.6 1,205,800 $ 10.32 5,000 $ 10.82
$11.64 to $13.50 612,200 13.05 1.7 605,500 13.05 6,700 13.04
$14.56 to $16.88 982,250 16.34 2.7 379,650 16.36 602,600 16.32
$10.30 to $16.88 2,805,250 $ 13.02 1.6 2,190,950 $ 12.12 614,300 $ 16.24
The fair value of options issued was determined using the Black-Scholes option-pricing model and is being amortized to
income over the vesting period of the related options. As at December 31, 2009, the fair value of options has been fully
amortized. In 2008, amortization of $0.4 million was charged to earnings.
MLF_Financials_ENG.indd 59 16/03/10 8:09 AM
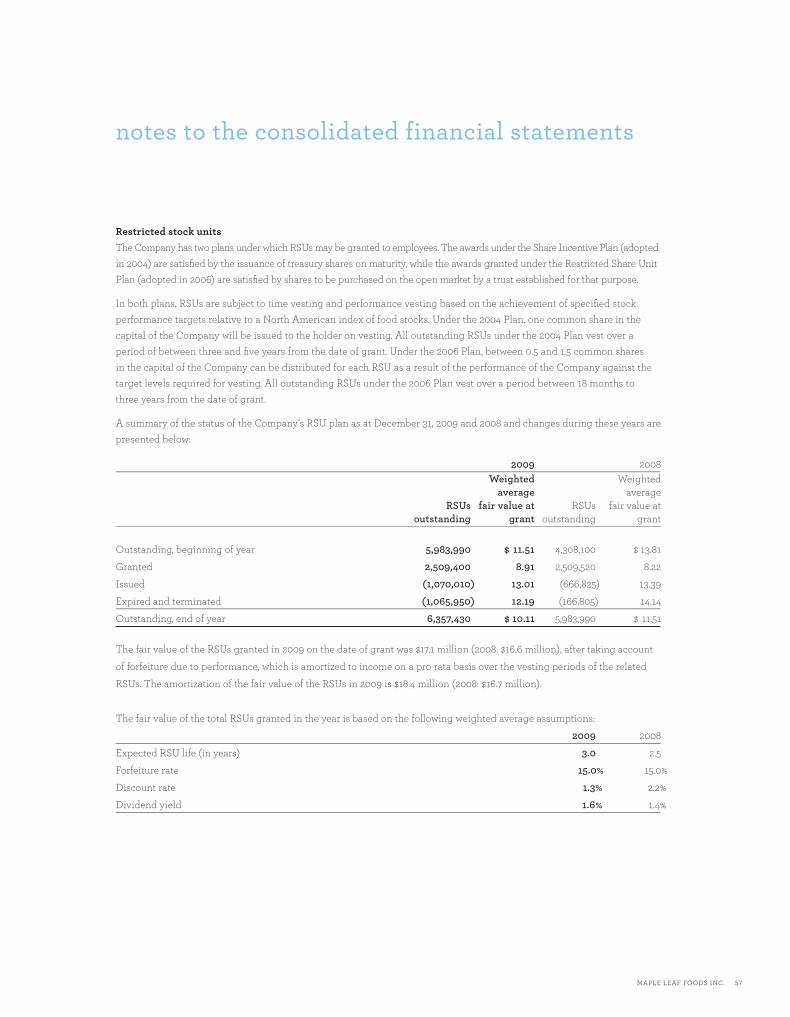
MAPLE LEAF FOODS INC. 57
notes to the consolidated financial statements
Restricted stock unitsThe Company has two plans under which RSUs may be granted to employees. The awards under the Share Incentive Plan (adopted in 2004) are satisfi ed by the issuance of treasury shares on maturity, while the awards granted under the Restricted Share Unit Plan (adopted in 2006) are satisfi ed by shares to be purchased on the open market by a trust established for that purpose.
In both plans, RSUs are subject to time vesting and performance vesting based on the achievement of specifi ed stock performance targets relative to a North American index of food stocks. Under the 2004 Plan, one common share in the capital of the Company will be issued to the holder on vesting. All outstanding RSUs under the 2004 Plan vest over a period of between three and fi ve years from the date of grant. Under the 2006 Plan, between 0.5 and 1.5 common shares in the capital of the Company can be distributed for each RSU as a result of the performance of the Company against the target levels required for vesting. All outstanding RSUs under the 2006 Plan vest over a period between 18 months to three years from the date of grant.
A summary of the status of the Company’s RSU plan as at December 31, 2009 and 2008 and changes during these years are presented below:
2009 2008Weighted Weighted
average averageRSUs fair value at RSUs fair value at
outstanding grant outstanding grant
Outstanding, beginning of year 5,983,990 $ 11.51 4,308,100 $ 13.81
Granted 2,509,400 8.91 2,509,520 8.22
Issued (1,070,010) 13.01 (666,825) 13.39
Expired and terminated (1,065,950) 12.19 (166,805) 14.14
Outstanding, end of year 6,357,430 $ 10.11 5,983,990 $ 11.51
The fair value of the RSUs granted in 2009 on the date of grant was $17.1 million (2008: $16.6 million), after taking account
of forfeiture due to performance, which is amortized to income on a pro rata basis over the vesting periods of the related
RSUs. The amortization of the fair value of the RSUs in 2009 is $18.4 million (2008: $16.7 million).
The fair value of the total RSUs granted in the year is based on the following weighted average assumptions:
2009 2008
Expected RSU life (in years) 3.0 2.5
Forfeiture rate 15.0% 15.0%
Discount rate 1.3% 2.2%
Dividend yield 1.6% 1.4%
MLF_Financials_ENG.indd 60 16/03/10 8:09 AM
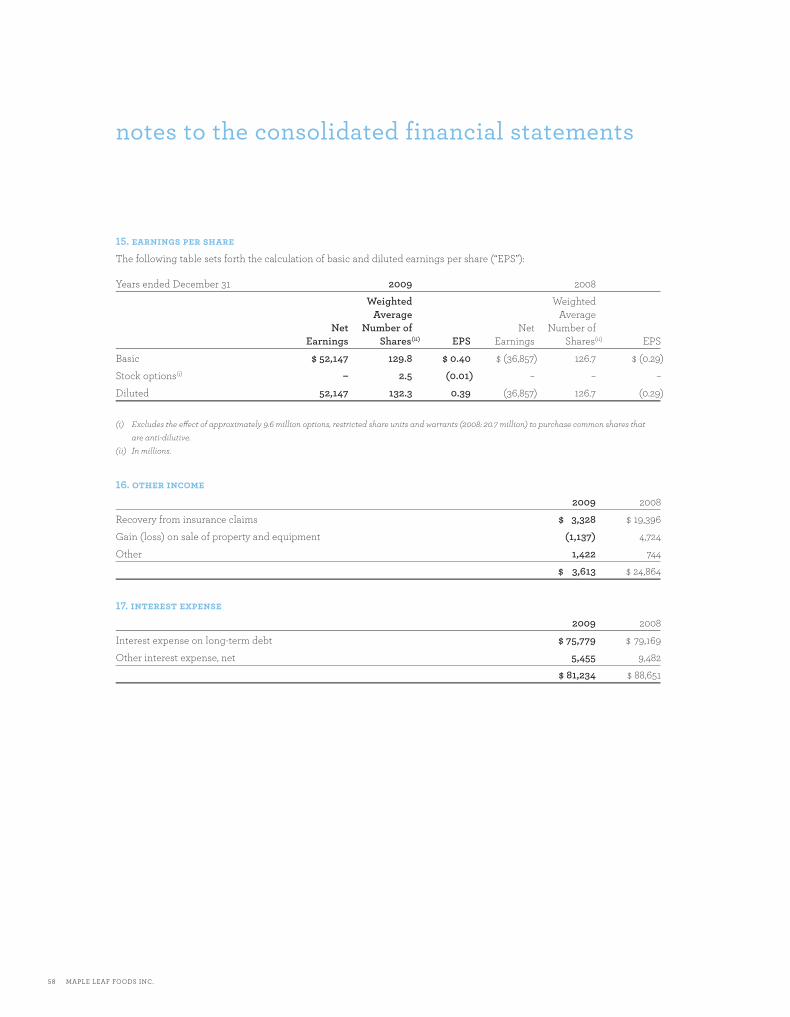
58 MAPLE LEAF FOODS INC.
notes to the consolidated financial statements
15. earnings per share
The following table sets forth the calculation of basic and diluted earnings per share (“EPS”):
Years ended December 31 2009 2008
Weighted Weighted Average Average Net Number of Net Number of Earnings Shares(ii) EPS Earnings Shares(ii) EPS
Basic $ 52,147 129.8 $ 0.40 $ (36,857) 126.7 $ (0.29)
Stock options(i) – 2.5 (0.01) – – –
Diluted 52,147 132.3 0.39 (36,857) 126.7 (0.29)
(i) Excludes the eff ect of approximately 9.6 million options, restricted share units and warrants (2008: 20.7 million) to purchase common shares that are anti-dilutive.
(ii) In millions.
16. other income
2009 2008
Recovery from insurance claims $ 3,328 $ 19,396
Gain (loss) on sale of property and equipment (1,137) 4,724
Other 1,422 744
$ 3,613 $ 24,864
17. interest expense
2009 2008
Interest expense on long-term debt $ 75,779 $ 79,169
Other interest expense, net 5,455 9,482
$ 81,234 $ 88,651
MLF_Financials_ENG.indd 61 16/03/10 8:09 AM
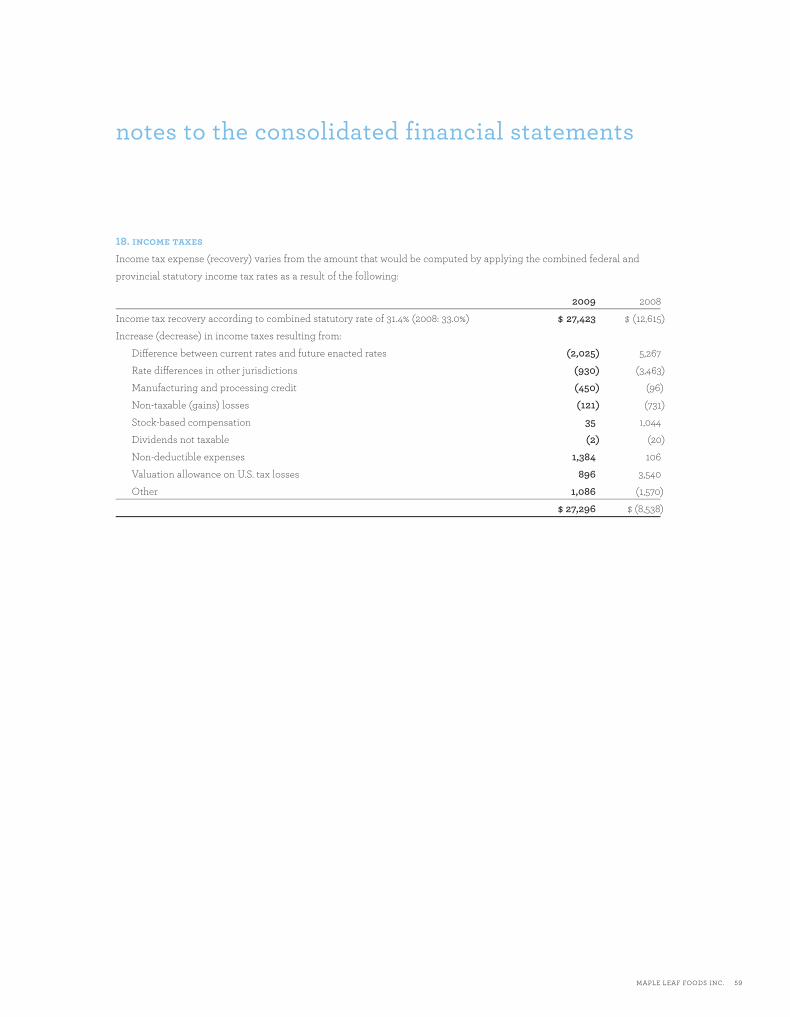
MAPLE LEAF FOODS INC. 59
notes to the consolidated financial statements
18. income taxes
Income tax expense (recovery) varies from the amount that would be computed by applying the combined federal and
provincial statutory income tax rates as a result of the following:
2009 2008
Income tax recovery according to combined statutory rate of 31.4% (2008: 33.0%) $ 27,423 $ (12,615)
Increase (decrease) in income taxes resulting from:
Diff erence between current rates and future enacted rates (2,025) 5,267
Rate diff erences in other jurisdictions (930) (3,463)
Manufacturing and processing credit (450) (96)
Non-taxable (gains) losses (121) (731)
Stock-based compensation 35 1,044
Dividends not taxable (2) (20)
Non-deductible expenses 1,384 106
Valuation allowance on U.S. tax losses 896 3,540
Other 1,086 (1,570)
$ 27,296 $ (8,538)
MLF_Financials_ENG.indd 62 16/03/10 8:09 AM
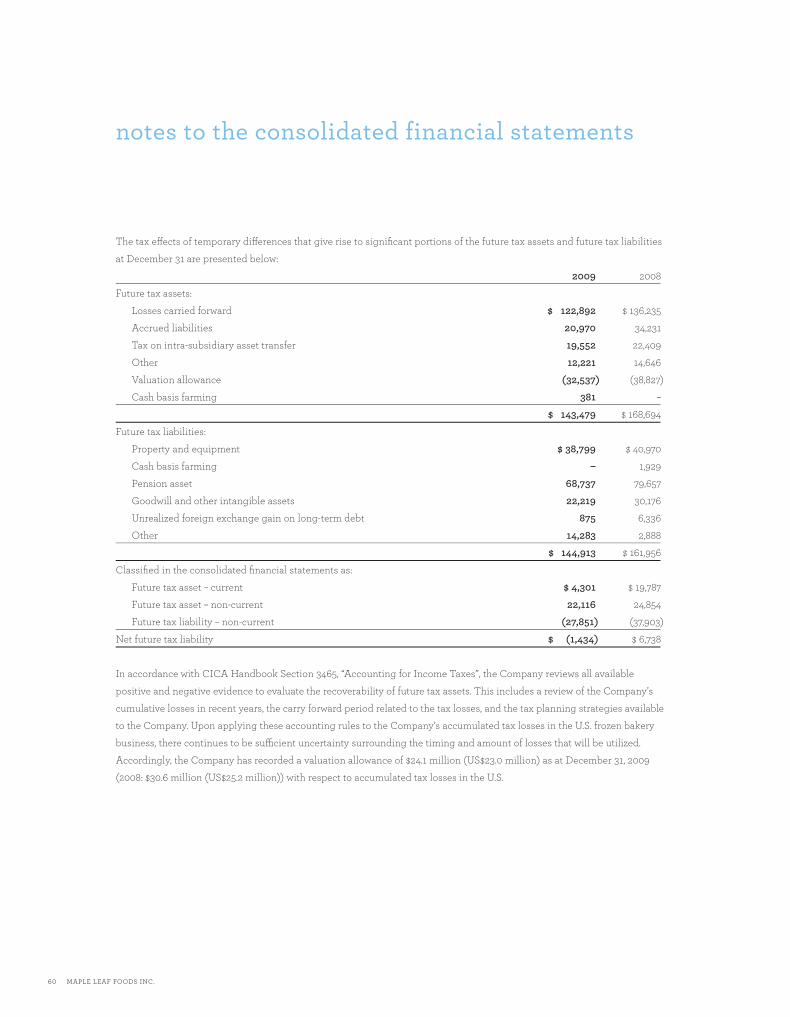
60 MAPLE LEAF FOODS INC.
notes to the consolidated financial statements
The tax eff ects of temporary diff erences that give rise to signifi cant portions of the future tax assets and future tax liabilities
at December 31 are presented below:
2009 2008
Future tax assets:
Losses carried forward $ 122,892 $ 136,235
Accrued liabilities 20,970 34,231
Tax on intra-subsidiary asset transfer 19,552 22,409
Other 12,221 14,646
Valuation allowance (32,537) (38,827)
Cash basis farming 381 –
$ 143,479 $ 168,694
Future tax liabilities:
Property and equipment $ 38,799 $ 40,970
Cash basis farming – 1,929
Pension asset 68,737 79,657
Goodwill and other intangible assets 22,219 30,176
Unrealized foreign exchange gain on long-term debt 875 6,336
Other 14,283 2,888
$ 144,913 $ 161,956
Classifi ed in the consolidated fi nancial statements as:
Future tax asset – current $ 4,301 $ 19,787
Future tax asset – non-current 22,116 24,854
Future tax liability – non-current (27,851) (37,903)
Net future tax liability $ (1,434) $ 6,738
In accordance with CICA Handbook Section 3465, “Accounting for Income Taxes”, the Company reviews all available
positive and negative evidence to evaluate the recoverability of future tax assets. This includes a review of the Company’s
cumulative losses in recent years, the carry forward period related to the tax losses, and the tax planning strategies available
to the Company. Upon applying these accounting rules to the Company’s accumulated tax losses in the U.S. frozen bakery
business, there continues to be suffi cient uncertainty surrounding the timing and amount of losses that will be utilized.
Accordingly, the Company has recorded a valuation allowance of $24.1 million (US$23.0 million) as at December 31, 2009
(2008: $30.6 million (US$25.2 million)) with respect to accumulated tax losses in the U.S.
MLF_Financials_ENG.indd 63 16/03/10 8:09 AM
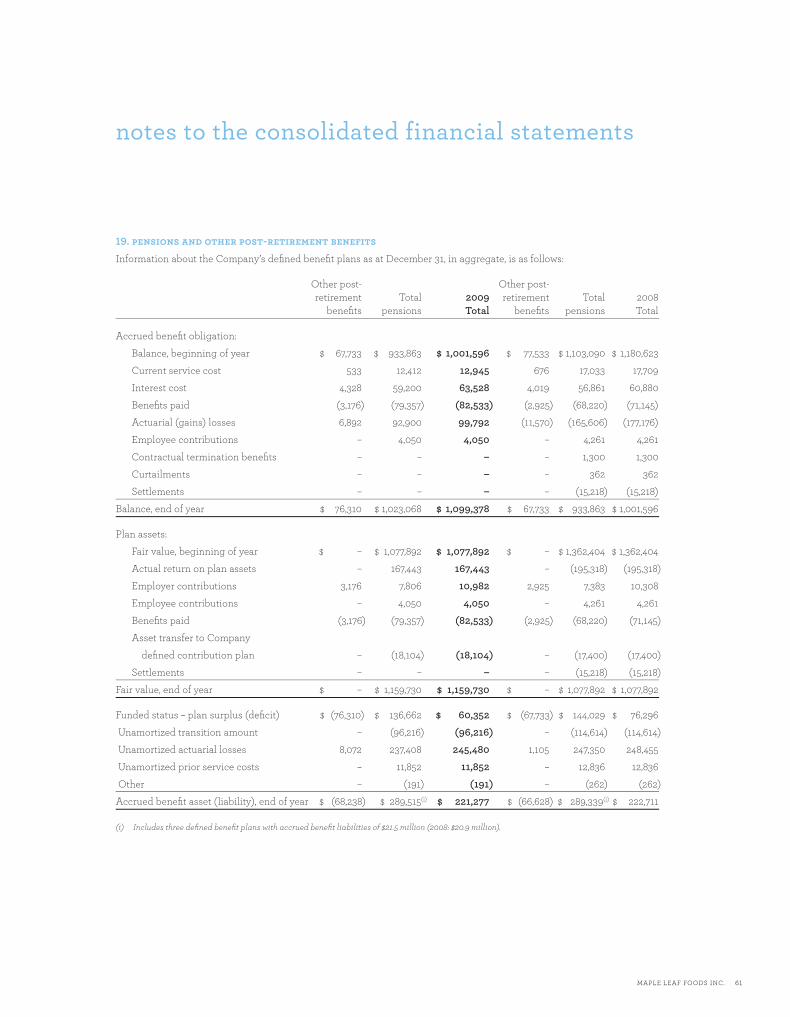
MAPLE LEAF FOODS INC. 61
notes to the consolidated financial statements
19. pensions and other post-retirement benefi ts
Information about the Company’s defi ned benefi t plans as at December 31, in aggregate, is as follows:
Other post- Other post- retirement Total 2009 retirement Total 2008 benefi ts pensions Total benefi ts pensions Total
Accrued benefi t obligation:
Balance, beginning of year $ 67,733 $ 933,863 $ 1,001,596 $ 77,533 $ 1,103,090 $ 1,180,623
Current service cost 533 12,412 12,945 676 17,033 17,709
Interest cost 4,328 59,200 63,528 4,019 56,861 60,880
Benefi ts paid (3,176) (79,357) (82,533) (2,925) (68,220) (71,145)
Actuarial (gains) losses 6,892 92,900 99,792 (11,570) (165,606) (177,176)
Employee contributions – 4,050 4,050 – 4,261 4,261
Contractual termination benefi ts – – – – 1,300 1,300
Curtailments – – – – 362 362
Settlements – – – – (15,218) (15,218)
Balance, end of year $ 76,310 $ 1,023,068 $ 1,099,378 $ 67,733 $ 933,863 $ 1,001,596
Plan assets:
Fair value, beginning of year $ – $ 1,077,892 $ 1,077,892 $ – $ 1,362,404 $ 1,362,404
Actual return on plan assets – 167,443 167,443 – (195,318) (195,318)
Employer contributions 3,176 7,806 10,982 2,925 7,383 10,308
Employee contributions – 4,050 4,050 – 4,261 4,261
Benefi ts paid (3,176) (79,357) (82,533) (2,925) (68,220) (71,145)
Asset transfer to Company
defi ned contribution plan – (18,104) (18,104) – (17,400) (17,400)
Settlements – – – – (15,218) (15,218)
Fair value, end of year $ – $ 1,159,730 $ 1,159,730 $ – $ 1,077,892 $ 1,077,892
Funded status – plan surplus (defi cit) $ (76,310) $ 136,662 $ 60,352 $ (67,733) $ 144,029 $ 76,296
Unamortized transition amount – (96,216) (96,216) – (114,614) (114,614)
Unamortized actuarial losses 8,072 237,408 245,480 1,105 247,350 248,455
Unamortized prior service costs – 11,852 11,852 – 12,836 12,836
Other – (191) (191) – (262) (262)
Accrued benefi t asset (liability), end of year $ (68,238) $ 289,515(i) $ 221,277 $ (66,628) $ 289,339(i) $ 222,711
(i) Includes three defi ned benefi t plans with accrued benefi t liabilities of $21.5 million (2008: $20.9 million).
MLF_Financials_ENG.indd 64 16/03/10 8:09 AM

62 MAPLE LEAF FOODS INC.
notes to the consolidated financial statements
Amounts recognized in the consolidated balance sheet consist of:
2009 2008
Other long-term assets $ 322,656 $ 320,574
Accounts payable and accrued charges 5,250 4,712
Other long-term liabilities 96,129 93,151
Pension benefi t expense (income):
2009 2008
Current service cost – defi ned benefi t $ 12,412 $ 17,056
Current service cost – defi ned contribution 28,185 26,197
Interest cost 59,200 56,861
Actual return on plan assets (167,443) 195,318
Diff erence between actual and expected return 92,175 (294,202)
Actuarial losses (gains) recognized 92,900 (165,606)
Diff erence between actual and recognized actuarial
(gains) losses in the year (82,233) 167,401
Amortization of transitional amount (18,398) (18,580)
Diff erence between amortization of prior service costs and
actual plan amendments in the year 984 735
Plan amendments – 249
Curtailment loss – 512
Contractual termination benefi ts – 1,300
Settlement loss – 1,300
Net benefi t plan expense (income) $ 17,782 $ (11,459)
The signifi cant actuarial assumptions adopted in measuring the Company’s accrued benefi t obligations are as follows:
2009 2008
Discount rate used to calculate net benefi t plan expense 6.50% 5.25%
Discount rate used to calculate year end benefi t obligation 5.75% 6.50%
Expected long-term rate of return on plan assets 7.25% 7.50%
Rate of compensation increase 3.50% 3.50%
MLF_Financials_ENG.indd 65 16/03/10 8:09 AM
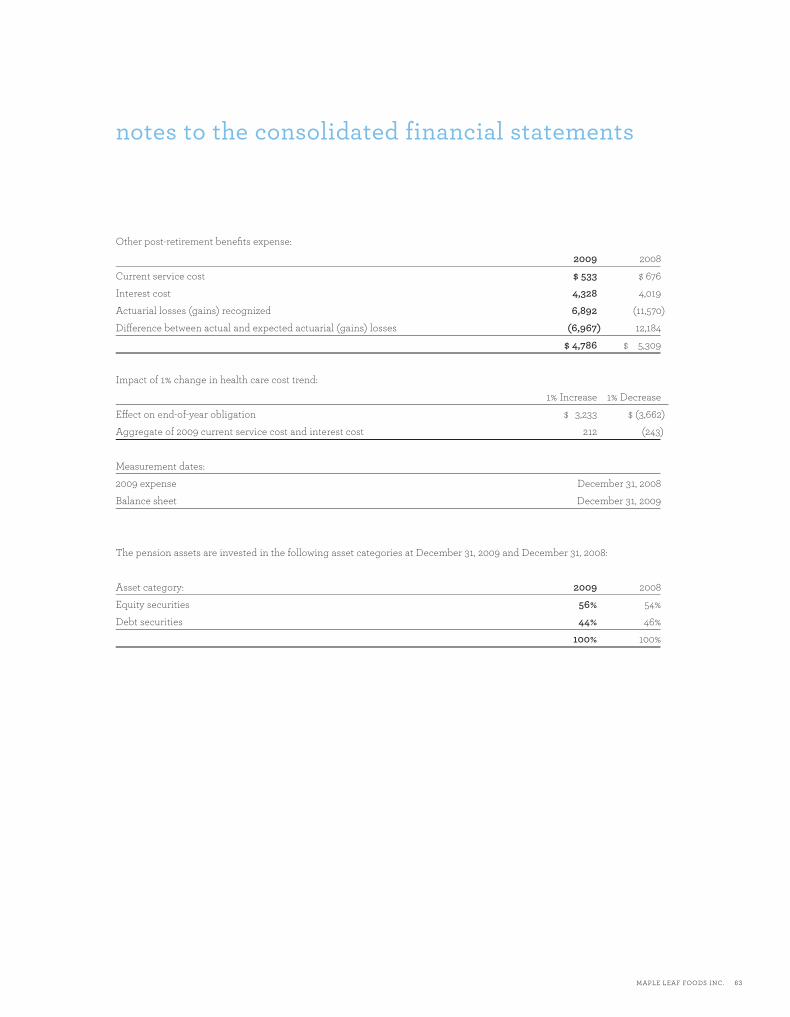
MAPLE LEAF FOODS INC. 63
notes to the consolidated financial statements
Other post-retirement benefi ts expense:
2009 2008
Current service cost $ 533 $ 676
Interest cost 4,328 4,019
Actuarial losses (gains) recognized 6,892 (11,570)
Diff erence between actual and expected actuarial (gains) losses (6,967) 12,184
$ 4,786 $ 5,309
Impact of 1% change in health care cost trend:
1% Increase 1% Decrease
Eff ect on end-of-year obligation $ 3,233 $ (3,662)
Aggregate of 2009 current service cost and interest cost 212 (243)
Measurement dates:
2009 expense December 31, 2008
Balance sheet December 31, 2009
The pension assets are invested in the following asset categories at December 31, 2009 and December 31, 2008:
Asset category: 2009 2008
Equity securities 56% 54%
Debt securities 44% 46%
100% 100%
MLF_Financials_ENG.indd 66 16/03/10 8:09 AM

64 MAPLE LEAF FOODS INC.
notes to the consolidated financial statements
20. acquisitions and divestitures(a) In December 2008, the Company disposed of its hog genetics business. The loss on this disposal is included in restructuring and other related costs (Note 11).
(b) On January 29, 2008, the Company acquired the shares of Aliments Martel Inc. (“Martel”), a manufacturer and distributor of sandwiches, meals and sweet goods based in Quebec for an initial purchase price of $44.6 million plus contingent consideration of up to $22.6 million, based on fi nancial performance over three years post-acquisition. During the fi rst quarter of 2009, the Company fi nalized the purchase equation, allocating $15.4 million to the identifi able net tangible assets of Martel at the acquisition date and $29.2 million to goodwill and intangible assets. The acquired intangible assets included $1.5 million allocated to trademarks that are being amortized on a straight-line basis over ten years and $1.7 million allocated to customer relationships that are being amortized on a straight-line basis over 20 years. No amounts have been paid to the vendors in respect of contingent consideration.
(c) On July 17, 2008, the Company purchased 458,000 additional shares in Canada Bread Company, Limited (“Canada Bread”) for cash consideration of $32.6 million, increasing the Company’s ownership interest in Canada Bread from 88.0% to 89.8%. During the second quarter of 2009, the Company fi nalized the purchase equation for these purchases, allocating $11.4 million of the purchase price to the net tangible assets of Canada Bread at the acquisition date, $1.1 million to intangible assets and $20.1 million to goodwill.
(d) On January 14, 2008, the Company purchased the assets of Central By-Products (“CBP”), a rendering business located near London, Ontario for $18.1 million. During the fi rst quarter of 2009, the Company fi nalized the purchase price equation and allocated $6.0 million to the net identifi able assets of CBP at the acquisition date and $12.1 million to goodwill.
(e) In the fi rst quarter of 2008, the Company sold its Ontario hog production operations and all of its wholly-owned production investments in Alberta. The loss on these disposals had previously been recognized in the fourth quarter of 2007.
Details of net assets acquired and purchase adjustments made in 2009 and 2008 are as follows:
2009 2008
Net working capital $ (350) $ 2,999
Future tax assets – non-current (13) 164
Property and equipment (2,445) 21,128
Intangible assets 3,200 6,312
Goodwill (6) 34,607
Future tax liability – non-current (63) (1,800)
Other long-term liabilities – (448)
Total purchase cost $ 323 $ 62,962
21. contingencies and commitments(a) The Company has been named as defendant in several legal actions and is subject to various risks and contingencies arising in the normal course of business. Management is of the opinion that the outcome of these uncertainties will not have a material adverse eff ect on the Company’s fi nancial position.
(b) In the normal course of business, the Company and its subsidiaries enter into sales commitments with customers, and
MLF_Financials_ENG.indd 67 16/03/10 8:09 AM

MAPLE LEAF FOODS INC. 65
notes to the consolidated financial statements
purchase commitments with suppliers. These commitments are for varying terms and can provide for fi xed or variable prices. With respect to certain of its contracts, the Company has the right to acquire at fair value, and the suppliers have the right to sell back to the Company, certain assets which have an estimated fair value of $12.3 million (2008: $9.3 million). The Company believes that these contracts serve to reduce risk, and does not anticipate that losses will be incurred on these contracts.
(c) The Company has operating lease, rent and other commitments that require minimum annual payments as follows:
2010 $ 64,620
2011 51,897
2012 44,070
2013 37,225
2014 30,001
Thereafter 117,150
$ 344,963
22. supplemental cash fl ow information
2009 2008
Net interest paid $ 76,841 $ 92,079
Net income taxes paid 28,037 36,762
MLF_Financials_ENG.indd 68 16/03/10 8:09 AM
66 MAPLE LEAF FOODS INC.
notes to the consolidated financial statements
23. related party transactionOn December 16, 2008, the Company issued 7,368,421 equity units each consisting of one subscription receipt and 0.4 common share purchase warrants for net proceeds of $69.1 million. Ontario Teachers Pension Plan Board, a related shareholder, subscribed for 5,484,784 units and McCain Capital Corporation, a related shareholder, subscribed for 1,694,737 units. The subscription receipts were settled on August 4, 2009 (Note 12).
24. subsequent event
On February 23, 2010, the Company declared a dividend of $0.04 per share, payable on March 31, 2010 to shareholders
of record as of March 10, 2010.
25. segmented fi nancial informationThe Company’s operations are classifi ed into the following three primary business segments, which have been used for the operating segment disclosures for all years presented:
(a) The Meat Products Group comprises value-added processed packaged meats; chilled meal entrees and lunch kits; value-added pork, poultry and turkey products.
(b) The Agribusiness Group includes the Company’s swine production and animal by-products recycling operations.
(c) The Bakery Products Group comprises the Company’s 89.8% ownership in Canada Bread, a producer of fresh and frozen par-baked bakery products including breads, rolls, bagels, artisan and sweet goods, sandwiches and fresh pasta and sauces.
MLF_Financials_ENG.indd 69 16/03/10 8:09 AM
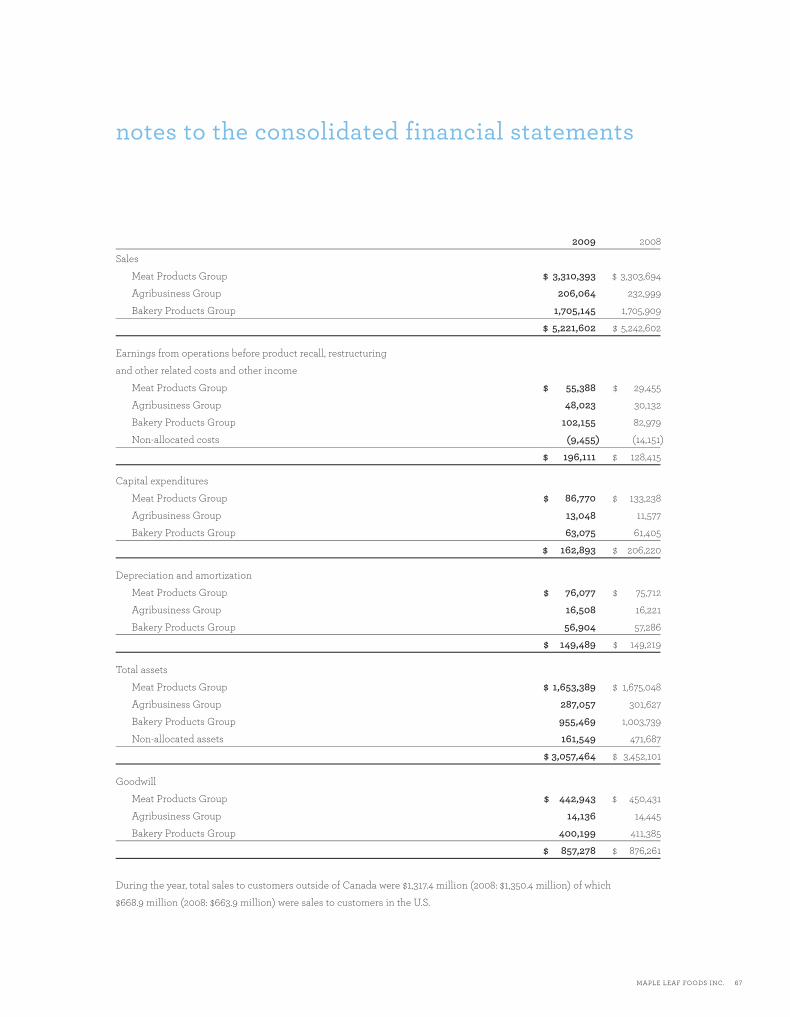
MAPLE LEAF FOODS INC. 67
notes to the consolidated financial statements
2009 2008
Sales
Meat Products Group $ 3,310,393 $ 3,303,694
Agribusiness Group 206,064 232,999
Bakery Products Group 1,705,145 1,705,909
$ 5,221,602 $ 5,242,602
Earnings from operations before product recall, restructuring
and other related costs and other income
Meat Products Group $ 55,388 $ 29,455
Agribusiness Group 48,023 30,132
Bakery Products Group 102,155 82,979
Non-allocated costs (9,455) (14,151)
$ 196,111 $ 128,415
Capital expenditures
Meat Products Group $ 86,770 $ 133,238
Agribusiness Group 13,048 11,577
Bakery Products Group 63,075 61,405
$ 162,893 $ 206,220
Depreciation and amortization
Meat Products Group $ 76,077 $ 75,712
Agribusiness Group 16,508 16,221
Bakery Products Group 56,904 57,286
$ 149,489 $ 149,219
Total assets
Meat Products Group $ 1,653,389 $ 1,675,048
Agribusiness Group 287,057 301,627
Bakery Products Group 955,469 1,003,739
Non-allocated assets 161,549 471,687
$ 3,057,464 $ 3,452,101
Goodwill
Meat Products Group $ 442,943 $ 450,431
Agribusiness Group 14,136 14,445
Bakery Products Group 400,199 411,385
$ 857,278 $ 876,261
During the year, total sales to customers outside of Canada were $1,317.4 million (2008: $1,350.4 million) of which
$668.9 million (2008: $663.9 million) were sales to customers in the U.S.
MLF_Financials_ENG.indd 70 16/03/10 8:09 AM
68 MAPLE LEAF FOODS INC.
corporate governance and board of directors
corporate governanceThe Board of Directors and Management of the Company are committed to maintaining a high standard of corporate governance. The Board has responsibility for the overall stewardship of the Company and discharges such responsibility by reviewing, discussing and approving the Company’s strategic planning and organizational structure and supervising management with a view to preserving and enhancing the underlying value of the Company. Management of the business within this process and structure is the responsibility of the Chief Executive Offi cer and senior management.
The Board has adopted guidelines to assist it in meeting its corporate governance responsibilities. The role of the Board, the Chief Executive Offi cer, the Chairman, Lead Director and the individual committees are clearly delineated. Together with the Chairman, Lead Director and the Corporate Governance Committee, the Board assesses its processes and practices regularly to ensure its governance objectives are met.
composition of the board of directorsThe Board is comprised of experienced directors with a diversity of relevant skills and competencies. The Board of Directors has assessed each of the Company’s 11 non-management directors to be independent.
A more comprehensive analysis of the Company’s approach to corporate governance matters is included in the Management Proxy Circular for the April 29, 2010 annual meeting of shareholders.
board of directors
W. Geoffrey BeattiePresident and CEO, The Woodbridge Company (Investment company)Mr. Beattie, 50, is the Chief Executive Offi cer of The Woodbridge Company Limited (1998), the Thomson family’s principal holding company, Deputy Chairman of Thomson Reuters and Chairman of CTVglobemedia Inc. Mr. Beattie is a director of The Royal Bank of Canada and General Electric Company. Mr. Beattie is also a trustee of the University Health Network.
director since: 2008
John L. Bragg, O.C.Chairman, President and Co-CEO, Oxford Frozen Foods (Food manufacturing)Mr. Bragg, 69, founded Oxford Frozen Foods, an international frozen foods supplier, in 1968 and Bragg Communications, Canada’s fi fth largest cable television provider and a major Maritimes Internet and wireline telephone service provider, in 1970. Mr. Bragg is an Offi cer of the Order of Canada. Mr. Bragg was appointed a Canadian Business Hall of Fame Laureate in 2003, and was one of the original four members inducted into the Nova Scotia Business Hall of Fame in 1993.
director since: 2008
Purdy Crawford, C.C.Counsel, Osler, Hoskin & Harcourt (Law fi rm)Mr. Crawford, 78, is a director of several Canadian companies. From 1986 to 1995 he was CEO of Imasco, and from 1995 to 2000 he was the non-Executive Chairman of Imasco Limited and CT Financial Services. Mr. Crawford is a Companion of the Order of Canada and a member of the Canadian Business Hall of Fame.
director since: 1995
MLF_Financials_ENG.indd 71 16/03/10 8:09 AM
MAPLE LEAF FOODS INC. 69
corporate governance and board of directors
Jeffrey GandzProfessor, Managing Director – Program Design, Richard Ivey School of Business, University of Western OntarioDr. Gandz, 65, has been a consultant for many Canadian and multinational corporations and government ministries, and is the author of several books, many articles and government reports on a variety of subjects, including leadership and organizational eff ectiveness.
director since: 1999
James F. HankinsonCorporate DirectorMr. Hankinson, 66, is a director of several Canadian companies. Mr. Hankinson served as President and Chief Executive Offi cer of Ontario Power Generation from 2005 until his retirement in 2009. He was President and Chief Operating Offi cer of Canadian Pacifi c Limited until 1995, and President and Chief Executive Offi cer of New Brunswick Power Corporation until 2002.
director since: 1995
Chaviva M. Hošek, O.C.President and Chief Executive Offi cer, The Canadian Institute for Advanced Research (Research institute)Dr. Hošek, 63, received her Ph.D. from Harvard University in 1973. She was Director of Policy and Research from 1993 to 2000 in the Prime Minister’s Offi ce. Her career has included a term as Minister of Housing for the Province of Ontario and a 13-year period as an academic at the University of Toronto. Dr. Hošek serves as a director of the Central European University and Great West Lifeco.
director since: 2002
Wayne A. KozunSenior Vice-President, Public Equities, Ontario Teachers’ Pension Plan (Public sector pension fund)Mr. Kozun, 44, leads the team that oversees the Teachers’ actively-managed public equities portfolios, including relationship investing, totalling more than $29 billion. Mr. Kozun joined Teachers’ in 1995 and has risen steadily through positions of growing responsibility, most recently as Vice-President, Tactical Asset Allocation. Mr. Kozun has completed the Directors Education Program of the Institute of Corporate Directors and his ICD.D designation is pending.
director since: 2009.
Claude R. Lamoureux, O.C.Corporate DirectorMr. Lamoureux, 67, was Chief Executive Offi cer of the Ontario Teachers’ Pension Plan until his retirement in 2007. He was appointed to the position in 1990, when the Ontario government established the new independent corporation to replace the Ontario Teachers’ Superannuation Fund. An actuary by profession, Mr. Lamoureux joined Teachers’ from Metropolitan Life, where he had a successful career in their New York and Ottawa offi ces. Mr. Lamoureux is an Offi cer of the Order of Canada.
director since: 2008
G. Wallace F. McCain, C.C.Chairman, Maple Leaf Foods Inc.Mr. McCain, 79, was appointed Chairman following the acquisition of the Company in April 1995. Mr. McCain co-founded McCain Foods Limited in 1956 which has grown to become one of the largest frozen food companies in the world. Mr. McCain was President and Co-Chief Executive Offi cer of McCain Foods Limited until 1994 and is currently its Vice-Chairman and director of other associated companies within the McCain Foods Group. Mr. McCain is a Companion of the Order of Canada.
director since: 1995
MLF_Financials_ENG.indd 72 16/03/10 8:09 AM

70 MAPLE LEAF FOODS INC.
corporate governance and board of directors
J. Scott McCainPresident and Chief Operating Offi cer, Agribusiness Group, Maple Leaf Foods Inc.Before joining Maple Leaf Foods Inc. in April 1995, Mr. McCain was Vice-President for Production of McCain Foods Limited in Canada, a company he joined in 1978 and where he held progressively senior positions in manufacturing and operations. He is a director of Canada Bread Company, Limited and McCain Capital Corporation. Mr. McCain, 53, is a director of McCain Foods Group.
director since: 1995
Michael H. McCainPresident and Chief Executive Offi cer, Maple Leaf Foods Inc.Mr. McCain, 51, joined Maple Leaf Foods Inc. in April 1995 as President and Chief Operating Offi cer and was appointed its Chief Executive Offi cer in 1999. Prior to joining Maple Leaf Foods, Mr. McCain spent 16 years with McCain Foods Limited in Canada and the United States. He is the Chairman and director of Canada Bread Company, Limited, a director of McCain Foods Group Ltd., the American Meat Institute, and Royal Bank of Canada. He is a past director of American Frozen Food Institute and Bombardier Inc.
director since: 1995
Diane E. McGarryCorporate DirectorMs. McGarry, 60, has over 30 years’ experience with Xerox including fi ve years in Canada as Chairman, President and Chief Executive Offi cer of Xerox Canada from 1993 to 1998. Prior to retiring in 2005, Ms. McGarry held the position of Chief Marketing Offi cer, Xerox Corporation.
director since: 2005
Gordon RitchiePrincipal Advisor, Hill & Knowlton Canada (Government and public relations company)Mr. Ritchie, 66, is also Chief Executive Offi cer of Strategico Inc. and has been a director of a number of leading Canadian corporations. Mr. Ritchie had 22 years of distinguished public service. As Ambassador for Trade Negotiations, Mr. Ritchie was one of the principal architects of the Canada/United States Free Trade Agreement.
director since: 1995
William T. RoyanVice President, Relationship Investing, Ontario Teachers’ Pension Plan (Public sector pension fund)
Mr. Royan, 42, joined Ontario Teachers’ in January 2008 as Vice President, Relationship Investing where he is responsible for making large-scale, long-term strategic investments in companies across the globe. He joined Ontario Teachers’ from Lehman Brothers in New York, where he held senior roles in its mergers group and its equity strategies unit, Lehman’s principal investing arm. director since: 2009
Note: Ages of the Board of Directors provided as at March 2010.
MLF_Financials_ENG.indd 73 16/03/10 8:09 AM
MAPLE LEAF FOODS INC. 71
senior management and officers
committees of the board of directors
audit committeeD.E. McGarry, Chair J.L. BraggJ.F. HankinsonC.R. LamoureuxW.T. Royan
corporate governance committeeJ.F. Hankinson, ChairmanW.G. BeattieP. CrawfordC.M. HošekW.A. Kozun
environment, health and safety committeeJ. Gandz, ChairmanJ.L. BraggC.M. HošekW.A. KozunD.E. McGarryG. Ritchie
human resources and compensation committeeG. Ritchie, ChairmanW.G. BeattieP. CrawfordJ. GandzC.R. LamoureuxW.T. Royan
Corporate Council
G. Wallace F. McCainChairman
Michael H. McCainPresident and Chief Executive Offi cer
J. Scott McCainPresident and Chief Operating Offi cer, Agribusiness Group
Richard A. LanChief Operating Offi cer, Food Group
Michael H. VelsExecutive Vice-President and Chief Financial Offi cer
Douglas W. DoddsChief Strategy Offi cer
Wayne JohnsonSenior Vice-President and Chief Human Resources Offi cer
Rocco CappuccittiSenior Vice-President, Transactions & Administration and Corporate Secretary
Lynda J. KuhnSenior Vice-President, Communications
executive council(Includes members of the Corporate Council and Senior Operating Management as follows)
Peter BakerManaging Director, Maple Leaf Bakery U.K.
Kevin P. GoldingPresident, Rothsay and Maple Leaf Agri-Farms
Stephen GrahamChief Marketing Offi cer
Randall D. HuffmanChief Food Safety Offi cer
E. Jeffrey HutchinsonChief Information Offi cer
Bill KaldisVice President, Logistics
Gary MaksymetzPresident, Maple Leaf Consumer Foods
Rory A. McAlpineVice-President, Government and Industry Relations
C. Barry McLeanPresident, Canada Bread Fresh Bakery
Réal MenardPresident, Canada Bread Frozen Bakery
Bruce Y. MiyashitaVice-President, Six Sigma
Deborah K. SimpsonVice-President, Finance
Peter C. SmithVice-President, Corporate Engineering
Simon WookeyPresident, Fresh Prepared Foods
Richard YoungExecutive Vice-President, Transformation, Maple Leaf Consumer Foods
other corporate offi cers
J. Nicholas BolandVice-President, Finance Projects
Catherine BrennanVice-President and Treasurer
Dianne SingerAssistant Corporate Secretary
Jeff McDowellVice-President, Cold Springs Farm
Glen GrattonVice-President, Maple Leaf Agri Farms
MLF_Financials_ENG.indd 74 16/03/10 8:09 AM
72 MAPLE LEAF FOODS INC.
corporate information
capital stockThe Company’s authorized capital consists of an unlimited number of voting common shares, an unlimited number of non-voting common shares and an unlimited number of preferred shares issuable in series. At December 31, 2009, 114,774,802 voting shares and 22,000,000 non-voting shares were issued and outstanding, for a total of 136,774,802 outstanding shares. There were 785 shareholders of record of which 748 were registered in Canada, holding 98.7% of the issued voting shares. All of the issued non-voting shares are held by Ontario Teachers’ Pension Plan. These non-voting shares may be converted into voting shares at any time.
ownershipThe Company’s major shareholders are McCain Capital Corporation holding 43,212,890 voting shares representing 31.6% of the total issued and outstanding shares and Ontario Teachers’ Pension Plan holding 26,213,155 voting shares and 22,000,000 non-voting shares representing 35.3% of the total issued and outstanding shares. The remainder of the issued and outstanding shares are publicly held.
corporate offi ceMaple Leaf Foods Inc.30 St. Clair Avenue WestSuite 1500Toronto, Ontario, Canada M4V 3A2Tel: 416.926.2000Fax: 416.926.2018Website: www.mapleleaf.com
annual meetingThe annual meeting of shareholders of Maple Leaf Foods Inc. will be held on Thursday, April 29, 2010 at 11:00 a.m. at the Toronto Board of Trade, 1 First Canadian Place, 77 Adelaide Street West, Toronto, Ontario, Canada.
dividendsThe declaration and payment of quarterly dividends are made at the discretion of the Board of Directors. Anticipated payment dates in 2010: March 31, June 30, September 30 and December 31.
shareholder inquiriesInquiries regarding dividends, change of address, transfer requirements or lost certifi cates should be directed to the Company’s transfer agent:Computershare Investor Services Inc.100 University Avenue, 9th FloorToronto, Ontario, Canada M5J 2Y1Tel: 514.982.7555or 1.800.564.6253 (toll-free North America)or [email protected]
company informationFor public and investment analysis inquiries, please contact our Senior Vice-President, Communications at 416.926.2000.
For copies of annual and quarterly reports, annual information form and other disclosure documents, please contact our Senior Vice-President, Transactions & Administration and Corporate Secretary at 416.926.2000.
transfer agent and registrarComputershare Investor Services Inc.100 University Avenue, 9th FloorToronto, Ontario, Canada m5j 2y1Tel: 514.982.7555or 1.800.564.6253 (toll-free North America)or [email protected]
auditors
kpmg llpToronto, Ontario
stock exchange listings and stock symbolThe Company’s voting common shares are listed on The Toronto Stock Exchange and trade under the symbol “MFI”.
rapport annuelSi vous désirez recevoir un exemplaire de la version française de ce rapport, veuillez écrire à l’adresse suivante : Secrétaire de la société, Les Aliments Maple Leaf Inc., 30 St. Clair Avenue West, Toronto, Ontario m4v 3a2.
MLF_Financials_ENG.indd 75 16/03/10 8:09 AM

MLF_Financials_ENG.indd 4 16/03/10 8:09 AM

Maple Leaf Foods Inc. 30 St. Clair Avenue West, Suite 1500Toronto, Ontario, Canada m4v 3a2www.mapleleaf.com
Printed in Canada
MLF_Financials_ENG.indd 1 16/03/10 8:09 AM


