Forward-looking statements - InnVest Hotelsinnvesthotels.com/Userfiles/file/INN Q109 - ALL.pdf ·...
44
FIRST QUARTER REPORT 2009 1 Letter to unitholders The lodging industry continues to experience a slowdown in demand, reflecting broader economic trends and their impact on discretionary spending for travel. Diligent cost controls coupled with efforts to drive room rates throughout the portfolio helped mitigate the impact of reduced occupancies across the portfolio. Looking ahead, we continue to expect 2009 to be a difficult year for the hospitality sector. Our objectives through this period are to solidify our balance sheet liquidity and effectively manage our assets. First quarter earnings are not reflective of anticipated results for the annual period given the seasonality of operations. The first quarter is typically the weakest earnings period for the Trust. First quarter operating highlights p Average daily rate growth of 0.8% was offset by a 3.6 point decline in occupancy driven by the deteriorating economic environment and its impact on discretionary travel demand. As a result, revenue per available room (“RevPAR”) on a same-hotel basis declined 5.5%; p Overall, hotel revenues declined 6.1%, or $8.2 million, to $127.7 million. The revenue shortfall was somewhat offset by a 3.1% reduction in hotel expenses. Hotel operating income declined $4.8 million to $18.4 million; p The REIT generated a first quarter net loss of $15.4 million, relatively unchanged from the prior period; p The Trust maintained a prudent payout ratio of 87.5% on a trailing twelve month basis. Distributable loss and funds from operations both declined in the first quarter of 2009 as compared to 2008 reflecting the impact of lower revenues; and p Following the end of the first quarter of 2009, the Trust divested one hotel, previously classified as held for sale, for gross proceeds of $4.1 million. While credit markets appear to be stabilizing, significant uncertainty remains which leads us to maintain a cautious outlook in the near term. Building on our efforts in 2008, we have adapted our strategy to position the REIT to address the current environment with particular attention to our balance sheet and liquidity. Our priority in 2009 will be to continue to be proactive in our capital management initiatives including efforts to address debt maturities. We are continually seeking opportunities to recycle our capital efficiently and have actively expanded our sales efforts with respect to certain underperforming assets. Having developed and implemented contingency plans throughout the portfolio, we continue to manage our portfolio aggressively to maximize the performance of each hotel. Historically, the lodging industry performance has been highly correlated with the economy given the largely discretionary nature of leisure and business travel. While Canada cannot escape the impact of the volatile global trends, it remains fundamentally stronger than many other countries, including the U.S., as evidenced by national RevPAR performance over the last several months. Despite the near term operating environment, with new supply effectively constrained by the credit markets, InnVest is positioned for a stronger recovery when demand trends improve. InnVest’s current portfolio is diversified by geography, customer and brand. This diversity, combined with our partnership with experienced hotel operators, contributes to the resiliency of the portfolio and positions the REIT to effectively manage through the current economic environment. Kenneth Gibson President and Chief Executive Officer May 6, 2009 Q1 2009 First Quarter Report to Unitholders For the three months ended March 31, 2009.
Transcript of Forward-looking statements - InnVest Hotelsinnvesthotels.com/Userfiles/file/INN Q109 - ALL.pdf ·...

first quarter report 2009 1
Letter to unitholdersThe lodging industry continues to experience a slowdown in demand, reflecting broader economic trends and their impact on discretionary spending for travel. Diligent cost controls coupled with efforts to drive room rates throughout the portfolio helped mitigate the impact of reduced occupancies across the portfolio. Looking ahead, we continue to expect 2009 to be a difficult year for the hospitality sector. Our objectives through this period are to solidify our balance sheet liquidity and effectively manage our assets.
First quarter earnings are not reflective of anticipated results for the annual period given the seasonality of operations. The first quarter is typically the weakest earnings period for the Trust.
First quarter operating highlights p Average daily rate growth of 0.8% was offset by a 3.6 point
decline in occupancy driven by the deteriorating economic environment and its impact on discretionary travel demand. As a result, revenue per available room (“RevPAR”) on a same-hotel basis declined 5.5%;
p Overall, hotel revenues declined 6.1%, or $8.2 million, to $127.7 million. The revenue shortfall was somewhat offset by a 3.1% reduction in hotel expenses. Hotel operating income declined $4.8 million to $18.4 million;
p The REIT generated a first quarter net loss of $15.4 million, relatively unchanged from the prior period;
p The Trust maintained a prudent payout ratio of 87.5% on a trailing twelve month basis. Distributable loss and funds from operations both declined in the first quarter of 2009 as compared to 2008 reflecting the impact of lower revenues; and
p Following the end of the first quarter of 2009, the Trust divested one hotel, previously classified as held for sale, for gross proceeds of $4.1 million.
While credit markets appear to be stabilizing, significant uncertainty remains which leads us to maintain a cautious outlook in the near term.
Building on our efforts in 2008, we have adapted our strategy to position the REIT to address the current environment with particular attention to our balance sheet and liquidity. Our priority in 2009 will be to continue to be proactive in our capital management initiatives including efforts to address debt maturities. We are continually seeking opportunities to recycle our capital efficiently and have actively expanded our sales efforts with respect to certain underperforming assets. Having developed and implemented contingency plans throughout the portfolio, we continue to manage our portfolio aggressively to maximize the performance of each hotel.
Historically, the lodging industry performance has been highly correlated with the economy given the largely discretionary nature of leisure and business travel. While Canada cannot escape the impact of the volatile global trends, it remains fundamentally stronger than many other countries, including the U.S., as evidenced by national RevPAR performance over the last several months.
Despite the near term operating environment, with new supply effectively constrained by the credit markets, InnVest is positioned for a stronger recovery when demand trends improve. InnVest’s current portfolio is diversified by geography, customer and brand. This diversity, combined with our partnership with experienced hotel operators, contributes to the resiliency of the portfolio and positions the REIT to effectively manage through the current economic environment.
Kenneth Gibson President and Chief Executive Officer
May 6, 2009
Q12009 First Quarter Report to Unitholders For the three months ended March 31, 2009.

2 innVest real estate inVestment trust
management’s discussion and analysis
IntroductionInnVest Real Estate Investment Trust (“InnVest”, the “Trust”
or the “REIT”) is an unincorporated open-ended real estate
investment trust governed by the laws of Ontario and a
Declaration of Trust. It is publicly traded and listed on the
Toronto Stock Exchange under the symbol INN.UN. The
following is a discussion of the results of operations and
financial condition of InnVest for the three months ended
March 31, 2009.
The following management’s discussion and analysis (“MD&A”)
should be read in conjunction with the interim unaudited
financial statements and notes contained herein as at and
for the three months ended March 31, 2009. This MD&A
should also be read in conjunction with the REIT’s audited
consolidated financial statements for the year ended
December 31, 2008 and the MD&A for the year ended
December 31, 2008. The financial statements of InnVest are
prepared in accordance with Canadian generally accepted
accounting principles (“GAAP”) and are presented in Canadian
dollars. Monetary data in tabular form and in the text, unless
otherwise indicated, are in thousands of dollars, except for per
unit, average daily rate (“ADR”), and revenue per available
room (“RevPAR”) amounts. This MD&A is dated May 6, 2009.
Certain measures in this MD&A, such as hotel operating
income (“HOI”), funds from operations (“FFO”) and distributable
income, do not have any standardized meaning as prescribed
by GAAP, and therefore are considered non-GAAP measures.
InnVest uses non-GAAP financial measures to assess its
operating performance. Securities regulators require that
entities caution readers that earnings and other measures
adjusted to a basis other than GAAP do not have standardized
meanings and are unlikely to be comparable to similar
measures used by other companies. Please see Non-GAAP
Financial Measures for a discussion of certain non-GAAP
financial measures used by the Trust, including a reconciliation
to GAAP financial measures.
Additional information relating to InnVest, including its Annual
Information Form, can be accessed on the Canadian Securities
Administrators’ System for Electronic Document Analysis and
Retrieval (“SEDAR”) located at www.sedar.com and on the
Trust’s website at www.innvestreit.com.
Forward-looking statementsIn the interest of providing InnVest unitholders and potential
investors with information regarding the Trust, certain
statements contained in this M&DA constitute forward-looking
statements within the meaning of applicable securities laws.
These statements include, but are not limited to, statements
made concerning InnVest’s objectives, its strategies to achieve
those objectives, as well as other statements with respect to
management’s beliefs, plans, estimates and intentions, and
similar statements concerning anticipated future events,
results, circumstances and performance or expectations that
are not historical facts. Forward-looking information typically
contains statements with words such as “outlook”, “objective”,
“may”, “continue”, “anticipate”, “believe”, “expect”, “estimate”,
“plan”, “intend”, “forecast”, “project” or similar expressions
suggesting future outcomes or events. Such forward-looking
statements reflect management’s current beliefs and are based
on information currently available to management.
These forward-looking statements are not guarantees of future
events or performance and, by their nature, are based on
InnVest’s estimates and assumptions, which are subject to
risks and uncertainties, including those described under “Risks
and uncertainties” in this MD&A. Readers are cautioned not to
place undue reliance on forward-looking statements, as there
can be no assurance that the plans, intentions or expectations
upon which they are based will occur. By its nature, InnVest’s
forward-looking information involves numerous assumptions,
inherent risks and uncertainties, which may cause the Trust’s
actual performance and financial results in future periods to
differ materially from any estimates or projections of future
performance or results expressed or implied by such forward-
looking statements. Factors that could cause actual results,
performance, or achievements to differ materially from those
expressed or implied by forward-looking statements include,
but are not limited to, changes in business strategies; general
global economic and business conditions; general global credit
market conditions; the effects of competition and pricing
pressures; industry overcapacity; shifts in market demands;
changes in laws and regulations, including environmental and
regulatory laws; potential increases in maintenance and
operating costs; uncertainties of litigation; labour disputes;
timing of completion of capital or maintenance projects;
currency and interest rate fluctuations; various events which
could disrupt operations; and technological changes.
Although InnVest believes that the expectations represented by
such forward-looking statements are reasonable, there can be
no assurance that such expectations will be consistent with
first quarter report 2009 3
management’s discussion and analysis
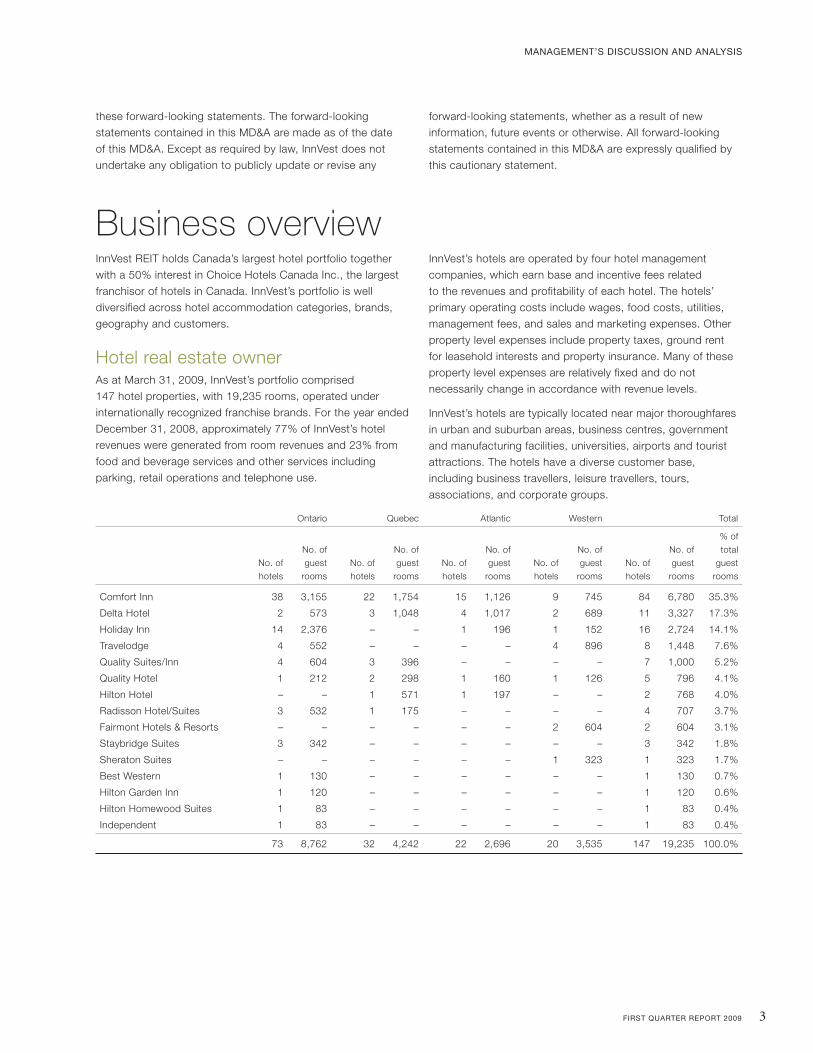
InnVest REIT holds Canada’s largest hotel portfolio together
with a 50% interest in Choice Hotels Canada Inc., the largest
franchisor of hotels in Canada. InnVest’s portfolio is well
diversified across hotel accommodation categories, brands,
geography and customers.
Hotel real estate ownerAs at March 31, 2009, InnVest’s portfolio comprised
147 hotel properties, with 19,235 rooms, operated under
internationally recognized franchise brands. For the year ended
December 31, 2008, approximately 77% of InnVest’s hotel
revenues were generated from room revenues and 23% from
food and beverage services and other services including
parking, retail operations and telephone use.
InnVest’s hotels are operated by four hotel management
companies, which earn base and incentive fees related
to the revenues and profitability of each hotel. The hotels’
primary operating costs include wages, food costs, utilities,
management fees, and sales and marketing expenses. Other
property level expenses include property taxes, ground rent
for leasehold interests and property insurance. Many of these
property level expenses are relatively fixed and do not
necessarily change in accordance with revenue levels.
InnVest’s hotels are typically located near major thoroughfares
in urban and suburban areas, business centres, government
and manufacturing facilities, universities, airports and tourist
attractions. The hotels have a diverse customer base,
including business travellers, leisure travellers, tours,
associations, and corporate groups.
Business overview
Ontario Quebec Atlantic Western Total
% of
No. of No. of No. of No. of No. of total
No. of guest No. of guest No. of guest No. of guest No. of guest guest
hotels rooms hotels rooms hotels rooms hotels rooms hotels rooms rooms
Comfort Inn 38 3,155 22 1,754 15 1,126 9 745 84 6,780 35.3%
Delta Hotel 2 573 3 1,048 4 1,017 2 689 11 3,327 17.3%
Holiday Inn 14 2,376 – – 1 196 1 152 16 2,724 14.1%
Travelodge 4 552 – – – – 4 896 8 1,448 7.6%
Quality Suites/Inn 4 604 3 396 – – – – 7 1,000 5.2%
Quality Hotel 1 212 2 298 1 160 1 126 5 796 4.1%
Hilton Hotel – – 1 571 1 197 – – 2 768 4.0%
Radisson Hotel/Suites 3 532 1 175 – – – – 4 707 3.7%
Fairmont Hotels & Resorts – – – – – – 2 604 2 604 3.1%
Staybridge Suites 3 342 – – – – – – 3 342 1.8%
Sheraton Suites – – – – – – 1 323 1 323 1.7%
Best Western 1 130 – – – – – – 1 130 0.7%
Hilton Garden Inn 1 120 – – – – – – 1 120 0.6%
Hilton Homewood Suites 1 83 – – – – – – 1 83 0.4%
Independent 1 83 – – – – – – 1 83 0.4%
73 8,762 32 4,242 22 2,696 20 3,535 147 19,235 100.0%
these forward-looking statements. The forward-looking
statements contained in this MD&A are made as of the date
of this MD&A. Except as required by law, InnVest does not
undertake any obligation to publicly update or revise any
forward-looking statements, whether as a result of new
information, future events or otherwise. All forward-looking
statements contained in this MD&A are expressly qualified by
this cautionary statement.

4 innVest real estate inVestment trust
management’s discussion and analysis
Innvest’s franchise businessGenerating $3.8 million in other business income for the
year ended December 31, 2008 ($493 year-to-date in 2009),
InnVest owns 50% of Choice Hotels Canada Inc. (“CHC”),
which has franchise agreements with over 290 locations
representing over 24,500 guest rooms open and under
development in Canada. The remaining 50% interest is owned
by Choice Hotels International Inc. (“Choice International”),
one of the largest hotel franchise companies in the world.
In addition to strong international brand recognition, Choice
International has a centralized reservation system, sales
and marketing programs and proprietary property
management systems.
In 1993, CHC was granted a 99-year license to franchise all
Choice hotel brands in Canada, including Comfort Inn®, Quality
Suites® and Quality Hotels®. CHC earns franchise revenue
by charging hotel owners a monthly royalty fee based
on a percentage of the revenue generated by the licenced
properties and by selling franchises. InnVest’s proportionate
interest operating results are included in the consolidated
statements of income in other business income.
Office, retail and retirement home businessGenerating $1.8 million in other business income for the
year ended December 31, 2008 ($419 year-to-date in 2009),
InnVest owns office and retail real estate as well as a
retirement home. These real estate interests are adjacent
to owned hotels and were acquired as part of certain hotel
acquisitions. The operating results are included in the
consolidated statements of income in other business income.
51%Limited service
49%Full service
Rooms By Service Category
46%Ontario
22%Quebec
14%Atlantic
18%West
Rooms By Geography
35%Transient
10%Other
18%Group
2008 Room Revenues By Customer
37%Corporate
&Government

first quarter report 2009 5
management’s discussion and analysis
InnVest has adapted its strategy in response to the current
economic environment with a near term focus aimed at
preserving the REIT’s balance sheet stability. We believe
efforts to enhance liquidity, combined with our proven ability
to manage assets in difficult times, will differentiate the REIT
in this environment. InnVest employs operating and capital
allocation strategies to position the REIT to ensure the stability
of its balance sheet and to position it to take advantage of
opportunities which may exist.
Operating strategyInnVest’s operating focus aims to enhance the performance
of each hotel and improve its RevPAR penetration versus its
competitive set. Internal growth is maximized through the
following operating and strategic principles:
1. Partnering with leading hotel management groups and brands;
2. Implementing yield management and market strategies to
maximize RevPAR;
3. Leveraging InnVest’s size and industry experience to control
costs through operating efficiencies, as well as taking
advantage of buying power and economies of scale; and
4. Investing in the portfolio to drive higher returns and enhance
the value of the assets.
InnVest’s ability to deliver stable cash flow is largely achieved
through its diversification, by location, brand, customer and
market position. Since individual markets can be affected
by local events and economic conditions, geographic
diversification helps limit the impact of such factors on the
overall portfolio. Diversification across customers and brands
allows the Trust to effectively manage its rooms based on
changing demand drivers, thereby optimizing the financial
performance through improved occupancy and ADR.
The manager of all but 15 of InnVest’s hotels is Westmont
Hospitality Canada Ltd (“Westmont”), one of the largest
privately held managers of hotels in the world. The managers
of the REIT’s remaining 15 hotels are Delta Hotels (10),
Fairmont Hotels (3) and Hilton Hotels (2), each an experienced
hotel manager with recognized brands.
Capital allocation strategyIn order to drive the long-term profitability of the portfolio,
InnVest continually evaluates its capital allocation
opportunities. Over the last several years, InnVest has
significantly expanded its portfolio, broadening its market
base and diversifying its risk profile. Following this growth,
the Trust’s current capital allocation efforts are focused
on maximizing the potential of its existing portfolio.
The Trust constantly evaluates its current real estate holdings
to optimize diversification and capitalize on embedded value or
higher return opportunities. From time to time, certain assets
are identified that may not support the Trust’s long term
objectives given limited growth prospects in earnings and value.
In late 2007, InnVest reclassified four assets as held for sale.
Three of these hotels were sold in 2008. The remaining asset
was sold subsequent to the end of the first quarter in 2009.
In accordance with its capital allocation review, InnVest
identified five hotel properties to be held for sale in the
current quarter and wrote down the book value of these hotels
by $29.6 million during the fourth quarter of 2008 based
on expectations of sale proceeds. These hotel properties
contributed minimal hotel operating income of $1.6 million
to the REIT in 2008 and their sale should enable the successful
redeployment of funds into higher yielding opportunities.
Business strategy
Recent developmentsDuring the first quarter of 2009, InnVest successfully extended
two mortgages totalling $13.5 million which were originally
scheduled to mature in February 2010. One mortgage of
$6.9 million was extended to September 30, 2012, while
the second mortgage of $6.6 million was extended to
December 31, 2012 at a weighted average interest rate of
approximately 6.8% compared to the previous rate of 6.2%.
During the first quarter, InnVest classified five assets as held
for sale. The Trust recognized a non-cash impairment charge
of $29.6 million during the fourth quarter of 2008 based on the
anticipated fair value of these assets. The hotel properties
are primarily in tertiary markets impacted by the manufacturing
sector decline and which have also been particularly impacted
by new supply in recent years. In aggregate, six assets were
classified as discontinued operations as at March 31, 2009.
Following the end of the first quarter of 2009, InnVest
completed the divestiture of one hotel which had been
identified as held for sale since the end of 2007. The
transaction was completed for gross proceeds of
$4.1 million less closing costs.

6 innVest real estate inVestment trust
management’s discussion and analysis
First quarter operating highlights
OutlookWhile credit markets appear to be stabilizing, significant
uncertainty remains which leads us to maintain a cautious
outlook in the near term.
Building on our efforts in 2008, we have adapted our strategy
to position the REIT to address the current environment with
particular attention to our balance sheet and liquidity. Our
priority in 2009 will be to continue to be proactive in our
capital management initiatives including efforts to address
debt maturities. We are continually seeking opportunities
to recycle our capital efficiently and have actively expanded
our sales efforts with respect to certain underperforming
assets. Having developed and implemented contingency plans
throughout the portfolio, we continue to manage our portfolio
aggressively to maximize the performance of each hotel.
Historically, the lodging industry performance has been highly
correlated with the economy given the largely discretionary
nature of leisure and business travel. While Canada cannot
escape the impact of the volatile global trends, it remains
fundamentally stronger than many other countries, including
the U.S., as evidenced by national RevPAR performance over
the last several months.
Despite the near term operating environment, with new supply
effectively constrained by the credit markets, InnVest is
positioned for a stronger recovery when demand trends
improve. InnVest’s current portfolio is diversified by geography,
customer and brand. This diversity, combined with our
partnership with experienced hotel operators, contributes to
the resiliency of the portfolio and positions the REIT to
effectively manage through the current economic environment.
p First quarter earnings are not reflective of anticipated results
for the annual period given the seasonality of operations.
The first quarter is typically the weakest earnings period
for the Trust.
p ADR growth of 0.8% was offset by a 3.6 point decline
in occupancy driven by the deteriorating economic
environment and its impact on discretionary travel demand.
As a result, RevPAR on a same-hotel basis declined 5.5%.
This performance exceeds the RevPAR achieved across
the Canadian lodging industry during the quarter;
p Overall, hotel revenues declined 6.1%, or $8.2 million, to
$127.7 million. The revenue shortfall was somewhat offset
by a 3.1% reduction in hotel expenses. Overall, HOI
declined $4.8 million to $18.4 million;
p The REIT generated a first quarter net loss of $15.4 million,
relatively unchanged from the prior period;
p InnVest maintained a prudent payout ratio of 87.5% on a
trailing twelve month basis. Distributable loss and funds
from operations each declined in the first quarter of 2009
as compared to 2008 reflecting the impact of lower
revenues; and
p Following the end of the first quarter of 2009, the Trust
divested one hotel, previously classified as held for sale,
for gross proceeds of $4.1 million.

first quarter report 2009 7
management’s discussion and analysis
Hotel operating results comparisonThe REIT has classified 138 of its 144 hotels owned for the
entire current and comparative period as its “Base Portfolio”,
with the remaining six hotels being classified as discontinued
operations. Operating results for three assets acquired or
developed have been excluded since their results were
capitalized during a portion of the periods presented in
accordance with the REIT’s accounting policy.
Hotel revenues Hotel revenues consist primarily of revenue generated from
room occupancy. Non-room revenue from food and beverage
services and other miscellaneous revenue streams associated
with hotel operations such as space leases, vending
commissions, movie rentals, parking and telephone are
also included. For the first quarter of 2009, room revenues
accounted for approximately 77% of total hotel revenues.
Overall hotel portfolioFor the three months ended March 31, 2009, hotel revenues
decreased by $8.2 million, or 6.1%, to $127.7 million. First
quarter results were impacted by the deteriorating economic
environment and its impact on discretionary travel demand.
For the three months ended March 31, 2009, a 0.8% increase
in ADR was offset by a 3.6 point decline in overall occupancy.
The trend of ADR growth offsetting occupancy declines is
consistent with trends experienced through late 2008. Overall,
first quarter RevPAR decreased 5.5%. InnVest’s first quarter
RevPAR performance outperformed results achieved by the
broader Canadian hotel industry. RevPAR trends were
generally consistent across all service categories and brands.
Notably, RevPAR from the 2007 full-service portfolio additions
outperformed the RevPAR achieved across the balance
of the portfolio.
First quarter operating results reviewThree months ended March 31, 2009 2008
Hotel revenues $ 127,701 $ 135,940
Hotel expenses 109,285 112,771
Hotel operating income1 18,416 23,169
Net loss from continuing operations (14,621) (13,697)
Net loss and comprehensive loss (15,420) (15,073)
Funds from operations1 447 3,418
Distributable loss1 (3,753) (272)
Distributions declared2 13,956 20,618
Distributions per unit2 0.1875 0.28125
Per Unit:
Net loss from continuing operations per unit – basic and diluted (0.196) (0.187)
Net loss per unit – basic and diluted (0.207) (0.206)
Funds from operations per unit – basic and diluted 0.006 0.047
Distributable loss per unit3 – basic and diluted (0.050) (0.004)
1. See Non-GAAP Financial Measures.
2. Distributions and distributions per unit include cash distributions and distributions arising from the dividend reinvestment plan.
3. Distributable loss per unit is calculated on a basis consistent with that prescribed by GAAP for calculating net loss per unit.
Occupancy ADR RevPAR
% Variance to 2008 $ Variance to 2008 $ Variance to 2008
Ontario 51.1% (4.1 pts) $ 109.84 0.2% $ 56.11 (7.4%)
Quebec 52.2% (2.8 pts) $ 105.75 0.8% $ 55.21 (4.3%)
Atlantic 49.1% (4.4 pts) $ 104.47 1.3% $ 51.33 (7.0%)
Western 59.2% (2.3 pts) $ 137.03 1.0% $ 81.08 (2.9%)
Total 52.6% (3.6 pts) $ 114.19 0.8% $ 60.11 (5.5%)
Note: On a same-hotel basis, excluding the hotels that have been classified as discontinued operations, and the hotels which have not been included in the full
periods presented.

8 innVest real estate inVestment trust
management’s discussion and analysis
Room revenuesConsistent with RevPAR performance achieved during
the quarter, overall room revenues for the three months
ended March 31, 2009 decreased $5.8 million, or 5.6%, to
$98.1 million. Each region experienced modest ADR growth
which offset declines in occupancies. The overall declines in
occupancy are more broadly related to economic conditions
beyond the control of the Trust. As was noted in 2008,
Ontario continues to show the weakest performance given
its particular reliance on the manufacturing industry.
Three months ended March 31, 2009
Number of Variance
Room revenue variance hotel rooms $ Variance to 2008
Base Portfolio
Ontario 7,634 $ (3,527) (8.4)%
Quebec 4,080 (1,157) (5.4)%
Atlantic 2,696 (1,090) (8.0)%
West 3,535 (1,078) (4.0)%
Sub-total 17,945 (6,852) (6.6)%
Acquisitions 342 1,047 100.0%
Total 18,287 $ (5,805) (5.6)%
Consistent with broader economic activity and trends noted
through the end of 2008, demand was notably softer in the
first quarter of 2009 for the Ontario region. Ontario, particularly
southern Ontario, is impacted by the challenges experienced
in the manufacturing sector with declining production and job
losses resulting in slowing demand for accommodations.
Overall, first quarter room revenues for the region declined
$3.5 million or 8.4% based on occupancy declines. Almost
all of this decrease was realized in the Greater Toronto Area
and southern Ontario markets such as Burlington, Kitchener
and London.
InnVest’s Base Portfolio of Quebec hotels saw room revenues
decline $1.2 million or 5.4%. Modest rate growth achieved in
the region was offset by occupancy declines. As anticipated,
lower demand was experienced in Quebec City, which
benefitted from year-long festivities associated with the city’s
400th anniversary celebrations in 2008. We expect similar
trends for this city through the balance of 2009. The Montreal
area also experienced declining demand resulting from new
supply coupled with reduced group activity.
First quarter room revenues at InnVest’s Base Portfolio of
Atlantic hotels declined $1.1 million or 8.0%. Occupancies
were impacted by new supply in certain markets as the hotels
focused on maintaining room rate integrity. ADR increased
1.3% for the Atlantic region.
InnVest’s Base Portfolio of Western hotels realized a room
revenue decline of 4.0% or $1.1 million. This decline was
attributable to softness in Edmonton following a strong group
base in the comparative period. Results for the balance of the
region were in line with the prior year.
Non-room revenuesFor the three months ended March 31, 2009, non-room
revenues totalled $29.6 million, down $2.4 million or 7.6%
compared to the prior year. Non-room revenues are directly
impacted by overall occupancy. Lower occupancy results
in the reduced use of ancillary services offered at the hotel.
Hotel expensesIn periods of declining occupancies, the Trust is focused
on managing all costs to minimize the overall impact on
profitability. It should be noted that savings opportunities are
restricted during lower occupancy periods such as the first
quarter, particularly in smaller limited service hotels, given the
minimal infrastructure in place. Many property level expenses,
including property taxes, leasehold payments and insurance,
are relatively fixed and do not necessarily change in
accordance with overall demand levels.
Hotel expenses for the three months ended March 31, 2009
declined $3.5 million or 3.1% when compared to 2008. The
decrease reflects reduced occupancies as well as active steps
taken by the Trust to manage costs throughout the portfolio
in light of the softer economic environment. Some of these
initiatives, implemented in 2008, include hiring freezes and
salary freezes throughout most of the portfolio and at the
Trust’s corporate offices, as well as seeking to maximize value
from vendors through pricing concessions. These initiatives
should continue to benefit future periods.
Hotel operating incomeFor the three months ended March 31, 2009, the Trust
generated HOI of $18.4 million, down $4.8 million as
compared to the prior period. Typically, declining revenues,
or revenue growth below inflation, will result in a decline in
profitability given the considerable amount of operating fixed
costs, particularly at lower occupancy levels.

first quarter report 2009 9
management’s discussion and analysis
Net lossInnVest realized a net loss from continuing operations of
$14.6 million or a loss of $0.196 per unit basic and diluted.
These results were modestly lower then the loss of
$0.187 per unit basic and diluted in the prior year. The lower
HOI was offset by a higher future income tax recovery and
lower interest costs.
During the first quarter of 2009, InnVest reclassified five hotels
as discontinued operations. As at March 31, 2009, six assets
were held for sale. For the first quarter of 2009, discontinued
operations generated net losses of $799 compared to $876 in
the prior period. The prior year also includes a $500 writedown
of the book value of assets held for sale.
InnVest’s net loss for the first quarter totaled $15.4 million,
or a loss of $0.207 per unit basic and diluted, relatively
unchanged from the prior year.
Funds from operationsFor the three months ended March 31, 2009, InnVest
generated FFO of $447 ($0.006 per unit) compared to
$3.4 million in the prior period ($0.047 per unit). The decline
is primarily attributable to the $4.8 million reduction in HOI
for the first quarter. See Non-GAAP Financial Measures for
a reconciliation of GAAP net loss to FFO.
Distributable lossFor the three months ended March 31, 2009, InnVest
generated a distributable loss of $3.8 million (loss of
$0.050 per unit) compared to a distributable loss of $272 in
the prior year (loss of $0.004 per unit). The reduction reflects
lower HOI generated during the quarter. See Non-GAAP
Financial Measures for a reconciliation of GAAP net loss to
distributable loss.
Distributions declared during the first quarter of 2009 totalled
$14.0 million compared to $20.6 million in the prior period.
This reflected distributions of $0.1875 per unit (2008 –
$0.28125), reflecting the reduced level of monthly distributions
to $0.0625 per unit beginning in November 2008.
Three months ended March 31, 2009
Number of Variance
HOI variance hotel rooms $ Variance to 2008
Base Portfolio
Ontario 7,634 $ (2,653) (26.8)%
Quebec 4,080 (385) (14.9)%
Atlantic 2,696 (822) (59.1)%
West 3,535 (991) (10.7)%
Sub-total 17,945 (4,851) (20.9)%
Acquisitions 342 98 100.0%
Total 18,287 $ (4,753) (20.5)%
Hotel operating income margin analysisGiven the overall decline in revenues, hotel operating income
margins for the three months ended March 31, 2009, declined
to 14.4% as compared to 17.0% in 2008. First quarter margins
are not representative of annual margins achieved for the
portfolio given the seasonality of earnings. The first quarter
is historically the weakest earnings period for the Trust.
Other income and expensesOther income and expenses for the three months ended
March 31, 2009 totalled $40.0 million, down $418 as
compared to 2008. The decline is attributable to lower
overall interest incurred following the refinancing of the Trust’s
$215.0 million bridge loan in March 2008 with mortgage debt.
The REIT has benefitted from declines in overall floating
debt lending rates as compared to the prior year. At
March 31, 2009, approximately 9.7% of the REIT’s
outstanding debt is at floating rates.
Income taxesFor the three months ended March 31, 2009, the REIT
generated a future income tax recovery of $6.9 million,
as compared to $3.5 million in 2008. In addition to ongoing
operations and capital expenditures, the future income tax
recovery realized in the first quarter of 2009 reflects the
provincial SIFT tax rate change which was enacted in
March 2009 along with the impact of the reclassification
of certain assets as held for sale.
For 2009, the REIT estimates that the non-taxable portion of
the distributions made to unitholders during the year will be
approximately 40% (2008 – 44%).

10 innVest real estate inVestment trust
management’s discussion and analysis
Changes in financial conditionOperating activitiesFor the three months ended March 31, 2009, operating
activities used cash of $2.2 million, up $1.7 million from the
prior year. Lower cash earnings were somewhat offset by a
modest decline in working capital usage during the period
given tight cash management initiatives implemented to
conserve liquidity.
Financing activitiesFinancing activities reflect first quarter cash distributions
of $13.3 million (2008 – $16.7 million), which excludes the
distributions which were satisfied through the Trust’s dividend
reinvestment program (“DRIP”). Distributions declared for the
three months ended March 31, 2009 were $0.1875 per unit
compared to $0.28125 in 2008. In November 2008, the REIT
announced a reduction to its monthly distributions from
$0.09375 per unit to $0.0625 per unit. The Trust purchased
and cancelled 211,500 units for total proceeds of $689 during
the first quarter of 2009 in accordance with its normal course
issuer bid.
At March 31, 2009, the REIT had drawn $20.2 million from
its operating loan to finance the distribution and other capital
needs during the quarter. Given the seasonality of operations,
first quarter distributions are typically financed by drawing on
the Trust’s operating loan.
During the first quarter of 2008, InnVest completed
$390 million in aggregate mortgage financings, at a weighted
average blended interest rate of 5.6%, including new mortgage
debt and early refinancing of existing debt. Net proceeds were
used to repay the $215 million bridge loan incurred as part
of the acquisition of the Legacy Portfolio and to repay
$154.8 million in existing mortgages. InnVest fixed the
interest rates on $370 million of this debt.
During the prior period, the REIT also obtained
$17.3 million in financing to partially fund the acquisition
of one new hotel and the development of a second hotel.
Investing activitiesEach year, InnVest sets aside between 3% and 5% of total
hotel revenues at each hotel and certain amounts required for
hotel acquisitions for replacing furniture, fixtures and
equipment and capital improvements (the “FF&E reserve”).
Capital expenditures for the three months ended March 31,
2009 totalled $6.0 million (2008 – $5.9 million). This compares
to the Trust’s FF&E reserve of $5.4 million for the first quarter
of 2009 (2008 – $5.8 million).
Investing activities for the prior period reflect the acquisition
of a newly built hotel for $17.2 million and the completion
of a hotel under development.
SeasonalityInnVest’s operations are seasonal and as such its results are
not consistent throughout the year. Revenue earned from hotel
operations fluctuates throughout the year, with the third
quarter being the highest due to the increased level of leisure
travel in the summer months and the first quarter being the
lowest because leisure travel tends to be lower. The results
from operations vary materially from quarter to quarter
because of the seasonal nature of the revenue stream and the
fact that certain costs such as property taxes, insurance,
interest, depreciation and amortization, and corporate and
administrative expenses are fixed, or virtually fixed. Given their
lower relative contribution to results, weakness in the first and
fourth quarters will have a lesser impact on annual earnings.
Quarterly results

first quarter report 2009 11
management’s discussion and analysis
For each quarter ended (unaudited) (as reported)
March 31 Dec 31 Sept 30 June 30 March 31 Dec 31 Sept 30 June 30
2009 2008 2008 2008 2008 2007 2007 2007
Occupancy 52.6% 58.0% 72.1% 67.5% 55.9% 60.7% 72.8% 65.2%
ADR $ 114.09 $ 117.86 $ 125.86 $ 122.68 $ 112.89 $ 113.03 $ 105.17 $ 99.27
RevPAR $ 59.98 $ 68.33 $ 90.77 $ 82.84 $ 63.04 $ 68.56 $ 76.53 $ 64.70
Total revenues $ 127,701 $ 162,365 $ 193,832 $ 181,996 $ 140,529 $ 162,316 $ 135,982 $ 109,299
Hotel operating income $ 18,416 $ 36,871 $ 64,576 $ 56,152 $ 23,574 $ 38,130 $ 49,100 $ 33,959
Hotel operating income margin 14.4% 22.7% 33.3% 30.9% 16.8% 23.5% 36.1% 31.1%
Net (loss) income from
continuing operations $ (14,621) $ (28,329) $ 24,519 $ 17,186 $ (14,271) $ 24,510 $ 29,984 $ (113,270)
Distributable(loss) income $ (3,753) $ 13,340 $ 40,598 $ 31,874 $ (272) $ 13,686 $ 34,639 $ 19,892
Distributions $ 13,956 $ 16,277 $ 20,845 $ 20,733 $ 20,618 $ 21,572 $ 17,813 $ 15,793
Net (loss) income from
continuing operations
per unit
– basic $ (0.196) $ (0.381) $ 0.330 $ 0.233 $ (0.195) $ 0.337 $ 0.450 $ (2.023)
– diluted $ (0.196) $ (0.381) $ 0.320 $ 0.233 $ (0.195) $ 0.325 $ 0.420 $ (2.023)
Distributable (loss) income
per unit
– basic $ (0.050) $ 0.179 $ 0.547 $ 0.433 $ (0.004) $ 0.188 $ 0.520 $ 0.355
– diluted $ (0.050) $ 0.179 $ 0.497 $ 0.400 $ (0.004) $ 0.188 $ 0.474 $ 0.334
Trust units outstanding 74,434,338 74,412,317 74,249,239 73,849,170 73,447,668 73,000,694 72,610,235 56,265,058
Weighted average
trust units outstanding 74,439,594 74,373,530 74,222,761 73,647,417 73,234,488 72,795,804 66,566,306 56,002,020
Total assets $ 1,952,900 $ 1,977,104 $ 2,042,387 $ 2,060,807 $ 2,059,716 $ 2,062,279 $ 2,093,834 $ 1,210,338
Total long-term debt $ 938,774 $ 951,276 $ 948,318 $ 940,730 $ 939,582 $ 711,617 $ 728,817 $ 518,129
Liquidity and capital resourcesInnVest has several sources of liquidity including the following:
Cash generated from hotel operations
The REIT’s operations are seasonal with the first quarter
typically being the weakest earnings period given the low level
of business and leisure travel during these months. Over the
year, the REIT anticipates generating HOI sufficient to fund
distributions to unitholders, capital expenditures and debt
service requirements.
Lines of credit
InnVest has a line of credit with a major banking institution to
finance temporary shortfalls in cash resulting from business
seasonality and working capital fluctuations. The credit facility
may also be used to provide short-term financing in the event
of an acquisition of a new hotel.
Issuing additional debt
InnVest also has the ability to raise funds by mortgaging
its properties or by issuing either debt or convertible debt
securities. The Trust typically uses long-term debt financing to
refinance existing debt or to finance an acquisition. The choice
of debt instrument used is dependent on then-current market
conditions. The ability to secure debt financing on reasonable
terms is ultimately dependent on market conditions and
the lender’s determination of InnVest’s creditworthiness.
At March 31, 2009, substantially all of the REIT’s assets
have been pledged as security under debt agreements.

12 innVest real estate inVestment trust
management’s discussion and analysis
Issuing additional equity securities
InnVest’s listing on the Toronto Stock Exchange gives it the
ability to access, subject to market conditions, additional
equity through the issuance of additional units or other equity
instruments. When issued, additional equity is most often used
to finance an acquisition or repay debt. The REIT is subject to
certain restrictions on the issuance of equity as a result of
changes to the taxation of publicly traded trusts (refer to Risks
and Uncertainties – Proposed Tax Changes to Income Trusts).
Management believes that the REIT’s credit facilities,
cash on hand and expected cash flow from operations,
when combined with the potential to access debt and
equity markets, will allow InnVest to meet all of its
financial commitments.
Cash on hand At March 31, 2009, the REIT has cash on hand totaling
$12.9 million, of which $2.5 million is restricted under the
REIT’s Declaration of Trust for the replacement of furniture,
fixtures, and equipment and for capital improvements.
The REIT invests capital in its portfolio to maintain its
assets, and pursue repositioning opportunities to enhance
its competitive position. Capital expenditures for the three
months ended March 31, 2009 totalled $6.0 million (2008 –
$5.9 million). This compares to the Trust’s FF&E reserve of
$5.4 million for the first quarter of 2009 (2008 – $5.8 million).
Given the seasonality of hotel operations, revenues are
not earned evenly through the year. Conversely, capital
expenditures are typically scheduled during lower occupancy
periods to avoid guest displacement. However, in light of
the current operating environment, non-essential capital
investments during the first quarter of 2009 were limited in
order to meet the Trust’s desire to conserve liquidity. The Trust
expects its capital investment to be largely funded through
its FF&E reserve for the year 2009. Excess capital invested
above the FF&E reserve during the three months ended
March 31, 2009 was funded through cash from operations
or the REIT’s operating line.
The following table reconciles the change in restricted cash
during the three months ended March 31, 2009 and the
comparable period:
Three months ended March 31, 2009 2008
Opening balance $ 3,013 $ 2,995
FF&E Reserve 5,427 5,848
Capital expenditures (5,968) (5,919)
Closing balance $ 2,472 $ 2,924
Credit facility/bridge loanInnVest’s operations are seasonal (see Quarterly Results –
Seasonality). The REIT’s credit facility ensures that the
seasonal fluctuation in cash flows will not affect its ability
to operate in the normal course of business. The
Trust has a $40.0 million operating line secured by
14 unencumbered properties.
At March 31, 2009, $20.2 million was drawn on the credit
facility. In addition, letters of credit totaling $3.7 million were
drawn against the facility. The operating line bears interest at
the lesser of Canadian bank prime rate plus 0.5% or the
Canadian Bankers’ Acceptance rate plus 1.5%. This line of
credit expires in August 2009. Management anticipates that
the facility will be renewed in the normal course of business.
A $9.0 million bridge loan was scheduled to expire in
March 2009. Following the end of the quarter, management
successfully finalized an extension for $7.0 million of the bridge
through August 2009, bringing the maturity in line with the
REIT’s operating line with the same lender. The $2.0 million
difference was repaid in April 2009.
Mortgages payable and convertible debenturesAt March 31, 2009, InnVest had mortgages payable of
$945.4 million with a weighted average term of 3.5 years
and a weighted average effective interest rate of 5.6%.
Approximately 9.7% of the Trust’s mortgage debt is at floating
rate. In addition, the REIT has access to a loan facility, granted
in conjunction with property mortgages, for up to $36.1 million
to fund 50% to 100% of capital expenditures incurred
at individual hotels. At March 31, 2009, the REIT has
drawn $12.2 million on this facility (December 31, 2008 –
$12.2 million), such amounts being included in mortgages
payable. Remaining capacity under this facility at
March 31, 2009 approximated $23.9 million. In April 2009 an
additional amount of $6.9 million was funded under this facility.
InnVest also has three series of fixed-rate convertible
debentures which mature between 2011 and 2014.
At March 31, 2009, InnVest has $190.7 million
(December 31, 2008 – $190.8 million) in convertible
debentures outstanding.
InnVest’s debt obligations do not provide for any contractual
limitations on cash distributions to its unitholders.

first quarter report 2009 13
management’s discussion and analysis
During 2008, the global financial credit markets experienced
significant volatility. In general, the availability of credit has
deteriorated dramatically and credit spreads offered have
widened considerably. While credit spreads have widened, the
underlying bond yields have also decreased such that the
overall cost of debt, if available, remains relatively attractive.
The REIT’s strategy is to improve the performance of its hotels
and complete value-added capital investments as appropriate.
The resulting increased property values then enables the REIT
to obtain additional mortgage proceeds to finance additional
capital improvements or acquisitions. In light of the current
credit environment, the REIT’s near term focus is on preserving
its liquidity to help address future refinancing requirements,
including the potential that future refinancing proceeds are not
sufficient to satisfy mortgage debt maturities.
Adjusted debt to gross book valuesInnVest is not permitted to exceed certain financial leverage
amounts under the terms of the Declaration of Trust. The REIT
is permitted to hold indebtedness, excluding convertible
debentures, up to a level of 50% of gross asset value. Further,
the REIT is permitted to have indebtedness and convertible
debentures up to a level of 60% of gross asset value. InnVest
calculates indebtedness in accordance with GAAP excluding
non-interest bearing indebtedness, trade accounts payable,
and any future income tax liability. InnVest calculates gross
asset value as the total book value of assets on the REIT’s
balance sheet, plus the accumulated depreciation and
amortization, less any future income tax liabilities.
At March 31, 2009, the REIT’s leverage excluding
and including convertible debentures was 47.7%
(December 31, 2008 – 47.2%) and 57.0%
(December 31, 2008 – 56.5%), respectively.
Total assets per
Consolidated balance sheet $ 1,952,900
Accumulated depreciation
and amortization 295,696
Future income tax liability (204,046)
Future income tax liability
not included in assets 18,695
Gross asset value $ 2,063,245
Book value of mortgages
and other indebtedness1 $ 984,494 47.7%
Convertible debentures2 190,744 9.3%
Total debt $ 1,175,238 57.0%
1. Adjusted to eliminate financing issuance costs and include long-term debt
related to assets held for sale.
2. Adjusted to face value.
Long-term capital obligationsThe REIT’s long-term capital obligations consist primarily
of fixed-term mortgage financing and unsecured debentures.
The maturity dates for these obligations have been staggered
to lower the overall refinancing risk. The estimated interest
payments on mortgage debt and convertible debentures
include scheduled interest payments on fixed and variable rate
debt outstanding at March 31, 2009. The estimated interest
payment on variable rate mortgages is based on interest rates
prevailing at March 31, 2009.
Considering its overall leverage and demonstrated historical
access to capital markets, InnVest expects that all maturities
will be refinanced or repaid in the normal course of business.
InnVest has no mortgage maturities until mid-2010. In the
first quarter of 2009, the REIT successful extended the term
of two mortgages totalling $13.5 million which were originally
scheduled to mature in February 2010. One mortgage of
$6.9 million was extended to September 30, 2012, while
the second mortgage of $6.6 million was extended to
December 31, 2012 at a weighted average interest rate of
approximately 6.8% compared to the previous rate of 6.2%.
Following this extension, approximately $177.9 million in
mortgage debt with an average interest rate of 5.6% matures
in 2010. This debt represents one maturity with a large
Canadian institutional lender. Forty limited service hotels serve
as collateral on this debt. Mortgage maturities in 2011
approximate $321.5 million with an average interest rate
of 5.5%. This is made up of two separate maturities of
approximately $268.0 million and $53.5 million, both with a
large Canadian institutional lender. The $268.0 million maturity
includes two one-year extensions, at the REIT’s option, subject
to certain minimum thresholds at the time of maturity. In
aggregate, nine full service hotels serve as collateral on the
mortgages which mature in 2011. As at March 31, 2009, these
2010 and 2011 maturities are supported by strong debt
service coverage. InnVest’s outstanding Series A debentures
of $45.8 million also matures in April 2011. The REIT has
approximately $141.7 million of mortgages payable secured
by conduit financing with the relevant maturities in 2014
and beyond.
The REIT has leasehold interests in 13 of its hotels. The
leaseholds require minimum annual average lease payments
and expire between 2017 and 2088. There are also future
rental charges determined as a percentage of revenue that
are not included in the amounts reflected below. Capital
and operating leases primarily relate to equipment and
office leases.
In addition, capital expenditures committed, and yet to be
incurred, at March 31, 2009 approximated $405.

14 innVest real estate inVestment trust
management’s discussion and analysis
Remainder of 2014 and
2009 2010 2011 2012 2013 thereafter Total
Bank indebtedness – principal 9,000 – – – – – 9,000
Bank indebtedness – interest 94 – – – – – 94
Mortgages payable – principal 8,449 179,240 328,451 23,399 11,355 394,501 945,395
Mortgages payable – interest 41,187 50,229 28,066 25,385 23,956 17,612 186,435
Capital lease – principal 195 203 213 242 225 1,269 2,347
Capital lease – interest 176 239 239 239 239 60 1,192
Convertible debentures –
principal – – 45,764 – 74,980 70,000 190,744
Convertible debentures –
interest 9,408 11,455 10,025 8,595 6,345 4,095 49,923
Long-term land leases 3,670 4,945 4,492 4,492 4,492 89,933 112,024
Operating equipment
and office leases 473 392 172 50 35 – 1,122
72,652 246,703 417,422 62,402 121,627 577,470 1,498,276
Overall, the Trust has no significant current debt maturities,
minimal floating rate debt and appropriate leverage for its real
estate class. The Trust also has access to a credit facility to
fund short term fluctuations in earnings. If necessary, near
term disruptions to operating earnings and cash flow could
be addressed through reductions in discretionary capital
allocation decisions such as capital investments above the
FF&E reserve and/or distributions. Based on the current level
of distributions and current units outstanding, annual
distributions approximate $56 million. The Trust could also
generate liquidity through asset sales. At March 31, 2009,
six assets are classified as held for sale, one of which was
disposed of subsequent to the end of the first quarter of 2009.
As a result, management does not expect the current global
credit market environment to have a material impact on the
Trust’s ability to fund its commitments.
Distributions to unitholdersFor the three months ended March 31, 2009, the REIT
declared distributions of $14.0 million, of which $660,
was distributed in units as part of the DRIP. This represents
distributions declared of $0.1875 per unit, compared to
$0.28125 per unit for the first quarter of 2008. For the
twelve months ended March 31, 2009, InnVest’s payout
ratio was 87.5%, or 75.3% on a cash basis (excluding
the non-cash distributions made through the DRIP). This
payout ratio compares to a 91.7% annual payout for the year
ended December 31, 2008. The improved payout ratio reflects
the reduced level of distributions which offset the weaker hotel
operating environment.
In November 2008, the Trust announced a reduction in its
monthly distribution to $0.0625 per month, or $0.75 per unit
annually. This represented a one third reduction from annual
distributions of $1.125 per unit that had been paid since the
Trust’s inception in 2002. The reduction was implemented
based on the Board of Trustees’ decision to take a prudent
approach to distributions in light of current uncertain economic
conditions. The distribution reduction will enable InnVest to
conserve approximately $28 million annually and will help
enhance the REIT’s balance sheet and liquidity during the
current challenging credit environment. Based on current
market conditions, management expects the current level of
cash distributions to be sustainable. However, the potential
deterioration of business trends could impact future
distributions paid.
Liquidity to fund distributions is generated from cash flow
from operations, cash on hand, available bank operating
lines and by the ability to finance certain unencumbered or
under-leveraged assets. First and fourth quarter distributions
are typically partially funded through bank operating lines
given the seasonality of earnings through the year in contrast
to fixed costs.
Since 2006, the REIT’s annual distributions have been fully
funded by distributable income generated by the Trust.

first quarter report 2009 15
management’s discussion and analysis
12 months
ended
March 31, Years ended December 31
2009 2008 2007 2006 2005
Distributable income $ 82,059 $ 85,540 $ 71,995 $ 62,771 $ 48,721
Distributions 71,811 78,473 70,758 59,605 52,884
Distributable income in excess
of (less than) distributions 10,248 7,067 1,237 3,166 (4,163)
Non-cash distributions made
through the DRIP 10,021 13,234 10,606 4,166 3,303
Distributable income in excess
of (less than) cash distributions $ 20,269 $ 20,301 $ 11,843 $ 7,332 $ (860)
Payout ratios:
Total distributions 87.5% 91.7% 98.3% 95.0% 108.5%
Cash distributions (total
distributions minus DRIP) 75.3% 76.3% 83.6% 88.3% 101.8%
The REIT is required to pay distributions of not less than 80%
of the annual distributable income equally on a monthly basis.
Distributions to unitholders are approved by the REIT’s Board
of Trustees. In exercising their discretion to approve the level
of distributions, the Trustees use forecasts prepared by
management and other financial information to determine if
sufficient cash flow will be available to fund distributions. Such
financial information is subject to change due to the nature of
the Canadian hotel industry which can be difficult to predict,
even in the short-run (see Risks and Uncertainties).
Unit informationAt March 31, 2009, a total of 74,434,338 units of the REIT were outstanding. There is only one class of trust units, with each unit
eligible for one vote.
2009 2008
Units outstanding, January 1 74,412,317 73,000,694
Dividend reinvestment plan 202,067 427,230
Executive compensation plan 19,052 16,033
Trustee compensation plan 11,060 3,711
Conversion of debentures 1,342 –
Trust units cancelled pursuant to normal course issuer bid (211,500) –
Units outstanding, March 31 74,434,338 73,447,668
Commencing on November 11, 2008, InnVest initiated a
normal course issuer bid (“NCIB”) to purchase up to 5,924,617
trust units, representing approximately 10% of InnVest’s public
float. The NCIB expires on November 10, 2009. Under the
NCIB, units purchased will be cancelled. InnVest believes that
the market price of its units at certain times may be attractive
and that the purchase of units from time to time would be an
appropriate use of InnVest’s funds.

16 innVest real estate inVestment trust
management’s discussion and analysis
InnVest issues additional units each month through its DRIP.
Given its desire to conserve liquidity, to date, the REIT has
limited its NCIB purchases to satisfy those units issued
through the DRIP as to minimize their dilutive effect.
During the first quarter of 2009, the Trust purchased and
cancelled 211,500 trust units under the NCIB at an aggregate
cost of $689 (average cost of $3.26 per unit). Subsequent
to March 31, 2009, InnVest purchased and cancelled an
additional 70,000 units at an aggregate cost of $245 (average
cost of $3.49 per unit). In aggregate since implementing the
NCIB, the REIT has acquired 560,000 units at an aggregate
cost of $1.9 million (average cost of $3.34).
A total of $45.8 million of the Series A – 6.25% Debentures
remained outstanding at March 31, 2009. These debentures
are convertible into trust units at a strike price of $12.50,
bear interest at 6.25% per annum payable semi-annually on
April 15 and October 15 of each year and are due April 15, 2011.
At March 31, 2009, the trust units to be issued upon
conversion of the Series A – 6.25% Debentures are 3,661,120.
A total of $75.0 million of the Series B – 6.00% Debentures
remained outstanding at March 31, 2009. The Series B –
6.00% Debentures are convertible into trust units at a strike
price of $14.90, bear interest at 6.00% per annum payable
semi-annually on May 31 and November 30 of each year and
are due May 31, 2013. During the quarter, $20 convertible
debentures were converted into 1,342 units. At March 31, 2009,
the trust units to be issued upon conversion of the Series B –
6.00% Debentures total 5,032,215.
A total of $70.0 million of Series C – 5.85% Debentures
remained outstanding at March 31, 2009. These debentures
are convertible into trust units at a strike price of $14.70,
bear interest at 5.85% per annum payable semi-annually
on August 1 and February 1 of each year and are due
August 1, 2014. At March 31, 2009, the trust units to be
issued upon conversion of the Series C – 5.85% Debentures
total 4,761,905.
For each of its Series A, Series B and Series C debentures,
the REIT may elect, from time to time, to satisfy its obligation
to pay interest by delivering trust units. Also, for each of its
Series A, Series B and Series C debentures, the REIT may,
at its option, on not more than 60 days’ and not less than
30 days’ prior notice and subject to applicable regulatory
approval, elect to satisfy its obligation to repay all or any
option of the principal amount of the Series A, Series B and
Series C Debentures that are to be redeemed or that are to
mature, by issuing trust units. The number of trust units to be
issued in respect of each debenture will be determined by
dividing the principal amount by 95% of the volume-weighted
average trading price of the trust units on the Toronto Stock
Exchange for the 20 consecutive trading days ending on the
fifth trading day preceding the date fixed for redemption or
maturity, as the case may be.
At March 31, 2009, there were 81,922 (December 31, 2008 –
71,003) unvested executive units granted under the executive
compensation plan. Units granted vest equally on the third and
fourth anniversary of the effective date of grant.
On October 9, 2008, the REIT adopted a unitholder rights
plan, which expired April 9, 2009. On April 14, 2009,
unitholders of the REIT approved the adoption of the second
amended and restated unitholder rights plan, which will be
in effect for a period up to three years. InnVest did not adopt
either of the plans in response to any specific take-over
proposal, nor has it been made aware of any such proposal.
A unitholder right plan is intended to ensure that unitholders
receive fair treatment in the event of an unsolicited attempt
to gain control of InnVest and, in such event, to ensure
unitholders receive full value and that the Board of Trustees
has time to consider alternatives to maximize unitholder value.
The rights will only become exercisable upon the occurrence
of certain triggering events, including the acquisition by a
person or group of persons of 20% or more of the outstanding
units in a transaction not approved by InnVest’s Board
of Trustees.
Non-GAAP financial measuresIncluded in this MD&A are certain non-GAAP financial
measures, which are measures of InnVest’s historical or future
financial performance that are not calculated and presented in
accordance with GAAP. These non-GAAP financial measures
are unlikely to be comparable to similar measures presented
by other entities. The following discussion defines non-GAAP
measures used by InnVest and presents why management
believes they are useful supplemental measures of the
REIT’s performance.
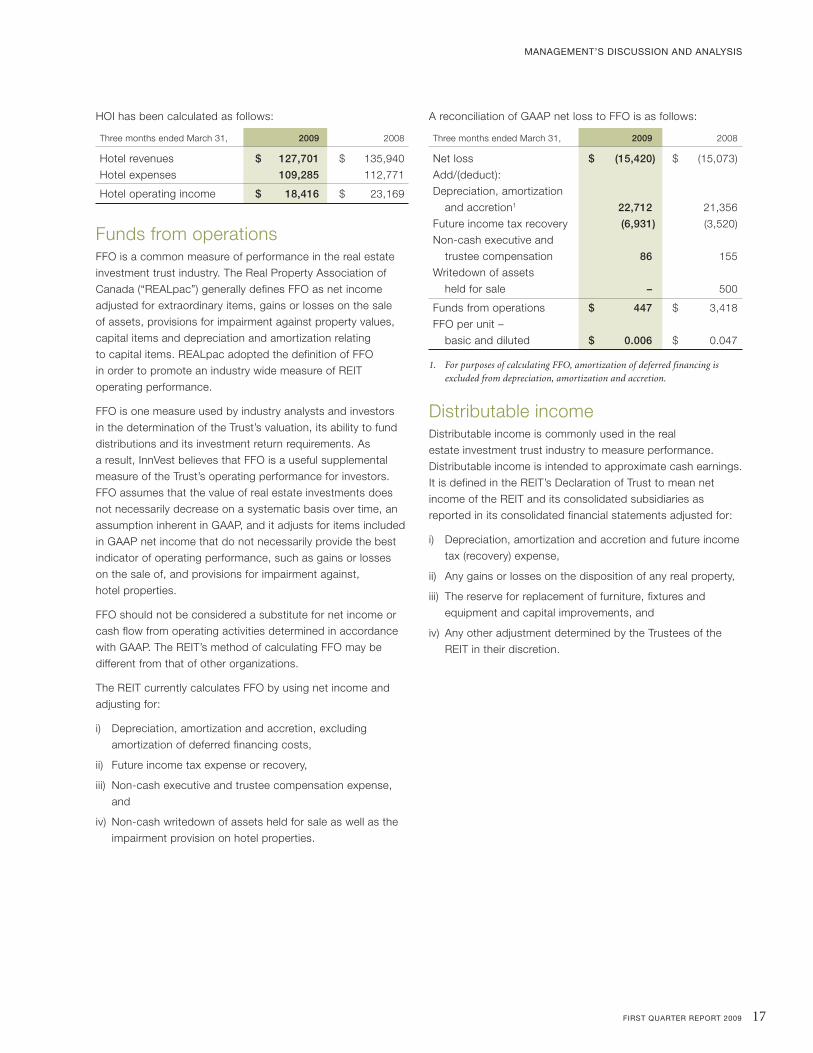
Hotel operating incomeHOI is defined as hotel revenues less hotel expenses. HOI is a
commonly used measure by lodging real estate owners which,
when considered with GAAP measures, gives management a
more complete understanding of property level results before
debt service. It also facilitates comparisons between InnVest
and its competitors. Management believes that HOI is
one of InnVest’s key performance indicators since it helps
management, lenders and investors evaluate the ongoing hotel
profitability. Management believes hotel operating income to
be a meaningful indicator of hotel performance.
first quarter report 2009 17
management’s discussion and analysis
HOI has been calculated as follows:
Three months ended March 31, 2009 2008
Hotel revenues $ 127,701 $ 135,940
Hotel expenses 109,285 112,771
Hotel operating income $ 18,416 $ 23,169
Funds from operationsFFO is a common measure of performance in the real estate
investment trust industry. The Real Property Association of
Canada (“REALpac”) generally defines FFO as net income
adjusted for extraordinary items, gains or losses on the sale
of assets, provisions for impairment against property values,
capital items and depreciation and amortization relating
to capital items. REALpac adopted the definition of FFO
in order to promote an industry wide measure of REIT
operating performance.
FFO is one measure used by industry analysts and investors
in the determination of the Trust’s valuation, its ability to fund
distributions and its investment return requirements. As
a result, InnVest believes that FFO is a useful supplemental
measure of the Trust’s operating performance for investors.
FFO assumes that the value of real estate investments does
not necessarily decrease on a systematic basis over time, an
assumption inherent in GAAP, and it adjusts for items included
in GAAP net income that do not necessarily provide the best
indicator of operating performance, such as gains or losses
on the sale of, and provisions for impairment against,
hotel properties.
FFO should not be considered a substitute for net income or
cash flow from operating activities determined in accordance
with GAAP. The REIT’s method of calculating FFO may be
different from that of other organizations.
The REIT currently calculates FFO by using net income and
adjusting for:
i) Depreciation, amortization and accretion, excluding
amortization of deferred financing costs,
ii) Future income tax expense or recovery,
iii) Non-cash executive and trustee compensation expense,
and
iv) Non-cash writedown of assets held for sale as well as the
impairment provision on hotel properties.
A reconciliation of GAAP net loss to FFO is as follows:
Three months ended March 31, 2009 2008
Net loss $ (15,420) $ (15,073)
Add/(deduct):
Depreciation, amortization
and accretion1 22,712 21,356
Future income tax recovery (6,931) (3,520)
Non-cash executive and
trustee compensation 86 155
Writedown of assets
held for sale – 500
Funds from operations $ 447 $ 3,418
FFO per unit –
basic and diluted $ 0.006 $ 0.047
1. For purposes of calculating FFO, amortization of deferred financing is
excluded from depreciation, amortization and accretion.
Distributable incomeDistributable income is commonly used in the real
estate investment trust industry to measure performance.
Distributable income is intended to approximate cash earnings.
It is defined in the REIT’s Declaration of Trust to mean net
income of the REIT and its consolidated subsidiaries as
reported in its consolidated financial statements adjusted for:
i) Depreciation, amortization and accretion and future income
tax (recovery) expense,
ii) Any gains or losses on the disposition of any real property,
iii) The reserve for replacement of furniture, fixtures and
equipment and capital improvements, and
iv) Any other adjustment determined by the Trustees of the
REIT in their discretion.

18 innVest real estate inVestment trust
management’s discussion and analysis
Distributable income is one measure used by industry analysts
in the determination of the Trust’s per unit value, the ability
of the Trust to fund distributions and investment returns for
current or potential investors. As outlined in the Declaration of
Trust, the REIT is required to distribute monthly to unitholders
not less than one-twelfth of 80% of the estimated annualized
distributable income of the Trust for the calendar year.
Distributable income is not only used by management and
the Board of Trustees to determine the level of distributions
to unitholders, it also serves as an important measure
for investors in their evaluation of the performance
of management.
In addition, when evaluating acquisition opportunities, the
distributable income to be generated by the asset is reviewed
by management to determine whether a proposed acquisition
will generate an increase in distributable income per unit.
Therefore, distributable income is an important measure for
management as a guideline through which operating and
financial decisions are made and is an integral part of the
investment decision for investors and potential investors.
A reconciliation of GAAP net loss to distributable loss is as follows:
Three months ended March 31, 2009 2008
Net loss $ (15,420) $ (15,073)
Add/(deduct):
Depreciation and amortization 22,712 21,356
Future income tax recovery (6,931) (3,520)
FF&E Reserve (5,427) (5,848)
Non-cash portion of convertible debenture interest and accretion 784 578
Non-cash portion of mortgage interest expense 424 258
Non-cash executive and trustee compensation 86 155
Writedown of assets held for sale – 500
Amortization of deferred financing costs 17 1,314
Deferred land lease expense and retail lease income, net 2 8
Distributable loss $ (3,753) $ (272)
Distributable loss per unit – basic and diluted $ (0.050) $ (0.004)
The following table reconciles cash flows from operating activities to distributable loss in accordance with Canadian Securities
Administrators Staff Notice 41-201 Income Trusts and Other Indirect Offerings. Management considers distributable cash to be
equivalent to distributable income. The reconciliation has been prepared using reasonable and supportable assumptions which
reflect the REIT’s planned courses of action given management’s judgment about the most probable set of economic conditions.
Three months ended March 31, 2009 2008
Reconciliation of cash flow from operating activities to distributable loss
Cash flow from operating activities $ (2,185) $ (461)
Changes in non-cash working capital 3,562 6,152
Miscellaneous, including changes in non-cash working capital – discontinued operations 295 (123)
Deferred land lease expense and retail lease income, net 2 8
FF&E reserve (5,427) (5,848)
Distributable loss $ (3,753) $ (272)

first quarter report 2009 19
management’s discussion and analysis
Risks and uncertaintiesAll real estate investments are subject to a degree of risk.
The achievement of the REIT’s objectives is, in part, dependent
on successful mitigation of business risks. The following is
a discussion of some, but not all, of the risks which may
influence the REIT’s performance. Readers should also refer
to InnVest’s Annual Information Form, which is available on
SEDAR, for a more detailed discussion of risks.
Operating risksInnVest is subject to the normal operating risks consistent with
hotel ownership. The following is a discussion of key risks and
uncertainties facing the Trust on a day-to-day basis, and the
strategies adopted to mitigate such risks. The REIT has risk
management processes in place as well as restrictions,
limitations and policies placed upon it by its Declaration of
Trust. However, it should not be assumed that the following
discussion is exhaustive or that the strategies adopted to
mitigate these risks will be effective.
The REIT is subject to the operating risks inherent in the
Canadian hotel industry, including:
p Cyclical downturns arising from changes in general and local
economic conditions;
p Competition from other hotels;
p Seasonal fluctuations in hotel operating income generated
throughout the year;
p Changes in wages, prices, energy costs and construction
and maintenance costs that might result from inflation,
government regulation, changes in interest rates or
currency fluctuations;
p Changes in the level of business and commercial travel
and tourism;
p The recurring need for renovation, refurbishment and
improvement of hotel properties;
Related party transactionsFranchise businessInnVest owns 50% of CHC. The other 50% is owned by
Choice Hotels International, which is one of the largest hotel
franchise companies in the world. CHC earns franchise
revenue by charging monthly royalty fees to licenced hotel
owners based on a percentage of the licenced hotels’
revenues, and by selling franchises.
Under the terms of the joint venture agreement between
Choice Hotels International and a subsidiary of the REIT,
InnVest pays a below market royalty fee for its hotels that are
franchised under the Choice Hotel brands. This arrangement
will remain in place for the duration of the joint venture until
2092. Net royalty payments paid to CHC by the REIT for
the three months ended March 31, 2009 totalled $142
(2008 – $138).
Hotel managementOn July 26, 2002, the REIT entered into a management
agreement for hotel management and accounting services and
an administrative services agreement (the “Agreements”) with
Westmont. Westmont is controlled by a minority unitholder of
the REIT. The Agreements have an initial term of 10 years with
two successive five-year renewal terms, subject to the consent
of Westmont and approval by the REIT. In 2008, InnVest
exercised the first five-year extension term on the Agreements,
extending the expiry to July 25, 2017. The Agreements are
subject to non-competitive arrangements for limited service
hotels in Canada. The Agreements provide for the payment
of an annual management fee to Westmont equal to 3.375%
of gross hotel revenue during the term of the Agreements,
including renewal periods. In addition, Westmont may receive
an annual incentive fee if the REIT achieves distributable
income in excess of $1.25 per unit. No management incentive
fees were paid in the three months ended March 31, 2009
(2008 – $ nil).
In addition to the base management fee and incentive fee,
Westmont is entitled to reasonable fees based on a percentage
of the cost of purchasing certain goods and supplies and
certain construction costs and capital expenditures, fees
for accounting services, reasonable out-of-pocket costs and
expenses, other than general and administrative expenses
or overhead costs except as otherwise provided in the
Administrative Services Agreement, and project management
and general contractor service fees related to hotel renovations
managed by Westmont. Also, for certain hotels owned by
InnVest and not managed by Westmont, Westmont is entitled
to an asset management fee based on a fixed percentage of
the purchase price of the hotel or a fixed percentage of HOI,
subject to an annual minimum fee.
Management and other fees paid to Westmont for the three
months ended March 31, 2009 totalled $4.0 million (2008 –
$4.3 million). These fees represent approximately 65% of total
hotel management and other fees paid by InnVest to the four
hotel management companies with whom it partners.

20 innVest real estate inVestment trust
management’s discussion and analysis
p Increases in expenses of travel, particularly automotive travel;
p Increase in the supply of accommodations in local markets;
p Availability and pricing of financing for operating or capital
requirements; and
p Other factors, including medical concern relating to
travelling to Canada, acts of terrorism, natural disasters,
extreme weather conditions and labour shortages, work
stoppages or disputes.
The REIT mitigates these risks by having a geographically
diverse portfolio of hotels, associated with recognized hotel
brands. In addition, the portfolio benefits from a diverse
customer mix including corporate, government, leisure, local,
crew, sports and other groups, which limits its reliance on
any one individual travel segment. The REIT currently has
a $40 million operating line to ensure that the seasonal
fluctuation in cash flow will not affect its ability to operate in
the normal course of business. As with all debt financing, the
REIT’s ability to renew its credit facility on similar terms will be
dependent on market conditions at the time and the underlying
performance of the assets pledged as collateral for the facility.
Given its size, InnVest has significant buying power and
negotiates favourable national contracts on a regular basis
for operating supplies and renovation materials. The Trust
also enters into fixed rate utility contracts when
deemed appropriate.
InnVest is governed by its Declaration of Trust which is
intended to mitigate risks through financial and operating
management restrictions, limitations and policies such as:
p Eligible investments are restricted primarily to hotels
in Canada;
p Investing in raw land for development and engaging in
the development and construction of new real property
other than property adjacent to an existing owned hotel is
prohibited. In the first quarter of 2008, InnVest completed
the development of one hotel which is adjacent to an
existing owned hotel;
p Individual property mortgages, or mortgages on a pool
of properties, cannot exceed 75% of the value of the
underlying property;
p Debt is limited to 50% of gross asset value before
convertible debentures and 60% including
convertible debentures;
p Units cannot be issued from treasury unless the trustees
consider it not to be dilutive to ensuing annual distributions
of distributable income to existing unitholders;
p The REIT is required to pay annual distributions of not
less than 80% of the annual distributable income, payable
equally on a monthly basis;
p Related party transactions require the approval of two-thirds
of the independent trustees, and any transfers of real
property between related parties requires an independent
appraisal; and
p Any material change to the Master Hotel Management
Agreement requires two-thirds approval of the
independent trustees.
Liquidity risksInnVest utilizes cash flow from operations and credit
facilities to support operating requirements, to fund capital
expenditures, to make acquisitions and to pay distributions
to unitholders. Each year, InnVest sets aside between 3% and
5% of total hotel revenues at each hotel and certain amounts
required for hotel acquisitions for replacing furniture, fixtures
and equipment and capital improvements. Capital
expenditures for the three months ended March 31, 2009
totalled $6.0 million (2008 – $5.9 million). This compares to the
Trust’s FF&E reserve of $5.4 million for the first quarter of 2009
(2008 – $5.8 million). Given the seasonality of hotel operations,
revenues are not earned evenly through the year. Conversely,
capital expenditures are typically scheduled during lower
occupancy periods to avoid guest displacement. However,
in light of the current operating environment, non-essential
capital investments during the first quarter of 2009 have been
limited in order to meet the Trust’s desire to conserve liquidity.
The Trust expects its capital investment to be largely funded
through its FF&E reserve for the year 2009.
The REIT is required to fund capital improvements above
the reserve, or the acquisitions of hotels, principally by issuing
additional units or incurring additional indebtedness. Access to
capital markets for additional unit financings and the availability
of additional borrowing will depend on prevailing market
conditions and the acceptability of the terms offered. In
addition, the Declaration of Trust prohibits the REIT from
incurring or assuming any indebtedness if it would result
in its financial leverage exceeding 50% (60% including
convertible debentures).
The REIT is subject to the risks associated with debt financing,
including the risk that cash flow from operations will be
insufficient to meet required payments of principal and interest,
the risk that existing debt will not be refinanced or that terms
of such refinancings will not be favourable to the REIT.
Similarly, there can be no assurance that the REIT will be able
to complete additional unit financings or borrow additional
funds on terms acceptable to it, or at all. If the REIT were
unable to secure additional funding for acquisitions,
refinancings or capital improvements, it would be required
to curtail these activities, which could have a material adverse
effect on its results of operations and financial condition.

first quarter report 2009 21
management’s discussion and analysis
Furthermore, if the REIT were in need of capital, it could
be required to liquidate one or more investments in hotel
properties at times which may not permit the realization of the
maximum return on such investments or could be required to
agree to additional financing on unfavourable terms. The REIT
attempts to mitigate these potential risks by developing
relationships with its lenders, by seeking out new
sources of capital and by staggering the maturities of
its long-term debt.
Interest rate risksThe REIT’s operations are impacted by interest rates as
interest expense represents a significant cost in the ownership
of hotel real estate investments. As at March 31, 2009, the
REIT has approximately $984.5 million of indebtedness
excluding the convertible debentures, representing a financial
leverage ratio of approximately 47.7% and approximately
$1.2 billion of indebtedness including the convertible
debentures, representing a financial leverage ratio of
approximately 57.0%. At March 31, 2009, total indebtedness
excluding convertible debentures had a 3.5 year weighted
average term to maturity bearing a weighted average interest
rate of 5.6% and a weighted average effective interest rate
of 5.7%. Should such amounts be refinanced upon maturity
at an aggregate interest rate differential of 100 basis points,
the REIT’s operations would be impacted by approximately
$9.8 million annually.
The REIT seeks to reduce its interest rate risk by staggering
the maturities of long-term debt and limiting the use of floating
rate debt so as to minimize exposure to interest rate
fluctuations. At March 31, 2009, 9.7% of the REIT’s aggregate
long-term debt was at floating interest rates.
Proposed tax changes to income trustsInnVest currently qualifies as a Mutual Fund Trust for income
tax purposes. As required by its Declaration of Trust, InnVest
intends to distribute all taxable income to its unitholders and
to deduct these distributions for income tax purposes.
In June 2007, a Bill was enacted for the taxation of publicly
traded trusts, including income trusts (the “Bill”). The Bill
applies to publicly traded trusts which existed prior to
November 1, 2006 starting with taxation years ending in 2011,
except for those existing trusts that qualify for the real estate
investment trust (“Qualifying REIT”) exception included in the
legislation. An existing trust may lose its relief from taxation
in the interim periods to 2011 where it undergoes “undue
expansion”. Based on the guidelines, InnVest can issue,
on a cumulative basis, a total of approximately $143 million
in equity annually in each of 2008 through 2010 and maintain
its relief from taxation to the end of 2010. For the year ended
December 31, 2008, the REIT issued $13.5 million in equity,
primarily resulting from the issuance of units through the DRIP
as well as executive and trustee equity compensation. For the
three months ended March 31, 2009, the REIT issued $775
in equity.
Pursuant to the legislation, a REIT which carries on Canadian
hotel operations (including through subsidiaries) will not
be a Qualifying REIT. As a result, InnVest, as is presently
constituted, will be subject to tax starting January 1, 2011.
The Bill may adversely affect the level of cash distributions
to unitholders commencing in 2011 if InnVest does not
become a Qualifying REIT by then. Management is reviewing
various options to address this change including, among
others, whether it is feasible to reorganize InnVest so that
non-qualifying operations and assets are transferred under a
plan of arrangement to a taxable entity that is held by InnVest
unitholders, and the InnVest hotels, which will continue to
be owned by the REIT, are leased by it to the taxable entity.
It is not possible at this preliminary juncture to provide any
assurances that any such reorganization or a similar
reorganization can or will be implemented before 2011, or that
any such reorganization, if implemented, would not result in
material costs or other adverse consequences to InnVest and
its unitholders.
Critical accounting estimatesThe REIT’s unaudited consolidated financial statements for
the three months ended March 31, 2009 were prepared in
accordance with GAAP. The significant accounting policies
used in the preparation of the interim consolidated financial
statements are consistent with those reported in the audited
consolidated financial statements for the year ended
December 31, 2008. GAAP requires management to make
estimates and assumptions concerning the reported amounts
of assets and liabilities and the disclosure of contingent assets
and liabilities at the balance sheet date and the reported
amounts of revenue and expenses during the reporting period.
Management uses its judgment and knowledge from past
experience as a basis for estimates and other assumptions
required in the preparation of the financial statements.
Management’s estimates and assumptions are evaluated and

22 innVest real estate inVestment trust
management’s discussion and analysis
updated on a regular basis taking into account current market
conditions. The actual results for the REIT may materially
differ, if management were to use different estimates
and assumptions.
The REIT’s MD&A for the year ended December 31, 2008
contains a discussion of InnVest’s significant accounting
policies most affected by estimates and judgments used in
the preparation of its financial statements, being its accounting
policies relating to the expected life of hotel properties, the
allocation of purchase prices for acquired hotels, the valuation
of hotel properties, the fair value of mortgages and debentures
payable, defined benefit pension plans, income taxes and
other real estate properties. Management has determined that
at March 31, 2009, there is no change to its assessment of its
significant accounting policies most affected by estimates and
judgments as detailed in the MD&A for the year ended
December 31, 2008.
Changes in significant accounting policiesThe accounting policies followed in the preparation of the
accompanying financial statements are consistent with those
as set out in the audited financial statements for the year
ended December 31, 2008, except as follows:
Goodwill and intangible assetsEffective January 1, 2009, the REIT adopted the Canadian
Institute of Chartered Accountants (“CICA”) Section 3064 –
Goodwill and Intangible Assets. Section 3064 replaces
Handbook Section 3062 – Goodwill and Other Intangible
Assets and Handbook Section 3450 – Research and
Development Costs. Section 3064 establishes standards for
the recognition, measurement and disclosure of goodwill and
intangible assets. There was no material impact of this
standard to the REIT.
Future accounting changesThe following are upcoming accounting changes to
Canadian GAAP that will have an impact on InnVest’s
financial statements.
International financial reporting standardsIn early 2008, the Canadian Accounting Standards Board
confirmed January 1, 2011 as the date IFRS will replace
current Canadian standards and interpretations as Canadian
GAAP for publicly accountable enterprises. The transition date
of January 1, 2011 will require the restatement for comparative
purposes of amounts reported by the REIT for the year ending
December 31, 2010. The REIT will convert to these new
standards according to the timetable set with these rules.
InnVest has established an implementation team comprised
of members of senior management to facilitate the conversion
to IFRS. This implementation team continues to develop a
comprehensive conversion plan to convert its consolidated
financial statements to IFRS as required. The conversion plan
will address matters including changes in accounting policies,
the restatement of comparative periods, organizational and
internal control, the modification of existing systems and the
training and awareness of staff, in addition to other related
business matters. The evaluation of the potential impact
of IFRS on InnVest’s consolidated financial statements will be
an ongoing process as new standards and recommendations
are issued leading up to the implementation date.
InnVest has identified IFRS versus Canadian GAAP differences
and various policy choices available under IFRS, but continues
to assess the implications of such differences and policy
choices for its financial reporting. The main differences
identified to date relate to the accounting for the Trust’s hotel
properties, the impairment testing thereof, and accounting for
joint ventures and business combinations. As appropriate, the
Trust’s internal controls and system requirements will be
adapted based on any changes in policies implemented.
To date, the Trust has not arrived at any definitive conclusion
regarding its election options for key standards under IFRS.

first quarter report 2009 23
management’s discussion and analysis
While not expected to impact the determination of cash flow
from operations, changing from current Canadian GAAP to
IFRS may materially affect InnVest’s reported financial position
and results of operations. At this preliminary stage, the
REIT cannot quantify the impact of the IFRS changeover
on its financial reporting.
Business combinationsIn January 2009, the CICA issued new accounting standards
concerning Section 1582 – Business Combinations,
Section 1602 – Non-controlling Interests and Section 1601 –
Consolidated Financial Statements, which are based on the
International Accounting Standards Board’s (“IASB”)
International Financial Reporting Standard 3 – Business
Combinations. The new standards replace the existing
guidance on business combinations and consolidated financial
statements. The objective of the new standards is to
harmonize Canadian accounting for business combinations
with international and U.S. accounting standards. The
new standards are to be applied prospectively to business
combinations for which the acquisition date is on or after the
beginning of the first annual reporting period beginning on
or after January 1, 2011, with earlier application permitted.
Assets and liabilities that arose from business combinations
whose acquisition dates preceded the application of the new
standards shall not be adjusted upon application of these new
standards. The Non-controlling Interests standard shall be
applied retrospectively except for certain items.
The REIT is assessing whether it will apply the new accounting
standards at the beginning of its 2011 fiscal year or elect to
early adopt the new accounting standards at the beginning
of its 2010 fiscal year in order to minimize the amount of
restatement when the REIT adopts IFRS. The impact of the
new standards on the Trust’s results of operations, financial
position and disclosures will be assessed as part of the REIT’s
IFRS transition project.
Controls and procedures At March 31, 2009, the Chief Executive Officer and Chief
Financial Officer of the Trust, along with the assistance of
senior management, have designed disclosure controls and
procedures to provide reasonable assurance that material
information relating to InnVest is made known to the CEO
and CFO, and have designed internal controls over financial
reporting to provide reasonable assurance regarding the
reliability of financial reporting and the preparation of financial
statements in accordance with GAAP. There were no changes
in the Trust’s internal controls over financial reporting that
occurred during the interim period ended March 31, 2009
that have significantly affected, or are reasonably likely
to significantly affect, the Trust’s internal controls over
financial reporting.

24 innVest real estate inVestment trust
consolidated financial statements
Consolidated balance sheets(in thousands of dollars) (unaudited) March 31, 2009 December 31, 2008
(Restated, Note 21)
ASSETS
Current assets
Cash $ 10,470 $ 18,143
Accounts receivable 23,902 27,319
Prepaid expenses and other assets 12,090 8,861
Assets held for sale (Note 21) 818 610
47,280 54,933
Restricted cash 2,472 3,013
Hotel properties (Note 3) 1,779,908 1,792,828
Other real estate properties (Note 4) 15,987 16,078
Licence contracts (Note 5) 17,524 17,853
Intangible and deferred assets (Note 6) 39,988 42,165
Assets held for sale (Note 21) 49,741 50,234
$ 1,952,900 $ 1,977,104
LIABILITIES
Current liabilities
Bank indebtedness (Note 7) $ 29,200 $ 9,000
Accounts payable and accrued liabilities 68,386 71,876
Acquisition related liabilities 2,332 2,561
Distributions payable 4,652 4,651
Current portion of long-term debt (Note 8) 11,215 10,763
Liabilities related to assets held for sale (Note 21) 1,052 1,157
116,837 100,008
Long-term debt (Note 8) 927,559 930,317
Other long-term obligations (Note 9) 7,199 7,139
Convertible debentures (Note 10) 180,929 180,170
Future income tax liability (Note 12) 204,046 210,977
Long-term liabilities related to assets held for sale (Note 21) 9,899 12,763
1,446,469 1,441,374
UNITHOLDERS’ EQUITY 506,431 535,730
$ 1,952,900 $ 1,977,104
The accompanying notes are an integral part of these consolidated financial statements.
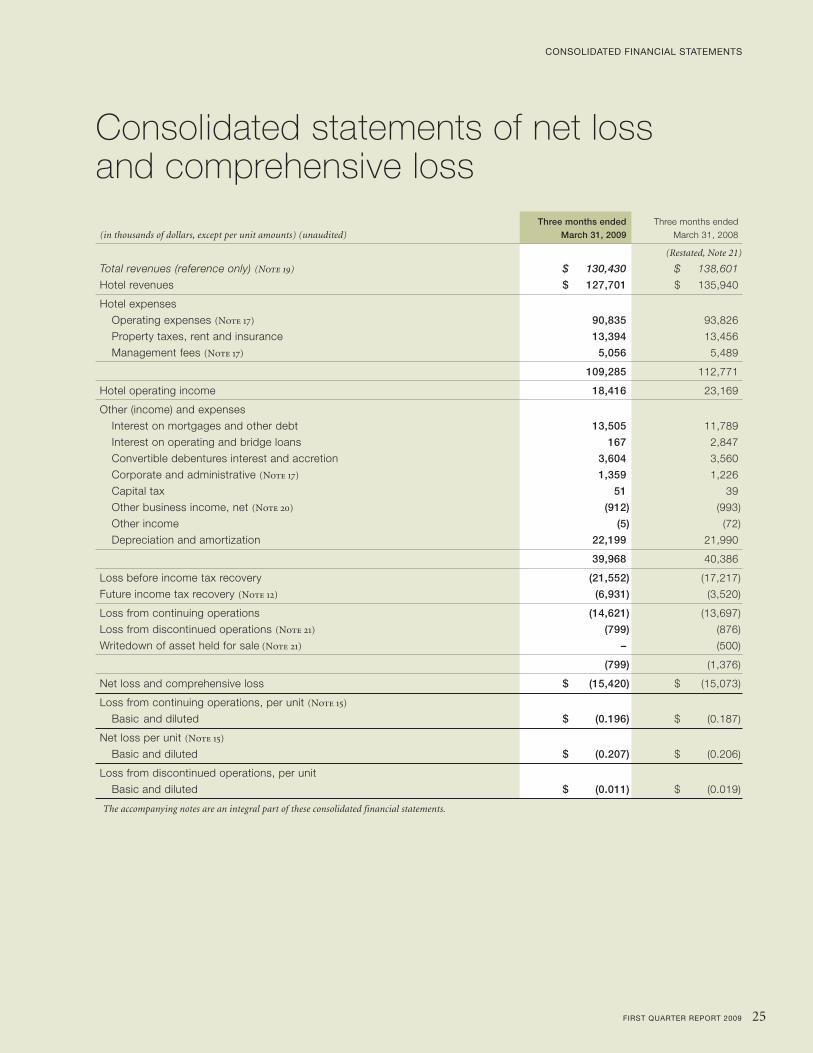
first quarter report 2009 25
consolidated financial statements
Consolidated statements of net loss and comprehensive loss Three months ended Three months ended
(in thousands of dollars, except per unit amounts) (unaudited) March 31, 2009 March 31, 2008
(Restated, Note 21)
Total revenues (reference only) (Note 19) $ 130,430 $ 138,601
Hotel revenues $ 127,701 $ 135,940
Hotel expenses
Operating expenses (Note 17) 90,835 93,826
Property taxes, rent and insurance 13,394 13,456
Management fees (Note 17) 5,056 5,489
109,285 112,771
Hotel operating income 18,416 23,169
Other (income) and expenses
Interest on mortgages and other debt 13,505 11,789
Interest on operating and bridge loans 167 2,847
Convertible debentures interest and accretion 3,604 3,560
Corporate and administrative (Note 17) 1,359 1,226
Capital tax 51 39
Other business income, net (Note 20) (912) (993)
Other income (5) (72)
Depreciation and amortization 22,199 21,990
39,968 40,386
Loss before income tax recovery (21,552) (17,217)
Future income tax recovery (Note 12) (6,931) (3,520)
Loss from continuing operations (14,621) (13,697)
Loss from discontinued operations (Note 21) (799) (876)
Writedown of asset held for sale (Note 21) – (500)
(799) (1,376)
Net loss and comprehensive loss $ (15,420) $ (15,073)
Loss from continuing operations, per unit (Note 15)
Basic and diluted $ (0.196) $ (0.187)
Net loss per unit (Note 15)
Basic and diluted $ (0.207) $ (0.206)
Loss from discontinued operations, per unit
Basic and diluted $ (0.011) $ (0.019)
The accompanying notes are an integral part of these consolidated financial statements.

26 innVest real estate inVestment trust
consolidated financial statements
Consolidated statements of unitholders’ equity Net income (loss) and Holders’
(in thousands of dollars) comprehensive Contributed Executive conversion
(unaudited) income (loss) Distributions Deficit Units in $ surplus compensation option Total
Balance December 31, 2007 $ 137,923 $ (299,691) $ (161,768) $ 757,375 $ – $ 417 $ 8,642 $ 604,666
CHANGES DURING THE PERIOD
Net loss and comprehensive loss (15,073) – (15,073) – – – – (15,073)
Unit distributions (Note 16) – (20,618) (20,618) – – – – (20,618)
Distribution reinvestment
plan units issued – – – 3,873 – – – 3,873
Vested executive compensation – – – 151 – (151) – –
Executive and
trustee compensation – – – 38 – 117 – 155
Balance March 31, 2008 $ 122,850 $ (320,309) $ (197,459) $ 761,437 $ – $ 383 $ 8,642 $ 573,003
Balance December 31, 2008 $134,546 $ (378,164) $ (243,618) $ 768,034 $ 1,938 $ 734 $ 8,642 $ 535,730
CHANGES DURING THE PERIOD
Net loss and
comprehensive loss (15,420) – (15,420) – – – – (15,420)
Unit distributions (Note 16) – (13,956) (13,956) – – – – (13,956)
Distribution reinvestment
plan units issued – – – 660 – – – 660
Units repurchased pursuant
to normal course
issuer bid (Note 14) – – – (2,180) 1,491 – – (689)
Conversion of debentures – – – 20 – – – 20
Vested executive compensation – – – 170 – (170) – –
Executive and
trustee compensation – – – 38 – 48 – 86
Balance March 31, 2009 $ 119,126 $ (392,120) $ (272,994) $ 766,742 $ 3,429 $ 612 $ 8,642 $ 506,431
The accompanying notes are an integral part of these consolidated financial statements.

first quarter report 2009 27
consolidated financial statements
Consolidated statements of cash flows Three months ended Three months ended
(in thousands of dollars) (unaudited) March 31, 2009 March 31, 2008
(Restated, Note 21)
OPERATING ACTIVITIES
Loss from continuing operations $ (14,621) $ (13,697)
Add (deduct) items not affecting operations
Depreciation and amortization 22,199 21,990
Non-cash portion of interest expense 914 549
Future income tax recovery (6,931) (3,520)
Non-cash executive and trustee compensation 86 155
Convertible debentures accretion 290 287
Discontinued operations (560) (73)
Changes in non-cash working capital (3,562) (6,152)
(2,185) (461)
FINANCING ACTIVITIES
Repayment of long-term debt (2,653) (157,228)
Proceeds from long-term debt – 387,486
Units repurchased pursuant to normal course issuer bid (Note 14) (689) –
Unit distributions (13,295) (16,703)
Increase in operating loan 20,200 15,600
Proceeds from bridge loan – 8,907
Repayment of bridge loan – (215,000)
Discontinued operations repayment of debt (2,886) (101)
677 22,961
INVESTING ACTIVITIES
Capital expenditures on hotel properties (5,937) (5,843)
Discontinued operations capital expenditures (31) (76)
Hotel under development expenditures (82) (3,818)
Change in intangible and deferred assets (656) (431)
Acquisition of hotel property – (17,175)
Decrease in restricted cash 541 71
(6,165) (27,272)
Decrease in cash during the period (7,673) (4,772)
Cash, beginning of period 18,143 22,271
Cash, end of period $ 10,470 $ 17,499
Supplemental disclosure of cash flow information:
Cash paid for interest $ 15,686 $ 14,823
Cash paid for income taxes (including capital tax) $ 76 $ 68
The accompanying notes are an integral part of these consolidated financial statements.

28 innVest real estate inVestment trust
notes to consolidated financial statements
Notes to consolidated financial statementsMarch 31, 2009 (all dollar amounts are in thousands, except unit and per unit amounts) (unaudited)
Note 1 Basis of presentation
InnVest Real Estate Investment Trust (“InnVest” or the “REIT”) is an unincorporated open-ended real estate investment trust
governed by the laws of Ontario. The REIT began operations on July 26, 2002. The units of the REIT are traded on the Toronto
Stock Exchange under the symbol of “INN.UN”. As at March 31, 2009, the REIT owned 147 Canadian hotels operated under
international brands and has a 50% interest in Choice Hotels Canada Inc. (“CHC”).
The accompanying unaudited interim consolidated financial statements are prepared in accordance with Canadian generally
accepted accounting principles (“GAAP”). The accounting principles used in these financial statements are consistent with those
used in the annual consolidated financial statements for the year ended December 31, 2008, except as disclosed in Note 2.
These financial statements do not include all the information and disclosure required by GAAP for annual financial statements,
and should be read in conjunction with the annual consolidated financial statements for the year ended December 31, 2008.
Revenues earned from hotel operations fluctuate throughout the year, with the third quarter being the highest due to the
increased level of leisure travel in the summer months, and the first quarter being the lowest as leisure travel tends to be lower
at that time of year.
Note 2 Change in significant accounting policies
Goodwill and intangible assetsEffective January 1, 2009, the REIT adopted the Canadian Institute of Chartered Accountants (“CICA”) Section 3064 – Goodwill
and Intangible Assets. The standard was applied retrospectively. This new standard has no material impact to the REIT.
Note 3 Hotel properties
Accumulated March 31, 2009 December 31, 2008
Cost depreciation net book value net book value
(Restated, Note 21)
Land $ 184,248 $ – $ 184,248 $ 184,248
Buildings 1,691,837 185,741 1,506,096 1,517,708
Furniture, fixtures and equipment 145,979 56,415 89,564 90,872
$ 2,022,064 $ 242,156 $ 1,779,908 $ 1,792,828
As at March 31, 2009, the two hotels accounted for as development properties with a combined net book value of $35,302
(December 31, 2008 – $35,352) no longer meet the criteria under the REIT’s accounting policy for newly built hotels acquired or
developed and as such are now considered operating hotel properties subject to depreciation. Capitalized net operating losses
for the three months ended March 31, 2009 were $82 (December 31, 2008 – $ 838). These losses include mortgage interest
capitalized of $87 (year ended December 31, 2008 – $1,009).

first quarter report 2009 29
notes to consolidated financial statements
Note 4 Other real estate properties
Other real estate properties include office and retail properties and a retirement residence.
Accumulated March 31, 2009 December 31, 2008
Cost depreciation net book value net book value
Land $ 1,624 $ – $ 1,624 $ 1,624
Buildings 15,425 1,102 $ 14,323 14,412
Furniture, fixtures and equipment 73 33 $ 40 42
$ 17,122 $ 1,135 $ 15,987 $ 16,078
Note 5 Licence contracts
Accumulated March 31, 2009 December 31, 2008
Cost amortization net book value net book value
Licence contracts $ 26,320 $ 8,796 $ 17,524 $ 17,853
During the three months ended March 31, 2009, the licence contracts were amortized by $329 (March 31, 2008 – $329).
Note 6 Intangible and deferred assets
Accumulated March 31, 2009 December 31, 2008
Cost amortization net book value net book value
(Restated, Note 21)
Customer relationships $ 48,794 $ 17,226 $ 31,568 $ 33,918
Tenant relationships 2,595 1,446 $ 1,149 1,270
Franchise rights 2,375 1,107 $ 1,268 716
Lease origination costs 6,256 707 $ 5,549 5,741
Other 1,046 592 $ 454 503
Total intangible assets 61,066 21,078 39,988 42,148
Deferred financing costs related
to bridge loan – – – 17
$ 61,066 $ 21,078 $ 39,988 $ 42,165
During the three months ended March 31, 2009, the intangible assets were amortized by $2,810 (March 31, 2008 – $2,470) and
the deferred financing costs related to the bridge loans were amortized by $17 (March 31, 2008 – $1,314).

30 innVest real estate inVestment trust
notes to consolidated financial statements
Note 7 Bank indebtedness
The REIT has a $40,000 operating line that bears interest at the Canadian bank prime rate plus 0.5%. It is secured by 14 properties
and is due August 1, 2009.
Proceeds of $9,000 from a bridge loan were received on March 19, 2008, for 365 days, whereby the REIT provided an additional
unencumbered hotel as security. This loan was extended to August 1, 2009 during the quarter, which included a pay-down of
$2,000, made on April 7, 2009. The extension bears interest at Canadian Bankers’ Acceptance rate plus 3.5% and requires
interest payments only.
There is a risk that bank lenders will not refinance the bank credit facility on terms and conditions acceptable to the REIT or on
any terms at all.
March 31, 2009 December 31, 2008
Operating line $ 20,200 $ –
Bridge loan 9,000 9,000
$ 29,200 $ 9,000
Note 8 Long-term debt
March 31, 2009 December 31, 2008
(Restated, Note 21)
Mortgages payable $ 945,395 $ 948,064
Less debt issuance costs (6,621) (6,984)
Total long-term debt 938,774 941,080
Less current portion (11,215) (10,763)
Net long-term debt $ 927,559 $ 930,317
Substantially all of the REIT’s assets have been pledged as security under debt agreements. At March 31, 2009, long-term debt
had a weighted average interest rate of 5.6% (December 31, 2008 – 5.7%) and a weighted average effective interest rate of 5.7%
(December 31, 2008 – 5.8%). The long-term debt is repayable in average monthly payments of principal and interest totalling
$5,235 (December 31, 2008 – $5,483) per month, and matures at various dates from July 25, 2010 to March 21, 2018.
Scheduled repayment of long-term debt is as follows:
Scheduled repayments Due on maturity Total
2009 (remainder of the year) $ 8,449 $ – $ 8,449
2010 9,492 169,748 179,240
2011 9,593 318,858 328,451
2012 11,012 12,387 23,399
2013 11,355 – 11,355
2014 and thereafter 10,613 383,888 394,501
$ 60,514 $ 884,881 $ 945,395
The current portion of long-term debt on the balance sheet is based on the twelve months ending March 31, 2010, whereas the
repayment schedule above reflects the fiscal year.
The estimated fair value of the REIT’s long-term debt at March 31, 2009 was approximately $913,219 (December 31, 2008 –
$933,784). This estimate was determined by discounting expected cash flows at the interest rates currently being offered to the
REIT for debt of the same remaining maturities.

first quarter report 2009 31
notes to consolidated financial statements
Long-term debt includes $91,937 (December 31, 2008 – $92,129) of mortgages payable, which are subject to floating interest
rates. Annual interest expense will increase by $919 for every 1% increase in the base Bankers’ Acceptance rate.
Interest expense on mortgages and other debt, interest on operating and bridge loans, as well as convertible debentures interest
are considered operating items in the statement of cash flows.
The REIT has access to a loan facility, granted in conjunction with property mortgages, of up to $23,904 available to fund 50%
to 100% of capital expenditures incurred at individual hotels. During the quarter ended March 31, 2009, the REIT has drawn
$nil on this facility (December 31, 2008 – $12,196). Subsequent to March 31, 2009, the REIT drew an additional $6,888 from
this facility, in the ordinary course of business.
Note 9 Other long-term obligations
March 31, 2009 December 31, 2008
(Restated, Note 21)
Capital leases $ 1,662 $ 1,662
Other lease obligations 685 658
2,347 2,320
Less current portion (195) (195)
Total lease obligations 2,152 2,125
Pension liability 3,539 3,522
Asset retirement obligation 1,508 1,492
Total other long-term obligations $ 7,199 $ 7,139
Defined benefit pension plansThe defined benefit pension plans were assumed pursuant to the acquisition of certain hotels in 2006 and 2007. The most recent
actuarial valuation with respect to the funding of the REIT’s pension plans was prepared on March 31, 2009.
The pension plan assets as at March 31, 2009 consist of the following:
Non-union
Management non-management
pension pension March 31, 2009 December 31, 2008
benefit plans benefit plans total benefit plans total benefit plans
Accrued benefit obligation $ 4,598 $ 1,034 $ 5,632 $ 5,513
Fair value of plan assets 2,197 944 3,141 3,263
Funded status - plan deficit 2,401 90 2,491 2,250
Unamortized net actuarial gain 786 262 1,048 1,272
Accrued employee future
benefit liability $ 3,187 $ 352 $ 3,539 $ 3,522
The pension expense for the three months ended March 31, 2009 is $98 (March 31, 2008 – $337).

32 innVest real estate inVestment trust
notes to consolidated financial statements
Note 10 Convertible debentures
The details of the three series of convertible debentures are outlined in the tables below:
Effective Original Converted Face Holders’ Interest interest face to trust amount conversion Transaction March 31, Debenture Maturity date rate rate amount units outstanding option Accretion costs 2009
Series A April 15, 2011 6.25% 7.73% $ 57,500 $ (11,736) $ 45,764 $ (2,289) $ 1,467 $ (56) $ 44,886
Series B May 31, 2013 6.00% 7.53% 75,000 (20) 74,980 (3,400) 1,361 (2,058) 70,883
Series C August 1, 2014 5.85% 7.42% 70,000 – 70,000 (2,953) 678 (2,565) 65,160
$ 202,500 $ (11,756) $ 190,744 $ (8,642) $ 3,506 $ (4,679) $ 180,929
Effective Original Converted Face Holders’ Interest interest face to trust amount conversion Transaction December 31, Debenture Maturity date rate rate amount units outstanding option Accretion costs 2008
Series A April 15, 2011 6.25% 7.73% $ 57,500 $ (11,736) $ 45,764 $ (2,289) $ 1,398 $ (333) $ 44,540
Series B May 31, 2013 6.00% 7.53% 75,000 – 75,000 (3,400) 1,241 (2,173) 70,668
Series C August 1, 2014 5.85% 7.42% 70,000 – 70,000 (2,953) 577 (2,662) 64,962
$ 202,500 $ (11,736) $ 190,764 $ (8,642) $ 3,216 $ (5,168) $ 180,170
The fair value of the REIT’s convertible debentures based on their trading prices on the Toronto Stock Exchange at
March 31, 2009 is $102,745 (December 31, 2008 – $102,108).
Note 11 Capital management
The REIT manages its capital, which is defined as the aggregate of unitholders’ equity and debt, under the terms of the
Declaration of Trust. The REIT’s capital management objectives are (i) to ensure compliance with debt and investment restrictions
outlined in its Declaration of Trust as well as external existing debt covenants, (ii) to allow for the implementation of its acquisition
strategy and hotel property refurbishment program, and (iii) to build long-term unitholder value. Issuances of equity and debt are
approved by the Board of Trustees (the “Board”) through their review and approval of the REIT’s strategic plan and annual budget
plan, along with changes to the approved plans periodically throughout each year.
At March 31, 2009, InnVest’s primary contractual obligations consisted of long-term mortgage obligations and convertible
debentures. InnVest is not permitted to exceed certain financial leverage amounts under the terms of the Declaration of Trust.
The REIT is permitted to hold indebtedness excluding convertible debentures up to a level of 50% of gross asset value. Further,
the REIT is permitted to have indebtedness and convertible debentures up to a level of 60% of gross asset value. The Declaration
of Trust also governs that individual property mortgages, or mortgages on a pool of properties, cannot exceed 75% of the fair
value of the underlying property. InnVest calculates indebtedness in accordance with GAAP excluding non-interest bearing
indebtedness, trade accounts payable, and any future income tax liability. InnVest calculates gross asset value as the total book
value of assets on the REIT’s balance sheet, plus accumulated depreciation and amortization, less future income tax liabilities.

first quarter report 2009 33
notes to consolidated financial statements
At March 31, 2009, the REIT’s leverage excluding and including convertible debentures was 47.7% and 57.0% respectively,
calculated as follows:
March 31, 2009 December 31, 2008
Total assets per consolidated
balance sheet $ 1,952,900 $ 1,977,104
Accumulated depreciation
and amortization 295,696 269,331
Future income tax liability (204,046) (210,977)
Future income tax liability not
included in assets 18,695 18,834
Gross asset value $ 2,063,245 $ 2,054,292
Book value of mortgages
and other indebtedness1 $ 984,494 47.7% $ 970,071 47.2%
Convertible debentures2 190,744 9.3% 190,764 9.3%
$ 1,175,238 57.0% $ 1,160,835 56.5%
1. Adjusted to eliminate financing issuance costs and include long-term debt related to assets held for sale.
2. Adjusted to face value.
The REIT’s Declaration of Trust also includes guidelines that limit capital expended to, among other items, the following:
(a) Direct and indirect investments in real property on which hotels are situated and the hotel business conducted thereon,
primarily in Canada, and in entities whose activities consist primarily of franchising hotels;
(b) Temporary investments held in cash, deposits with a Canadian Chartered bank or trust company, short term government debt
securities or in money market instruments of, or guaranteed by, a Schedule 1 Canadian bank, short term commercial paper,
notes, bonds of other debt securities of a Canadian entity having a rating of at least R-1 (Mid) by Dominion Bond Rating
Service or A-1 (Mid) by Standard & Poor’s Corporation maturing prior to one year from the date of issue; and
c) Investments in mortgages or mortgage bonds, where the related security is a first mortgage on income producing real property
which otherwise complies with (a) above and is subject to certain leverage limits and debt service coverage. The aggregate
value of such investments shall not exceed 20% of the unitholders’ equity.
The REIT is in compliance with these guidelines.
The REIT is also subject to certain restrictions on the issuance of equity as discussed in Note 12. The REIT can issue
on a cumulative basis a total of approximately $143,000 in equity annually in each of 2009 and 2010 and maintain its
relief from taxation to the end of 2010. The REIT issued $888 in equity during the three months ended March 31, 2009
(March 31, 2008 – $4,063).
As outlined in the Declaration of Trust, the REIT is required to distribute monthly to unitholders not less than one-twelfth of
eighty percent (80%) of distributable income of the REIT for the calendar year (see Note 16).
The REIT maintains an operating line of $40,000 with a Canadian Chartered bank with the following covenants in addition to
the leverage limits under the Declaration of Trust:
(a) Trailing twelve months consolidated earnings before interest, taxes, depreciation and amortization (“EBITDA”) to
consolidated interest expense of not less than 2.0 times (actual being 2.6 times at March 31, 2009 and 2.7 times at
December 31, 2008, respectively);
(b) Trailing twelve months consolidated EBITDA to consolidated debt service of not less than 1.5 times (actual being
2.3 times at March 31, 2009 and 2.3 times at December 31, 2008); and
(c) Unitholders’ Equity of not less than $300,000 (actual being $506,431 at March 31, 2009 and $535,730 at
December 31, 2008, respectively).

34 innVest real estate inVestment trust
notes to consolidated financial statements
Note 12 Income taxes and future income tax liability
The REIT currently qualifies as a Mutual Fund Trust for income tax purposes. As required by its Declaration of Trust, the REIT
intends to distribute all taxable income to its unitholders and to deduct these distributions for income tax purposes (see Note 16).
In June 2007, a Bill was enacted for the taxation of publicly traded trusts, including income trusts (the “Bill”). The Bill applies to
publicly traded trusts which existed prior to November 1, 2006 starting with taxation years ending in 2011, except for those trusts
that qualify for the real estate investment trust (“Qualifying REIT”) exception included in the legislation. An existing trust may lose
its relief from taxation in the interim periods to 2011 where it undergoes “undue expansion”. Pursuant to the legislation, a REIT
which carries on Canadian hotel operations (including through subsidiaries) will not be a Qualifying REIT. As a result, the REIT
will be subject to tax starting January 1, 2011.
The Bill may adversely affect the level of cash distribution to unitholders commencing in 2011 if the REIT does not become a
Qualifying REIT by then. Management is reviewing whether it is feasible to reorganize the REIT so that non-qualifying operations
and assets are transferred under a plan of arrangement to a taxable entity that is held by the REIT unitholders, and that the REIT
hotels, which continue to be owned by the REIT, are leased by it to the taxable entity. It is not possible at this preliminary juncture
to provide any assurances that any such reorganization or a similar reorganization can or will be implemented before 2011,
or that any such reorganization, if implemented, would not result in material costs or other adverse consequences to the REIT
and its unitholders.
Note 13 Financial instruments
Risk managementIn the normal course of business, the REIT is exposed to a number of risks that can affect its operating performance. These risks,
and the actions taken to manage them, are as follows:
Interest rate risk
The time period over which management is spreading debt maturities implies an average term to maturity of approximately five
years. This strategy reduces the REIT’s exposure to re-pricing risk resulting from short-term interest rate fluctuations in any one
year. Management is of the view that such a strategy will provide the most effective interest rate risk management for debt.
The REIT’s floating rate debt balance is monitored by management to minimize the REIT’s exposure to interest rate fluctuations.
As at March 31, 2009, the REIT’s floating rate debt balance of $91,937 (December 31, 2008 – $92,129) is approximately 9.7%
of total long-term debt.
Credit risk
Credit risk relates to the possibility that hotel guests, either individual or corporate, do not pay the amounts owed to the REIT.
The REIT mitigates this risk by limiting its exposure to customers allowed to pay by invoice after check out (“direct bill”). Accounts
receivable as at March 31, 2009 is $23,902 (December 31, 2008 – $27,319). InnVest reviews accounts receivable and the
allowance for doubtful accounts is adjusted for any balances which are determined by management to be uncollectable.
This provision adjustment is expensed in the hotel operating income. The allowance as at March 31, 2009 is $623 or 2.6%
(December 31, 2008 – $805 or 2.9%) of total receivables. The amount credited in the operating income for the three months
ended March 31, 2009 is $100, due to amounts provided for, which were subsequently collected (March 31, 2008 – $49).
Liquidity risk
Liquidity risk arises from the possibility of not having sufficient debt and equity capital available to the REIT to fund its growth and
capital maintenance programs and refinance its obligations as they arise.

first quarter report 2009 35
notes to consolidated financial statements
There is a risk that lenders will not refinance maturing debt on terms and conditions acceptable to the REIT or on any terms
at all. Management’s strategy mitigates the REIT’s exposure to an excessive amount of debt maturing in any one year. There is
also a risk that bank lenders will not refinance the operating credit facility on terms and conditions acceptable to the REIT or on
any terms at all.
Estimated maturities of the REIT’s financial liablities for the next 24 months:
Remainder Three months ending Contractual
of 2009 2010 March 31, 2011 Cash flows1
Mortgage payable – principal $ 8,449 $ 179,240 $ 269,899 $ 457,588
Mortgage payable – interest2 41,187 50,229 9,665 101,081
Convertible debentures – interest 9,408 11,455 2,047 22,910
Bank loans – principal 9,000 – – 9,000
Bank loans – interest 94 – – 94
Total $ 68,138 $ 240,924 $ 281,611 $ 590,673
1. Contractual cash flows include principal and interest payments for the next 24 months and ignore extensions options available to the REIT.
2. Interest amounts for floating rate debt is based on interest rates prevailing at March 31, 2009.
Fair valuesThe fair values of the REIT’s financial assets and liabilities, representing net working capital, approximate their recorded values
at March 31, 2009 and December 31, 2008 due to their short-term nature.
The fair value of the REIT’s long-term debt is less than the carrying value by approximately $32,176 at March 31, 2009
(December 31, 2008 – $24,476) due to changes in interest rates since the dates on which the individual mortgages were
arranged. The fair value of long-term debt has been estimated based on the current market rates for mortgages with similar
terms and conditions.
The fair value of the REIT’s convertible debentures is less than the carrying value by approximately $78,184 at March 31, 2009
(December 31, 2008 – $78,062). The fair value of convertible debentures has been estimated based on the market rates for
convertible debentures, as at March 31, 2009 and December 31, 2008.
Letters of creditAs at March 31, 2009, the REIT has letters of credit totalling $3,693 (December 31, 2008 – $3,693) held on behalf of security
deposits for various utility companies and liquor licences, and additional security for the pension liabilities.

36 innVest real estate inVestment trust
notes to consolidated financial statements
Note 14 Unitholders’ equity
The REIT is authorized to issue an unlimited number of units, each of which represents an equal undivided beneficial interest in
any distributions from the REIT. All units are of the same class with equal rights and privileges. Per the Declaration of Trust, units
cannot be issued from treasury unless the trustees consider it not to be dilutive to ensuing annual distributions of distributable
income to existing unitholders.
Units Amount
Balance at December 31, 2007 73,000,694 $ 757,375
Units issued under distribution reinvestment plan 427,230 3,873
Units issued for vested executive compensation plan 16,033 151
Units issued under trustee compensation plan 3,711 38
Balance at March 31, 2008 73,447,668 $ 761,437
Balance at December 31, 2008 74,412,317 $ 768,034
Units issued under distribution reinvestment plan 202,067 660
Units repurchased pursuant to normal course issuer bid (211,500) (2,180)
Units issued on conversion of debentures 1,342 20
Units issued for vested executive compensation plan 19,052 170
Units issued under trustee compensation plan 11,060 38
Balance at March 31, 2009 74,434,338 $ 766,742
Pursuant to the REIT’s normal course issuance bid (the “Bid”), the REIT purchased and cancelled 211,500 units
(December 31, 2008 – 278,500 units) at an average price of $3.26 per unit (December 31, 2008 – $3.36 per unit). The REIT
recognized $1,491 of contributed surplus (December 31, 2008 – $1,938) upon the cancellation of these units. Purchases under
the Bid commenced on November 11, 2008 and will terminate on November 10, 2009.
Trustee compensation planThe members of the Board of Trustees receive 50% of their annual retainer in units (based on the then current market price of the
units). The REIT has set aside 100,000 units in reserve for this purpose. The balance in this reserve account at March 31, 2009
is 12,608 units. Under the Trustee Compensation Plan, 11,060 units were issued during the three months ended March 31, 2009
(three months ended March 31, 2008 – 3,711 units).
Executive compensation planThe senior executives participate in the executive compensation plan under which units are granted by the Board of Trustees
from time to time. The REIT has reserved a maximum of 1,000,000 units for issuance under the plan. The balance in this reserve
account at March 31, 2009 is 788,902 units. A unit granted through the plan entitles the holder to receive, on the vesting date,
the then current fair market value of the unit plus the value of the cash distributions that would have been paid on the unit if it had
been issued on the date of grant assuming the reinvestment of the distribution into REIT units. The payment will be satisfied
through the issuance of units.

first quarter report 2009 37
notes to consolidated financial statements
The following table summarizes the status of the executive compensation plan at March 31, 2009, excluding granted units which
have fully vested:
Unvested Units accumulated
executive units from distributions Total units
January 1, 2006 – granted 12,968 5,613 18,581
January 1, 2007 – granted 15,000 5,213 20,213
January 1, 2008 – granted 20,455 4,731 25,186
January 1, 2009 – granted 25,500 1,472 26,972
Units vested 2009 (6,484) (2,546) (9,030)
67,439 14,483 81,922
In March 2009, the Board of Trustees approved the granting of 25,500 units effective as of January 1, 2009. These units vest
equally on the third and fourth anniversaries of the effective date of grant.
Distribution reinvestment plan (“DRIP”)The REIT has a DRIP whereby eligible Canadian unitholders may elect to have their distributions of income from the REIT
automatically reinvested in additional units.
Note 15 Per unit information
Three months ended Three months ended
March 31, 2009 March 31, 2008
Weighted average units Weighted average units
(Restated, Note 21)
Loss from
continuing operations – basic $ (14,621) 74,439,594 $ (13,697) 73,234,488
Dilutive effect of executive
compensation plan – 79,679 – 61,950
Loss from
continuing operations – diluted $ (14,621) 74,519,273 $ (13,697) 73,296,438
Three months ended Three months ended
March 31, 2009 March 31, 2008
Weighted average units Weighted average units
Net loss – basic $ (15,420) 74,439,594 $ (15,073) 73,234,488
Dilutive effect of
executive compensation plan – 79,679 – 61,950
Net loss – diluted $ (15,420) 74,519,273 $ (15,073) 73,296,438
The impact of the convertible debentures has been excluded from the per unit calculations above because the impact of the
conversions would not be dilutive.

38 innVest real estate inVestment trust
notes to consolidated financial statements
Note 16 Distributions to unitholders
Distributions to unitholders are computed based on distributable income as defined by the Declaration of Trust.
Distributable income is a measure of cash flow that is not defined under Canadian GAAP and, accordingly, may not be
comparable to similar measures used by other issuers.
Distributable income is defined as net income in accordance with Canadian GAAP, subject to certain adjustments as set out in
the Declaration of Trust, including adding back depreciation and amortization, amortization of fair value debt adjustment and
future income tax (recovery) expense, excluding any gains or losses on the disposition of real property and future income taxes,
deducting the amount calculated, at 4% to 5% of hotel revenues, for the reserve for the replacement of furniture, fixtures and
equipment and capital improvements, the accretion on convertible debentures that is included in the computation of net income,
and making any other adjustments determined by the trustees of the REIT in their discretion. As outlined in the Declaration of
Trust, the REIT is required to distribute monthly to unitholders not less than one-twelfth of eighty percent (80%) of distributable
income of the REIT for the calendar year.
First quarter distributions are typically funded through cash on hand and the bank operating line given the seasonality of earnings
through the year in contrast to fixed costs.
Three months ended Three months ended
March 31, 2009 March 31, 2008
Net loss $ (15,420) $ (15,073)
Add (deduct)
Depreciation and amortization 22,729 22,670
Future income tax recovery (6,931) (3,520)
Non-cash portion of mortgage interest expense 424 258
Non-cash portion of convertible debentures interest and accretion 784 578
Reserve for replacement of furniture, fixtures and equipment
and capital improvements (5,427) (5,848)
Writedown of assets held for sale – 500
Non-cash executive and trustee compensation 86 155
Deferred land lease expense and retail lease income, net 2 8
11,667 14,801
Distributable loss (3,753) (272)
Distributions
Required under the Declaration of Trust – –
Discretionary 13,956 20,618
Distributions paid or payable 13,956 20,618
Distributions in excess of distributable loss $ 17,709 $ 20,890

first quarter report 2009 39
notes to consolidated financial statements
Note 17 Management agreements
Westmont Hospitality Canada LimitedOn July 26, 2002, the REIT entered into a Management Agreement for hotel management and accounting services and an
Administrative Services Agreement (the “Agreements”) with Westmont Hospitality Canada Limited (“Westmont”). Westmont is
considered a related party to the REIT as a result of its ability to exercise significant influence through the Agreements. Westmont
manages all but fifteen of the REIT’s hotels.
The Agreements have an initial term of ten years with two successive five-year renewal terms, subject to the consent of Westmont
and approval of the REIT. On September 15, 2008, the REIT exercised the first five-year extension term on the Agreements,
extending the expiration to July 25, 2017. The REIT’s independent trustees approved the extension following a review by third
party hospitality consulting firms based in Canada. The Agreements provide for the payment of an annual management fee to
Westmont in an amount equal to 3.375% of gross revenues during the term of the Agreements, including renewal periods. In
addition, Westmont may receive an annual incentive fee if the REIT achieves distributable income in excess of $1.25 per unit.
No management incentive fees were paid during the periods presented.
Accounting fees are calculated based on a fixed charge per room which increases by the Consumer Price Index change annually.
For assets sold which are managed by Westmont, the REIT pays a termination fee equal to the fees paid based on trailing twelve
months revenues. No termination fees were paid in the three months ended March 31, 2009 and 2008.
In addition to the base management fee and incentive fee, Westmont is entitled to fees based on a percentage of the cost of
purchasing certain goods and supplies and certain construction costs and capital expenditures, fees for accounting services,
reasonable out-of-pocket costs and expenses (other than general and administrative expenses or overhead costs except as
otherwise provided in the Administrative Services Agreement) and project management and general contractor service fees
related to hotel renovations managed by Westmont.
Also, for certain hotels owned by InnVest and not managed by Westmont, Westmont is entitled to an asset management fee
based on a fixed percentage of the purchase price of the hotel or a fixed percentage of hotel operating income, after the reserve
for replacement of furniture, fixtures and equipment and capital improvements, subject to an annual minimum fee.
During the three months ended March 31, 2009 and 2008, the fees charged to the REIT pursuant to the Agreements were
as follows:
March 31, 2009 March 31, 2008
(Restated, Note 21)
Fees from continuing operations:
Management fees $ 2,407 $ 2,558
Asset management fees (included in management fee expense) 505 650
Accounting services (included in hotel operating expenses) 557 532
Administrative services (included in corporate and administrative expenses) 117 95
Project management and general contractor services
(capitalized to hotel properties) 210 109
Fees from discontinued operations 192 338
$ 3,988 $ 4,282
In addition, salaries of REIT employees paid by Westmont and reimbursed by the REIT were $108 (March 31, 2008 – $36).
Included in accounts payable and accrued liabilities are amounts owed to Westmont at March 31, 2009 totalling $1,324
(December 31, 2008 – $1,484).

40 innVest real estate inVestment trust
notes to consolidated financial statements
Other management agreementsThe REIT entered into management agreements with Hilton Canada Co. (“Hilton”) to manage the two Hilton hotels acquired
in 2006. The agreements provide for the payment of an annual management fee to Hilton in an amount equal to 2.5% until
December 31, 2008 and then 3.0% of gross revenues during the balance of the term of the agreements. The agreements
mature on December 31, 2026. For the three months ended March 31, 2009, total management fees paid to Hilton were
$212 (March 31, 2008 – $196).
The REIT assumed the hotel management agreements with Delta Hotels Limited (“Delta”), dated January 1, 2003 when two Delta
hotels were purchased in 2006. The agreements provide for the payment of an annual management fee to Delta in an amount
equal to 3% of total revenues from the hotel, plus 0.5% of total revenues from the hotel if the hotel’s annual gross operating profit
is greater than the budgeted gross operating profit. The agreements mature on December 31, 2015, with two ten-year extension
options. For the three months ended March 31, 2009, total management fees paid to Delta were $118 (March 31, 2008 – $125).
With the acquisition of the Legacy Portfolio in September 2007, InnVest assumed the existing hotel management agreements with
Fairmont Hotels and Resorts (“Fairmont”) or Delta for each of the Legacy Portfolio hotels. The agreements provide for the
payment of a base management fee and an incentive management fee to either Fairmont or Delta. The REIT also assumed a
portfolio incentive fee in which 11 of the 25 hotels of Legacy Hotels Real Estate Investment Trust participated, of which six are
now owned or leased by InnVest. The base management fee is equal to 3% of total hotel revenues for nine of the hotels and
2% of total hotel revenues for the remaining two hotels. The agreements mature from December 31, 2010 to December 31, 2047.
The incentive management fees and portfolio incentive fees are calculated based on net operating income from hotel operations
plus amortization less the capital replacement reserve, in excess of a threshold. For the three months ended March 31, 2009,
total management fees paid for the Legacy Portfolio were $1,829 (March 31, 2008 – $1,975).
Note 18 Segmented financial information
The REIT operates hotel properties throughout Canada. Information related to these properties by geographic segment is
presented below. The REIT primarily evaluates operating performance based on hotel operating income. All key financing,
investing and capital allocation decisions are centrally managed. The comparatives have been restated to exclude discontinued
operations and assets held for sale at March 31, 2009.
Western Ontario Quebec Atlantic Total
Three months ended March 31, 2009
Hotel revenues $ 36,525 $ 48,046 $ 26,487 $ 16,643 $ 127,701
Hotel expenses 28,228 40,699 24,285 16,073 109,285
Hotel operating income $ 8,297 $ 7,347 $ 2,202 $ 570 $ 18,416
Three months ended March 31, 2008 (Restated, Note 21)
Hotel revenues $ 38,610 $ 51,368 $ 27,937 $ 18,025 $ 135,940
Hotel expenses 29,323 41,465 25,350 16,633 112,771
Hotel operating income $ 9,287 $ 9,903 $ 2,587 $ 1,392 $ 23,169
Capital expenditures on hotel properties
Three months ended March 31, 2009 $ 1,708 $ 2,165 $ 1,558 $ 506 $ 5,937
Three months ended March 31, 2008 (Restated, Note 21) $ 413 $ 1,866 $ 1,351 $ 2,213 $ 5,843
Hotel properties
March 31, 2009 $ 507,389 $ 634,455 $ 395,285 $ 242,779 $ 1,779,908
December 31, 2008 (Restated, Note 21) $ 512,032 $ 637,791 $ 406,931 $ 236,074 $ 1,792,828

first quarter report 2009 41
notes to consolidated financial statements
Note 19 Total revenues
Three months ended Three months ended
March 31, 2009 March 31, 2008
(Restated, Note 21)
Hotel revenues $ 127,701 $ 135,940
Other business income (Note 20) 2,729 2,661
$ 130,430 $ 138,601
Note 20 Other business income
Three months Three months
Franchise Retail/ Retirement ended ended
business office residence March 31, 2009 March 31, 2008
Revenues $ 1,793 $ 660 $ 276 $ 2,729 $ 2,661
Expenses 1,300 332 185 1,817 1,668
Other business income, net $ 493 $ 328 $ 91 $ 912 $ 993
Other business income includes franchise business income, which is InnVest’s 50% share of CHC’s operations, and the income
from the other real estate properties.
Note 21 Assets held for sale and discontinued operations
Five hotel properties, four in Ontario and one in Quebec, were reclassified as assets held for sale during the three months ended
March 31, 2009. These five hotels are included in the discontinued operations for the three months ended March 31, 2009 and
the three months ended March 31, 2008 have been restated to reflect these operations as discontinued operations.
Three Ontario hotel properties and one Quebec hotel property which were reclassified as assets held for sale on
December 18, 2007, are included in the discontinued operations for the three months ended March 31, 2008. All but one Ontario
hotel were sold during the year ended December 31, 2008. Subsequent to March 31, 2009, the REIT sold an Ontario hotel
property that was held for sale for $4,100.

42 innVest real estate inVestment trust
notes to consolidated financial statements
Discontinued operations for the three months ended March 31, 2009 and 2008 are as follows:
2009 2008
(Restated)
Hotel revenues $ 4,351 $ 6,307
Hotel expenses
Operating expenses 3,288 4,562
Property taxes, rent and insurance 1,009 1,214
Management fees 147 213
4,444 5,989
Hotel operating (loss) income (93) 318
Interest on mortgages 176 514
Depreciation and amortization 530 680
706 1,194
Loss from discontinued operations (799) (876)
Writedown of assets held for sale – 500
Net loss from discontinued operations $ (799) $ (1,376)

Corporate and unitholder information
Reservations
Corporate office5090 Explorer Drive
Suite 700
Mississauga, Ontario
L4W 4T9
Toll: 1-877-209-3429
Phone: 905-206-7100
Fax: 905-206-7114
Website: www.innvestreit.com
Stock exchange listingThe Toronto Stock Exchange
Trading Symbol: INN.UN
Convertible Debentures: INN.DB.A, INN.DB.B, INN.DB.C
Best Western
Comfort Inn, Quality Inn
Delta Hotels
Fairmont Hotels & Resorts
Hilton Garden Inn
Hilton Hotels
Holiday Inn, Holiday Inn Select, Holiday Inn Express
Homewood Suites Hotels
Radisson
Sheraton Hotels & Resorts
Staybridge Suites Hotels
Travelodge
Registrar and transfer agentInquiries regarding change of address, registered
holdings, transfers and duplicate mailings should
be directed to the following:
Computershare Trust Company of Canada
100 University Avenue
11th floor
Toronto, Ontario
Phone: 1-800-564-6253
Fax: 1-866-249-7775
Investor relationsEmail: [email protected]
Distribution reinvestment planUnitholders may acquire units by reinvesting cash distributions
without paying brokerage commissions or administrative
charges. For general information concerning the Distribution
Reinvestment Plan or for a change of address, please contact
the registrar and transfer agent.
1-800-780-7234
1-800-424-6423
1-888-890-3222
1-800-257-7544
1-877-STAY-HGI (1-877-782-9444)
1-800-HILTONS (1-800-445-8667)
1-888-HOLIDAY (1-888-465-4329)
1-800-CALL-HOME (1-800-225-5466)
1-888-201-1718
1-800-325-3535
1-877-660-8550
1-800-578-7878
de
sig
n:
cr
aib
de
sig
n &
co
mm
un
ica
tio
ns
ww
w.c
ra
ib.c
om
pr
int
ed
in
ca
na
da

www.innvestreit.com