Fortune tellers - PMCapital · Fortune tellers Forecasts, ... or RBA cash rate over rolling seven...
9
Quarterly Report DECEMBER 2017 Fortune tellers Forecasts, predictions and other dangerous activities p.1 Quarterly video update CONTENTS Video update 1 PM Capital Asian Opportunities Fund 5 PM Capital Global Opportunities Fund 2 Important information 8 PM Capital Global Opportunities Fund Limited ACN 166 064 875 (ASX Code: PGF) PM Capital Asian Opportunities Fund Limited ACN 168 666 171 (ASX Code: PAF)
Transcript of Fortune tellers - PMCapital · Fortune tellers Forecasts, ... or RBA cash rate over rolling seven...

Quarterly Report
DECEMBER 2017
Fortune tellersForecasts, predictions and other dangerous activitiesp.1 Quarterly video update
CONTENTSVideo update 1 PM Capital Asian Opportunities Fund 5
PM Capital Global Opportunities Fund 2 Important information 8
PM Capital Global Opportunities Fund LimitedACN 166 064 875 (ASX Code: PGF)
PM Capital Asian Opportunities Fund Limited
ACN 168 666 171 (ASX Code: PAF)
PM CAPITAL QUARTERLY REPORT | DECEMBER 20171
Listed Company OverviewPM Capital Global Opportunities Fund Limited
PM Capital Asian Opportunities Fund Limited
Asset Class Global equities Asian (ex-Japan) equities
Listing Date 11 December 2013 21 May 2014
Suggested Time Frame Seven years plus Seven years plus
Shares on Issue 350,192,809 56,248,711
Share Price1 $1.230 $1.235
Market Capitalisation $ 430.7 million $69.5 million
NTA before tax accruals + franking credits (per share) $1.3506 $1.3104
Company Net Assets before tax accruals + franking credits $ 473.0 million $73.7 million
Quarterly video updateInvestment Manager PM Capital provides investors with their quarterly video update.
Within the video, Chief Investment Officer Paul Moore gives his views on:
• How our investment approach remains positive after recent market gains
• Where the real market opportunities and risks lie now
“Unemployment in some US states is now 3% or below, another anecdote highlighting that we are now in the second innings of the post-Trump world and that inflation and rates, in our opinion, have inflected.”
PM Capital’s Yield Portfolio Manager, Jarod Dawson, shares his views on credit markets and the positioning of the PM Capital Enhanced Yield Fund, where he notes that market participants need to be careful that gains from credit aren’t wiped out by exposures to interest rate duration.
Access the video here.
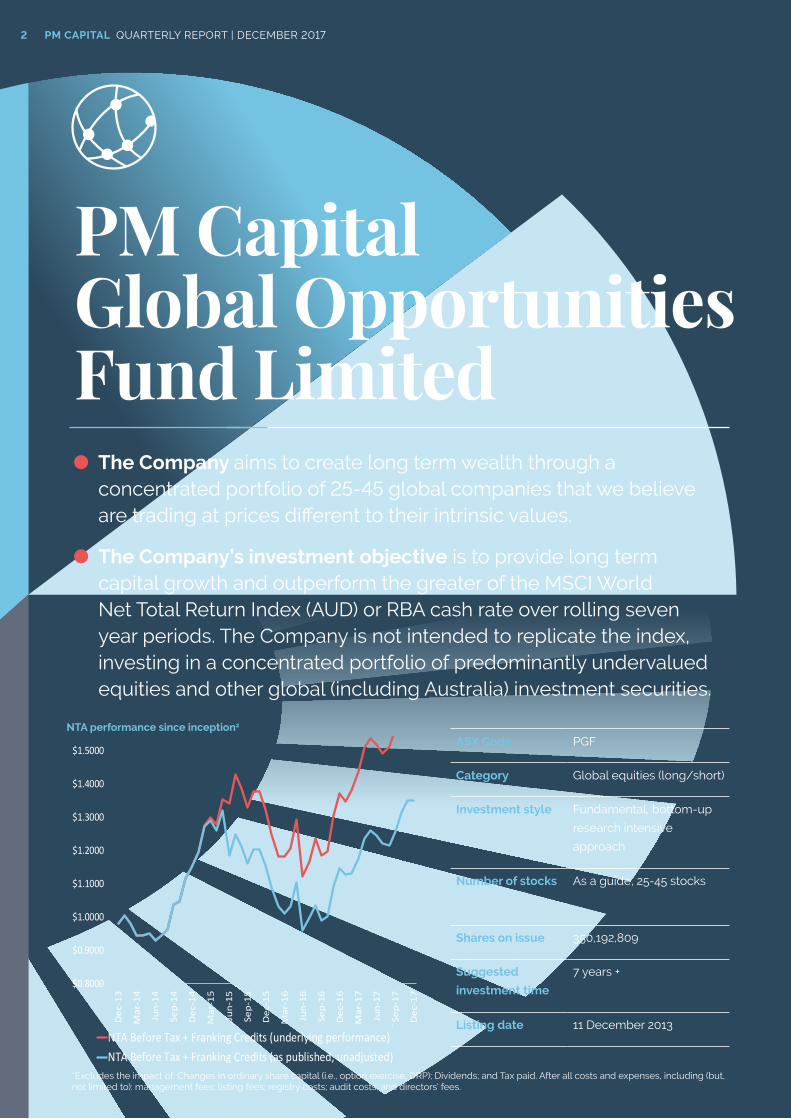
PM Capital Global Opportunities Fund Limited
The Company aims to create long term wealth through a concentrated portfolio of 25-45 global companies that we believe are trading at prices different to their intrinsic values.
The Company’s investment objective is to provide long term capital growth and outperform the greater of the MSCI World Net Total Return Index (AUD) or RBA cash rate over rolling seven year periods. The Company is not intended to replicate the index, investing in a concentrated portfolio of predominantly undervalued equities and other global (including Australia) investment securities.
Shares on issue 350,192,809
Suggested
investment time
7 years +
Listing date 11 December 2013
ASX Code PGF
Category Global equities (long/short)
Investment style Fundamental, bottom-up
research intensive
approach
Number of stocks As a guide, 25-45 stocks
PM CAPITAL QUARTERLY REPORT | DECEMBER 20172
$0.8000
$0.9000
$1.0000
$1.1000
$1.2000
$1.3000
$1.4000
$1.5000
$1.6000
Dec
-13
Mar
-14
Jun-
14
Sep-
14
Dec
-14
Mar
-15
Jun-
15
Sep-
15
Dec
-15
Mar
-16
Jun-
16
Sep-
16
Dec
-16
Mar
-17
Jun-
17
Sep-
17
Dec
-17
NTA Before Tax + Franking Credits (underlying performance)NTA Before Tax + Franking Credits (as published, unadjusted)
*Excludes the impact of: Changes in ordinary share capital (i.e., option exercise, DRP); Dividends; and Tax paid. After all costs and expenses, including (but, not limited to): management fees; listing fees; registry costs; audit costs; and directors’ fees.
NTA performance since inception2
*
PM Capital Global Opportunities FundNet tangible asset backing per ordinary share2
(all figures are unaudited)30
September 2017
31 December
2017
Change (%)
1 year performance5
3 year performance
p.a.5
NTA before tax accruals + franking credits3 $1.2577 $1.3506 + 7.39% + 22.82% + 13.58%
NTA after tax4 $1.1838 $1.2490 + 5.51%
PM CAPITAL QUARTERLY REPORT | DECEMBER 2017
Paul Moore Global Portfolio Manager
3
KEY POINTS
• Market moves on US tax reform • Secular trends inflecting • Earnings growth the driver from
here
PERFORMANCE
The portfolio has produced attractive returns in the December quarter and 2017 calendar year, benefiting from its exposure to domestically-focused US firms that will most benefit from corporate tax reform.
PORTFOLIO ACTIVITY
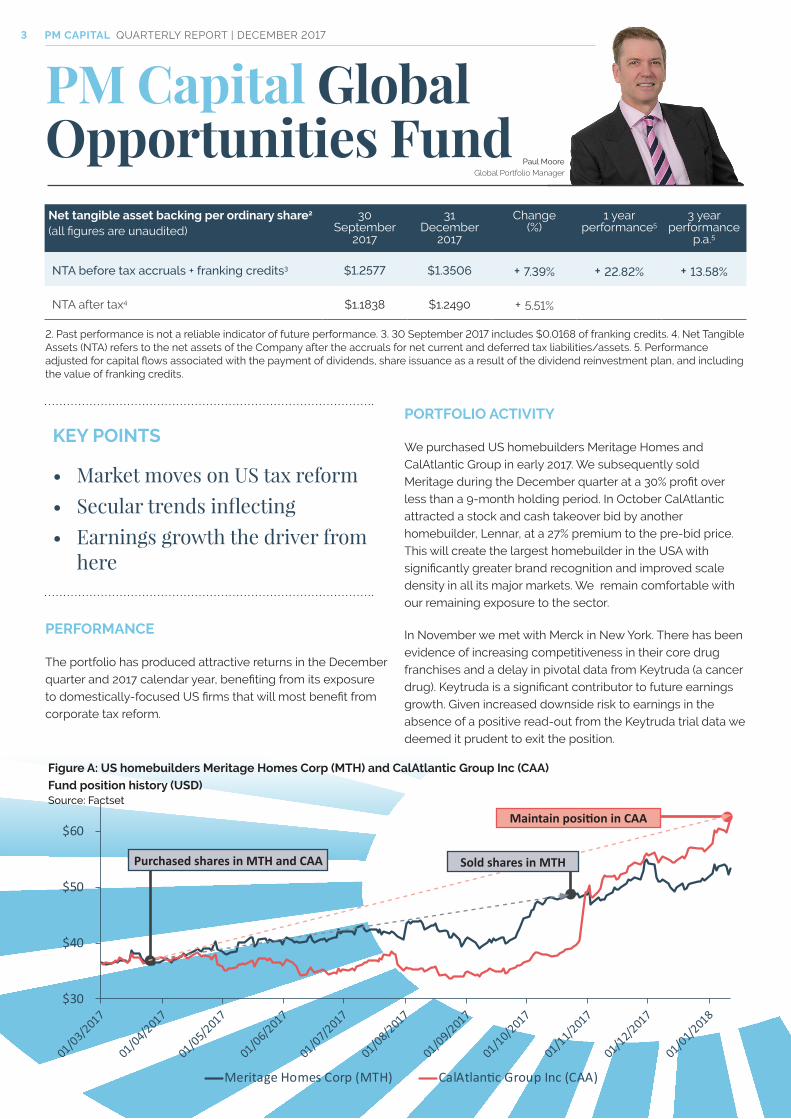
We purchased US homebuilders Meritage Homes and CalAtlantic Group in early 2017. We subsequently sold Meritage during the December quarter at a 30% profit over less than a 9-month holding period. In October CalAtlantic attracted a stock and cash takeover bid by another homebuilder, Lennar, at a 27% premium to the pre-bid price. This will create the largest homebuilder in the USA with significantly greater brand recognition and improved scale density in all its major markets. We remain comfortable with our remaining exposure to the sector.
In November we met with Merck in New York. There has been evidence of increasing competitiveness in their core drug franchises and a delay in pivotal data from Keytruda (a cancer drug). Keytruda is a significant contributor to future earnings growth. Given increased downside risk to earnings in the absence of a positive read-out from the Keytruda trial data we deemed it prudent to exit the position.
2. Past performance is not a reliable indicator of future performance. 3. 30 September 2017 includes $0.0168 of franking credits. 4. Net Tangible Assets (NTA) refers to the net assets of the Company after the accruals for net current and deferred tax liabilities/assets. 5. Performance adjusted for capital flows associated with the payment of dividends, share issuance as a result of the dividend reinvestment plan, and including the value of franking credits.
$30
$40
$50
$60
Meritage Homes Corp (MTH) CalAtlantic Group Inc (CAA)
Figure A: US homebuilders Meritage Homes Corp (MTH) and CalAtlantic Group Inc (CAA)
Fund position history (USD)Source: Factset
Purchased shares in MTH and CAA Sold shares in MTH
Maintain position in CAA
PM CAPITAL QUARTERLY REPORT | DECEMBER 20174
* Stated as effective exposure.
Paul Moore - Chief Investment Officer & Global Portfolio Manager
PM Capital Global Opportunities Fund
John Whelan - Contributing author
Portfolio investments Weighting^^
Global Brewing 2.5%
Post GFC Housing Recovery - US 15.0%
Post GFC Housing Recovery - Europe 13.6%
Global Domestic Banking 38.7%
Service Monopolies 18.5%
Pharmaceuticals 3.5%
Gaming - Macau 4.9%
Alternative Investment Managers 13.0%
Other 2.6%
Long Equity Position 112.2%
Short Equity Position -19.0%
Net Invested Equities position 93.2%
Total holdings 42
Current stock examples
Heineken
Howard Hughes Corporation
Cairn Homes
Bank of America
Alphabet
Pfizer
Wynn Macau
KKR & Co L.P.
Currency exposure*
USD 74.6%
EUR 19.3%
GBP 6.8%
AUD -0.7%
Total exposure 100.0%
OUTLOOK
The US market had a strong quarter, driven by a rotation into the companies set to benefit the most from lower corporate tax rates. As we have discussed previously, the changes in tax will encourage domestic production via:
1. Significant reduction in the corporate tax rate from 35% to 21%
2. Allowing the full expensing of capital investment – a catalyst for corporate capital expenditure
3. Fundamental changes to the taxation of multinationals which will promote US production
4. Reduced taxes on the repatriation of previously untaxed old earnings
5. Reduction in individual income tax rates
The agenda will now move onto the long term infrastructure plan and reducing the regulatory burden on the business community. These initiatives, if enacted, should lead to a more productive economy over the long term.
US banking stocks have performed well recently in anticipation of the tax changes being passed. However, we believe the likely positive effects of the corporate tax cuts have not been fully appreciated by the overall market. We believe that tax reform should meaningfully increase the earnings power for both the businesses the banks lend to, as well as themselves.
Our US homebuilding positions were up strongly over the quarter with robust, broad-based demand for new housing. The limited inventory and pent-up demand among first-time
home buyers confirms our view that the outlook for the future remains positive. New home sales are rapidly rising to meet this demand but remain well below mid-cycle transaction levels.
Our Spanish hotel stocks are in the midst of a recovery cycle, helped by the nation’s safe destination status, reasonable prices and rising internal demand. During the quarter, NH Hotel’s share price rise was caused by another Spanish hotel operator, Barcelo approaching NH with a merger plan. While we value NH on a stand-alone basis, we also think long term that it will be a part of consolidation in the highly fragmented European hotel market.
Underperforming stocks over the quarter included US real estate company Realogy and Spanish financial services company Caixabank. Realogy missed earnings expectations in the third quarter due to pressure on agent splits and tight housing inventory which is having the effect of lowering housing transactions. Caixabank was hit due to poor sentiment, with the results of the recent Catalonian elections resulting in what is likely to be a continuing political stalemate and uncertainty.
The Australian Dollar finished the year close to the top of its three-year trading range. While the interest rate differential has narrowed significantly between the US and Australia, commodity prices have been rebounding on synchronised global growth and a weaker US Dollar against the majors.

PM Capital Asian Opportunities Fund Limited
The Company aims to create long term wealth through a concentrated portfolio of typically 15-35 Asian centric companies that we believe are trading at prices different to their intrinsic values.
The objective of the Company is to provide long term capital growth and outperform the greater of the MSCI All Country Asia (ex-Japan) Net Index (AUD) or RBA cash rate over rolling seven year periods. The Fund is not intended to replicate the index, investing in a concentrated portfolio of predominantly undervalued equities in the Asian ex-Japan region.
Shares on issue 56,248,711
Suggested
investment time
7 years +
Listing date 21 May 2014
ASX code PAF
Category Asian (ex-Japan)6 equities
Investment style Fundamental, bottom-up
research intensive
approach
Number of stocks As a guide, 15-35 stocks
PM CAPITAL QUARTERLY REPORT | DECEMBER 20175
0.9000
1.0000
1.1000
1.2000
1.3000
1.4000
1.5000
16-May-14 16-May-15 16-May-16 16-May-17
NTA Before Tax + Franking Credits (underlying performance)NTA Before Tax + Franking Credits (as published, unadjusted)
*Excludes the impact of: Changes in ordinary share capital (i.e., option exercise, DRP); Dividends; and Tax paid. After all costs and expenses, including (but, not limited to): management fees; listing fees; registry costs; audit costs; and directors’ fees.
NTA performance since inception2
*
PM Capital Asian Opportunities Fund
KEY POINTS• Performance was pleasing over the
quarter building upon strong returns over the last year
• Macau holdings again were strong contributors to performance
• New position initiated in South Korean company Amorepacific Corporation
PERFORMANCE
The portfolio continued its recent period of positive performance in December, with the majority of portfolio holdings advancing.
Dali Foods (+27%) was the largest contributor to portfolio performance. Many of China’s leading Fast Moving Consumer Good’s businesses, of which Dali Foods is one, performed strongly over the quarter as the ‘Chinese consumer’ thematic garnered more attention from investors. While there was no Dali-specific news which has led us to change our view of the company’s underlying earnings trajectory, the recent share price move suggests investors are becoming more optimistic about the company’s outlook, particularly management’s efforts to ‘premiumise’ its brand portfolio.
Our gaming investments were mixed during the quarter with Macau-based holdings, MGM China (+26%) and Wynn Macau (+16%), as well as Cambodia-based Nagacorp (+28%) all providing significant positive contributions to performance. This offset a weak Donaco International (-14%). Our Macau holdings once again benefited from the release of strong monthly gaming revenue and visitation statistics which exceeded market estimates and drove upward revisions to consensus estimates. This rational for the strong performance of our Macau holdings has been a consistent message over the past eighteen months.
Official gaming revenues released by Macau’s government advanced 19% in 2017, the first increase in three years, while overnight visitation grew 10%. Attitudes towards Macau have improved considerably over the last year as investors have become more comfortable with the drivers of revenue growth and the industry’s ability to navigate regulatory risks. This improved sentiment can be no better summed up than by the recent headline to a Bloomberg article: “Macau casino profits may surge to pre-crackdown highs”.
Nagacorp saw a positive reaction to the November opening of its Naga 2 casino in Phnom Penh. The property doubles Nagacorp’s capacity and should support significant growth in earnings over the next couple of years. Conversely, Donaco International declined after management provided a disappointing trading update to investors at its AGM in November.
The portfolio’s financial holdings also contributed meaningfully to performance as they reacted positively to rising US interest rates. DBS Group (+19%) was the strongest of our holdings, continuing the valuation rerating seen over the past 12 months as concerns surrounding its oil and gas loan portfolio also diminished.
PORTFOLIO ACTIVITY
The invested position increased over the period to 85.9%. During the quarter we initiated a position in South Korean cosmetics company Amorepacfic Corporation. Recent geopolitical tensions between South Korea and China have had a meaningful impact on Korean companies reliant on Chinese consumers. Korea’s cosmetics companies are beneficiaries of inbound Chinese tourism, particularly through the duty-free channel, which has reduced considerably as tensions have risen. While the conflict looks to be easing, it is always difficult to predict how these events will unfold in the short term. However, it is our belief that in the longer term these issues will prove to be transitory and will not fundamentally impact the long term competitive position of Amorepacific which commands a leading position in the Korean cosmetics market. We chose to initiate this position in the Company’s preferred,
PM CAPITAL QUARTERLY REPORT | DECEMBER 2017
Kevin Bertoli Asian Portfolio Manager
6
Net tangible asset backing per ordinary share2
(all figures are unaudited)30
September 2017
31 December
2017
Change (%)
1 year performance5
3 year performance
p.a.5
NTA before tax accruals + franking credits3 $1.2491 $1.3104 + 4.91% + 28.30% + 11.10%
NTA after tax4 $1.1745 $1.2194 + 3.82%
2. Past performance is not a reliable indicator of future performance. 3. 30 September 2017 includes $0.0350 of franking credits. 4. Net Tangible Assets (NTA) refers to the net assets of the Company after the accruals for net current and deferred tax liabilities/assets. 5. Performance adjusted for capital flows associated with the payment of dividends, share issuance as a result of the dividend reinvestment plan, and including the value of franking credits.
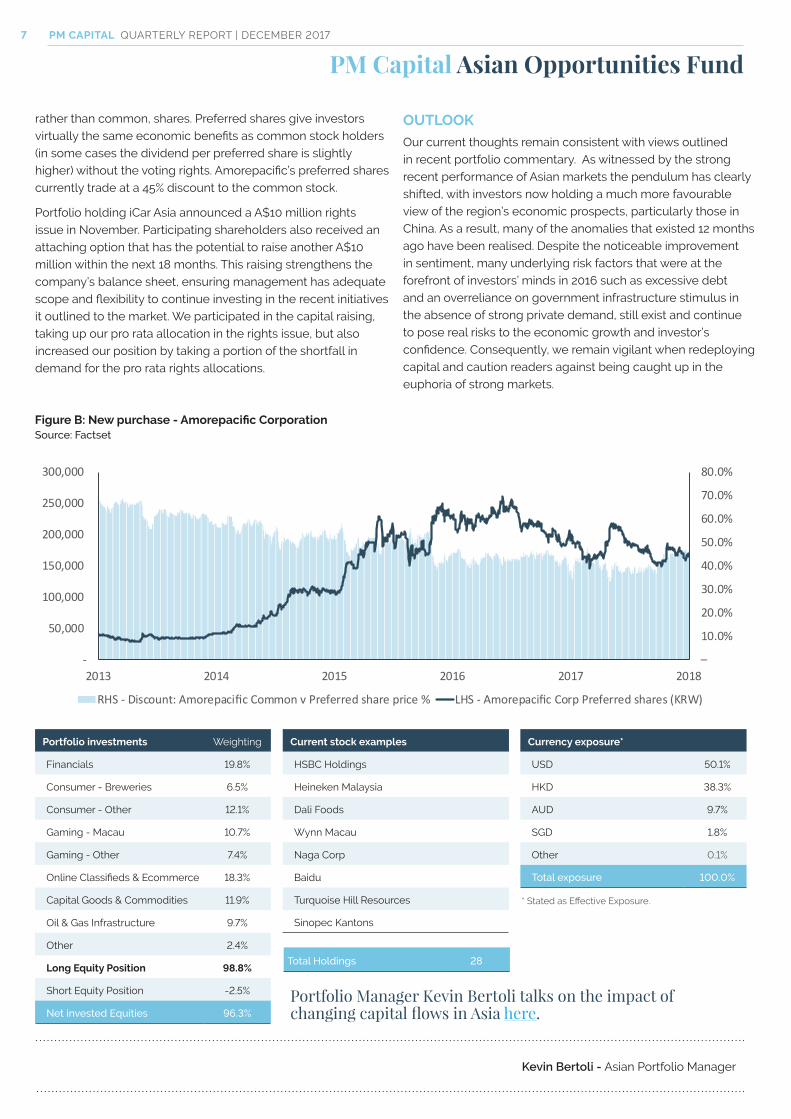
rather than common, shares. Preferred shares give investors virtually the same economic benefits as common stock holders (in some cases the dividend per preferred share is slightly higher) without the voting rights. Amorepacific’s preferred shares currently trade at a 45% discount to the common stock.
Portfolio holding iCar Asia announced a A$10 million rights issue in November. Participating shareholders also received an attaching option that has the potential to raise another A$10 million within the next 18 months. This raising strengthens the company’s balance sheet, ensuring management has adequate scope and flexibility to continue investing in the recent initiatives it outlined to the market. We participated in the capital raising, taking up our pro rata allocation in the rights issue, but also increased our position by taking a portion of the shortfall in demand for the pro rata rights allocations.
PM Capital Asian Opportunities FundPM CAPITAL QUARTERLY REPORT | DECEMBER 2017
* Stated as Effective Exposure.
7
Kevin Bertoli - Asian Portfolio Manager
Total Holdings 28
Portfolio Manager Kevin Bertoli talks on the impact of changing capital flows in Asia here.
OUTLOOKOur current thoughts remain consistent with views outlined in recent portfolio commentary. As witnessed by the strong recent performance of Asian markets the pendulum has clearly shifted, with investors now holding a much more favourable view of the region’s economic prospects, particularly those in China. As a result, many of the anomalies that existed 12 months ago have been realised. Despite the noticeable improvement in sentiment, many underlying risk factors that were at the forefront of investors’ minds in 2016 such as excessive debt and an overreliance on government infrastructure stimulus in the absence of strong private demand, still exist and continue to pose real risks to the economic growth and investor’s confidence. Consequently, we remain vigilant when redeploying capital and caution readers against being caught up in the euphoria of strong markets.
Current stock examples
HSBC Holdings
Heineken Malaysia
Dali Foods
Wynn Macau
Naga Corp
Baidu
Turquoise Hill Resources
Sinopec Kantons
Portfolio investments Weighting
Financials 19.8%
Consumer - Breweries 6.5%
Consumer - Other 12.1%
Gaming - Macau 10.7%
Gaming - Other 7.4%
Online Classifieds & Ecommerce 18.3%
Capital Goods & Commodities 11.9%
Oil & Gas Infrastructure 9.7%
Other 2.4%
Long Equity Position 98.8%
Short Equity Position -2.5%
Net invested Equities 96.3%
Currency exposure*
USD 50.1%
HKD 38.3%
AUD 9.7%
SGD 1.8%
Other 0.1%
Total exposure 100.0%
Figure B: New purchase - Amorepacific CorporationSource: Factset
–
10.0%
20.0%
30.0%
40.0%
50.0%
60.0%
70.0%
80.0%
-
50,000
100,000
150,000
200,000
250,000
300,000
2013 2014 2015 2016 2017 2018
RHS - Discount: Amorepacific Common v Preferred share price % LHS - Amorepacific Corp Preferred shares (KRW)
This Quarterly Report is issued by PM Capital Limited (ABN 69 083 644 731, AFSL No. 230222) as investment manager for the:
It contains general information only and does not constitute an offer, invitation, solicitation or recommendation with respect to the purchase or sale of any securities of either PGF or PAF. The information herein seeks to provide an insight into how and why we make our investment decisions, and is subject to change without notice. The Quarterly Report does not constitute product or investment advice, nor does it take into account any investors’ investment objectives, taxation situation, financial situation or needs. An investor should seek their own financial advice, and must not act on the basis of any matter contained in this Quarterly Report in making an investment decision but must make their own assessment of PGF and/or PAF and conduct their own investigations and analysis prior to making a decision to invest. Past performance is not a reliable indicator of future performance and no guarantee of future returns, ASX trading prices, or market liquidity is implied or given. All values are expressed in Australian currency unless otherwise stated.
The Index for the PM Capital Global Opportunities Fund Limited is the MSCI World Net Total Return Index in Australian dollars, net dividends reinvested. The Index for the PM Capital Asian Opportunities Fund Limited is the MSCI AC Asia ex Japan Net Total Return Index in Australian dollars, net dividends reinvested. See www.msci.com for further information on the MSCI indices.
See the company announcements platform at www.asx.com.au, and www.pmcapital.com.au, for further information.
1. As at close of market trading Friday 29th December 2017.
2. Past performance is not a reliable indicator of future performance.
6. The Asian region (ex-Japan) includes Hong Kong, China, Taiwan, Korea, Indonesia, India, Sri Lanka, Malaysia, Philippines, Thailand, Vietnam, Pakistan and Singapore, but excludes Japan. The Company may also obtain exposure to companies listed on other global exchanges where the predominant business of those companies is conducted in the Asian region (ex-Japan).
Important information
RESPONSIBLE ENTITY
PM Capital Limited ABN 69 083 644 731 AFSL 230222
Level 27, 420 George Street Sydney NSW 2000
p +61 2 8243 0888
f +61 2 8243 0880
www.pmcapital.com.au © 2018. All rights reserved.
PM CAPITAL Global Opportunities Fund LimitedACN 166 064 875 (ASX Code: PGF)
PM CAPITAL Asian Opportunities Fund Limited
ACN 168 666 171 (ASX Code: PAF)