fortune 500 cfo index - Spencer Stuart/media/s/research and... · Fortune 500 CFO Index ... CFO?”...
38
FORTUNE 500 CFO INDEX January 2017
Transcript of fortune 500 cfo index - Spencer Stuart/media/s/research and... · Fortune 500 CFO Index ... CFO?”...

FORTUNE 500 CFO INDEX
January 2017

Fortune 500 CFO Index
Goals & Methodology
> The Spencer Stuart Fortune 500 CFO Index is an analysis of the CFOs at
Fortune 500 companies for the 11 year period from 2006-2016. The goal of
this analysis is to answer the question, “What is the profile of the F500
CFO?” The data for each year represents a snapshot of executives sitting
in the CFO seat as of 12/31 of their respective year.
Industry Acronyms
> CG&S – Consumer Goods & Services
> ENER – Energy
> FS – Financial Services
> IND – Industrial
> LS – Life Sciences
> TMT – Technology, Media, & Telecommunications
2
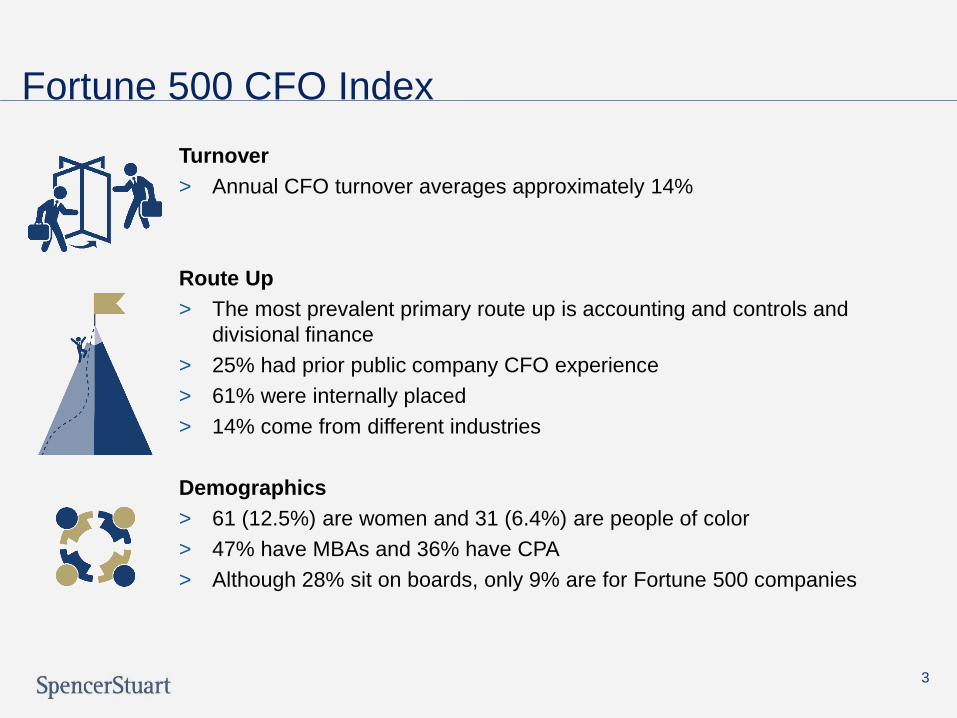
Fortune 500 CFO Index
Turnover
> Annual CFO turnover averages approximately 14%
Route Up
> The most prevalent primary route up is accounting and controls and
divisional finance
> 25% had prior public company CFO experience
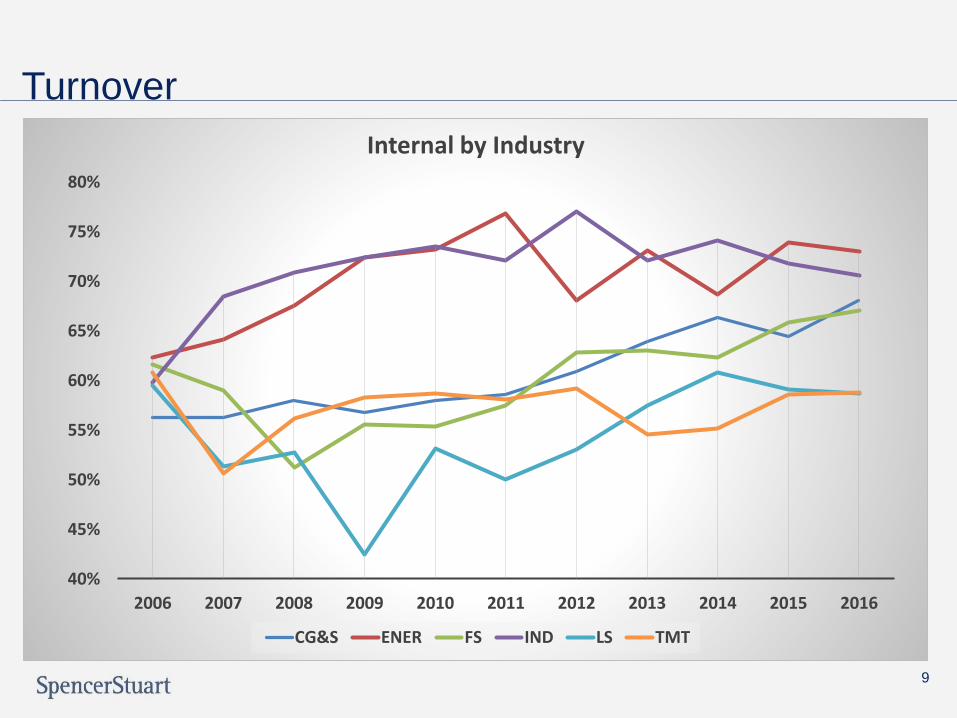
> 61% were internally placed
> 14% come from different industries
Demographics
> 61 (12.5%) are women and 31 (6.4%) are people of color
> 47% have MBAs and 36% have CPA
> Although 28% sit on boards, only 9% are for Fortune 500 companies
3

Turnover & Tenure
4

Turnover
5
31
5357
3843
39
4550
4743
47
30
39 38
25
18 20
26
38
2530
23
61, 12%
92, 18%95, 19%
63, 13% 61, 12% 59, 12%
71, 14%
88, 18%
72, 14% 73, 15%70, 14%
2006 2007 2008 2009 2010 2011 2012 2013 2014 2015 2016
Cas
es o
f Tu
rno
ver,
% o
f F5
00
Fortune 500 CFO Turnover 2006-2016
Internal External Total

Turnover
TOTAL 61 92 95 63 61 59 71 88 72 73 70
6
2006 2007 2008 2009 2010 2011 2012 2013 2014 2015 2016
CG&S 13% 22% 13% 8% 10% 11% 16% 16% 15% 20% 17%
ENER 12% 13% 28% 20% 13% 13% 10% 13% 9% 14% 19%
FS 15% 17% 19% 14% 12% 12% 9% 21% 13% 13% 13%
IND 9% 19% 18% 13% 9% 15% 20% 19% 10% 11% 8%
LS 11% 27% 14% 5% 15% 9% 8% 17% 28% 11% 11%
TMT 16% 14% 22% 15% 16% 9% 16% 19% 18% 16% 15%
0%
5%
10%
15%
20%
25%
30%
Turnover by Industry
Turnover
7
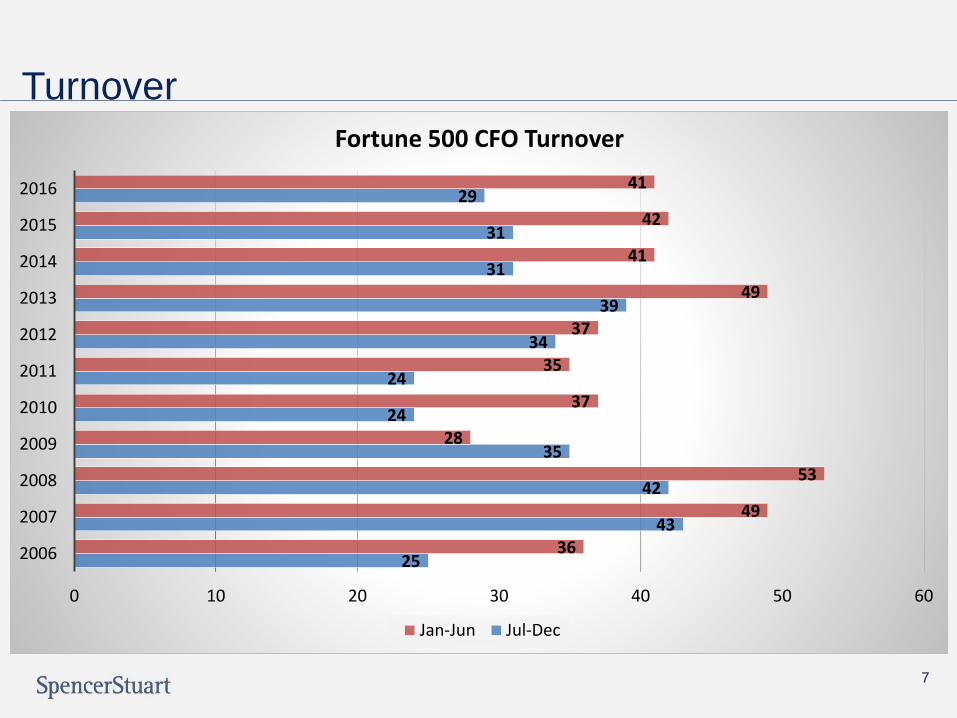
25
43
42
35
24
24
34
39
31
31
29
36
49
53
28
37
35
37
49
41
42
41
0 10 20 30 40 50 60
2006
2007
2008
2009
2010
2011
2012
2013
2014
2015
2016
Fortune 500 CFO Turnover
Jan-Jun Jul-Dec

Turnover
• Over the
eleven year
period, there
were 805 CFO
transitions.
8
61% Internal Placements
39% External Placements
CFO Origin 2006-2016
Turnover
9
40%
45%
50%
55%
60%
65%
70%
75%
80%
2006 2007 2008 2009 2010 2011 2012 2013 2014 2015 2016
Internal by Industry
CG&S ENER FS IND LS TMT

Tenure
10
5.3 5.35.1 5
5.3
5.86
5.8 5.7 5.6 5.7
0
1
2
3
4
5
6
7
2006 2007 2008 2009 2010 2011 2012 2013 2014 2015 2016
Te
nu
re Y
ea
rs

Tenure
11
67, 14%
108, 22%
242, 50%
70, 14%
0% 10% 20% 30% 40% 50% 60%
11+years
6-10years
2-5years
<1 year
2016 Average Tenure

Route Up
12
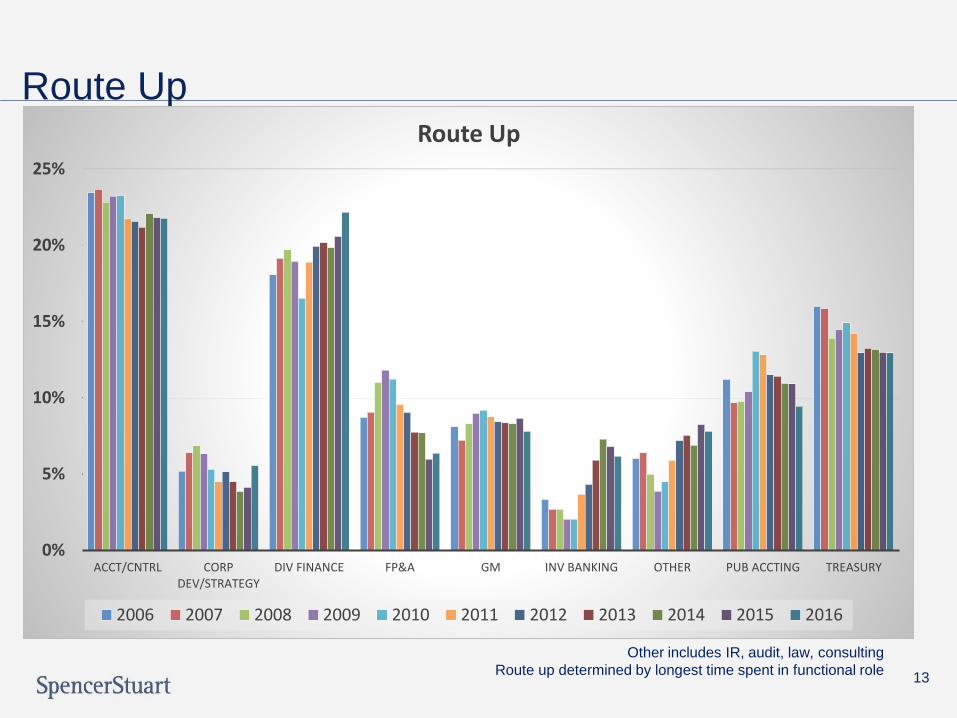
Route Up
Other includes IR, audit, law, consulting
Route up determined by longest time spent in functional role13
0%
5%
10%
15%
20%
25%
ACCT/CNTRL CORP DEV/STRATEGY
DIV FINANCE FP&A GM INV BANKING OTHER PUB ACCTING TREASURY
Route Up
2006 2007 2008 2009 2010 2011 2012 2013 2014 2015 2016

Route Up
Other includes IR, audit, law, consulting
Route up determined by longest time spent in functional role14
0%
10%
20%
30%
40%
ACCT/CNTRL CORP DEVDIV FINANCE FP&A GM INV BANKING OTHER PUB ACCTINGTREASURY
Internal Placements
2006 2007 2008 2009 2010 2011 2012 2013 2014 2015 2016
0%
10%
20%
30%
40%
ACCT/CNTRL CORP DEVDIV FINANCE FP&A GM INV BANKING OTHER PUB ACCTINGTREASURY
External Placements
2006 2007 2008 2009 2010 2011 2012 2013 2014 2015 2016
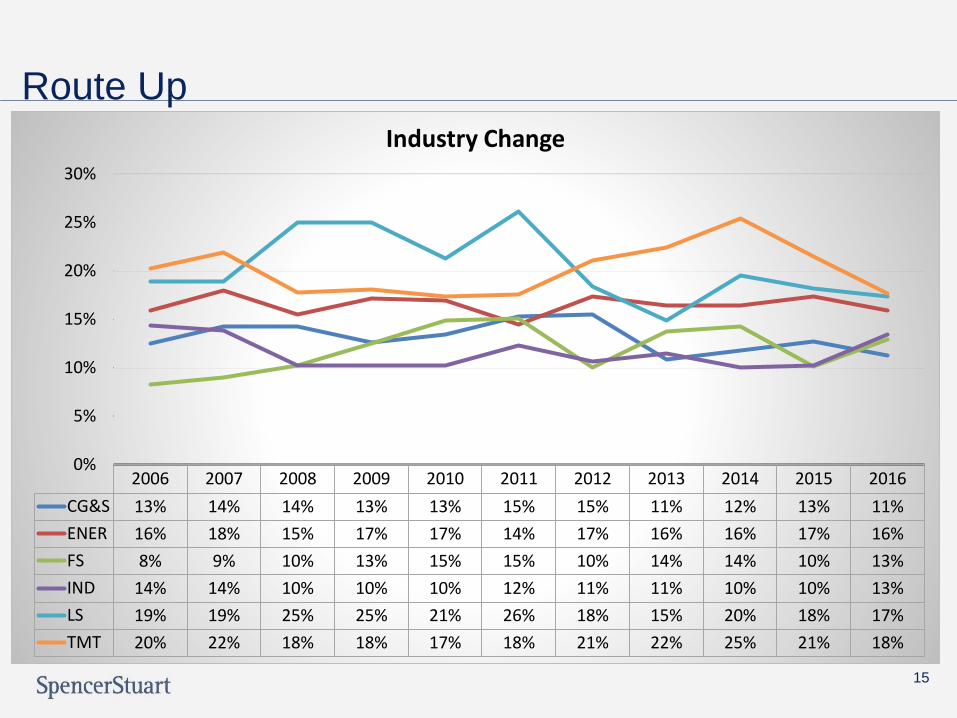
Route Up
15
2006 2007 2008 2009 2010 2011 2012 2013 2014 2015 2016
CG&S 13% 14% 14% 13% 13% 15% 15% 11% 12% 13% 11%
ENER 16% 18% 15% 17% 17% 14% 17% 16% 16% 17% 16%
FS 8% 9% 10% 13% 15% 15% 10% 14% 14% 10% 13%
IND 14% 14% 10% 10% 10% 12% 11% 11% 10% 10% 13%
LS 19% 19% 25% 25% 21% 26% 18% 15% 20% 18% 17%
TMT 20% 22% 18% 18% 17% 18% 21% 22% 25% 21% 18%
0%
5%
10%
15%
20%
25%
30%
Industry Change
Former CFO Experience
16

Former CFO Experience
17
No prior CFO experience
69%
Public25%
Private6%
2016 Type of CFO Experience

Former CFO Experience
18
23% 23%25%
27% 27% 27% 26%
29% 29% 29%30%
0%
5%
10%
15%
20%
25%
30%
35%
2006 2007 2008 2009 2010 2011 2012 2013 2014 2015 2016
Former CFO
Former CFO Experience
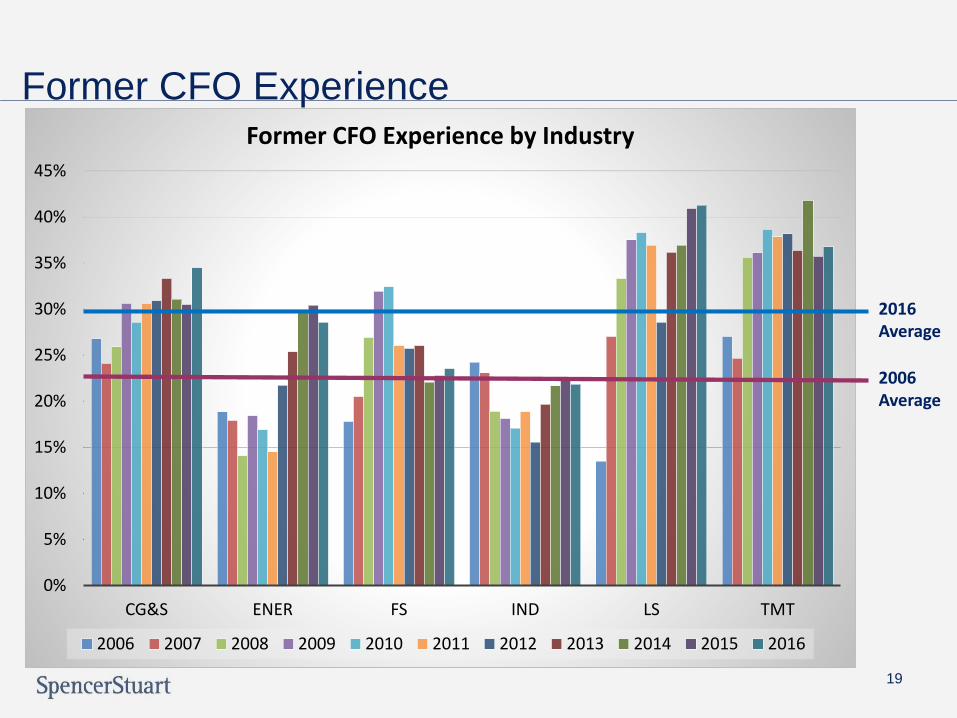
2006 Average
2016 Average
19
0%
5%
10%
15%
20%
25%
30%
35%
40%
45%
CG&S ENER FS IND LS TMT
Former CFO Experience by Industry
2006 2007 2008 2009 2010 2011 2012 2013 2014 2015 2016

Former CFO Experience
20
Public65%
Private9%
None26%
2016 External Placements Former CFO Experience
Prior Position
21
Prior Position
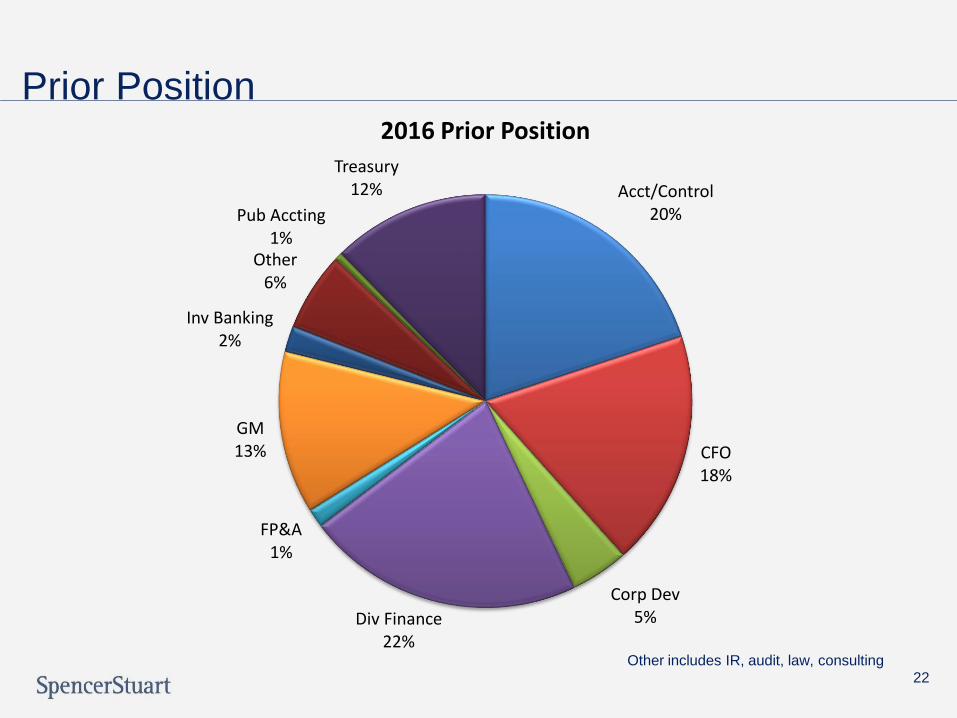
Other includes IR, audit, law, consulting22
Acct/Control20%
CFO18%
Corp Dev5%Div Finance
22%
FP&A1%
GM13%
Inv Banking2%
Other 6%
Pub Accting1%
Treasury12%
2016 Prior Position

Prior Position
Other includes IR, audit, law, consulting23
0%
5%
10%
15%
20%
25%
30%
ACCT/CONTROL CFO CORP DEV DIV FINANCE FP&A GM INV BANKING OTHER PUB ACCTING TREASURY
Prior Postion 2006 - 2016
2006 2007 2008 2009 2010 2011 2012 2013 2014 2015 2016

Prior Position
Other includes IR, audit, law, consulting 24
Acct/Cntrl2%
CFO56%
Corp Dev3%
Div Finance14% FP&A
1%
GM12%
Inv Banking4%
Other4%
Pub Accting2%Treasury
2%
2016 External Placements Prior Position
Prior Position
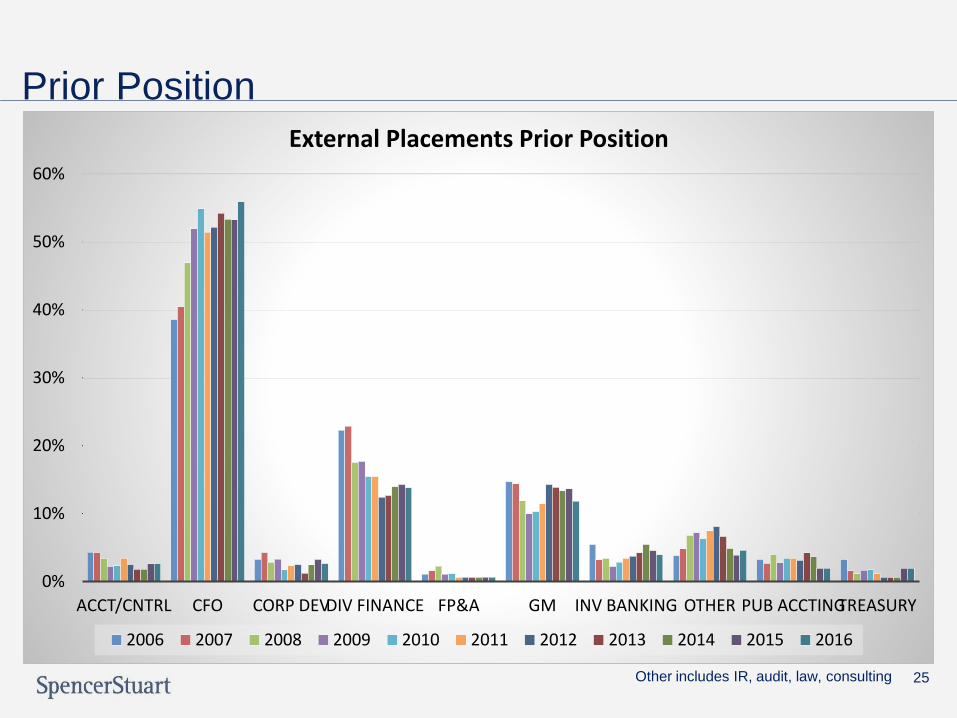
Other includes IR, audit, law, consulting 25
0%
10%
20%
30%
40%
50%
60%
ACCT/CNTRL CFO CORP DEVDIV FINANCE FP&A GM INV BANKING OTHER PUB ACCTINGTREASURY
External Placements Prior Position
2006 2007 2008 2009 2010 2011 2012 2013 2014 2015 2016

Demographics
26

Gender Diversity
27
6.8% 7%
8.5%8.8% 8.8%
10.2%
12.1%11.6%
12.3%
13.8%
12.5%
0
10
20
30
40
50
60
70
80
2006 2007 2008 2009 2010 2011 2012 2013 2014 2015 2016
Female CFOs in the F500
Gender Diversity
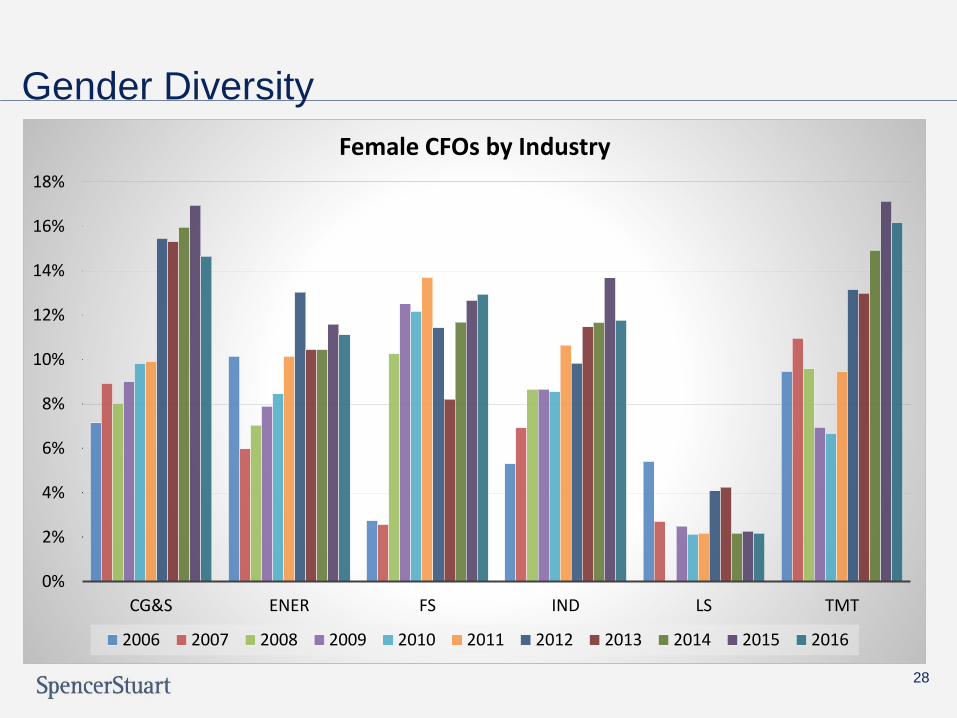
28
0%
2%
4%
6%
8%
10%
12%
14%
16%
18%
CG&S ENER FS IND LS TMT
Female CFOs by Industry
2006 2007 2008 2009 2010 2011 2012 2013 2014 2015 2016

Ethnic Diversity
29
3.3%3.5%
3.7%
3.3%
3.7%
4.3%
3.9%
4.3%
4.8%
6.2%
6.4%
0
5
10
15
20
25
30
35
2006 2007 2008 2009 2010 2011 2012 2013 2014 2015 2016
Diverse Execs in the Fortune 500
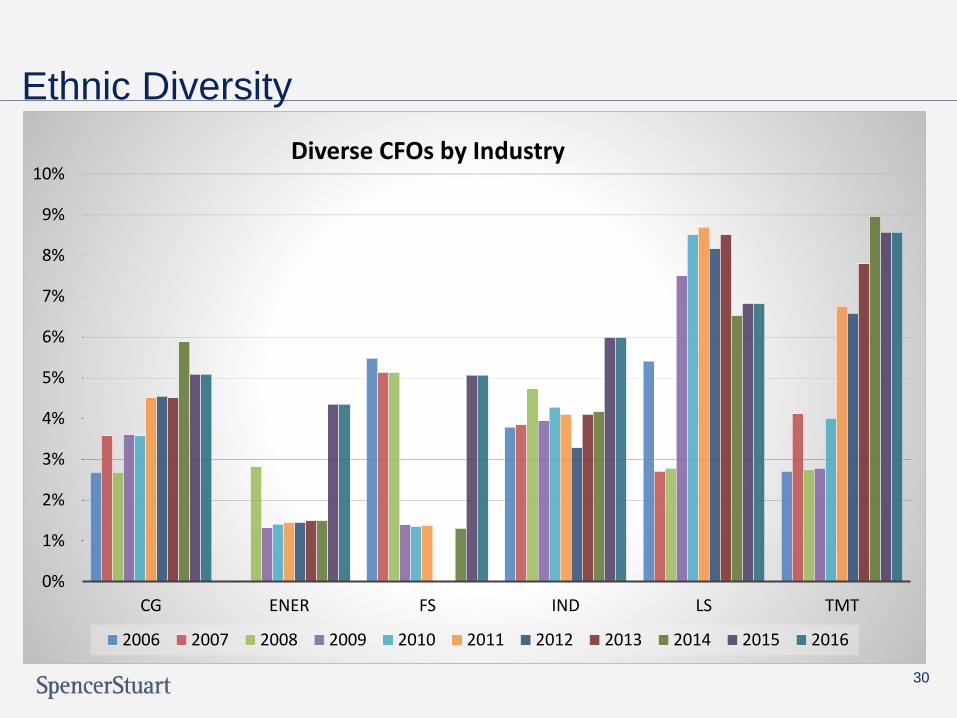
Ethnic Diversity
30
0%
1%
2%
3%
4%
5%
6%
7%
8%
9%
10%
CG ENER FS IND LS TMT
Diverse CFOs by Industry
2006 2007 2008 2009 2010 2011 2012 2013 2014 2015 2016

Education
Top five most attended MBA
schools
University of Chicago – 31
Harvard – 16
Kellogg - 15
Wharton – 13
Columbia – 11
31
0%
10%
20%
30%
40%
50%
60%
2006 2007 2008 2009 2010 2011 2012 2013 2014 2015 2016
CFO Education
MBA CPA
Fortune 500 CFOs in
the Boardroom
32

Fortune 500 CFOs in the Boardroom
33
2006 2007 2008 2009 2010 2011 2012 2013 2014 2015 2016
All 29% 26% 30% 32% 29% 29% 28% 29% 27% 27% 28%
Class Of 15% 13% 19% 27% 16% 22% 21% 20% 15% 15% 13%
0%
5%
10%
15%
20%
25%
30%
35%
F500 CFOs on Corporate Boards

Fortune 500 CFOs in the Boardroom
NOTE: This data includes CFOs sitting on their own company board.
34
0%
5%
10%
15%
20%
25%
30%
35%
40%
45%
CG&S ENER FS IND LS TMT
F500 CFOs on Corporate Boards
2006 2007 2008 2009 2010 2011 2012 2013 2014 2015 2016

Fortune 500 CFOs in the Boardroom
*Some CFOs sit on their own
corporate board and external
corporate board(s)
35
28%(136 CFOs)
72%(351 CFOs)
F500 CFOs on Corporate Boards
Sits on corporate board No boards
9%(44 CFOs)
91%(443 CFOs)
F500 CFOs on F500 boards
Sits on a F500 board No F500 boards
7%(33 CFOs)
93%(454 CFOs)
F500 CFOs on Outside F500 Boards
Sits as an Independent Director on a F500 board
Does not sit on an outside F500 board
Appendix
36

Fortune 500 Company Breakdown by Industry
2006 2007 2008 2009 2010 2011 2012 2013 2014 2015 2016
CG&S 112 22% 112 22% 112 22% 111 22% 112 22% 111 22% 110 22% 111 22% 119 24% 118 24% 116 23%
ENER 69 14% 67 13% 71 14% 76 15% 71 14% 69 14% 69 14% 67 13% 67 13% 69 14% 63 13%
FS 73 15% 78 16% 78 16% 72 14% 74 15% 73 15% 70 14% 73 15% 77 15% 79 16% 85 17%
IND 132 26% 130 26% 127 25% 127 25% 117 23% 122 24% 122 24% 122 24% 120 24% 117 23% 119 24%
LS 37 7% 37 7% 36 7% 40 8% 47 9% 46 9% 49 10% 47 9% 46 9% 44 9% 46 9%
TMT 74 15% 73 15% 73 15% 72 14% 75 15% 74 15% 76 15% 77 15% 67 13% 70 14% 68 14%
TTL 497 497 497 498 496 495 496 497 496 497 497
37