fort worth isd - center for new lives - 1998 Texas School Survey of Drug and Alcohol Use
136
-
Upload
texas-school-survey-of-drug-and-alcohol-use -
Category
Documents
-
view
218 -
download
0
Transcript of fort worth isd - center for new lives - 1998 Texas School Survey of Drug and Alcohol Use

8/6/2019 fort worth isd - center for new lives - 1998 Texas School Survey of Drug and Alcohol Use
http://slidepdf.com/reader/full/fort-worth-isd-center-for-new-lives-1998-texas-school-survey-of-drug-and 1/136

8/6/2019 fort worth isd - center for new lives - 1998 Texas School Survey of Drug and Alcohol Use
http://slidepdf.com/reader/full/fort-worth-isd-center-for-new-lives-1998-texas-school-survey-of-drug-and 2/136
Fort Worth ISD - Center for New Lives
Spring 1998
──────────────────────────────────────────────────────────────────────────────────────────────
Table T-1: How recently, if ever, have you used...
Past School Ever Never
Month Year Used Used
─────────────────────────────────────────────────────────────────────────────────────
Any tobacco product All 7.0% 17.9% 45.5% 54.5%
─────────────────────────────────────────────────────────────────────────────────────
Cigarettes All 4.9% 13.1% 42.3% 57.7%
─────────────────────────────────────────────────────────────────────────────────────
Smokeless tobacco All 2.1% 4.9% 7.3% 92.7%
──────────────────────────────────────────────────────────────────────────────────────────────
Table T-2: How often do you normally use...
Any tobacco product?
Several Several About About Less Than
Never Every Times Times Once a Once a Once a
Used Day a Week a Month Month Year Year
All 68.0% 4.7% 3.5% 2.7% 2.1% 10.6% 8.4%
Cigarettes?
Several Several About About Less Than
Never Every Times Times Once a Once a Once a
Used Day a Week a Month Month Year Year
All 68.6% 4.8% 3.5% 1.8% 2.1% 10.7% 8.5%
Smokeless tobacco?
Several Several About About Less Than
Never Every Times Times Once a Once a Once a
Used Day a Week a Month Month Year Year
All 91.7% * % * % 1.1% * % 3.5% 3.8%

8/6/2019 fort worth isd - center for new lives - 1998 Texas School Survey of Drug and Alcohol Use
http://slidepdf.com/reader/full/fort-worth-isd-center-for-new-lives-1998-texas-school-survey-of-drug-and 3/136
──────────────────────────────────────────────────────────────────────────────────────────────
Table T-3: In the past 30 days, how many cigarettes have you smoked?
>1 But >10 But >1 Pack
<1 Per <10 Per <1 Pack But <2 >2 Packs
None Day Day Per Day Packs/Day Per Day
All 90.7% 3.6% 4.7% 1.0% * % * %
──────────────────────────────────────────────────────────────────────────────────────────────
Table T-4: Average age of first use of:
All
Tobacco 13.1

8/6/2019 fort worth isd - center for new lives - 1998 Texas School Survey of Drug and Alcohol Use
http://slidepdf.com/reader/full/fort-worth-isd-center-for-new-lives-1998-texas-school-survey-of-drug-and 4/136

8/6/2019 fort worth isd - center for new lives - 1998 Texas School Survey of Drug and Alcohol Use
http://slidepdf.com/reader/full/fort-worth-isd-center-for-new-lives-1998-texas-school-survey-of-drug-and 5/136

8/6/2019 fort worth isd - center for new lives - 1998 Texas School Survey of Drug and Alcohol Use
http://slidepdf.com/reader/full/fort-worth-isd-center-for-new-lives-1998-texas-school-survey-of-drug-and 6/136
Fort Worth ISD - Center for New Lives
Spring 1998
──────────────────────────────────────────────────────────────────────────────────────────────
Table A-1: How recently, if ever, have you used...
Past School Ever Never
Month Year Used Used
─────────────────────────────────────────────────────────────────────────────────────
Any alcohol product All 21.9% 29.8% 72.3% 27.7%
─────────────────────────────────────────────────────────────────────────────────────
Beer All 12.0% 16.6% 42.0% 58.0%
─────────────────────────────────────────────────────────────────────────────────────
Wine coolers All 17.1% 24.5% 70.1% 29.9%
─────────────────────────────────────────────────────────────────────────────────────
Wine All 1.8% 10.4% 38.1% 61.9%
─────────────────────────────────────────────────────────────────────────────────────
Liquor All 11.1% 16.0% 33.1% 66.9%
──────────────────────────────────────────────────────────────────────────────────────────────
Table A-2: How often do you normally use...
Any alcohol product?
Several Several About About Less Than
Never Every Times Times Once a Once a Once a
Used Day a Week a Month Month Year Year
All 34.1% * % 3.9% 8.5% 18.8% 16.5% 18.1%
Beer?
Several Several About About Less Than
Never Every Times Times Once a Once a Once a
Used Day a Week a Month Month Year Year
All 56.5% * % 3.4% 7.7% 4.7% 12.3% 15.4%
Wine coolers?
Several Several About About Less Than

8/6/2019 fort worth isd - center for new lives - 1998 Texas School Survey of Drug and Alcohol Use
http://slidepdf.com/reader/full/fort-worth-isd-center-for-new-lives-1998-texas-school-survey-of-drug-and 7/136
Never Every Times Times Once a Once a Once a
Used Day a Week a Month Month Year Year
All 33.1% * % 4.4% 6.7% 16.6% 17.5% 21.7%
Wine?
Several Several About About Less Than
Never Every Times Times Once a Once a Once aUsed Day a Week a Month Month Year Year
All 61.0% * % 3.3% 1.1% 18.8% 7.7% 8.0%
Liquor?
Several Several About About Less Than
Never Every Times Times Once a Once a Once a
Used Day a Week a Month Month Year Year
All 68.5% * % * % 2.6% 8.2% 18.4% 2.2%

8/6/2019 fort worth isd - center for new lives - 1998 Texas School Survey of Drug and Alcohol Use
http://slidepdf.com/reader/full/fort-worth-isd-center-for-new-lives-1998-texas-school-survey-of-drug-and 8/136
Fort Worth ISD - Center for New Lives
Spring 1998
──────────────────────────────────────────────────────────────────────────────────────────────
Table A-3: When you drink the following alcoholic beverages, how many drinks do you usually
have at one time, on average?
Beer
Never Ever 5 or More 1 to 4 Less Than 1
All 64.1% 35.9% 3.4% 20.9% 11.7%
Wine Coolers
Never Ever 5 or More 1 to 4 Less Than 1
All 26.0% 74.0% 21.0% 41.8% 11.2%
Wine
Never Ever 5 or More 1 to 4 Less Than 1
All 55.7% 44.3% 9.5% 22.3% 12.5%
Liquor
Never Ever 5 or More 1 to 4 Less Than 1
All 62.8% 37.2% 5.1% 20.4% 11.7%
──────────────────────────────────────────────────────────────────────────────────────────────
Table A-4: During the past twelve months, how often have you had five or more drinks at one
time?
Beer
Several Several Less Than
Never Ever Times/Week Times/Month Once/Month
All 86.6% 13.4% * % 6.9% 6.5%

8/6/2019 fort worth isd - center for new lives - 1998 Texas School Survey of Drug and Alcohol Use
http://slidepdf.com/reader/full/fort-worth-isd-center-for-new-lives-1998-texas-school-survey-of-drug-and 9/136
Wine Coolers
Several Several Less Than
Never Ever Times/Week Times/Month Once/Month
All 60.9% 39.1% 2.8% 18.1% 18.2%
Wine
Several Several Less Than
Never Ever Times/Week Times/Month Once/Month
All 74.7% 25.3% 2.7% 8.5% 14.0%
Liquor
Several Several Less Than
Never Ever Times/Week Times/Month Once/Month
All 75.8% 24.2% 2.7% 3.9% 17.5%

8/6/2019 fort worth isd - center for new lives - 1998 Texas School Survey of Drug and Alcohol Use
http://slidepdf.com/reader/full/fort-worth-isd-center-for-new-lives-1998-texas-school-survey-of-drug-and 10/136
Fort Worth ISD - Center for New Lives
Spring 1998
──────────────────────────────────────────────────────────────────────────────────────────────
Table A-5: Average age of first use of:
All
Alcohol 13.6
Beer 13.2
Wine Coolers 14.0
Wine 14.4
Liquor 14.5
──────────────────────────────────────────────────────────────────────────────────────────────
Table A-6: If you wanted some, how difficult would it be to get...
Beer?
Never Very Somewhat Somewhat Very
Heard Of Impossible Difficult Difficult Easy Easy
All 19.7% 10.6% 4.7% 2.7% 13.4% 48.9%
Wine coolers?
Never Very Somewhat Somewhat Very
Heard Of Impossible Difficult Difficult Easy Easy
All 12.4% 9.5% 6.7% 3.8% 15.8% 51.9%
Wine?
Never Very Somewhat Somewhat Very
Heard Of Impossible Difficult Difficult Easy Easy
All 24.2% 11.9% 6.4% 1.7% 14.8% 41.0%
Liquor?
Never Very Somewhat Somewhat Very

8/6/2019 fort worth isd - center for new lives - 1998 Texas School Survey of Drug and Alcohol Use
http://slidepdf.com/reader/full/fort-worth-isd-center-for-new-lives-1998-texas-school-survey-of-drug-and 11/136
Heard Of Impossible Difficult Difficult Easy Easy
All 21.0% 13.6% 6.8% 1.8% 16.5% 40.3%
──────────────────────────────────────────────────────────────────────────────────────────────
Table A-7: Since school began in the fall, on how many days (if any) have you...
Attended class while drunk on alcohol?
None 1-3 Days 4-9 Days 10+ Days
All 91.1% 7.6% 1.3% * %
Gotten into trouble with teachers because of your drinking?
None 1-3 Days 4-9 Days 10+ Days
All 100.0% * % * % * %

8/6/2019 fort worth isd - center for new lives - 1998 Texas School Survey of Drug and Alcohol Use
http://slidepdf.com/reader/full/fort-worth-isd-center-for-new-lives-1998-texas-school-survey-of-drug-and 12/136
Fort Worth ISD - Center for New Lives
Spring 1998
──────────────────────────────────────────────────────────────────────────────────────────────
Table A-8: School year use of alcohol by absences and conduct problems:
Average days absent due to illness or other reasons:
Alcohol Users: 6.4 days per student
Alcohol Non-users: 4.5 days per student
Average days conduct problems reported:
Alcohol Users: 4.3 days per student
Alcohol Non-users: 2.3 days per student
──────────────────────────────────────────────────────────────────────────────────────────────
Table A-9: During the past twelve months, how many times have you...
Driven a car when you've had a good bit to drink?
None 1-3 Times 4-9 Times 10+ Times
All 92.5% 4.0% 3.4% * %
Gotten into trouble with the police because of drinking?
None 1-3 Times 4-9 Times 10+ Times
All 99.0% 1.0% * % * %
──────────────────────────────────────────────────────────────────────────────────────────────
Table A-10: About how many of your close friends use...
Any alcohol product?
Never heard
None A Few Some Most All
All 24.8% 20.3% 17.1% 15.9% 21.9%

8/6/2019 fort worth isd - center for new lives - 1998 Texas School Survey of Drug and Alcohol Use
http://slidepdf.com/reader/full/fort-worth-isd-center-for-new-lives-1998-texas-school-survey-of-drug-and 13/136
Beer?
Never heard
None A Few Some Most All
All 33.3% 26.4% 17.5% 10.4% 12.4%
Wine coolers?
Never heard
None A Few Some Most All
All 23.9% 21.3% 22.4% 15.6% 16.8%
Wine?
Never heard
None A Few Some Most All
All 48.9% 19.0% 11.4% 7.2% 13.4%

8/6/2019 fort worth isd - center for new lives - 1998 Texas School Survey of Drug and Alcohol Use
http://slidepdf.com/reader/full/fort-worth-isd-center-for-new-lives-1998-texas-school-survey-of-drug-and 14/136

8/6/2019 fort worth isd - center for new lives - 1998 Texas School Survey of Drug and Alcohol Use
http://slidepdf.com/reader/full/fort-worth-isd-center-for-new-lives-1998-texas-school-survey-of-drug-and 15/136
Do Not Most of
Drink Never Seldom the time Always
All 41.4% 38.2% 11.8% 4.8% 3.8%
From friends
Do Not Most of
Drink Never Seldom the time Always
All 30.3% 9.1% 19.0% 25.7% 15.9%
From a store
Do Not Most of
Drink Never Seldom the time Always
All 34.3% 29.7% 10.3% 17.8% 7.9%
At parties
Do Not Most of
Drink Never Seldom the time Always
All 31.6% 5.3% 15.0% 21.4% 26.7%

8/6/2019 fort worth isd - center for new lives - 1998 Texas School Survey of Drug and Alcohol Use
http://slidepdf.com/reader/full/fort-worth-isd-center-for-new-lives-1998-texas-school-survey-of-drug-and 16/136
Fort Worth ISD - Center for New Lives
Spring 1998
──────────────────────────────────────────────────────────────────────────────────────────────
Other source
Do Not Most of
Drink Never Seldom the time Always
All 45.6% 17.7% 6.5% 5.5% 24.7%
──────────────────────────────────────────────────────────────────────────────────────────────
Table A-14: How do your parents feel about kids your age drinking beer?
Strongly Mildly Mildly Strongly Don't
Disapprove Disapprove Neither Approve Approve Know
All 65.0% 7.9% 9.3% * % 2.8% 15.0%
──────────────────────────────────────────────────────────────────────────────────────────────
Table A-15: How dangerous do you think it is for kids your age to use alcohol?
Very Somewhat Not Very Not at All Do Not
Dangerous Dangerous Dangerous Dangerous Know
All 68.0% 20.8% 5.2% 2.9% 3.1%

8/6/2019 fort worth isd - center for new lives - 1998 Texas School Survey of Drug and Alcohol Use
http://slidepdf.com/reader/full/fort-worth-isd-center-for-new-lives-1998-texas-school-survey-of-drug-and 17/136
Fort Worth ISD - Center for New Lives
Spring 1998
──────────────────────────────────────────────────────────────────────────────────────────────
Table D-1: How recently, if ever, have you used...
Past School Ever Never
Month Year Used Used
─────────────────────────────────────────────────────────────────────────────────────
Marijuana? All 10.1% 18.1% 52.3% 47.7%
─────────────────────────────────────────────────────────────────────────────────────
Cocaine? All 0.9% 4.8% 18.8% 81.2%
─────────────────────────────────────────────────────────────────────────────────────
Crack? All * % * % 1.3% 98.7%
─────────────────────────────────────────────────────────────────────────────────────
Hallucinogens? All * % * % 4.7% 95.3%
─────────────────────────────────────────────────────────────────────────────────────
Uppers? All * % * % * % 100.0%─────────────────────────────────────────────────────────────────────────────────────
Downers? All * % * % 3.0% 97.0%
─────────────────────────────────────────────────────────────────────────────────────
Rohypnol? All 0.9% 0.9% 7.7% 92.3%
─────────────────────────────────────────────────────────────────────────────────────
Steroids? All * % * % 1.3% 98.7%
─────────────────────────────────────────────────────────────────────────────────────
Ecstasy? All * % * % * % 100.0%
─────────────────────────────────────────────────────────────────────────────────────
Heroin? All * % 0.9% 3.7% 96.3%
──────────────────────────────────────────────────────────────────────────────────────────────
Table D-2: How often do you normally use...
Marijuana?
Several Several About About Less Than
Never Every Times Times Once a Once a Once a
Used Day a Week a Month Month Year Year
All 53.0% * % * % 7.8% 4.6% 14.4% 20.2%
Cocaine?

8/6/2019 fort worth isd - center for new lives - 1998 Texas School Survey of Drug and Alcohol Use
http://slidepdf.com/reader/full/fort-worth-isd-center-for-new-lives-1998-texas-school-survey-of-drug-and 18/136
Several Several About About Less Than
Never Every Times Times Once a Once a Once a
Used Day a Week a Month Month Year Year
All 82.5% * % * % 1.0% 1.0% 7.9% 7.5%
Crack?
Several Several About About Less Than
Never Every Times Times Once a Once a Once a
Used Day a Week a Month Month Year Year
All 92.1% * % * % * % * % 4.8% 3.2%
Hallucinogens?
Several Several About About Less Than
Never Every Times Times Once a Once a Once a
Used Day a Week a Month Month Year Year
All 94.9% * % * % * % * % * % 5.1%

8/6/2019 fort worth isd - center for new lives - 1998 Texas School Survey of Drug and Alcohol Use
http://slidepdf.com/reader/full/fort-worth-isd-center-for-new-lives-1998-texas-school-survey-of-drug-and 19/136
Fort Worth ISD - Center for New Lives
Spring 1998
──────────────────────────────────────────────────────────────────────────────────────────────
Uppers?
Several Several About About Less Than
Never Every Times Times Once a Once a Once a
Used Day a Week a Month Month Year Year
All 100.0% * % * % * % * % * % * %
Downers?
Several Several About About Less Than
Never Every Times Times Once a Once a Once a
Used Day a Week a Month Month Year Year
All 100.0% * % * % * % * % * % * %
Rohypnol?
Several Several About About Less Than
Never Every Times Times Once a Once a Once a
Used Day a Week a Month Month Year Year
All 94.8% * % * % * % 0.9% 3.0% 1.3%
Steroids?
Several Several About About Less Than
Never Every Times Times Once a Once a Once a
Used Day a Week a Month Month Year Year
All 98.5% * % * % * % * % 1.5% * %
Ecstasy?
Several Several About About Less Than
Never Every Times Times Once a Once a Once a
Used Day a Week a Month Month Year Year

8/6/2019 fort worth isd - center for new lives - 1998 Texas School Survey of Drug and Alcohol Use
http://slidepdf.com/reader/full/fort-worth-isd-center-for-new-lives-1998-texas-school-survey-of-drug-and 20/136
All 95.5% * % * % * % * % 3.2% 1.4%
Heroin?
Several Several About About Less Than
Never Every Times Times Once a Once a Once a
Used Day a Week a Month Month Year Year
All 99.0% * % * % * % 1.0% * % * %
──────────────────────────────────────────────────────────────────────────────────────────────
Table D-3: Average age of first use of:
All
Marijuana 14.1
Cocaine 14.8
Crack *
Hallucinogens *
Uppers *Downers *
Rohypnol *
Steroids *
Ecstasy *
Heroin *

8/6/2019 fort worth isd - center for new lives - 1998 Texas School Survey of Drug and Alcohol Use
http://slidepdf.com/reader/full/fort-worth-isd-center-for-new-lives-1998-texas-school-survey-of-drug-and 21/136
Fort Worth ISD - Center for New Lives
Spring 1998
──────────────────────────────────────────────────────────────────────────────────────────────
Table D-4: Age of first use of marijuana by family situation:
Two parent family
Never 9 or Under 10-11 12-13 14-15 16-17 18 or Over
All 43.6% * % * % 29.7% 22.4% 4.3% * %
Other family situation
Never 9 or Under 10-11 12-13 14-15 16-17 18 or Over
All 46.7% * % 4.2% 10.6% 21.5% 17.0% * %
──────────────────────────────────────────────────────────────────────────────────────────────
Table D-5: If you wanted some, how difficult would it be to get...
Marijuana?
Never Very Somewhat Somewhat Very
Heard Of Impossible Difficult Difficult Easy Easy
All 15.3% 15.3% 11.1% 2.0% 7.9% 48.4%
Cocaine?
Never Very Somewhat Somewhat Very
Heard Of Impossible Difficult Difficult Easy Easy
All 26.6% 24.4% 8.7% 8.3% 7.7% 24.2%
Crack?
Never Very Somewhat Somewhat Very
Heard Of Impossible Difficult Difficult Easy Easy

8/6/2019 fort worth isd - center for new lives - 1998 Texas School Survey of Drug and Alcohol Use
http://slidepdf.com/reader/full/fort-worth-isd-center-for-new-lives-1998-texas-school-survey-of-drug-and 22/136
All 25.4% 28.1% 8.4% 7.9% 9.3% 20.9%
Hallucinogens?
Never Very Somewhat Somewhat Very
Heard Of Impossible Difficult Difficult Easy Easy
All 35.4% 33.0% 6.3% 8.9% 8.3% 8.2%
Uppers?
Never Very Somewhat Somewhat Very
Heard Of Impossible Difficult Difficult Easy Easy
All 34.1% 32.3% 6.6% 4.9% 11.5% 10.6%
Downers?
Never Very Somewhat Somewhat Very
Heard Of Impossible Difficult Difficult Easy Easy
All 39.8% 27.6% 6.4% 4.8% 8.2% 13.2%

8/6/2019 fort worth isd - center for new lives - 1998 Texas School Survey of Drug and Alcohol Use
http://slidepdf.com/reader/full/fort-worth-isd-center-for-new-lives-1998-texas-school-survey-of-drug-and 23/136
Fort Worth ISD - Center for New Lives
Spring 1998
──────────────────────────────────────────────────────────────────────────────────────────────
Rohypnol?
Never Very Somewhat Somewhat Very
Heard Of Impossible Difficult Difficult Easy Easy
All 43.0% 27.4% 3.3% 4.8% 7.6% 13.9%
Steroids?
Never Very Somewhat Somewhat Very
Heard Of Impossible Difficult Difficult Easy Easy
All 41.0% 30.1% 8.8% 6.7% 5.2% 8.2%
Ecstasy?
Never Very Somewhat Somewhat Very
Heard Of Impossible Difficult Difficult Easy Easy
All 46.7% 26.3% 3.4% 6.0% 4.2% 13.5%
Heroin?
Never Very Somewhat Somewhat Very
Heard Of Impossible Difficult Difficult Easy Easy
All 37.4% 28.0% 7.5% 6.0% 8.1% 12.9%
──────────────────────────────────────────────────────────────────────────────────────────────
Table D-6: Since school began in the fall, on how many days (if any) have you...
Attended class while high from marijuana use?
None 1-3 Days 4-9 Days 10+ Days
All 87.7% 9.9% 1.3% 1.0%

8/6/2019 fort worth isd - center for new lives - 1998 Texas School Survey of Drug and Alcohol Use
http://slidepdf.com/reader/full/fort-worth-isd-center-for-new-lives-1998-texas-school-survey-of-drug-and 24/136

8/6/2019 fort worth isd - center for new lives - 1998 Texas School Survey of Drug and Alcohol Use
http://slidepdf.com/reader/full/fort-worth-isd-center-for-new-lives-1998-texas-school-survey-of-drug-and 25/136
Fort Worth ISD - Center for New Lives
Spring 1998
──────────────────────────────────────────────────────────────────────────────────────────────
Table D-8: During the past twelve months, how many times have you...
Driven a car when you've felt high from drugs?
None 1-3 Times 4-9 Times 10+ Times
All 90.9% 3.2% 3.4% 2.5%
Gotten into trouble with the police because of drug use?
None 1-3 Times 4-9 Times 10+ Times
All 99.0% 1.0% * % * %
──────────────────────────────────────────────────────────────────────────────────────────────
Table D-9: About how many of your close friends use marijuana?
Never heard
None A Few Some Most All
All 36.8% 13.0% 15.6% 15.2% 19.5%
──────────────────────────────────────────────────────────────────────────────────────────────
Table D-10: During the past twelve months, how many times have you...
Had difficulties of any kind with your friends because of your drug use?
None 1-3 Times 4-9 Times 10+ Times
All 96.4% 3.6% * % * %
Been criticized by someone you were dating because of drug use?
None 1-3 Times 4-9 Times 10+ Times
All 94.7% 4.3% 1.0% * %

8/6/2019 fort worth isd - center for new lives - 1998 Texas School Survey of Drug and Alcohol Use
http://slidepdf.com/reader/full/fort-worth-isd-center-for-new-lives-1998-texas-school-survey-of-drug-and 26/136
──────────────────────────────────────────────────────────────────────────────────────────────
Table D-11: Thinking of parties you attended this school year, how often was marijuana used?
Half Most Of Don't Didn't
Never Seldom the Time the Time Always Know Attend
All 48.4% 3.7% 3.5% 14.4% 10.9% 1.8% 17.2%
──────────────────────────────────────────────────────────────────────────────────────────────
Table D-12: How often, if ever, do you smoke marijuana in...
Joints?
Half the Most of Don't
Never Seldom Time the Time Always Know
All 57.7% 15.8% 3.8% 7.7% 15.0% * %

8/6/2019 fort worth isd - center for new lives - 1998 Texas School Survey of Drug and Alcohol Use
http://slidepdf.com/reader/full/fort-worth-isd-center-for-new-lives-1998-texas-school-survey-of-drug-and 27/136
Fort Worth ISD - Center for New Lives
Spring 1998
──────────────────────────────────────────────────────────────────────────────────────────────
Blunts?
Half the Most of Don't
Never Seldom Time the Time Always Know
All 70.3% 11.2% * % 13.0% 5.4% * %
Bongs or water pipes?
Half the Most of Don't
Never Seldom Time the Time Always Know
All 90.7% 4.3% 3.7% * % * % 1.4%
Pipes?
Half the Most of Don't
Never Seldom Time the Time Always Know
All 86.7% 9.6% 3.7% * % * % * %
Some other way?
Half the Most of Don't
Never Seldom Time the Time Always Know
All 86.9% 5.4% * % * % 1.2% 6.5%
──────────────────────────────────────────────────────────────────────────────────────────────
Table D-13: How do your parents feel about kids your age using marijuana?
Strongly Mildly Mildly Strongly Don't
Disapprove Disapprove Neither Approve Approve Know
All 70.4% 5.7% 3.2% 1.0% 2.8% 16.8%
──────────────────────────────────────────────────────────────────────────────────────────────

8/6/2019 fort worth isd - center for new lives - 1998 Texas School Survey of Drug and Alcohol Use
http://slidepdf.com/reader/full/fort-worth-isd-center-for-new-lives-1998-texas-school-survey-of-drug-and 28/136
Table D-14: How dangerous do you think it is for kids your age to use...
Marijuana?
Very Somewhat Not Very Not at All Do Not
Dangerous Dangerous Dangerous Dangerous Know
All 63.5% 11.8% 14.6% 7.2% 3.0%
Cocaine?
Very Somewhat Not Very Not at All Do Not
Dangerous Dangerous Dangerous Dangerous Know
All 92.2% 4.0% * % * % 3.8%
Crack?
Very Somewhat Not Very Not at All Do Not
Dangerous Dangerous Dangerous Dangerous Know
All 96.8% * % * % * % 3.2%

8/6/2019 fort worth isd - center for new lives - 1998 Texas School Survey of Drug and Alcohol Use
http://slidepdf.com/reader/full/fort-worth-isd-center-for-new-lives-1998-texas-school-survey-of-drug-and 29/136
Fort Worth ISD - Center for New Lives
Spring 1998
──────────────────────────────────────────────────────────────────────────────────────────────
Ecstasy?
Very Somewhat Not Very Not at All Do Not
Dangerous Dangerous Dangerous Dangerous Know
All 89.5% 2.1% 1.1% * % 7.3%
Steroids?
Very Somewhat Not Very Not at All Do Not
Dangerous Dangerous Dangerous Dangerous Know
All 88.1% 3.5% * % * % 8.4%
Heroin?
Very Somewhat Not Very Not at All Do Not
Dangerous Dangerous Dangerous Dangerous Know
All 92.3% 1.9% * % * % 5.7%

8/6/2019 fort worth isd - center for new lives - 1998 Texas School Survey of Drug and Alcohol Use
http://slidepdf.com/reader/full/fort-worth-isd-center-for-new-lives-1998-texas-school-survey-of-drug-and 30/136

8/6/2019 fort worth isd - center for new lives - 1998 Texas School Survey of Drug and Alcohol Use
http://slidepdf.com/reader/full/fort-worth-isd-center-for-new-lives-1998-texas-school-survey-of-drug-and 31/136
Fort Worth ISD - Center for New Lives
Spring 1998
──────────────────────────────────────────────────────────────────────────────────────────────
Table I-1: How recently, if ever, have you used...
Past School Ever Never
Month Year Used Used
─────────────────────────────────────────────────────────────────────────────────────
Any inhalant? All * % 4.4% 23.9% 76.1%
─────────────────────────────────────────────────────────────────────────────────────
Liquid or spray paint? All * % 3.6% 13.3% 86.7%
─────────────────────────────────────────────────────────────────────────────────────
Whiteout, correction fluid? All * % * % 1.3% 98.7%
─────────────────────────────────────────────────────────────────────────────────────
Gasoline? All * % 1.0% 1.0% 99.0%
─────────────────────────────────────────────────────────────────────────────────────
Freon? All * % * % 3.0% 97.0%─────────────────────────────────────────────────────────────────────────────────────
Poppers, Locker Room, etc.? All * % * % 2.9% 97.1%
─────────────────────────────────────────────────────────────────────────────────────
Glue? All * % * % 1.2% 98.8%
─────────────────────────────────────────────────────────────────────────────────────
Paint, lacquer thinner, etc.? All * % 3.9% 7.6% 92.4%
─────────────────────────────────────────────────────────────────────────────────────
Nitrous oxide, laughing gas? All * % * % 0.9% 99.1%
─────────────────────────────────────────────────────────────────────────────────────
Octane booster? All * % 3.8% 17.8% 82.2%
─────────────────────────────────────────────────────────────────────────────────────
Other sprays? All * % * % 1.2% 98.8%─────────────────────────────────────────────────────────────────────────────────────
Other inhalants? All * % * % 9.2% 90.8%
──────────────────────────────────────────────────────────────────────────────────────────────
Table I-2: How often do you normally use inhalants?
Several Several About About Less Than
Never Every Times Times Once a Once a Once a
Used Day a Week a Month Month Year Year
All 85.9% * % * % * % * % 6.0% 8.0%

8/6/2019 fort worth isd - center for new lives - 1998 Texas School Survey of Drug and Alcohol Use
http://slidepdf.com/reader/full/fort-worth-isd-center-for-new-lives-1998-texas-school-survey-of-drug-and 32/136
──────────────────────────────────────────────────────────────────────────────────────────────
Table I-3: Number of different kinds of inhalants used:
0 1 2-3 4+
All 78.0% 6.2% 12.3% 3.5%
──────────────────────────────────────────────────────────────────────────────────────────────
Table I-4: Average age of first use of:
All
Inhalants *

8/6/2019 fort worth isd - center for new lives - 1998 Texas School Survey of Drug and Alcohol Use
http://slidepdf.com/reader/full/fort-worth-isd-center-for-new-lives-1998-texas-school-survey-of-drug-and 33/136

8/6/2019 fort worth isd - center for new lives - 1998 Texas School Survey of Drug and Alcohol Use
http://slidepdf.com/reader/full/fort-worth-isd-center-for-new-lives-1998-texas-school-survey-of-drug-and 34/136
8/6/2019 fort worth isd - center for new lives - 1998 Texas School Survey of Drug and Alcohol Use
http://slidepdf.com/reader/full/fort-worth-isd-center-for-new-lives-1998-texas-school-survey-of-drug-and 35/136
Fort Worth ISD - Center for New Lives
Spring 1998
──────────────────────────────────────────────────────────────────────────────────────────────
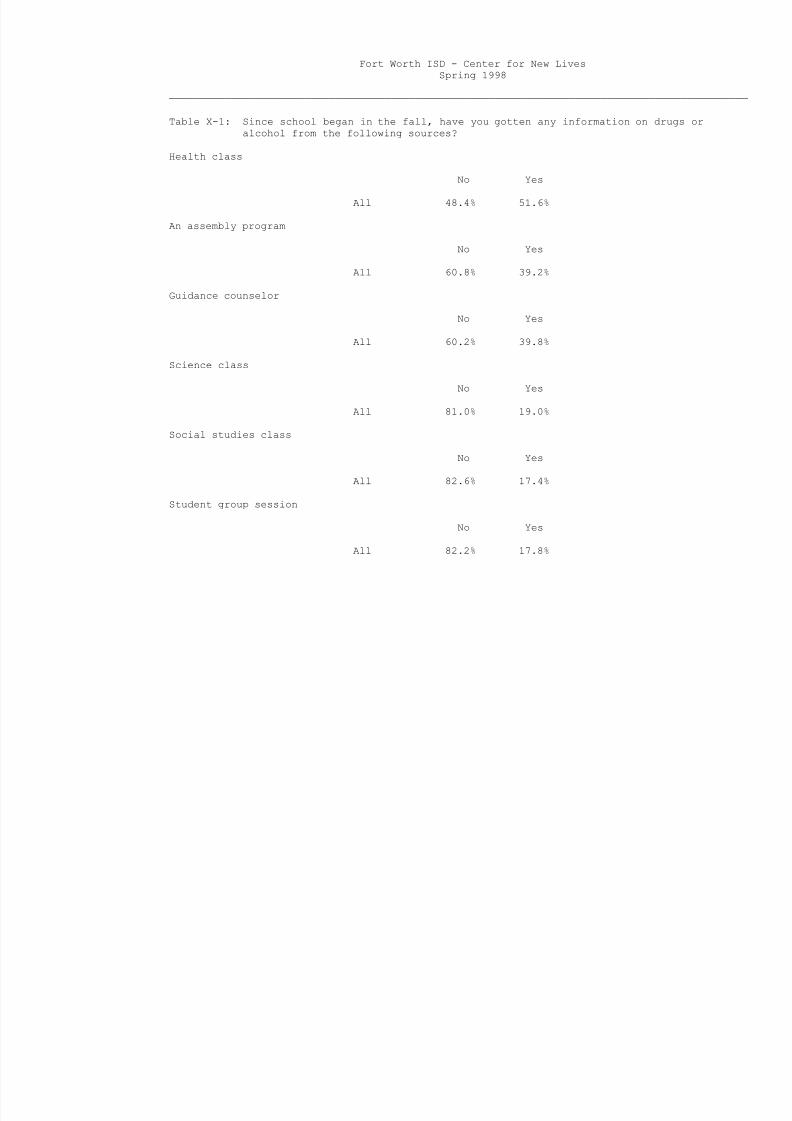
Table X-1: Since school began in the fall, have you gotten any information on drugs or
alcohol from the following sources?
Health class
No Yes
All 48.4% 51.6%
An assembly program
No Yes
All 60.8% 39.2%
Guidance counselor
No Yes
All 60.2% 39.8%
Science class
No Yes
All 81.0% 19.0%
Social studies class
No Yes
All 82.6% 17.4%
Student group session
No Yes
All 82.2% 17.8%

8/6/2019 fort worth isd - center for new lives - 1998 Texas School Survey of Drug and Alcohol Use
http://slidepdf.com/reader/full/fort-worth-isd-center-for-new-lives-1998-texas-school-survey-of-drug-and 36/136
An invited school guest
No Yes
All 54.7% 45.3%
Some other school source
No Yes
All 64.4% 35.6%
Any school source
No Yes
All 43.8% 56.2%

8/6/2019 fort worth isd - center for new lives - 1998 Texas School Survey of Drug and Alcohol Use
http://slidepdf.com/reader/full/fort-worth-isd-center-for-new-lives-1998-texas-school-survey-of-drug-and 37/136
Fort Worth ISD - Center for New Lives
Spring 1998
──────────────────────────────────────────────────────────────────────────────────────────────
Table X-2: If you had a drug or alcohol problem and needed help, who would you go to?
A counselor or program in school
No Yes
All 53.0% 47.0%
Another adult in school (such as a nurse or teacher)
No Yes
All 63.5% 36.5%
A counselor or program outside of school
No Yes
All 53.8% 46.2%
Your parents
No Yes
All 32.0% 68.0%
A medical doctor
No Yes
All 63.6% 36.4%
Your friends
No Yes
All 31.8% 68.2%

8/6/2019 fort worth isd - center for new lives - 1998 Texas School Survey of Drug and Alcohol Use
http://slidepdf.com/reader/full/fort-worth-isd-center-for-new-lives-1998-texas-school-survey-of-drug-and 38/136
Another adult (a relative, clergyman, or other family friend)
No Yes
All 36.5% 63.5%
──────────────────────────────────────────────────────────────────────────────────────────────
Table X-3: Since school began in the fall, have you sought help, other than from family or
friends, for problems in any way connected with your use of alcohol, marijuana,
or other drugs?
No Yes
All 82.4% 17.6%
──────────────────────────────────────────────────────────────────────────────────────────────
Table X-4: About how many of your friends:
Feel close to their parents?
None A Few Some Most All
All 14.0% 25.6% 22.7% 23.9% 13.7%

8/6/2019 fort worth isd - center for new lives - 1998 Texas School Survey of Drug and Alcohol Use
http://slidepdf.com/reader/full/fort-worth-isd-center-for-new-lives-1998-texas-school-survey-of-drug-and 39/136
Fort Worth ISD - Center for New Lives
Spring 1998
──────────────────────────────────────────────────────────────────────────────────────────────
Sometimes carry weapons?
None A Few Some Most All
All 58.0% 16.5% 16.8% 4.9% 3.7%
Care about making good grades?
None A Few Some Most All
All 6.4% 22.1% 19.0% 13.4% 39.1%
Belong/want to belong to a gang?
None A Few Some Most All
All 52.7% 20.7% 19.2% 7.4% * %
Wish they could drop out of school?
None A Few Some Most All
All 42.0% 29.9% 22.5% 5.6% * %

8/6/2019 fort worth isd - center for new lives - 1998 Texas School Survey of Drug and Alcohol Use
http://slidepdf.com/reader/full/fort-worth-isd-center-for-new-lives-1998-texas-school-survey-of-drug-and 40/136

8/6/2019 fort worth isd - center for new lives - 1998 Texas School Survey of Drug and Alcohol Use
http://slidepdf.com/reader/full/fort-worth-isd-center-for-new-lives-1998-texas-school-survey-of-drug-and 41/136
Fort Worth ISD - Center for New Lives
Spring 1998
Table B1: Prevalence and recency of use of selected substances by grade
--> All students
Past School Ever Never
Month Year Used Used
─────────────────────────────────────────────────────────────────────────────────────
Tobacco All 7.0% 17.9% 45.5% 54.5%─────────────────────────────────────────────────────────────────────────────────────
Alcohol All 21.9% 29.8% 72.3% 27.7%
─────────────────────────────────────────────────────────────────────────────────────
Inhalants All * % 4.4% 23.9% 76.1%
─────────────────────────────────────────────────────────────────────────────────────
Any Illicit Drug All 10.7% 18.4% 53.1% 46.9%
─────────────────────────────────────────────────────────────────────────────────────
Marijuana All 10.1% 18.1% 52.3% 47.7%
─────────────────────────────────────────────────────────────────────────────────────
Marijuana Only All 4.5% 7.8% 32.1% 67.9%
─────────────────────────────────────────────────────────────────────────────────────
Cocaine or Crack All 0.9% 4.7% 18.3% 81.7%
─────────────────────────────────────────────────────────────────────────────────────
Cocaine All 0.9% 4.8% 18.8% 81.2%
─────────────────────────────────────────────────────────────────────────────────────
Crack All * % * % 1.3% 98.7%
─────────────────────────────────────────────────────────────────────────────────────
Hallucinogens All * % * % 4.7% 95.3%
─────────────────────────────────────────────────────────────────────────────────────
Uppers All * % * % * % 100.0%
─────────────────────────────────────────────────────────────────────────────────────
Downers All * % * % 3.0% 97.0%
─────────────────────────────────────────────────────────────────────────────────────Rohypnol All 0.9% 0.9% 7.7% 92.3%
─────────────────────────────────────────────────────────────────────────────────────
Steroids All * % * % 1.3% 98.7%
─────────────────────────────────────────────────────────────────────────────────────
Ecstasy All * % * % * % 100.0%
─────────────────────────────────────────────────────────────────────────────────────
Heroin All * % 0.9% 3.7% 96.3%
Table B2: Prevalence and recency of use of selected substances by grade
--> Male students

8/6/2019 fort worth isd - center for new lives - 1998 Texas School Survey of Drug and Alcohol Use
http://slidepdf.com/reader/full/fort-worth-isd-center-for-new-lives-1998-texas-school-survey-of-drug-and 42/136

8/6/2019 fort worth isd - center for new lives - 1998 Texas School Survey of Drug and Alcohol Use
http://slidepdf.com/reader/full/fort-worth-isd-center-for-new-lives-1998-texas-school-survey-of-drug-and 43/136
Fort Worth ISD - Center for New Lives
Spring 1998
Table B3: Prevalence and recency of use of selected substances by grade
--> Female students
Past School Ever Never
Month Year Used Used
─────────────────────────────────────────────────────────────────────────────────────
Tobacco All 7.0% 16.9% 44.8% 55.2%─────────────────────────────────────────────────────────────────────────────────────
Alcohol All 21.0% 29.0% 72.0% 28.0%
─────────────────────────────────────────────────────────────────────────────────────
Inhalants All * % 4.5% 24.2% 75.8%
─────────────────────────────────────────────────────────────────────────────────────
Any Illicit Drug All 9.7% 17.5% 52.5% 47.5%
─────────────────────────────────────────────────────────────────────────────────────
Marijuana All 9.1% 17.1% 51.8% 48.2%
─────────────────────────────────────────────────────────────────────────────────────
Marijuana Only All 3.4% 6.8% 31.3% 68.7%
─────────────────────────────────────────────────────────────────────────────────────
Cocaine or Crack All 0.9% 4.8% 18.5% 81.5%
─────────────────────────────────────────────────────────────────────────────────────
Cocaine All 0.9% 4.9% 19.0% 81.0%
─────────────────────────────────────────────────────────────────────────────────────
Crack All * % * % 1.3% 98.7%
─────────────────────────────────────────────────────────────────────────────────────
Hallucinogens All * % * % 4.7% 95.3%
─────────────────────────────────────────────────────────────────────────────────────
Uppers All * % * % * % 100.0%
─────────────────────────────────────────────────────────────────────────────────────
Downers All * % * % 3.1% 96.9%
─────────────────────────────────────────────────────────────────────────────────────Rohypnol All 0.9% 0.9% 7.7% 92.3%
─────────────────────────────────────────────────────────────────────────────────────
Steroids All * % * % 1.3% 98.7%
─────────────────────────────────────────────────────────────────────────────────────
Ecstasy All * % * % * % 100.0%
─────────────────────────────────────────────────────────────────────────────────────
Heroin All * % 0.9% 3.8% 96.2%
Table B4: Prevalence and recency of use of selected substances by grade
--> White students

8/6/2019 fort worth isd - center for new lives - 1998 Texas School Survey of Drug and Alcohol Use
http://slidepdf.com/reader/full/fort-worth-isd-center-for-new-lives-1998-texas-school-survey-of-drug-and 44/136
Past School Ever Never
Month Year Used Used
─────────────────────────────────────────────────────────────────────────────────────
Tobacco All * % * % * % 100.0%
─────────────────────────────────────────────────────────────────────────────────────
Alcohol All * % * % * % 100.0%
─────────────────────────────────────────────────────────────────────────────────────
Inhalants All * % * % * % 100.0%
─────────────────────────────────────────────────────────────────────────────────────
Any Illicit Drug All * % * % * % 100.0%─────────────────────────────────────────────────────────────────────────────────────
Marijuana All * % * % * % 100.0%
─────────────────────────────────────────────────────────────────────────────────────
Marijuana Only All * % * % * % 100.0%
─────────────────────────────────────────────────────────────────────────────────────
Cocaine or Crack All * % * % * % 100.0%
─────────────────────────────────────────────────────────────────────────────────────
Cocaine All * % * % * % 100.0%
─────────────────────────────────────────────────────────────────────────────────────
Crack All * % * % * % 100.0%
─────────────────────────────────────────────────────────────────────────────────────
Hallucinogens All * % * % * % 100.0%
─────────────────────────────────────────────────────────────────────────────────────
Uppers All * % * % * % 100.0%
─────────────────────────────────────────────────────────────────────────────────────
Downers All * % * % * % 100.0%
─────────────────────────────────────────────────────────────────────────────────────
Rohypnol All * % * % * % 100.0%
─────────────────────────────────────────────────────────────────────────────────────
Steroids All * % * % * % 100.0%
─────────────────────────────────────────────────────────────────────────────────────
Ecstasy All * % * % * % 100.0%
─────────────────────────────────────────────────────────────────────────────────────Heroin All * % * % * % 100.0%

8/6/2019 fort worth isd - center for new lives - 1998 Texas School Survey of Drug and Alcohol Use
http://slidepdf.com/reader/full/fort-worth-isd-center-for-new-lives-1998-texas-school-survey-of-drug-and 45/136
Fort Worth ISD - Center for New Lives
Spring 1998
Table B5: Prevalence and recency of use of selected substances by grade
--> Black students
Past School Ever Never
Month Year Used Used
─────────────────────────────────────────────────────────────────────────────────────
Tobacco All 8.6% 16.6% 36.8% 63.2%─────────────────────────────────────────────────────────────────────────────────────
Alcohol All 16.8% 18.3% 72.1% 27.9%
─────────────────────────────────────────────────────────────────────────────────────
Inhalants All * % * % 1.4% 98.6%
─────────────────────────────────────────────────────────────────────────────────────
Any Illicit Drug All 6.3% 10.5% 44.5% 55.5%
─────────────────────────────────────────────────────────────────────────────────────
Marijuana All 6.5% 11.0% 46.5% 53.5%
─────────────────────────────────────────────────────────────────────────────────────
Marijuana Only All 6.1% 10.3% 43.7% 56.3%
─────────────────────────────────────────────────────────────────────────────────────
Cocaine or Crack All * % * % * % 100.0%
─────────────────────────────────────────────────────────────────────────────────────
Cocaine All * % * % * % 100.0%
─────────────────────────────────────────────────────────────────────────────────────
Crack All * % * % * % 100.0%
─────────────────────────────────────────────────────────────────────────────────────
Hallucinogens All * % * % * % 100.0%
─────────────────────────────────────────────────────────────────────────────────────
Uppers All * % * % * % 100.0%
─────────────────────────────────────────────────────────────────────────────────────
Downers All * % * % * % 100.0%
─────────────────────────────────────────────────────────────────────────────────────Rohypnol All * % * % * % 100.0%
─────────────────────────────────────────────────────────────────────────────────────
Steroids All * % * % 2.3% 97.7%
─────────────────────────────────────────────────────────────────────────────────────
Ecstasy All * % * % * % 100.0%
─────────────────────────────────────────────────────────────────────────────────────
Heroin All * % * % * % 100.0%
Table B6: Prevalence and recency of use of selected substances by grade
--> Mexican/American students

8/6/2019 fort worth isd - center for new lives - 1998 Texas School Survey of Drug and Alcohol Use
http://slidepdf.com/reader/full/fort-worth-isd-center-for-new-lives-1998-texas-school-survey-of-drug-and 46/136
Past School Ever Never
Month Year Used Used
─────────────────────────────────────────────────────────────────────────────────────
Tobacco All 5.3% 19.2% 55.4% 44.6%
─────────────────────────────────────────────────────────────────────────────────────
Alcohol All 27.2% 45.3% 72.3% 27.7%
─────────────────────────────────────────────────────────────────────────────────────
Inhalants All * % 9.5% 56.5% 43.5%
─────────────────────────────────────────────────────────────────────────────────────
Any Illicit Drug All 18.7% 30.2% 69.3% 30.7%─────────────────────────────────────────────────────────────────────────────────────
Marijuana All 16.5% 28.0% 63.8% 36.2%
─────────────────────────────────────────────────────────────────────────────────────
Marijuana Only All 2.4% 4.7% 16.9% 83.1%
─────────────────────────────────────────────────────────────────────────────────────
Cocaine or Crack All 2.4% 12.4% 45.5% 54.5%
─────────────────────────────────────────────────────────────────────────────────────
Cocaine All 2.4% 12.4% 45.5% 54.5%
─────────────────────────────────────────────────────────────────────────────────────
Crack All * % * % 3.6% 96.4%
─────────────────────────────────────────────────────────────────────────────────────
Hallucinogens All * % * % 13.4% 86.6%
─────────────────────────────────────────────────────────────────────────────────────
Uppers All * % * % * % 100.0%
─────────────────────────────────────────────────────────────────────────────────────
Downers All * % * % 7.3% 92.7%
─────────────────────────────────────────────────────────────────────────────────────
Rohypnol All 2.3% 2.3% 20.1% 79.9%
─────────────────────────────────────────────────────────────────────────────────────
Steroids All * % * % * % 100.0%
─────────────────────────────────────────────────────────────────────────────────────
Ecstasy All * % * % * % 100.0%
─────────────────────────────────────────────────────────────────────────────────────Heroin All * % 2.4% 10.0% 90.0%

8/6/2019 fort worth isd - center for new lives - 1998 Texas School Survey of Drug and Alcohol Use
http://slidepdf.com/reader/full/fort-worth-isd-center-for-new-lives-1998-texas-school-survey-of-drug-and 47/136
Fort Worth ISD - Center for New Lives
Spring 1998
Table B7: Prevalence and recency of use of selected substances by grade
--> Students reporting A and B grades
Past School Ever Never
Month Year Used Used
─────────────────────────────────────────────────────────────────────────────────────
Tobacco All 5.3% 13.9% 44.9% 55.1%─────────────────────────────────────────────────────────────────────────────────────
Alcohol All 21.2% 27.3% 67.2% 32.8%
─────────────────────────────────────────────────────────────────────────────────────
Inhalants All * % 5.0% 23.9% 76.1%
─────────────────────────────────────────────────────────────────────────────────────
Any Illicit Drug All 8.4% 14.2% 47.8% 52.2%
─────────────────────────────────────────────────────────────────────────────────────
Marijuana All 7.5% 13.5% 46.5% 53.5%
─────────────────────────────────────────────────────────────────────────────────────
Marijuana Only All 3.5% 8.2% 30.4% 69.6%
─────────────────────────────────────────────────────────────────────────────────────
Cocaine or Crack All 1.3% 2.6% 15.4% 84.6%
─────────────────────────────────────────────────────────────────────────────────────
Cocaine All 1.4% 2.7% 16.0% 84.0%
─────────────────────────────────────────────────────────────────────────────────────
Crack All * % * % 1.9% 98.1%
─────────────────────────────────────────────────────────────────────────────────────
Hallucinogens All * % * % 2.5% 97.5%
─────────────────────────────────────────────────────────────────────────────────────
Uppers All * % * % * % 100.0%
─────────────────────────────────────────────────────────────────────────────────────
Downers All * % * % * % 100.0%
─────────────────────────────────────────────────────────────────────────────────────Rohypnol All 1.3% 1.3% 9.2% 90.8%
─────────────────────────────────────────────────────────────────────────────────────
Steroids All * % * % 1.8% 98.2%
─────────────────────────────────────────────────────────────────────────────────────
Ecstasy All * % * % * % 100.0%
─────────────────────────────────────────────────────────────────────────────────────
Heroin All * % 1.3% 1.3% 98.7%
Table B8: Prevalence and recency of use of selected substances by grade
--> Students reporting C, D, and F grades

8/6/2019 fort worth isd - center for new lives - 1998 Texas School Survey of Drug and Alcohol Use
http://slidepdf.com/reader/full/fort-worth-isd-center-for-new-lives-1998-texas-school-survey-of-drug-and 48/136

8/6/2019 fort worth isd - center for new lives - 1998 Texas School Survey of Drug and Alcohol Use
http://slidepdf.com/reader/full/fort-worth-isd-center-for-new-lives-1998-texas-school-survey-of-drug-and 49/136
Fort Worth ISD - Center for New Lives
Spring 1998
Table B9: Prevalence and recency of use of selected substances by grade
--> Students living with two parents
Past School Ever Never
Month Year Used Used
─────────────────────────────────────────────────────────────────────────────────────
Tobacco All 3.0% 24.9% 47.3% 52.7%─────────────────────────────────────────────────────────────────────────────────────
Alcohol All 19.5% 29.0% 84.6% 15.4%
─────────────────────────────────────────────────────────────────────────────────────
Inhalants All * % 3.2% 30.7% 69.3%
─────────────────────────────────────────────────────────────────────────────────────
Any Illicit Drug All 3.0% 24.9% 57.5% 42.5%
─────────────────────────────────────────────────────────────────────────────────────
Marijuana All 3.0% 24.9% 57.5% 42.5%
─────────────────────────────────────────────────────────────────────────────────────
Marijuana Only All 2.9% 11.6% 33.7% 66.3%
─────────────────────────────────────────────────────────────────────────────────────
Cocaine or Crack All * % 9.6% 12.9% 87.1%
─────────────────────────────────────────────────────────────────────────────────────
Cocaine All * % 9.6% 12.9% 87.1%
─────────────────────────────────────────────────────────────────────────────────────
Crack All * % * % * % 100.0%
─────────────────────────────────────────────────────────────────────────────────────
Hallucinogens All * % * % * % 100.0%
─────────────────────────────────────────────────────────────────────────────────────
Uppers All * % * % * % 100.0%
─────────────────────────────────────────────────────────────────────────────────────
Downers All * % * % 10.9% 89.1%
─────────────────────────────────────────────────────────────────────────────────────Rohypnol All * % * % 9.9% 90.1%
─────────────────────────────────────────────────────────────────────────────────────
Steroids All * % * % 4.8% 95.2%
─────────────────────────────────────────────────────────────────────────────────────
Ecstasy All * % * % * % 100.0%
─────────────────────────────────────────────────────────────────────────────────────
Heroin All * % * % 10.0% 90.0%
Table B10: Prevalence and recency of use of selected substances by grade
--> Students not living with two parents

8/6/2019 fort worth isd - center for new lives - 1998 Texas School Survey of Drug and Alcohol Use
http://slidepdf.com/reader/full/fort-worth-isd-center-for-new-lives-1998-texas-school-survey-of-drug-and 50/136
Past School Ever Never
Month Year Used Used
─────────────────────────────────────────────────────────────────────────────────────
Tobacco All 8.8% 15.6% 46.5% 53.5%
─────────────────────────────────────────────────────────────────────────────────────
Alcohol All 23.8% 31.3% 70.1% 29.9%
─────────────────────────────────────────────────────────────────────────────────────
Inhalants All * % 5.1% 22.0% 78.0%
─────────────────────────────────────────────────────────────────────────────────────
Any Illicit Drug All 14.2% 16.6% 53.3% 46.7%─────────────────────────────────────────────────────────────────────────────────────
Marijuana All 13.4% 15.9% 52.2% 47.8%
─────────────────────────────────────────────────────────────────────────────────────
Marijuana Only All 5.4% 6.6% 32.6% 67.4%
─────────────────────────────────────────────────────────────────────────────────────
Cocaine or Crack All 1.3% 2.6% 20.6% 79.4%
─────────────────────────────────────────────────────────────────────────────────────
Cocaine All 1.4% 2.7% 21.4% 78.6%
─────────────────────────────────────────────────────────────────────────────────────
Crack All * % * % 1.8% 98.2%
─────────────────────────────────────────────────────────────────────────────────────
Hallucinogens All * % * % 6.7% 93.3%
─────────────────────────────────────────────────────────────────────────────────────
Uppers All * % * % * % 100.0%
─────────────────────────────────────────────────────────────────────────────────────
Downers All * % * % * % 100.0%
─────────────────────────────────────────────────────────────────────────────────────
Rohypnol All 1.2% 1.2% 6.8% 93.2%
─────────────────────────────────────────────────────────────────────────────────────
Steroids All * % * % * % 100.0%
─────────────────────────────────────────────────────────────────────────────────────
Ecstasy All * % * % * % 100.0%
─────────────────────────────────────────────────────────────────────────────────────Heroin All * % 1.3% 1.3% 98.7%
8/6/2019 fort worth isd - center for new lives - 1998 Texas School Survey of Drug and Alcohol Use
http://slidepdf.com/reader/full/fort-worth-isd-center-for-new-lives-1998-texas-school-survey-of-drug-and 51/136
Fort Worth ISD - Center for New Lives
Spring 1998
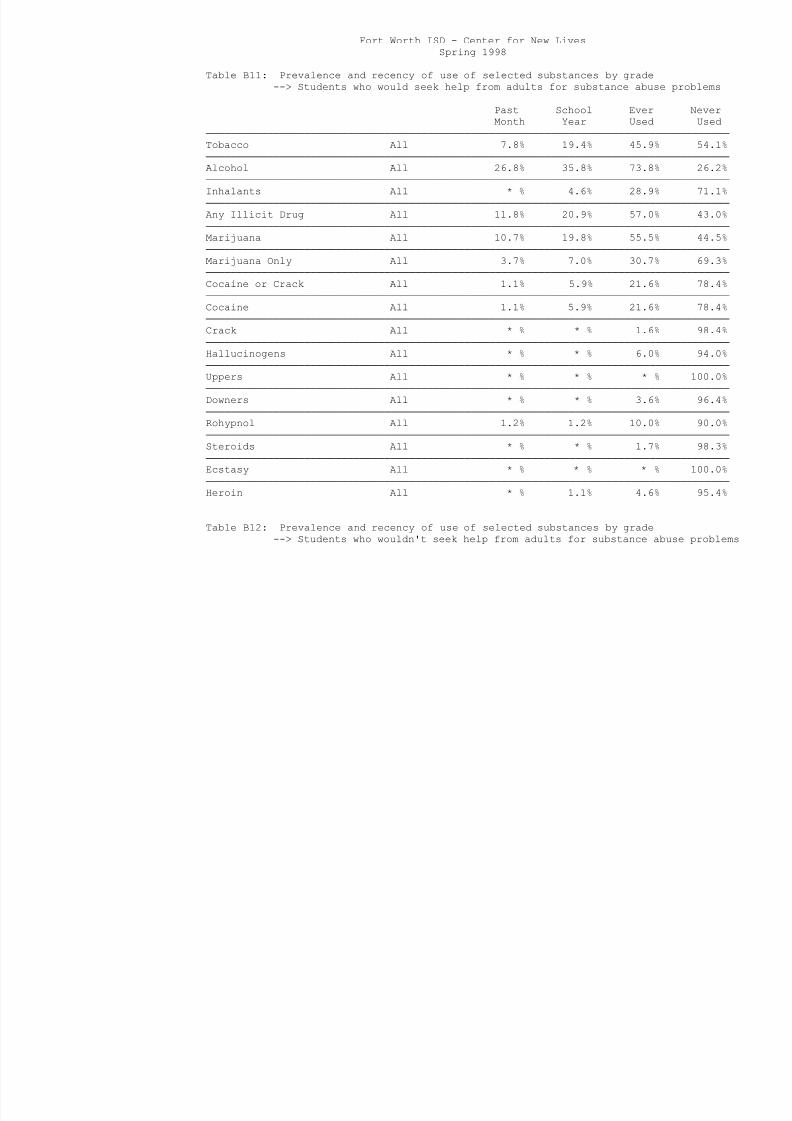
Table B11: Prevalence and recency of use of selected substances by grade
--> Students who would seek help from adults for substance abuse problems
Past School Ever Never
Month Year Used Used
─────────────────────────────────────────────────────────────────────────────────────
Tobacco All 7.8% 19.4% 45.9% 54.1%─────────────────────────────────────────────────────────────────────────────────────
Alcohol All 26.8% 35.8% 73.8% 26.2%
─────────────────────────────────────────────────────────────────────────────────────
Inhalants All * % 4.6% 28.9% 71.1%
─────────────────────────────────────────────────────────────────────────────────────
Any Illicit Drug All 11.8% 20.9% 57.0% 43.0%
─────────────────────────────────────────────────────────────────────────────────────
Marijuana All 10.7% 19.8% 55.5% 44.5%
─────────────────────────────────────────────────────────────────────────────────────
Marijuana Only All 3.7% 7.0% 30.7% 69.3%
─────────────────────────────────────────────────────────────────────────────────────
Cocaine or Crack All 1.1% 5.9% 21.6% 78.4%
─────────────────────────────────────────────────────────────────────────────────────
Cocaine All 1.1% 5.9% 21.6% 78.4%
─────────────────────────────────────────────────────────────────────────────────────
Crack All * % * % 1.6% 98.4%
─────────────────────────────────────────────────────────────────────────────────────
Hallucinogens All * % * % 6.0% 94.0%
─────────────────────────────────────────────────────────────────────────────────────
Uppers All * % * % * % 100.0%
─────────────────────────────────────────────────────────────────────────────────────
Downers All * % * % 3.6% 96.4%
─────────────────────────────────────────────────────────────────────────────────────Rohypnol All 1.2% 1.2% 10.0% 90.0%
─────────────────────────────────────────────────────────────────────────────────────
Steroids All * % * % 1.7% 98.3%
─────────────────────────────────────────────────────────────────────────────────────
Ecstasy All * % * % * % 100.0%
─────────────────────────────────────────────────────────────────────────────────────
Heroin All * % 1.1% 4.6% 95.4%
Table B12: Prevalence and recency of use of selected substances by grade
--> Students who wouldn't seek help from adults for substance abuse problems

8/6/2019 fort worth isd - center for new lives - 1998 Texas School Survey of Drug and Alcohol Use
http://slidepdf.com/reader/full/fort-worth-isd-center-for-new-lives-1998-texas-school-survey-of-drug-and 52/136

8/6/2019 fort worth isd - center for new lives - 1998 Texas School Survey of Drug and Alcohol Use
http://slidepdf.com/reader/full/fort-worth-isd-center-for-new-lives-1998-texas-school-survey-of-drug-and 53/136
P t S h l E N

8/6/2019 fort worth isd - center for new lives - 1998 Texas School Survey of Drug and Alcohol Use
http://slidepdf.com/reader/full/fort-worth-isd-center-for-new-lives-1998-texas-school-survey-of-drug-and 54/136
Past School Ever Never
Month Year Used Used
─────────────────────────────────────────────────────────────────────────────────────
Tobacco All 10.8% 22.8% 39.7% 60.3%
─────────────────────────────────────────────────────────────────────────────────────
Alcohol All 28.4% 32.1% 73.2% 26.8%
─────────────────────────────────────────────────────────────────────────────────────
Inhalants All * % 5.5% 12.8% 87.2%
─────────────────────────────────────────────────────────────────────────────────────
Any Illicit Drug All 17.3% 24.4% 53.1% 46.9%─────────────────────────────────────────────────────────────────────────────────────
Marijuana All 16.4% 23.9% 53.5% 46.5%
─────────────────────────────────────────────────────────────────────────────────────
Marijuana Only All 4.1% 11.1% 32.6% 67.4%
─────────────────────────────────────────────────────────────────────────────────────
Cocaine or Crack All 1.9% 1.9% 18.3% 81.7%
─────────────────────────────────────────────────────────────────────────────────────
Cocaine All 1.9% 1.9% 18.3% 81.7%
─────────────────────────────────────────────────────────────────────────────────────
Crack All * % * % 2.7% 97.3%
─────────────────────────────────────────────────────────────────────────────────────
Hallucinogens All * % * % 7.8% 92.2%
─────────────────────────────────────────────────────────────────────────────────────
Uppers All * % * % * % 100.0%
─────────────────────────────────────────────────────────────────────────────────────
Downers All * % * % * % 100.0%
─────────────────────────────────────────────────────────────────────────────────────
Rohypnol All 1.8% 1.8% 10.0% 90.0%
─────────────────────────────────────────────────────────────────────────────────────
Steroids All * % * % * % 100.0%
─────────────────────────────────────────────────────────────────────────────────────
Ecstasy All * % * % * % 100.0%
─────────────────────────────────────────────────────────────────────────────────────Heroin All * % 1.9% 1.9% 98.1%

8/6/2019 fort worth isd - center for new lives - 1998 Texas School Survey of Drug and Alcohol Use
http://slidepdf.com/reader/full/fort-worth-isd-center-for-new-lives-1998-texas-school-survey-of-drug-and 55/136
15 13 1609 19 2

8/6/2019 fort worth isd - center for new lives - 1998 Texas School Survey of Drug and Alcohol Use
http://slidepdf.com/reader/full/fort-worth-isd-center-for-new-lives-1998-texas-school-survey-of-drug-and 56/136
15 13.1609 19.2
16 21.70919 31.7
17 11.2063 16.4
18 13.86365 20.3
19 or older 3.111931 4.5
Frequency Missing = 0.5728782288
ETHNICITY
Q5 Frequency Percent
──────────────────────────────────────
African/American 40.7146 60.0
Mexican/American 25.68976 37.9
White 1.400369 2.1
Frequency Missing = 1.1952644526
The frequencies have been weighted so that the
analysis reflects the distribution of students by grade
level in the campus
Fort Worth ISD - Center for New Lives

8/6/2019 fort worth isd - center for new lives - 1998 Texas School Survey of Drug and Alcohol Use
http://slidepdf.com/reader/full/fort-worth-isd-center-for-new-lives-1998-texas-school-survey-of-drug-and 57/136
Fort Worth ISD - Center for New Lives
Spring 1998
ON AVERAGE WHAT GRADES
DO YOU GET
Q6 Frequency Percent
────────────────────────────────
Mostly A's 6.807671 10.1
Mostly B's 41.98638 62.1Mostly C's 18.2327 27.0
Mostly D's 0.622386 0.9
Frequency Missing = 1.3508610086
LENGTH OF TIME IN THIS DISTRICT
Q7 Frequency Percent
───────────────────────────────
<1 year 23.06854 33.4
2-3 years 13.14804 19.1
>4 years 32.78342 47.5
DO YOU HAVE A JOB
Q8 Frequency Percent
────────────────────────────────No 50.41084 73.1
Yes 18.58916 26.9
DO YOU GET AN ALLOWANCE
Q9 Frequency Percent
────────────────────────────────
No 41.06309 60.0
Yes 27.36403 40.0

8/6/2019 fort worth isd - center for new lives - 1998 Texas School Survey of Drug and Alcohol Use
http://slidepdf.com/reader/full/fort-worth-isd-center-for-new-lives-1998-texas-school-survey-of-drug-and 58/136
Frequency Missing = 0.5728782288
EITHER PARENT COLLEGE GRADUATE
Q10 Frequency Percent
────────────────────────────────Don't Know 14.59881 21.2
No 40.00182 58.0
Yes 14.39937 20.9
QUALIFY FOR FREE/REDUCED
PRICE LUNCH
Q11 Frequency Percent
────────────────────────────────
Don't Know 11.08799 16.1
No 21.68232 31.4
Yes 36.22969 52.5
The frequencies have been weighted so that the
analysis reflects the distribution of students by grade
level in the campus
Fort Worth ISD - Center for New Lives

8/6/2019 fort worth isd - center for new lives - 1998 Texas School Survey of Drug and Alcohol Use
http://slidepdf.com/reader/full/fort-worth-isd-center-for-new-lives-1998-texas-school-survey-of-drug-and 59/136
Fort Worth ISD Center for New Lives
Spring 1998
PARTICIPATE IN ATHLETICS
Q12A Frequency Percent
────────────────────────────────
No 43.89225 65.5
Yes 23.13451 34.5
Frequency Missing = 1.9732472325
PARTICIPATE IN BAND/ORCHESTRA
Q12B Frequency Percent
────────────────────────────────
No 57.55838 92.1
Yes 4.911707 7.9
Frequency Missing = 6.5299116628
PARTICIPATE IN CHOIR
Q12C Frequency Percent
────────────────────────────────
No 48.6742 78.6
Yes 13.28525 21.4
Frequency Missing = 7.0405512691
PARTICIPATE IN DRAMA/SPEECH
Q12D Frequency Percent
────────────────────────────────
No 48.75534 81.2
Yes 11.29914 18.8

8/6/2019 fort worth isd - center for new lives - 1998 Texas School Survey of Drug and Alcohol Use
http://slidepdf.com/reader/full/fort-worth-isd-center-for-new-lives-1998-texas-school-survey-of-drug-and 60/136
Frequency Missing = 8.9455160461
PARTICIPATE IN DRILL
TEAM/CHEERLEADING
Q12E Frequency Percent────────────────────────────────
No 48.66713 76.7
Yes 14.79826 23.3
Frequency Missing = 5.5346080734
PARTICIPATE IN STUDENT
GOVERNMENT
Q12F Frequency Percent
────────────────────────────────
No 57.45229 91.1
Yes 5.640182 8.9
Frequency Missing = 5.9075254389
The frequencies have been weighted so that the
analysis reflects the distribution of students by grade
level in the campus
Fort Worth ISD - Center for New Lives

8/6/2019 fort worth isd - center for new lives - 1998 Texas School Survey of Drug and Alcohol Use
http://slidepdf.com/reader/full/fort-worth-isd-center-for-new-lives-1998-texas-school-survey-of-drug-and 61/136
o t o t S Ce te o e es
Spring 1998
PARTICIPATE IN SCHOOL
NEWSPAPER/YEARBOOK
Q12G Frequency Percent
────────────────────────────────
No 60.09178 91.8
Yes 5.379012 8.2
Frequency Missing = 3.5292127921
PARTICIPATE IN ACADEMIC
CLUBS/SOCIETIES
Q12H Frequency Percent
────────────────────────────────
No 60.19131 93.4Yes 4.25203 6.6
Frequency Missing = 4.5566644303
PARTICIPATE IN SERVICE CLUBS
Q12I Frequency Percent
────────────────────────────────No 59.41332 96.8
Yes 1.973247 3.2
Frequency Missing = 7.6134294979
PARTICIPATE IN VOE/DE/WORK-STUDY
Q12J Frequency Percent
────────────────────────────────

8/6/2019 fort worth isd - center for new lives - 1998 Texas School Survey of Drug and Alcohol Use
http://slidepdf.com/reader/full/fort-worth-isd-center-for-new-lives-1998-texas-school-survey-of-drug-and 62/136
Fort Worth ISD - Center for New Lives

8/6/2019 fort worth isd - center for new lives - 1998 Texas School Survey of Drug and Alcohol Use
http://slidepdf.com/reader/full/fort-worth-isd-center-for-new-lives-1998-texas-school-survey-of-drug-and 63/136
Spring 1998
DO YOU FEEL SAFE IN YOUR NEIGHBORHOOD
Q13B Frequency Percent
─────────────────────────────────────
Very Safe 14.90345 21.8
Somewhat Safe 33.31759 48.8
Not Very Safe 11.67077 17.1Not Safe At All 7.757324 11.4
Don't Know 0.572878 0.8
Frequency Missing = 0.7779827798
DO YOU FEEL SAFE AT SCHOOL
Q13C Frequency Percent
─────────────────────────────────────Very Safe 18.49297 27.8
Somewhat Safe 29.60179 44.5
Not Very Safe 10.97573 16.5
Not Safe At All 0.777983 1.2
Don't Know 6.667634 10.0
Frequency Missing = 2.4838868389
FRIENDS FEELING CLOSE
TO THEIR PARENTS
Q14A Frequency Percent
───────────────────────────
None 9.512736 14.0
A Few 17.36175 25.6
Some 15.42348 22.7
Most 16.24209 23.9
All 9.31419 13.7
Frequency Missing = 1.1457564576

8/6/2019 fort worth isd - center for new lives - 1998 Texas School Survey of Drug and Alcohol Use
http://slidepdf.com/reader/full/fort-worth-isd-center-for-new-lives-1998-texas-school-survey-of-drug-and 64/136
HOW MANY FRIENDS
CARRY WEAPONS
Q14B Frequency Percent
───────────────────────────
None 37.23721 58.0A Few 10.62069 16.5
Some 10.80136 16.8
Most 3.156295 4.9
All 2.378313 3.7
Frequency Missing = 4.8061332886
The frequencies have been weighted so that the
analysis reflects the distribution of students by grade
level in the campus
Fort Worth ISD - Center for New Lives

8/6/2019 fort worth isd - center for new lives - 1998 Texas School Survey of Drug and Alcohol Use
http://slidepdf.com/reader/full/fort-worth-isd-center-for-new-lives-1998-texas-school-survey-of-drug-and 65/136
Spring 1998
HOW MANY FRIENDS CARE
ABOUT GOOD GRADES
Q14C Frequency Percent
───────────────────────────
None 4.401068 6.4
A Few 15.12218 22.1Some 12.99244 19.0
Most 9.169395 13.4
All 26.74203 39.1
Frequency Missing = 0.5728782288
HOW MANY FRIENDS
BELONG TO A GANG
Q14D Frequency Percent
───────────────────────────
None 36.08631 52.7
A Few 14.1382 20.7
Some 13.13531 19.2
Most 5.067304 7.4
Frequency Missing = 0.5728782288
FRIENDS WISHING TO
DROP OUT OF SCHOOL
Q14E Frequency Percent
───────────────────────────
None 27.22104 42.0
A Few 19.3728 29.9
Some 14.59933 22.5
Most 3.623085 5.6
Frequency Missing = 4.1837470647

8/6/2019 fort worth isd - center for new lives - 1998 Texas School Survey of Drug and Alcohol Use
http://slidepdf.com/reader/full/fort-worth-isd-center-for-new-lives-1998-texas-school-survey-of-drug-and 66/136
PARENTS ATTEND PTA/SCHOOL
OPEN HOUSES
Q15 Frequency Percent
────────────────────────────────
No 43.40141 66.3Yes 22.07452 33.7
Frequency Missing = 3.5240691043
EVER INHALED SPRAY PAINT FOR KICKS
Q16A Frequency Percent
────────────────────────────────────────
Never Heard/Used 58.35424 86.7In Your Lifetime 6.512037 9.7
Since School Began 2.427821 3.6
Frequency Missing = 1.705904059
The frequencies have been weighted so that the
analysis reflects the distribution of students by grade
level in the campus
Fort Worth ISD - Center for New Lives

8/6/2019 fort worth isd - center for new lives - 1998 Texas School Survey of Drug and Alcohol Use
http://slidepdf.com/reader/full/fort-worth-isd-center-for-new-lives-1998-texas-school-survey-of-drug-and 67/136
Spring 1998
EVER INHALED WHITEOUT FOR KICKS
Q16B Frequency Percent
────────────────────────────────────────
Never Heard/Used 60.20352 98.7
In Your Lifetime 0.777983 1.3
Frequency Missing = 8.0184949122
EVER INHALED GASOLINE FOR KICKS
Q16C Frequency Percent
────────────────────────────────────────
Never Heard/Used 64.2934 99.0
Since School Began 0.622386 1.0
Frequency Missing = 4.0842167058
EVER INHALED FREON FOR KICKS
Q16D Frequency Percent
────────────────────────────────────────
Never Heard/Used 59.2756 97.0
In Your Lifetime 1.805434 3.0
Frequency Missing = 7.9189645533
EVER INHALED POPPERS, ETC. FOR KICKS
Q16E Frequency Percent
────────────────────────────────────────
Never Heard/Used 60.932 97.1
In Your Lifetime 1.805434 2.9

8/6/2019 fort worth isd - center for new lives - 1998 Texas School Survey of Drug and Alcohol Use
http://slidepdf.com/reader/full/fort-worth-isd-center-for-new-lives-1998-texas-school-survey-of-drug-and 68/136
Fort Worth ISD - Center for New Lives
S i 1998

8/6/2019 fort worth isd - center for new lives - 1998 Texas School Survey of Drug and Alcohol Use
http://slidepdf.com/reader/full/fort-worth-isd-center-for-new-lives-1998-texas-school-survey-of-drug-and 69/136
Spring 1998
EVER INHALED NITROUS OXIDE FOR KICKS
Q16H Frequency Percent
────────────────────────────────────────
Never Heard/Used 64.1378 99.1
In Your Lifetime 0.572878 0.9
Frequency Missing = 4.2893212568
EVER INHALED OCTANE BOOSTER FOR KICKS
Q16I Frequency Percent
────────────────────────────────────────
Never Heard/Used 52.56502 82.2
In Your Lifetime 8.939858 14.0
Since School Began 2.427821 3.8
Frequency Missing = 5.0673040367
EVER INHALED OTHER SPRAYS FOR KICKS
Q16J Frequency Percent
────────────────────────────────────────
Never Heard/Used 63.15471 98.8
In Your Lifetime 0.777983 1.2
Frequency Missing = 5.0673040367
EVER INHALED OTHER INHALANTS FOR KICKS
Q16K Frequency Percent
────────────────────────────────────────
Never Heard/Used 60.98806 90.8
In Your Lifetime 6.206502 9.2

8/6/2019 fort worth isd - center for new lives - 1998 Texas School Survey of Drug and Alcohol Use
http://slidepdf.com/reader/full/fort-worth-isd-center-for-new-lives-1998-texas-school-survey-of-drug-and 70/136
Frequency Missing = 1.805434418
RECENT CIGARETTE USE
Q17A Frequency Percent────────────────────────────────────────
Never Heard/Used 38.38927 57.7
In Your Lifetime 19.40495 29.2
Since School Began 5.447294 8.2
In the Past Month 3.2746 4.9
Frequency Missing = 2.4838868389
The frequencies have been weighted so that the
analysis reflects the distribution of students by grade
level in the campus
Fort Worth ISD - Center for New Lives
Spring 1998

8/6/2019 fort worth isd - center for new lives - 1998 Texas School Survey of Drug and Alcohol Use
http://slidepdf.com/reader/full/fort-worth-isd-center-for-new-lives-1998-texas-school-survey-of-drug-and 71/136
Spring 1998
RECENT SMOKELESS TOBACCO USE
Q17B Frequency Percent
────────────────────────────────────────
Never Heard/Used 59.99842 92.7
In Your Lifetime 1.555966 2.4
Since School Began 1.805434 2.8In the Past Month 1.350861 2.1
Frequency Missing = 4.2893212568
RECENT BEER USE
Q17C Frequency Percent
────────────────────────────────────────
Never Heard/Used 37.52963 58.0In Your Lifetime 16.46739 25.4
Since School Began 2.951191 4.6
In the Past Month 7.762468 12.0
Frequency Missing = 4.2893212568
RECENT WINE COOLER USE
Q17D Frequency Percent
────────────────────────────────────────
Never Heard/Used 19.1965 29.9
In Your Lifetime 29.19763 45.5
Since School Began 4.768842 7.4
In the Past Month 10.97483 17.1
Frequency Missing = 4.8621994856
RECENT WINE USE

8/6/2019 fort worth isd - center for new lives - 1998 Texas School Survey of Drug and Alcohol Use
http://slidepdf.com/reader/full/fort-worth-isd-center-for-new-lives-1998-texas-school-survey-of-drug-and 72/136
Q17E Frequency Percent
────────────────────────────────────────
Never Heard/Used 40.0953 61.9
In Your Lifetime 17.97899 27.7
Since School Began 5.540652 8.5
In the Past Month 1.195264 1.8
Frequency Missing = 4.1897908979
RECENT LIQUOR USE
Q17F Frequency Percent
────────────────────────────────────────
Never Heard/Used 39.22949 66.9
In Your Lifetime 10.00486 17.1
Since School Began 2.851661 4.9
In the Past Month 6.529912 11.1
Frequency Missing = 10.384076932
The frequencies have been weighted so that the
analysis reflects the distribution of students by grade
level in the campus
Fort Worth ISD - Center for New Lives
Spring 1998

8/6/2019 fort worth isd - center for new lives - 1998 Texas School Survey of Drug and Alcohol Use
http://slidepdf.com/reader/full/fort-worth-isd-center-for-new-lives-1998-texas-school-survey-of-drug-and 73/136
Spring 1998
RECENT MARIJUANA USE
Q18A Frequency Percent
────────────────────────────────────────
Never Heard/Used 31.70801 47.7
In Your Lifetime 22.79875 34.3
Since School Began 5.279481 7.9In the Past Month 6.729873 10.1
Frequency Missing = 2.4838868389
RECENT COCAINE USE
Q18B Frequency Percent
────────────────────────────────────────
Never Heard/Used 49.71336 81.2In Your Lifetime 8.534793 13.9
Since School Began 2.378313 3.9
In the Past Month 0.572878 0.9
Frequency Missing = 7.8006597339
RECENT CRACK USE
Q18C Frequency Percent
────────────────────────────────────────
Never Heard/Used 59.0705 98.7
In Your Lifetime 0.777983 1.3
Frequency Missing = 9.1515207425
RECENT HALLUCINOGEN USE
Q18E Frequency Percent
────────────────────────────────────────

8/6/2019 fort worth isd - center for new lives - 1998 Texas School Survey of Drug and Alcohol Use
http://slidepdf.com/reader/full/fort-worth-isd-center-for-new-lives-1998-texas-school-survey-of-drug-and 74/136
Never Heard/Used 59.96305 95.3
In Your Lifetime 2.951191 4.7
Frequency Missing = 6.0857542212
RECENT UPPER USE
Q18F Frequency Percent
────────────────────────────────────────
Never Heard/Used 54.47243 100.0
Frequency Missing = 14.527574639
RECENT DOWNER USE
Q18G Frequency Percent
────────────────────────────────────────
Never Heard/Used 57.95213 97.0
In Your Lifetime 1.805434 3.0
Frequency Missing = 9.2424354244
The frequencies have been weighted so that the
analysis reflects the distribution of students by grade
level in the campus
Fort Worth ISD - Center for New Lives
Spring 1998

8/6/2019 fort worth isd - center for new lives - 1998 Texas School Survey of Drug and Alcohol Use
http://slidepdf.com/reader/full/fort-worth-isd-center-for-new-lives-1998-texas-school-survey-of-drug-and 75/136
Spring 1998
RECENT ROHYPNOL USE
Q18H Frequency Percent
────────────────────────────────────────
Never Heard/Used 59.86352 92.3
In Your Lifetime 4.388852 6.8
In the Past Month 0.572878 0.9
Frequency Missing = 4.1747456111
RECENT STEROID USE
Q18I Frequency Percent
────────────────────────────────────────
Never Heard/Used 58.20198 98.7
In Your Lifetime 0.777983 1.3
Frequency Missing = 10.020032428
RECENT ECSTASY USE
Q18J Frequency Percent
────────────────────────────────────────
Never Heard/Used 57.62962 100.0
Frequency Missing = 11.370379067
RECENT HEROIN USE
Q18K Frequency Percent
────────────────────────────────────────
Never Heard/Used 61.76849 96.3
In Your Lifetime 1.805434 2.8
Since School Began 0.572878 0.9

8/6/2019 fort worth isd - center for new lives - 1998 Texas School Survey of Drug and Alcohol Use
http://slidepdf.com/reader/full/fort-worth-isd-center-for-new-lives-1998-texas-school-survey-of-drug-and 76/136
Frequency Missing = 4.853198032
TOBACCO USE IN PAST MONTH
Q19A Frequency Percent──────────────────────────────────────
Never Heard/Used 58.12663 89.5
1-2 times 1.923739 3.0
3-10 times 0.622386 1.0
11+ times 4.25203 6.5
Frequency Missing = 4.0752152522
The frequencies have been weighted so that the
analysis reflects the distribution of students by grade
level in the campus
Fort Worth ISD - Center for New Lives
Spring 1998

8/6/2019 fort worth isd - center for new lives - 1998 Texas School Survey of Drug and Alcohol Use
http://slidepdf.com/reader/full/fort-worth-isd-center-for-new-lives-1998-texas-school-survey-of-drug-and 77/136
p g
ALCOHOL USE IN PAST MONTH
Q19B Frequency Percent
──────────────────────────────────────
Never Heard/Used 42.5635 70.0
1-2 times 11.34209 18.7
3-10 times 6.312591 10.411+ times 0.572878 0.9
Frequency Missing = 8.208939953
INHALANT USE IN PAST MONTH
Q19C Frequency Percent
──────────────────────────────────────
Never Heard/Used 64.92478 100.0
Frequency Missing = 4.0752152522
MARIJUANA USE IN PAST MONTH
Q19D Frequency Percent
──────────────────────────────────────
Never Heard/Used 45.61937 80.2
1-2 times 7.607771 13.4
3-10 times 2.483887 4.4
11+ times 1.145756 2.0
Frequency Missing = 12.143218159
COCAINE USE IN PAST MONTH
Q19E Frequency Percent

8/6/2019 fort worth isd - center for new lives - 1998 Texas School Survey of Drug and Alcohol Use
http://slidepdf.com/reader/full/fort-worth-isd-center-for-new-lives-1998-texas-school-survey-of-drug-and 78/136
Fort Worth ISD - Center for New Lives
Spring 1998

8/6/2019 fort worth isd - center for new lives - 1998 Texas School Survey of Drug and Alcohol Use
http://slidepdf.com/reader/full/fort-worth-isd-center-for-new-lives-1998-texas-school-survey-of-drug-and 79/136
Frequency Missing = 2.3693111931
CLOSE FRIENDS USE SMOKELESS TOBACCO
Q20B Frequency Percent
──────────────────────────────────────
Never heard/None 53.33271 83.9
A few 4.862199 7.6
Some 3.000699 4.7
Most 1.805434 2.8
All 0.572878 0.9
Frequency Missing = 5.4260762608
CLOSE FRIENDS USE BEER
Q20C Frequency Percent
──────────────────────────────────────
Never heard/None 21.38334 33.3
A few 16.90306 26.4
Some 11.2243 17.5
Most 6.667634 10.4
All 7.968473 12.4
Frequency Missing = 4.853198032
CLOSE FRIENDS USE WINE COOLERS
Q20D Frequency Percent
──────────────────────────────────────
Never heard/None 15.38246 23.9
A few 13.73403 21.3
Some 14.39281 22.4
Most 10.04125 15.6
All 10.80136 16.8

8/6/2019 fort worth isd - center for new lives - 1998 Texas School Survey of Drug and Alcohol Use
http://slidepdf.com/reader/full/fort-worth-isd-center-for-new-lives-1998-texas-school-survey-of-drug-and 80/136
Frequency Missing = 4.6480934809
CLOSE FRIENDS USE WINE
Q20E Frequency Percent
──────────────────────────────────────
Never heard/None 32.60815 48.9
A few 12.63778 19.0
Some 7.613429 11.4
Most 4.824908 7.2
All 8.946416 13.4
Frequency Missing = 2.3693111931
The frequencies have been weighted so that the
analysis reflects the distribution of students by grade
level in the campus
Fort Worth ISD - Center for New Lives
Spring 1998

8/6/2019 fort worth isd - center for new lives - 1998 Texas School Survey of Drug and Alcohol Use
http://slidepdf.com/reader/full/fort-worth-isd-center-for-new-lives-1998-texas-school-survey-of-drug-and 81/136
CLOSE FRIENDS USE LIQUOR
Q20F Frequency Percent
──────────────────────────────────────
Never heard/None 25.063 40.1
A few 15.02124 24.0
Some 6.885469 11.0Most 6.530812 10.4
All 9.045947 14.5
Frequency Missing = 6.4535278989
CLOSE FRIENDS USE INHALANTS
Q20G Frequency Percent
──────────────────────────────────────Never heard/None 53.80606 82.4
A few 3.778682 5.8
Some 5.989181 9.2
Most 1.705904 2.6
Frequency Missing = 3.7201722017
CLOSE FRIENDS USE MARIJUANA
Q20H Frequency Percent
──────────────────────────────────────
Never heard/None 23.66778 36.8
A few 8.336246 13.0
Some 9.991742 15.6
Most 9.736615 15.2
All 12.51999 19.5
Frequency Missing = 4.7476238399

8/6/2019 fort worth isd - center for new lives - 1998 Texas School Survey of Drug and Alcohol Use
http://slidepdf.com/reader/full/fort-worth-isd-center-for-new-lives-1998-texas-school-survey-of-drug-and 82/136
DIFFICULT TO GET CIGARETTES
Q21A Frequency Percent
────────────────────────────────────
Never heard of 11.59722 17.7
Impossible 11.01868 16.8
Very difficult 2.378313 3.6
Somewhat easy 8.640881 13.2Very easy 31.80034 48.6
Frequency Missing = 3.5645756458
DIFFICULT TO GET SMOKELESS TOBACCO
Q21B Frequency Percent
────────────────────────────────────
Never heard of 23.72526 38.0Impossible 15.71307 25.2
Very difficult 1.805434 2.9
Somewhat diff 1.195264 1.9
Somewhat easy 3.479705 5.6
Very easy 16.4787 26.4
Frequency Missing = 6.6025662529
The frequencies have been weighted so that the
analysis reflects the distribution of students by grade
level in the campus
Fort Worth ISD - Center for New Lives
Spring 1998

8/6/2019 fort worth isd - center for new lives - 1998 Texas School Survey of Drug and Alcohol Use
http://slidepdf.com/reader/full/fort-worth-isd-center-for-new-lives-1998-texas-school-survey-of-drug-and 83/136
DIFFICULT TO GET BEER
Q21C Frequency Percent
────────────────────────────────────
Never heard of 12.52514 19.7
Impossible 6.717142 10.6
Very difficult 3.000699 4.7Somewhat diff 1.718635 2.7
Somewhat easy 8.503159 13.4
Very easy 31.00962 48.9
Frequency Missing = 5.5256066197
DIFFICULT TO GET WINE COOLERS
Q21D Frequency Percent────────────────────────────────────
Never heard of 7.719004 12.4
Impossible 5.901867 9.5
Very difficult 4.183747 6.7
Somewhat diff 2.378313 3.8
Somewhat easy 9.85402 15.8
Very easy 32.40999 51.9
Frequency Missing = 6.5530582579
DIFFICULT TO GET WINE
Q21E Frequency Percent
────────────────────────────────────
Never heard of 15.9309 24.2
Impossible 7.862898 11.9
Very difficult 4.183747 6.4
Somewhat diff 1.145756 1.7
Somewhat easy 9.747931 14.8
Very easy 26.98147 41.0
Frequency Missing = 3.1472939729

8/6/2019 fort worth isd - center for new lives - 1998 Texas School Survey of Drug and Alcohol Use
http://slidepdf.com/reader/full/fort-worth-isd-center-for-new-lives-1998-texas-school-survey-of-drug-and 84/136
DIFFICULT TO GET LIQUOR
Q21F Frequency Percent
────────────────────────────────────Never heard of 13.09802 21.0
Impossible 8.485285 13.6
Very difficult 4.233255 6.8
Somewhat diff 1.145756 1.8
Somewhat easy 10.30859 16.5
Very easy 25.17604 40.3
Frequency Missing = 6.5530582579
The frequencies have been weighted so that the
analysis reflects the distribution of students by grade
level in the campus
Fort Worth ISD - Center for New Lives
Spring 1998

8/6/2019 fort worth isd - center for new lives - 1998 Texas School Survey of Drug and Alcohol Use
http://slidepdf.com/reader/full/fort-worth-isd-center-for-new-lives-1998-texas-school-survey-of-drug-and 85/136
DIFFICULT TO GET INHALANTS
Q21G Frequency Percent
────────────────────────────────────
Never heard of 22.27448 34.3
Impossible 11.43648 17.6
Very difficult 2.427821 3.7Somewhat diff 1.350861 2.1
Somewhat easy 8.167533 12.6
Very easy 19.26761 29.7
Frequency Missing = 4.0752152522
DIFFICULT TO GET MARIJUANA
Q21H Frequency Percent────────────────────────────────────
Never heard of 9.368842 15.3
Impossible 9.362798 15.3
Very difficult 6.779381 11.1
Somewhat diff 1.195264 2.0
Somewhat easy 4.862199 7.9
Very easy 29.62713 48.4
Frequency Missing = 7.8043889075
DIFFICULT TO GET COCAINE
Q21I Frequency Percent
────────────────────────────────────
Never heard of 16.98934 26.6
Impossible 15.62627 24.4
Very difficult 5.584116 8.7
Somewhat diff 5.334647 8.3
Somewhat easy 4.917366 7.7
Very easy 15.47723 24.2
Frequency Missing = 5.0710332103

8/6/2019 fort worth isd - center for new lives - 1998 Texas School Survey of Drug and Alcohol Use
http://slidepdf.com/reader/full/fort-worth-isd-center-for-new-lives-1998-texas-school-survey-of-drug-and 86/136
DIFFICULT TO GET CRACK
Q21J Frequency Percent
────────────────────────────────────Never heard of 15.18391 25.4
Impossible 16.77202 28.1
Very difficult 5.011238 8.4
Somewhat diff 4.712261 7.9
Somewhat easy 5.539752 9.3
Very easy 12.47653 20.9
Frequency Missing = 9.3042882702
The frequencies have been weighted so that the
analysis reflects the distribution of students by grade
level in the campus
Fort Worth ISD - Center for New Lives
Spring 1998
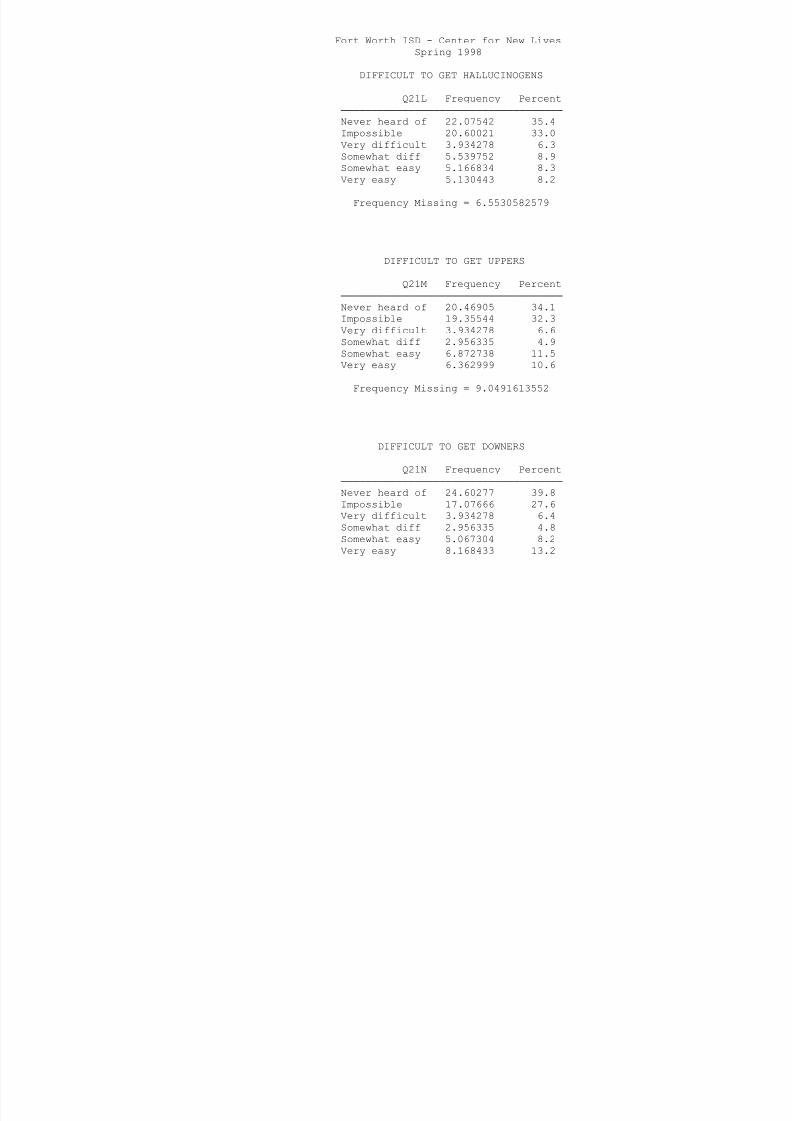
8/6/2019 fort worth isd - center for new lives - 1998 Texas School Survey of Drug and Alcohol Use
http://slidepdf.com/reader/full/fort-worth-isd-center-for-new-lives-1998-texas-school-survey-of-drug-and 87/136
DIFFICULT TO GET HALLUCINOGENS
Q21L Frequency Percent
────────────────────────────────────
Never heard of 22.07542 35.4
Impossible 20.60021 33.0
Very difficult 3.934278 6.3
Somewhat diff 5.539752 8.9
Somewhat easy 5.166834 8.3
Very easy 5.130443 8.2
Frequency Missing = 6.5530582579
DIFFICULT TO GET UPPERS
Q21M Frequency Percent────────────────────────────────────
Never heard of 20.46905 34.1
Impossible 19.35544 32.3
Very difficult 3.934278 6.6
Somewhat diff 2.956335 4.9
Somewhat easy 6.872738 11.5
Very easy 6.362999 10.6
Frequency Missing = 9.0491613552
DIFFICULT TO GET DOWNERS
Q21N Frequency Percent
────────────────────────────────────
Never heard of 24.60277 39.8
Impossible 17.07666 27.6
Very difficult 3.934278 6.4
Somewhat diff 2.956335 4.8
Somewhat easy 5.067304 8.2
Very easy 8.168433 13.2
Frequency Missing = 7.1942189422

8/6/2019 fort worth isd - center for new lives - 1998 Texas School Survey of Drug and Alcohol Use
http://slidepdf.com/reader/full/fort-worth-isd-center-for-new-lives-1998-texas-school-survey-of-drug-and 88/136
DIFFICULT TO GET ROHYPNOL
Q21O Frequency Percent
────────────────────────────────────
Never heard of 27.60347 43.0
Impossible 17.59951 27.4
Very difficult 2.128844 3.3
Somewhat diff 3.111931 4.8
Somewhat easy 4.862199 7.6
Very easy 8.946416 13.9
Frequency Missing = 4.7476238399
The frequencies have been weighted so that the
analysis reflects the distribution of students by grade
level in the campus
Fort Worth ISD - Center for New Lives
Spring 1998

8/6/2019 fort worth isd - center for new lives - 1998 Texas School Survey of Drug and Alcohol Use
http://slidepdf.com/reader/full/fort-worth-isd-center-for-new-lives-1998-texas-school-survey-of-drug-and 89/136
DIFFICULT TO GET STEROIDS
Q21P Frequency Percent
────────────────────────────────────
Never heard of 22.78512 41.0
Impossible 16.71596 30.1
Very difficult 4.862199 8.8
Somewhat diff 3.734317 6.7
Somewhat easy 2.906827 5.2
Very easy 4.557565 8.2
Frequency Missing = 13.438012971
DIFFICULT TO GET ECSTASY
Q21Q Frequency Percent────────────────────────────────────
Never heard of 28.89209 46.7
Impossible 16.29867 26.3
Very difficult 2.128844 3.4
Somewhat diff 3.684809 6.0
Somewhat easy 2.583417 4.2
Very easy 8.336246 13.5
Frequency Missing = 7.0759141228
DIFFICULT TO GET HEROIN
Q21R Frequency Percent
────────────────────────────────────
Never heard of 23.40751 37.4
Impossible 17.54345 28.0
Very difficult 4.712261 7.5
Somewhat diff 3.734317 6.0
Somewhat easy 5.067304 8.1
Very easy 8.081634 12.9
Frequency Missing = 6.4535278989

8/6/2019 fort worth isd - center for new lives - 1998 Texas School Survey of Drug and Alcohol Use
http://slidepdf.com/reader/full/fort-worth-isd-center-for-new-lives-1998-texas-school-survey-of-drug-and 90/136
AGE WHEN FIRST USED CIGARETTES
Q22A Frequency Percent
───────────────────────────────────
9 or younger 4.556664 15.4
10 years old 1.923739 6.5
11 years old 0.622386 2.1
12 years old 3.610869 12.2
13 years old 4.35156 14.7
14 years old 7.140982 24.2
15 years old 3.679151 12.5
17 years old 3.629643 12.3
Frequency Missing = 39.485005032
The frequencies have been weighted so that the
analysis reflects the distribution of students by grade
level in the campus
Fort Worth ISD - Center for New Lives
Spring 1998

8/6/2019 fort worth isd - center for new lives - 1998 Texas School Survey of Drug and Alcohol Use
http://slidepdf.com/reader/full/fort-worth-isd-center-for-new-lives-1998-texas-school-survey-of-drug-and 91/136
AGE WHEN FIRST USED
SMOKELESS TOBACCO
Q22B Frequency Percent
───────────────────────────────────
14 years old 2.483887 68.4
17 years old 1.145756 31.6
Frequency Missing = 65.370356704
AGE WHEN FIRST USED BEER
Q22C Frequency Percent
───────────────────────────────────
9 or younger 4.307196 14.7
10 years old 0.572878 2.011 years old 0.622386 2.1
12 years old 1.718635 5.9
13 years old 6.779381 23.2
14 years old 6.362999 21.8
15 years old 5.790121 19.8
16 years old 3.056765 10.5
Frequency Missing = 39.789639942
AGE WHEN FIRST USED WINE COOLERS
Q22D Frequency Percent
───────────────────────────────────
9 or younger 1.350861 3.2
10 years old 0.622386 1.5
11 years old 0.777983 1.8
12 years old 3.74139 8.8
13 years old 7.033993 16.5
14 years old 15.11035 35.4
15 years old 4.657095 10.9
16 years old 6.841105 16.0
17 years old 0.572878 1.3
18 or older 1.923739 4.5

8/6/2019 fort worth isd - center for new lives - 1998 Texas School Survey of Drug and Alcohol Use
http://slidepdf.com/reader/full/fort-worth-isd-center-for-new-lives-1998-texas-school-survey-of-drug-and 92/136
Frequency Missing = 26.368215364
AGE WHEN FIRST USED WINE
Q22E Frequency Percent
───────────────────────────────────
9 or younger 1.350861 4.5
12 years old 0.777983 2.6
13 years old 2.390529 7.9
14 years old 12.88108 42.4
15 years old 4.862199 16.0
16 years old 5.758487 19.0
17 years old 2.333948 7.7
Frequency Missing = 38.644912222
The frequencies have been weighted so that the
analysis reflects the distribution of students by grade
level in the campus
Fort Worth ISD - Center for New Lives
Spring 1998

8/6/2019 fort worth isd - center for new lives - 1998 Texas School Survey of Drug and Alcohol Use
http://slidepdf.com/reader/full/fort-worth-isd-center-for-new-lives-1998-texas-school-survey-of-drug-and 93/136
AGE WHEN FIRST USED LIQUOR
Q22F Frequency Percent
───────────────────────────────────
9 or younger 0.777983 3.7
12 years old 2.546125 12.1
13 years old 3.050207 14.5
14 years old 3.424539 16.3
15 years old 2.278782 10.9
16 years old 6.418165 30.6
17 years old 2.483887 11.8
Frequency Missing = 48.020311976
AGE WHEN FIRST USED INHALANTS
Q22G Frequency Percent
───────────────────────────────────
13 years old 2.427821 19.1
14 years old 8.572599 67.5
17 years old 1.705904 13.4
Frequency Missing = 56.293676619
AGE WHEN FIRST USED MARIJUANA
Q22H Frequency Percent
───────────────────────────────────
11 years old 1.805434 5.5
12 years old 2.427821 7.3
13 years old 7.520072 22.7
14 years old 9.874337 29.8
15 years old 3.424539 10.3
16 years old 5.540652 16.7
17 years old 2.496617 7.5
Frequency Missing = 35.910527787

8/6/2019 fort worth isd - center for new lives - 1998 Texas School Survey of Drug and Alcohol Use
http://slidepdf.com/reader/full/fort-worth-isd-center-for-new-lives-1998-texas-school-survey-of-drug-and 94/136
AGE WHEN FIRST USED COCAINE
Q22I Frequency Percent
───────────────────────────────────
13 years old 2.427821 20.1
14 years old 3.623085 30.0
15 years old 1.145756 9.5
16 years old 3.156295 26.2
17 years old 1.705904 14.1
Frequency Missing = 56.94113832
AGE WHEN FIRST USED CRACK
Q22J Frequency Percent
───────────────────────────────────
16 years old 1.805434 42.1
17 years old 0.777983 18.1
18 or older 1.705904 39.8
Frequency Missing = 64.710678743
The frequencies have been weighted so that the
analysis reflects the distribution of students by grade
level in the campus
Fort Worth ISD - Center for New Lives
Spring 1998

8/6/2019 fort worth isd - center for new lives - 1998 Texas School Survey of Drug and Alcohol Use
http://slidepdf.com/reader/full/fort-worth-isd-center-for-new-lives-1998-texas-school-survey-of-drug-and 95/136
AGE WHEN FIRST USED HALLUCINOGENS
Q22L Frequency Percent
───────────────────────────────────
13 years old 0.572878 19.4
14 years old 1.805434 61.2
16 years old 0.572878 19.4
Frequency Missing = 66.048809124
AGE WHEN FIRST USED UPPERS
Q22M Frequency Percent
───────────────────────────────────
Frequency Missing = 69
AGE WHEN FIRST USED DOWNERS
Q22N Frequency Percent
───────────────────────────────────
16 years old 1.805434 100.0
Frequency Missing = 67.194565582
AGE WHEN FIRST USED ROHYPNOL
Q22O Frequency Percent
───────────────────────────────────
13 years old 1.805434 36.4
14 years old 1.805434 36.4
15 years old 0.777983 15.7
17 years old 0.572878 11.5
Frequency Missing = 64.038270155

8/6/2019 fort worth isd - center for new lives - 1998 Texas School Survey of Drug and Alcohol Use
http://slidepdf.com/reader/full/fort-worth-isd-center-for-new-lives-1998-texas-school-survey-of-drug-and 96/136
AGE WHEN FIRST USED STEROIDS
Q22P Frequency Percent
───────────────────────────────────
15 years old 0.777983 100.0
Frequency Missing = 68.22201722
AGE WHEN FIRST USED ECSTASY
Q22Q Frequency Percent
───────────────────────────────────
16 years old 1.805434 69.917 years old 0.777983 30.1
Frequency Missing = 66.416582802
The frequencies have been weighted so that the
analysis reflects the distribution of students by grade
level in the campus
Fort Worth ISD - Center for New Lives
Spring 1998

8/6/2019 fort worth isd - center for new lives - 1998 Texas School Survey of Drug and Alcohol Use
http://slidepdf.com/reader/full/fort-worth-isd-center-for-new-lives-1998-texas-school-survey-of-drug-and 97/136
AGE WHEN FIRST USED HEROIN
Q22R Frequency Percent
───────────────────────────────────
17 years old 0.572878 100.0
Frequency Missing = 68.427121771
HOW OFTEN NORMALLY USE CIGARETTES
Q23A Frequency Percent
──────────────────────────────────────
Every day 3.106273 4.8
Several times/wk 2.278782 3.5
Several times/mo 1.195264 1.8
About once/month 1.350861 2.1About once/year 6.984485 10.7
< once/year 5.497316 8.5
Never used 44.61738 68.6
Frequency Missing = 3.96964106
HOW OFTEN NORMALLY USE
SMOKELESS TOBACCO
Q23B Frequency Percent
──────────────────────────────────────
Several times/mo 0.572878 1.1
About once/year 1.805434 3.5
< once/year 1.973247 3.8
Never used 47.76737 91.7
Frequency Missing = 16.881068993
HOW OFTEN NORMALLY USE BEER

8/6/2019 fort worth isd - center for new lives - 1998 Texas School Survey of Drug and Alcohol Use
http://slidepdf.com/reader/full/fort-worth-isd-center-for-new-lives-1998-texas-school-survey-of-drug-and 98/136
Q23C Frequency Percent
──────────────────────────────────────
Several times/wk 1.705904 3.4
Several times/mo 3.934278 7.7
About once/month 2.390529 4.7
About once/year 6.262568 12.3
< once/year 7.826121 15.4
Never used 28.71091 56.5
Frequency Missing = 18.169691379
HOW OFTEN NORMALLY USE WINE COOLERS
Q23D Frequency Percent
──────────────────────────────────────
Several times/wk 2.32829 4.4Several times/mo 3.524069 6.7
About once/month 8.714822 16.6
About once/year 9.169395 17.5
< once/year 11.39918 21.7
Never used 17.35004 33.1
Frequency Missing = 16.51419546
The frequencies have been weighted so that the
analysis reflects the distribution of students by grade
level in the campus
Fort Worth ISD - Center for New Lives
Spring 1998
O O O S

8/6/2019 fort worth isd - center for new lives - 1998 Texas School Survey of Drug and Alcohol Use
http://slidepdf.com/reader/full/fort-worth-isd-center-for-new-lives-1998-texas-school-survey-of-drug-and 99/136
HOW OFTEN NORMALLY USE WINE
Q23E Frequency Percent
──────────────────────────────────────
Several times/wk 1.705904 3.3
Several times/mo 0.572878 1.1
About once/month 9.587577 18.8
About once/year 3.946494 7.7
< once/year 4.102091 8.0
Never used 31.12047 61.0
Frequency Missing = 17.964586828
HOW OFTEN NORMALLY USE LIQUOR
Q23F Frequency Percent──────────────────────────────────────
Several times/mo 1.350861 2.6
About once/month 4.202522 8.2
About once/year 9.43108 18.4
< once/year 1.145756 2.2
Never used 35.10515 68.5
Frequency Missing = 17.764625964
HOW OFTEN NORMALLY USE INHALANTS
Q23G Frequency Percent
──────────────────────────────────────
About once/year 3.610869 6.0
< once/year 4.806133 8.0
Never used 51.34095 85.9
Frequency Missing = 9.2420496478
HOW OFTEN NORMALLY USE MARIJUANA

8/6/2019 fort worth isd - center for new lives - 1998 Texas School Survey of Drug and Alcohol Use
http://slidepdf.com/reader/full/fort-worth-isd-center-for-new-lives-1998-texas-school-survey-of-drug-and 100/136
Q23H Frequency Percent
──────────────────────────────────────
Several times/mo 4.25203 7.8
About once/month 2.496617 4.6
About once/year 7.862898 14.4
< once/year 10.9819 20.2
Never used 28.88502 53.0
Frequency Missing = 14.521530806
HOW OFTEN NORMALLY USE COCAINE
Q23I Frequency Percent
──────────────────────────────────────
Several times/mo 0.572878 1.0About once/month 0.572878 1.0
About once/year 4.388852 7.9
< once/year 4.145941 7.5
Never used 45.62541 82.5
Frequency Missing = 13.694040031
The frequencies have been weighted so that the
analysis reflects the distribution of students by grade
level in the campus
Fort Worth ISD - Center for New Lives
Spring 1998
HOW OFTEN NORMALLY USE CRACK

8/6/2019 fort worth isd - center for new lives - 1998 Texas School Survey of Drug and Alcohol Use
http://slidepdf.com/reader/full/fort-worth-isd-center-for-new-lives-1998-texas-school-survey-of-drug-and 101/136
HOW OFTEN NORMALLY USE CRACK
Q23J Frequency Percent
──────────────────────────────────────
About once/year 2.583417 4.8
< once/year 1.705904 3.2
Never used 49.8341 92.1
Frequency Missing = 14.876573857
HOW OFTEN NORMALLY USE HALLUCINOGENS
Q23L Frequency Percent
──────────────────────────────────────
< once/year 2.951191 5.1
Never used 54.85139 94.9
Frequency Missing = 11.197422565
HOW OFTEN NORMALLY USE UPPERS
Q23M Frequency Percent
──────────────────────────────────────
Never used 51.90071 100.0
Frequency Missing = 17.099289947
HOW OFTEN NORMALLY USE DOWNERS
Q23N Frequency Percent
──────────────────────────────────────
Never used 54.63407 100.0

8/6/2019 fort worth isd - center for new lives - 1998 Texas School Survey of Drug and Alcohol Use
http://slidepdf.com/reader/full/fort-worth-isd-center-for-new-lives-1998-texas-school-survey-of-drug-and 102/136
Fort Worth ISD - Center for New Lives
Spring 1998
HOW OFTEN NORMALLY USE ECSTASY

8/6/2019 fort worth isd - center for new lives - 1998 Texas School Survey of Drug and Alcohol Use
http://slidepdf.com/reader/full/fort-worth-isd-center-for-new-lives-1998-texas-school-survey-of-drug-and 103/136
HOW OFTEN NORMALLY USE ECSTASY
Q23Q Frequency Percent
──────────────────────────────────────
About once/year 1.805434 3.2
< once/year 0.777983 1.4
Never used 54.26719 95.5
Frequency Missing = 12.149390585
HOW OFTEN NORMALLY USE HEROIN
Q23R Frequency Percent
──────────────────────────────────────
About once/month 0.572878 1.0
Never used 58.14489 99.0
Frequency Missing = 10.282231913
HOW MANY CIGARETTES IN PAST 30 DAYS
Q24 Frequency Percent
──────────────────────────────────────
None 58.81781 90.7
Less than 1 2.32829 3.6> 1 and < 10 3.056765 4.7
> 10 and < 1pk 0.622386 1.0
Frequency Missing = 4.1747456111
AMOUNT OF BEER AT ONE TIME
Q25A Frequency Percent
──────────────────────────────────────
Never drink this 40.37756 64.1
12+ drinks 0.777983 1.2
5-8 drinks 1 350861 2 1

8/6/2019 fort worth isd - center for new lives - 1998 Texas School Survey of Drug and Alcohol Use
http://slidepdf.com/reader/full/fort-worth-isd-center-for-new-lives-1998-texas-school-survey-of-drug-and 104/136
5 8 drinks 1.350861 2.1
3-4 drinks 4.183747 6.6
2 drinks 4.706603 7.5
1 drink 4.25203 6.7
< 1 drink 7.371033 11.7
Frequency Missing = 5.9801800291
AMOUNT OF WINE COOLERS AT ONE TIME
Q25B Frequency Percent
──────────────────────────────────────
Never drink this 15.33243 26.0
12+ drinks 6.462015 11.0
9-11 drinks 4.189791 7.1
5-8 drinks 1.718635 2.93-4 drinks 8.435777 14.3
2 drinks 7.295678 12.4
1 drink 8.877491 15.1
< 1 drink 6.623784 11.2
Frequency Missing = 10.064396735
The frequencies have been weighted so that the
analysis reflects the distribution of students by grade
level in the campus
Fort Worth ISD - Center for New Lives
Spring 1998
AMOUNT OF WINE AT ONE TIME

8/6/2019 fort worth isd - center for new lives - 1998 Texas School Survey of Drug and Alcohol Use
http://slidepdf.com/reader/full/fort-worth-isd-center-for-new-lives-1998-texas-school-survey-of-drug-and 105/136
AMOUNT OF WINE AT ONE TIME
Q25C Frequency Percent
──────────────────────────────────────
Never drink this 34.12117 55.7
12+ drinks 3.511338 5.7
9-11 drinks 1.705904 2.8
5-8 drinks 0.572878 0.9
3-4 drinks 1.923739 3.1
2 drinks 3.679151 6.0
1 drink 8.030711 13.1
< 1 drink 7.669496 12.5
Frequency Missing = 7.7856144471
AMOUNT OF LIQUOR AT ONE TIME
Q25D Frequency Percent
──────────────────────────────────────
Never drink this 37.28351 62.8
12+ drinks 1.705904 2.9
5-8 drinks 1.350861 2.3
3-4 drinks 4.202522 7.1
2 drinks 5.334647 9.0
1 drink 2.595633 4.4
< 1 drink 6.935877 11.7
Frequency Missing = 9.591048865
BEERS, FIVE OR MORE AT ONE TIME
Q26A Frequency Percent
──────────────────────────────────────
Never drink this 43.70167 66.6
Never 5+ at time 13.12965 20.0
Several times/mo 3.729174 5.7
About once/month 0.777983 1.2
< once/month 0.572878 0.9
< once/year 3.691882 5.6
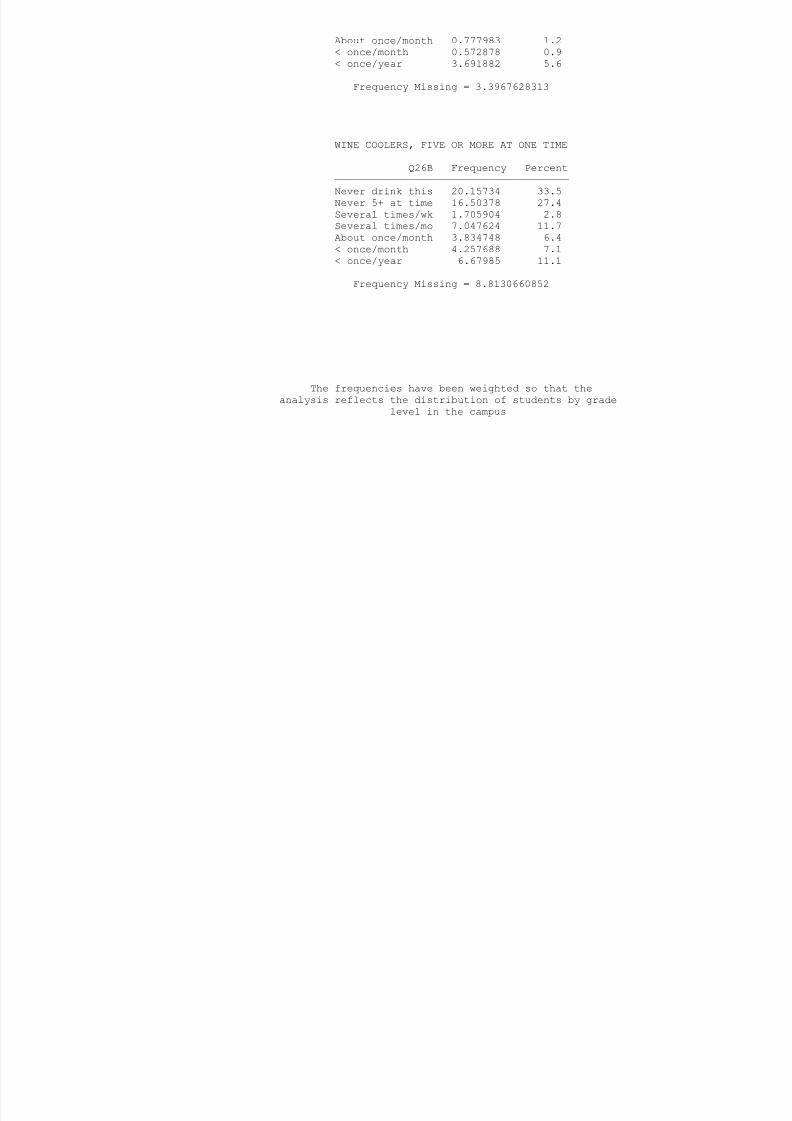
8/6/2019 fort worth isd - center for new lives - 1998 Texas School Survey of Drug and Alcohol Use
http://slidepdf.com/reader/full/fort-worth-isd-center-for-new-lives-1998-texas-school-survey-of-drug-and 106/136
Frequency Missing = 3.3967628313
WINE COOLERS, FIVE OR MORE AT ONE TIME
Q26B Frequency Percent
──────────────────────────────────────
Never drink this 20.15734 33.5
Never 5+ at time 16.50378 27.4
Several times/wk 1.705904 2.8
Several times/mo 7.047624 11.7
About once/month 3.834748 6.4
< once/month 4.257688 7.1
< once/year 6.67985 11.1
Frequency Missing = 8.8130660852
The frequencies have been weighted so that the
analysis reflects the distribution of students by grade
level in the campus
Fort Worth ISD - Center for New Lives
Spring 1998
WINE, FIVE OR MORE AT ONE TIME

8/6/2019 fort worth isd - center for new lives - 1998 Texas School Survey of Drug and Alcohol Use
http://slidepdf.com/reader/full/fort-worth-isd-center-for-new-lives-1998-texas-school-survey-of-drug-and 107/136
, O O O
Q26C Frequency Percent
──────────────────────────────────────
Never drink this 34.89915 55.2
Never 5+ at time 12.35732 19.5
Several times/wk 1.705904 2.7
Several times/mo 2.851661 4.5About once/month 2.546125 4.0
< once/month 3.629643 5.7
< once/year 5.235117 8.3
Frequency Missing = 5.775075478
LIQUOR, FIVE OR MORE AT ONE TIME
Q26D Frequency Percent
──────────────────────────────────────
Never drink this 41.21778 65.2
Never 5+ at time 6.717142 10.6
Every day 1.705904 2.7
Several times/mo 1.145756 1.8
About once/month 1.350861 2.1
< once/month 6.785939 10.7
< once/year 4.301538 6.8
Frequency Missing = 5.775075478
GET ALCOHOLIC BEVERAGES FROM HOME
Q27A Frequency Percent
──────────────────────────────────────
Do not Drink 26.91229 41.4
Never 24.83951 38.2
Seldom 7.662937 11.8
Most of the Time 3.119004 4.8
Always 2.496617 3.8
Frequency Missing = 3.96964106

8/6/2019 fort worth isd - center for new lives - 1998 Texas School Survey of Drug and Alcohol Use
http://slidepdf.com/reader/full/fort-worth-isd-center-for-new-lives-1998-texas-school-survey-of-drug-and 108/136
GET ALCOHOLIC BEVERAGES FROM FRIENDS
Q27B Frequency Percent
──────────────────────────────────────Do not Drink 18.62041 30.3
Never 5.608549 9.1
Seldom 11.66601 19.0
Most of the Time 15.83741 25.7
Always 9.786638 15.9
Frequency Missing = 7.4809795371
The frequencies have been weighted so that the
analysis reflects the distribution of students by grade
level in the campus
Fort Worth ISD - Center for New Lives
Spring 1998
GET ALCOHOLIC BEVERAGES FROM A STORE

8/6/2019 fort worth isd - center for new lives - 1998 Texas School Survey of Drug and Alcohol Use
http://slidepdf.com/reader/full/fort-worth-isd-center-for-new-lives-1998-texas-school-survey-of-drug-and 109/136
Q27C Frequency Percent
──────────────────────────────────────
Do not Drink 21.47207 34.3
Never 18.59482 29.7
Seldom 6.479889 10.3
Most of the Time 11.14354 17.8Always 4.96173 7.9
Frequency Missing = 6.3479537068
GET ALCOHOLIC BEVERAGES AT PARTIES
Q27D Frequency Percent
──────────────────────────────────────
Do not Drink 19.54833 31.6
Never 3.267528 5.3
Seldom 9.282042 15.0
Most of the Time 13.25361 21.4
Always 16.52255 26.7
Frequency Missing = 7.1259364866
GET ALCOHOLIC BEVERAGES FROM OTHER
Q27E Frequency Percent
──────────────────────────────────────
Do not Drink 28.81211 45.6
Never 11.19871 17.7
Seldom 4.102091 6.5
Most of the Time 3.479705 5.5
Always 15.63231 24.7
Frequency Missing = 5.775075478
DANGEROUS FOR KIDS

8/6/2019 fort worth isd - center for new lives - 1998 Texas School Survey of Drug and Alcohol Use
http://slidepdf.com/reader/full/fort-worth-isd-center-for-new-lives-1998-texas-school-survey-of-drug-and 110/136
TO USE TOBACCO
Q28A Frequency Percent
────────────────────────────────
Very 37.48154 61.7
Somewhat 14.96054 24.6
Not very 1.350861 2.2Not at all 0.572878 0.9
Don't know 6.412507 10.6
Frequency Missing = 8.2216705803
The frequencies have been weighted so that the
analysis reflects the distribution of students by grade
level in the campus
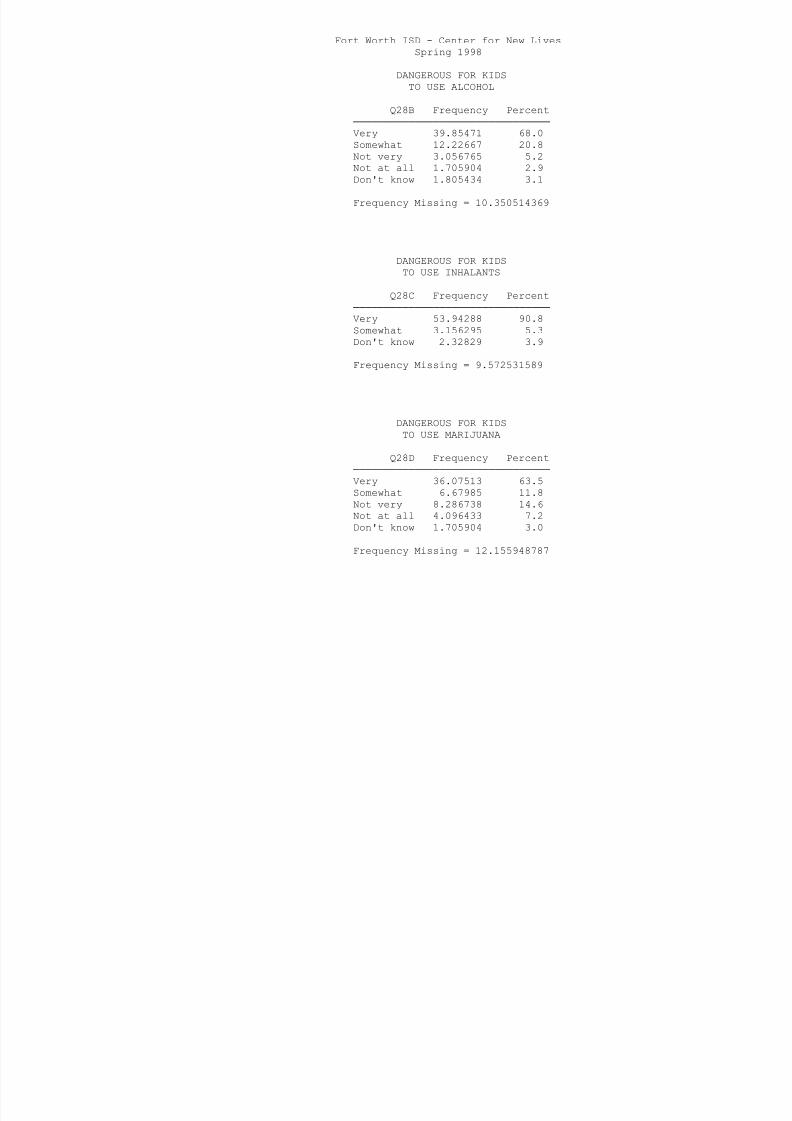
8/6/2019 fort worth isd - center for new lives - 1998 Texas School Survey of Drug and Alcohol Use
http://slidepdf.com/reader/full/fort-worth-isd-center-for-new-lives-1998-texas-school-survey-of-drug-and 111/136

8/6/2019 fort worth isd - center for new lives - 1998 Texas School Survey of Drug and Alcohol Use
http://slidepdf.com/reader/full/fort-worth-isd-center-for-new-lives-1998-texas-school-survey-of-drug-and 112/136
DANGEROUS FOR KIDS
TO USE COCAINE
Q28E Frequency Percent
────────────────────────────────
Very 55.43661 92.2
Somewhat 2.390529 4.0Don't know 2.278782 3.8
Frequency Missing = 8.8940791681
DANGEROUS FOR KIDS TO USE CRACK
Q28F Frequency Percent
────────────────────────────────
Very 52.13745 96.8
Don't know 1.705904 3.2
Frequency Missing = 15.156647657
The frequencies have been weighted so that the
analysis reflects the distribution of students by grade
level in the campus
Fort Worth ISD - Center for New Lives
Spring 1998
DANGEROUS FOR KIDS

8/6/2019 fort worth isd - center for new lives - 1998 Texas School Survey of Drug and Alcohol Use
http://slidepdf.com/reader/full/fort-worth-isd-center-for-new-lives-1998-texas-school-survey-of-drug-and 113/136
TO USE ECSTASY
Q28G Frequency Percent
────────────────────────────────
Very 49.23628 89.5
Somewhat 1.145756 2.1
Not very 0.622386 1.1Don't know 4.034194 7.3
Frequency Missing = 13.961383205
DANGEROUS FOR KIDS
TO USE STEROIDS
Q28H Frequency Percent
────────────────────────────────
Very 50.31375 88.1
Somewhat 1.973247 3.5
Don't know 4.812177 8.4
Frequency Missing = 11.900821872
DANGEROUS FOR KIDS TO USE HEROIN
Q28I Frequency Percent
────────────────────────────────
Very 54.8699 92.3
Somewhat 1.145756 1.9
Don't know 3.411808 5.7
Frequency Missing = 9.572531589
USE MARIJUANA AS JOINTS
Q29A Frequency Percent
──────────────────────────────────────
27 01696 57 7

8/6/2019 fort worth isd - center for new lives - 1998 Texas School Survey of Drug and Alcohol Use
http://slidepdf.com/reader/full/fort-worth-isd-center-for-new-lives-1998-texas-school-survey-of-drug-and 114/136
Never 27.01696 57.7
Seldom 7.408325 15.8
Half the time 1.768143 3.8
Most of the time 3.629643 7.7
Always 7.034893 15.0
Frequency Missing = 22.142032875
USE MARIJUANA AS BLUNTS
Q29B Frequency Percent
──────────────────────────────────────
Never 32.39597 70.3
Seldom 5.179951 11.2
Most of the time 6.007442 13.0
Always 2.496617 5.4
Frequency Missing = 22.920015655
The frequencies have been weighted so that the
analysis reflects the distribution of students by grade
level in the campus
Fort Worth ISD - Center for New Lives
Spring 1998
USE MARIJUANA IN BONGS OR WATER PIPES

8/6/2019 fort worth isd - center for new lives - 1998 Texas School Survey of Drug and Alcohol Use
http://slidepdf.com/reader/full/fort-worth-isd-center-for-new-lives-1998-texas-school-survey-of-drug-and 115/136
Q29C Frequency Percent
──────────────────────────────────────
Never 41.77845 90.7
Seldom 1.973247 4.3
Half the time 1.705904 3.7
Don't know 0.622386 1.4
Frequency Missing = 22.920015655
USE MARIJUANA IN PIPES
Q29D Frequency Percent
──────────────────────────────────────
Never 39.97301 86.7
Seldom 4.401068 9.6
Half the time 1.705904 3.7
Frequency Missing = 22.920015655
USE MARIJUANA OTHER WAYS
Q29E Frequency Percent
──────────────────────────────────────Never 40.02252 86.9
Seldom 2.483887 5.4
Always 0.572878 1.2
Don't know 3.000699 6.5
Frequency Missing = 22.920015655
DAYS SKIPPED SINCE SEPTEMBER
Q30A Frequency Percent
──────────────────────────────
None 43.63287 70.5
1 3 d 11 49254 18 6

8/6/2019 fort worth isd - center for new lives - 1998 Texas School Survey of Drug and Alcohol Use
http://slidepdf.com/reader/full/fort-worth-isd-center-for-new-lives-1998-texas-school-survey-of-drug-and 116/136
1-3 days 11.49254 18.6
4-9 days 0.572878 0.9
10+ days 6.21306 10.0
Frequency Missing = 7.0886447501
DAYS ILL SINCE SEPTEMBER
Q30B Frequency Percent
──────────────────────────────
None 17.07049 28.4
1-3 days 25.52979 42.5
4-9 days 13.15408 21.9
10+ days 4.35156 7.2
Frequency Missing = 8.8940791681
The frequencies have been weighted so that the
analysis reflects the distribution of students by grade
level in the campus
Fort Worth ISD - Center for New Lives
Spring 1998
OTHER DAYS MISSED
SINCE SEPTEMBER

8/6/2019 fort worth isd - center for new lives - 1998 Texas School Survey of Drug and Alcohol Use
http://slidepdf.com/reader/full/fort-worth-isd-center-for-new-lives-1998-texas-school-survey-of-drug-and 117/136
SINCE SEPTEMBER
Q30C Frequency Percent
──────────────────────────────
None 6.063122 10.7
1-3 days 38.1119 67.3
4-9 days 9.836146 17.410+ days 2.583417 4.6
Frequency Missing = 12.405417645
SENT TO PRINCIPAL/DEAN
SINCE SEPTEMBER
Q30D Frequency Percent
──────────────────────────────
None 45.93095 78.8
1-3 days 6.884955 11.8
4-9 days 3.679151 6.3
10+ days 1.805434 3.1
Frequency Missing = 10.699513586
SOMEONE CALLED HOMESINCE SEPTEMBER
Q30E Frequency Percent
──────────────────────────────
None 47.83591 79.6
1-3 days 7.052768 11.7
4-9 days 3.411808 5.7
10+ days 1.805434 3.0
Frequency Missing = 8.8940791681
IN TROUBLE FOR DRINKING
SINCE SEPTEMBER

8/6/2019 fort worth isd - center for new lives - 1998 Texas School Survey of Drug and Alcohol Use
http://slidepdf.com/reader/full/fort-worth-isd-center-for-new-lives-1998-texas-school-survey-of-drug-and 118/136
SINCE SEPTEMBER
Q30F Frequency Percent
──────────────────────────────
None 58.30049 100.0
Frequency Missing = 10.699513586
IN TROUBLE FOR DRUG
USE SINCE SEPTEMBER
Q30G Frequency Percent
──────────────────────────────
None 56.0217 99.0
1-3 days 0.572878 1.0
Frequency Missing = 12.405417645
The frequencies have been weighted so that the
analysis reflects the distribution of students by grade
level in the campus
Fort Worth ISD - Center for New Lives
Spring 1998
DAYS SKIPPED IN PAST MONTH

8/6/2019 fort worth isd - center for new lives - 1998 Texas School Survey of Drug and Alcohol Use
http://slidepdf.com/reader/full/fort-worth-isd-center-for-new-lives-1998-texas-school-survey-of-drug-and 119/136
Q31A Frequency Percent
──────────────────────────────
None 54.29793 90.2
1-3 days 5.334647 8.9
4-9 days 0.572878 1.0
Frequency Missing = 8.7945488091
DAYS ILL IN PAST MONTH
Q31B Frequency Percent
──────────────────────────────
None 31.45712 52.2
1-3 days 23.46885 39.0
4-9 days 4.133725 6.9
10+ days 1.145756 1.9
Frequency Missing = 8.7945488091
OTHER DAYS MISSED
IN PAST MONTH
Q31C Frequency Percent──────────────────────────────
None 23.13361 39.9
1-3 days 30.65934 52.9
4-9 days 4.133725 7.1
Frequency Missing = 11.073331097
SENT TO PRINCIPAL/DEAN

8/6/2019 fort worth isd - center for new lives - 1998 Texas School Survey of Drug and Alcohol Use
http://slidepdf.com/reader/full/fort-worth-isd-center-for-new-lives-1998-texas-school-survey-of-drug-and 120/136
Fort Worth ISD - Center for New Lives
Spring 1998
TROUBLE WITH FRIENDS
BECAUSE OF DRINKING
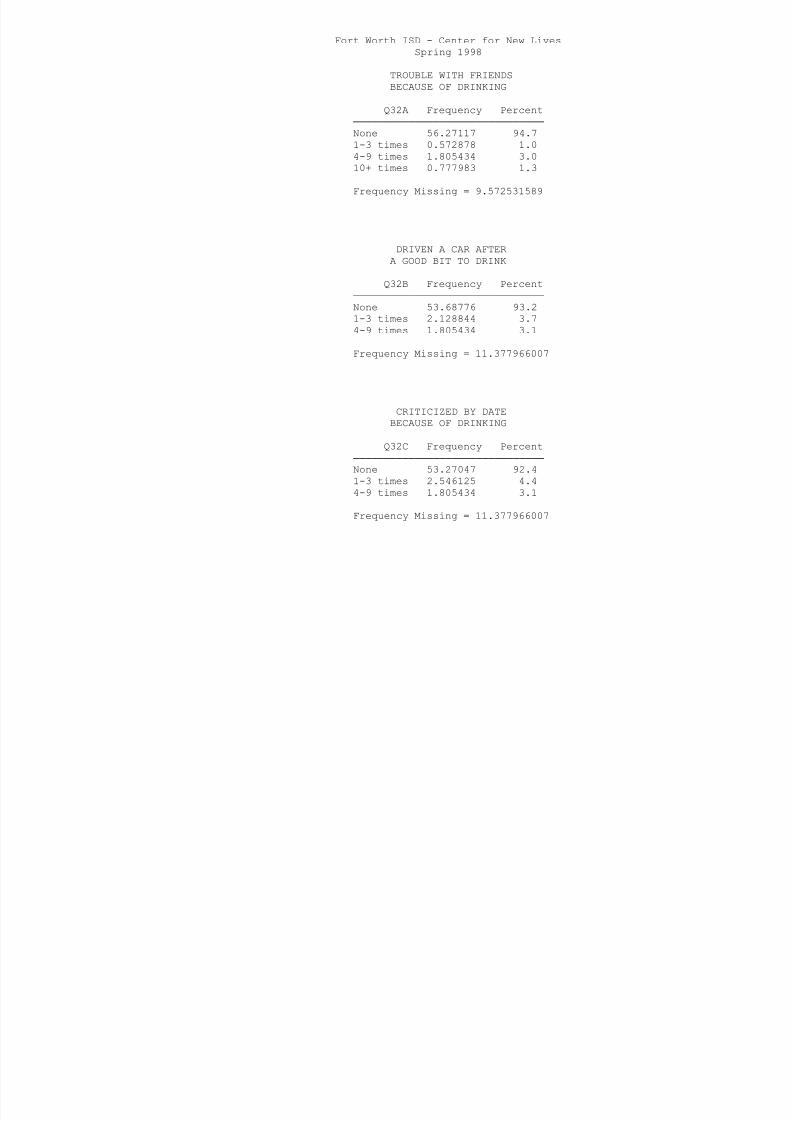
8/6/2019 fort worth isd - center for new lives - 1998 Texas School Survey of Drug and Alcohol Use
http://slidepdf.com/reader/full/fort-worth-isd-center-for-new-lives-1998-texas-school-survey-of-drug-and 121/136
BECAUSE OF DRINKING
Q32A Frequency Percent
───────────────────────────────
None 56.27117 94.7
1-3 times 0.572878 1.0
4-9 times 1.805434 3.010+ times 0.777983 1.3
Frequency Missing = 9.572531589
DRIVEN A CAR AFTER
A GOOD BIT TO DRINK
Q32B Frequency Percent
───────────────────────────────
None 53.68776 93.2
1-3 times 2.128844 3.7
4-9 times 1.805434 3.1
Frequency Missing = 11.377966007
CRITICIZED BY DATE
BECAUSE OF DRINKING
Q32C Frequency Percent
───────────────────────────────
None 53.27047 92.4
1-3 times 2.546125 4.4
4-9 times 1.805434 3.1
Frequency Missing = 11.377966007

8/6/2019 fort worth isd - center for new lives - 1998 Texas School Survey of Drug and Alcohol Use
http://slidepdf.com/reader/full/fort-worth-isd-center-for-new-lives-1998-texas-school-survey-of-drug-and 122/136
Fort Worth ISD - Center for New Lives
Spring 1998
DRIVEN A CAR WHILE
HIGH FROM DRUGS

8/6/2019 fort worth isd - center for new lives - 1998 Texas School Survey of Drug and Alcohol Use
http://slidepdf.com/reader/full/fort-worth-isd-center-for-new-lives-1998-texas-school-survey-of-drug-and 123/136
Q32F Frequency Percent
───────────────────────────────
None 53.78729 91.7
1-3 times 1.705904 2.9
4-9 times 1.805434 3.110+ times 1.350861 2.3
Frequency Missing = 10.350514369
CRITICIZED BY DATE
BECAUSE OF DRUG USE
Q32G Frequency Percent
───────────────────────────────
None 54.04846 94.7
1-3 times 2.427821 4.3
4-9 times 0.572878 1.0
Frequency Missing = 11.950844236
TROUBLE WITH POLICE
BECAUSE OF DRUG USE
Q32H Frequency Percent
───────────────────────────────
None 58.70555 99.0
1-3 times 0.622386 1.0
Frequency Missing = 9.6720619479
CLASS DAYS DRUNK ON
ALCOHOL SINCE SEPT
Q33A Frequency Percent
──────────────────────────────

8/6/2019 fort worth isd - center for new lives - 1998 Texas School Survey of Drug and Alcohol Use
http://slidepdf.com/reader/full/fort-worth-isd-center-for-new-lives-1998-texas-school-survey-of-drug-and 124/136
None 56.22166 91.1
1-3 days 4.706603 7.6
4-9 days 0.777983 1.3
Frequency Missing = 7.2937493011
CLASS DAYS HIGH ON MARIJUANA
SINCE SEPT
Q33B Frequency Percent
──────────────────────────────
None 50.68101 87.7
1-3 days 5.740098 9.9
4-9 days 0.777983 1.3
10+ days 0.572878 1.0
Frequency Missing = 11.228027508
The frequencies have been weighted so that the
analysis reflects the distribution of students by grade
level in the campus
Fort Worth ISD - Center for New Lives
Spring 1998
CLASS DAYS HIGH ON INHALANTS
SINCE SEPT

8/6/2019 fort worth isd - center for new lives - 1998 Texas School Survey of Drug and Alcohol Use
http://slidepdf.com/reader/full/fort-worth-isd-center-for-new-lives-1998-texas-school-survey-of-drug-and 125/136
Q33C Frequency Percent
──────────────────────────────
None 54.41623 98.9
1-3 days 0.622386 1.1
Frequency Missing = 13.961383205
CLASS DAYS HIGH
ON OTHER DRUG(S)
Q33D Frequency Percent
──────────────────────────────
None 56.27117 99.0
4-9 days 0.572878 1.0
Frequency Missing = 12.155948787
ALCOHOL USE AT PARTIES
THIS SCHOOL YEAR
Q34A Frequency Percent
──────────────────────────────────────Never 29.69554 47.5
Seldom 4.568881 7.3
Half the time 2.75123 4.4
Most of the time 6.872738 11.0
Always 7.253243 11.6
Don't know 0.572878 0.9
Didn't attend 10.76972 17.2
Frequency Missing = 6.5157665213
DRUG USE AT PARTIES THIS SCHOOL YEAR
Q34B Frequency Percent

8/6/2019 fort worth isd - center for new lives - 1998 Texas School Survey of Drug and Alcohol Use
http://slidepdf.com/reader/full/fort-worth-isd-center-for-new-lives-1998-texas-school-survey-of-drug-and 126/136
──────────────────────────────────────
Never 30.26752 48.4
Seldom 2.341021 3.7
Half the time 2.178352 3.5
Most of the time 8.995924 14.4
Always 6.785939 10.9Don't know 1.145756 1.8
Didn't attend 10.76972 17.2
Frequency Missing = 6.5157665213
SOUGHT HELP FOR DRUG/ALCOHOL
PROBLEM
Q35 Frequency Percent
────────────────────────────────
No 47.89198 82.4
Yes 10.2407 17.6
Frequency Missing = 10.867326401
The frequencies have been weighted so that the
analysis reflects the distribution of students by grade
level in the campus
Fort Worth ISD - Center for New Lives
Spring 1998
WOULD SEEK HELP FROM
SCHOOL COUNSELOR

8/6/2019 fort worth isd - center for new lives - 1998 Texas School Survey of Drug and Alcohol Use
http://slidepdf.com/reader/full/fort-worth-isd-center-for-new-lives-1998-texas-school-survey-of-drug-and 127/136
Q36A Frequency Percent
────────────────────────────────
No 31.83711 53.0
Yes 28.26881 47.0
Frequency Missing = 8.8940791681
WOULD SEEK HELP OUTSIDE
OF SCHOOL
Q36B Frequency Percent
────────────────────────────────
No 38.14919 63.5
Yes 21.95673 36.5
Frequency Missing = 8.8940791681
WOULD SEEK HELP FROM
OTHER COUNSELOR
Q36C Frequency Percent
────────────────────────────────No 31.56321 53.8
Yes 27.08627 46.2
Frequency Missing = 10.350514369
WOULD SEEK HELP FROM PARENTS
Q36D Frequency Percent

8/6/2019 fort worth isd - center for new lives - 1998 Texas School Survey of Drug and Alcohol Use
http://slidepdf.com/reader/full/fort-worth-isd-center-for-new-lives-1998-texas-school-survey-of-drug-and 128/136
Fort Worth ISD - Center for New Lives
Spring 1998
Frequency Missing = 15.817225763

8/6/2019 fort worth isd - center for new lives - 1998 Texas School Survey of Drug and Alcohol Use
http://slidepdf.com/reader/full/fort-worth-isd-center-for-new-lives-1998-texas-school-survey-of-drug-and 129/136
WOULD SEEK HELP FROM
ANOTHER ADULT
Q36G Frequency Percent
────────────────────────────────
No 21.31647 36.5
Yes 37.08355 63.5
Frequency Missing = 10.599983227
WOULD NOT SEEK HELP
Q36H Frequency Percent
────────────────────────────────
No 40.07807 72.5
Yes 15.22172 27.5
Frequency Missing = 13.700212457
DRUG/ALCOHOL INFO--HEALTH CLASS
Q37A Frequency Percent
────────────────────────────────
No 27.0801 48.4
Yes 28.83603 51.6
Frequency Missing = 13.083870066
DRUG/ALCOHOL INFO--ASSEMBLY
PROGRAM
Q37B Frequency Percent
────────────────────────────────
N 33 28802 60 8

8/6/2019 fort worth isd - center for new lives - 1998 Texas School Survey of Drug and Alcohol Use
http://slidepdf.com/reader/full/fort-worth-isd-center-for-new-lives-1998-texas-school-survey-of-drug-and 130/136
No 33.28802 60.8
Yes 21.43285 39.2
Frequency Missing = 14.279134519
DRUG/ALCOHOL INFO--GUIDANCE
COUNSELOR
Q37C Frequency Percent
────────────────────────────────
No 33.33611 60.2
Yes 22.00714 39.8
Frequency Missing = 13.656748295
The frequencies have been weighted so that the
analysis reflects the distribution of students by grade
level in the campus
Fort Worth ISD - Center for New Lives
Spring 1998
DRUG/ALCOHOL INFO--SCIENCE CLASS
Q37D F P t

8/6/2019 fort worth isd - center for new lives - 1998 Texas School Survey of Drug and Alcohol Use
http://slidepdf.com/reader/full/fort-worth-isd-center-for-new-lives-1998-texas-school-survey-of-drug-and 131/136
Q37D Frequency Percent
────────────────────────────────
No 43.90163 81.0
Yes 10.30859 19.0
Frequency Missing = 14.789774125
DRUG/ALCOHOL INFO--SOCIAL
STUDIES CLASS
Q37E Frequency Percent
────────────────────────────────
No 44.79136 82.6
Yes 9.418864 17.4
Frequency Missing = 14.789774125
DRUG/ALCOHOL INFO--DRUG
RAP SESSION
Q37F Frequency Percent
────────────────────────────────
No 44.06945 82.2
Yes 9.567902 17.8
Frequency Missing = 15.362652354
DRUG/ALCOHOL INFO--INVITED
SCHOOL GUEST
Q37G Frequency Percent
────────────────────────────────
No 30.29298 54.7
Yes 25.05027 45.3
Frequency Missing = 13.656748295

8/6/2019 fort worth isd - center for new lives - 1998 Texas School Survey of Drug and Alcohol Use
http://slidepdf.com/reader/full/fort-worth-isd-center-for-new-lives-1998-texas-school-survey-of-drug-and 132/136
DRUG/ALCOHOL INFO--OTHER
SCHOOL SOURCE
Q37H Frequency Percent
────────────────────────────────
No 35.65874 64.4
Yes 19.68451 35.6
Frequency Missing = 13.656748295
The frequencies have been weighted so that the
analysis reflects the distribution of students by grade
level in the campus
Fort Worth ISD - Center for New Lives
Spring 1998
PARENTS FEEL ABOUT KIDS SMOKING CIGARET
Q38A Frequency Percent

8/6/2019 fort worth isd - center for new lives - 1998 Texas School Survey of Drug and Alcohol Use
http://slidepdf.com/reader/full/fort-worth-isd-center-for-new-lives-1998-texas-school-survey-of-drug-and 133/136
Q38A Frequency Percent
───────────────────────────────────────
Strong disapprove 39.35011 65.7
Mild disapprove 3.536285 5.9
Neither 2.906827 4.9
Mildly approve 1.805434 3.0Strongly approve 1.705904 2.8
Don't know 10.59625 17.7
Frequency Missing = 9.0991837191
PARENTS FEEL ABOUT KIDS DRINKING BEER
Q38B Frequency Percent
───────────────────────────────────────Strong disapprove 39.46842 65.0
Mild disapprove 4.768842 7.9
Neither 5.640182 9.3
Strongly approve 1.705904 2.8
Don't know 9.095455 15.0
Frequency Missing = 8.3212009393
PARENTS FEEL ABOUT KIDS USING MARIJUANA
Q38C Frequency Percent
───────────────────────────────────────
Strong disapprove 42.30645 70.4
Mild disapprove 3.424539 5.7
Neither 1.923739 3.2
Mildly approve 0.622386 1.0
Strongly approve 1.705904 2.8
Don't know 10.12291 16.8
Frequency Missing = 8.8940791681
PURCHASED LOTTERY TICKET

8/6/2019 fort worth isd - center for new lives - 1998 Texas School Survey of Drug and Alcohol Use
http://slidepdf.com/reader/full/fort-worth-isd-center-for-new-lives-1998-texas-school-survey-of-drug-and 134/136
PURCHASED LOTTERY TICKET
IN PAST YEAR
Q39 Frequency Percent
────────────────────────────────
No 38.59772 63.6Yes 22.08108 36.4
Frequency Missing = 8.3212009393
NON-LOTTERY GAMBLING
IN PAST YEAR
Q40 Frequency Percent
────────────────────────────────No 49.08068 81.9
Yes 10.82013 18.1
Frequency Missing = 9.0991837191
The frequencies have been weighted so that the
analysis reflects the distribution of students by grade
level in the campus
Fort Worth ISD - Center for New Lives
Spring 1998
MONEY SPENT ON GAMBLING
IN PAST YEAR

8/6/2019 fort worth isd - center for new lives - 1998 Texas School Survey of Drug and Alcohol Use
http://slidepdf.com/reader/full/fort-worth-isd-center-for-new-lives-1998-texas-school-survey-of-drug-and 135/136
Q41 Frequency Percent
────────────────────────────────
$0 44.25012 72.9
$1 - $10 7.363961 12.1
$11 - $50 9.064721 14.9
Frequency Missing = 8.3212009393

8/6/2019 fort worth isd - center for new lives - 1998 Texas School Survey of Drug and Alcohol Use
http://slidepdf.com/reader/full/fort-worth-isd-center-for-new-lives-1998-texas-school-survey-of-drug-and 136/136
The frequencies have been weighted so that the
analysis reflects the distribution of students by grade
level in the campus