FORT LEWIS DINING FACILITIES CONSUMER … of this document is unlimited. Technical Report TR 72-44...
238
\ l FORT LEWIS DINING FACILITIES CONSUMER SURVEY by Harold 0. Kiess J. Bradley Swanson Richard F. 0. Johnson January 1972 I Pioneering Research Laboratory
Transcript of FORT LEWIS DINING FACILITIES CONSUMER … of this document is unlimited. Technical Report TR 72-44...

\ l FORT LEWIS DINING FACILITIES CONSUMER SURVEY
by
Harold 0. Kiess J. Bradley Swanson
Richard F. 0. Johnson
January 1972
I
Pioneering Research Laboratory
Distribution of this document is unlimited.
The findings in this report are not to be construed as an official Department of the Army position unless so designated by other authorized documents.
Destroy this report when no longer needed. Do not return it to the originator.
Distribution of this document is unlimited.
Technical Report
TR 72-44 PR
AD
Fort Lewis Dining Facilities Consumer Survey
by
Harold 0. Kiess J. Bradley Swanson
Richard F. 0. Johnson
January 1972
United States Army Natick Laboratories Pioneering Research Laboratory Natick, Massachusetts 01760
/
/

Foreword
This technical report is one of several dealing with studies of the feeding system at Fort Lewis, Washington, evaluations of that system, recommendations for change at Fort Lewis, and the results of those changes. This work was carried on as part of Task 03 under Project Number 1J662713AJ45, Systems Studies in Military Feeding, and Task 06 under Project Number 1J662713A034, Military Food Service and Subsistence Technology.
Each military service, Army, Navy, Air Force, and Marine Corps, has its representative at the Natick Laboratories. Inquiries concerning this report, or other matters in the Depart· ment of Defense Food RDT&E Program, should be directed to the appropriate Service Representative, for example:
Navy Representative DOD Food Program US Army Natick Laboratories Natick, Massachusetts 01760

Acknowledgements
The authors would like to express their thanks to the following individuals who participated in various stages of this investigation: Dr. Robert Byrne and Dr. Walter Organist for establishing the sampling procedures; Dr. Joseph Budelis, Miss Barbara Hasenzahl, Mr. Gerald Hertweck, Dr. Herbert Meiselman, and Dr. Thomas Nichols for their assistance in the administration of the questionnaire; and Miss Mary St. Andre for her tabulation of the data. Special appreciation is extended to Col. Julian Turner and his staff at Ft. Lewis, Washington, whose valuable efforts aided in the completion of this study.

Contents
Abstract
I. Introduction
II. Procedure
Selection of Sample - TDA and TOE Units Selection of Sample - Basic Combat Trainees (BCTs) Administration of Questionnaires - TDA, TOE, and BCT Units
Ill. Results - TDA and TOE Units
Background Information of Sample Army Status and Attitudes
Army Status Attitude toward the Army
Attitudes toward Dining Facilities Introduction Eating Patterns and Eating Behavior Variety of Normal Meals - Weekdays and Weekends Variety of Short-Order Meals - Weekdays and Weekends Food Quality and Preparation Food Quantity Sanitation Overcrowding Noise Level Obtaining and Eating the Meal Personal-Social Factors Likes and Dislikes about the Dining Hall
Soldier Preferences Preferences in Dining Facilities Specialty Food Type Preferences Snack Bars
IV. Results - Basic Combat Trainee Units
Background Information of Sample Army Status and Attitudes
Army Status Attitude toward the Army
Page
iii
1
1 3 3
3
3 5 5 5 6 6 6 7 8 8 9 9
10 10 10 10 11 12 12 14 15
15
15 16 16 16
Attitudes toward Dining Facilities Eating Patterns and Eating Behavior Variety of Normal Meals - Weekdays and Weekends Food Quality and Preparation Food Quantity Sanitation Overcrowding Noise Level Obtaining and Eating the Meal Personal-Social Factors Likes and Dislikes about the Dining Hall
Soldier Preferences Preferences in Dining Facilities Specialty Food Type Preferences
V. Conclusion
Appendices
1. Dining Facilities Questionnaire 2. Procedure for Administration of Questionnaire 3. Questionnaire Figures 4. Questionnaire Tables 5. Comments
ii
Page
16 16 17 17 18 18 19 19 19 19 19 21 21 21
22

Abstract
A survey of approximately 350 garrison and TOE troops from nine dining halls at Ft. Lewis, Washington was conducted in April 1971. The purpose of the survey was to identify those factors which have the potential for influencing or determining consumer attendance at the dining hall. In general, the results showed that the "typical" soldier did not consider the quality of the Army's food-service system to be very good. Their most frequent complaints about the dining hall were food-related, i.e., poor quality, poor preparation, and lack of sufficient quantity.
The conclusion could be made that an improvement of quality, preparation, and quantity of the food would be all that is necessary to draw the military customer back into the dining hall. Indeed it may be, but we have no way of knowing without an empirical test. The eating situation may well be an interactive one in which all factors, including attitude towards the Army, influence eating behavior.
iii
I. INTRODUCTION
The Army has traditionally provided its men with all of their meals. Recent observations at a number of Army posts, however, indicate that a large number of the men do not eat many or any of their meals in the Army dining facilities. Moreover, this problem does not seem confined to the Army; both the Air Force and the Navy report similar observations. However, although the problem of men failing to attend a great number of military-furnished meals has been reported throughout the services, little concrete information is available either on the number of meals they miss or the reasons for this behavior.
The purpose of this study was to gain more information about the consumer, that is, the Army soldier. Most of the questions were directly concerned with food and areas related to the dini'ng facility; however, there were some questions of a more general nature to give us some idea of the background of the subject and his feelings about his military situation. Although all the respondents in this survey were from Fort Lewis, Washington, it is hoped that some generalizations will be able to be made for other Army posts as well. It is also hoped that. the results will provide useful information for the upgrading of present feeding facilities (not only Army facilities, but also Navy, Air Force and Marine shore installations) and for the planning of new facilities.
II. PROCEDURE
Selection of Sample - TDA and TOE Units
The attendance rates for TDA (Table of Distribution and Allowances) and TOE (Table of Organization and Equipment) dining halls at Fort Lewis were determined for February, 1971. Nine dining halls were then selected as representative of (1) the range of attendance at the various Fort Lewis dining facilities and (2) the facilities showing these attendance rates. From each of these nine facilities, 70 soldiers' names were randomly selected from the signature headcount sheets, DA Form 3351, and their attendance rates for the month of February, 1971, were determined. At Fort Lewis, company commanders of the selected dining halls were given the list of the 70 soldiers selected from their unit and told to send 50 of the soldiers to a specified interview session. Only 50 of the 70 soldiers were requested, in order to obviate the problems of those who were on leave, had transferred to another station, were on temporary duty, or had left the service. In actuality, it was generally impossible to obtain even 50 out of the 70 soldiers selected. Table 1 presents the dining units selected, the identification letter assigned to them, the number of soldiers interviewed in each, and the percentage utilization of the facility during February, 1971, as determined from the signature headcount sheets.

Table 1
TDA and TOE Sample
Dining Hall Units No. Interviewed No. Discarded Total % Util.
A' Co A, USATCI 34 0 34 27% Wac Co
B HHC, USATCI 32 31 43%
c 3rd Cav 51 0 51 66% I & I< Troops
D HHD 62 Med Gp 36 2 34 48% 551st Med Co 423d Med Co
E HO, 339th Engr. 26 0 26 48%
F 2d Bn 47 2 45 54% 19th Arty
G 143 SDS Co 30 1 29 57% 63d Ord Co
H 513 Maint Co 53 3 50 56% 171st Ord
542d Maint Co 43 0 43 66% 70th Support Bn 151st
1This unit was composed of 19 males and 15 females.
2
Selection of Sample - Basic Combat Trainees (BCTs)
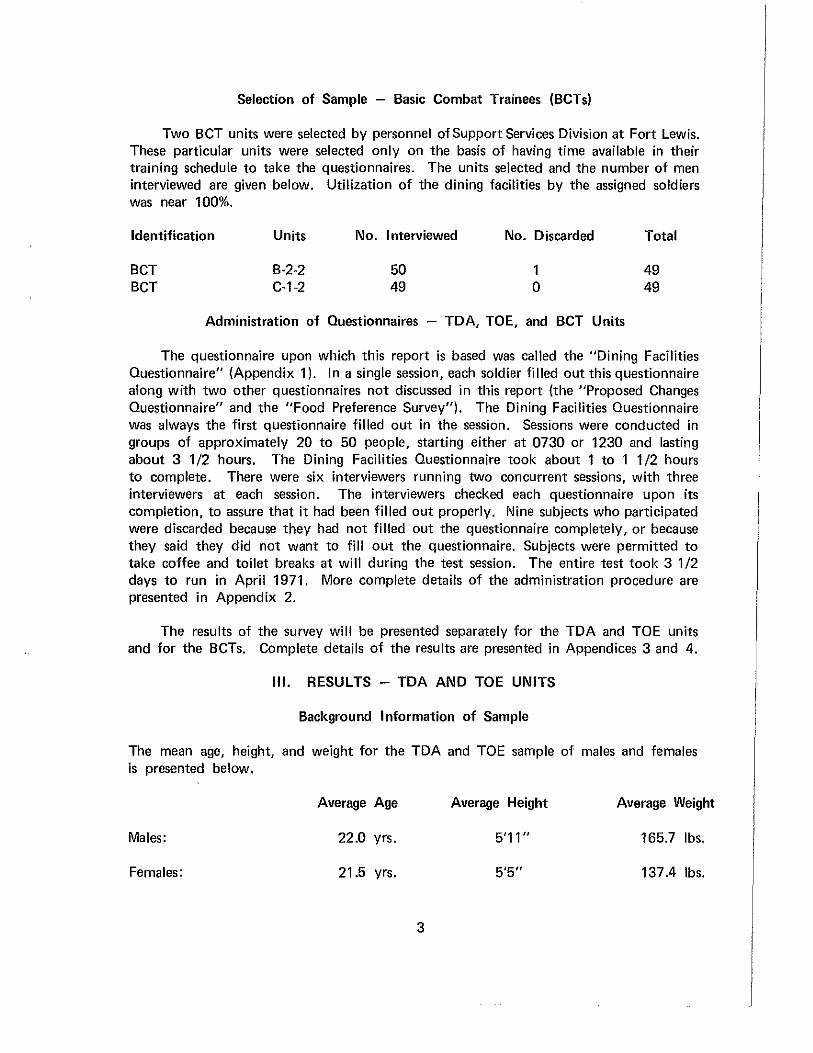
Two BCT units were selected by personnel of Support Services Division at Fort Lewis. These particular units were selected only on the basis of having time available in their training schedule to take the questionnaires. The units selected and the number of men interviewed are given below. Utilization of the dining facilities by the assigned soldiers was near 100%.
Identification
BCT BCT
Units
B-2-2 C-1-2
No. Interviewed
50 49
No. Discarded
1 0
Total
49 49
Administration of Questionnaires - TDA, TOE, and BCT Units
The questionnaire upon which this report is based was called the "Dining Facilities Questionnaire" (Appendix 1 ). In a single session, each soldier filled out this questionnaire along with two other questionnaires not discussed in this report (the "Proposed Changes Questionnaire" and the "Food Preference Survey"). The Dining Facilities Questionnaire was always the first questionnaire filled out in the session. Sessions were conducted in groups of approximately 20 to 50 people, starting either at 0730 or 1230 and lasting about 3 1/2 hours. The Dining Facilities Questionnaire took about 1 to 1 1/2 hours to complete. There were six interviewers running two concurrent sessions, with three interviewers at each session. The interviewers checked each questionnaire upon its completion, to assure that it had been filled out properly. Nine subjects who participated were discarded because they had not filled out the questionnaire completely, or because they said they did not want to fill out the questionnaire. Subjects were permitted to take coffee and toilet breaks at will during the test session. The entire test took 3 1/2 days to run in April 1971. More complete details of the administration procedure are presented in Appendix 2.
The results of the survey will be presented separately for the TDA and TOE units and for the BCTs. Complete details of the results are presented in Appendices 3 and 4.
Ill. RESULTS - TDA AND TOE UNITS
Background Information of Sample
The mean age, height, and weight for the TDA and TOE sample of males and females is presented below.
Average Age Average Height Average Weight
Males: 22.0 yrs. 5'11" 165.7 lbs.
Females: 21.5 yrs. 5'5" 137.4 lbs.
3

Although the sample was drawn only from soldiers stationed at Fort Lewis, the members of the sample represented all geographical regions of the United States in approximate proportion to the distribution of the population of the United States. The sample also represented a variety of rural - urban backgrounds (e.g., farm background, small towns, large towns, small and large cities). The majority (79%) of our sample had finished high school, and 32% of the sample had had at least some college training. The largest proportion of our sample was single (76%) and had never been married; nineteen percent of the respondents were married.
Civilian occupations prior to joining the Army were many and varied. The largest group (30%) had been students, while 20% of the sample had held skilled positions and 14% of the sample had had unskilled occupations.
A complete summary, based on The Dictionary of Occupational Titles, Volume I, U. S. Government Printing Office, Washington 2nd Edition, 1949, is as follows:
Occupations Prior to Joining the Army
Professional and Managerial Clerical and Sales Service Occupations Agricultural, Fishery, Forestry Skilled Occupations Semiskilled Occupations Unskilled Occupations Students Unemployed No Answer, Indecipherable Answer
8% 6% 3% 1%
20% 7%
14% 30%
5% 6%
Eighty-five percent of the respondents were Caucasian, 13% Negro, and 2% were of other racial origin or failed to answer the question. Forty-five percent of the soldiers reported a religious preference for a Protestant faith 2 ; 27% of them reported a preference for the Catholic faith; 13% reported a preference for another faith 3 ; 12% reported no preference; and 3% of the soldiers failed to respond to the question.
2 Protestant 3 Other Faith
Baptist Mormon Brethren Atheist Methodist Pentecostal Bahai Agnostic Lutheran Jewish Nazarene Holyist Presbyterian Church of God Church of Christ Assembly of God Episcopalian Buddhist Tao Greek Orthodox
4
Army Status and Attitudes
Army Status
The majority of the troops were not career Army (88%); most had been drafted (51%) or had enlisted to avoid the draft (16%) and had been in the Army less than 24 months (71 %). Only a very small percentage of the sample had been in the Army for over three years; the typical soldier had been in the Army for between 18 and 24 months. The most typical rank was E-4 (33%); there were few representatives over the grade of E-5 and few under E-3. A total of 79 different MOS's were represented in the sample, together with 6 soldiers who said they had no job. There were ten MOS's, each of which was held by 10 or more soldiers in the sample; however, the majority of the MOS's were held by only two or three people in the sample. Eighty-six percent of the sample lived in the barracks and 92% did not receive a separate rations allowance. Those who did not live in the barracks and those who received a separate rations allowance were included in the sample because they had attained this status since the time their names had been chosen for the sample or because they were still eating at least some of their meals in the dining facility, on a cash basis. Most of the soldiers had eaten in the dining facility that they rated for less than six months. Only a small percentage had eaten in the facility they were rating for over 12 months.
Attitude Toward the Army
In general, the attitude of the soldier toward the Army was "I dislike it" or "I dislike it very much".4 The troops from two units were an exception to this; their attitudes were more neutral (Units A&G). However, almost as many of the soldiers felt that their treatment by the Army had been "fair" (48%) as those that felt their treatment had been "unfair" (52%). A large proportion of these soldiers felt that the Army was not using their talents effectively (78%). There was some variability from unit to unit, but in all units, the percentage of "ineffective" ratings was higher than the "effective" ratings.
If we were to create a profile of a "typical" respondent, he would have possessed the following characteristics:
Age: 21 years Height: 5' 11" Weight: 165.7 lbs. Hometown Area: Midwest or Southeast Education: High school graduate Marital status: Single Race: Caucasian Religion: Protestant Occupation prior to Army: Student
4 Note: In almost all instances, the median was considerably less than the mean for this question. This is due to most of the subjects having ranked their attitudes on the low end of the scale, while a few subjects ranked their attitudes on the very high end of the scale.
5
Had been drafted into service Time in Service: 18 to 24 months Grade: E-4 Non-career Army Will not re-enlist Disliked the Army Equally likely to have felt he had been fairly or unfairly treated Felt his talents were being ineffectively used Lived in the barracks Not on separate rations Had eaten in the dining hall he was rating for about 1 to 3 months
It should be emphasized that this description would have been a "typical" subject as abstracted from the background data. It is very unlikely that any one subject would have had all these characteristics. For example, it was possible for a respondent to have been a 23-year-old WAC, 5' 2" tall, 110 pounds, from Maine, who liked the Army very much.
Attitudes Toward Dining Facilities
In traduction
The following sections will present summary values of the results for various areas of eating behavior and attitudes about the dining facilities. Unless otherwise noted, these values will be assumed to be representative for all of the sample. If units differed significantly on the results for any question, mention will be made of this in the text. Complete summaries of the results are presented in the Appendices. Appendix 4 presents tables containing the percentages of responses and summary statistics, and Appendix 5 presents a summary of the soldier's comments.
Eating Patterns and Eating Behavior
Five different estimates of the soldier's eating behavior, both prior to being in the Army and while in the Army, were obtained. The soldier estimated: (a) his eating behavior before entering the Army, (b) all the meals he ate anywhere while in the Army, and (c) all the meals he ate in his dining hall. Also obtained were: (d) the number of meals he ate in his dining hall as calculated from signature head count sheets, and (e) the soldier's corrections of his signature headcount sheet record. The various estimates of eating patterns are presented in Table 2 below.
6
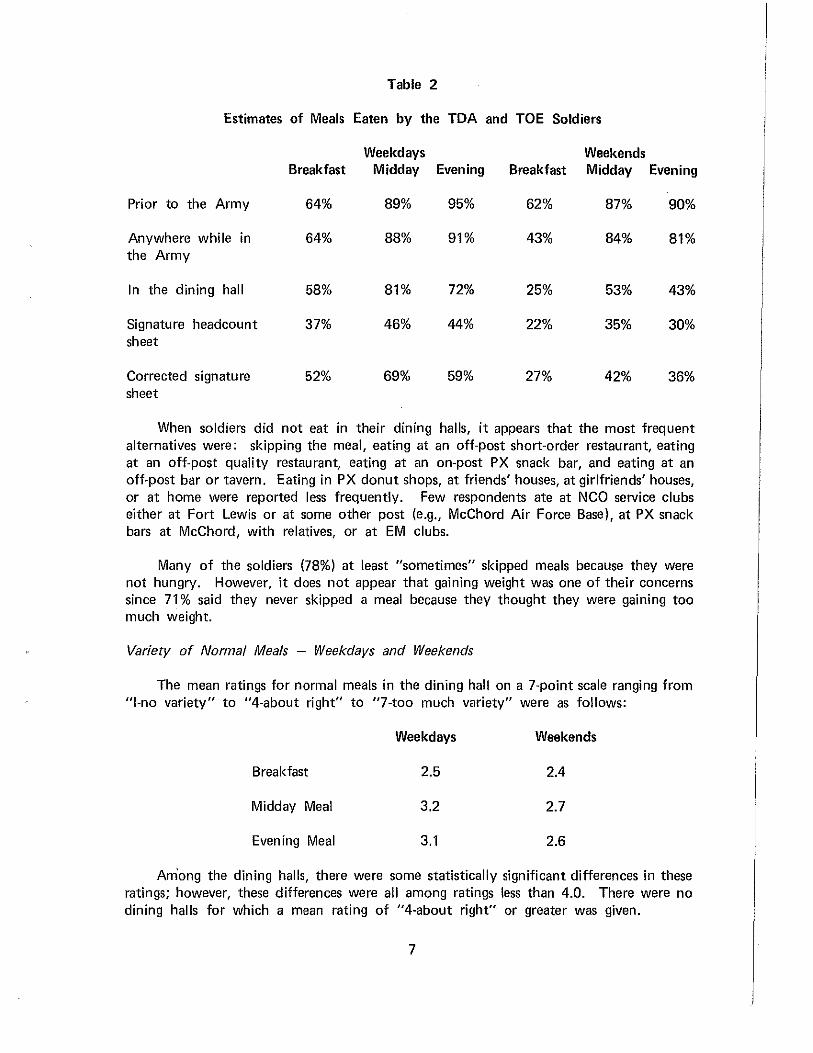
Table 2
Estimates of Meals Eaten by the TDA and TOE Soldiers
Weekdays Weekends Breakfast Midday Evening Breakfast Midday Evening
Prior to the Army 64% 89% 95% 62% 87% 90%
Anywhere while in 64% 88% 91% 43% 84% 81% the Army
In the dining hall 58% 81% 72% 25% 53% 43%
Signature headcount 37% 46% 44% 22% 35% 30% sheet
Corrected signature 52% 69% 59% 27% 42% 36% sheet
When soldiers did not eat in their dining halls, it appears that the most frequent alternatives were: skipping the meal, eating at an off-post short-order restaurant, eating at an off-post quality restaurant, eating at an on-post PX snack bar, and eating at an off-post bar or tavern. Eating in PX donut shops, at friends' houses, at girlfriends' houses, or at home were reported less frequently. Few respondents ate at NCO service clubs either at Fort Lewis or at some other post (e.g., McChord Air Force Base), at PX snack bars at McChord, with relatives, or at EM clubs.
Many of the soldiers (78%) at least "sometimes" skipped meals because they were not hungry. However, it does not appear that gaining weight was one of their concerns since 71% said they never skipped a meal because they thought they were gaining too much weight.
Variety of Normal Meals - Weekdays and Weekends
The mean ratings for normal meals in the dining hall on a 7-point scale ranging from "1-no variety" to "4-about right" to "7-too much variety" were as follows:
Weekdays Weekends
Breakfast 2.5 2.4
Midday Meal 3.2 2.7
Evening Meal 3.1 2.6
Among the dining halls, there were some statistically significant differences in these ratings; however, these differences were all among ratings less than 4.0. There were no dining halls for which a mean rating of "4-about right" or greater was given.
7
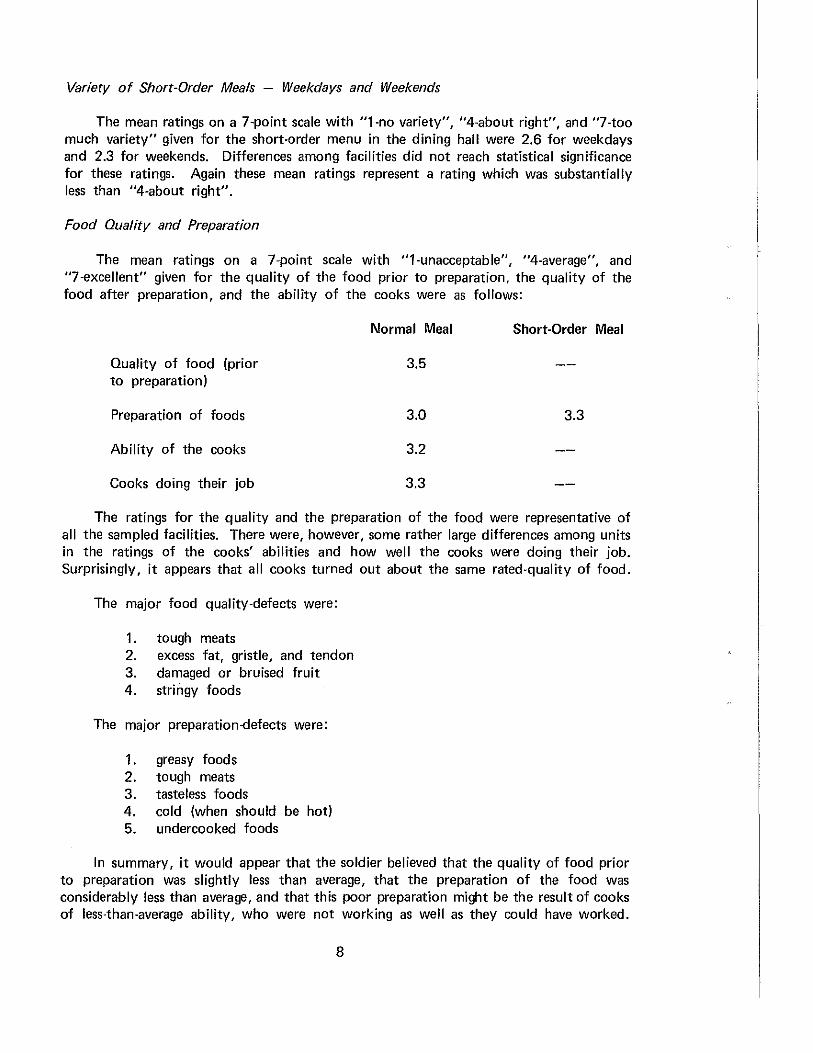
Variety of Short-Order Meals - Weekdays and Weekends
The mean ratings on a 7-point scale with "1·no variety", "4-about right", and "7-too much variety" given for the short-order menu in the dining hall were 2.6 for weekdays and 2.3 for weekends. Differences among facilities did not reach statistical significance for these ratings. Again these mean ratings represent a rating which was substantially less than "4-about right".
Food Duality and Preparation
The mean ratings on a 7-point scale with "1-unacceptable", "4-average", and "?-excellent" given for the quality of the food prior to preparation, the quality of the food after preparation, and the ability of the cooks were as follows:
Quality of food (prior to preparation)
Preparation of foods
Ability of the cooks
Cooks doing their job
Normal Meal Short-Order Meal
3.5
3.0 3.3
3.2
3.3
The ratings for the quality and the preparation of the food were representative of all the sampled facilities. There were, however, some rather large differences among units in the ratings of the cooks' abilities and how well the cooks were doing their job. Surprisingly, it appears that all cooks turned out about the same rated-quality of food.
The major food quality-defects were:
1. tough meats 2. excess fat, gristle, and tendon 3. damaged or bruised fruit 4. stringy foods
The major preparation-defects were:
1. greasy foods 2. tough meats 3. tasteless foods 4. cold (when should be hot) 5. undercooked foods
In summary, it would appear that the soldier believed that the quality of food prior to preparation was slightly less than average, that the preparation of the food was considerably less than average, and that this poor preparation might be the result of cooks of less-than-average ability, who were not working as well as they could have worked.
8
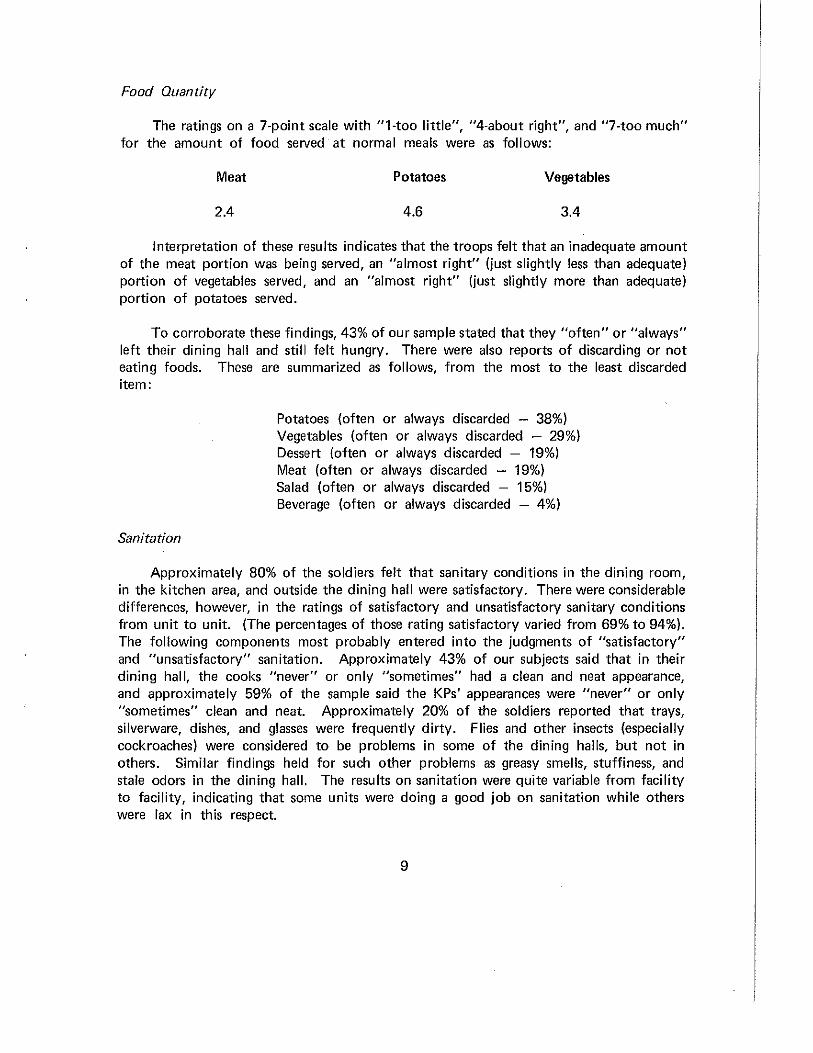
Food Quantity
The ratings on a 7-point scale with "Hoo little", "4-about right", and "7-too much" for the amount of food served at normal meals were as follows:
Meat Potatoes Vegetables
2.4 4.6 3.4
Interpretation of these results indicates that the troops felt that an inadequate amount of the meat portion was being served, an "almost right" (just slightly less than adequate) portion of vegetables served, and an "almost right" (just slightly more than adequate) portion of potatoes served.
To corroborate these findings, 43% of our sample stated that they "often" or "always" left their dining hall and still felt hungry. There were also reports of discarding or not eating foods. These are summarized as follows, from the most to the least discarded item:
Sanitation
Potatoes (often or always discarded - 38%) Vegetables (often or always discarded - 2g%) Dessert (often or always discarded - 19%) Meat (often or always discarded - 19%) Salad (often or always discarded - 15%) Beverage (often or always discarded - 4%)
Approximately 80% of the soldiers felt that sanitary conditions in the dining room, in the kitchen area, and outside the dining hall were satisfactory. There were considerable differences, however, in the ratings of satisfactory and unsatisfactory sanitary conditions from unit to unit. (The percentages of those rating satisfactory varied from 69% to 94%). The following components most probably entered into the judgments of "satisfactory" and "unsatisfactory" sanitation. Approximately 43% of our subjects said that in their dining hall, the cooks "never" or only "sometimes" had a clean and neat appearance, and approximately 59% of the sample said the KPs' appearances were "never" or only "sometimes" clean and neat. Approximately 20% of the soldiers reported that trays, silverware, dishes, and glasses were frequently dirty. Flies and other insects (especially cockroaches) were considered to be problems in some of the dining halls, but not in others. Similar findings held for such other problems as greasy smells, stuffiness, and stale odors in the dining hall. The results on sanitation were quite variable from facility to facility, indicating that some units were doing a good job on sanitation while others were lax in this respect.
9
Overcrowding
For all dining facilities, there were reports of their being "sometimes" overcrowded. For some facilities, there were reports of very "frequent" overcrowding, while for others overcrowding occurred only on an infrequent basis.
Noise Level
A large percentage of the respondents (78%) reported that at least "sometimes" the noise level in the dining hall was too high for a pleasant meal. This figure was quite consistent from unit to unit, indicating a rather general problem.
Obtaining and Eating the Meal
There was a great deal of variability in the amount of time that soldiers from various units reported having to wait in line to obtain their meals. The average wait was reported to be between 10 and 15 minutes, although for some units the wait was reported to be generally longer than 15 minutes and for others the wait was more on the average of 5 to 10 minutes. Seventy-five percent of the respondents considered the wait to be too long and 76% of the subjects said that they at least "sometimes" ate somewhere other than the dining hall because of the wait in line.
Almost all (98%) of the troops reported that they signed for their meals and that they did this before each meal.
The mean time allowed to eat the meal was greater than 20 minutes for all three meals, although for some facilities, the time was reported to be between 10 to 20 minutes for certain meals. A high percentage (breakfast-78%; midday-77%; and evening-94%) of the subjects felt they were given enough time to eat their meal once they had obtained it. It should be noted here, that some of the time constraints on eating may have been due to the respondent's sleeping habits, jobs, after-duty-hours habits or requirements, etc., rather than by restrictions imposed by dining hall personnel.
Personal-Social Factors
Almost 53% of the subjects reported that there were certain individuals or groups of individuals who made eating in the dining hall unpleasant at times. This percentage varied from 31% to 74%; however, it seems that many respondents (73%) did not skip meals at their dining hall because of these individuals.
A fairly large number of soldiers reported that they had certain regularly-scheduled activities that influenced whether or not they ate certain meals. Part-time jobs, recreational activities, and schooling accounted for some of these activities. The largest percentage of activities, however, fell into categories that were not easily grouped.
10
The respondents also felt there were unnecessary rules for behavior in the dining hall, which made eating there rather unpleasant. The rules and the percent of respondents who felt these rules were unnecessary are as follows:
Subjects
58 53 52 41 34 28 16
Rule
calling "at ease" when officers enter dining hall signing for meals permitting officers and NCOs to "cut" in line separating the officers and NCOs from the EMs imposing dress regulations for the dining hall imposing time limits for eating not allowing smoking
Likes and Dislikes about the Dining Hall
Particular "likes" about the dining hall and the percentage of soldiers expressing these "likes" are listed below.'
% Soldiers "Like"
52 convenient location 51 free food 40 cleanliness 28 personnel easy to get along with 22 pleasant appearance 19 convenient times to eat 11 well-balanced meals 9 plenty to eat and drink 6 good food
About 25% of the soldiers reported there was "nothing" they "liked" about the dining hall.
Particular "dislikes" about the dining hall and the percentage of soldiers expressing these "dislikes" are listed below.'
% Soldiers
73 63 63 62 60 58 53
"Dislike"
waiting in line for meals no second helpings food not very good not enough food served silverware missing or inappropriate military atmosphere showing meal card
5 Note: The percentages do not add up to 100%, since each soldier was free to choose as many or as few "likes" or "dislikes" as he wanted.
11
% Soldiers ~~Dislike"
53 not enough condiments available 50 food wasted 49 waiting outside 49 too many people in the dining hall 45 signing for meals 40 serving KP 36 dirty trays, plates, silverware 25 dining hall too noisy 22 harassed by dining hall personnel and
NCOs 22 poor discipline of the men in the
dining hall 21 dress and behavior regulations too
strict 20 inconvenient eating hours
There were other "dislikes", but they were not reported by a large percentage of the soldiers. About 3% of the sample said there was "nothing" they "disliked" about the dining hall.
Soldier Preferences
Preferences in Dining Facilities
Approximately 62% of the soldiers preferred to have small dining halls designed for only a company of men to eat in. Only 13% of the soldiers felt they would like a larger facility, while the rest of the sample did not express a preference in this matter. It should be noted here that although all the dining halls sampled at Fort Lewis were of the "small" variety referred to in the question, 76% of the sample said that they had eaten in larger consolidated facilities which fed equivalent to more than one company. Thus, the preference for the smaller dining facility, at least for a large proportion of the men, was based on experience with both kinds of facilities.
The preferred hours of operation of the dining hall for each meal, with indication of the maximum hours of operation, are given below.
12
Weekdays Weekends Breakfast Midday Evening Breakfast Midday Evening
Preferred 0630-0800 1115-1300 1630-1830 0800-1030 1130-1330 1630-1730 hours
Maximum 0630-0830 1100-1330 1615-1830 0800-1030 1115-1400 1600-1800 hours
It should be recognized that these are only recommendations based on the subjects' indications of preferred dining hall operating hours, and there was a great deal of variability in the soldiers' preferences. Certainly, operational requirements will necessitate modifications of these operating hours and certainly these hours may not be applicable to other facilities at Fort Lewis, who have personnel working different hours from the personnel in the sampled units.
Sixty-one percent of the subjects said they would like to have permission to eat at any dining hall on post, while 31% said it did not matter to them. This may reflect that the soldier's dining hall was not open during the appropriate hours for him, or it may reflect the soldier's belief that quality differences existed among dining facilities and permission to eat at any facility would permit him to seek out the "best" facility, or that he may have friends in another dining unit.
Ninety-six percent of the soldiers reported that they preferred to have their dining facility located in their barracks building or in a building adjacent to the barracks. Very few of the soldiers reported a preference for a facility located outside the immediate company area. Preferred interior decorations included music, curtains, tablecloths, decorative wall patterns, and brighter colors. About 44% of the sample said they would also like counters and booths. However, about 44% of the sample said that this did not matter to them. Thus, it appears that counters and booths were not disliked, but there was no strong liking for them either. Disliked interior decorations included military pictures and posters, flags, and trophies. There also appeared to be an overwhelming preference for 4-man tables (71%), as opposed to 1-, 2-, 3-, 5-, 6-, 7-or-more-man tables. Only about 46% of the respondents said they preferred china dishes to metal or plastic trays. There did not appear to be a strong dislike for trays, since about 36% of the soldiers said that they had no preference for trays or china.
In the area of the serving of the food, it would appear that the soldiers would, in general, prefer to serve themselves. This preference varied with the type of food item: the meat, dessert and beverage items were the items the soldiers would most like to serve themselves. However, the majority of the soldiers would also like to serve themselves the other items on the menu, such as the potato, vegetable, and salad items.
13
Most of the respondents said they would like to have music (86%) with their meals, or it did not matter whether music was provided (12%). Only 2% wanted no music at all. No one type of music stood out as a definite favorite, since most subjects reported they would like to have a variety of different types of music offered. Selection of different types of music should be made from the following: hard rock, popular, soul, rock and roll, and country and western.
The soldiers would also prefer to see stronger behavioral regulations concerning shouting, yelling, and horseplay in the dining hall. This was a rather consistent finding among all units, indicating that at present this may be a problem.
Specialty Food Type Preferences
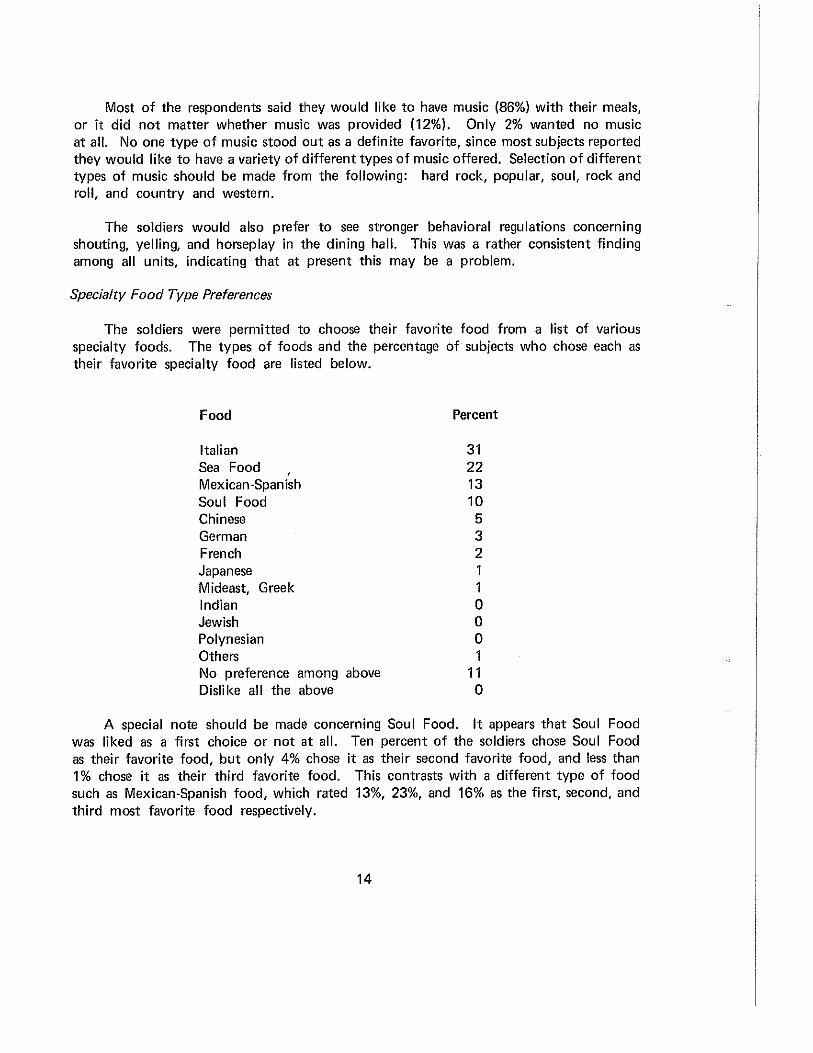
The soldiers were permitted to choose their favorite food from a list of various specialty foods. The types of foods and the percentage of subjects who chose each as their favorite specialty food are listed below.
Food Percent
Italian 31 Sea Food
' 22
Mexican-Spanish 13 Soul Food 10 Chinese 5 German 3 French 2 Japanese 1 Mideast, Greek 1 Indian 0 Jewish 0 Polynesian 0 Others 1 No preference among above 11 Dislike all the above 0
A special note should be made concerning Soul Food. It appears that Soul Food was liked as a first choice or not at all. Ten percent of the soldiers chose Soul Food as their favorite food, but only 4% chose it as their second favorite food, and less than 1% chose it as their third favorite food. This contrasts with a different type of food such as Mexican-Spanish food, which rated 13%, 23%, and 16% as the first, second, and third most favorite food respectively.
14
Snack Bars
There was a strong preference for the Army to operate snack bars where soldiers can go to obtain free snacks during off- and on-duty hours. Seventy-seven percent of the respondents were in favor of having these snack bars, while only 6% of the sample were against them. The remaining 17% didn't care whether they had them or not. However, it also appears that the soldiers wanted to have snack bars and not general-recreation or "hang-around" areas, since 49% of the sample said that personnel should be permitted to stay at these snack bars only as long as it takes them to eat, with only 30% feeling that no limit should be imposed on the amount of time that could be spent at the snack bar. As far as hours of operation were concerned, the responses to this question were quite varied, and it is difficult to make generalizations about when the snack bar would be most used. It appears, however, that operating hours of 0700-2400 on weekdays would accommodate about 95% of the personnel, and 0800-0100 on weekends would accommodate about 94% of the personnel. There was, however, a small but definite percentage of personnel (4% to 6%) that would like to have a snack bar available all night between 2400 and 0600 hours. These people would not be accommodated by the snack-bar hours recommended above.
IV. RESULTS - BASIC COMBAT TRAINEE UNITS
Background Information of Sample
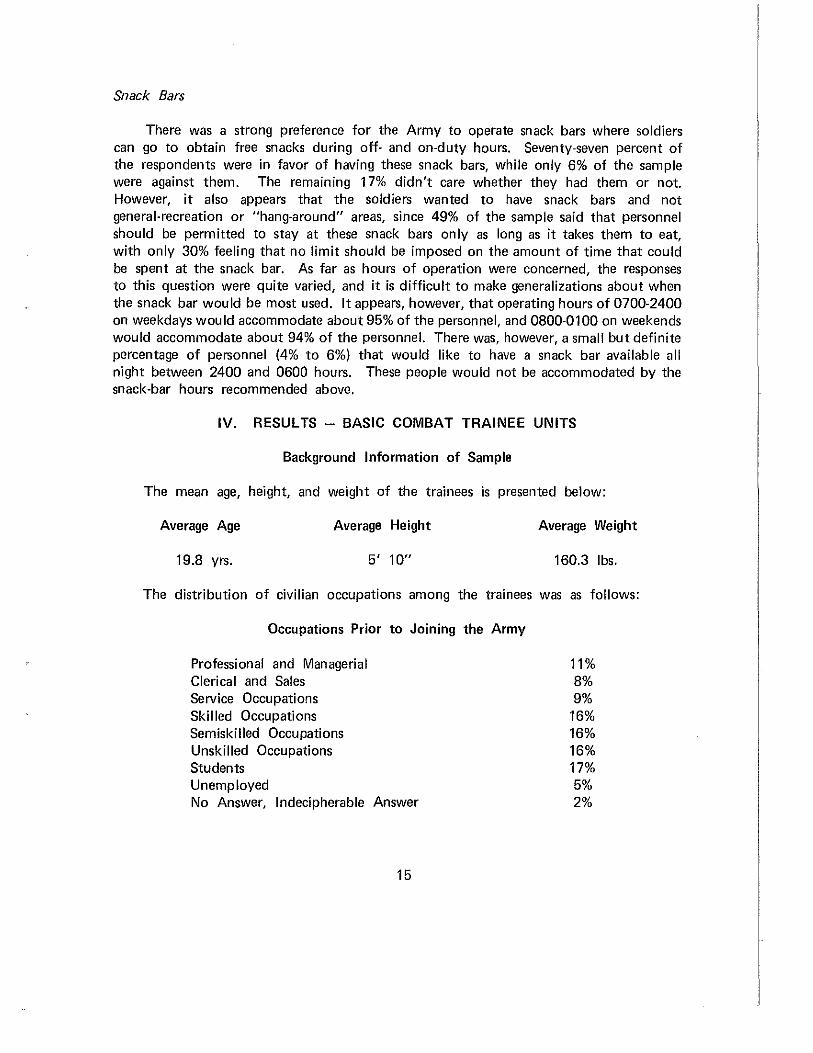
The mean age, height, and weight of the trainees is presented below:
Average Age Average Height Average Weight
19.8 yrs. 5' 1 0" 160.3 lbs.
The distribution of civilian occupations among the trainees was as follows:
Occupations Prior to Joining the Army
Professional and Managerial Clerical and Sales Service Occupations Skilled Occupations Semiskilled Occupations Unskilled Occupations Students Unemployed No Answer, Indecipherable Answer
15
11% 8% 9%
16% 16% 16% 17% 5% 2%
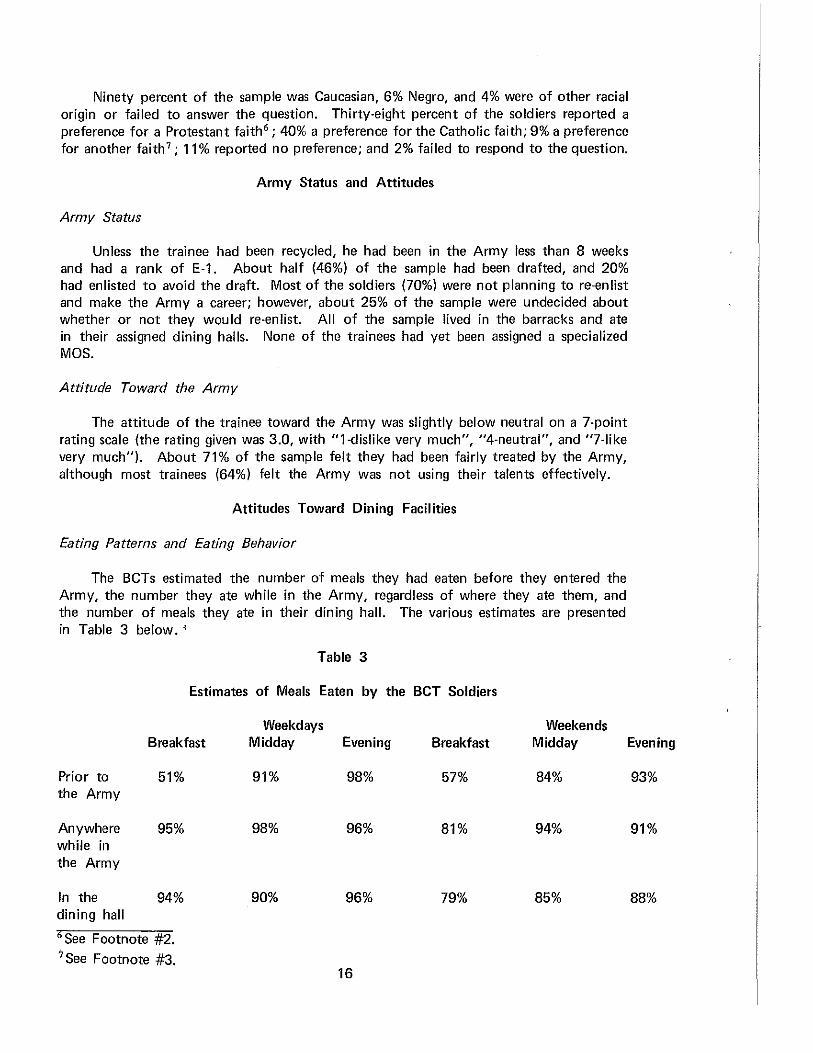
Ninety percent of the sample was Caucasian, 6% Negro, and 4% were of other racial origin or failed to answer the question. Thirty-eight percent of the soldiers reported a preference for a Protestant faith 6 ; 40% a preference for the Catholic faith; 9% a preference for another faith 7 ; 11% reported no preference; and 2% failed to respond to the question.
Army Status and Attitudes
Army Status
Unless the trainee had been recycled, he had been in the Army less than 8 weeks and had a rank of E-1. About half (46%) of the sample had been drafted, and 20% had enlisted to avoid the draft. Most of the soldiers (70%) were not planning to re-enlist and make the Army a career; however, about 25% of the sample were undecided about whether or not they would re-enlist. All of the sample lived in the barracks and ate in their assigned dining halls. None of the trainees had yet been assigned a specialized MOS.
Attitude Toward the Army
The attitude of the trainee toward the Army was slightly below neutral on a 7-point rating scale (the rating given was 3.0, with "1-dislike very much", "4-neutral", and "7-like very much"). About 71% of the sample felt they had been fairly treated by the Army, although most trainees (64%) felt the Army was not using their talents effectively.
Attitudes Toward Dining Facilities
Eating Patterns and Eating Behavior
The BCTs estimated the number of meals they had eaten before they entered the Army, the number they ate while in the Army, regardless of where they ate them, and the number of meals they ate in their dining hall. The various estimates are presented in Table 3 below. '
Table 3
Estimates of Meals Eaten by the BCT Soldiers
Weekdays Weekends Breakfast Midday Evening Breakfast Midday Evening
Prior to 51% 91% 98% 57% 84% 93% the Army
Anywhere 95% 98% 96% 81% 94% 91% while in the Army
In the 94% 90% 96% 79% 85% 88% dining hall 6 See Footnote #2. 7 See Footnote #3.
16
When the BCTs did not eat in their dining hall, they reported that they either skipped the meal or ate it at a PX snack bar on post. Since the BCTs ate a very large proportion of their meals in the dining hall, the frequency of their eating elsewhere was quite low. When meals were skipped, it may have been due to the soldier's not being hungry, since about 44% of the sample said that they "sometimes" skipped a meal because they were not hungry. But very few trainees reported that they ever skipped a meal because they thought they were gaining too much weight.
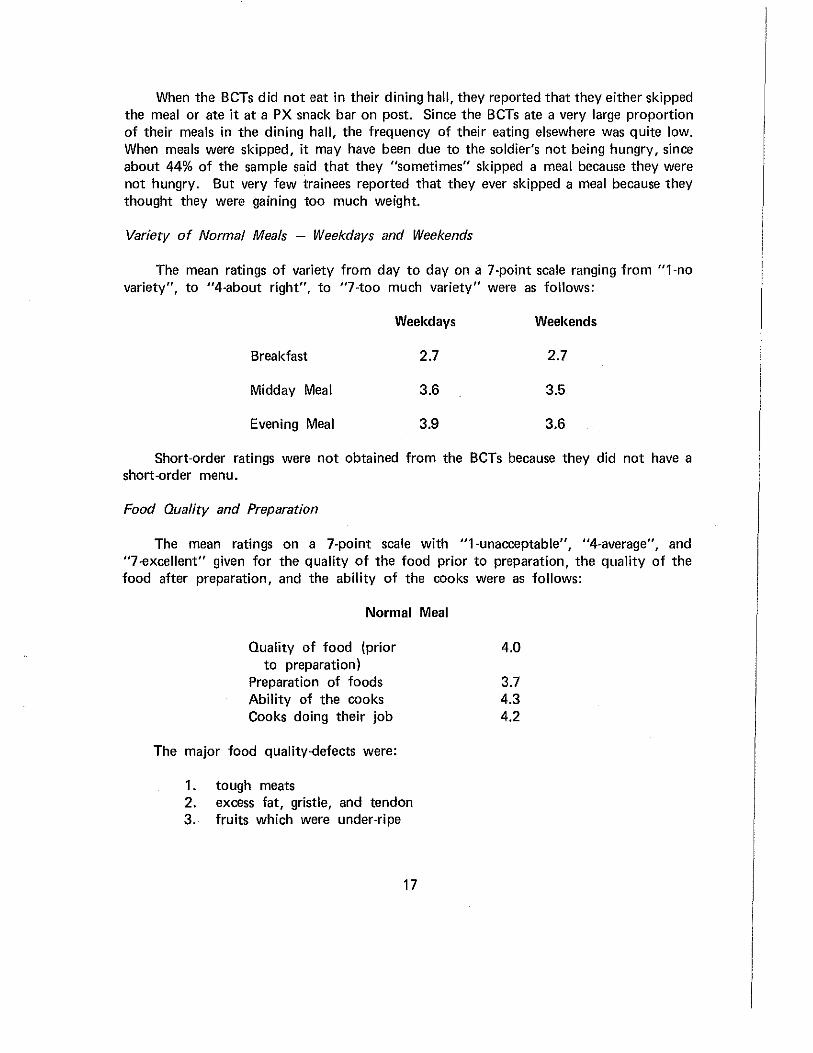
Variety of Normal Meals - Weekdays and Weekends
The mean ratings of variety from day to day on a 7-point scale ranging from "1-no variety", to "4-about right", to "7-too much variety" were as follows:
Weekdays Weekends
Breakfast 2.7 2.7
Midday Meal 3.6 3.5
Evening Meal 3.9 3.6
Short-order ratings were not obtained from the BCTs because they did not have a short-order menu.
Food Quality and Preparation
The mean ratings on a 7-point scale with "1-unacceptable", "4-average", and "7-excellent" given for the quality of the food prior to preparation, the quality of the food after preparation, and the ability of the cooks were as follows:
Normal Meal
Quality of food (prior to preparation)
Preparation of foods Ability of the cooks Cooks doing their job
The major food quality-defects were:
1 . to ugh meats 2. excess fat, gristle, and tendon 3. fruits which were under-ripe
17
4.0
3.7 4.3 4.2
The major preparation-defects reported were:
1. undercooked foods 2. tough meats 3. tasteless and bland foods 4. cold (when should be hot) 5. greasy foods
Food Quantity
The ratings on a 7-point scale with "1-too little", "4-about right", and "7-too much" for the amount of food served were as follows:
Meat Potatoes Vegetables
2.6 4.1 3.6
These results indicate that the BCTs felt that an inadequate portion of the meat item was served, a slightly less than adequate portion of vegetables was served, and an adequate portion of potatoes was served. In agreement with these findings, about 54% of the trainees stated that they "often" or "always" left their dining hall feeling hungry. Although in their previous reports the BCTs implied that they were receiving inadequate amounts of food, there were some reports of the discarding of food. These are summarized as follows:
Potatoes (often or always discarded 23%) Vegetables (often or always discarded 21%) Salad (often or always discarded 8%) Meat (often or always discarded 6%) Dessert (often or always discarded 4%) Beverage (often or always discarded 0%)
Sanitation
Approximately 94% of the trainees felt that sanitary conditions in the dining room, in the kitchen area, and outside the dining hall were satisfactory. About 76% of the sample said the cooks "often" or "always" had a clean and neat appearance and 68% felt the KPs "often" or "always" were clean and neat. Occurrences of dirty eating utensils and dishes were reported. The major problems appeared to be dirty trays ("often" or "always" dirty- 29%), dirty silverware ("often" or "always" dirty- 12%), and dirty dishes and glasses ("often" or "always" dirty - 8%). Less than 4% of the subjects reported any problems with insects, animals, etc., in their dining facility. There were also few reports of problems such as smells, stuffiness, or stale odors in the dining hall.
18
Overcrowding
Approximately 59% of the sample reported that the dining hall was "sometimes" overcrowded, and 32% said that their dining hall was "often" or "always" overcrowded.
Noise Level
Noise level did not appear to be too much of a problem in the BCT facilities. Approximately 66% of the soldiers said that the noise level was "never" too loud, and 27% said that it was only "sometimes" too loud.
Obtaining and Eating the Meal
The average wait in line to obtain the meal was reported to be between 1 0 and 15 minutes; 59% of the BCTs considered their average wait in line to be too long. The mean time to eat the meal was reported to be between 10 and 20 minutes for all three mea Is, although approximately 1/3 of the sample reported that they ate their meals in less than 10 minutes; about 45% of the sample felt they were given insufficient time to eat their meals.
Personal-Social Factors
The BCTs felt there were certain unnecessary behavioral rules for the dining hall that made eating there less pleasant than it could have been. The rules and the percent of respondents who felt these rules were unnecessary are as follows:
% Subjects
74 66 47 42 38 18 15
Rule
imposing time limits for eating calling "at ease" when officers enter not allowing smoking signing for meals permitting officers and NCOs to cut in line imposing dress regulations for the dining hall separating officers and NCOs from the EMs
Likes and Dislikes about the Dining Hall
Particular "likes" about the dining hall and the percentage of soldiers expressingthese "likes" are given below:
19

% Soldiers
75 72 67 43 28 26 19 13
3
"like"
cleanliness convenient location free food pleasant appearance well-balanced meals personnel easy to get along with good food convenient times to eat plenty to eat and drink
Ten percent of the BCTs said there was "nothing" that they "liked" about their dining hall.
Particular "dislikes" about the dining hall and the percentage of soldiers expressing these "dislikes" are listed below:
% Soldiers
72 70 65 64 62 60 56 52 50 46 41 33 33 32 26 25 25 20
"Dislike"
harassed by dining hall personnel and NCOs not enough food served not enough condiments not enough time to eat not permitting second helpings waiting in line to obtain the meal waiting outside to obtain the meal military atmosphere food wasted serving on KP dirty trays, plates, and silverware food not very good too many people eating in the dining hall doing PT before and after meals dress and behavior regulations too strict silverware missing or inappropriate showing meal card to obtain meal officers and NCOs eating in the same
dining hall
There were other "dislikes", but the percentage of soldiers expressing these dislikes was quite small. Seven percent of the BCTs said there was "nothing" that they "disliked" about their dining hall.
20

Soldier Preferences
Preferences in Dining Facilities
Approximately 63% of the BCTs preferred to have small dining halls designed for only a company to eat in. Only 7% of the sample expressed a desire for larger facilities, while the rest of the sample did not express a preference. However, most of the sample had never eaten in a larger dining hall (80%), so their preference was based only on having eaten in the smaller-sized facilities. Ninety·one percent of the BCTs preferred to have their dining hall located in the barracks building. Inside the dining hall, the preferred table size was 4 men per table (80%). The men also wanted brighter colors (66%), decorative wall patterns (73%) curtains (66%), tablecloths (71%), and music with meals (90%). Interior decorations s~ch as military pictures, posters, flags, and trophies were not particularly .liked, but for approximately 46% of the sample, it did not matter whether these decorations were used or not. Counters and booths were preferred by about 39% of the BCTs, while 35% of the soldiers did not state a definite preference for counters and booths. About 50% of the trainees expressed no preference for either china plates or metal or plastic trays. Only 17% held a definite preference for chinaware instead of trays.
In general, it appears that the soldiers would prefer to serve their own food. This preference varied with the type of food item: the meat, dessert, and beverage items were the items the soldiers would most like to serve themselves.
Preferences for the choice of music to be played in the dining hall were quite varied, and there seemed to be no one favorite type of music (with perhaps, the exception of hard rock, which was preferred by 14% of the sample); the most consistent preference (39%) was for a variety of types of music. A majority of the subjects (53%) would also like to see rules initiated to prevent shouting and yelling in the dining hall.
Specialty Food Type Preferences
The soldiers were permitted to choose their favorite food from a list of various specialty foods. The types of foods and the percentage of subjects who chose each as their favorite specialty food are listed below:
Food
Italian Sea Food Mexican-Spanish Soul Food Chinese German
21
Percent8
43 19 8 5 4 3

Food
French Indian Japanese Jewish Mideast, Greek Polynesian Others No preference among above Dislike all the above
V. CONCLUSION
Percent8
1 1 0 0 0 0 2
12 1
Although the sample was drawn entirely from Fort Lewis, Washington, the background data indicate that many regions of the United States and many different types of backgrounds were represented. On this basis, it appears justifiable to assume that the subjects' reponses which were not specifically related to a particular situation at Fort Lewis may be quite representative of what we may expect to find if we were to obtain an Army-wide sample. For example, we would expect this sample to be quite representative of attitudes toward the Army, career plans, food preferences, likes and dislikes, etc. However, for topics such as specific dining hall sanitation, food preparation, operating hours, etc., and other areas which are specific to the men's dining halls and duties at Fort Lewis, we would expect the results to apply only to Fort Lewis dining facilities. It is likely, however, that we would find similar results in these areas from other DOD service installations which have conditions and facilities similar to those at Fort Lewis.
Our TDA and TOE soldier was not very happy with his status in the Army, and had no particular desire to make the Army his career. He also did not consider the quality of the Army's food·service system to be very good. It is very likely that these are not independent feelings. The soldier's dislike for the Army food-service system could very well contribute to his dislike for the Army, and vice versa. However, we have no way of knowing from our questionnaire how much the food-service system contributed to the man's opinion of the Army or how his attitude toward the Army affected his opinion of the dining hall. Thus, at the present time, we have no way of knowing whether changes in the food-service system would have any effect on the soldier's general attitude toward the Army. It is also possible that the soldier's dislike for the Army was the overriding issue and biased his attitude toward the food and the dining situation. If this was the case, it is likely that he would still be dissatisfied with even the finest of dining facilities. It should be noted that the BCT's attitude toward the Army was slightly better than that of the TDA and TOE troops. Likewise, the BCT was more satisfied with his dining hall than was the TDA and TOE soldier.
8 Note: Percentages do not add up to 100% because of round-off error.
22
If we assume that the soldier had legitimate complaints about his dining hall, then the most frequent complaints were food-related, i.e., poor quality, poor preparation, and lack of sufficient quantity. Other major complaints were waiting in line for meals, the military atmosphere of the mess halls, missing or inappropriate silverware, wasted food, waiting outside for meals, crowded mess halls, signing for meals, and KP. Although soldiers expressed a preference for bright, cheerful facilities, this did not appear to be the significant factor in their decision either to eat or not to eat in their dining halls. Similarly, complaints about sanitation, in comparison to complaints about food, were at a relatively low rate (but rather high on an absolute scale), and did not seem to be the major concern of the soldiers.
The conclusion could be drawn that an improvement of the quality, preparation, and quantity of the food would be all that is necessary to draw the military customer back into the dining hall. Indeed it may be. But we have no way of knowing without an empirical test. The eating situation may well be an interactive one in which all factors, including attitude toward the Army, influence eating behavior.
23

APPENDIX 1
DINING FACILITIES QUESTIONNAIRE


DINING FACILITIES QUESTIONNAIRE
This questionnaire is being sponsored by the U.S. Army Natick Laboratories, Natick, Massachusetts. Its purpose is for you to tell us your opinions of your mess hall and to suggest changes you would like to see take place in the Army Food Service System.
The Army is required to furnish you with free and nutritious meals during your stay in the Army. However, you have probably heard the old story, "You can lead a horse to water, but you can't make him drink." This expresses exactly our problem; our current figures show that less than 60% of our free meals are being eaten by our soldiers (YOU!) We want to do better than that. Our goal is to furnish you with improved feeding service with better quality meals, better variety of meals, more selection of meals at each mealtime, increased serving hours, and more pleasant surroundings. We believe we can do a better job than we are doing now, and can encourage higher attendance by doing more things right.
The information that you give us in this questionnaire will be used to plan and suggest changes in the Army Food Service System. We would like you to read and answer the questions very carefully, since your answers will help to determine changes that may be made in your mess hall and in mess halls at other Army Posts. The success of this survey rests on your honesty and cooperation.
The instructions for the questionnaire follow. Please read them very carefully. As you are answering the questionnaire we will go over it with you to help you with the more difficult questions.

Instructions
Write your name only on the first page of the questionnaire where you are asked to do so. Do not write your name on any other page. Your reply to this questionnaire is confidential in nature, and we are not going to attach names to responses. When your questionnaire is turned in, the first page with your name on it will be removed and replaced with a code number. These code numbers will not be made available to anyone; even you will not be able to see or change your answers once you have handed in the questionnaire.
You will answer most of the questions by circling the number of the answer that you choose and then placing that number on the line at the right hand side of the question. Remember, you circle the number of your answer, and then place that number on the line at the right hand side of the question. Please be sure that you use the proper answer line for each question. Ignore the numbers that are under each line. These are numbers to be used for computer coding of your answers and you don't have to do anything with them.
Most of the questions require that you give only one answer. Please do not give more than one answer unless the question tells you to do so.
An example of one of these types of questions is:
How often do you skip breakfast because you are not hungry? Circle the number of your answer.
1. Never 2. Sometimes 3. Often 4.59
4. Always
If you sometimes skip breakfast because you are not hungry, you would circle the 2 for "Sometimes" and place "2" on the line to the right.
Your answer would then look like this:
How often do you skip breakfast because you are not hungry? Circle the number of your answer.
1. Never @ Sometimes
3. Often 4. Always
~ 4.59
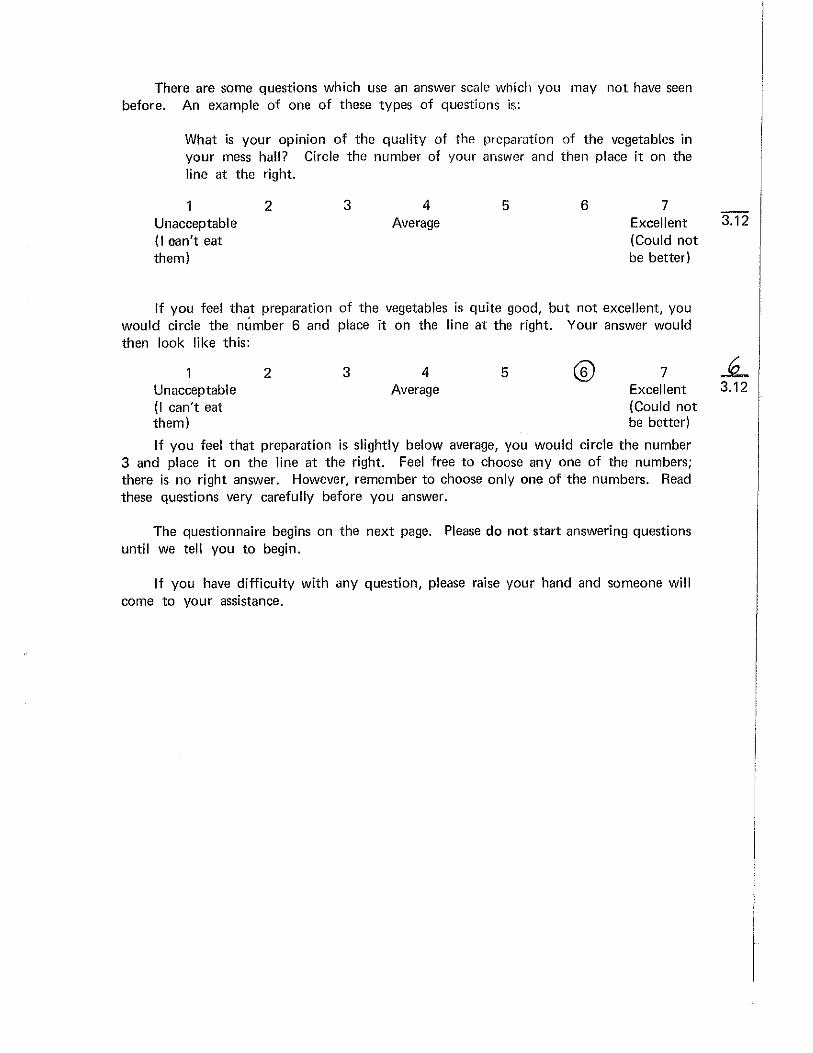
There are some questions which use an answer scale which you may not have seen before. An example of one of these types of questions is:
What is your opinion of the quality of the preparation of the vegetables in your mess hall? Circle the number of your answer and then place it on the line at the right.
2 3 5 6 7 Unacceptable (I can't eat them)
4 Average Excellent 3.12
(Could not be better)
If you feel that preparation of the vegetables is quite good, but not excellent, you would circle the number 6 and place it on the line at the right. Your answer would then look like this:
Unacceptable (I can't eat them)
2 3 4 Average
5 7 Excellent (Could not be better)
If you feel that preparation is slightly below average, you would circle the number 3 and place it on the line at the right. Feel free to choose any one of the numbers; there is no right answer. However, remember to choose only one of the numbers. Read these questions very carefully before you answer.
The questionnaire begins on the next page. Please do not start answering questions until we tell you to begin.
If you have difficulty with any question, please raise your hand and someone will come to your assistance.
~ 3.12

Name: ________ ~----------~----------~~--Last First M.l. 1.01 '1.02, 1.03
Meal Card Number:-----
Unit: ______ _
Job in the Army: _________________ _
Previous job before you entered the Army:..:----------------
Religious Preference: ----------------Race: ,;,._ _____ _ Height (in inches)'-: -------
Weight (iri pounds): _____ _
DINING FACILITIES QUESTIONNAIRE
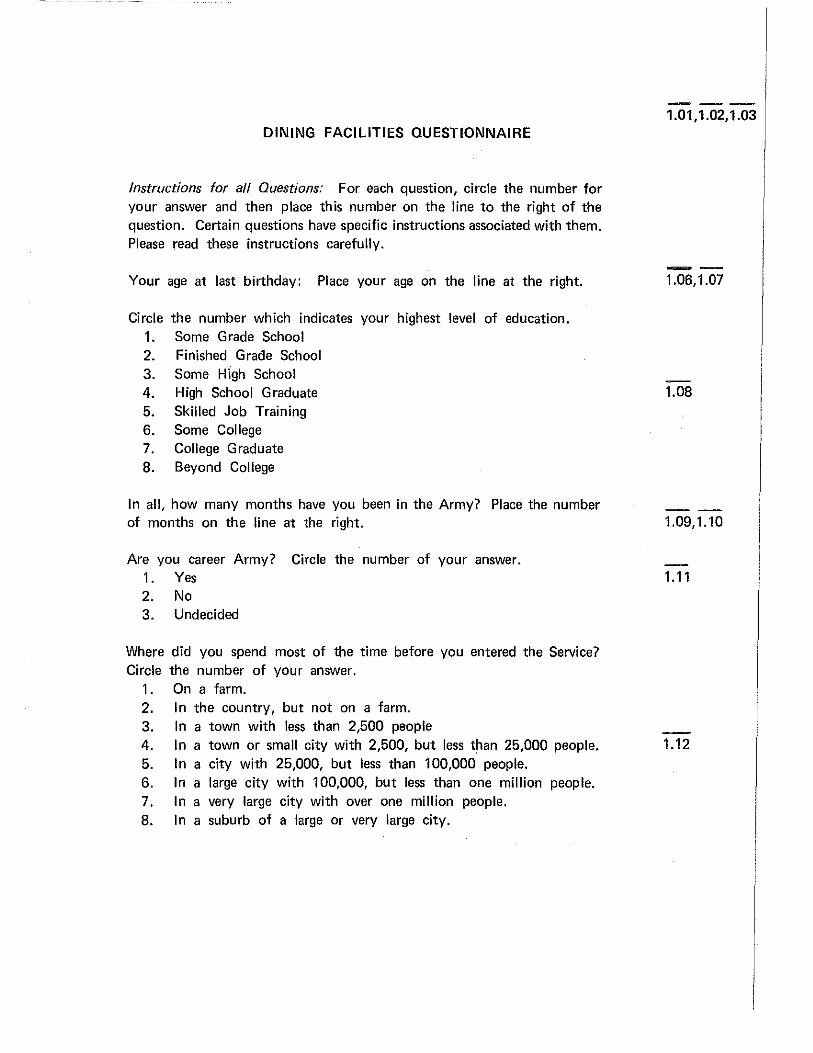
Instructions for all Questions: For each question, circle the number for your answer and then place this number on the line to the right of the question. Certain questions have specific instructions associated with them. Please read these instructions carefully.
Your age at last birthday: Place your age on the line at the right.
Circle the number which indicates your highest level of education. 1. Some Grade School 2. Finished Grade School 3. Some High School 4. High School Graduate 5. Skilled Job Training 6. Some College 7. College Graduate 8. Beyond College
In all, how many months have you been in the Army? Place the number of months on the line at the right.
Are you career Army? Circle the number of your answer. 1. Yes 2. No 3. Undecided
Where did you spend most of the time before you entered the Service? Circle the number of your answer.
1. On a farm. 2. In the country, but not on a farm. 3. In a town with less than 2,500 people
1.01, 1.02, 1.03
1.06, 1.07
1.08
1.09,1.10
1.11
4. In a town or small city with 2,500, but less than 25,000 people. 1.12 5. In a city with 25,000, but less than 100,000 people. 6. In a large city with 100,000, but less than one million people. 7. In a very large city with over one million people. 8. In a suburb of a large or very large city.
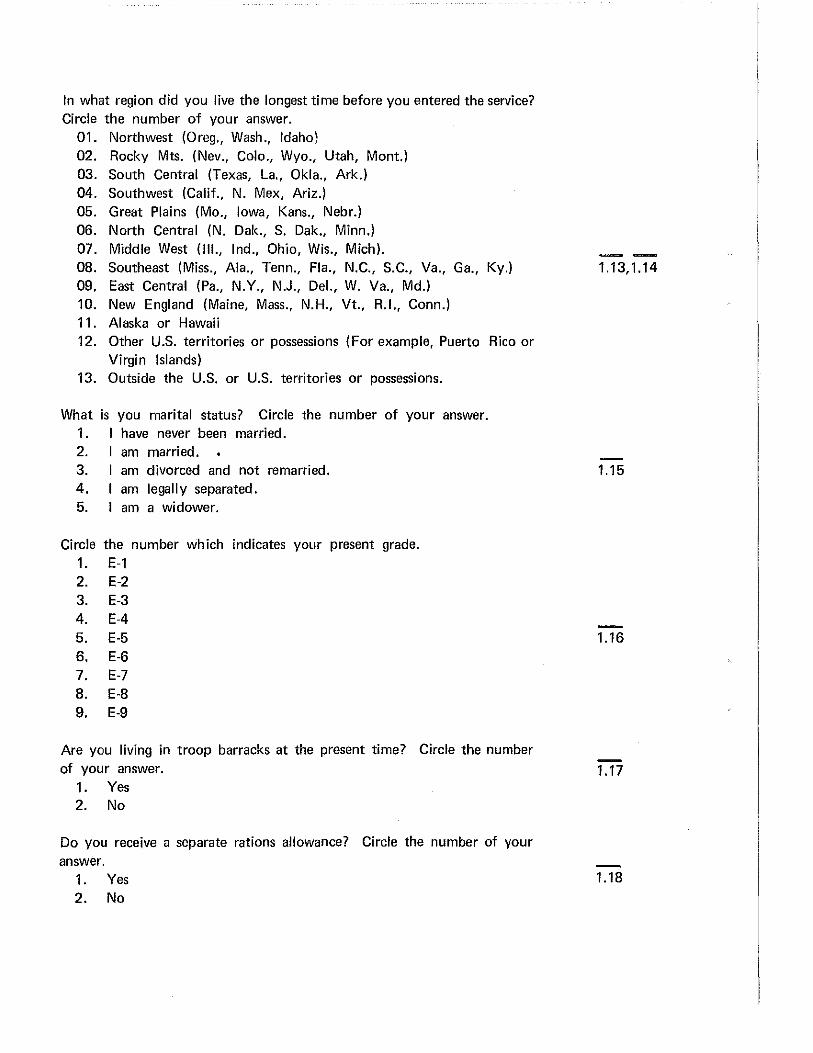
In what region did you live the longest time before you entered the service? Circle the number of your answer.
01. Northwest (Oreg., Wash., Idaho) 02. Rocky Mts. (Nev., Colo., Wyo., Utah, Mont.) 03. South Central (Texas, La., Okla., Ark.) 04. Southwest (Calif., N. Mex, Ariz.) 05. Great Plains (Mo., Iowa, Kans., Nebr.) 06. North Central (N. Dak., S. Dak., Minn.) 07. Middle West (Ill., Ind., Ohio, Wis., Mich). 08. Southeast (Miss., Ala., Tenn., Fla., N.C., S.C., Va., Ga., Ky.) 09, East Central (Pa., N.Y., N.J., Del., W. Va., Md.) 10. New England (Maine, Mass., N.H., Vt., R.I., Conn.) 11. Alaska or Hawaii 12. Other U.S. territories or possessions (For example, Puerto Rico or
Virgin Islands) 13. Outside the U.S. or U.S. territories or possessions.
What is you marital status? Circle the number of your answer. 1. I have never been married. 2. am married.
1.13,1.14
3. 1.15 am divorced and not remarried. 4. 5.
am am
legally separated. a widower.
Circle the number which indicates your present grade. 1. E-1 2. E-2 3. E-3 4. E-4 5. E-5 6. E-6 7. E-7 8. E-8 9. E-9
Are you living in troop barracks at the present time? Circle the number of your answer.
1. Yes 2. No
Do you receive a separate rations allowance? Circle the number of your answer.
1. Yes 2. No
1.16
1.17
1.18

In which mess hall do you eat? (Give the building number on the line at the right.)
1.19-1.23
How many months have you been eating in this mess hall? Place the number of months on the line at the right. 1.24, 1.25
During a typical week, which meals do you eat, regardless ·of where you eat them? Place a check (vi) in the box for each meal that you typically eat. If you have "brunch" on Saturdays and Sundays, consider it to be a mid-day meal.
Mon. Tues. Wed. Thurs. Fri. Sat. Sun.
Breakfast 1.26 1.27 1.28 1.29 1.30 1.31 1.32
Mid·day Meal 1.33 1.34 1.35 1.36 1.37 1.38 1.39
Evening Meal 1.40 1.41 1.42 1.43 1.44 1.45 1.46
During a typical week, which meals do you eat at your mess hall? Place a check (/) in the box for each meal that you typically eat. If you have "brunch" on Saturdays and Sundays, consider it to be a mid-day meal.
Mon. Tues. Wed. Thurs. Fri. Sat. Sun.
Breakfast 1.47 1.48 1.49 1.50 1.51 1.52 1.53
Mid-day Meal 1.54 1.55 1.56 1.57 1.58 1.59 1.60
Evening Meal 1.61 1.62 1.63 1.64 1.65 1.66 1.67
Before you eotered the Army, which meals did you usually eat? Place a check (v) in the box for each meal that you typically ate. If you ate "brunch" on Saturdays or Sundays, consider it to be a mid-day meal.
Mon. Tues. Wed. Thurs. Fri. Sat. Sun.
Breakfast 1.68 1.69 1.70 1.71 1.72 1.73 1.74
Mid-day Meal 1.75 1.76 1.77 1.78 1.79 1.80 2.06
Evening Mea I 2.07 2.08 2.09 2.10 2.11 2.12 2.13
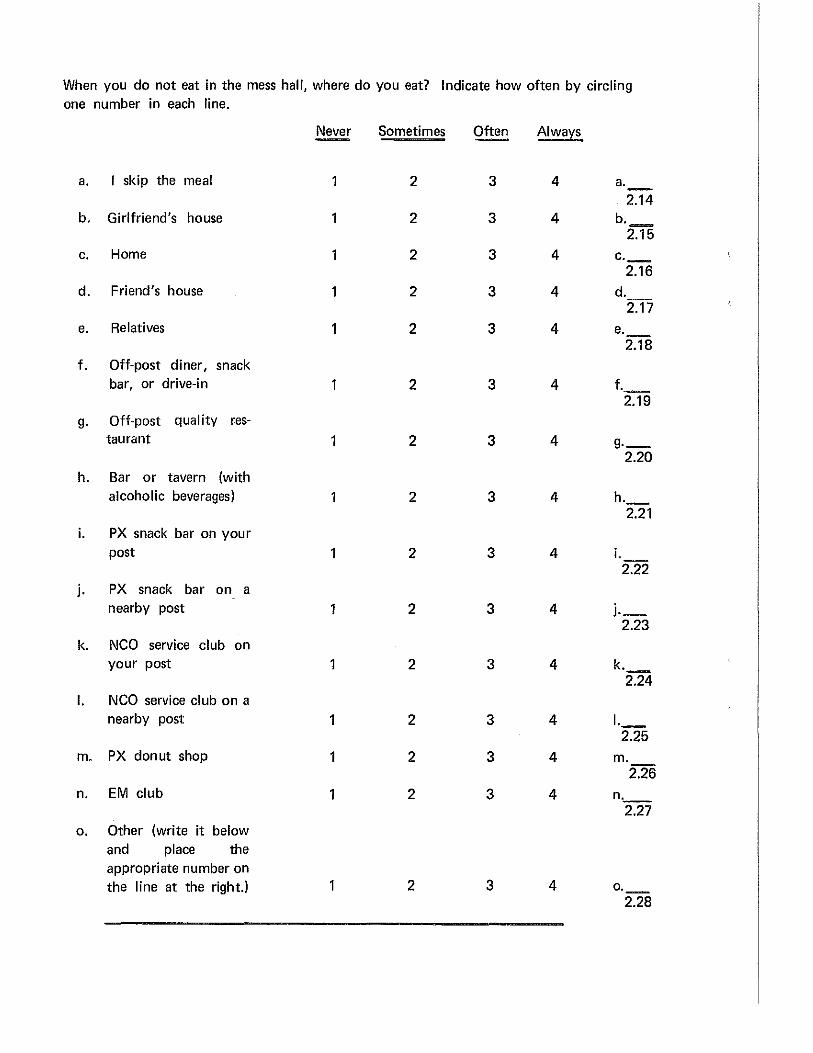
When you do not eat in the mess hall, where do you eat? Indicate how often by circling one number in each line.
Never Sometimes Often Always
a. I skip the meal 1 2 3 4 a. -2.14 b. Girlfriend's house 1 2 3 4 b. m c. Home 1 2 3 4 c._
2.16 d. Friend's house 1 2 3 4 d.
2.17 e. Relatives 1 2 3 4 e.
2.18 f. Off-post diner, snack
bar, or drive-in 1 2 3 4 f. 2.19
g. Off-post quality r.es-tau rant 1 2 3 4 g._
2.20 h. Bar or tavern (with
alcoholic beverages) 1 2 3 4 h._ 2.21
i. PX snack bar on your post 1 2 3 4 i.
2.22 j. PX snack bar on a
nearby post 1 2 3 4 j._ 2.23
k. NCO service club on your post 1 2 3 4 k.
2.24 I. NCO service club on a
nearby post 1 2 3 4 1._ 2.25
m. PX donut shop 1 2 3 4 m. 2.26
n. EM club 1 2 3 4 n. __ 2.27
o. Other (write it below and place the appropriate number on the line at the right.) 1 2 3 4 0.
2.28

Consider the normal meals that you are served at your mess hall (excluding the short order) during the weekdays (Monday thru Friday). Tell us your opinion of the variety of these meals from day to day. Circle the appropriate number for:
a. Breakfast:
1 2 3 4 5 6 7 a. No About Too much 2.29
variety right variety
b. Mid-day Meal:
2 3 4 5 6 7 b. No About Too much 2.30
variety right variety
c. Evening Meal:
1 2 3 4 5 6 7 c. No About Too much 2.31
variety right variety
Now consider only the normal meals you are served at your mess hall (excluding the short order) for a typical weekend (Saturday and Sunday). Tell us your opinion of the variety of these meals from weekend to weekend. Circle the appropriate number for:
a. Breakfast:
1 2 3 4 5 6 7 a. -No About Too much 2.32
variety right variety
b. Mid-day Meal:
2 3 4 5 6 7 b. --No About Too much 2.33
variety right variety
c. Evening Meal:
1 2 3 4 5 6 7 c. No About Too much 2.34
variety right variety
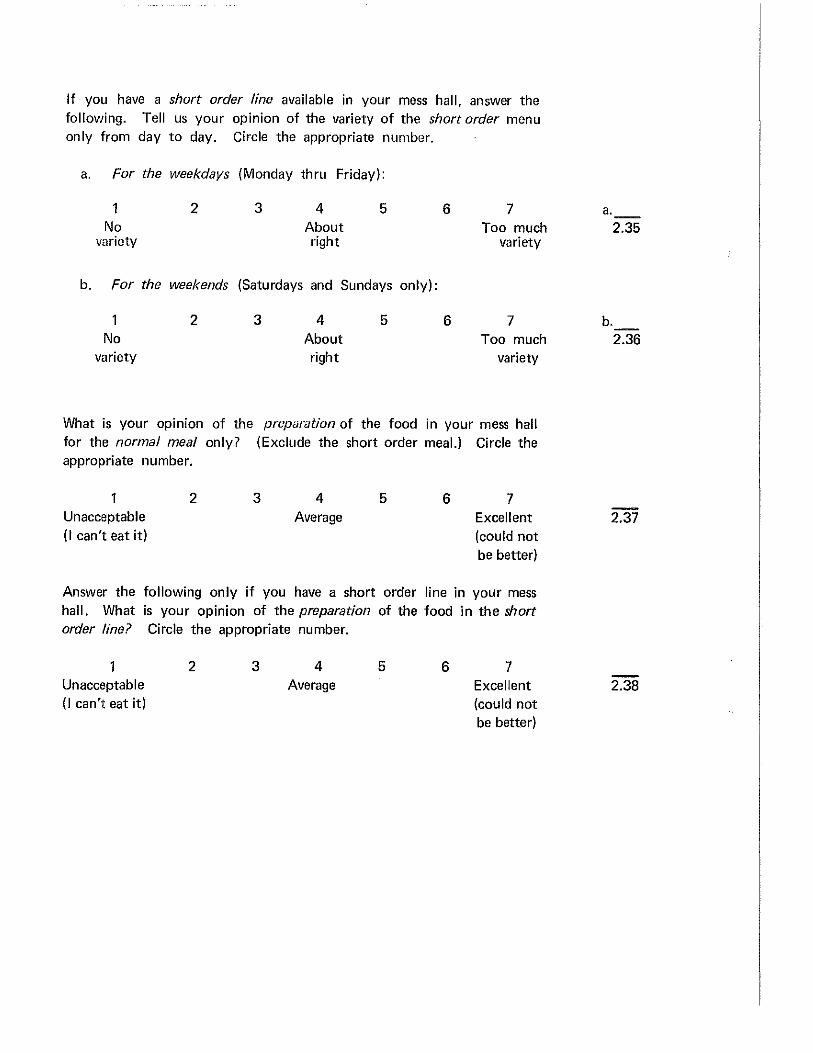
If you have a short order line available in your mess hall, answer the following. Tell us your opinion of the variety of the short order menu only from day to day. Circle the appropriate number.
a. For the weekdays (Monday thru Friday):
1 2 3 4 5 6 7 No About Too much
variety right variety
b. For the weekends (Saturdays and Sundays only):
2 3 4 5 6 7 No About Too much
variety right variety
What is your op1mon of the preparation of the food in your mess hall for the normal meal only? (Exclude the short order meal.) Circle the appropriate number.
1 Unacceptable (I can't eat it)
2 3 4 Average
5 6 7 Excellent (could not be better)
Answer the following only if you have a short order line in your mess hall. What is your opinion of the preparation of the food in the short order line? Circle the appropriate number.
1 Unacceptable (I can't eat it)
2 3 4 Average
5 6 7 Excellent (could not be better)
a. 2.35
b. 2.36
2.37
2.38

Is the food in your mess hall ever: (Circle one number in each line).
Never Sometimes- Often Alway~
a. Overcooked 1 2 3 4 a._ 2.39
b. Undercooked 1 2 3 4 b._ 2.40
c. Cold 1 2 3 4 c._ 2.41
d. Tasteless or bland 1 2 3 4 d._ 2.42
e. Burned 2 3 4 e. 2.43
f. Dried out 1 2 3 4 f._ 2.44
g. Greasy 1 2 3 4 g._ 2.45
h. Tough 1 2 3 4 h._ 2.46
i. Too spicy 1 2 3 4 i. 2.47
j. Raw 2 3 4 j._ 2.48
k. Still frozen 1 2 3 4 k._ 2.49
I. Too salty 1 2 3 4 1._ 2.50
What is your opmton of the quality of the food itself, that is, aside from the
preparation. Circle the number of your answer.
1 2 3 4 5 6 7 2.51 Unacceptable Average Excellent
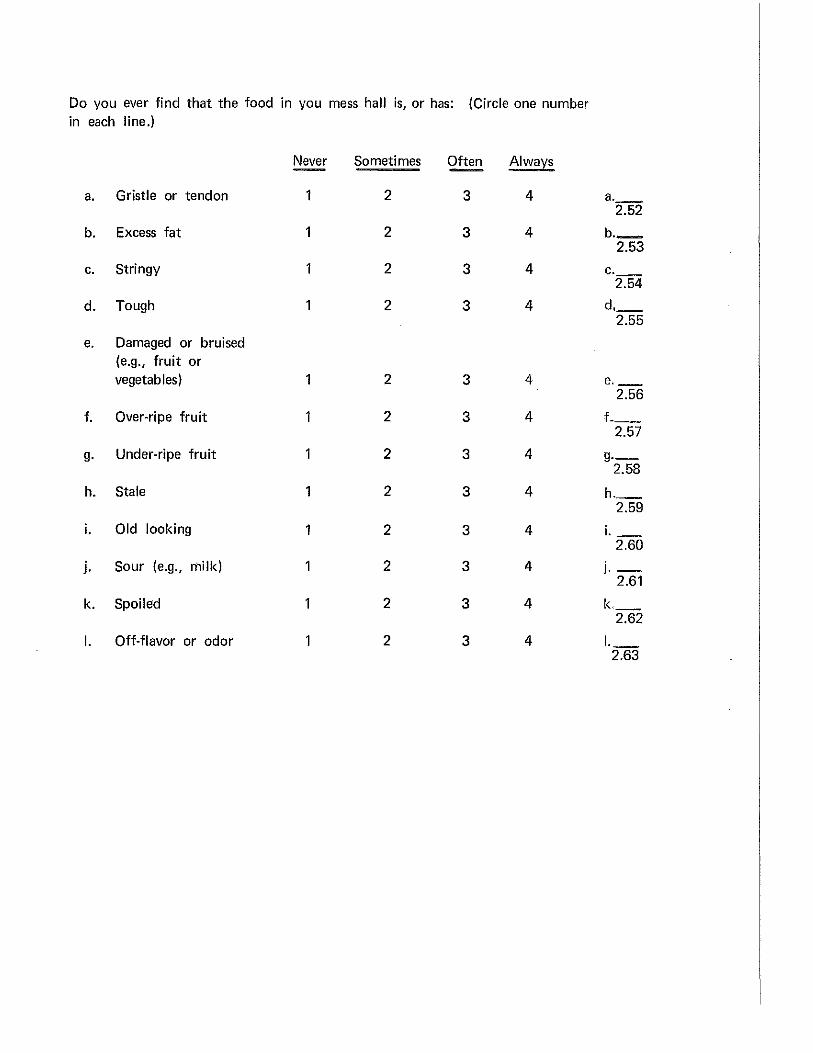
Do you ever find that the food in you mess hall is, or has: (Circle one number in each line.)
Never Sometimes Often Always
a. Gristle or tendon 1 2 3 4 a. __ 2.52
b. Excess fat 1 2 3 4 b._ 2.53
c. Stringy 1 2 3 4 c._ 2.54
d. Tough 1 2 3 4 d,_ 2.55
e. Damaged or bruised (e.g., fruit or vegetables) 1 2 3 4 e._
2.56
f. Over-ripe fruit 1 2 3 4 *--2.57
g. Under-ripe fruit 1 2 3 4 g._ 2.58
h. Stale 1 2 3 4 h._ 2.59
i. Old looking 1 2 3 4 i. 2.60
j. Sour (e.g., milk) 1 2 3 4 j._ 2.61
k. Spoiled 1 2 3 4 lc_ 2.62
I. Off-flavor or odor 2 3 4 1._ 2.63

Answer the following questions for the normal meal only. Exclude the short order meal. Circle the number of your answer.
a. What is your opinion of the amount of meat served:
1 2 3 5 6 7 a. Too 1;ttle
4 About
right
Too much 2.64
b. What is your opinion of the amount of vegetables served:
1 2. 3 4 5 6 7 b._ Too little About Too much 2.65
right
c. What is your opinion of the amount of potatoes served:
1 2 3 5 6 7 c._ Too little
4 About
right
Too much 2.66
Do you ever leave your mess hall hungry? Circle the number of your answer.
1. Never 2. Sometimes 3. Often 4. Always
Do you ever skip a meal at your mess hall because you are not hungry? Circle the number of your answer.
1. Never 2. Sometimes
3. Often 4. Always
2.67
2.68

Do you ever skip a meal at your mess hall because you think you are gaining too much weight? Circle the number of your answer.
1. Never 2. Sometimes 3. Often 4. Always
Do you serve yourself or do the mess hall personnel serve you the following items? Circle the letter of the items which you serve yourself and place the number "1" for those items on the corresponding line to the right.
a. Meat item
b. Potatoes
c. Vegetables
d. Salad
e. Dessert
f. Beverage
If you had your choice, which of the following items would you prefer to serve yourself? Circle the letter of those items which you would prefer to serve yourself and place the number "1" for those items on the corresponding line to the right.
a. Meat item
b. Potatoes
c. Vegetables
d. Salad
e. Dessert
f. Beverage
2.69
a. 2.70
b._ 2.71
c._ 2.72
d._ 2.73
e. __
2.74 f. __
2.75
a. 2.76
b. 2.77
c. __
2.78
d. 2.79
e. __
2.80
f._ 3.06

Do you ever not eat or throw away any of the food which you are served
in your mess hall? Circle one number for each meal item below:
~ Sometimes Often Always
a. Meat item 1 2 3 4 a. __
3.07
b. Potatoes 1 2 3 4 b. 3.08
c. Vegetables 2 3 4 c. 3.09
d. Salad 1 2 3 4 d._ 3.10
e. Dessert 1 2 3 4 e._ 3.11
f. Beverage 2 3 4 f._ 3.12
If you do throw food away or not eat any of the food, tell us how much
of each item. Circle one number for each meal item below:
Amount not eaten or thrown away
None A little A lot All
a. Meat item 1 2 3 4 a._ 3.13
b. Potatoes 2 3 4 b._ 3.14
c. Vegetables 2 3 4 c, __
3.15
d. Salad 2 3 4 d._ 3.16
e. Dessert 2 3 4 e. __ 3.17
f. Beverage 2 3 4 f._ 3.18
What is your opinion of the ability of the cooks in your mess hall? Circle
the appropriate number.
1 2 3 4 5 6 7
Very poor Average Excellent 3.19

Do you think the cooks in your mess hall are doing their job to the best of their ability? Circle the appropriate number.
No, definitely not
2 3 4 5 6 7
Yes, very much so
Do you consider the sanitary conditions in the dining room of your mess hall to be satisfactory or unsatisfactory? Circle the number of your answer.
1. Satisfactory 2. Unsatisfactory
Do you consider the sanitary conditions of the kitchen area of your mess hall be be satisfactory or unsatisfactory? Circle the number of your answer.
1. Satisfactory 2 .. Unsatisfactory
Do you consider the sanitary conditions of the outside of your mess hall to be satisfactory or unsatisfactory? Circle the number of your answer.
1. Satisfactory 2. l:Jnsatisfactory
Do you ever find the following in your mess hall? Circle one number in each line.
Never Sometimes Often Always
a. Dirty silverware 2 3 4
b. Dirty trays 1 2 3 4
c. Dirty dishes and glasses 1 2 3 4
d. Dirty floors 1 2 3 4
e. Dirty tables and chairs 2 3 4
f. Dirty dispensing devices 1 2 3 4
3.20
3.21
3.22
3.23
a._ 3.24
b._ 3.25
c._ 3.26
d~ 3.27
e._ 3.28
f.-3.29

Do the cooks in your mess hall have a clean and neat appearance? Circle the number of your answer.
1. Never 2. Sometimes 3. Often 4. Always
Do the KPs have a clean appearance in your mess hall? Circle the number of your answer.
1, Never 2. Sometimes 3. Often 4. Always
Circle the letter of those items below which you think are a problem in your mess hall and place the number "1" for those items on the corresponding line to the right.
a. Flies
b. Cockroaches
c. Ants
d. Mice
e. Rats
f. Dogs
g. Cats
h. Other (write it below and place a "1" on the line at the right)
3.30
3.31
a._ 3.32
b._ 3.33
c._ 3.34
d.-3.35
e._ 3.36
f._ 3.37
g._ 3.38
h._ 3.39
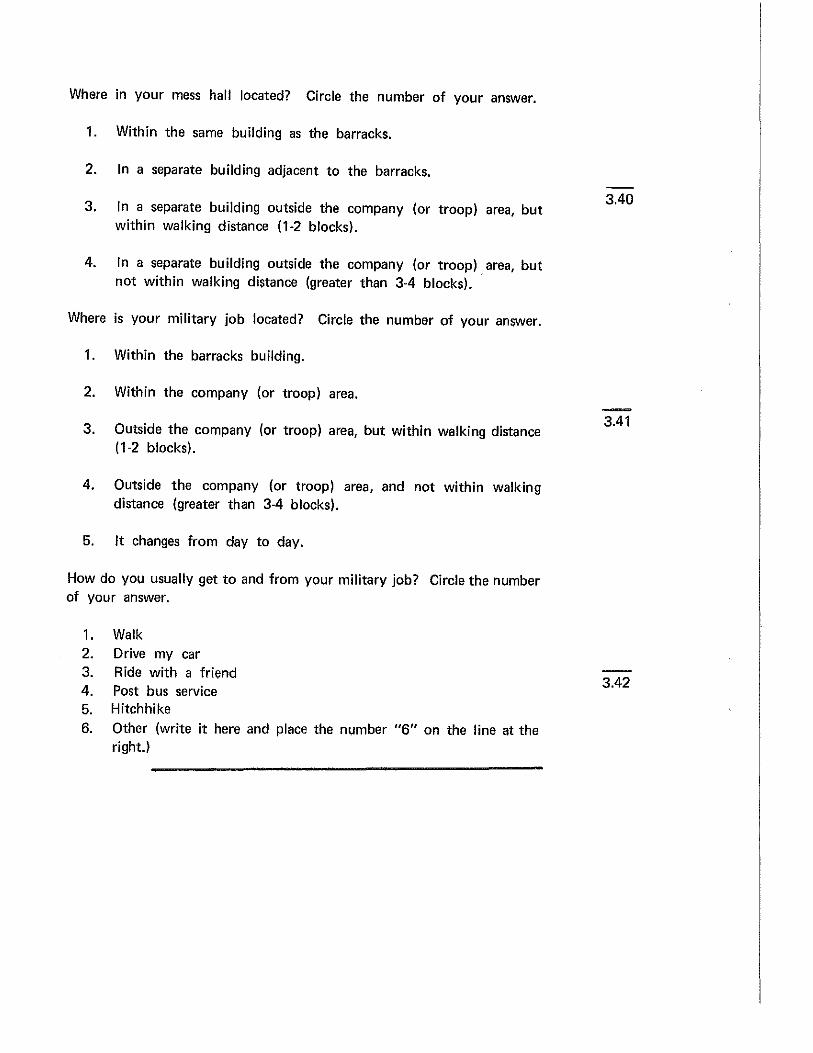
Where in your mess hall located? Circle the number of your answer.
1. Within the same building as the barracks.
2. In a separate building adjacent to the barracks.
3. In a separate building outside the company (or troop) area, but within walking distance (1-2 blocks).
4. In a separate building outside the company (or troop) area, but not within walking distance (greater than 3-4 blocks).
Where is your military job located? Circle the number of your answer.
1. Within the barracks building.
2. Within the company (or troop) area.
3. Outside the company (or troop) area, but within walking distance (1-2 blocks).
4. Outside the company (or troop) area, and not within walking distance (greater than 3-4 blocks).
5. It changes from day to day.
How do you usually get to and from your military job? Circle the number of your answer.
1. Walk 2. Drive my car 3. Ride with a friend 4. Post bus service 5. Hitchhike 6. Other (write it here and place the number "6" on the line at the
right.)
3.40
3.41
3.42

Where would you prefer your mess hall? Circle the number of your answer.
1. Within the barracks building.
2. In a separate building adjacent to the barracks.
3. In a separate building outside the company (or troop) area, but 3A3 within walking distance (2-3 blocks).
4. In a separate building outside the company (or troop) area, but not within walking distance (greater than 3-4 blocks).
Are there any groups of people who eat in the mess hall at certain times which make it unpleasant for you to eat there? Circle the number of your answer.
1. Yes 2. No
Do you avoid eating meals or skip meals when these people are eating in the mess hall? Circle the number of your answer.
1. Yes 2. No
During what hours is your mess hall open? Fill in the hours.
Weekdays: Monday to Friday
Breakfast : ----- hours to ____ hours
Mid-day meal : ____ hours to ____ hours
Evening meal :. ____ hours to ____ hours
Weekends: Saturday and Sunday
Breakfast : _____ hours to ____ hours
Mid-day meal : ----hours to ---- hours
Evening meal: hours to hours ----- ------
3.44
3.45

What hours would you like it to be open for your convenience? Fill in the hours.
Weekdays: Monday to Friday
Breakfast : ____ hours to ____ hours
Mid-day meal :_hours to ____ hours
Evening meal :_hours to ____ ,hours
Weekends: Saturday and Sunday
Breakfast : ____ ,hours to ____ ,hours
Mid-day meal : __ hours to ____ hours
Evening meal : __ hours to ____ hours
How long do you usually have to wait in line to get a meal? Circle the number of your answer.
1. never have to wait in line. 2. wait between one and five minutes 3. wait between five and ten minutes. 4. wait between ten and fifteen minutes. 5. wait longer than fifteen minutes.
Do you think the wait is too long? Circle the number of your answer.
1. Yes 2. No
How often do you eat somewhere other than your mess hall because the wait in line at your mess hall is too long? Circle the number of your answer.
1. Never 2. Sometimes 3. Often 4. Always
3.46
3.47
3.48

Once you arrive at the mess hall, how much time are you given to eat? Place a ( /) check in the appropriate box for each mea I and transfer the number in that box to the corresponding line at the right for each meal.
Less than 10-20 More than 10 minutes minutes 20 minutes
a. Breakfast 1 '
b. Mid-day meal l 2
c. Evening meal 1 z
Are you given enough time to eat breakfast? Circle the number of your answer.
1. Yes 2. No
Are you given enough time to eat the mid·day meal? Circle the number of your answer.
1. Yes 2. No
Are you given enough time to eat the evening meal? Circle the number of your answer.
1. Yes 2. No
3
3
3
a. __ 3.49
b._ 3.50
c. __ 3.51
3.52
3.53
3.54
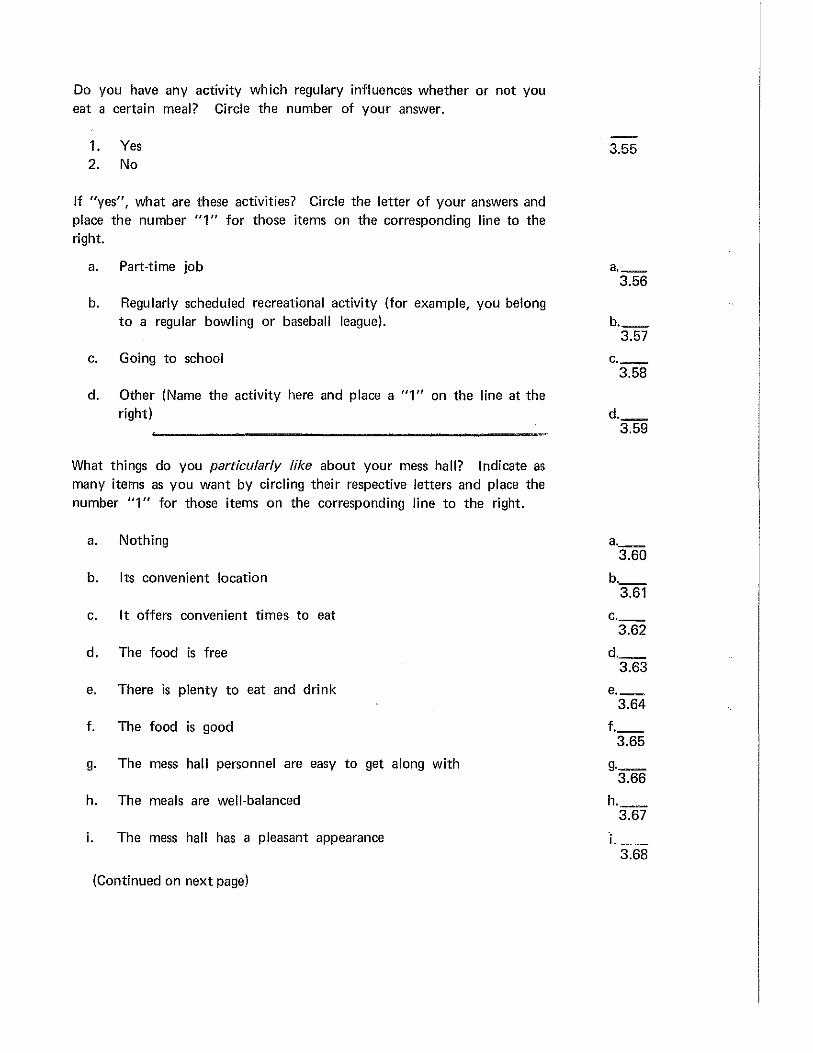
Do you have any activity which regulary influences whether or not you eat a certain meal? Circle the number of your answer.
1. Yes 2. No
If "yes", what are these activities? Circle the letter of your answers and place the number "1" for those items on the corresponding line to the right.
a. Part-time job
b. Regularly scheduled recreational activity (for example, you belong to a regular bowling or baseball league).
c. Going to school
d. Other (Name the activity here and place a "1" on the line at the right)
What things do you particularly like about your mess hall? Indicate as many items as you want by circling their respective letters and place the number 'T' for those items on the corresponding line to the right.
a. Nothing
b. Its convenient location
c. It offers convenient times to eat
d. The food is free
e. There is plenty to eat and drink
f. The food is good
g. The mess hall personnel are easy to get along with
h. The meals are well-balanced
i. The mess hall has a pleasant appearance
(Continued on next page)
3.55
a. __ 3.56
b._ 3.57
c._ 3.58
d._ 3.59
a.~-3.60
b._ 3.61
c. __ 3.62
d._ 3.63
e._ 3.64
f._ 3.65
g._ 3.66
h. 3.67
i.- ·-3.68
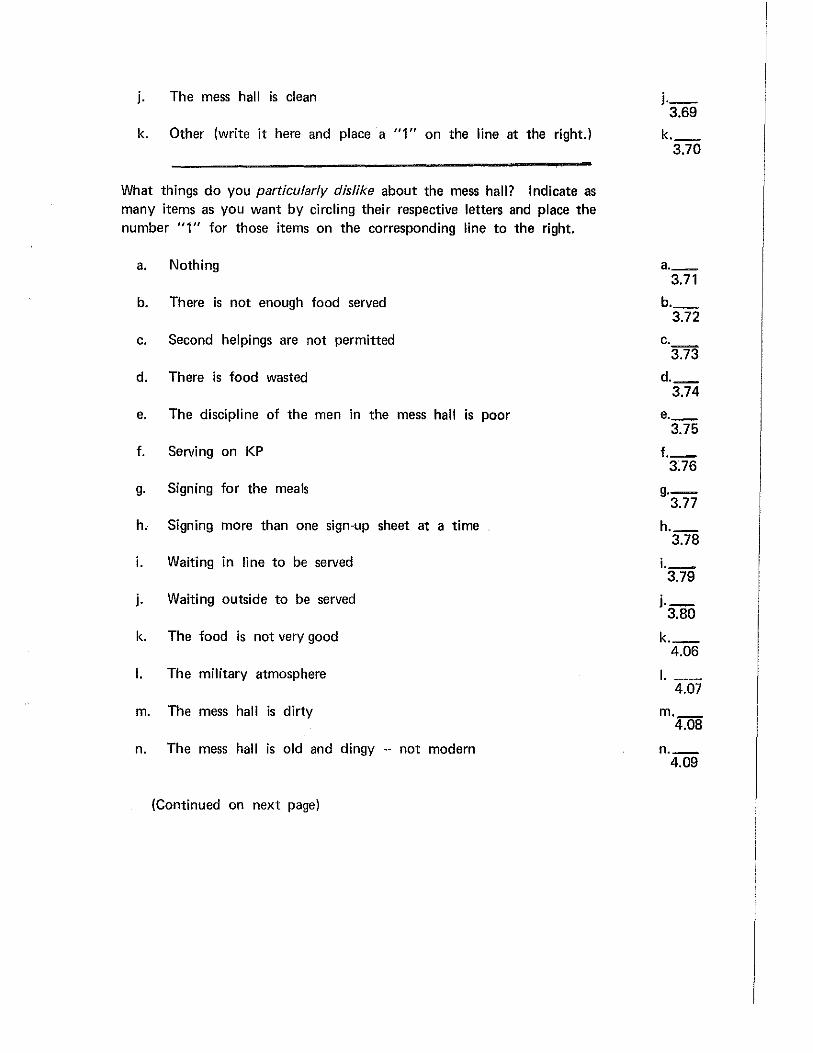
j. The mess hall is clean
k. Other (write it here and place a "1" on the line at the right.)
What things do you particularly dislike about the mess hall? Indicate as many items as you want by circling their respective letters and place the number "1" for those items on the corresponding line to the right.
a. Nothing
b. There is not enough food served
c. Second helpings are not permitted
d. There is food wasted
e. The discipline of the men in the mess hall is poor
f. Serving on KP
g. Signing for the meals
h. Signing more than one sign-up sheet at a time
i. Waiting in line to be served
j. Waiting outside to be served
k. The food is not very good
I. The military atmosphere
m. The mess hall is dirty
n. The mess hall is old and dingy -- not modern
(Continued on next page)
j._ 3.69
k._ 3.70
a. __ 3.71
b._ 3.72
c. 3.73
d._ 3.74
e. __ 3.75
f._ 3~76
g,_ 3.77
h._ 3.78
i. __
3.79
j._ 3.80
k._ 4.06
I. ------4.07
m._ 4.08
n. __ 4.09
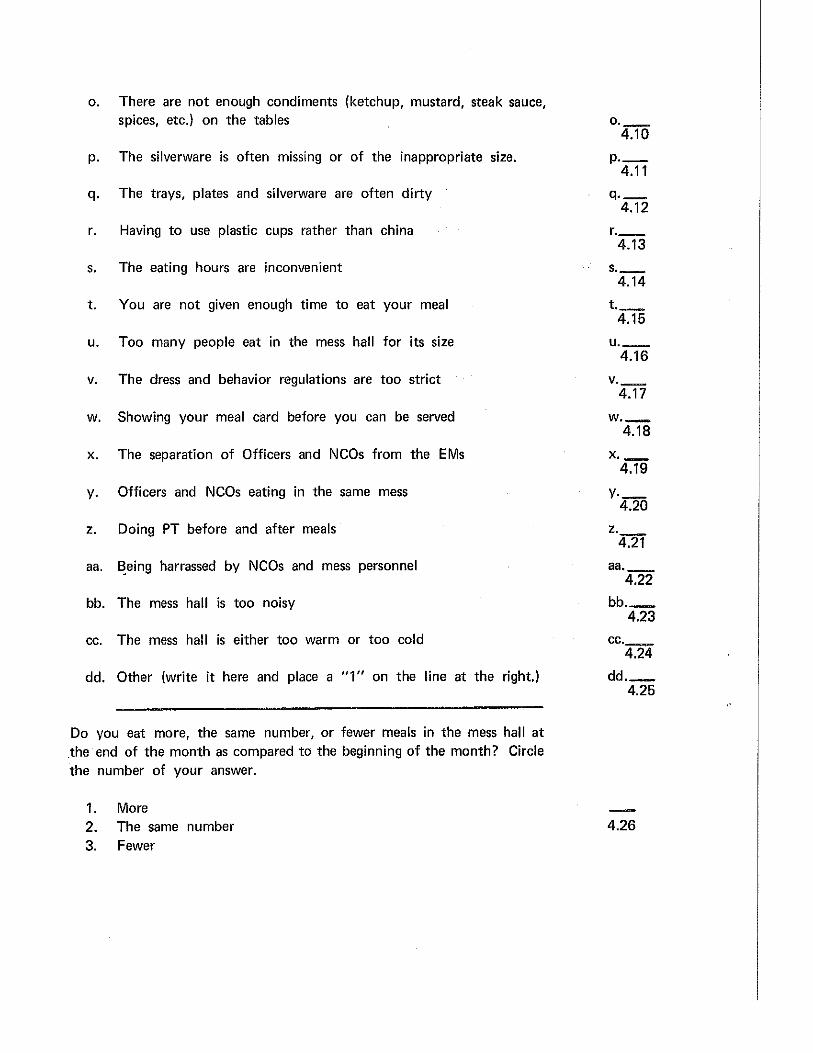
o. There are not enough condiments (ketchup, mustard, steak sauce, spices, etc.) on the tables
p. The silverware is often missing or of the inappropriate size.
q. The trays, plates and silverware are often dirty
r. Having to use plastic cups rather than china
s. The eating hours are inconvenient
t. You are not given enough time to eat your meal
u. Too many people eat in the mess hall for its size
v. The dress and behavior regulations are too strict
w. Showing your meal card before you can be served
x. The separation of Officers and NCOs from the EMs
y. Officers and NCOs eating in the same mess
z. Doing PT before and after meals
aa. ~eing harrassed by NCOs and mess personnel
bb. The mess hall is too noisy
cc. The mess hall is either too warm or too cold
dd. Other (write it here and place a "1" on the line at the right.)
Do you eat more, the same number, or fewer meals in the mess hall at .the end of the month as compared to the beginning of the month? Circle the number of your answer.
1. More 2. The same number 3. Fewer
o. __ 4.10
p._ 4.11
q._ 4.12
r. __ 4.13
s. __ 4.14
t._ 4.15
u. __ 4.16
v._ 4.17
w._ 4.18
x._ 4.19
y._ 4.20
z. __ 4.21
aa. __ 4.22
bb._ 4.23
cc._ 4.24
dd._ 4.25
4.26
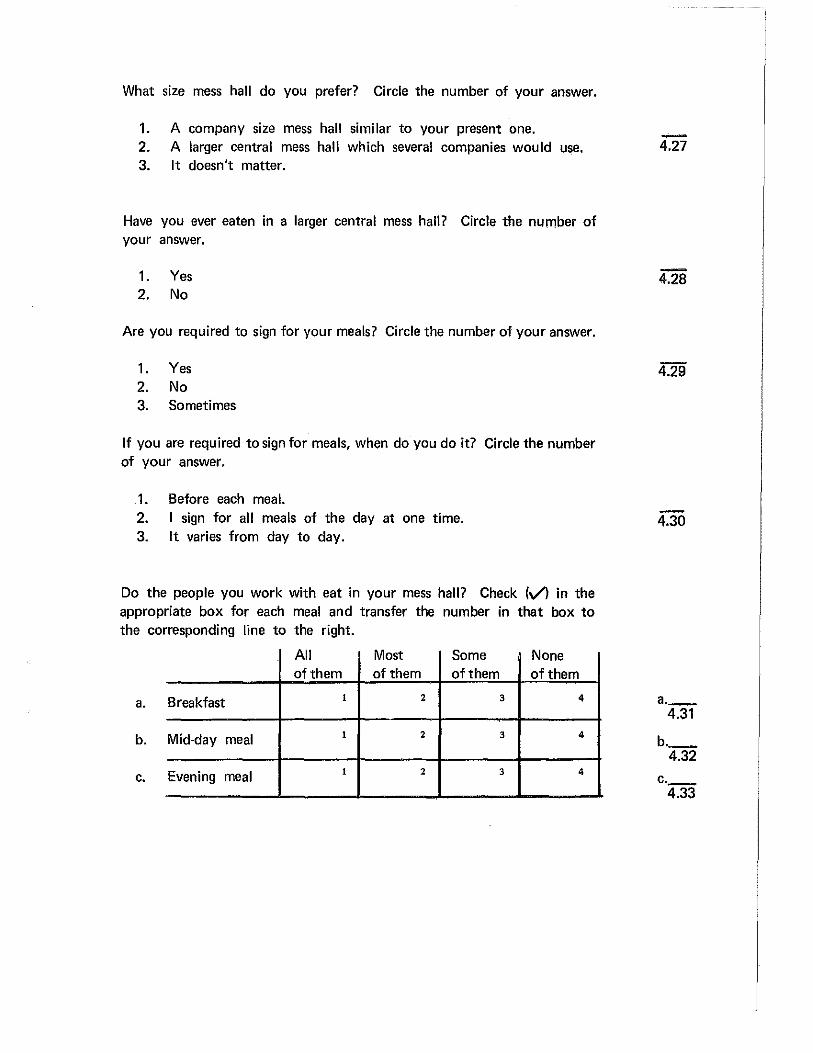
What size mess hall do you prefer? Circle the number of your answer.
1. A company size mess hall similar to your present one. 2. A larger central mess hall which several companies would use. 3. It doesn't matter.
Have you ever eaten in a larger central mess hall? Circle the number of your answer.
1. Yes 2. No
Are you required to sign for your meals? Circle the number of your answer.
1. Yes 2. No 3. Sometimes
If you are required to sign for meals, when do you do it? Circle the number of your answer.
1. Before each meal. 2. I sign for all meals of the day at one time. 3. It varies from day to day.
Do the people you work with eat in your mess hall? Check (\/) in the appropriate box for each meal and transfer the number in that box to the corresponding line to the right.
All Most Some None of them of them of them of them
a. Breakfast 1 2 3 4
b. Mid-day meal 1 2 3 4
c. Evening meal 1 2 3 4
~
4.27
4.30
a. __ 4.31
b._ 4.32
c._ 4.33
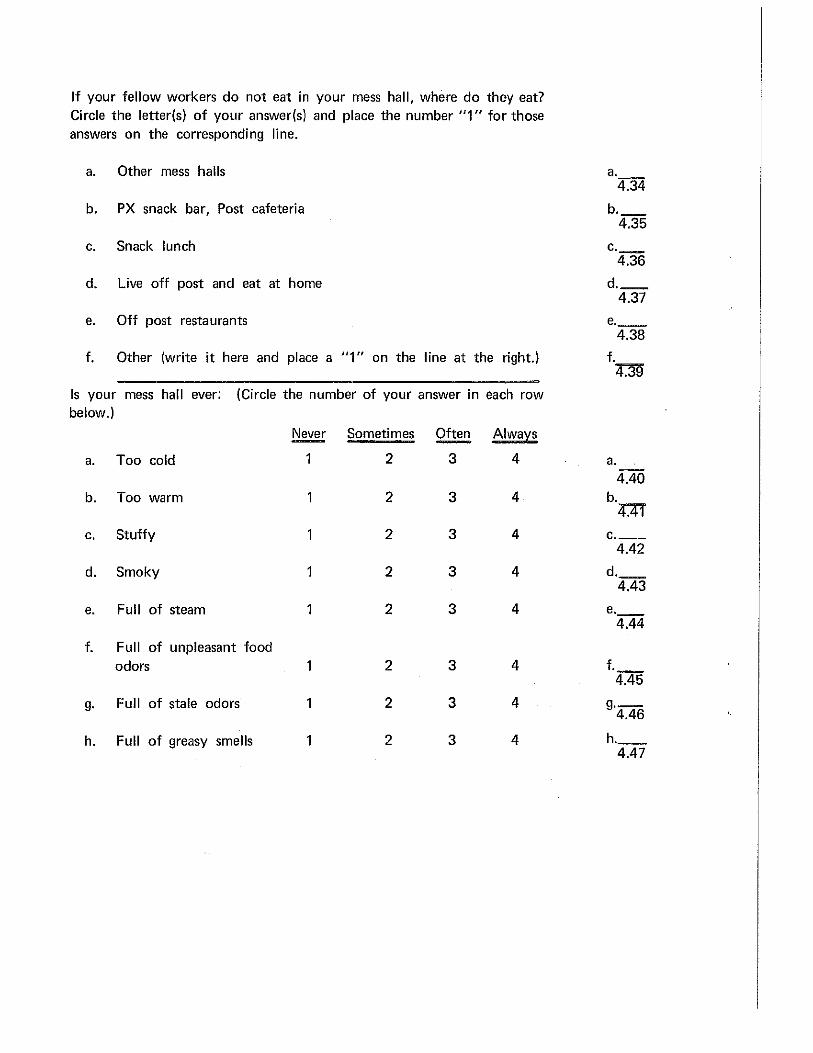
If your fellow workers do not eat in your mess hall, where do they eat? Circle the letter(s) of your answer(s) and place the number "1" for those answers on the corresponding line.
a. Other mess halls
b. PX snack bar, Post cafeteria
c. Snack lunch
d. Live off post and eat at home
e. Off post restaurants
f. Other (write it here and place a "1" on the line at the right.)
Is your mess hall ever: (Circle the number of your answer in each row below.)
a. Too cold
b. Too warm
c. Stuffy
d. Smoky
e. Full of steam
f. Full of unpleasant food odors
g. Full of stale odors
h. Full of greasy smells
Never Sometimes Q!!!:!! Always
1 2 3 4
2 3 4
2 3 4
1 2 3 4
1 2 3 4
1 2 3 4
1 2 3 4
1 2 3 4
a. 4.34
b._ 4.35
c. __ 4.36
d._ 4.37
e. __ 4.38
f. 4.39
a. 4.40
b. rn
c. __ 4.42
d._ 4.43
e. __ 4.44
f._ 4.45
9"4.46
h._ 4.47
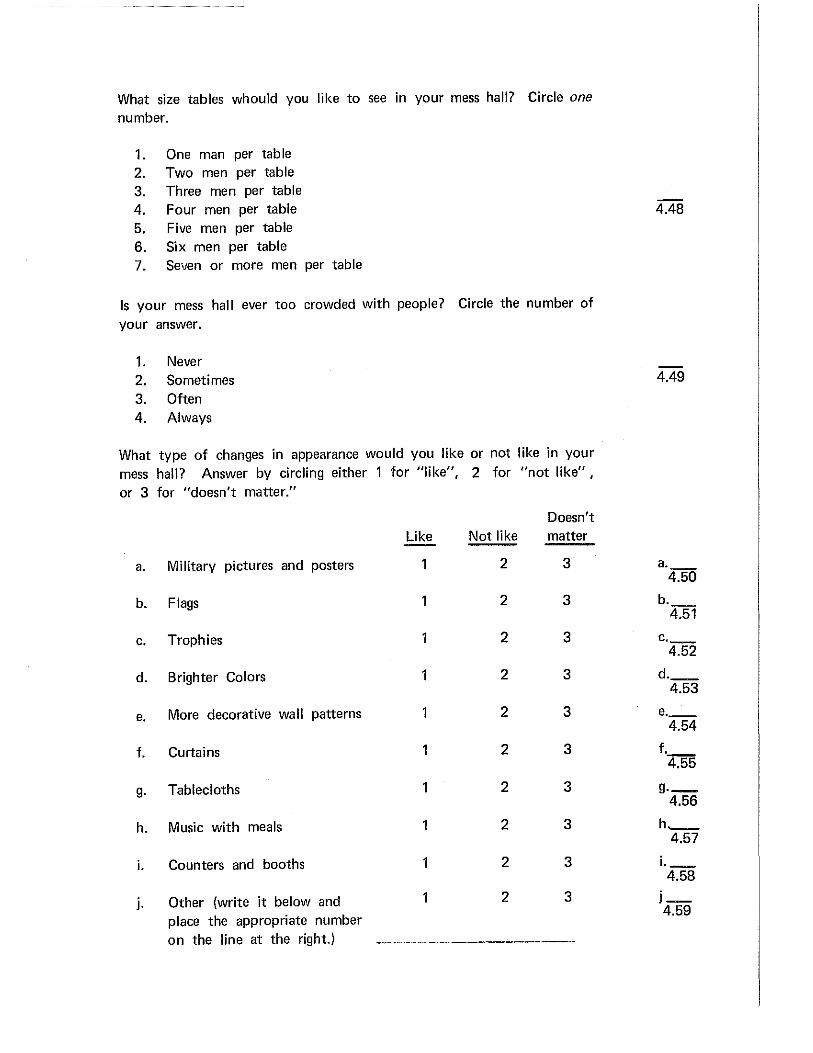
What size tables whould you like to see in your mess hall? Circle one number.
1. One man per table 2. Two men per table
3. Three men per table
4. Four men per table 5. Five men per table
6. Six men per table
7. Seven or more men per table
Is your mess hall ever too crowded with people? Circle the number of
your answer.
1. Never 2. Sometimes 3. Often 4. Always
What type of changes in appearance would you like or not like in your mess hall? Answer by circling either 1 for "like", 2 for "not like" , or 3 for "doesn't matter."
a. Military pictures and posters
b. Flags
c.
d.
e.
f.
g.
h.
i.
j.
Trophies
Brighter Colors
More decorative wall patterns
Curtains
Tablecloths
Music with meals
Counters and booths
Other (write it below and place the appropriate number on the line at the right.)
Like Not like
2
2
1 2
1 2
1 2
1 2
1 2
1 2
1 2
1 2
Doesn't matter
3
3
3
3
3
3
3
3
3
3
4.48
4.49
a. 4.50
b. 4.51
c. __
4.52
d. 4.53
e. __ 4.54
f. 4.55
g._ 4.56
h_ 4.57
i. __
4.58 j_ 4.59
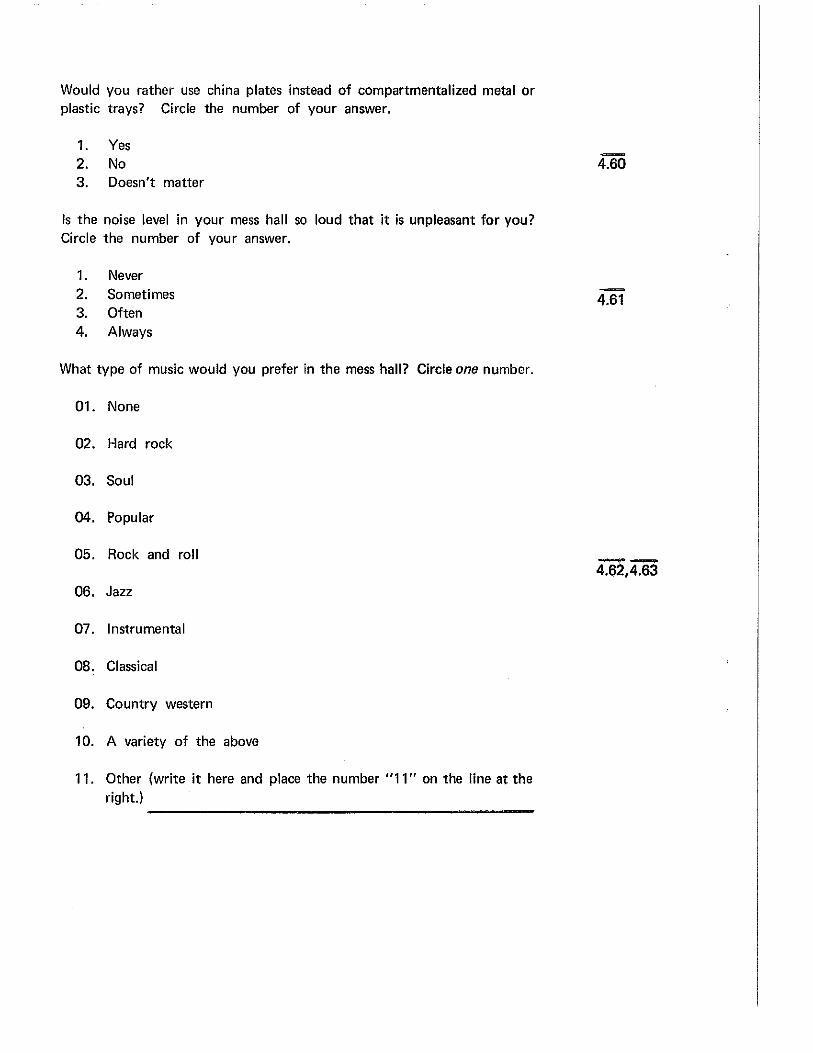
Would you rather use china plates instead of compartmentalized metal or plastic trays? Circle the number of your answer.
1. Yes 2. No 3. Doesn't matter
Is the noise level in your mess hall so loud that it is unpleasant for you? Circle the number of your answer.
1. Never 2. Sometimes 3. Often 4. Always
What type of music would you prefer in the mess hall? Circle one number.
01. None
02. Hard rock
03. Soul
04. Popular
05. Rock and roll
06. Jazz
07. Instrumental
08. Classical
09. Country western
10. A variety of the above
11. Other (write it here and place the number "11" on the line at the right.)
----------------------------------
4.60
4.61
__,.._ 4.62.4.63

Circle the letter of any rules for behavior in the mess hall, listed below, which you believe are unnecessary; and place a "1" for those rules on the corresponding line to the right.
a. Separation of NCOs and officers from EMs
b. Time limits for eating
c. Officers and NCOs cutting in line
d. Dress regulations
e. No smoking
f. Calling "at ease" when officers enter
g. Signing for meals
h. Other (write it here and place a "1" on the line at the right.)
Circle the letter of any rules for behavior listed below which you would like to see instituted or enforced in your mess hall, and place the number "1" for those rules on the corresponding line to the right.
a. Stricter dress regulations
b. No smoking for cooks and KPs
c. No shouting or yelling
d. Stricter behavior regulations ·· no horseplay, throwing food, etc.
e. Other (write it here and place a "1" on the line at the right.)
a. __ 4.64
b._ 4.65
c. __ 4.66
d._ 4.67
e._ 4.68
f._ 4.69
g._ 4.70
h._ 4.71
a._ 4.72
b._ 4.73
c._ 4.74
d._ 4.75
e. __ 4.76
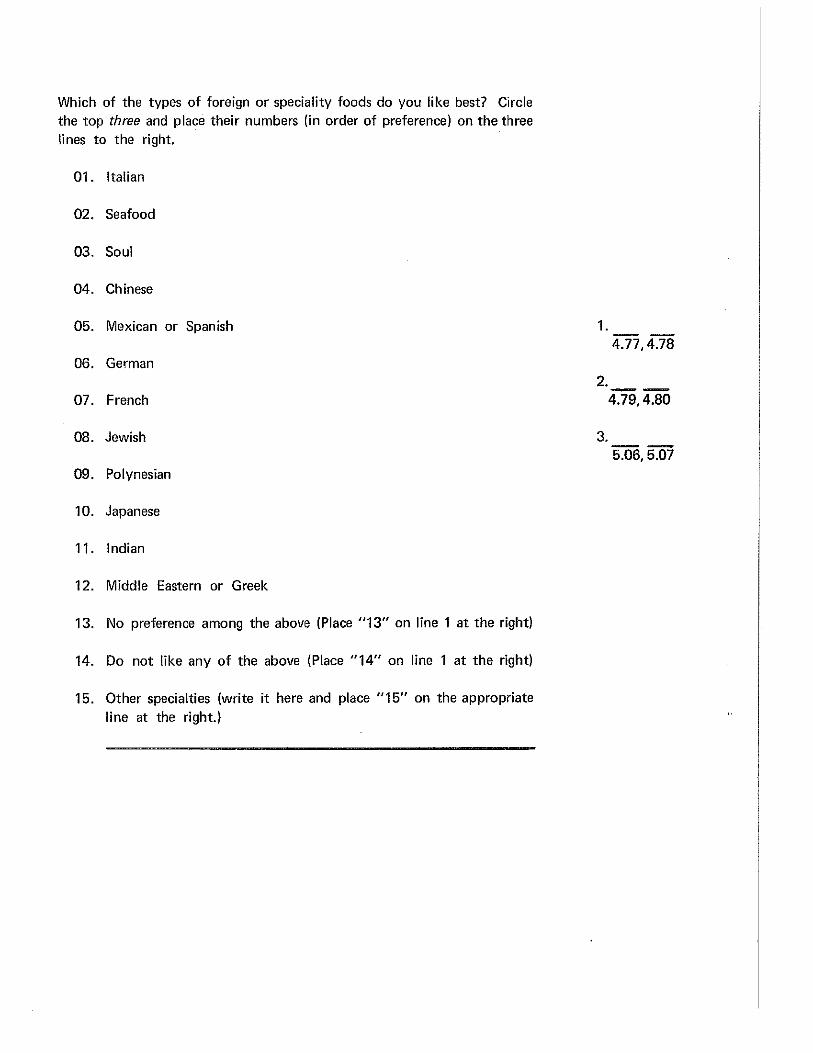
Which of the types of foreign or speciality foods do you like best? Circle the top three and place their numbers (in order of preference) on the three lines to the right.
01. Italian
02. Seafood
03. Soul
04. Chinese
05. Mexican or Spanish
06. German
07. French
08. Jewish
09. Polynesian
10. Japanese
11. Indian
12. Middle Eastern or Greek
13. No preference among the above (Place "13" on line 1 at the right)
14. Do not like any of the above (Place "14" on line 1 at the right)
15. Other specialties (write it here and place "15" on the appropriate line at the right.)
1. -~ --4.77,4.78
2. ---4.79,4.80
3. 5.06, 5.07
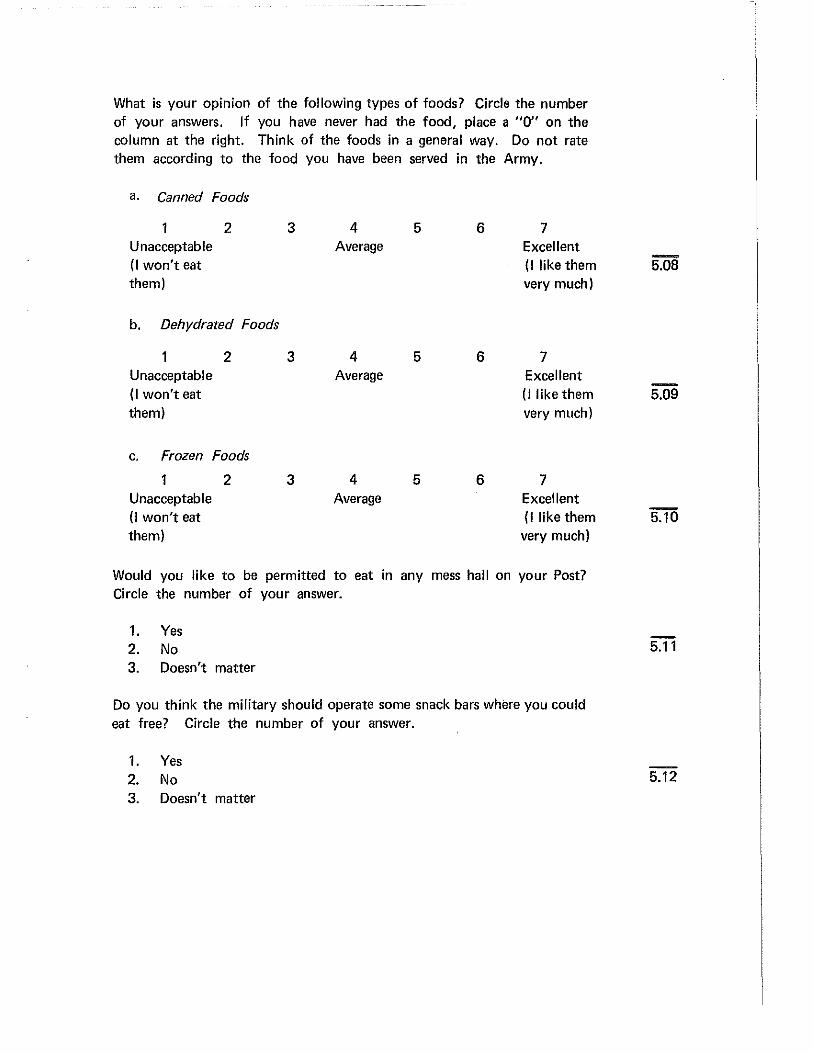
What is your opinion of the following types of foods? Circle the number of your answers. If you have never had the food, place a "0" on the column at the right. Think of the foods in a general way. Do not rate them according to the food you have been served in the Army.
a. Canned Foods
1 Unacceptable (I won't eat them)
2
b. Dehydrated Foods
Unacceptable (I won't eat them)
2
c. Frozen Foods
1 Unacceptable (I won't eat them)
2
3
3
3
4 Average
4 Average
4 Average
5 6
5 6
5 6
7 Excellent (I like them very much)
7 Excellent (I like them very much)
7 Excellent (I like them
very much)
Would you like to be permitted to eat in any mess hall on your Post? Circle the number of your answer.
1. Yes 2. No 3. Doesn't matter
Do you think the military should operate some snack bars where you could eat free? Circle the number of your answer.
1. Yes 2. No 3. Doesn't matter
5.09
5.11
5.12

If the military did operate these snack bars, what hours do you think they should be operi? Write in the hours for weekdays (Monday to Friday) and weekends (Saturday and Sunday).
Weekdays: ____ hours to ____ hours
Weekends: hours to hours
How much time do you think you should be permitted to stay in the snack bar when you go there? Circle the number of your answer.
1. As long as it takes me to get my food and eat it.
2. No more than one hour.
3. As long as you want, even if you are not eating anything.
Why did you join the Army? Circle the number of your answer.
1. Drafted 2. Enlisted to avoid draft 3. Enlisted for other reasons
Do you plan to reenlist when your present tour of duty ends? Circle the number of your answer.
1. Yes 2. No 3. Not sure
How much do you like the Army? Circle the number of your answer.
1 I dislike it itery much
2 3 4 I am neutral about it
5 6 7 I like it very much
Compared to other enlisted men that you know, do you believe the Army has treated you fairly? Circle the number of your answer.
1. Yes 2. No
Do you think the Army is using your talents and abilities effectively? Circle the number of your answer.
1. Yes 2. No
5.13
5.14
5.15
5.16
5.17
5.18

APPENDIX 2
PROCEDURE FOR ADMINISTRATION OF QUESTIONNAIRE
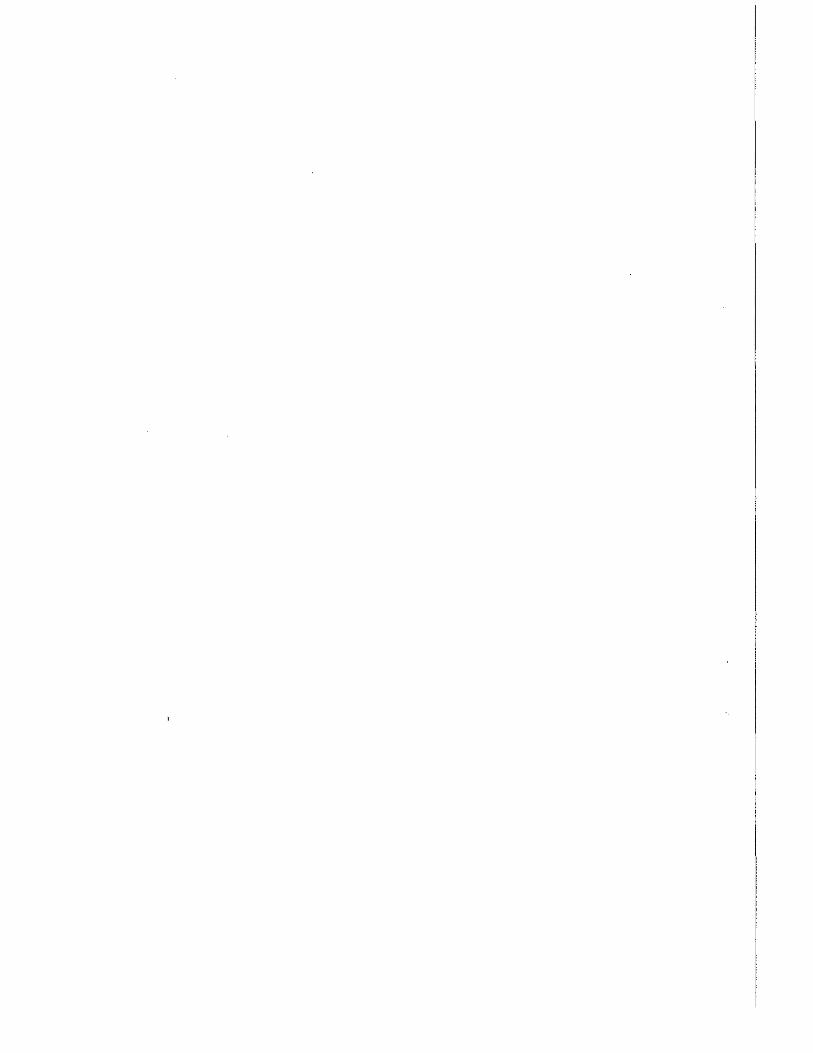

Procedure for Administration of Questionnaire
The soldiers selected were given a letter explaining the purpose of the questionnaires
several days prior to reporting for filling out the questionnaires. Soldiers reported to fill out the questionnaire at either 0730 or 1230, in groups ranging in size from 26 to 53 people.
The order and procedure for filling out the questionnaires was as follows. (I refers to the Interviewer, S refers to the Soldier).
1. I pass out the Instructions, Background Information Sheet, and Dining Facilities Questionnaire. (See Appendix 1.)
2. I read the instructions for Dining Facilities Questionnaire to the soldiers.
3. S filled out the Background Information Sheet, which assigned him a number used to identify his questionnaire.
4. The Background Information Sheet was collected.
5. S filled out the Dining Facilities Questionnaire and I checked it over when S
was finished, to insure no questions were missed.
6. I passed out the Attendance Record Sheet, the Corrected Attendance Record, the Instructions for Attendance Questionnaire, and the Proposed Changes Questionnaire.
7. I read the instructions for the Attendance Questionnaire:
8. S filled out his Corrected Attendance Sheet with the aid of his Attendance
Record Sheet and I.
9. I read instructions for the Proposed Changes Questionnaire.
10. S filled out the Proposed Changes Questionnaire, using his Corrected Attendance
Sheet as a basis for attendance. I checked it over when S was finished.

11. I passed out the Food Preference Survey.
12. S filled out the Food Preference Survey, I checked it over when S finished, and S was permitted to leave.
Steps 1-10 required approximately 1 1/2 hours to complete and Steps 11 and 12 required about 2 hours, for a total time of approximately 3 1/2 hours. The soldiers
could take coffee and toilet breaks at will during the interview session. Coffee and donuts were available at the interview room.
Two groups of soldiers filled out the questionnaire concurrently, at two different
locations. Six trained interviewers, three with each group, conducted the sessions. The
interviewers rotated from one test site to the other for different sessions, to prevent any systematic interviewer-biases from occurring. The interviewers walked around the room
while the soldiers were filling out the questionnaires, to provide assistance and to insure
that the soldiers were filling out the questionnaires properly. The entire survey took 3 1/2 days to administer.

APPENDIX 3
QUESTIONNAIRE FIGURES

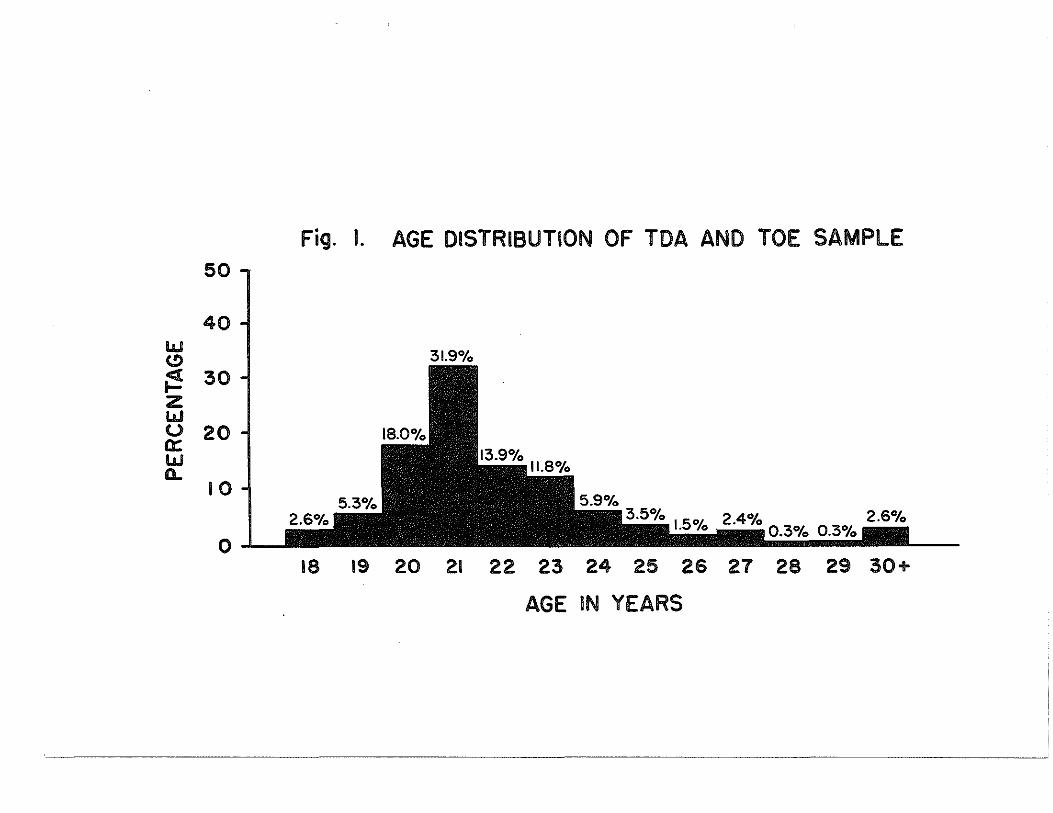
50
40 l.a.l (!)
;:! 30 z l.a.l u 20 0: l.a.l a..
10
0 _.__
Fig. I. AGE DISTRIBUTION OF TDA AND TOE SAMPLE
31.9%
2.6%
18 19 20 21 22 23 24 25 26 27 28 29 30+
AGE IN YEARS
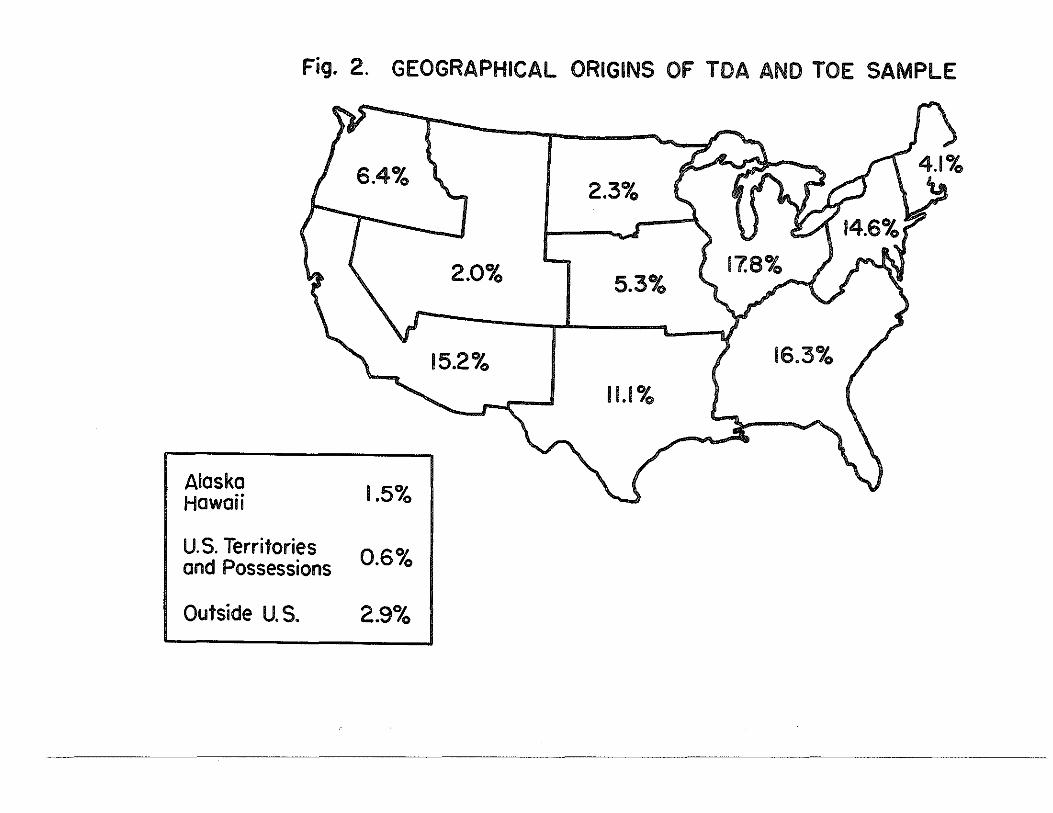
Fig. 2. GEOGRAPHICAL ORIGINS OF TOA AND TOE SAMPLE
Alaska Hawaii
U.S. Territories and Possessions
Outside U.S.
1.5%
0.6%
2.9%
2.3%
2.0% 5.3%
15.2% 16.3%
11.1%

On a farm
In the country, but not on a farm
In a town with less than 2500 people
In a town or small city with 2500-25,000 people
In a city with 25,000-100,000 people
In a large city with 100,000-1,000,000 people
In a very large city with >1,000,000 people
In a suburb of a large or very large city
0 0
-
1'\) .~ ~ 0
(II 1: ~ 0
~
c.n
en
-.1 -~ ~
00
PERCENTAGE 1'\)
0
(X)
:..... ~ 0
m ~ ~
(X)
:..... ~ 0
(II
0 ~ 0
c.n 0
.., -· 10 • (J.I •
..... ::u oc: )>:::0
l> l>l Z' oc: ....g::U om rrgl> z (J)m l>l> 3:n .," I' C) rrt:::o
0 c: z 0 0 ..,

IJ.. 0 0 z :::> Ow O:::...J (!)a.. ~~ u<l: ~(/) _jl.&.l <(0 zl-oo -z ~<( u<r =>o ~~--
. 0\ ·-IJ..
0 It)
0 v
0 (\J
alia11o::> puo.<ae
a~onpoJe aliauoo
a5a1Jo::> awos
0
:.!! 0 C\1 .
0 0 -
I.&J ....I a.. ~ <( en I.&J 0 ..... 0 z <(
<( 0 ..... 1.&.. 0 (/) ::> ~ ~ (/)
....I
~ 0::: <( ~
. 10
0' ·-1.&..
:.!! 0 f()
cD ,.._
0 00
0 .....
0 0 w 10
0 'it
0 10
39\flN3:>H3d
0 N
0
:.!! 0 f()
0
:.!! 0 10 0
0
10 J9MOP!M
.q- pa~oJodas
pa:>JOA!O
N papJDr-.1
9ifiU!S

Fig. 6. TIME -IN- SERVICE OF TDA AND TOE SAMPLE 50
40 1.&.1 33.7% <!>
~ 30 z 1.&.1 u 2.0 0::: 1.&.1 a..
10 6.5%
0 1.8%
0.0%
2-6 7-12 13-18 19-24 25-30 31-36 37-42 43-48 49-54 >54
NUMBER OF MONTHS IN THE ARMY
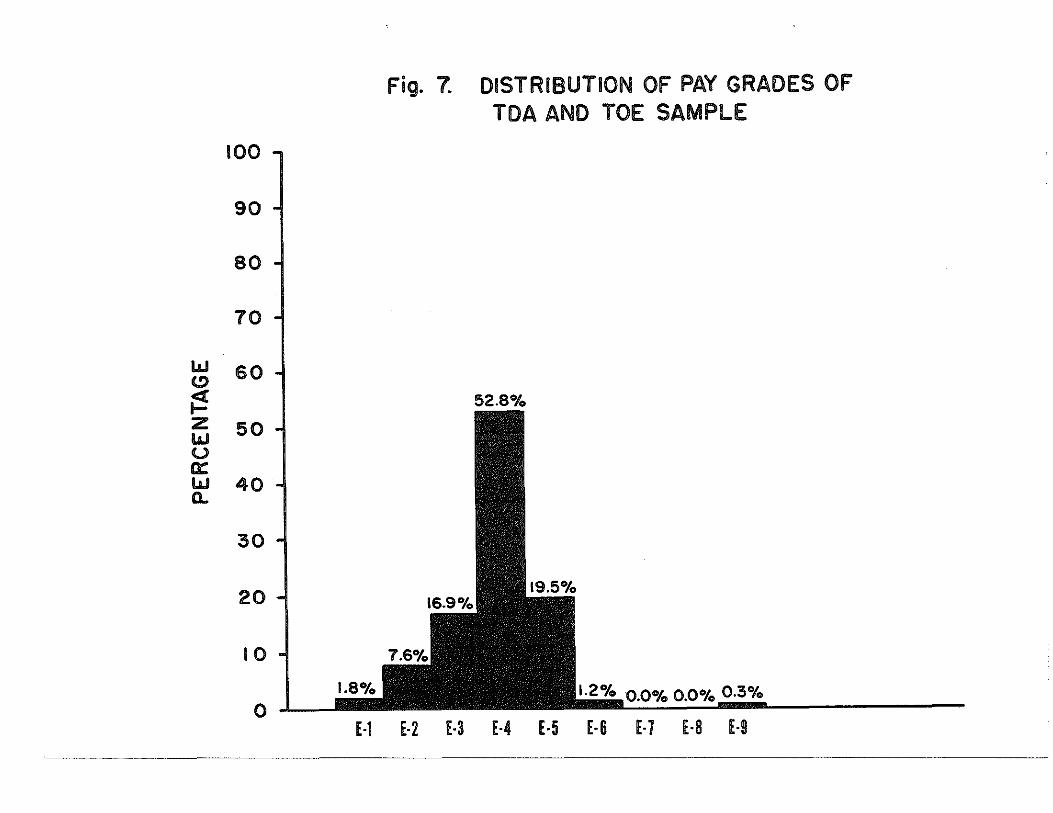
w (!)
~ z w u a:: w a..
100
90
80
70
60 I
50
40
30
20
10
1.8% 0 j_l __1111111111111111
Fig. 7. DISTRIBUTION OF PAY GRADES OF TDA AND TOE SAMPLE
52.8%
1.2% 0.0% 0.0% 0.3%
E-1 E-2 E-3 E-4 E-5 E-6 E-7 E-8 E-9
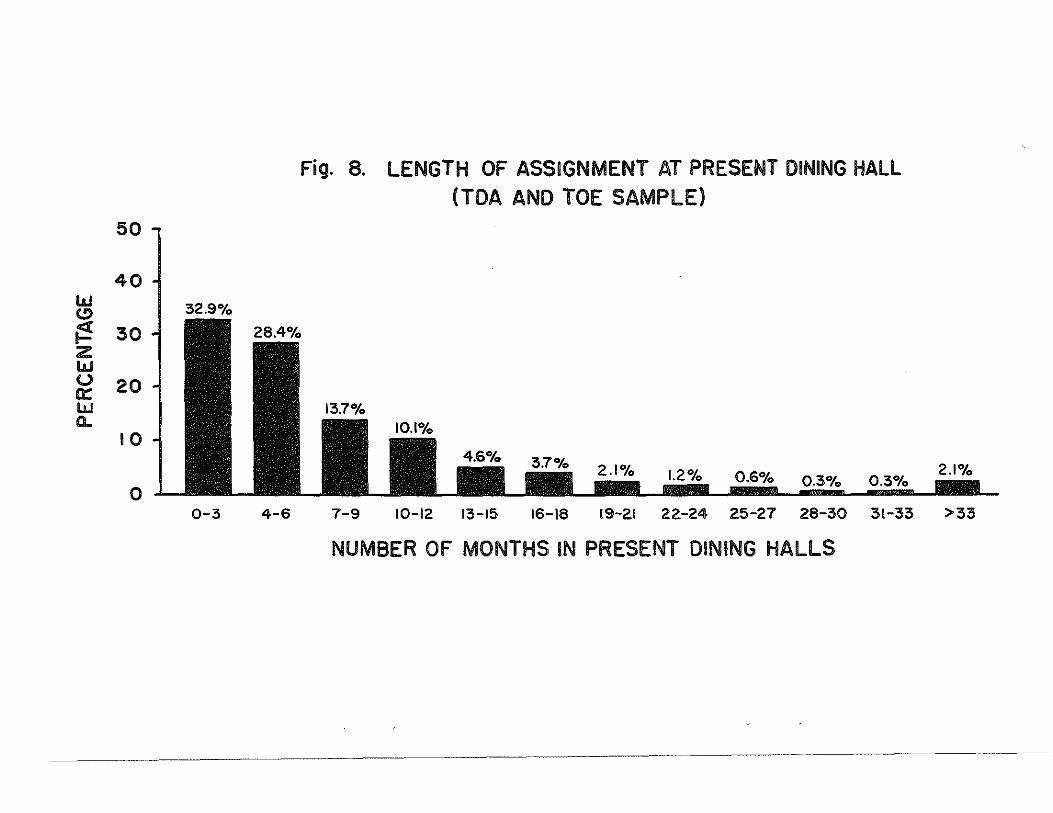
Fig. 8. LENGTH OF ASSIGNMENT AT PRESENT DINING HALL (TDA AND TOE SAMPLE)
50
40 LLI I 32.9% (!)
~ 30 z LLI u 20 0:: LLI a..
10 I 4.6% ., ""!PAl
1.2% 0.6% 0
--------···- 0.3% 0.3% 2.1%
0-3 4-6 7-9 10-12 13-15 16-18 19-21 22-24 25-27 28-30 31-33 >33
NUMBER OF MONTHS IN PRESENT DINING HALLS

APPENDIX 4
QUESTIONNAIRE TABLES
DINING FACILITIES QUESTIONNAIRE DATA SUMMARIES
The following tables contain a complete summary of the Dining Facilities Questionnaire results. The tables are presented in the order: Background Information for TDA, TOE, and BCT units; Results for TDA and TOE units; and Results for BCT units. Each table is preceded by the question from which the results were obtained.
The following guidelines should be kept in mind while utilizing the tables:
1. All numerical values in the tables are percentages, with the exception of: the number of subjects responding to the questions, and the means, standard deviations, and medians of the 7-point rating scales.
2. The line entitled: "Number of Subjects Responding", presents the number of subjects who answered the question. In many instances, this number is slightly smaller than the number of subjects who completed the questionnaire.
3. Due to rounding errors there are instances when percentages which are supposed to total 100% do not. These errors are within ± 0.1% and do not affect interpretation of the resu Its.
4. On certain questions, subjects were permitted to choose as few or as many alternatives as they desired. For these questions, the data percentages will not add to 100%. The questions are noted by footnotes in the tables. Results given are the percentages of the dining halls who answered affirmatively.

BACKGROUND DATA FOR TDA, TOE, AND BCT UNITS
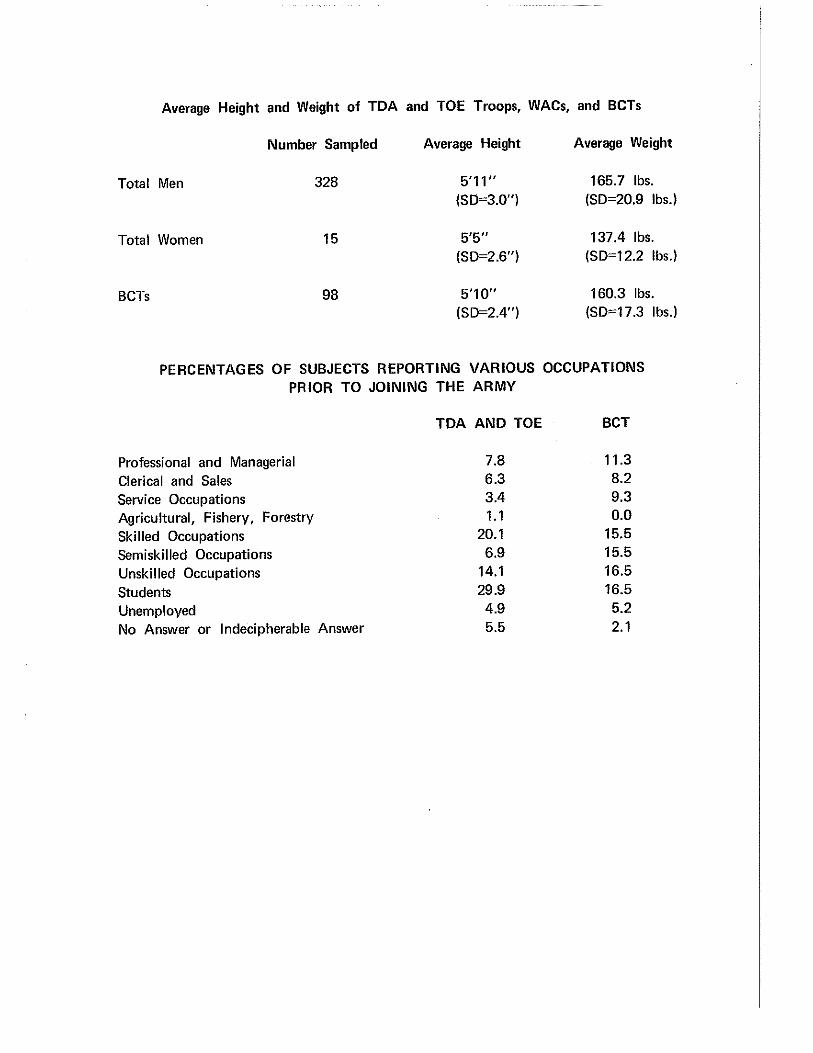
Average Height and Weight of TDA and TOE Troops, WACs, and BCTs
Number Sampled Average Height Average Weight
Total Men 328 5'11" 165.7 lbs. (SD=3.0") (SD=20.9 lbs.)
Total Women 15 5'5" 137.4 lbs. (SD=2.6") (SD=12.2 lbs.)
8CTs 98 5'1 0" 160.3 lbs. (SD=2.4") (SD=17.3 lbs.)
PERCENTAGES OF SUBJECTS REPORTING VARIOUS OCCUPATIONS PRIOR TO JOINING THE ARMY
Professional and Managerial Clerical and Sales Service Occupations Agricultural, Fishery, Forestry Skilled Occupations Semiskilled Occupations Unskilled Occupations Students Unemployed No Answer or Indecipherable Answer
TDA AND TOE BCT
7.8 6.3 3.4 1.1
20.1 6.9
14.1 29.9
4.9 5.5
11.3 8.2 9.3 0.0
15.5 15.5 16.5 16.5 5.2 2.1
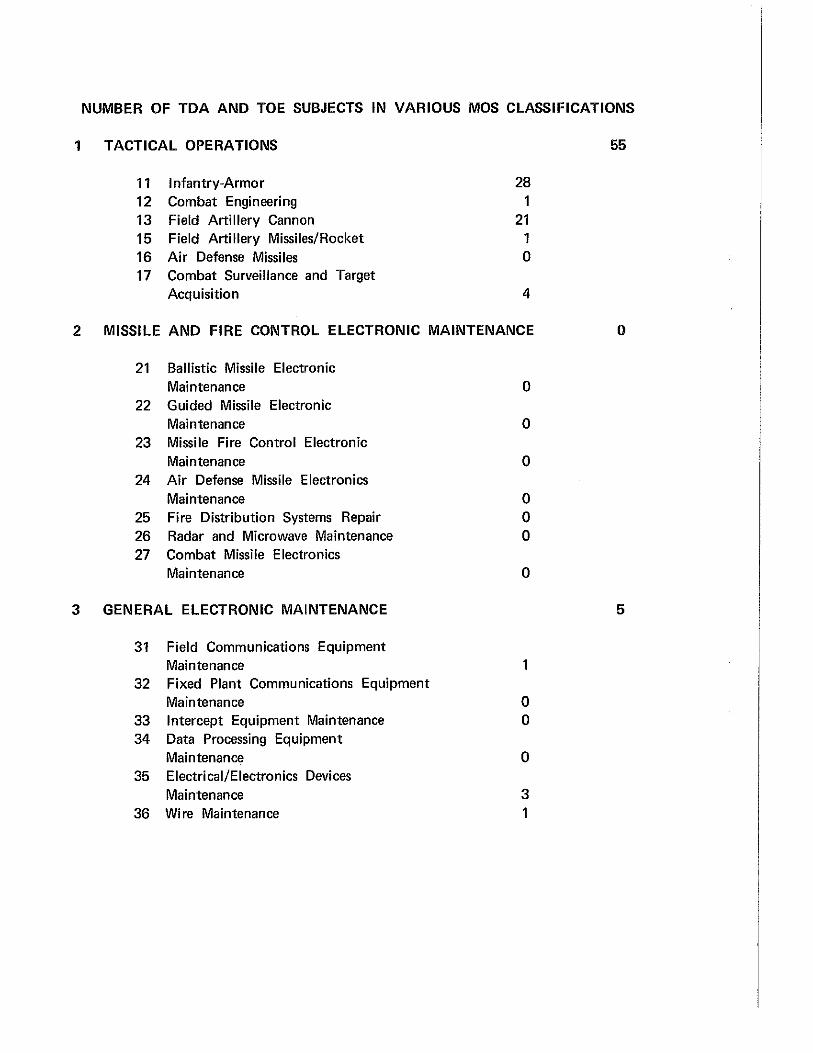
NUMBER OF TDA AND TOE SUBJECTS IN VARIOUS MOS CLASSIFICATIONS
1 TACTICAL OPERATIONS 55
11 Infantry-Armor 28 12 Combat Engineering 1 13 Field Artillery Cannon 21 15 Field Artillery Missiles/Rocket 1 16 Air Defense Missiles 0 17 Combat Surveillance and Target
Acquisition 4
2 MISSILE AND FIRE CONTROL ELECTRONIC MAINTENANCE 0
21 Ballistic Missile Electronic Maintenance 0
22 Guided Missile Electronic Maintenance 0
23 Missile Fire Control Electronic Maintenance 0
24 Air Defense Missile Electronics Maintenance 0
25 Fire Distribution Systems Repair 0 26 Radar and Microwave Maintenance 0 27 Combat Missile Electronics
Maintenance 0
3 GENERAL ELECTRONIC MAINTENANCE 5
31 Field Communications Equipment Maintenance 1
32 Fixed Plant Communications Equipment Maintenance 0
33 Intercept Equipment Maintenance 0 34 Data Processing Equipment
Maintenance 0 35 E lectri cai/Eiectronics Devices
Maintenance 3 36 Wire Maintenance 1

4 PRECISION MAINTENANCE
41 Precision Devices 42 Prosthetic Appliances 43 Textile and Leather Repair 44 Metal Working 45 Armament Maintenance 46 Missile Mechanical Maintenance
5 AUXILIARY SERVICES
51 Construction and Utilities 52 Power Production and Distribution 53 Industrial Gas Production 54 Chemical 55 Ammunition 57 General Duty
6 MOTORS
61 Marine Operations 62 Engineer Heavy Equipment Operation
and Maintenance 63 Mechanical Maintenance 64 Motor Transport 65 Railway Maintenance and Operations 67 Aircraft Maintenance 68 Aircraft Components Repair
7 CLERICAL
70A Clerk 71 Administration 72 Communications Center Operations 73 Finance 7 4 Data Processing 76 Supply
6 0 0 3 6 0
5 2 0 0 6 7
0
7 43 16 0 2 1
33 29
1 15 0
43
15
20
69
121
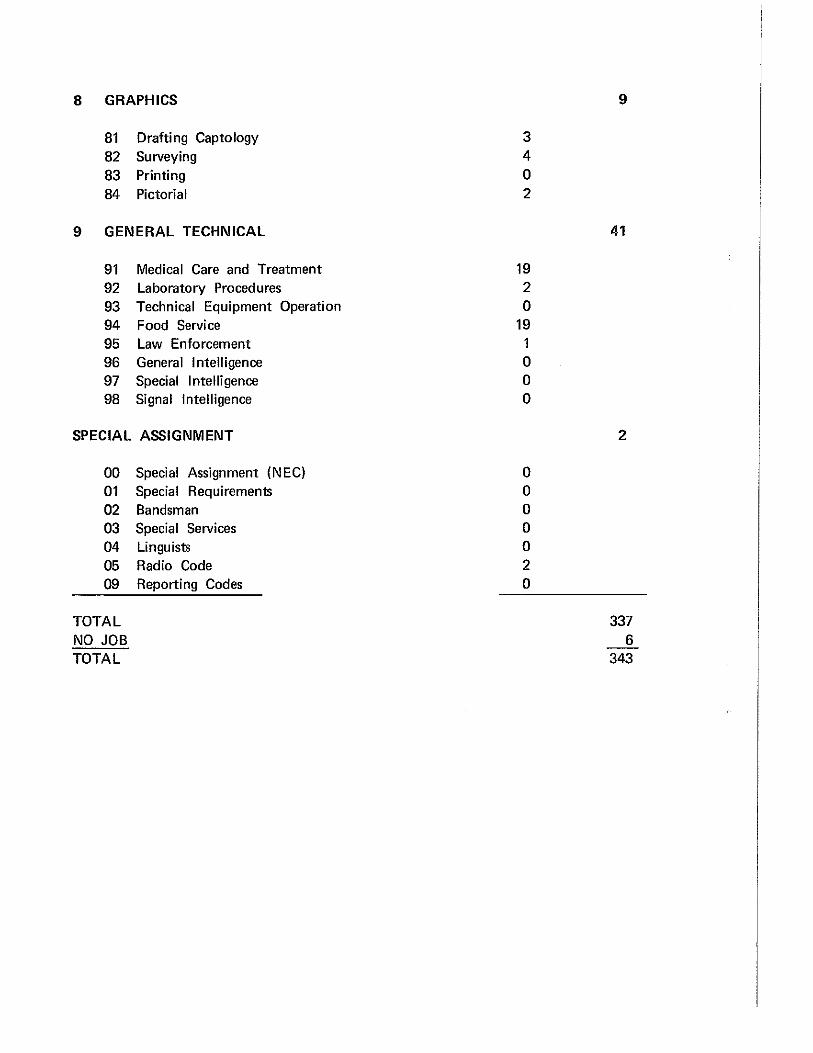
8 GRAPHICS 9
81 Drafting Captology 3 82 Surveying 4 83 Printing 0 84 Pictorial 2
9 GENERAL TECHNICAL 41
91 Medical Care and Treatment 19 92 Laboratory Procedures 2 93 Technical Equipment Operation 0 94 Food Service 19 95 Law Enforcement 1 96 General Intelligence 0 97 Special Intelligence 0 98 Signal Intelligence 0
SPECIAL ASSIGNMENT 2
00 Special Assignment (NEG) 0 01 Special Requirements 0 02 Bandsman 0 03 Special Services 0 04 Linguists 0 05 Radio Code 2 09 Reporting Codes 0
TOTAL 337 NO JOB 6 TOTAL 343

GEOGRAPHICAL DISTRIBUTION - TDA AND TOE SAMPLE'
Region Sample at Fort Lewis u.s. Population
Northwest 6.6% 3.0% Rocky Mountains 2.1% 2.4% South Central 11.5% 9.5% Southwest 15.7% 11.2% Great Plains 5.4% 5.6% North Central 2.4% 2.5% Middle West 18.4% 19.9% Southeast 16.9% 17.8% East Central 15.1% 21.8% New England 4.2% 5.8% Alaska and Hawaii 1.5% 0.5%
PERCENTAGES OF SAMPLE REPORTING THE MEALS THEY TYPICALLY ATE
During a typical week, which meals do you eat, regardless of where you eat them? Place a check in the box for each meal that you typically eat. If you have "brunch" on Saturdays and Sundays, consider it to be a midday meal.
a. BREAKFAST
Mess Hall M T w T F Mean Sat Sun Mean
A 28.1 28.1 31.2 25.0 34.4 29.4 25.0 25.0 25.0 B 48.3 58.6 41.4 51.7 48.3 49.7 27.6 34.5 31.1 c 72.6 76.5 78.4 78.4 72.6 75.7 47.1 47.1 47.1 D 56.7 46.7 56.7 56.7 50.0 53.4 30.0 36.7 33.4 E 66.7 62.5 66.7 66.7 66.7 65.9 62.5 58.3 60.4 F 60.5 65.1 60.5 65.1 62.8 62.8 44.2 48.8 46.5 G 75.0 71.4 78.6 71.4 75.0 74.3 35.7 32.1 33.9 H 82.0 87.2 92.3 89.7 87.2 87.7 51.3 51.3 51.3
76.9 84.6 84.6 82.0 78.9 81.0 59.0 51.3 55.2
MEAN 63.0 64.5 65.6 65.2 63.8 64.4 42.5 42.8 42.7
BCT's 95.6 95.6 94.4 95.6 94.4 95.1 84.4 76.7 80.6
1 Based on persons living in the continental United States and Alaska and Hawaii
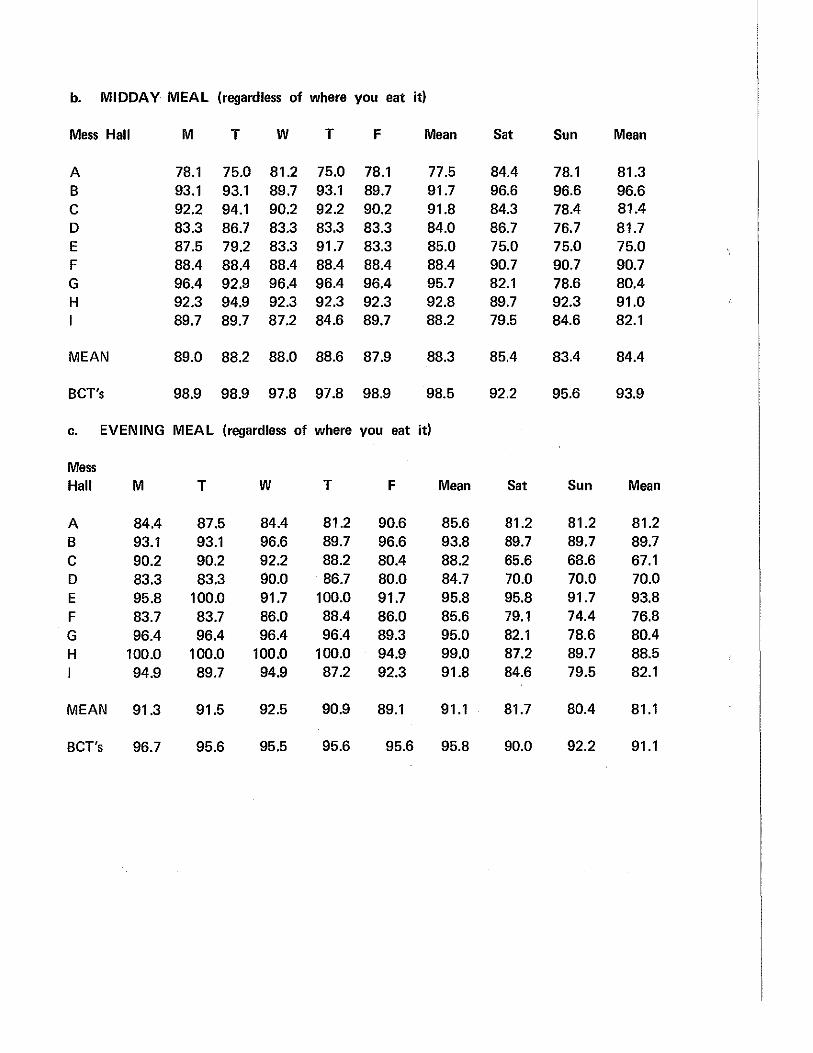
b. MIDDAY MEAL (regardless of where you eat it)
Mess Hall M T w T F Mean Sat Sun Mean
A 78.1 75.0 81.2 75.0 78.1 77.5 84.4 78.1 81.3 B 93.1 93.1 89.7 93.1 89.7 91.7 96.6 96.6 96.6 c 92.2 94.1 90.2 92.2 90.2 91.8 84.3 78.4 81.4 D 83.3 86.7 83.3 83.3 83.3 84.0 86.7 76.7 81.7 E 87.5 79.2 83.3 91.7 83.3 85.0 75.0 75.0 75.0 F 88.4 88.4 88.4 88.4 88.4 88.4 90.7 90.7 90.7 G 96.4 92.9 96.4 96.4 96.4 95.7 82.1 78.6 80.4 H 92.3 94.9 92.3 92.3 92.3 92.8 89.7 92.3 91.0
89.7 89.7 87.2 84.6 89.7 88.2 79.5 84.6 82.1
MEAN 89.0 88.2 88.0 88.6 87.9 88.3 85.4 83.4 84.4
BCT's 98.9 98.9 97.8 97.8 98.9 98.5 92.2 95.6 93.9
c. EVENING MEAL (regardless of where you eat it)
Mess Hall M T w T F Mean Sat Sun Mean
A 84.4 87.5 84.4 81.2 90.6 85.6 81.2 81.2 81.2 B 93.1 93.1 96.6 89.7 96.6 93.8 89.7 89.7 89.7 c 90.2 90.2 92.2 88.2 80.4 88.2 65.6 68.6 67.1 D 83.3 83.3 90.0 86.7 80.0 84.7 70.0 70.0 70.0 E 95.8 100.0 91.7 100.0 91.7 95.8 95.8 91.7 93.8 F 83.7 83.7 86.0 88.4 86.0 85.6 79.1 74.4 76.8 G 96.4 96.4 96.4 96.4 89.3 95.0 82.1 78.6 80.4 H 100.0 100.0 100.0 100.0 94.9 99.0 87.2 89.7 88.5
94.9 89.7 94.9 87.2 92.3 91.8 84.6 79.5 82.1
MEAN 91.3 91.5 92.5 90.9 89.1 91.1 81.7 80.4 81.1
BCT's 96.7 95.6 95.5 95.6 95.6 95.8 90.0 92.2 91.1
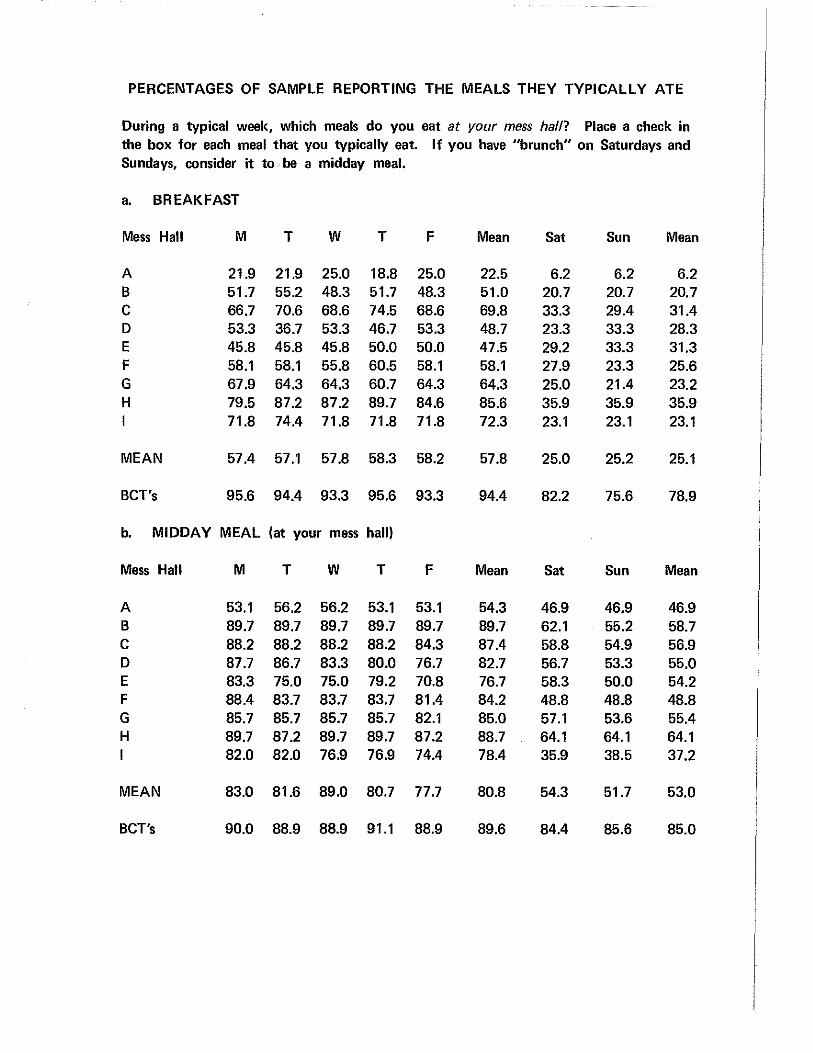
PERCENTAGES OF SAMPLE REPORTING THE MEALS THEY TYPICALLY ATE
During a typical week, which meals do you eat at your mess hall? Place a check in the box for each meal that you typically eat. If you have "brunch" on Saturdays and Sundays, consider it to be a midday meal.
a. BREAKFAST
Mess Hall M T w T F Mean Sat Sun Mean
A 21.9 21.9 25.0 18.8 25.0 22.5 6.2 6.2 6.2 8 51.7 55.2 48.3 51.7 48.3 51.0 20.7 20.7 20.7 c 66.7 70.6 68.6 74.5 68.6 69.8 33.3 29.4 31.4 D 53.3 36.7 53.3 46.7 53.3 48.7 23.3 33.3 28.3 E 45.8 45.8 45.8 50.0 50.0 47.5 29.2 33.3 31.3 F 58.1 58.1 55.8 60.5 58.1 58.1 27.9 23.3 25.6 G 67.9 64.3 64.3 60.7 64.3 64.3 25.0 21.4 23.2 H 79.5 87.2 87.2 89.7 84.6 85.6 35.9 35.9 35.9
71.8 74.4 71.8 71.8 71.8 72.3 23.1 23.1 23.1
MEAN 57.4 57.1 57.8 58.3 58.2 57.8 25.0 25.2 25.1
8CT's 95.6 94.4 93.3 95.6 93.3 94.4 82.2 75.6 78.9
b. MIDDAY MEAL (at your mess hall)
Mess Hall M T w T F Mean Sat Sun Mean
A 53.1 56.2 56.2 53.1 53.1 54.3 46.9 46.9 46.9 B 89.7 89.7 89.7 89.7 89.7 89.7 62.1 55.2 58.7 c 88.2 88.2 88.2 88.2 84.3 87.4 58.8 54.9 56.9 D 87.7 86.7 83.3 80.0 76.7 82.7 56.7 53.3 55.0 E 83.3 75.0 75.0 79.2 70.8 76.7 58.3 50.0 54.2 F 88.4 83.7 83.7 83.7 81.4 84.2 48.8 48.8 48.8 G 85.7 85.7 85.7 85.7 82.1 85.0 57.1 53.6 55.4 H 89.7 87.2 89.7 89.7 87.2 88.7 64.1 64.1 64.1
82.0 82.0 76.9 76.9 74.4 78.4 35.9 38.5 37.2
MEAN 83.0 81.6 89.0 80.7 77.7 80.8 54.3 51.7 53.0
BCT's 90.0 88.9 88.9 91.1 88.9 89.6 84.4 85.6 85.0
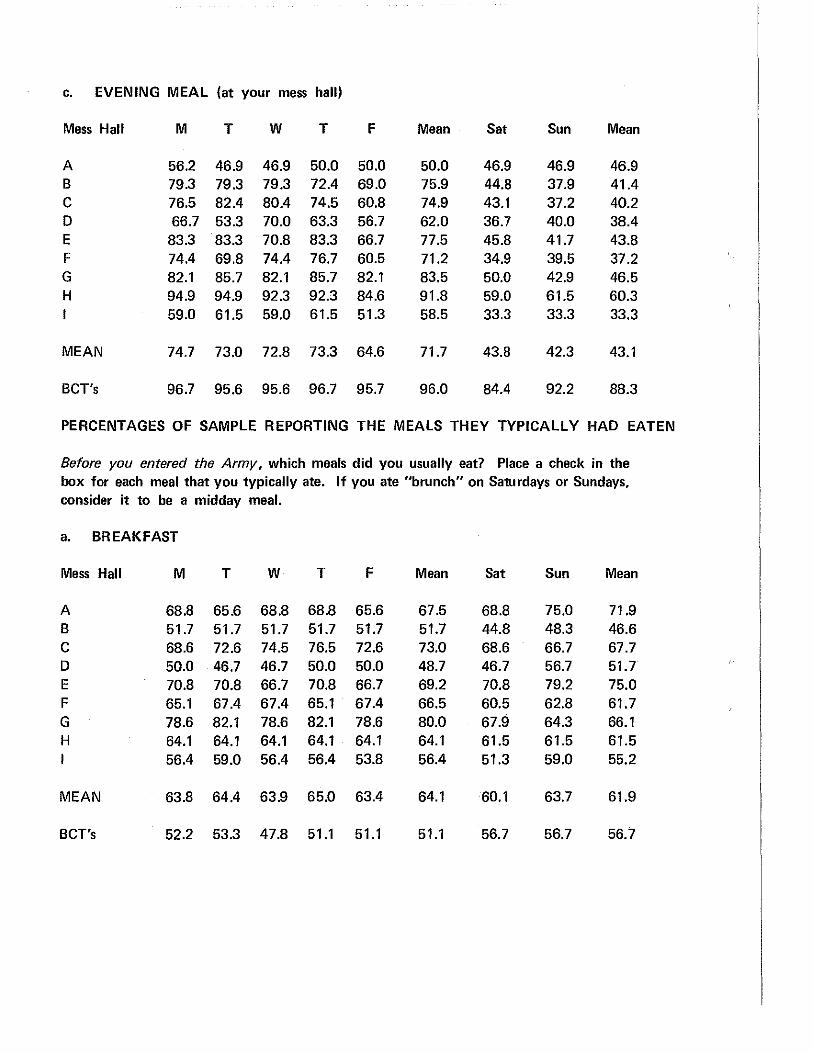
c. EVENING MEAL (at your mess hall)
Mess Hall M T w T F Mean Sat Sun Mean
A 56.2 46.9 46.9 50.0 50.0 50.0 46.9 46.9 46.9 B 79.3 79.3 79.3 72.4 69.0 75.9 44.8 37.9 41.4 c 76.5 82.4 80.4 74.5 60.8 74.9 43.1 37.2 40.2 D 66.7 53.3 70.0 63.3 56.7 62.0 36.7 40.0 38.4 E 83.3 83.3 70.8 83.3 66.7 77.5 45.8 41.7 43.8 F 74.4 69.8 74.4 76.7 60.5 71.2 34.9 39.5 37.2 G 82.1 85.7 82.1 85.7 82.1 83.5 50.0 42.9 46.5 H 94.9 94.9 92.3 92.3 84.6 91.8 59.0 61.5 60.3
59.0 61.5 59.0 61.5 51.3 58.5 33.3 33.3 33.3
MEAN 74.7 73.0 72.8 73.3 64.6 71.7 43.8 42.3 43.1
BCT's 96.7 95.6 95.6 96.7 95.7 96.0 84.4 92.2 88.3
PERCENTAGES OF SAMPLE REPORTING THE MEALS THEY TYPICALLY HAD EATEN
Before you entered the Army, which meals did you usually eat? Place a check in the box for each meal that you typically ate. If you ate "brunch" on Saturdays or Sundays, consider it to be a midday meal.
a. BREAKFAST
Mess Hall M T w T F Mean Sat Sun Mean
A 68.8 65.6 68.8 68.8 65.6 67.5 68.8 75.0 71.9 B 51.7 51.7 51.7 51.7 51.7 51.7 44.8 48.3 46.6 c 68.6 72.6 74.5 76.5 72.6 73.0 68.6 66.7 67.7 D 50.0 46.7 46.7 50.0 50.0 48.7 46.7 56.7 51.7 E 70.8 70.8 66.7 70.8 66.7 69.2 70.8 79.2 75.0 F 65.1 67.4 67.4 65.1 67.4 66.5 60.5 62.8 61.7 G 78.6 82.1 78.6 82.1 78.6 80.0 67.9 64.3 66.1 H 64.1 64.1 64.1 64.1 64.1 64.1 61.5 61.5 61.5
56.4 59.0 56.4 56.4 53.8 56.4 51.3 59.0 55.2
MEAN 63.8 64.4 63.9 65.0 63.4 64.1 60.1 63.7 61.9
BCT's 52.2 53.3 47.8 51.1 51.1 51.1 56.7 56.7 56.7
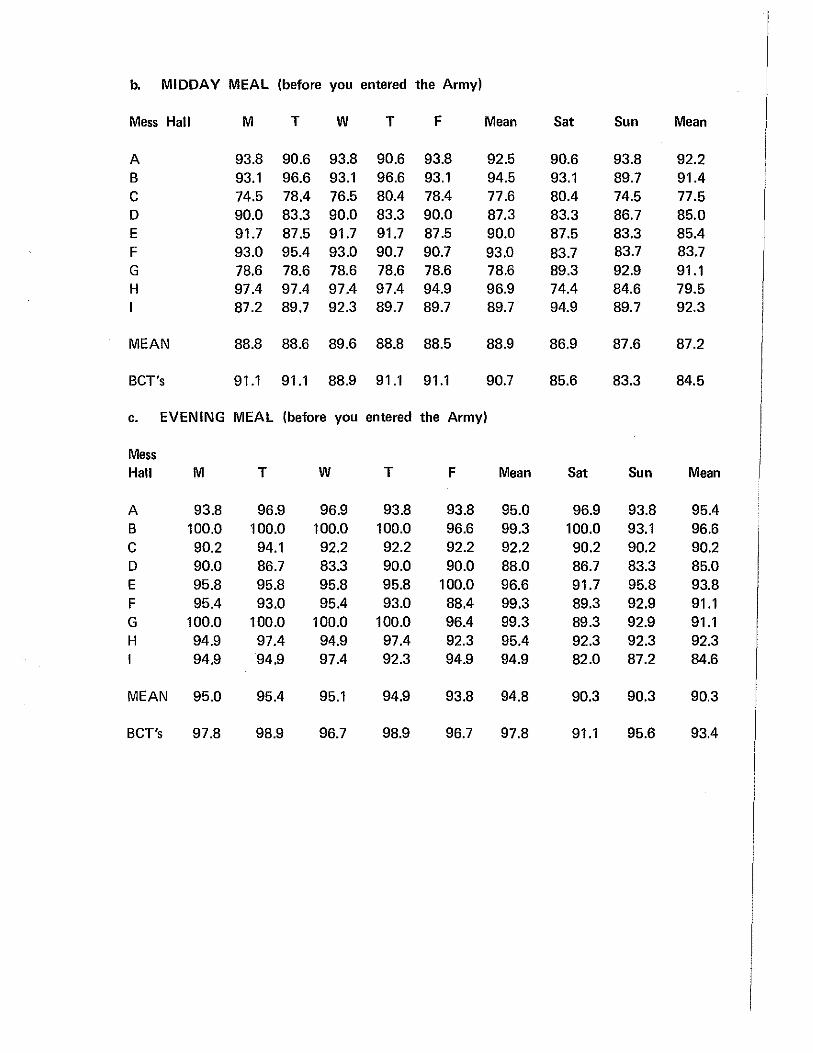
b. MIDDAY MEAL (before you entered the Army)
Mess Hall M T w T F Mean Sat Sun Mean
A 93.8 90.6 93.8 90.6 93.8 92.5 90.6 93.8 92.2 B 93.1 96.6 93.1 96.6 93.1 94.5 93.1 89.7 91.4 c 74.5 78.4 76.5 80.4 78.4 77.6 80.4 74.5 77.5 D 90.0 83.3 90.0 83.3 90.0 87.3 83.3 86.7 85.0 E 91.7 87.5 91.7 91.7 87.5 90.0 87.5 83.3 85.4 F 93.0 95.4 93.0 90.7 90.7 93.0 83.7 83.7 83.7 G 78.6 78.6 78.6 78.6 78.6 78.6 89.3 92.9 91.1 H 97.4 97.4 97.4 97.4 94.9 96.9 74.4 84.6 79.5 I 87.2 89.7 92.3 89.7 89.7 89.7 94.9 89.7 92.3
MEAN 88.8 88.6 89.6 88.8 88.5 88.9 86.9 87.6 87.2
BCT's 91.1 91.1 88.9 91.1 91.1 90.7 85.6 83.3 84.5
c. EVENING MEAL (before you entered the Army)
Mess Hall M T w T F Mean Sat Sun Mean
A 93.8 96.9 96.9 93.8 93.8 95.0 96.9 93.8 95.4 B 100.0 100.0 100.0 100.0 96.6 99.3 100.0 93.1 96.6 c 90.2 94.1 92.2 92.2 92.2 92.2 90.2 90.2 90.2 D 90.0 86.7 83.3 90.0 90.0 88.0 86.7 83.3 85.0 E 95.8 95.8 95.8 95.8 100.0 96.6 91.7 95.8 93.8 F 95.4 93.0 95.4 93.0 88.4 99.3 89.3 92.9 91.1 G 100.0 100.0 100.0 100.0 96.4 99.3 89.3 92.9 91.1 H 94.9 97.4 94.9 97.4 92.3 95.4 92.3 92.3 92.3
94.9 94.9 97.4 92.3 94.9 94.9 82.0 87.2 84.6
MEAN 95.0 95.4 95.1 94.9 93.8 94.8 90.3 90.3 90.3
BCT's 97.8 98.9 96.7 98.9 96.7 97.8 91.1 95.6 93.4
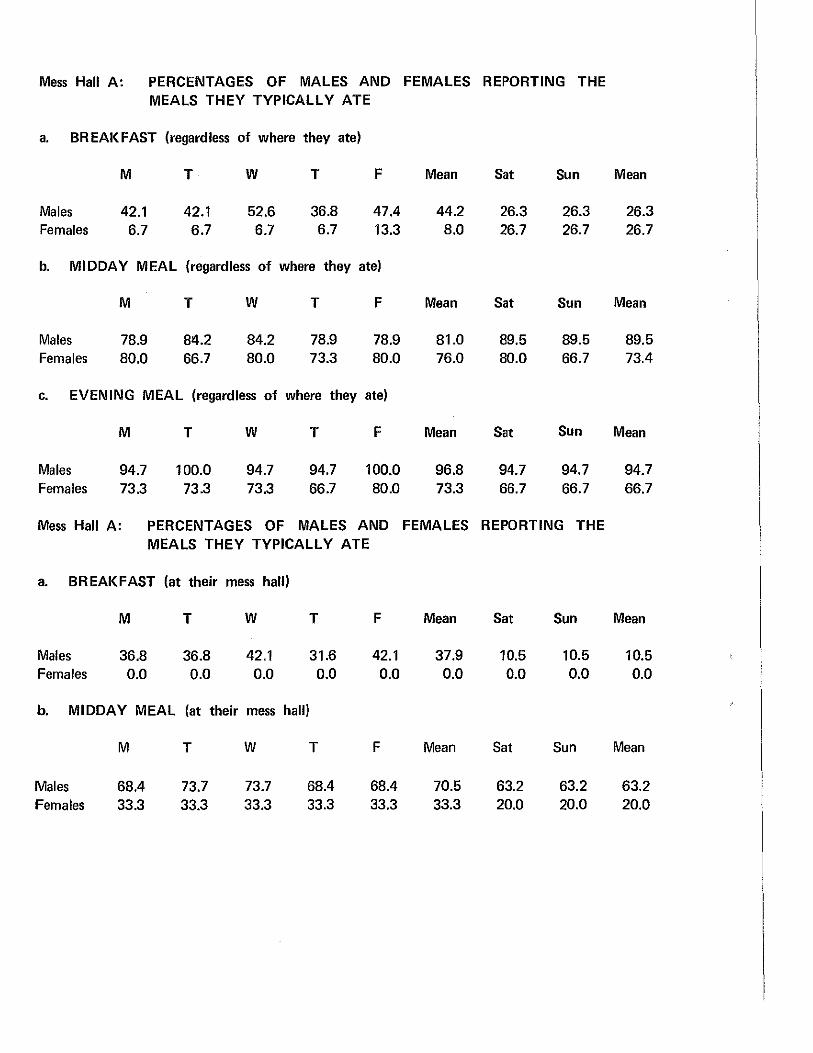
Mess Hall A: PERCENTAGES OF MALES AND FEMALES REPORTING THE MEALS THEY TYPICALLY ATE
a. BREAKFAST (regardless of where they ate)
M T w T F Mean Sat Sun Mean
Males 42.1 42.1 52.6 36.8 47.4 44.2 26.3 26.3 26.3 Females 6.7 6.7 6.7 6.7 13.3 8.0 26.7 26.7 26.7
b. MIDDAY MEAL (regardless of where they ate)
M T w T F Mean Sat Sun Mean
Males 78.9 8'1.2 84.2 78.9 78.9 81.0 89.5 89.5 89.5 Females 80.0 66.7 80.0 73.3 80.0 76.0 80.0 66.7 73.4
c. EVENING MEAL (regardless of where they ate)
M T w T F Mean Sat Sun Mean
Males 94.7 100.0 94.7 94.7 100.0 96.8 94.7 94.7 94.7 Females 73.3 73.3 73.3 66.7 80.0 73.3 66.7 66.7 66.7
Mess Hall A: PERCENTAGES OF MALES AND FEMALES REPORTING THE MEALS THEY TYPICALLY ATE
a. BREAKFAST (at their mess hall)
M T w T F Mean Sat Sun Mean
Males 36.8 36.8 42.1 31.6 42.1 37.9 10.5 10.5 10.5 Females 0.0 0.0 0.0 0.0 0.0 0.0 0.0 0.0 0.0
b. MIDDAY MEAL (at their mess hall)
M T w T F Mean Sat Sun Mean
Males 68.4 73.7 73.7 68.4 68.4 70.5 63.2 63.2 63.2 Females 33.3 33.3 33.3 33.3 33.3 33.3 20.0 20.0 20.0
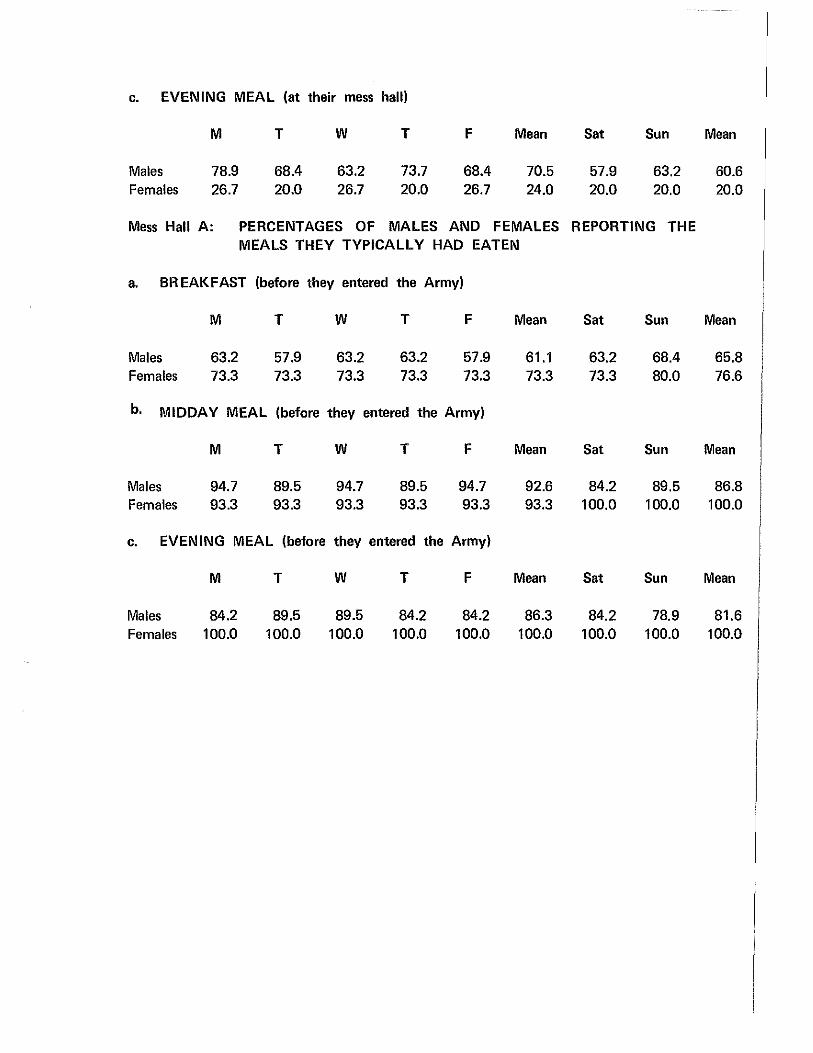
c. EVENING MEAL (at their mess hall)
M T w T F Mean Sat Sun Mean
Males 78.9 68.4 63.2 73.7 68.4 70.5 57.9 63.2 60.6 Females 26.7 20.0 26.7 20.0 26.7 24.0 20.0 20.0 20.0
Mess Hall A: PERCENTAGES OF MALES AND FEMALES REPORTING THE MEALS THEY TYPICALLY HAD EATEN
a. BREAKFAST (before they entered the Army)
M T w T F Mean Sat Sun Mean
Males 63.2 57.9 63.2 63.2 57.9 61.1 63.2 68.4 65.8 Females 73.3 73.3 73.3 73.3 73.3 73.3 73.3 80.0 76.6
b. MIDDAY MEAL (before they entered the Army)
M T w T F Mean Sat Sun Mean
Males 94.7 89.5 94.7 89.5 94.7 92.6 84.2 89.5 86.8 Females 93.3 93.3 93.3 93.3 93.3 93.3 100.0 100.0 100.0
c. EVENING MEAL (before they entered the Army)
M T w T F Mean Sat Sun Mean
Males 84.2 89.5 89.5 84.2 84.2 86.3 84.2 78.9 81.6 Females 100.0 100.0 100.0 100.0 100.0 100.0 100.0 100.0 100.0
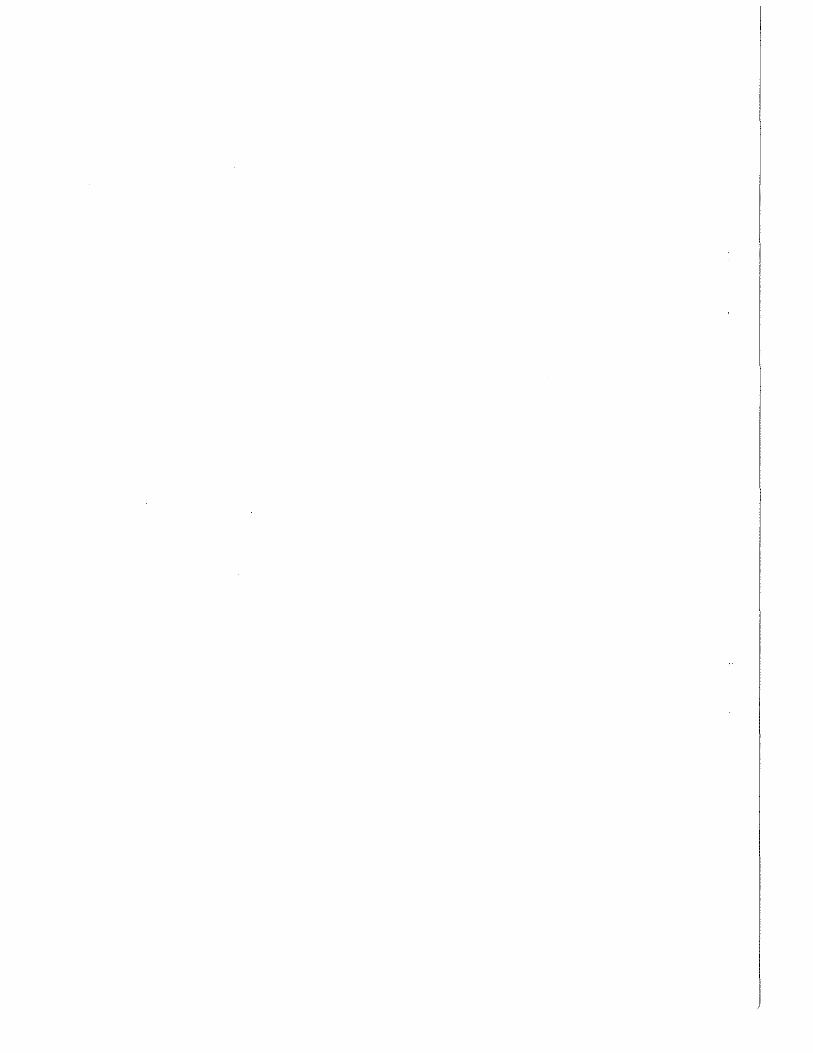

RESULTS FOR TDA AND TOE UNITS


TDA AND TOE SAMPLE, FT. LEWIS
Dining Hall Units No. Interviewed No. Discarded Total % Util.
A2 Co A, USATCI 34 0 34 27% Wac Co
8 HHC, USATCI 32 1 31 43%
c 3rd Cav 51 0 51 66%
D HHD 62 Med Gp 36 2 34 48% 551st Med Co 423d Med Co
E HO, 339th Engr 26 0 26 48%
F 2d Bn 47 2 45 54% 19th Arty
G 143 SDS Co 30 1 29 57% 63d Ord Co
H 513 Maint Co 53 3 50 56% 171st Ord
542d Maint Co 43 0 43 66% 70th Support Bn 151st
When you do not eat in the mess hall, where do you eat?
a. skip the meal
A 8 c D E F G H MEAN
Never 0.0 13.3 2.0 5.9 3.8 4.6 17.2 16.3 9.5 8.0 Sometimes 42.4 50.0 72.5 58.8 73.1 75.0 65.5 65.3 73.8 65.1 Often 54.6 30.0 21.6 32.4 19.2 15.9 17.2 16.3 16.7 24.0 Always 3.0 6.7 3.9 2.9 3.8 4.6 0.0 2.0 0.0 3.0
NO. SUBJECTS 33 30 51 34 26 44 29 49 42 338 RESPONDING
2 This unit was composed of 19 males and 15 females.
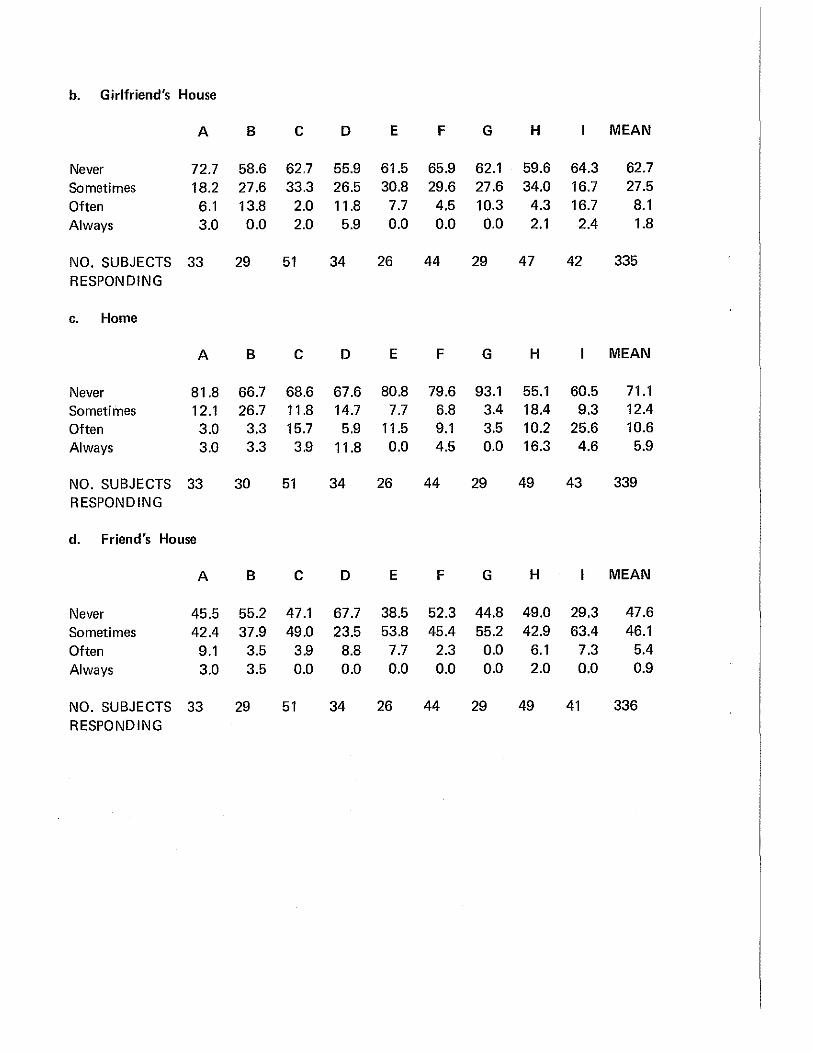
b. Girlfriend's House
A B c D E F G H MEAN
Never 72.7 58.6 62.7 55.9 61.5 65.9 62.1 59.6 64.3 62.7 Sometimes 18.2 27.6 33.3 26.5 30.8 29.6 27.6 34.0 16.7 27.5 Often 6.1 13.8 2.0 11.8 7.7 4.5 10.3 4.3 16.7 8.1 Always 3.0 0.0 2.0 5.9 0.0 0.0 0.0 2.1 2.4 1.8
NO. SUBJECTS 33 29 51 34 26 44 29 47 42 335 RESPONDING
c. Home
A B c D E F G H MEAN
Never 81.8 66.7 68.6 67.6 80.8 79.6 93.1 55.1 60.5 71.1 Sometimes 12.1 26.7 11.8 14.7 7.7 6.8 3.4 18.4 9.3 12.4 Often 3.0 3.3 15.7 5.9 11.5 9.1 3.5 10.2 25.6 10.6 Always 3.0 3.3 3.9 11.8 0.0 4.5 0.0 16.3 4.6 5.9
NO. SUBJECTS 33 30 51 34 26 44 29 49 43 339 RESPONDING
d. Friend's House
A B c D E F G H MEAN
Never 45.5 55.2 47.1 67.7 38.5 52.3 44.8 49.0 29.3 47.6 Sometimes 42.4 37.9 49.0 23.5 53.8 45.4 55.2 42.9 63.4 46.1 Often 9.1 3.5 3.9 8.8 7.7 2.3 0.0 6.1 7.3 5.4 Always 3.0 3.5 0.0 0.0 0.0 0.0 0.0 2.0 0.0 0.9
NO. SUBJECTS 33 29 51 34 26 44 29 49 41 336 RESPONDING

e. Relatives
A B c D E F G H MEAN
Never 93.9 82.8 78.4 81.8 88.5 93.2 85.7 66.7 66.7 80.8
Sometimes 3.0 13.8 13.7 12.1 11.5 6.8 10.7 27.1 30.9 15.3
Often 3.0 3.4 5.9 6.1 0.0 0.0 3.6 2.1 2.4 3.0
Always 0.0 0.0 2.0 0.0 0.0 0.0 0.0 4.2 0.0 0.9
NO. SUBJECTS 33 29 51 33 26 44 28 48 42 334
RESPONDING
f. Off-post diner, snack bar, or drive-in
A B c D E F G H MEAN
Never 3.0 10.3 3.9 11.8 0.0 15.9 24.1 16.3 21.4 12.2
Sometimes 57.6 48.3 62.8 73.5 50.0 63.6 31.0 57.1 64.3 57.9
Often 33.3 34.5 33.3 14.7 46.2 20.5 44.8 26.5 14.3 28.5
Always 6.1 6.9 0.0 0.0 3.8 0.0 0.0 0.0 0.0 1.5
NO. SUBJECTS 33 29 51 34 26 44 29 49 42 337
RESPONDING
g. Off-post quality restaurant
A B c D E F G H MEAN
Never 21.2 20.7 15.7 41.2 15.4 27.3 41.4 34.7 21.4 26.4
Sometimes 72.7 75.9 72.5 50.0 80.8 59.1 51.7 46.9 71.4 63.8
Often 6.1 3.4 9.8 5.9 3.8 11.4 6.9 18.4 4.8 8.6 Always 0.0 0.0 2.0 2.9 0.0 2.3 0.0 0.0 2.4 1.2
NO. SUBJECTS 33 29 51 34 26 44 29 49 42 337
RESPONDING

h. Bar or tavern (with alcoholic beverages)
A B c D E F G H MEAN
Never 51.5 41.4 35.3 58.8 26.9 36.4 48.3 46.9 50.0 43.9 Sometimes 42.4 44.8 49.0 32.4 46.2 54.6 41.4 40.8 38.1 43.6 Often 6.1 10.3 13.7 5.9 19.2 4.5 10.3 6.1 7.1 8.9 Always 0.0 3.5 2.0 2.9 7.7 4.5 0.0 6.1 4.8 3.6
NO. SUBJECTS 33 29 51 34 26 44 29 49 42 337 RESPONDING
i. PX snack bar on your post
A B c D E F G H MEAN
Never 23.5 34.5 29.4 57.6 34.6 25.0 6.9 18.0 30.9 28.4 Sometimes 67.7 51.7 64.7 42.4 61.5 61.4 75.9 66.0 64.3 62.1 Often 8.8 10.3 5.9 0.0 3.9 13.6 17.2 14.0 4.8 8.9 Always 0.0 3.5 0.0 0.0 0.0 0.0 0.0 2.0 0.0 0.6
NO. SUBJECTS 34 29 51 33 26 44 29 50 42 338 RESPONDING
j. PX snack bar on a nearby post
A B c D E F G H MEAN
Never 78.8 82.8 76.5 94.1 80.8 75.0 72.4 71.4 78.6 78.3 Sometimes 21.2 13.8 21.6 2.9 19.2 22.7 27.6 24.5 21.4 19.9 Often 0.0 3.4 2.0 0.0 0.0 0.0 0.0 4.1 0.0 1.2 Always 0.0 0.0 0.0 2.9 0.0 2.3 0.0 0.0 0.0 0.6
NO. SUBJECTS 33 29 51 34 26 44 29 49 42 337 RESPONDING
k. NCO service club on your post
A B c D E F G H MEAN
Never 66.7 86.2 68.6 64.7 80.8 86.4 75.9 85.7 78.6 77.1
Sometimes 27.3 13.8 29.4 32.4 19.2 11.4 24.1 12.2 19.0 20.8
Often 3.0 0.0 2.0 2.9 0.0 0.0 0.0 2.0 2.4 1.5
Always 3.0 0.0 0.0 0.0 0.0 2.3 0.0 0.0 0.0 0.6
NO. SUBJECTS 33 29 51 34 26 44 29 49 42 337
RESPONDING
I. NCO service club on a nearby post
A B c D E F G H MEAN
Never 93.9 93.1 88.2 91.2 96.2 88.6 89.7 95.9 92.9 92.0
Sometimes 6.1 6.9 9.8 8.8 3.8 9.1 10.3 4.1 7.1 7.4
Often 0.0 0.0 2.0 0.0 0.0 0.0 0.0 0.0 0.0 0.3
Always 0.0 0.0 0.0 0.0 0.0 2.3 0.0 0.0 0.0 0.3
NO. SUBJECTS 33 29 51 34 26 44 29 49 42 337
RESPONDING
m. PX donut shop
A B c D E F G H MEAN
Never 54.6 50.0 43.1 41.2 34.6 43.2 44.8 39.6 47.6 44.2
Sometimes 45.4 43.3 52.9 55.9 53.9 50.0 48.3 52.1 47.6 50.2
Often 0.0 6.7 3.9 0.0 7.7 4.5 6.9 8.3 4.8 4.7
Always 0.0 0.0 0.0 2.9 3.8 2.3 0.0 0.0 0.0 0.9
NO. SUBJECTS 33 30 51 34 26 44 29 48 42 337
RESPONDING

n. EM club
A B c D E F G H MEAN
Never 90.9 96.6 86.3 87.9 88.0 81.4 96.6 93.9 90.5 89.8 Sometimes 9.1 3.4 11.8 9.1 12.0 13.9 3.4 6.1 7.1 8.7 Often 0.0 0.0 2.0 0.0 0.0 0.0 0.0 0.0 2.4 0.6 Always 0.0 0.0 0.0 3.0 0.0 4.7 0.0 0.0 0.0 0.9
NO. SUBJECTS 33 29 51 33 25 43 29 49 42 334 RESPONDING
Consider the normal meals that you are served at your mess hall (excluding the short order) during the weekdays (Monday thru Friday). Tell us your opinion of the variety of these meals from day to day.
a. Breakfast
A B c D E F G H MEAN
1- 35.7 24.1 19.6 28.1 42.3 26.7 24.1 44.0 27.9 30.0 No variety
2 25.0 27.6 21.6 12.5 23.1 20.0 10.3 32.0 25.6 22.5
3 21.4 17.2 27.4 21.9 19.2 17.8 37.9 8.0 11.6 19.5
4- 10.7 27.6 21.6 31.3 11.5 26.7 27.6 10.0 32.6 22.2 About right
5 7.1 0.0 7.8 3.1 3.9 6.7 0.0 6.0 2.3 4.5
6 0.0 3.5 2.0 3.1 0.0 2.2 0.0 0.0 0.0 1.2
7- 0.0 0.0 0.0 0.0 0.0 0.0 0.0 0.0 0.0 0.0 Too much variety
MEAN 2.3 2.6 2.8 2.8 2.1 2.7 2.7 2.0 2.6 2.5
STANDARD DEVIATION 1.3 1.3 1.3 1.4 1.2 1.4 1.1 1.2 1.3 1.3
MEDIAN 2.1 2.4 2.8 2.9 1.8 2.7 2.9 1.7 2.4 2.4
NO. SUBJECTS 28 29 51 32 26 45 29 50 43 333 RESPONDING
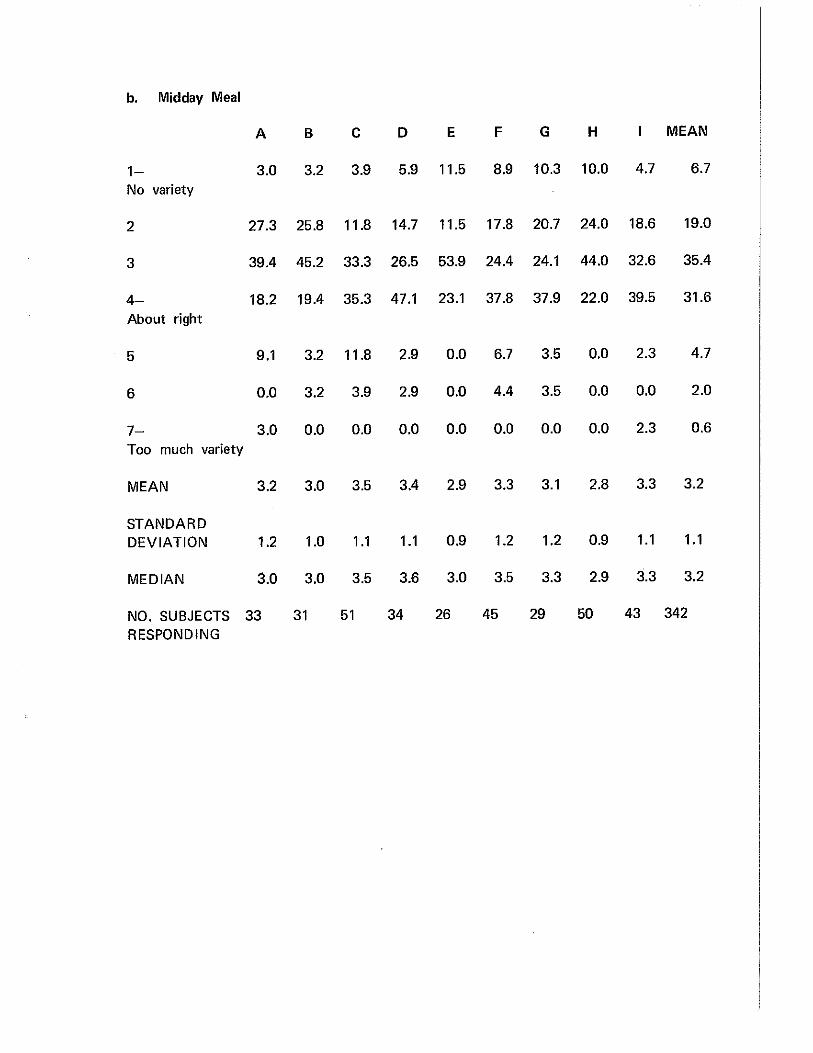
b. Midday Meal
A B c D E F G H MEAN
1- 3.0 3.2 3.9 5.9 11.5 8.9 10.3 10.0 4.7 6.7
No variety
2 27.3 25.8 11.8 14.7 11.5 17.8 20.7 24.0 18.6 19.0
3 39.4 45.2 33.3 26.5 53.9 24.4 24.1 44.0 32.6 35.4
4- 18.2 19.4 35.3 47.1 23.1 37.8 37.9 22.0 39.5 31.6
About right
5 9.1 3.2 11.8 2.9 0.0 6.7 3.5 0.0 2.3 4.7
6 0.0 3.2 3.9 2.9 0.0 4.4 3.5 0.0 0.0 2.0
7- 3.0 0.0 0.0 0.0 0.0 0.0 0.0 0.0 2.3 0.6
Too much variety
MEAN 3.2 3.0 3.5 3.4 2.9 3.3 3.1 2.8 3.3 3.2
STANDARD DEVIATION 1.2 1.0 1 .1 1.1 0.9 1.2 1.2 0.9 1.1 1.1
MEDIAN 3.0 3.0 3.5 3.6 3.0 3.5 3.3 2.9 3.3 3.2
NO. SUBJECTS 33 31 51 34 26 45 29 50 43 342
RESPONDING

c. Evening Meal
A B c D E F G H MEAN
1- 5.9 6.7 7.8 15.2 19.2 15.6 10.3 8.0 7.0 10.3 No variety
2 11.8 23.3 15.7 21.2 19.2 11.1 24.1 20.0 18.6 17.9
3 38.2 53.3 35.3 15.2 38.5 28.9 31.0 40.0 37.2 35.2
4- 29.4 13.3 21.6 42.4 19.2 33.3 20.7 26.0 32.6 27.0 About right
5 11.8 3.3 13.7 6.1 3.9 11.1 6.9 6.0 2.3 7.6
6 2.9 0.0 3.9 0.0 0.0 0.0 6.9 0.0 2.3 1.8
7- 0.0 0.0 2.0 0.0 0.0 0.0 0.0 0.0 0.0 0.3 Too much variety
MEAN 3.4 2.8 3.4 3.0 2.7 3.1 3.1 3.0 3.1 3.1
STANDARD DEVIATION 1.1 0.9 1.3 1.2 1 .1 1.2 1.3 1.0 1.0 1.2
MEDIAN 3.3 2.9 3.3 3.4 2.8 3.3 3.0 3.0 3.2 3.1
NO. SUBJECTS 34 30 51 33 26 45 29 50 43 341 RESPONDING
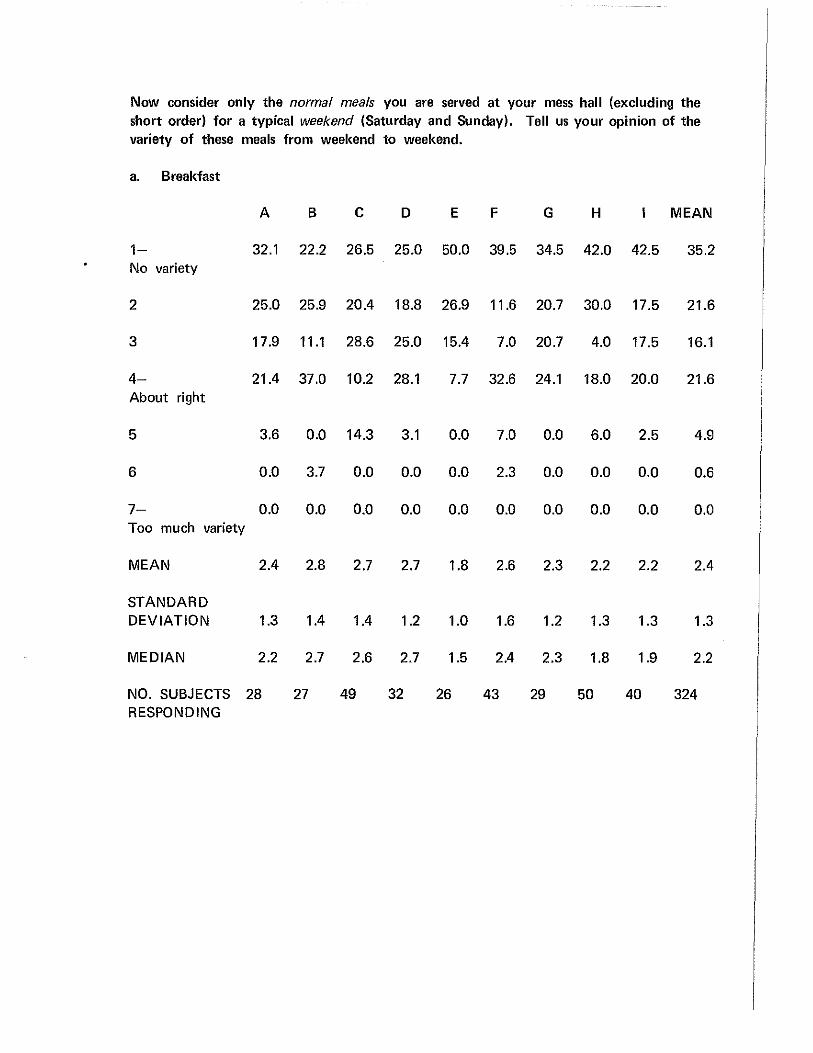
Now consider only the normal meals you are served at your mess hall (excluding the short order) for a typical weekend (Saturday and Sunday). Tell us your opinion of the variety of these meals from weekend to weekend.
a. Breakfast
A B c D E F G H MEAN
1- 32.1 22.2 26.5 25.0 50.0 39.5 34.5 42.0 42.5 35.2 No variety
2 25.0 25.9 20.4 18.8 26.9 11.6 20.7 30.0 17.5 21.6
3 17.9 11.1 28.6 25.0 15.4 7.0 20.7 4.0 17.5 16.1
4- 21.4 37.0 10.2 28.1 7.7 32.6 24.1 18.0 20.0 21.6 About right
5 3.6 0.0 14.3 3.1 0.0 7.0 0.0 6.0 2.5 4.9
6 0.0 3.7 0.0 0.0 0.0 2.3 0.0 0.0 0.0 0.6
7- 0.0 0.0 0.0 0.0 0.0 0.0 0.0 0.0 0.0 0.0 Too much variety
MEAN 2.4 2.8 2.7 2.7 1.8 2.6 2.3 2.2 2.2 2.4
STANDARD DEVIATION 1.3 1.4 1.4 1.2 1.0 1.6 1.2 1.3 1.3 1.3
MEDIAN 2.2 2.7 2.6 2.7 1.5 2.4 2.3 1.8 1.9 2.2
NO. SUBJECTS 28 27 49 32 26 43 29 50 40 324 RESPONDING
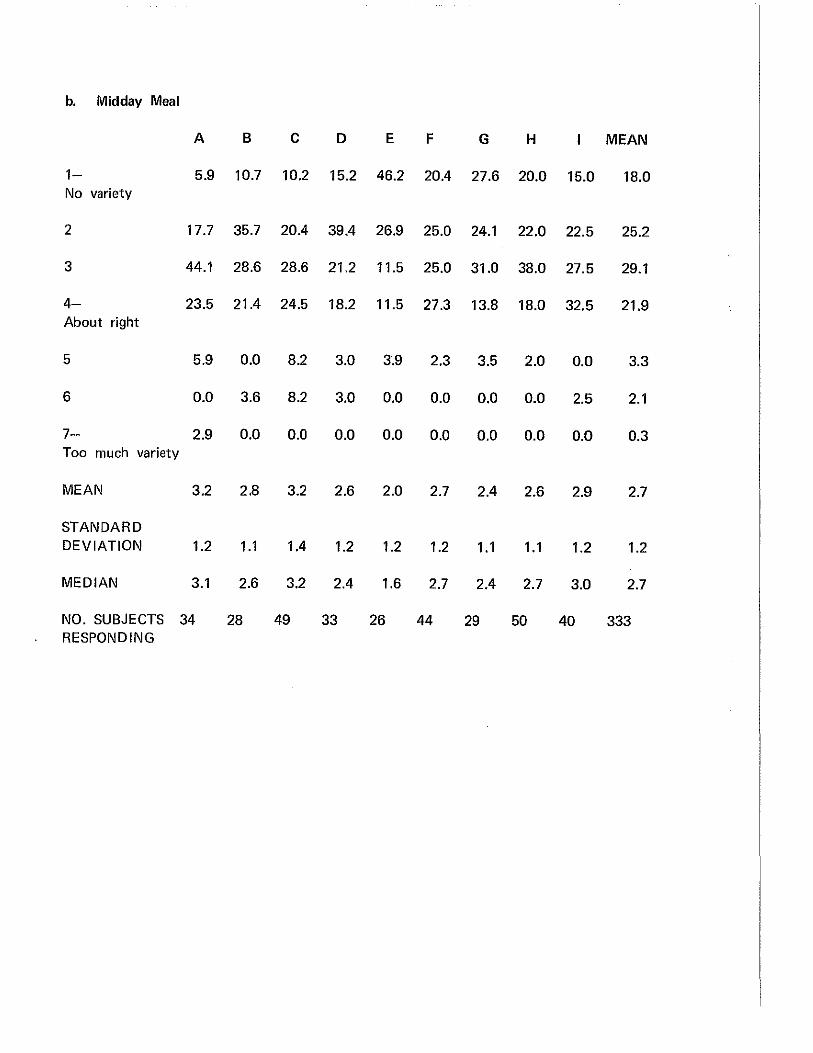
b. Midday Meal
A B c D E F G H MEAN
1- 5.9 10.7 10.2 15.2 46.2 20.4 27.6 20.0 15.0 18.0 No variety
2 17.7 35.7 20.4 39.4 26.9 25.0 24.1 22.0 22.5 25.2
3 44.1 28.6 28.6 21.2 11.5 25.0 31.0 38.0 27.5 29.1
4- 23.5 21.4 24.5 18.2 11.5 27.3 13.8 18.0 32.5 21.9 About right
5 5.9 0.0 8.2 3.0 3.9 2.3 3.5 2.0 0.0 3.3
6 0.0 3.6 8.2 3.0 0.0 0.0 0.0 0.0 2.5 2.1
7- 2.9 0.0 0.0 0.0 0.0 0.0 0.0 0.0 0.0 0.3 Too much variety
MEAN 3.2 2.8 3.2 2.6 2.0 2.7 2.4 2.6 2.9 2.7
STANDARD DEVIATION 1.2 1.1 1.4 1.2 1.2 1.2 1.1 1.1 1.2 1.2
MEDIAN 3.1 2.6 3.2 2.4 1.6 2.7 2.4 2.7 3.0 2.7
NO. SUBJECTS 34 28 49 33 26 44 29 50 40 333 RESPONDING
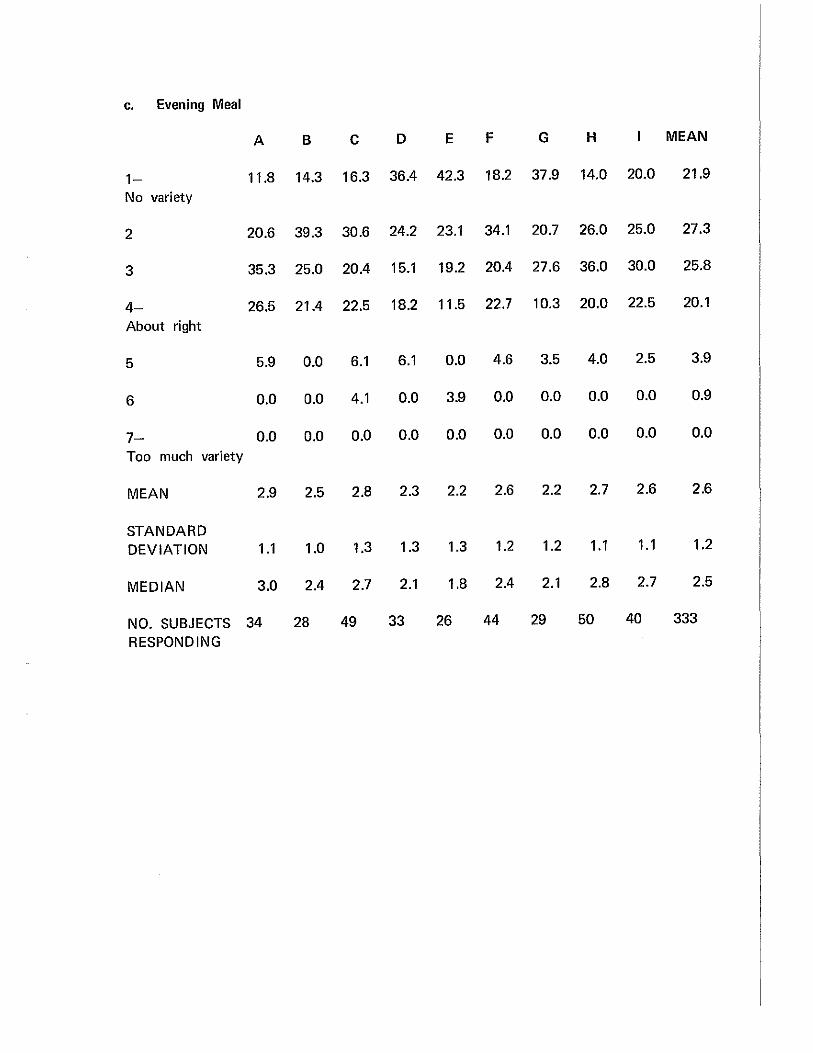
c. Evening Meal
A B c D E F G H MEAN
1- 11.8 14.3 16.3 36.4 42.3 18.2 37.9 14.0 20.0 21.9
No variety
2 20.6 39.3 30.6 24.2 23.1 34.1 20.7 26.0 25.0 27.3
3 35.3 25.0 20.4 15.1 19.2 20.4 27.6 36.0 30.0 25.8
4- 26.5 21.4 22.5 18.2 11.5 22.7 10.3 20.0 22.5 20.1
About right
5 5.9 0.0 6.1 6.1 0.0 4.6 3.5 4.0 2.5 3.9
6 0.0 0.0 4.1 0.0 3.9 0.0 0.0 0.0 0.0 0.9
7- 0.0 0.0 0.0 0.0 0.0 0.0 0.0 0.0 0.0 0.0
Too much variety
MEAN 2.9 2.5 2.8 2.3 2.2 2.6 2.2 2.7 2.6 2.6
STANDARD DEVIATION 1.1 1.0 1.3 1.3 1.3 1.2 1.2 1.1 1.1 1.2
MEDIAN 3.0 2.4 2.7 2.1 1.8 2.4 2.1 2.8 2.7 2.5
NO. SUBJECTS 34 28 49 33 26 44 29 50 40 333
RESPONDING

If you have a short-order line available in your mess hall, answer the following. Tell us your opinion of the variety of the short-order menu only from day to day.
a. For the weekdays (Monday thru Friday)
A B c D E F G H MEAN
1- 20.0 43.3 18.4 7.1 38.5 27.3 25.0 37.5 30.9 27.7 No variety
2 26.7 20.0 28.6 21.4 19.2 18.2 28.6 16.7 23.8 22.5
3 26.7 10.0 20.4 28.6 15.4 25.0 14.3 29.2 16.7 21.2
4- 23.3 20.0 22.4 35.7 26.9 18.2 28.6 14.6 19.1 22.1 About right
5 0.0 3.3 4.1 0.0 0.0 9.1 3.6 2.1 9.5 4.0
6 3.3 3.3 6.1 7.1 0.0 2.3 0.0 0.0 0.0 2.5
7- 0.0 0.0 0.0 0.0 0.0 0.0 0.0 0.0 0.0 0.0 Too much variety
MEAN 2.7 2.3 2.8 3.2 2.3 2.7 2.6 2.3 2.5 2.6
STANDARD DEVIATION 1.2 1.5 1.4 1.2 1.3 1.4 1.3 1.2 1.4 1.3
MEDIAN 2.6 1.8 2.7 3.2 2.1 2.7 2.4 2.3 2.3 2.5
NO. SUBJECTS 30 30 49 28 26 44 28 48 42 325 RESPONDING
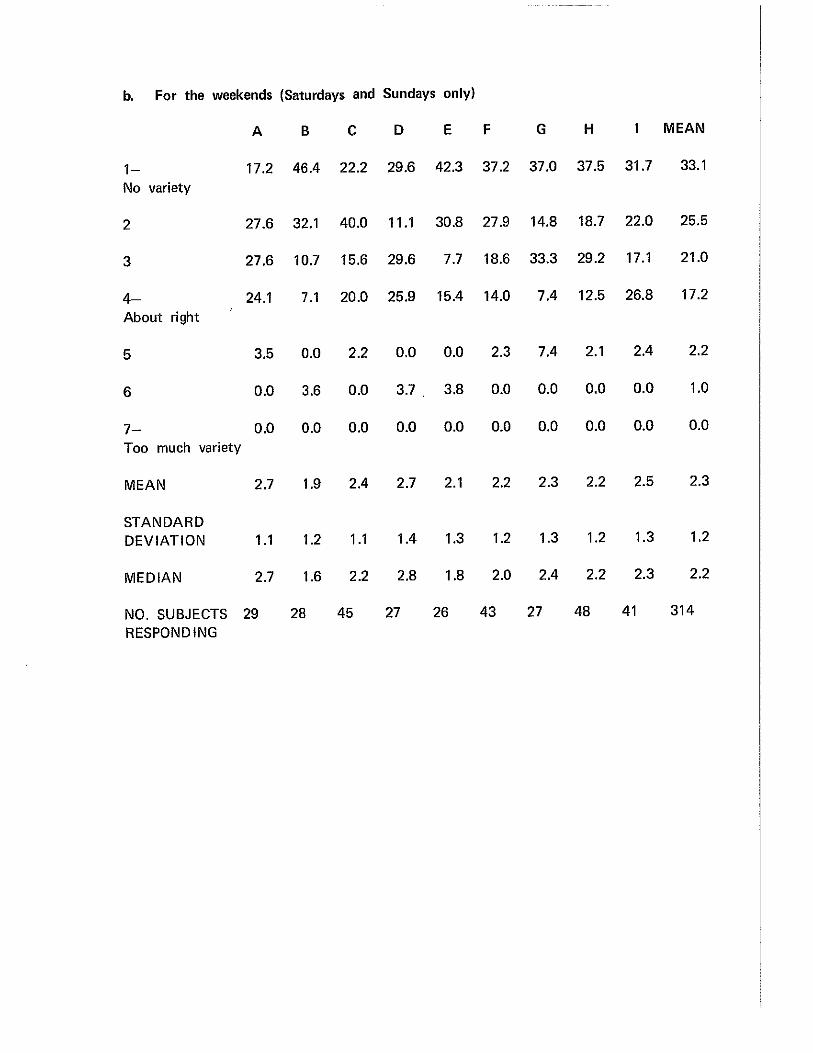
b. For the weekends (Saturdays and Sundays only)
A B c D E F G H MEAN
1- 17.2 46.4 22.2 29.6 42.3 37.2 37.0 37.5 31.7 33.1
No variety
2 27.6 32.1 40.0 11.1 30.8 27.9 14.8 18.7 22.0 25.5
3 27.6 10.7 15.6 29.6 7.7 18.6 33.3 29.2 17.1 21.0
4- 24.1 7.1 20.0 25.9 15.4 14.0 7.4 12.5 26.8 17.2
About right
5 3.5 0.0 2.2 0.0 0.0 2.3 7.4 2.1 2.4 2.2
6 0.0 3.6 0.0 3.7 3.8 0.0 0.0 0.0 0.0 1.0
7- 0.0 0.0 0.0 0.0 0.0 0.0 0.0 0.0 0.0 0.0
Too much variety
MEAN 2.7 1.9 2.4 2.7 2.1 2.2 2.3 2.2 2.5 2.3
STANDARD DEVIATION 1.1 1.2 1 .1 1.4 1.3 1.2 1.3 1.2 1.3 1.2
MEDIAN 2.7 1.6 2.2 2.8 1.8 2.0 2.4 2.2 2.3 2.2
NO. SUBJECTS 29 28 45 27 26 43 27 48 41 314
RESPONDING

What is your opinion of the preparation of the food in your mess hall for the normal meal only? (Exclude the short-order meal.)
A B c D E F G H MEAN
1- 0.0 3.2 3.9 11.8 7.7 4.4 6.9 12.5 9.3 6.7 Unacceptable (I can't eat it)
2 38.2 35.5 21.6 23.5 46.2 26.7 34.5 35.4 20.9 30.2
3 23.5 32.3 29.4 23.5 26.9 33.3 20.7 35.4 30.2 29.0
4- 38.2 16.1 37.3 29.4 19.2 26.7 34.5 14.6 30.2 27.6 Average
5 0.0 3.2 7.8 5.9 0.0 4.4 3.4 2.1 4.7 3.8
6 0.0 6.5 0.0 5.9 0.0 4.4 0.0 0.0 2.3 2.1
7- 0.0 3.2 0.0 0.0 0.0 0.0 0.0 0.0 2.3 0.6 Excellent (could not be better)
MEAN 3.0 3.1 3.2 3.1 2.6 3.1 2.9 2.6 3.2 3.0
STANDARD DEVIATION 0.9 1.4 1.0 1.3 0.9 1.1 1.1 1.0 1.3 1.1
MEDIAN 3.0 2.9 3.3 3.1 2.4 3.1 2.9 2.6 3.2 2.9
NO. SUBJECTS 34 31 51 34 26 45 29 48 43 341 RESPONDING
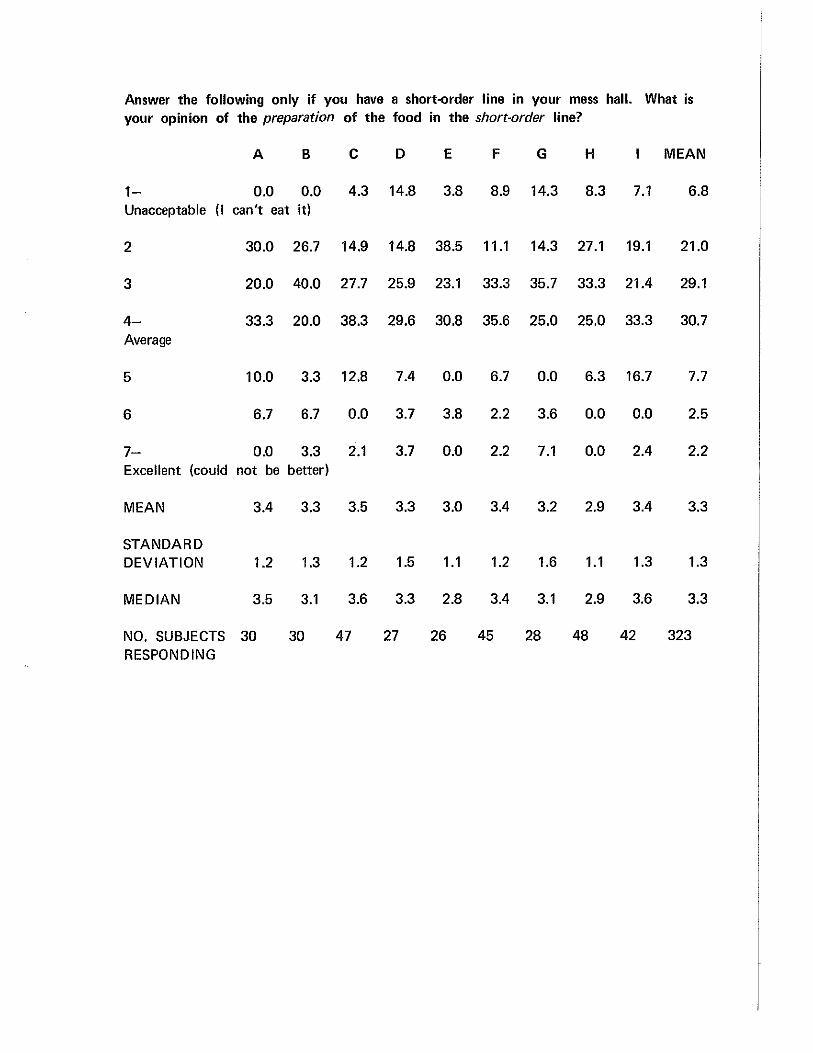
Answer the following only if you have a short-order line in your mess hall. What is your opinion of the preparation of the food in the short-order line?
A B c D E F G H MEAN
1- 0.0 0.0 4.3 14.8 3.8 8.9 14.3 8.3 7.1 6.8 Unacceptable (I can't eat it)
2 30.0 26.7 14.9 14.8 38.5 11.1 14.3 27.1 19.1 21.0
3 20.0 40.0 27.7 25.9 23.1 33.3 35.7 33.3 21.4 29.1
4- 33.3 20.0 38.3 29.6 30.8 35.6 25.0 25.0 33.3 30.7 Average
5 10.0 3.3 12.8 7.4 0.0 6.7 0.0 6.3 16.7 7.7
6 6.7 6.7 0.0 3.7 3.8 2.2 3.6 0.0 0.0 2.5
7- 0.0 3.3 2.1 3.7 0.0 2.2 7.1 0.0 2.4 2.2 Excellent (could not be better)
MEAN 3.4 3.3 3.5 3.3 3.0 3.4 3.2 2.9 3.4 3.3
STANDARD DEVIATION 1.2 1.3 1.2 1.5 1.1 1.2 1.6 1.1 1.3 1.3
MEDIAN 3.5 3.1 3.6 3.3 2.8 3.4 3.1 2.9 3.6 3.3
NO. SUBJECTS 30 30 47 27 26 45 28 48 42 323 RESPONDING

Is the food in your mess hall ever:
a. Overcooked
A B c D E F G H MEAN
Never 11.8 16.1 12.0 11.8 26.9 2.2 27.6. 6.2 20.9 13.8 Sometimes 67.6 54.8 68.0 61.8 42.3 88.9 55.2 75.0 48.8 64.4 Often 20.6 29.0 16.0 26.5 30.8 8.9 17.2 16.7 25.6 20.3 Always 0.0 0.0 4.0 0.0 0.0 0.0 0.0 2.1 4.7 1.5
NO. SUBJECTS 34 31 50 34 26 45 29 48 43 340 RESPONDING
b. Undercooked
A B c D E F G H MEAN
Never 2.9 6.4 12.0 8.8 0.0 4.4 6.9 4.1 13.9 7.0 Sometimes 50.0 45.2 50.0 58.8 34.6 62.2 55.2 51.0 39.5 50.2 Often 35.3 45.2 36.0 29.4 57.7 33.3 31.0 42.9 42.0 38.7 Always 11.8 3.2 2.0 2.9 7.7 0.0 6.9 2.0 4.6 4.1
NO. SUBJECTS 34 31 50 34 26 45 29 49 43 341 RESPONDING
c. Cold
A B c D E F G H MEAN
Never 14.7 16.1 18.0 2.9 7.7 8.9 6.9 4.1 4.6 9.4 Sometimes 29.4 29.0 64.0 52.9 26.9 55.6 51.7 40.8 60.5 47.5 Often 50.0 45.2 16.0 41.2 50.0 31.1 34.5 40.8 27.9 35.8 Always 5.9 9.7 2.0 2.9 15.4 4.4 6.9 14.3 7.0 7.3
NO. SUBJECTS 34 31 50 34 26 45 29 49 43 341 RESPONDING

d. Tasteless or bland
A B c D E F G H MEAN
Never 5.9 9.7 8.0 2.9 7.7 6.7 10.3 6.1 14.0 7.9 Sometimes 44.1 38.7 46.0 35.3 15.4 40.0 37.9 24.5 39.5 36.4 Often 32.4 38.7 42.0 50.0 53.8 42.2 41.4 51.0 32.6 42.5 Always 17.6 12.9 4.0 11.8 23.1 11.1 10.3 18.4 13.9 13.2
NO. SUBJECTS 34 31 50 34 26 45 29 49 43 341 RESPONDING
e. Burned
A B c D E F G H MEAN
Never 26.5 35.5 18.0 11.8 15.4 15.6 31.0 8.2 13.9 18.5 Sometimes 58.8 48.4 68.0 76.5 57.7 75.6 55.2 61.2 60.5 63.3 Often 14.7 16.1 14.0 11.8 23.1 8.9 13.8 30.6 23.3 17.6 Always 0.0 0.0 0.0 0.0 3.8 0.0 0.0 0.0 2.3 0.6
NO. SUBJECTS 34 31 50 34 26 45 29 49 43 341 RESPONDING
f. Dried out
A B c D E F G H MEAN
Never 14.7 10.0 22.0 8.8 7.7 15.6 6.9 10.2 9.3 12.4 Sometimes 52.9 56.7 48.0 64.7 50.0 66.7 62.1 63.3 60.5 58.5 Often 26.5 33.3 30.0 17.7 34.6 15.6 27.6 24.5 27.9 25.9 Always 5.9 0.0 0.0 8.8 7.7 2.2 3.4 2.0 2.3 3.2
NO. SUBJECTS 34 30 50 34 26 45 29 49 43 340 RESPONDING
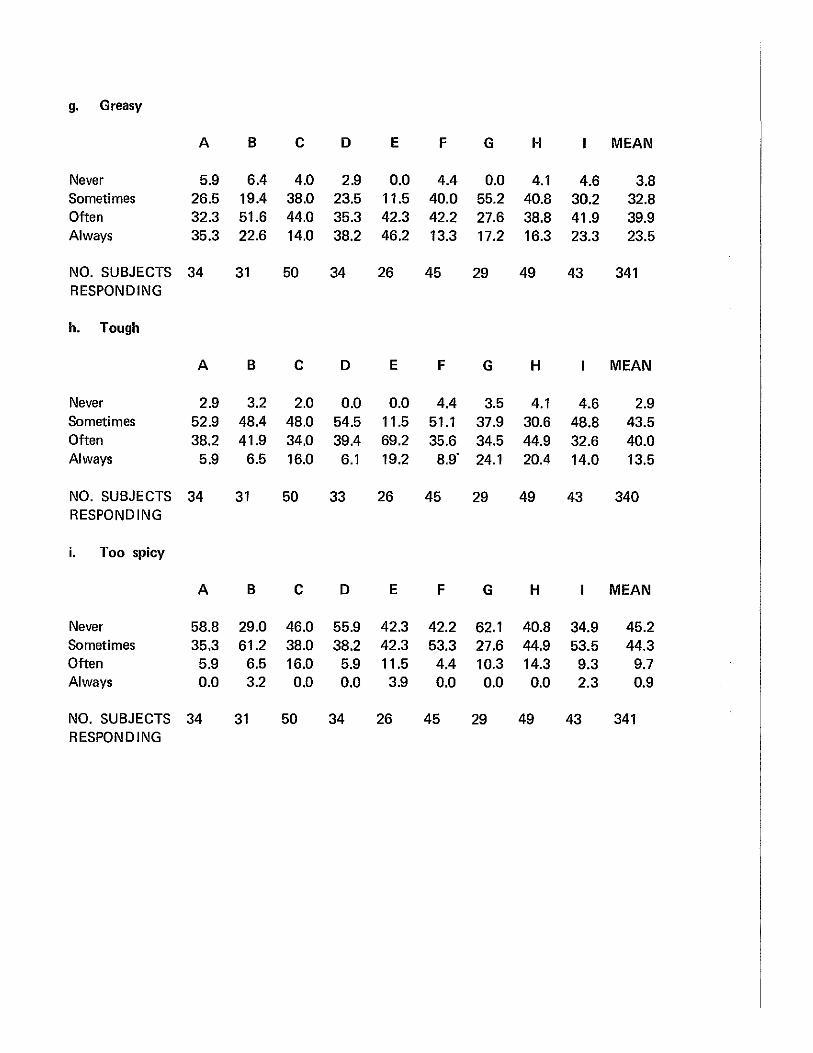
g. Greasy
A B c D E F G H MEAN
Never 5.9 6.4 4.0 2.9 0.0 4.4 0.0 4.1 4.6 3.8 Sometimes 26.5 19.4 38.0 23.5 11.5 40.0 55.2 40.8 30.2 32.8 Often 32.3 51.6 44.0 35.3 42.3 42.2 27.6 38.8 41.9 39.9 Always 35.3 22.6 14.0 38.2 46.2 13.3 17.2 16.3 23.3 23.5
NO. SUBJECTS 34 31 50 34 26 45 29 49 43 341 RESPONDING
h. Tough
A B c D E F G H MEAN
Never 2.9 3.2 2.0 0.0 0.0 4.4 3.5 4.1 4.6 2.9 Sometimes 52.9 48.4 48.0 54.5 11.5 51.1 37.9 30.6 48.8 43.5 Often 38.2 41.9 34.0 39.4 69.2 35.6 34.5 44.9 32.6 40.0 Always 5.9 6.5 16.0 6.1 19.2 8.9' 24.1 20.4 14.0 13.5
NO. SUBJECTS 34 31 50 33 26 45 29 49 43 340 RESPONDING
i. Too spicy
A B c D E F G H MEAN
Never 58.8 29.0 46.0 55.9 42.3 42.2 62.1 40.8 34.9 45.2 Sometimes 35.3 61.2 38.0 38.2 42.3 53.3 27.6 44.9 53.5 44.3 Often 5.9 6.5 16.0 5.9 11.5 4.4 10.3 14.3 9.3 9.7 Always 0.0 3.2 0.0 0.0 3.9 0.0 0.0 0.0 2.3 0.9
NO. SUBJECTS 34 31 50 34 26 45 29 49 43 341 RESPONDING
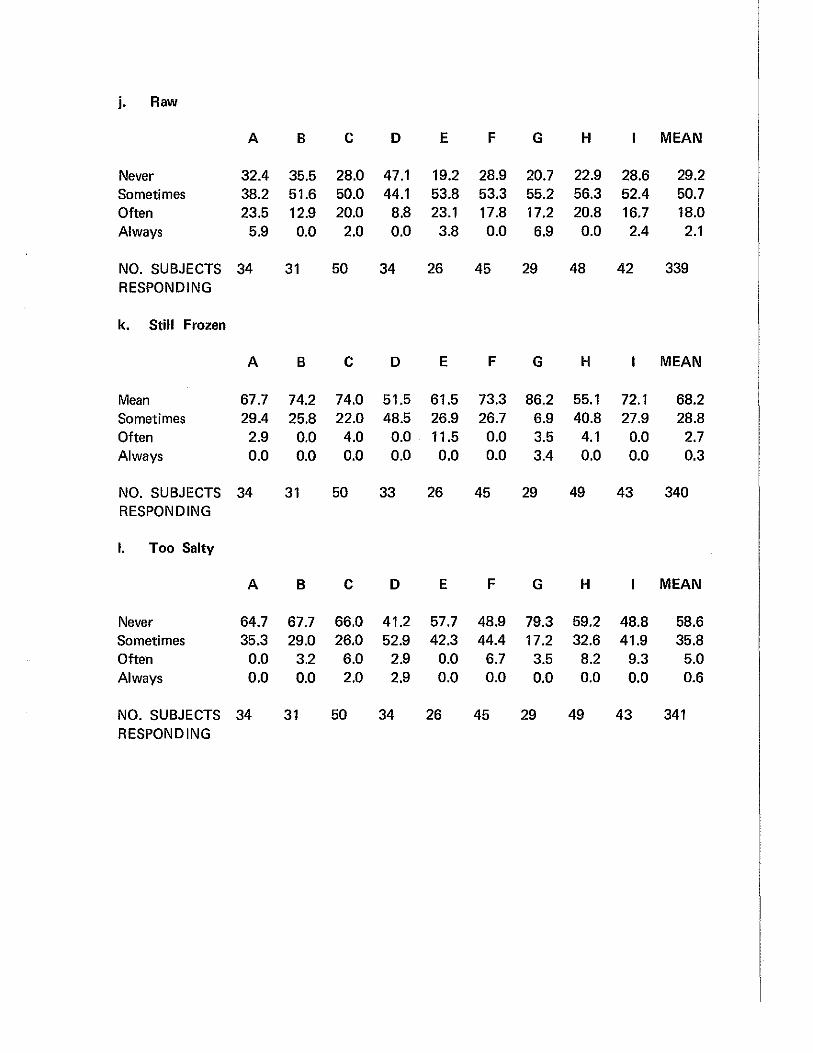
j. Raw
A B c D E F G H MEAN
Never 32.4 35.5 28.0 47.1 19.2 28.9 20.7 22.9 28.6 29.2 Sometimes 38.2 51.6 50.0 44.1 53.8 53.3 55.2 56.3 52.4 50.7 Often 23.5 12.9 20.0 8.8 23.1 17.8 17.2 20.8 16.7 18.0 Always 5.9 0.0 2.0 0.0 3.8 0.0 6.9 0.0 2.4 2.1
NO. SUBJECTS 34 31 50 34 26 45 29 48 42 339 RESPONDING
k. Still Frozen
A B c D E F G H MEAN
Mean 67.7 74.2 74.0 51.5 61.5 73.3 86.2 55.1 72.1 68.2 Sometimes 29.4 25.8 22.0 48.5 26.9 26.7 6.9 40.8 27.9 28.8 Often 2.9 0.0 4.0 0.0 11.5 0.0 3.5 4.1 0.0 2.7 Always 0.0 0.0 0.0 0.0 0.0 0.0 3.4 0.0 0.0 0.3
NO. SUBJECTS 34 31 50 33 26 45 29 49 43 340 RESPONDING
I. Too Salty
A B c D E F G H MEAN
Never 64.7 67.7 66.0 41.2 57.7 48.9 79.3 59.2 48.8 58.6 Sometimes 35.3 29.0 26.0 52.9 42.3 44.4 17.2 32.6 41.9 35.8 Often 0.0 3.2 6.0 2.9 0.0 6.7 3.5 8.2 9.3 5.0 Always 0.0 0.0 2.0 2.9 0.0 0.0 0.0 0.0 0.0 0.6
NO. SUBJECTS 34 31 50 34 26 45 29 49 43 341 RESPONDING
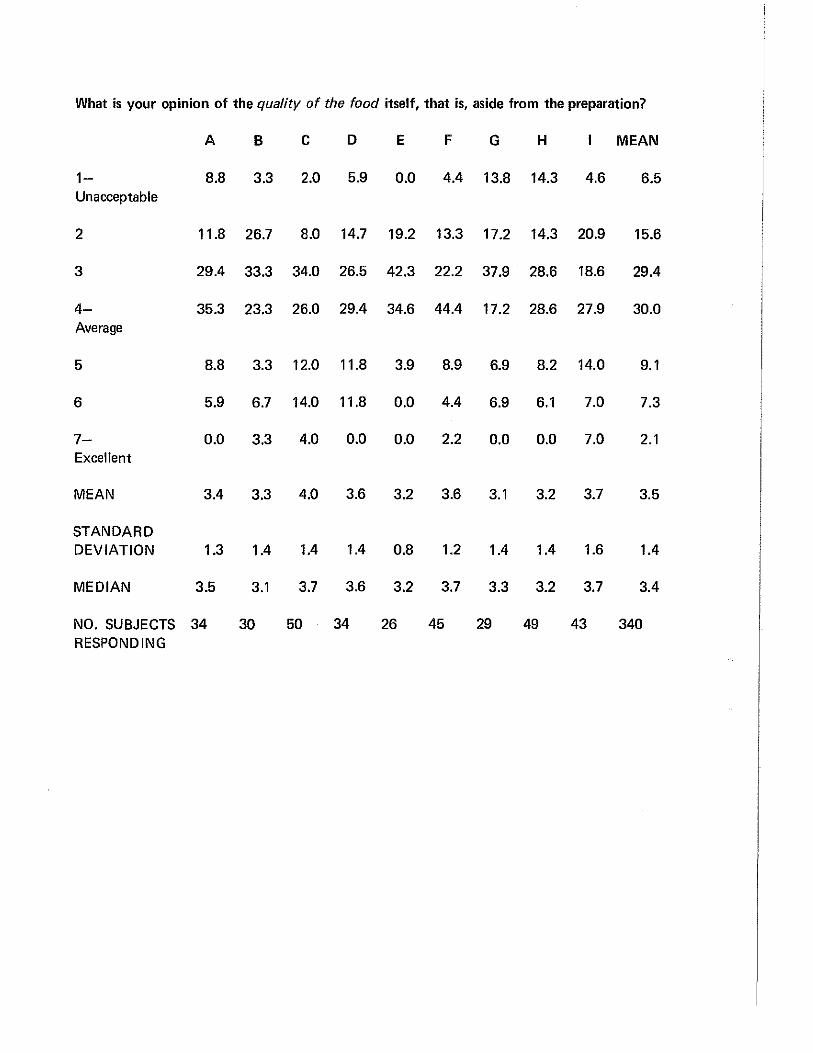
What is your opinion of the quality of the food itself, that is, aside from the preparation?
A B c D E F G H MEAN
1- 8.8 3.3 2.0 5.9 0.0 4.4 13.8 14.3 4.6 6.5 Unacceptable
2 11.8 26.7 8.0 14.7 19.2 13.3 17.2 14.3 20.9 15.6
3 29.4 33.3 34.0 26.5 42.3 22.2 37.9 28.6 18.6 29.4
4- 35.3 23.3 26.0 29.4 34.6 44.4 17.2 28.6 27.9 30.0 Average
5 8.8 3.3 12.0 11.8 3.9 8.9 6.9 8.2 14.0 9.1
6 5.9 6.7 14.0 11.8 0.0 4.4 6.9 6.1 7.0 7.3
7- 0.0 3.3 4.0 0.0 0.0 2.2 0.0 0.0 7.0 2.1 Excellent
MEAN 3.4 3.3 4.0 3.6 3.2 3.6 3.1 3.2 3.7 3.5
STANDARD DEVIATION 1.3 1.4 1.4 1.4 0.8 1.2 1.4 1.4 1.6 1.4
MEDIAN 3.5 3.1 3.7 3.6 3.2 3.7 3.3 3.2 3.7 3.4
NO. SUBJECTS 34 30 50 34 26 45 29 49 43 340 RESPONDING
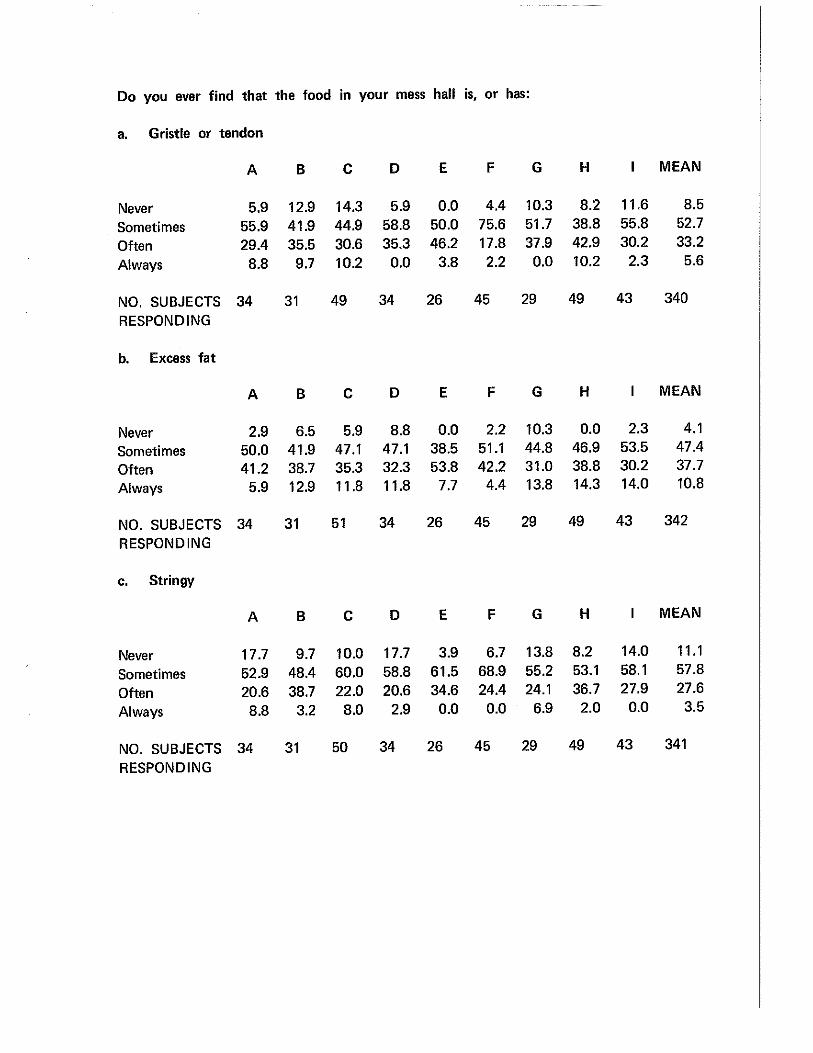
Do you ever find that the food in your mess hall is, or has:
a. Gristle or tendon
A B c D E F G H MEAN
Never 5.9 12.9 14.3 5.9 0.0 4.4 10.3 8.2 11.6 8.5
Sometimes 55.9 41.9 44.9 58.8 50.0 75.6 51.7 38.8 55.8 52.7
Often 29.4 35.5 30.6 35.3 46.2 17.8 37.9 42.9 30.2 33.2
Always 8.8 9.7 10.2 0.0 3.8 2.2 0.0 10.2 2.3 5.6
NO. SUBJECTS 34 31 49 34 26 45 29 49 43 340
RESPONDING
b. Excess fat
A B c D E F G H MEAN
Never 2.9 6.5 5.9 8.8 0.0 2.2 10.3 0.0 2.3 4.1
Sometimes 50.0 41.9 47.1 47.1 38.5 51.1 44.8 46.9 53.5 47.4
Often 41.2 38.7 35.3 32.3 53.8 42.2 31.0 38.8 30.2 37.7
Always 5.9 12.9 11.8 11.8 7.7 4.4 13.8 14.3 14.0 10.8
NO. SUBJECTS 34 31 51 34 26 45 29 49 43 342
RESPONDING
c. Stringy
A B c D E F G H MEAN
Never 17.7 9.7 10.0 17.7 3.9 6.7 13.8 8.2 14.0 11.1
Sometimes 52.9 48.4 60.0 58.8 61.5 68.9 55.2 53.1 58.1 57.8
Often 20.6 38.7 22.0 20.6 34.6 24.4 24.1 36.7 27.9 27.6
Always 8.8 3.2 8.0 2.9 0.0 0.0 6.9 2.0 0.0 3.5
NO. SUBJECTS 34 31 50 34 26 45 29 49 43 341
RESPONDING
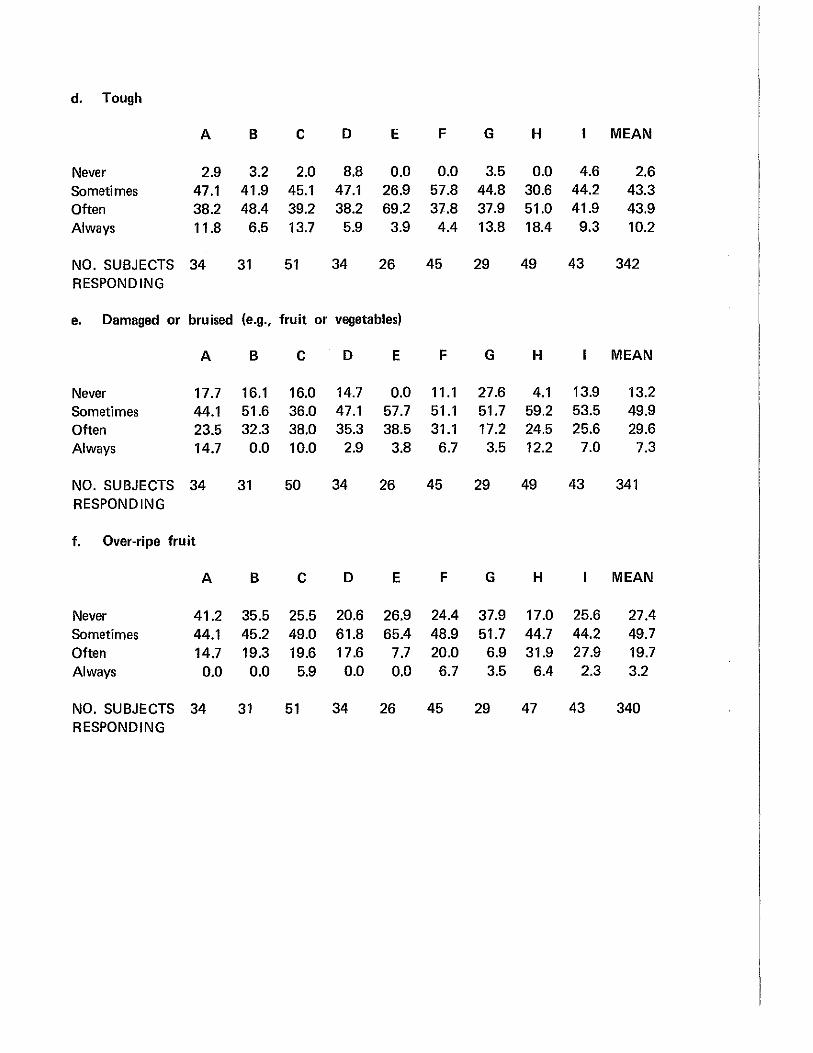
d. Tough
A B c D E F G H MEAN
Never 2.9 3.2 2.0 8.8 0.0 0.0 3.5 0.0 4.6 2.6 Sometimes 47.1 41.9 45.1 47.1 26.9 57.8 44.8 30.6 44.2 43.3 Often 38.2 48.4 39.2 38.2 69.2 37.8 37.9 51.0 41.9 43.9 Always 11.8 6.5 13.7 5.9 3.9 4.4 13.8 18.4 9.3 10.2
NO. SUBJECTS 34 31 51 34 26 45 29 49 43 342 RESPONDING
e. Damaged or bruised (e.g., fruit or vegetables)
A B c D E F G H MEAN
Never 17.7 16.1 16.0 14.7 0.0 11.1 27.6 4.1 13.9 13.2 Sometimes 44.1 51.6 36.0 47.1 57.7 51.1 51.7 59.2 53.5 49.9 Often 23.5 32.3 38.0 35.3 38.5 31.1 17.2 24.5 25.6 29.6 Always 14.7 0.0 10.0 2.9 3.8 6.7 3.5 12.2 7.0 7.3
NO. SUBJECTS 34 31 50 34 26 45 29 49 43 341 RESPONDING
f. Over-ripe fruit
A B c D E F G H MEAN
Never 41.2 35.5 25.5 20.6 26.9 24.4 37.9 17.0 25.6 27.4 Sometimes 44.1 45.2 49.0 61.8 65.4 48.9 51.7 44.7 44.2 49.7 Often 14.7 19.3 19.6 17.6 7.7 20.0 6.9 31.9 27.9 19.7 Always 0.0 0.0 5.9 0.0 0.0 6.7 3.5 6.4 2.3 3.2
NO. SUBJECTS 34 31 51 34 26 45 29 47 43 340 RESPONDING
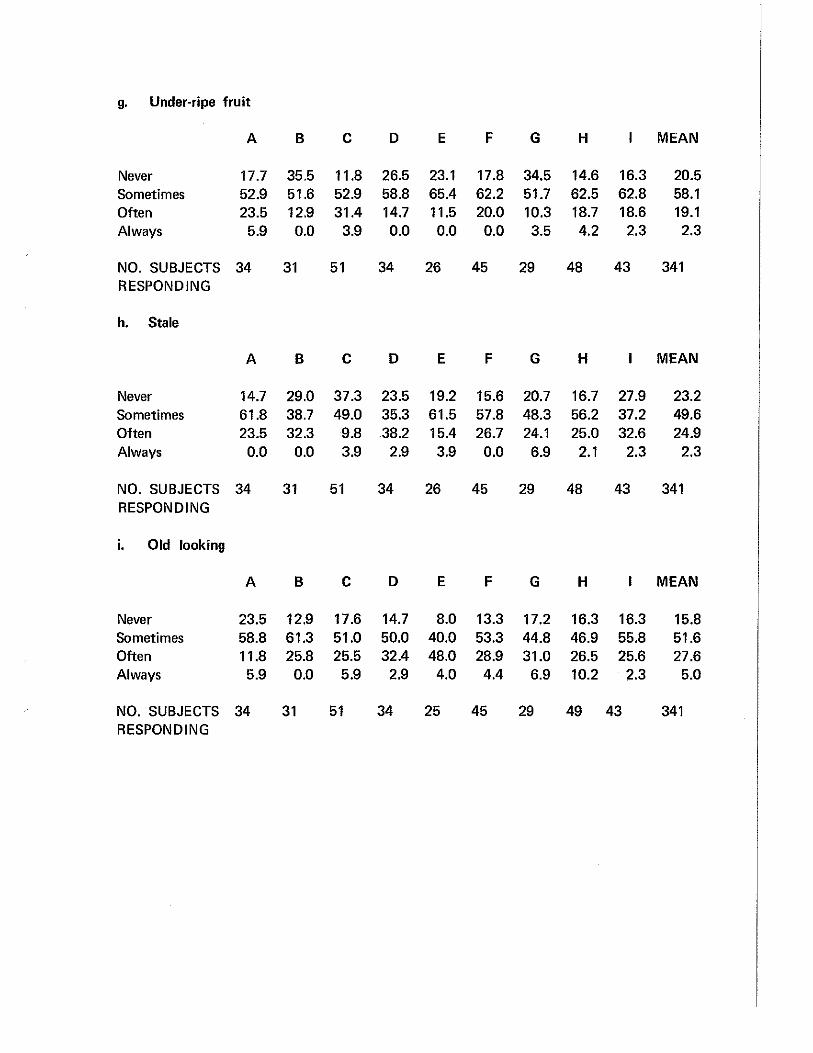
g. Under-ripe fruit
A B c D E F G H MEAN
Never 17.7 35.5 11.8 26.5 23.1 17.8 34.5 14.6 16.3 20.5 Sometimes 52.9 51.6 52.9 58.8 65.4 62.2 51.7 62.5 62.8 58.1 Often 23.5 12.9 31.4 14.7 11.5 20.0 10.3 18.7 18.6 19.1 Always 5.9 0.0 3.9 0.0 0.0 0.0 3.5 4.2 2.3 2.3
NO. SUBJECTS 34 31 51 34 26 45 29 48 43 341 RESPONDING
h. Stale
A B c D E F G H MEAN
Never 14.7 29.0 37.3 23.5 19.2 15.6 20.7 16.7 27.9 23.2 Sometimes 61.8 38.7 49.0 35.3 61.5 57.8 48.3 56.2 37.2 49.6 Often 23.5 32.3 9.8 38.2 15.4 26.7 24.1 25.0 32.6 24.9 Always 0.0 0.0 3.9 2.9 3.9 0.0 6.9 2.1 2.3 2.3
NO. SUBJECTS 34 31 51 34 26 45 29 48 43 341 RESPONDING
i. Old looking
A B c D E F G H MEAN
Never 23.5 12.9 17.6 14.7 8.0 13.3 17.2 16.3 16.3 15.8 Sometimes 58.8 61.3 51.0 50.0 40.0 53.3 44.8 46.9 55.8 51.6 Often 11.8 25.8 25.5 32.4 48.0 28.9 31.0 26.5 25.6 27.6 Always 5.9 0.0 5.9 2.9 4.0 4.4 6.9 10.2 2.3 5.0
NO. SUBJECTS 34 31 51 34 25 45 29 49 43 341 RESPONDING
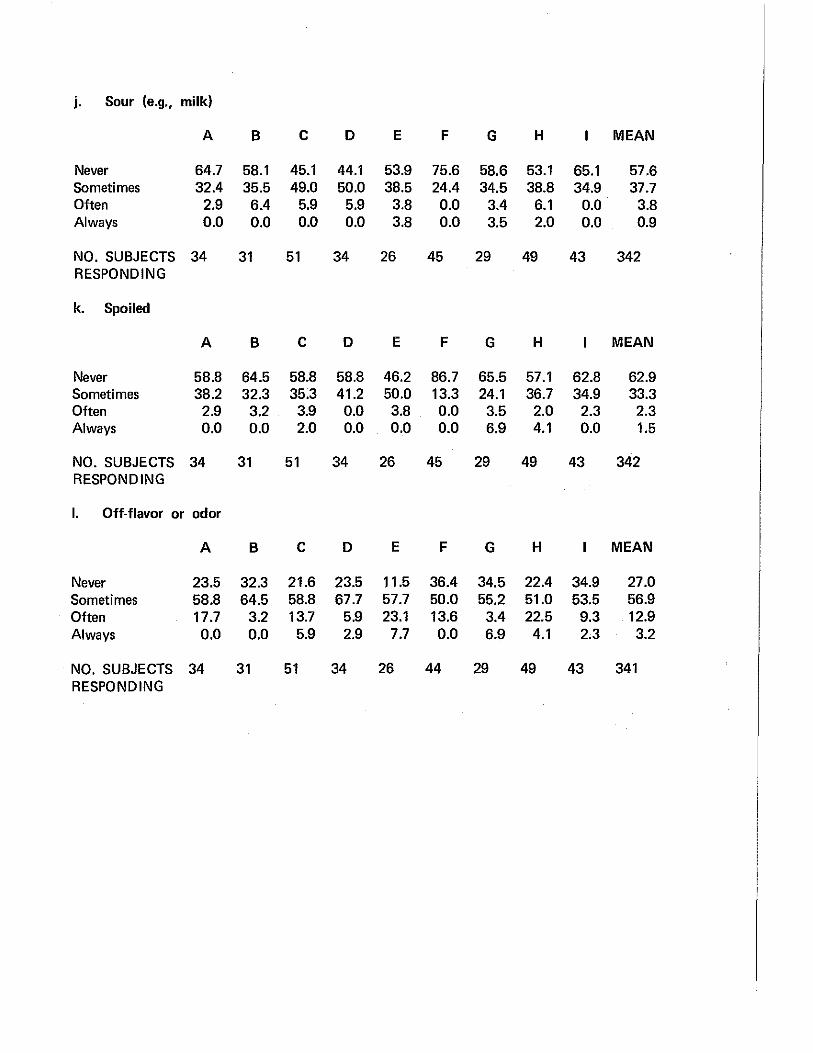
j. Sour (e.g., milk)
A B c D E F G H MEAN
Never 64.7 58.1 45.1 44.1 53.9 75.6 58.6 53.1 65.1 57.6 Sometimes 32.4 35.5 49.0 50.0 38.5 24.4 34.5 38.8 34.9 37.7 Often 2.9 6.4 5.9 5.9 3.8 0.0 3.4 6.1 0.0 3.8 Always 0.0 0.0 0.0 0.0 3.8 0.0 3.5 2.0 0.0 0.9
NO. SUBJECTS 34 31 51 34 26 45 29 49 43 342 RESPONDING
k. Spoiled
A B c D E F G H MEAN
Never 58.8 64.5 58.8 58.8 46.2 86.7 65.5 57.1 62.8 62.9 Sometimes 38.2 32.3 35.3 41.2 50.0 13.3 24.1 36.7 34.9 33.3 Often 2.9 3.2 3.9 0.0 3.8 0.0 3.5 2.0 2.3 2.3 Always 0.0 0.0 2.0 0.0 0.0 0.0 6.9 4.1 0.0 1.5
NO. SUBJECTS 34 31 51 34 26 45 29 49 43 342 RESPONDING
I. Off-flavor or odor
A B c D E F G H MEAN
Never 23.5 32.3 21.6 23.5 11.5 36.4 34.5 22.4 34.9 27.0 Sometimes 58.8 64.5 58.8 67.7 57.7 50.0 55.2 51.0 53.5 56.9 Often 17.7 3.2 13.7 5.9 23.1 13.6 3.4 22.5 9.3 12.9 Always 0.0 0.0 5.9 2.9 7.7 0.0 6.9 4.1 2.3 3.2
NO. SUBJECTS 34 31 51 34 26 44 29 49 43 341 RESPONDING

Answer the following questions for the normal meal only. Exclude the short·order meal.
a. What is your opinion of the amount of meat served:
A B c D E F G H MEAN
1- 32.4 29.0 35.3 32.4 42.3 33.3 31.0 30.6 27.9 32.5
Too little
2 17.6 35.5 13.7 11.8 38.5 33.3 34.5 16.3 23.3 23.7
3 26.5 22.6 27.4 11.8 19.2 20.0 24.1 40.8 25.6 25.1
4- 14.7 9.7 19.6 38.2 0.0 13.3 6.9 8.2 20.9 15.2
About right
5 5.9 3.2 2.0 2.9 0.0 0.0 3.5 2.0 0.0 2.0
6 2.9 0.0 2.0 2.9 0.0 0.0 0.0 2.0 2.3 1.5
7- 0.0 0.0 0.0 0.0 0.0 0.0 0.0 0.0 0.0 0.0
Too much
MEAN 2.5 2.2 2.4 2.8 1.8 2.1 2.2 2.4 2.5 2.4
STANDARD DEVIATION 1.4 1.1 1.3 1.5 0.8 1.0 1.1 1.2 1.2 1.2
MEDIAN 2.5 2.1 2.5 3.0 1.7 2.0 2.1 2.6 2.5 2.2
NO. SUBJECTS 34 31 51 34 26 45 29 49 43 342 RESPONDING

b. What is your opinion of the amount of vegetables served:
A B c D E F G H MEAN
1- 14.7 6.7 7.8 8.8 11.5 11.1 10.3 6.1 18.6 10.6 Too little
2 14.7 3.3 9.8 11.8 15.4 11.1 6.9 10.2 16.3 11.1
3 11.8 10.0 21.6 11.8 19.2 24.4 31.0 34.7 13.9 20.5
4- 47.1 60.0 47.1 47.1 53.9 40.0 34.5 40.8 41.9 45.2 About right
5 5.9 20.0 7.8 11.8 0.0 8.9 10.3 4.1 7.0 8.2
6 5.9 0.0 5.9 2.9 0.0 0.0 6.9 2.0 2.3 2.9
7- 0.0 0.0 0.0 5.9 0.0 4.4 0.0 2.0 0.0 1.5 Too much
MEAN 3.3 3.8 3.5 3.7 3.2 3.4 3.5 3.4 3.1 3.4
STANDARD DEVIATION 1.4 1.0 1.2 1.5 1.1 1.4 1.3 1.1 1.4 1.3
MEDIAN 3.7 4.0 3.7 3.9 3.6 3.6 3.5 3.5 3.5 3.7
NO. SUBJECTS 34 30 51 34 26 45 29 49 43 341 RESPONDING

c. What is your opinion of the amount of potatoes served:
A B c D E F G H MEAN
1- 5.9 3.2 8.0 5.9 3.8 11.1 6.9 10.2 9.3 7.6
Too little
2 0.0 3.2 4.0 2.9 3.8 6.7 3.5 10.2 4.7 4.7
3 5.9 12.9 12.0 5.9 23.1 22.2 17.2 16.3 9.3 13.8
4- 23.5 35.5 36.0 32.4 23.1 22.2 27.6 28.6 44.2 30.8 About right
5 11.8 9.7 8.0 8.8 0.0 11.1 10.3 8.2 2.3 7.9
6 23.5 12.9 8.0 11.8 11.5 4.4 20.7 12.2 4.6 11.4
7- 29.4 22.6 24.0 32.4 34.6 22.2 13.8 14.3 25.6 23.8 Too much
MEAN 5.2 4.7 4.5 5.0 4.8 4.2 4.5 4.1 4.4 4.6
STANDARD DEVIATION 1.7 1.7 1.8 1.8 1.9 2.0 1.7 1.8 1.9 1.8
MEDIAN 5.6 4.4 4.2 4.8 4.3 4.0 4.3 4.0 4.1 4.3
NO. SUBJECTS 34 31 50 34 26 45 29 49 43 341
RESPONDING
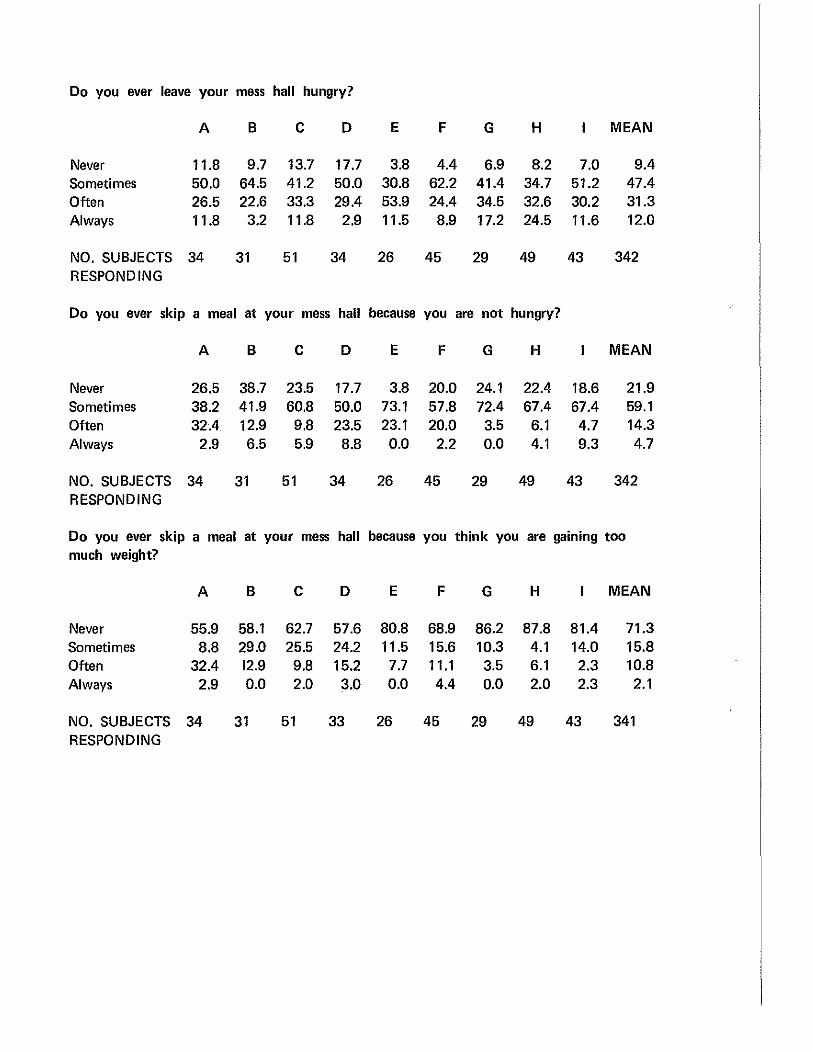
Do you ever leave your mess hall hungry?
A B c D E F G H MEAN
Never 11.8 9.7 13.7 17.7 3.8 4.4 6.9 8.2 7.0 9.4 Sometimes 50.0 64.5 41.2 50.0 30.8 62.2 41.4 34.7 51.2 47.4 Often 26.5 22.6 33.3 29.4 53.9 24.4 34.5 32.6 30.2 31.3 Always 11.8 3.2 11.8 2.9 11.5 8.9 17.2 24.5 11.6 12.0
NO. SUBJECTS 34 31 51 34 26 45 29 49 43 342 RESPONDING
Do you ever skip a meal at your mess hall because you are not hungry?
A B c D E F G H MEAN
Never 26.5 38.7 23.5 17.7 3.8 20.0 24.1 22.4 18.6 21.9 Sometimes 38.2 41.9 60.8 50.0 73.1 57.8 72.4 67.4 67.4 59.1 Often 32.4 12.9 9.8 23.5 23.1 20.0 3.5 6.1 4.7 14.3 Always 2.9 6.5 5.9 8.8 0.0 2.2 0.0 4.1 9.3 4.7
NO. SUBJECTS 34 31 51 34 26 45 29 49 43 342 RESPONDING
Do you ever skip a meal at your mess hall because you think you are gaining too much weight?
A B c D E F G H MEAN
Never 55.9 58.1 62.7 57.6 80.8 68.9 86.2 87.8 81.4 71.3 Sometimes 8.8 29.0 25.5 24.2 11.5 15.6 10.3 4.1 14.0 15.8 Often 32.4 12.9 9.8 15.2 7.7 11.1 3.5 6.1 2.3 10.8 Always 2.9 0.0 2.0 3.0 0.0 4.4 0.0 2.0 2.3 2.1
NO. SUBJECTS 34 31 51 33 26 45 29 49 43 341 RESPONDING

Do you serve yourself or do the mess hall personnel serve you the following items? Circle the items which you serve yourself. 3
A B c D E F G H MEAN Percentage of mess hall answering affirmatively:
Meat item 14.7 0.0 7.8 5.9 3.8 2.2 3.4 10.0 7.0 6.4 Potatoes 17.7 3.2 9.8 8.8 3.8 4.4 6.9 16.0 7.0 9.0 Vegetables 61.8 80.6 66.7 64.7 69.2 24.4 75.9 44.0 20.9 53.6 Salad 88.2 96.8 94.1 91.2 88.5 93.3 93.1 80.0 79.1 88.9 Dessert 79.4 96.8 33.3 17.6 30.8 17.8 51.7 68.0 79.1 52.2 Beverage 91.2 100.0 96.1 91.2 88.5 97.8 100.0 86.0 97.7 94.2
If you had your choice, which of the following items would you prefer to serve yourself? Circle those items which you would prefer to serve yourself.'
A B c D E F G H Percentage of mess hall answering affirmatively:
Meat item 76.5 77.4 82.4 79.4 96.2 68.9 89.7 88.0 74.4 Potatoes 61.8 51.6 54.9 44.1 69.2 62.2 55.2 60.0 58.1 Vegetables 70.6 64.5 64.7 55.9 69.2 71.1 62.1 58.0 65.1 Salad 58.8 67.7 64.7 61.8 69.2 60.0 65.5 64.0 62.8 Dessert 64.7 74.2 88.2 64.7 76.9 66.7 72.4 66.0 65.1 Beverage 70.6 90.3 74.5 82.4 88.5 75.6 69.0 70.0 76.7
3 Note: Percentages do not add up to 100% because subjects were permitted to choose as many or as few items as desired.
MEAN
80.8 57.4 64.4 63.6 71.1 76.7

Do you ever not eat or throw away any of the food which you are served in your mess hall?
a. Meat item
A B c D E F G H MEAN
Never 15.2 32.3 17.7 18.2 7.7 24.4 20.7 20.4 20.9 20.0 Sometimes 63.6 54.8 68.6 69.7 73.1 71.1 51.7 51.0 48.8 61.2 Often 21.2 12.9 13.7 12.1 19.2 4.4 27.6 22.5 30.2 17.9 Always 0.0 0.0 0.0 0.0 0.0 0.0 0.0 6.1 0.0 0.9
NO. SUBJECTS 33 31 51 33 26 45 29 49 43 340 RESPONDING
b. Potatoes
A B c D E F G H MEAN
Never 20.6 19.3 19.6 3.0 0.0 13.3 20.7 16.3 11.6 14.4 Sometimes 38.2 35.5 52.9 51.5 57.7 60.0 48.3 34.7 51.2 47.8 Often 38.2 38.7 27.5 33.3 38.5 24.4 27.6 38.8 32.6 32.8 Always 2.9 6.4 0.0 12.1 3.8 2.2 3.4 10.2 4.6 5.0
NO. SUBJECTS 34 31 51 33 26 45 29 49 43 341 RESPONDING
c. Vegetables
A B c D E F G H MEAN
Never 21.2 19.4 15.7 17.7 11.5 15.6 34.5 14.3 14.0 17.6 Sometimes 39.4 48.4 56.9 55.9 65.4 68.9 41.4 53.1 48.8 53.7 Often 36.4 29.0 23.5 23.5 11.5 15.6 17.2 26.5 25.6 23.5 Always 3.0 3.2 3.9 2.9 11.5 0.0 6.9 6.1 11.6 5.3
NO. SUBJECTS 33 31 51 34 26 45 29 49 43 341 RESPONDING

d. Salad
A B c D E F G H MEAN
Never 33.3 54.8 29.4 26.5 38.5 35.6 62.1 26.5 23.3 34.9 Sometimes 42.4 41.9 60.8 52.9 46.2 60.0 27.6 53.1 53.5 50.4 Often 21.2 0.0 7.8 17.7 7.7 2.2 6.9 14.3 11.6 10.0 Always 3.0 3.2 2.0 2.9 7.7 2.2 3.4 6.1 11.6 4.7
NO. SUBJECTS 33 31 51 34 26 45 29 49 43 341 RESPONDING
e. Dessert
A B c D E F G H MEAN
Never 9.1 35.5 25.5 14.7 11.5 20.0 34.5 16.3 11.6 19.7 Sometimes 57.6 54.8 66.7 70.6 57.7 66.7 55.2 57.1 62.8 61.6 Often 24.2 9.7 5.9 8.8 30.8 11.1 6.9 24.5 25.6 16.1 Always 9.1 0.0 2.0 5.9 0.0 2.2 3.4 2.0 0.0 2.6
NO. SUBJECTS 33 31 51 34 26 45 29 49 43 341 RESPONDING
f. Beverage
A B c D E F G H MEAN
Never 78.1 82.8 74.0 58.8 61.5 84.4 86.2 61.2 69.8 72.7 Sometimes 15.6 17.2 22.0 41.2 30.8 13.3 13.8 32.7 25.6 23.7 Often 3.1 0.0 4.0 0.0 7.7 2.2 0.0 4.1 2.3 2.7 Always 3.1 0.0 0.0 0.0 0.0 0.0 0.0 2.0 2.3 0.9
NO. SUBJECTS 32 29 50 34 26 45 29 49 43 337 RESPONDING
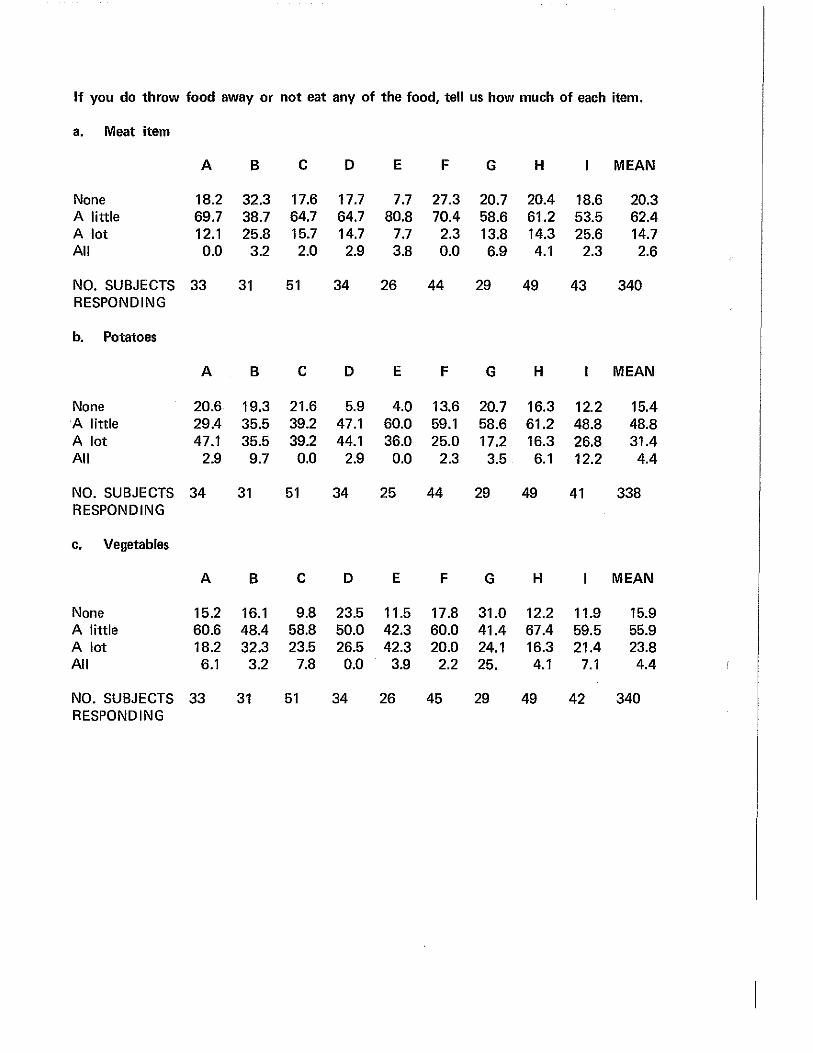
If you do throw food away or not eat any of the food, tell us how much of each item.
a. Meat item
A B c D E F G H MEAN
None 18.2 32.3 17.6 17.7 7.7 27.3 20.7 20.4 18.6 20.3 A little 69.7 38.7 64.7 64.7 80.8 70.4 58.6 61.2 53.5 62.4 A lot 12.1 25.8 15.7 14.7 7.7 2.3 13.8 14.3 25.6 14.7 All 0.0 3.2 2.0 2.9 3.8 0.0 6.9 4.1 2.3 2.6
NO. SUBJECTS 33 31 51 34 26 44 29 49 43 340 RESPONDING
b. Potatoes
A B c D E F G H MEAN
None 20.6 19.3 21.6 5.9 4.0 13.6 20.7 16.3 12.2 15.4 A little 29.4 35.5 39.2 47.1 60.0 59.1 58.6 61.2 48.8 48.8 A lot 47.1 35.5 39.2 44.1 36.0 25.0 17.2 16.3 26.8 31.4 All 2.9 9.7 0.0 2.9 0.0 2.3 3.5 6.1 12.2 4.4
NO. SUBJECTS 34 31 51 34 25 44 29 49 41 338 RESPONDING
c. Vegetables
A B c D E F G H MEAN
None 15.2 16.1 9.8 23.5 11.5 17.8 31.0 12.2 11.9 15.9 A little 60.6 48.4 58.8 50.0 42.3 60.0 41.4 67.4 59.5 55.9 A lot 18.2 32.3 23.5 26.5 42.3 20.0 24.1 16.3 21.4 23.8 All 6.1 3.2 7.8 0.0 3.9 2.2 25. 4.1 7.1 4.4
NO. SUBJECTS 33 31 51 34 26 45 29 49 42 340 RESPONDING

d. Salad
A B c D E F G H MEAN
None 36.4 51.6 24.0 26.5 38.5 27.3 44.8 20.4 26.2 31.1 A little 48.5 38.7 66.0 50.0 30.8 59.1 51.7 65.3 59.5 54.4 A lot 12.1 6.5 10.0 20.6 19.2 9.1 3.4 8.2 4.8 10.1 All 3.0 3.2 0.0 2.9 11.5 4.5 0.0 6.1 9.5 4.4
NO. SUBJECTS 33 31 50 34 26 44 29 49 42 338 RESPONDING
e. Dessert
A B c D E F G H MEAN
None 6.1 29.0 32.0 14.7 15.4 20.5 41.4 20.4 14.6 21.7 A little 63.6 48.4 50.0 67.6 53.8 63.6 51.7 53.1 53.7 56.1 A lot 24.2 19.4 14.0 11.8 26.9 9.1 6.9 20.4 24.4 17.2 All 6.1 3.2 4.0 5.9 3.9 6.8 0.0 6.1 7.3 5.0
NO. SUBJECTS 33 31 50 34 26 44 29 49 41 337 RESPONDING
f. Beverage
A B c D E F G H MEAN
None 75.0 80.0 70.0 58.8 68.0 81.8 79.3 57.1 69.8 70.5 A little 18.8 13.3 26.0 35.3 28.0 15.9 17.2 36.7 25.6 24.7 A lot 3.1 3.3 4.0 0.0 4.0 2.3 0.0 0.0 2.3 2.1 All 3.1 3.3 0.0 5.9 0.0 0.0 3.5 6.1 2.3 2.7
NO. SUBJECTS 32 30 50 34 25 44 29 49 43 336 RESPONDING

What is your opinion of the ability of the cooks in your mess hall?
A B c D E F G H MEAN
1- 20.6 10.0 16.0 14.7 30.8 13.6 31.0 10.4 22.5 17.9 Very poor
2 14.7 13.3 18.0 14.7 23.1 15.9 10.3 12.5 5.0 14.0
3 14.7 20.0 20.0 23.5 23.1 25.0 20.7 20.8 10.0 19.7
4- 35.3 20.0 36.0 38.2 23.1 27.3 27.6 43.8 35.0 32.8 Average
5 2.9 23.3 4.0 2.9 0.0 15.9 3.5 12.5 17.5 9.6
6 8.8 10.0 6.0 2.9 0.0 0.0 6.9 0.0 0.0 3.6
7- 2.9 3.3 0.0 2.9 0.0 2.3 0.0 0.0 10.0 2.4 Excellent
MEAN 3.2 3.8 3.1 3.2 2.4 3.2 2.8 3.4 3.6 3.2
STANDARD DEVIATION 1.7 1.6 1.4 1.4 1.2 1.4 1.6 1.2 1.8 1.5
MEDIAN 3.5 3.8 3.3 3.4 2.3 3.3 2.9 3.6 3.9 3.4
NO. SUBJECTS 34 30 50 34 26 44 29 48 40 335 RESPONDING

Do you think the cooks in your mess hall are doing their job to the best of their ability?
A B c D E F G H MEAN
1- 17.7 16.1 21.6 23.5 53.8 24.4 34.5 16.0 37.2 25.9 No, definitely not
2 8.8 9.7 15.7 11.8 19.2 11.1 13.8 4.0 9.3 11.1
3 20.6 19.3 15.7 17.7 15.4 17.8 17.2 14.0 9.3 16.0
4 23.5 22.6 27.4 14.7 3.9 26.7 13.8 30.0 20.9 21.9
5 2.9 12.9 9.8 17.7 7.7 8.9 10.3 10.0 7.0 9.6
6 14.7 9.7 5.9 2.9 0.0 2.2 10.3 10.0 11.6 7.6
7- 11.8 9.7 3.9 11.8 0.0 8.9 0.0 16.0 4.7 7.9 Yes, very much so
MEAN 3.8 3.7 3.2 3.5 1.9 3.3 2.8 4.1 3.0 3.3
STANDARD DEVIATION 2.0 1.9 1.7 2.0 1.3 1.8 1.8 1.9 2.0 1.9
MEDIAN 3.6 3.7 3.3 3.3 1.4 3.3 2.6 4.0 2.9 3.3
NO. SUBJECTS 34 31 51 34 26 45 29 50 43 343 RESPONDING

Do you consider the sanitary conditions in the dining room of your mess hall to be satisfactory or unsatisfactory?
A B c D E F G H MEAN
Satisfactory 82.4 83.9 78.4 91.2 73.1 84.4 69.0 88.0 86.0 82.5
Unsatis- 17.6 16.1 21.6 8.8 26.9 15.6 31.0 12.0 14.0 17.5 factory
NO. SUBJECTS 34 31 51 34 26 45 29 50 43 343 RESPONDING
Do you consider the sanitary conditions of the kitchen area of your mess hall to be satisfactory or unsatisfactory?
A B c D E F G H MEAN
Satisfactory 72.7 83.9 74.5 94.1 69.2 80.0 75.9 86.0 81.4 80.1
Unsatis- 27.3 16.1 25.5 5.9 30.8 20.0 24.1 14.0 18.6 19.1 factory
NO. SUBJECTS 33 31 51 34 26 45 29 50 43 343 RESPONDING
Do you consider the sanitary conditions of the outside of your mess hall to be satisfactory or unsatisfactory?
A B c D E F G H MEAN
Satisfactory 82.4 83.9 84.3 91.2 80.8 82.2 72.4 84.0 69.8 81.3
Unsatis- 17.6 16.1 15.7 8.8 19.2 17.8 27.6 16.0 30.2 18.7 factory
NO. SUBJECTS 34 31 51 34 26 45 29 50 43 343 RESPONDING
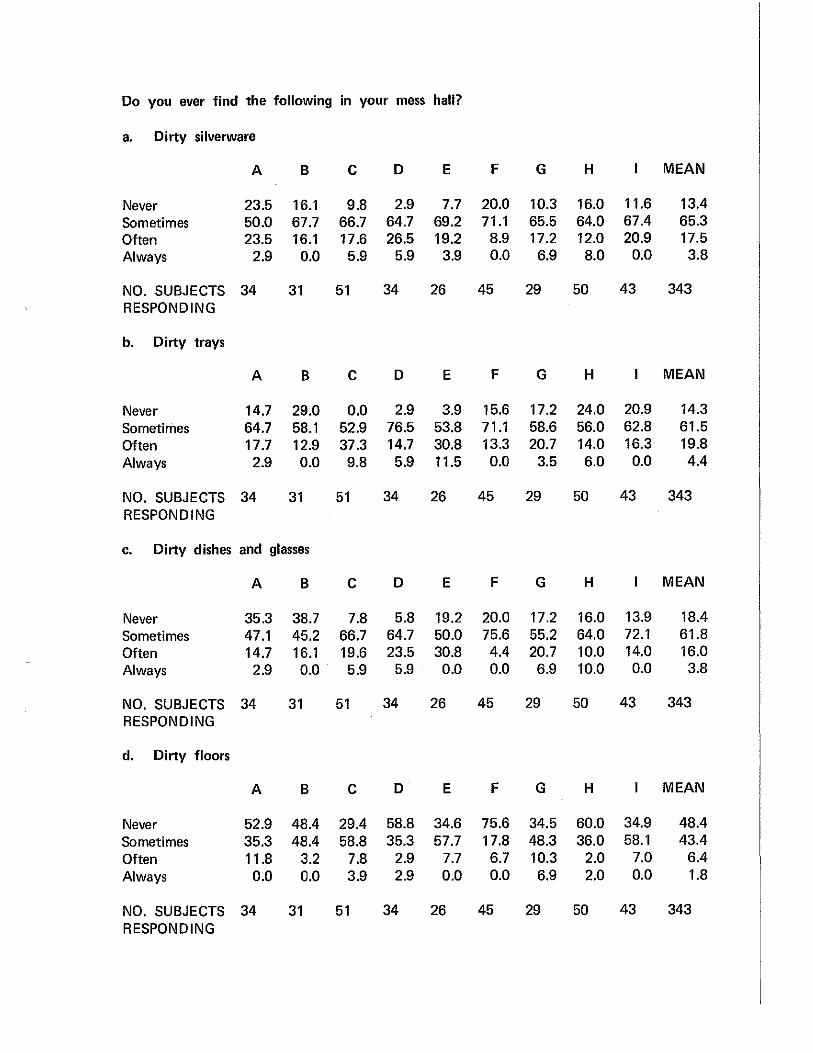
Do you ever find the following in your mess hall?
a. Dirty silverware
A B c D E F G H MEAN
Never 23.5 16.1 9.8 2.9 7.7 20.0 10.3 16.0 11.6 13.4 Sometimes 50.0 67.7 66.7 64.7 69.2 71.1 65.5 64.0 67.4 65.3 Often 23.5 16.1 17.6 26.5 19.2 8.9 17.2 12.0 20.9 17.5 Always 2.9 0.0 5.9 5.9 3.9 0.0 6.9 8.0 0.0 3.8
NO. SUBJECTS 34 31 51 34 26 45 29 50 43 343 RESPONDING
b. Dirty trays
A B c D E F G H MEAN
Never 14.7 29.0 0.0 2.9 3.9 15.6 17.2 24.0 20.9 14.3 Sometimes 64.7 58.1 52.9 76.5 53.8 71.1 58.6 56.0 62.8 61.5 Often 17.7 12.9 37.3 14.7 30.8 13.3 20.7 14.0 16.3 19.8 Always 2.9 0.0 9.8 5.9 11.5 0.0 3.5 6.0 0.0 4.4
NO. SUBJECTS 34 31 51 34 26 45 29 50 43 343 RESPONDING
c. Dirty dishes and glasses
A B c D E F G H MEAN
Never 35.3 38.7 7.8 5.8 19.2 20.0 17.2 16.0 13.9 18.4 Sometimes 47.1 45.2 66.7 64.7 50.0 75.6 55.2 64.0 72.1 61.8 Often 14.7 16.1 19.6 23.5 30.8 4.4 20.7 10.0 14.0 16.0 Always 2.9 0.0 5.9 5.9 0.0 0.0 6.9 10.0 0.0 3.8
NO. SUBJECTS 34 31 51 34 26 45 29 50 43 343 RESPONDING
d. Dirty floors
A B c D E F G H MEAN
Never 52.9 48.4 29.4 58.8 34.6 75.6 34.5 60.0 34.9 48.4 Sometimes 35.3 48.4 58.8 35.3 57.7 17.8 48.3 36.0 58.1 43.4 Often 11.8 3.2 7.8 2.9 7.7 6.7 10.3 2.0 7.0 6.4 Always 0.0 0.0 3.9 2.9 0.0 0.0 6.9 2.0 0.0 1.8
NO. SUBJECTS 34 31 51 34 26 45 29 50 43 343 RESPONDING

e. Dirty tables and chairs
A B c D E F G H MEAN
Never 47.1 41.9 15.7 29.4 26.9 55.6 31.0 48.0 30.2 36.4 Sometimes 32.4 41.9 58.8 64.7 53.8 37.8 41.4 46.0 58.1 48.7 Often 17.6 16.1 19.6 2.9 15.4 6.7 20.7 4.0 7.0 11.7 Always 2.9 0.0 5.9 2.9 3.9 0.0 6.9 2.0 4.7 3.2
NO. SUBJECTS 34 31 51 34 26 45 29 50 43 343 RESPONDING
f. Dirty dispensing devices
A B c D E F G H MEAN
Never 38.2 58.1 23.5 50.0 26.9 71.1 31.0 50.0 27.9 42.3 Sometimes 41.2 32.3 60.8 41.2 65.4 26.7 44.8 42.0 60.5 46.1 Often 20.6 9.7 9.8 5.9 3.9 2.2 17.2 6.0 11.6 9.3 Always 0.0 0.0 5.9 2.9 3.8 0.0 6.9 2.0 0.0 2.3
NO. SUBJECTS 34 31 51 34 26 45 29 50 43 343 RESPONDING
Do the cooks in your mess hall have a clean and neat appearance?
A B c D E F G H MEAN
Never 11.8 0.0 3.9 8.8 11.5 4.6 6.9 6.0 4.8 6.2 Sometimes 52.9 25.8 37.2 38.2 46.2 20.4 51.7 26.0 47.6 37.2 Often 26.5 61.3 41.2 26.5 38.5 56.8 37.9 50.0 30.9 41.6 Always 8.8 12.9 17.7 26.5 3.8 18.2 3.5 18.0 16.7 15.0
NO. SUBJECTS 34 31 51 34 26 44 29 50 42 341 RESPONDING
Do the KPs have a clean appearance in your mess hall?
A B c D E F G H MEAN
Never 14.7 9.7 9.8 14.7 26.9 9.1 10.3 18.0 14.3 13.8 Sometimes 44.1 38.7 54.9 47.1 53.8 43.2 65.5 32.0 38.1 45.5 Often 29.4 38.7 27.5 26.5 15.4 29.6 20.7 34.0 35.7 29.3 Always 11.8 12.9 7.8 11.8 3.9 18.2 3.5 16.0 11.9 11.4
NO. SUBJECTS 34 31 51 34 26 44 29 50 42 341 RESPONDING
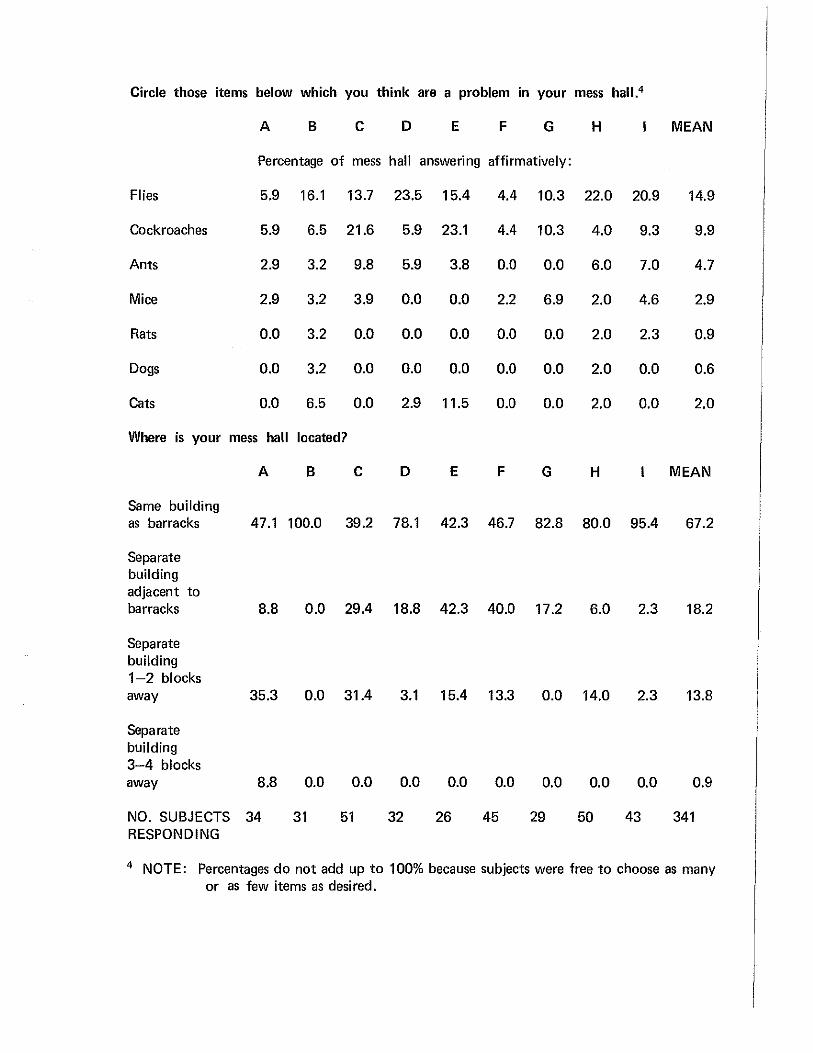
Circle those items below which you think are a problem in your mess hall.4
A B c D E F G H MEAN
Percentage of mess hall answering affirmatively:
Flies 5.9 16.1 13.7 23.5 15.4 4.4 10.3 22.0 20.9 14.9
Cockroaches 5.9 6.5 21.6 5.9 23.1 4.4 10.3 4.0 9.3 9.9
Ants 2.9 3.2 9.8 5.9 3.8 0.0 0.0 6.0 7.0 4.7
Mice 2.9 3.2 3.9 0.0 0.0 2.2 6.9 2.0 4.6 2.9
Rats 0.0 3.2 0.0 0.0 0.0 0.0 0.0 2.0 2.3 0.9
Dogs 0.0 3.2 0.0 0.0 0.0 0.0 0.0 2.0 0.0 0.6
Cats 0.0 6.5 0.0 2.9 11.5 0.0 0.0 2.0 0.0 2.0
Where is your mess hall located?
A B c D E F G H MEAN
Same building as barracks 47.1 100.0 39.2 78.1 42.3 46.7 82.8 80.0 95.4 67.2
Separate building adjacent to barracks 8.8 0.0 29.4 18.8 42.3 40.0 17.2 6.0 2.3 18.2
Separate building 1-2 blocks away 35.3 0.0 31.4 3.1 15.4 13.3 0.0 14.0 2.3 13.8
Separate building 3-4 blocks away 8.8 0.0 0.0 0.0 0.0 0.0 0.0 0.0 0.0 0.9
NO. SUBJECTS 34 31 51 32 26 45 29 50 43 341 RESPONDING
4 NOTE: Percentages do not add up to 100% because subjects were free to choose as many or as few items as desired.

Where is your military job located:
A B c D E F G H MEAN
Same building as barracks 11.8 12.9 7.8 29.4 19.2 28.9 37.9 4.0 20.9 18.1
Within the company area 2.9 0.0 3.9 14.7 3.9 4.4 10.3 2.0 2.3 4.7
Outside company area, 1-2 blocks 17.7 58.1 74.5 8.8 42.3 24.4 3.5 2.0 9.3 27.1
Greater than 3-4 blocks 67.6 29.0 5.9 8.8 19.2 20.0 37.9 90.0 67.4 39.9
Changes daily 0.0 0.0 7.9 38.2 15.4 22.2 10.4 2.0 0.0 10.2
NO. SUBJECTS 34 31 51 34 26 45 29 50 43 343 RESPONDING
How do you usually get to and from your military job?
A B c D E F G H MEAN
Walk 50.0 64.5 94.1 50.0 50.0 62.2 48.3 6.1 23.3 49.7
Drive my car 23.5 25.8 2.0 17.7 26.9 20.0 17.2 30.6 41.9 22.5
Ride with a friend 8.8 3.2 2.0 2.9 7.7 6.7 17.2 22.5 32.6 12.0
Post bus service 8.8 0.0 0.0 0.0 0.0 0.0 3.5 4.1 2.3 2.0
Hitchhike 2.9 0.0 0.0 0.0 0.0 2.2 0.0 2.0 0.0 0.9
Other 5.9 6.5 1.9 29.4 15.4 8.9 13.8 34.7 0.0 12.9
NO. SUBJECTS 34 31 51 34 26 45 29 49 43 342 RESPONDING
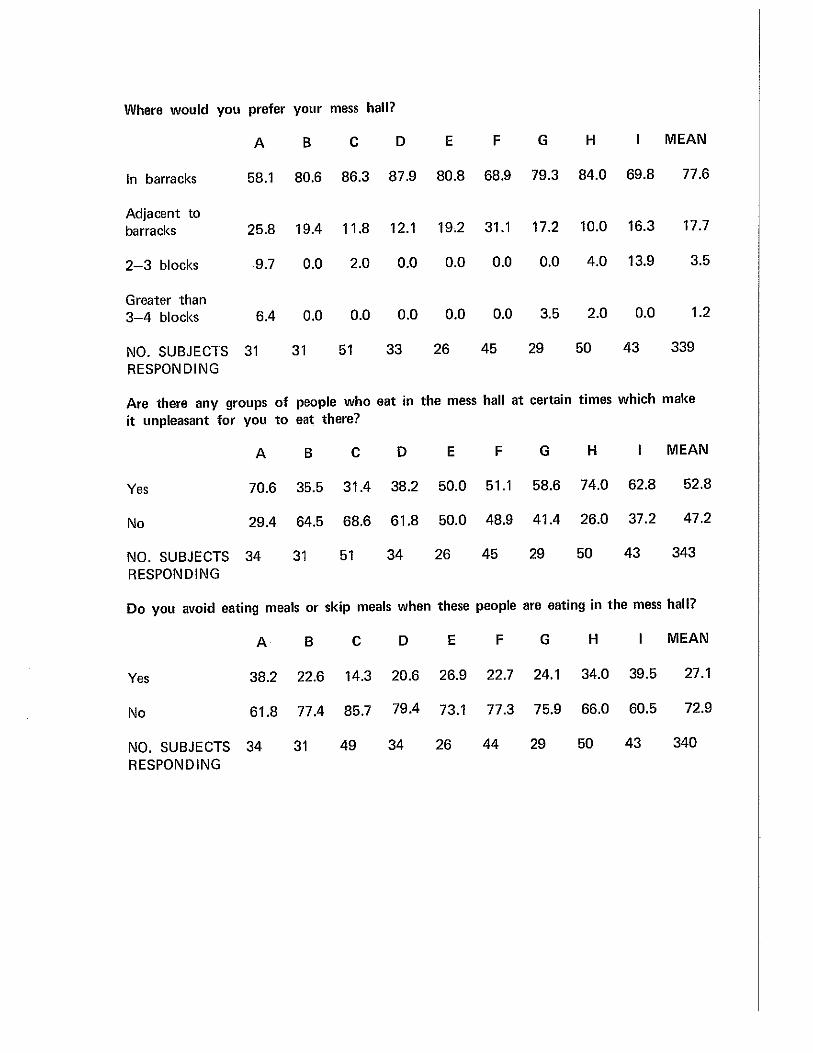
Where would you prefer your mess hall?
A B c D E F G H MEAN
In barracks 58.1 80.6 86.3 87.9 80.8 68.9 79.3 84.0 69.8 77.6
Adjacent to barracks 25.8 19.4 11.8 12.1 19.2 31.1 17.2 10.0 16.3 17.7
2-3 blocks 9.7 0.0 2.0 0.0 0.0 0.0 0.0 4.0 13.9 3.5
Greater than 3-4 blocks 6.4 0.0 0.0 0.0 0.0 0.0 3.5 2.0 0.0 1.2
NO. SUBJECTS 31 31 51 33 26 45 29 50 43 339
RESPONDING
Are there any groups of people who eat in the mess hall at certain times which make it unpleasant for you to eat there?
A B c D E F G H MEAN
Yes 70.6 35.5 31.4 38.2 50.0 51.1 58.6 74.0 62.8 52.8
No 29.4 64.5 68.6 61.8 50.0 48.9 41.4 26.0 37.2 47.2
NO. SUBJECTS 34 31 51 34 26 45 29 50 43 343
RESPONDING
Do you avoid eating meals or skip meals when these people are eating in the mess hall?
A B c D E F G H MEAN
Yes 38.2 22.6 14.3 20.6 26.9 22.7 24.1 34.0 39.5 27.1
No 61.8 77.4 85.7 79.4 73.1 77.3 75.9 66.0 60.5 72.9
NO. SUBJECTS 34 31 49 34 26 44 29 50 43 340
RESPONDING

How long do you usually have to wait in line to get a meal?
A B c D E F G H MEAN
Never 5.9 6.5 6.0 5.9 0.0 0.0 3.5 2.0 7.0 4.1 1-5 minutes 20.6 16.1 0.0 35.3 3.9 0.0 10.3 4.1 20.9 11.4 5-10 minutes 32.3 16.1 2.0 35.3 19.2 26.7 31.0 22.5 13.9 21.1 10-15 minutes 26.5 38.7 24.0 20.6 42.3 46.7 51.7 46.9 34.9 36.7 Longer 14.7 22.6 68.0 2.9 34.6 26.7 3.5 24.5 23.3 26.7
NO. SUBJECTS 34 31 50 34 26 45 29 49 43 341 RESPONDING
Do you think the wait is too long?
A B c D E F G H MEAN
Yes 61.8 71.0 96.0 45.5 96.2 79.5 65.5 87.8 62.8 75.2
No 38.2 29.0 4.0 54.5 3.9 20.5 34.5 12.2 37.2 24.8
NO. SUBJECTS 34 31 50 33 26 44 29 49 43 339 RESPONDING
How often do you eat somewhere other than your mess hall because the wait in line at your mess hall is too long?
A B c D E F G H MEAN
Never 18.2 38.7 22.0 52.9 15.4 11.1 24.1 14.3 25.6 23.8 Sometimes 45.4 38.7 58.0 29.4 42.3 62.2 55.2 63.3 51.2 51.2 Often 30.3 22.6 18.0 17.7 38.5 26.7 20.7 18.4 20.9 22.9 Always 6.1 0.0 2.0 0.0 3.8 0.0 0.0 4.1 2.3 2.1
NO. SUBJECTS 33 31 50 34 26 45 29 49 43 340 RESPONDING
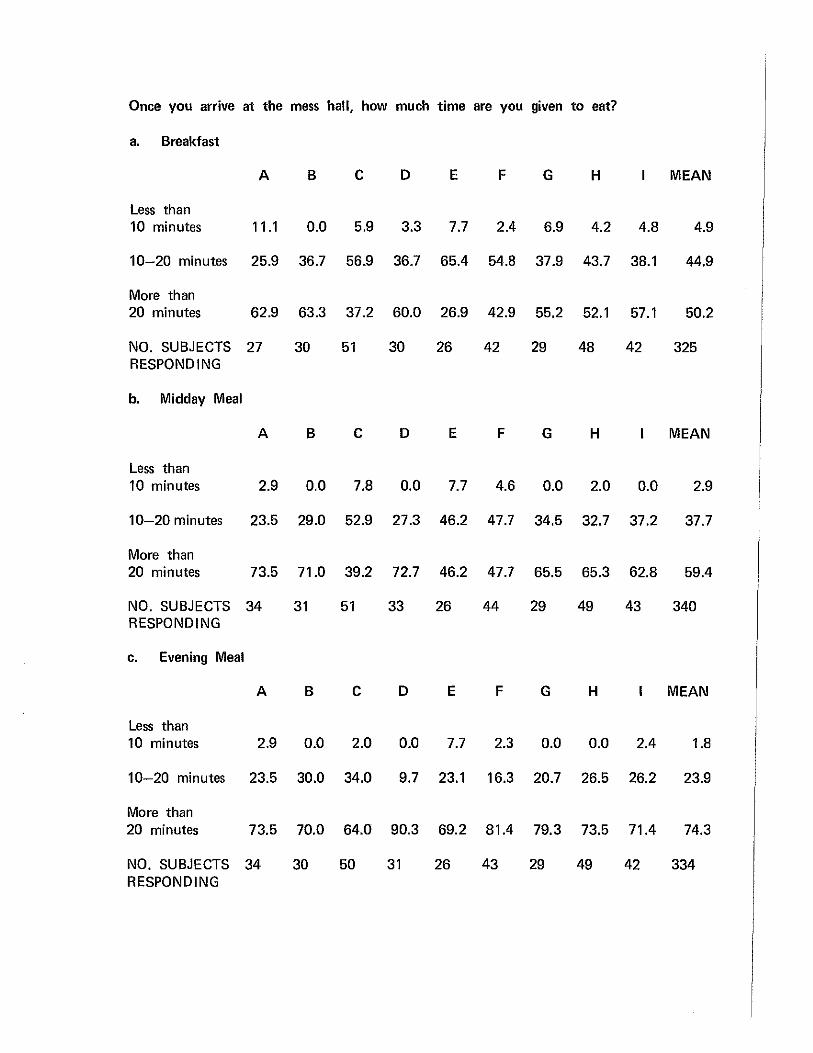
Once you arrive at the mess hall, how much time are you given to eat?
a. Breakfast
A B c D E F G H MEAN
Less than 10 minutes 11.1 0.0 5.9 3.3 7.7 2.4 6.9 4.2 4.8 4.9
10-20 minutes 25.9 36.7 56.9 36.7 65.4 54.8 37.9 43.7 38.1 44.9
More than 20 minutes 62.9 63.3 37.2 60.0 26.9 42.9 55.2 52.1 57.1 50.2
NO. SUBJECTS 27 30 51 30 26 42 29 48 42 325 RESPONDING
b. Midday Meal
A B c D E F G H MEAN
Less than 10 minutes 2.9 0.0 7.8 0.0 7.7 4.6 0.0 2.0 0.0 2.9
10-20 minutes 23.5 29.0 52.9 27.3 46.2 47.7 34.5 32.7 37.2 37.7
More than 20 minutes 73.5 71.0 39.2 72.7 46.2 47.7 65.5 65.3 62.8 59.4
NO. SUBJECTS 34 31 51 33 26 44 29 49 43 340 RESPONDING
c. Evening Meal
A B c D E F G H MEAN
Less than 10 minutes 2.9 0.0 2.0 0.0 7.7 2.3 0.0 0.0 2.4 1.8
10-20 minutes 23.5 30.0 34.0 9.7 23.1 16.3 20.7 26.5 26.2 23.9
More than 20 minutes 73.5 70.0 64.0 90.3 69.2 81.4 79.3 73.5 71.4 74.3
NO. SUBJECTS 34 30 50 31 26 43 29 49 42 334 RESPONDING

Are you given enough time to eat breakfast?
A B c D E F G H MEAN
Yes 83.9 96.7 72.0 62.5 73.1 76.7 75.9 76.0 88.1 78.1
No 16.1 3.3 28.0 37.5 26.9 23.3 24.1 24.0 11.9 21.9
NO. SUBJECTS 31 30 50 32 26 43 29 50 42 333 RESPONDING
Are you given enough time to eat the midday meal?
A B c D E F G H MEAN
Yes 93.9 93.6 43.1 85.3 73.1 73.3 86.2 86.0 76.7 77.2
No 6.1 6.4 56.8 14.7 26.9 26.7 13.8 14.0 23.3 22.8
NO. SUBJECTS 33 31 51 34 26 45 29 50 43 342 RESPONDING
Are you given enough time to eat the evening meal?
A B c D E F G H MEAN
Yes 84.8 100.0 92.0 100.0 96.2 93.0 93.1 94.0 92.9 93.8
No 15.2 0.0 8.0 0.0 3.8 7.0 6.9 6.0 7.1 6.2
NO. SUBJECTS 33 31 50 33 26 43 29 50 42 337 RESPONDING
Do you have any activity which regularly influences whether or not you eat a certain meal?
A B c D E F G H MEAN
Yes 46.9 32.3 29.4 42.4 46.2 20.4 27.6 34.0 40.5 34.6
No 53.1 67.7 70.6 57.6 53.8 79.6 72.4 66.0 59.5 65.4
NO. SUBJECTS 32 31 51 33 26 44 29 50 42 338 RESPONDING
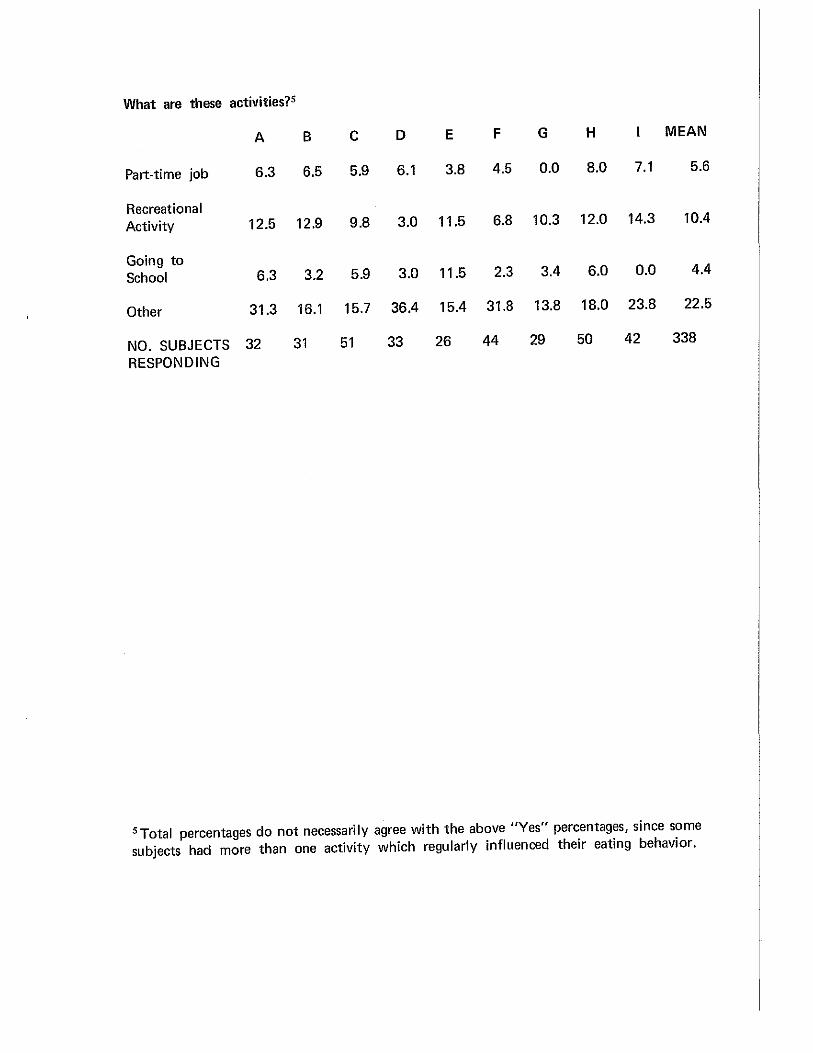
What are these activities?5
A B c D E F G H MEAN
Part-time job 6.3 6.5 5.9 6.1 3.8 4.5 0.0 8.0 7.1 5.6
Recreational Activity 12.5 12.9 9.8 3.0 11.5 6.8 10.3 12.0 14.3 10.4
Going to School 6.3 3.2 5.9 3.0 11.5 2.3 3.4 6.0 0.0 4.4
Other 31.3 16.1 15.7 36.4 15.4 31.8 13.8 18.0 23.8 22.5
NO. SUBJECTS 32 31 51 33 26 44 29 50 42 338
RESPONDING
5 Total percentages do not necessarily agree with the above "Yes" percentages, since some subjects had more than one activity which regularly influenced their eating behavior.

What things do you particularly like about your mess hall? Indicate as many items as you want.6
A B c D E F G H MEAN Percentage of mess hall answering affirmatively:
a. Nothing 29.4 12.9 13.7 23.5 50.0 24.4 17.2 24.0 37.2 25.1
b. Convenient location 38.2 67.7 39.2 52.9 42.3 53.3 65.5 66.0 44.2 51.9
c. Convenient times to eat
14.7 25.8 5.9 23.5 23.1 20.0 20.7 24.0 20.9 19.2
d. Free food 55.9 61.3 49.0 50.0 42.3 46.7 62.1 48.0 48.8 51.0
e. Plenty to eat and drink
14.7 9.7 5.9 17.6 7.7 6.7 13.8 6.0 4.6 9.0
f. The food is good 11.8 6.5 7.8 5.9 7.7 2.2 6.9 4.0 2.3 5.8
g. The mess hall personnel are easy to get along with
29.4 51.6 11.8 38.2 19.2 15.6 31.0 38.0 27.9 28.3
h. The meals are well-balanced
17.6 6.5 7.8 11.8 11.5 8.9 17.2 8.0 9.3 10.5
i. The mess hall has a pleasant appearance
23.5 38.7 31.4 17.6 7.7 26.7 10.3 18.0 20.9 22.4
j. The mess hall is clean 35.3 45.2 29.4 50.0 19.2 51.1 41.4 48.0 34.9 39.9
6 Note: Percentages do not add up to 100% because subjects were permitted to choose as many or as few items as desired.
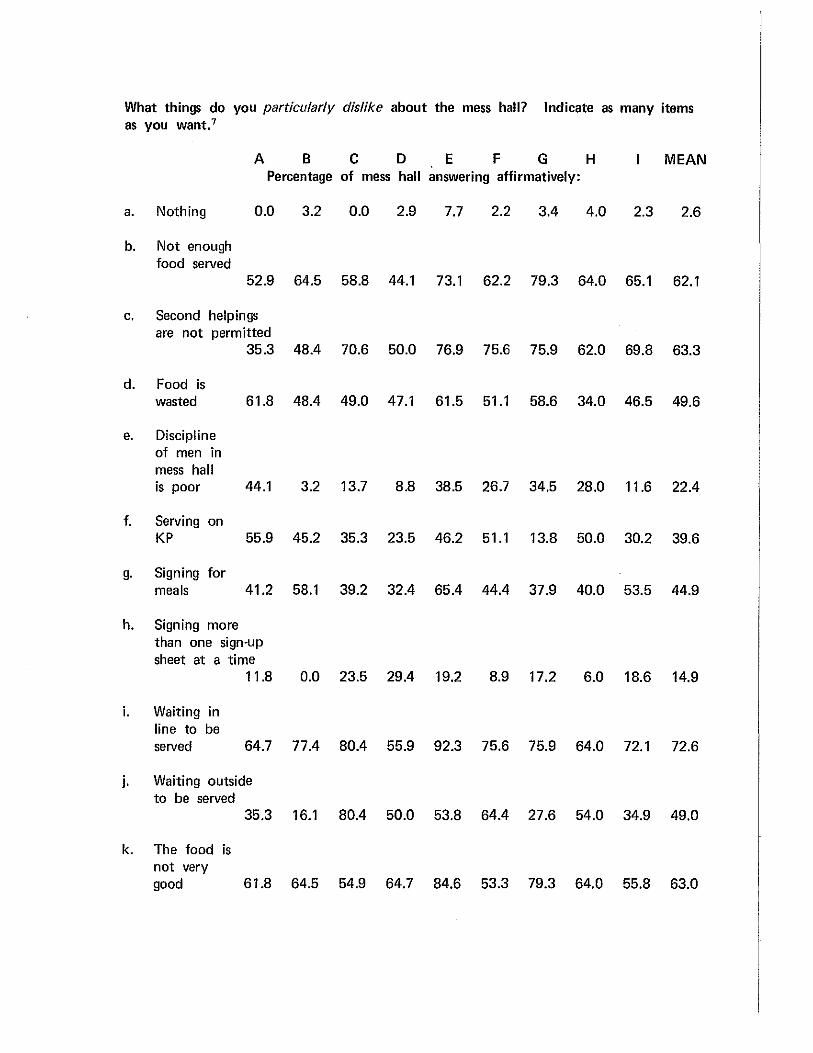
What things do you particularly dislike about the mess hall? Indicate as many items as you want. 7
A B c D E F G H MEAN Percentage of mess hall answering affirmatively:
a. Nothing 0.0 3.2 0.0 2.9 7.7 2.2 3.4 4.0 2.3 2.6
b. Not enough food served
52.9 64.5 58.8 44.1 73.1 62.2 79.3 64.0 65.1 62.1
c. Second helpings are not permitted
35.3 48.4 70.6 50.0 76.9 75.6 75.9 62.0 69.8 63.3
d. Food is wasted 61.8 48.4 49.0 47.1 61.5 51.1 58.6 34.0 46.5 49.6
e. Discipline of men in mess hall is poor 44.1 3.2 13.7 8.8 38.5 26.7 34.5 28.0 11.6 22.4
f. Serving on KP 55.9 45.2 35.3 23.5 46.2 51.1 13.8 50.0 30.2 39.6
g. Signing for meals 41.2 58.1 39.2 32.4 65.4 44.4 37.9 40.0 53.5 44.9
h. Signing more than one sign-up sheet at a time
11.8 0.0 23.5 29.4 19.2 8.9 17.2 6.0 18.6 14.9
i. Waiting in line to be served 64.7 77.4 80.4 55.9 92.3 75.6 75.9 64.0 72. 1 72.6
j. Waiting outside to be served
35.3 16.1 80.4 50.0 53.8 64.4 27.6 54.0 34.9 49.0
k. The food is not very good 61.8 64.5 54.9 64.7 84.6 53.3 79.3 64.0 55.8 63.0
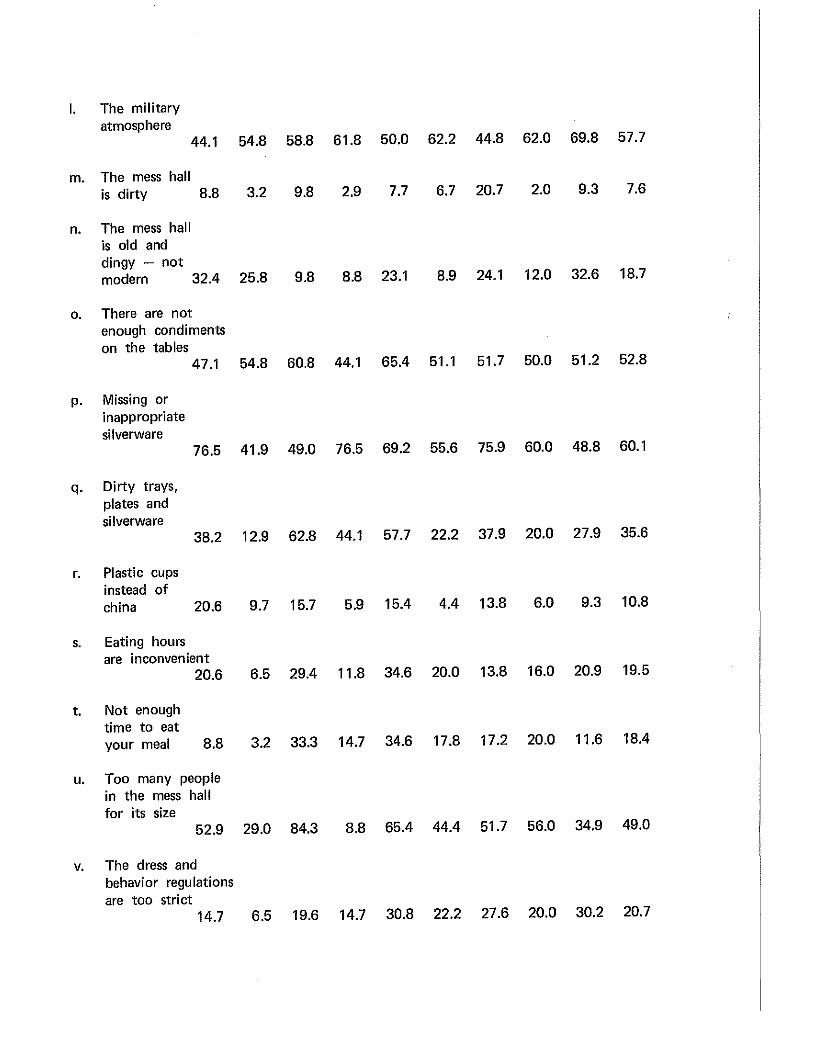
I. The military atmosphere
44.1 54.8 58.8 61.8 50.0 62.2 44.8 62.0 69.8 57.7
m. The mess hall is dirty 8.8 3.2 9.8 2.9 7.7 6.7 20.7 2.0 9.3 7.6
n. The mess hall is old and dingy - not modern 32.4 25.8 9.8 8.8 23.1 8.9 24.1 12.0 32.6 18.7
0. There are not enough condiments on the tables
47.1 54.8 60.8 44.1 65.4 51.1 51.7 50.0 51.2 52.8
p. Missing or inappropriate silverware
76.5 41.9 49.0 76.5 69.2 55.6 75.9 60.0 48.8 60.1
q. Dirty trays, plates and silverware
38.2 12.9 62.8 44.1 57.7 22.2 37.9 20.0 27.9 35.6
r. Plastic cups instead of china 20.6 9.7 15.7 5.9 15.4 4.4 13.8 6.0 9.3 10.8
s. Eating hours are inconvenient
20.6 6.5 29.4 11.8 34.6 20.0 13.8 16.0 20.9 19.5
t. Not enough time to eat your meal 8.8 3.2 33.3 14.7 34.6 17.8 17.2 20.0 11.6 18.4
u. Too many people in the mess hall for its size
52.9 29.0 84.3 8.8 65.4 44.4 51.7 56.0 34.9 49.0
v. The dress and behavior regulations are too strict
14.7 6.5 19.6 14.7 30.8 22.2 27.6 20.0 30.2 20.7

w. Showing your meal card before you can be served
52.9 45.2 56.8 32.4 69.2 53.3 48.3 54.0 60.5 52.8
X. Separation of Officers and N COs from the EMs
20.6 19.4 23.5 26.5 30.8 0.0 24.1 16.0 20.9 19.2
y. Officers and NCOs eating in the same mess 8.8 0.0 5.9 5.9 23.1 11.2 0.0 10.0 4.6 7.6
z. Doing PT before and after meals
0.0 3.2 2.0 0.0 7.7 4.4 0.0 10.0 9.3 4.4
aa. Being harrassed by NCOs and mess personnel 11.8 3.2 31.4 20.6 34.6 35.6 13.8 24.0 18.6 22.4
bb. The mess hall is too noisy
38.2 16.1 17.6 11.8 15.4 17.8 48.3 42.0 18.6 25.1
cc. The mess hall is either too warm or too cold 17.6 0.0 11.8 14.7 15.4 8.9 17.2 10.0 11.6 11.7
7 Note: Percentages do not total 100% because subjects were permitted to choose as may or as few items as desired.
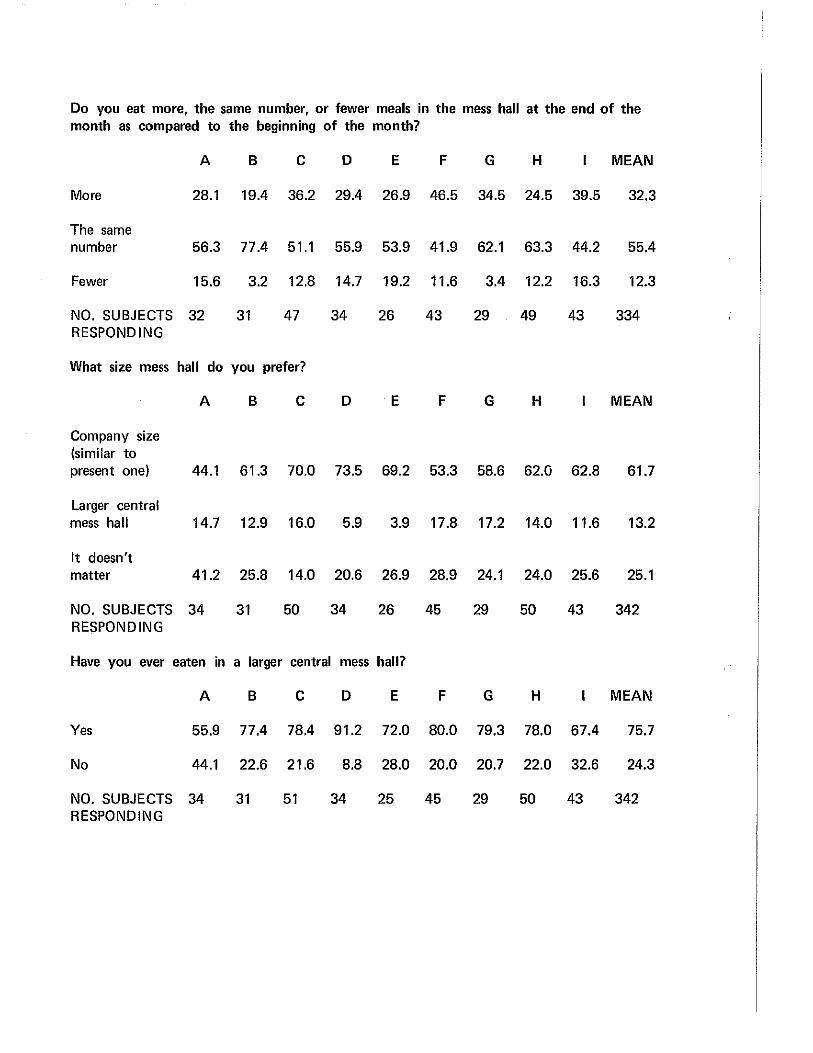
Do you eat more, the same number, or fewer meals in the mess hall at the end of the month as compared to the beginning of the month?
A B c D E F G H MEAN
More 28.1 19.4 36.2 29.4 26.9 46.5 34.5 24.5 39.5 32.3
The same number 56.3 77.4 51.1 55.9 53.9 41.9 62.1 63.3 44.2 55.4
Fewer 15.6 3.2 12.8 14.7 19.2 11.6 3.4 12.2 16.3 12.3
NO. SUBJECTS 32 31 47 34 26 43 29 49 43 334 RESPONDING
What size mess hall do you prefer?
A B c D E F G H MEAN
Company size (similar to present one) 44.1 61.3 70.0 73.5 69.2 53.3 58.6 62.0 62.8 61.7
Larger central mess hall 14.7 12.9 16.0 5.9 3.9 17.8 17.2 14.0 11.6 13.2
It doesn't matter 41.2 25.8 14.0 20.6 26.9 28.9 24.1 24.0 25.6 25.1
NO. SUBJECTS 34 31 50 34 26 45 29 50 43 342 RESPONDING
Have you ever eaten in a larger central mess hall?
A B c D E F G H MEAN
Yes 55.9 77.4 78.4 91.2 72.0 80.0 79.3 78.0 67.4 75.7
No 44.1 22.6 21.6 8.8 28.0 20.0 20.7 22.0 32.6 24.3
NO. SUBJECTS 34 31 51 34 25 45 29 50 43 342 RESPONDING
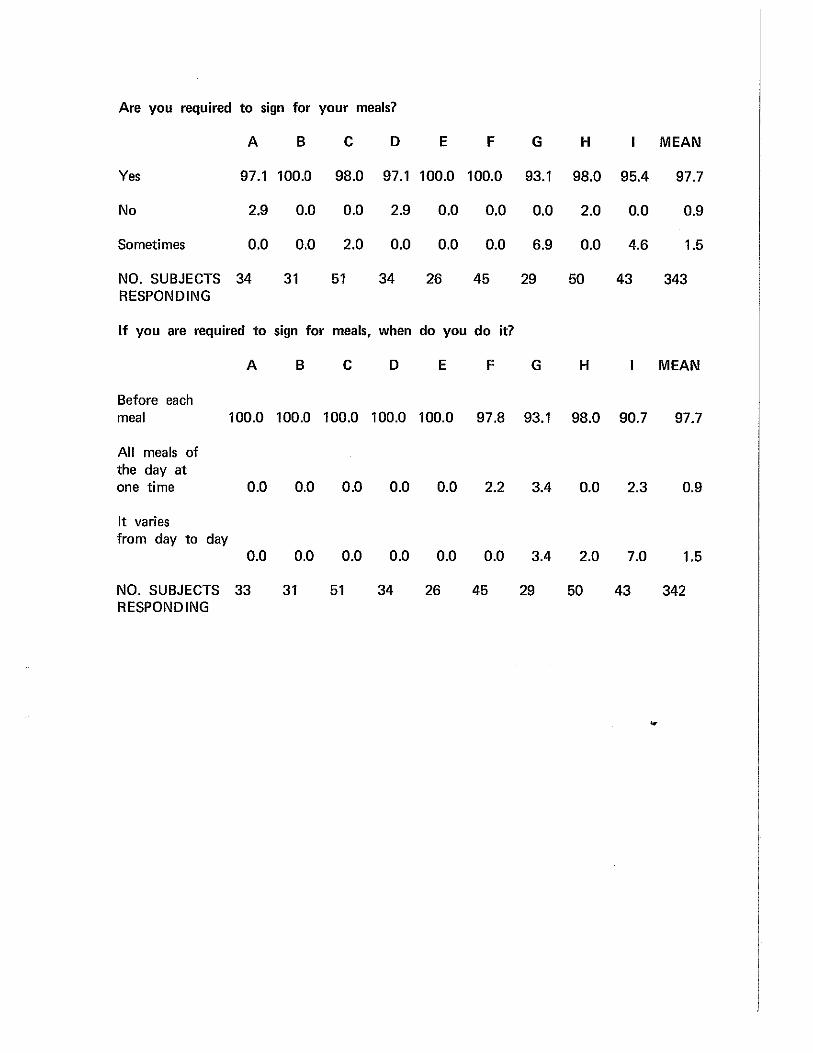
Are you required to sign for your meals?
A B c D E F G H MEAN
Yes 97.1 100.0 98.0 97.1 100.0 100.0 93.1 98.0 95.4 97.7
No 2.9 0.0 0.0 2.9 0.0 0.0 0.0 2.0 0.0 0.9
Sometimes 0.0 0.0 2.0 0.0 0.0 0.0 6.9 0.0 4.6 1.5
NO. SUBJECTS 34 31 51 34 26 45 29 50 43 343 RESPONDING
If you are required to sign for meals, when do you do it?
A B c D E F G H MEAN
Before each meal 100.0 100.0 100.0 100.0 100.0 97.8 93.1 98.0 90.7 97.7
All meals of the day at one time 0.0 0.0 0.0 0.0 0.0 2.2 3.4 0.0 2.3 0.9
It varies from day to day
0.0 0.0 0.0 0.0 0.0 0.0 3.4 2.0 7.0 1.5
NO. SUBJECTS 33 31 51 34 26 45 29 50 43 342 RESPONDING

Do the people you work with eat in your mess hall?
a. Breakfast
A B c D E F G H MEAN
All of them 2.9 0.0 12.5 3.1 0.0 13.6 13.8 18.0 2.4 8.5 Most of them 26.5 40.7 64.6 40.6 29.2 38.6 37.9 54.0 39.0 43.2 Some of them 52.9 55.6 22.9 46.9 66.7 38.6 41.4 26.0 51.2 41.9 None of them 17.7 3.7 0.0 9.4 4.2 9.1 6.9 2.0 7.3 6.4
NO. SUBJECTS 34 27 48 32 24 44 29 50 41 329 RESPONDING
b. Midday Meal
A B c D E F G H MEAN
All of them 11.8 3.3 18.0 8.8 4.0 13.3 10.3 16.0 2.4 10.6 Most of them 29.4 60.0 64.0 50.0 40.0 53.3 44.8 60.0 52.4 51.9 Some of them 41.2 33.3 18.0 38.2 48.0 28.9 41.4 22.0 38.1 32.5 None of them 17.6 3.3 0.0 2.9 8.0 4.4 3.5 2.0 7.1 5.0
NO. SUBJECTS 34 30 50 34 25 45 29 50 42 339 RESPONDING
c. Evening Meal
A B c D E F G H MEAN
All of them 8.8 3.4 12.2 3.0 0.0 13.9 13.8 16.0 4.9 9.3 Most of them 26.5 58.6 53.1 30.3 40.0 34.9 34.5 58.0 31.7 41.7 Some of them 44.1 34.5 32.7 57.6 56.0 41.9 44.8 24.0 51.2 41.4 None of them 20.6 3.5 2.0 9.1 4.0 9.3 6.9 2.0 12.2 7.5
NO. SUBJECTS 34 29 49 33 25 43 29 50 41 333 RESPONDING
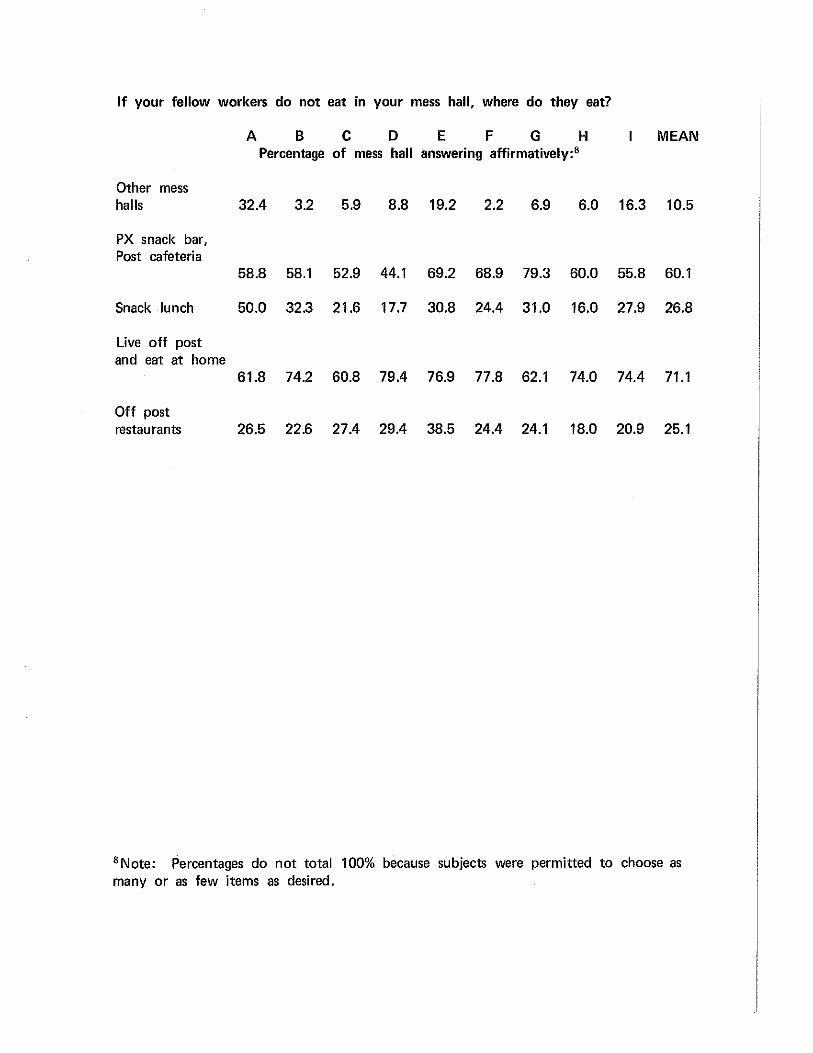
If your fellow workers do not eat in your mess hall, where do they eat?
A B c D E F G H MEAN Percentage of mess hall answering affirmatively: 8
Other mess halls 32.4 3.2 5.9 8.8 19.2 2.2 6.9 6.0 16.3 10.5
PX snack bar, Post cafeteria
58.8 58.1 52.9 44.1 69.2 68.9 79.3 60.0 55.8 60.1
Snack lunch 50.0 32.3 21.6 17.7 30.8 24.4 31.0 16.0 27.9 26.8
Live off post and eat at home
61.8 74.2 60.8 79.4 76.9 77.8 62.1 74.0 74.4 71.1
Off post restaurants 26.5 22.6 27.4 29.4 38.5 24.4 24.1 18.0 20.9 25.1
8 Note: Percentages do not total 100% because subjects were permitted to choose as many or as few items as desired.
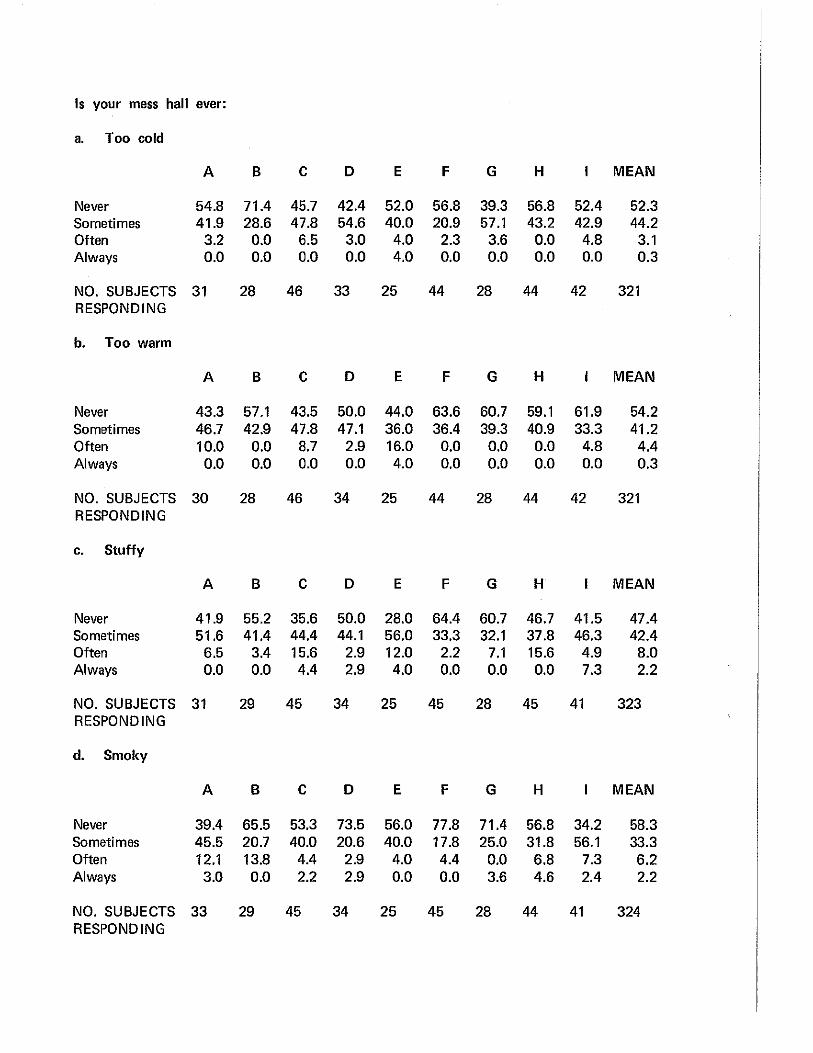
Is your mess hall ever:
a. Too cold
A B c D E F G H MEAN
Never 54.B 71.4 45.7 42.4 52.0 56.B 39.3 56.B 52.4 52.3 Sometimes 41.9 2B.6 47.B 54.6 40.0 20.9 57.1 43.2 42.9 44.2 Often 3.2 0.0 6.5 3.0 4.0 2.3 3.6 0.0 4.B 3.1 Always 0.0 0.0 0.0 0.0 4.0 0.0 0.0 0.0 0.0 0.3
NO. SUBJECTS 31 2B 46 33 25 44 2B 44 42 321 RESPONDING
b. Too warm
A B c D E F G H MEAN
Never 43.3 57.1 43.5 50.0 44.0 63.6 60.7 59.1 61.9 54.2 Sometimes 46.7 42.9 47.B 47.1 36.0 36.4 39.3 40.9 33.3 41.2 Often 10.0 0.0 B.7 2.9 16.0 0.0 0.0 0.0 4.B 4.4 Always 0.0 0.0 0.0 0.0 4.0 0.0 0.0 0.0 0.0 0.3
NO. SUBJECTS 30 2B 46 34 25 44 2B 44 42 321 RESPONDING
c. Stuffy
A B c D E F G H MEAN
Never 41.9 55.2 35.6 50.0 2B.O 64.4 60.7 46.7 41.5 47.4 Sometimes 51.6 41.4 44.4 44.1 56.0 33.3 32.1 37.B 46.3 42.4 Often 6.5 3.4 15.6 2.9 12.0 2.2 7.1 15.6 4.9 B.O Always 0.0 0.0 4.4 2.9 4.0 0.0 0.0 0.0 7.3 2.2
NO. SUBJECTS 31 29 45 34 25 45 2B 45 41 323 RESPONDING
d. Smoky
A B c D E F G H MEAN
Never 39.4 65.5 53.3 73.5 56.0 77.B 71.4 56.B 34.2 5B.3 Sometimes 45.5 20.7 40.0 20.6 40.0 17.B 25.0 31.B 56.1 33.3 Often 12.1 13.B 4.4 2.9 4.0 4.4 0.0 6.B 7.3 6.2 Always 3.0 0.0 2.2 2.9 0.0 0.0 3.6 4.6 2.4 2.2
NO. SUBJECTS 33 29 45 34 25 45 2B 44 41 324 RESPONDING
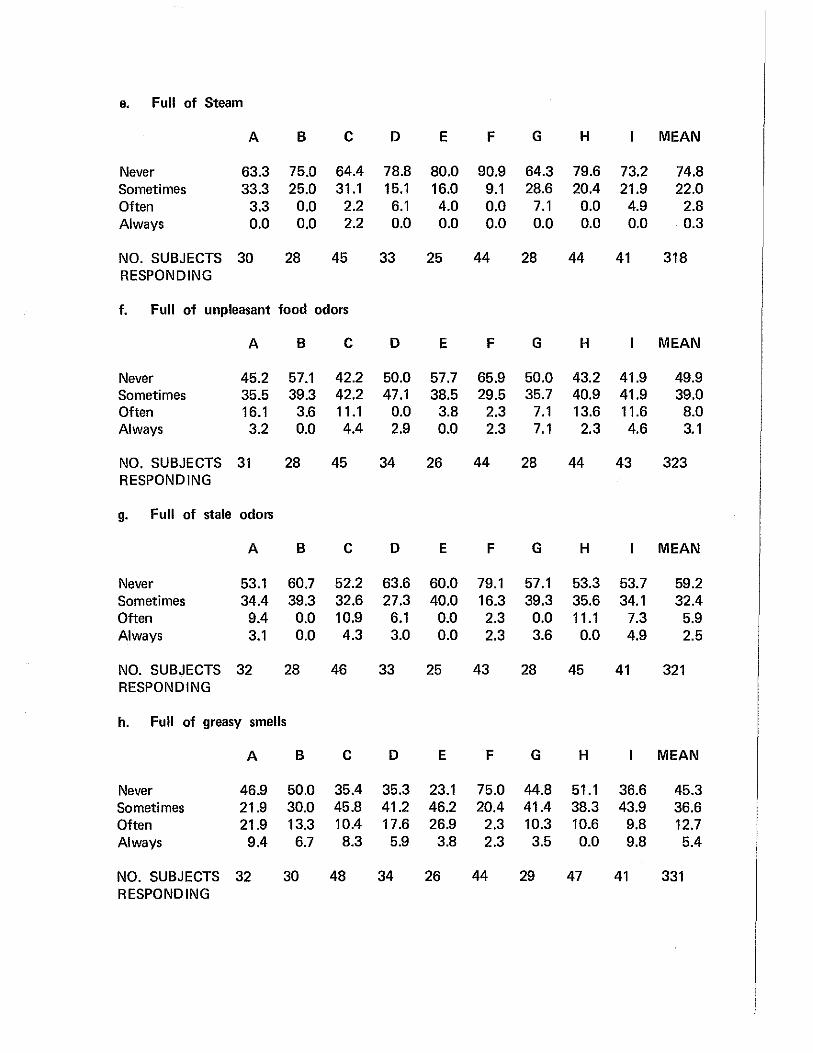
e. Full of Steam
A B c D E F G H MEAN
Never 63.3 75.0 64.4 78.8 80.0 90.9 64.3 79.6 73.2 74.8 Sometimes 33.3 25.0 31.1 15.1 16.0 9.1 28.6 20.4 21.9 22.0 Often 3.3 0.0 2.2 6.1 4.0 0.0 7.1 0.0 4.9 2.8 Always 0.0 0.0 2.2 0.0 0.0 0.0 0.0 0.0 0.0 0.3
NO. SUBJECTS 30 28 45 33 25 44 28 44 41 318 RESPONDING
f. Full of unpleasant food odors
A B c D E F G H MEAN
Never 45.2 57.1 42.2 50.0 57.7 65.9 50.0 43.2 41.9 49.9 Sometimes 35.5 39.3 42.2 47.1 38.5 29.5 35.7 40.9 41.9 39.0 Often 16.1 3.6 11.1 0.0 3.8 2.3 7.1 13.6 11.6 8.0 Always 3.2 0.0 4.4 2.9 0.0 2.3 7.1 2.3 4.6 3.1
NO. SUBJECTS 31 28 45 34 26 44 28 44 43 323 RESPONDING
g. Full of stale odors
A B c D E F G H MEAN
Never 53.1 60.7 52.2 63.6 60.0 79.1 57.1 53.3 53.7 59.2 Sometimes 34.4 39.3 32.6 27.3 40.0 16.3 39.3 35.6 34.1 32.4 Often 9.4 0.0 10.9 6.1 0.0 2.3 0.0 11.1 7.3 5.9 Always 3.1 0.0 4.3 3.0 0.0 2.3 3.6 0.0 4.9 2.5
NO. SUBJECTS 32 28 46 33 25 43 28 45 41 321 RESPONDING
h. Full of greasy smells
A B c D E F G H MEAN
Never 46.9 50.0 35.4 35.3 23.1 75.0 44.8 51.1 36.6 45.3 Sometimes 21.9 30.0 45.8 41.2 46.2 20.4 41.4 38.3 43.9 36.6 Often 21.9 13.3 10.4 17.6 26.9 2.3 10.3 10.6 9.8 12.7 Always 9.4 6.7 8.3 5.9 3.8 2.3 3.5 0.0 9.8 5.4
NO. SUBJECTS 32 30 48 34 26 44 29 47 41 331 RESPONDING
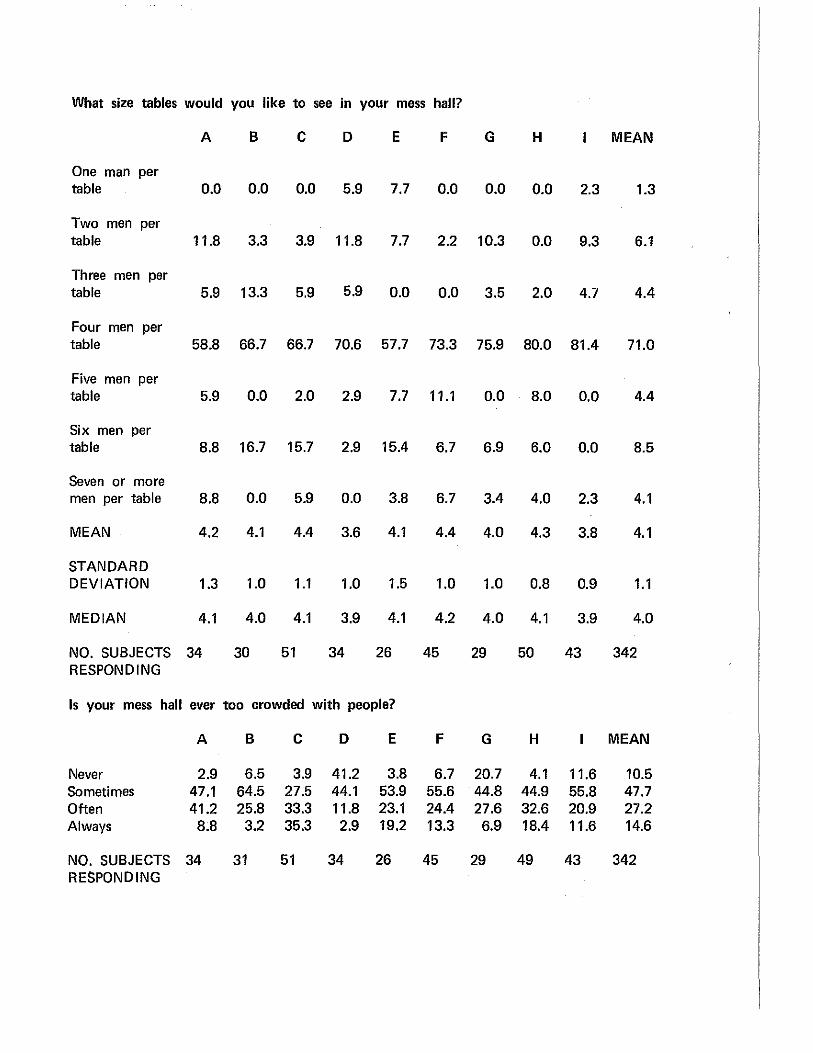
What size tables would you like to see in your mess hall?
A B c D E F G H MEAN
One man per table 0.0 0.0 0.0 5.9 7.7 0.0 0.0 0.0 2.3 1.3
Two men per table 11.8 3.3 3.9 11.8 7.7 2.2 10.3 0.0 9.3 6.1
Three men per table 5.9 13.3 5.9 5.9 0.0 0.0 3.5 2.0 4.7 4.4
Four men per table 58.8 66.7 66.7 70.6 57.7 73.3 75.9 80.0 81.4 71.0
Five men per table 5.9 0.0 2.0 2.9 7.7 11.1 0.0 8.0 0.0 4.4
Six men per table 8.8 16.7 15.7 2.9 15.4 6.7 6.9 6.0 0.0 8.5
Seven or more men per table 8.8 0.0 5.9 0.0 3.8 6.7 3.4 4.0 2.3 4.1
MEAN 4.2 4.1 4.4 3.6 4.1 4.4 4.0 4.3 3.8 4.1
STANDARD DEVIATION 1.3 1.0 1.1 1.0 1.5 1.0 1.0 0.8 0.9 1.1
MEDIAN 4.1 4.0 4.1 3.9 4.1 4.2 4.0 4.1 3.9 4.0
NO. SUBJECTS 34 30 51 34 26 45 29 50 43 342 RESPONDING
Is your mess hall ever too crowded with people?
A B c D E F G H MEAN
Never 2.9 6.5 3.9 41.2 3.8 6.7 20.7 4.1 11.6 10.5 Sometimes 47.1 64.5 27.5 44.1 53.9 55.6 44.8 44.9 55.8 47.7 Often 41.2 25.8 33.3 11.8 23.1 24.4 27.6 32.6 20.9 27.2 Always 8.8 3.2 35.3 2.9 19.2 13.3 6.9 18.4 11.6 14.6
NO. SUBJECTS 34 31 51 34 26 45 29 49 43 342 RESPONDING
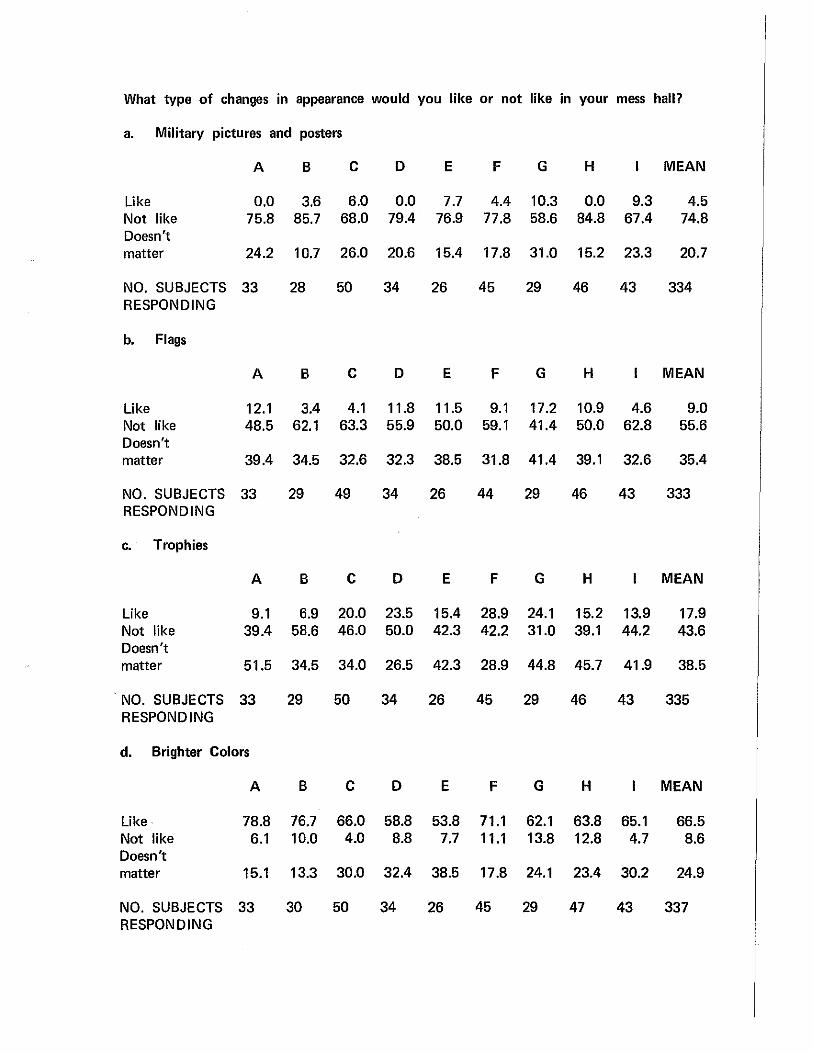
What type of changes in appearance would you like or not like in your mess hall?
a. Military pictures and posters
A B c D E F G H MEAN
Like 0.0 3.6 6.0 0.0 7.7 4.4 10.3 0.0 9.3 4.5 Not like 75.8 85.7 68.0 79.4 76.9 77.8 58.6 84.8 67.4 74.8 Doesn't matter 24.2 10.7 26.0 20.6 15.4 17.8 31.0 15.2 23.3 20.7
NO. SUBJECTS 33 28 50 34 26 45 29 46 43 334 RESPONDING
b. Flags
A B c D E F G H MEAN
Like 12.1 3.4 4.1 11.8 11.5 9.1 17.2 10.9 4.6 9.0 Not like 48.5 62.1 63.3 55.9 50.0 59.1 41.4 50.0 62.8 55.6 Doesn't matter 39.4 34.5 32.6 32.3 38.5 31.8 41.4 39.1 32.6 35.4
NO. SUBJECTS 33 29 49 34 26 44 29 46 43 333 RESPONDING
c. Trophies
A B c D E F G H MEAN
Like 9.1 6.9 20.0 23.5 15.4 28.9 24.1 15.2 13.9 17.9 Not like 39.4 58.6 46.0 50.0 42.3 42.2 31.0 39.1 44.2 43.6 Doesn't matter 51.5 34.5 34.0 26.5 42.3 28.9 44.8 45.7 41.9 38.5
NO. SUBJECTS 33 29 50 34 26 45 29 46 43 335 RESPONDING
d. Brighter Colors
A B c D E F G H MEAN
Like· 78.8 76.7 66.0 58.8 53.8 71.1 62.1 63.8 65.1 66.5 Not like 6.1 10.0 4.0 8.8 7.7 11.1 13.8 12.8 4.7 8.6 Doesn't matter 15.1 13.3 30.0 32.4 38.5 17.8 24.1 23.4 30.2 24.9
NO. SUBJECTS 33 30 50 34 26 45 29 47 43 337 RESPONDING

e. More decorative wall patterns
A B c D E F G H MEAN
Like 78.8 79.3 78.0 67.6 53.8 73.3 62.1 63.8 69.8 70.2 Not like 6.1 0.0 2.0 5.9 3.9 4.4 6.9 6.4 4.6 4.5 Doesn't matter 15.1 20.7 20.0 26.5 42.3 22.2 31.0 29.8 25.6 25.3
NO. SUBJECTS 33 29 50 34 26 45 29 47 43 336 RESPONDING
f. Curtains
A B c D E F G H MEAN
Like 78.8 86.7 74.0 79.4 73.1 70.5 69.0 73.9 74.4 75.2 Not like 3.0 0.0 6.0 0.0 7.7 6.8 0.0 2.2 0.0 3.0 Doesn't matter 18.2 13.3 20.6 20.6 19.2 22.7 31.0 23.9 25.6 21.8
NO. SUBJECTS 33 30 50 34 26 44 29 46 43 335 RESPONDING
g. Tablecloths
A B c D E F G H MEAN
Like 81.8 90.0 78.0 58.8 80.0 63.6 79.3 69.6 65.1 73.0 Not like 6.1 0.0 4.0 5.9 4.0 6.8 0.0 4.3 4.7 4.2 Doesn't matter 12.1 10.0 18.0 35.3 16.0 29.6 20.7 26.1 30.2 22.8
NO. SUBJECTS 33 30 50 34 25 44 29 46 43 334 RESPONDING
h. Music with meals
A B c D E F G H MEAN
Like 90.9 96.7 84.0 79.4 96.2 84.1 82.8 81.2 81.4 85.5 Not like 0.0 0.0 2.0 2.9 3.8 2.3 6.9 4.2 0.0 2.4 Doesn't matter 9.1 3.3 14.0 17.7 0.0 13.6 10.3 14.6 18.6 12.2
NO. SUBJECTS 33 30 50 34 26 44 29 48 43 337 RESPONDING
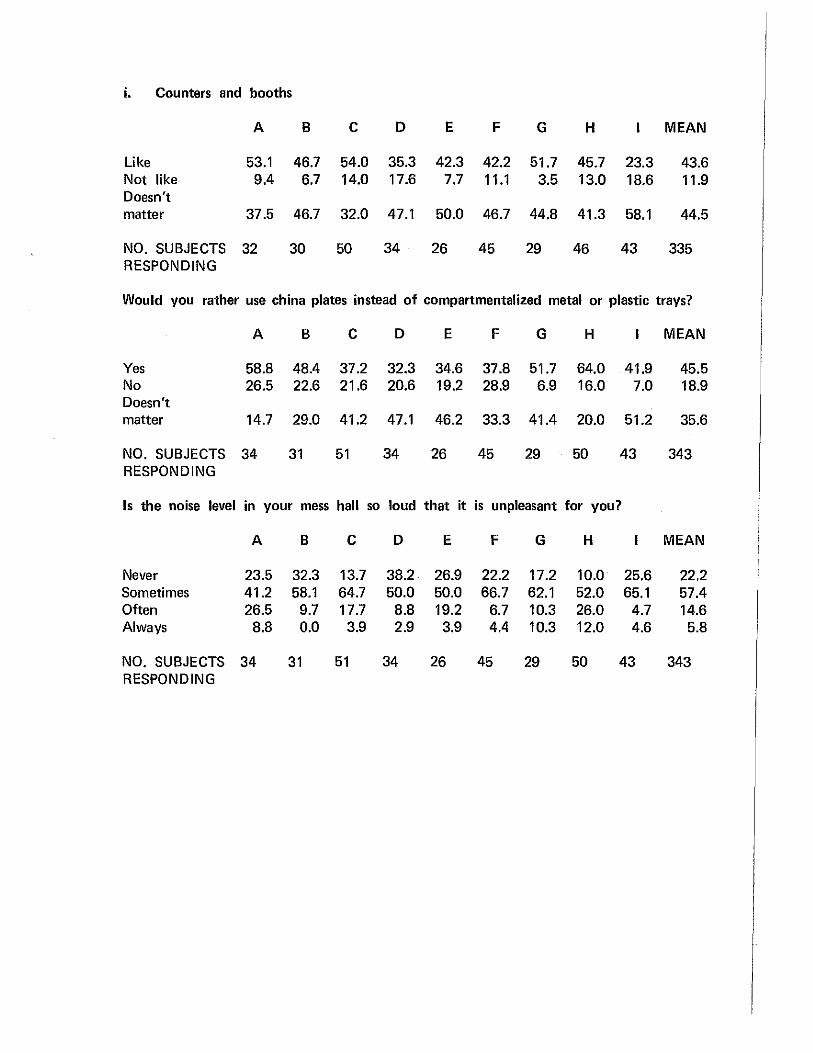
i. Counters and booths
A B c D E F G H MEAN
Like 53.1 46.7 54.0 35.3 42.3 42.2 51.7 45.7 23.3 43.6 Not like 9.4 6.7 14.0 17.6 7.7 11.1 3.5 13.0 18.6 11.9 Doesn't matter 37.5 46.7 32.0 47.1 50.0 46.7 44.8 41.3 58.1 44.5
NO. SUBJECTS 32 30 50 34 26 45 29 46 43 335 RESPONDING
Would you rather use china plates instead of compartmentalized metal or plastic trays?
A B c D E F G H MEAN
Yes 58.8 48.4 37.2 32.3 34.6 37.8 51.7 64.0 41.9 45.5 No 26.5 22.6 21.6 20.6 19.2 28.9 6.9 16.0 7.0 18.9 Doesn't matter 14.7 29.0 41.2 47.1 46.2 33.3 41.4 20.0 51.2 35.6
NO. SUBJECTS 34 31 51 34 26 45 29 50 43 343 RESPONDING
Is the noise level in your mess hall so loud that it is unpleasant for you?
A B c D E F G H MEAN
Never 23.5 32.3 13.7 38.2 26.9 22.2 17.2 10.0 25.6 22.2 Sometimes 41.2 58.1 64.7 50.0 50.0 66.7 62.1 52.0 65.1 57.4 Often 26.5 9.7 17.7 8.8 19.2 6.7 10.3 26.0 4.7 14.6 Always 8.8 0.0 3.9 2.9 3.9 4.4 10.3 12.0 4.6 5.8
NO. SUBJECTS 34 31 51 34 26 45 29 50 43 343 RESPONDING
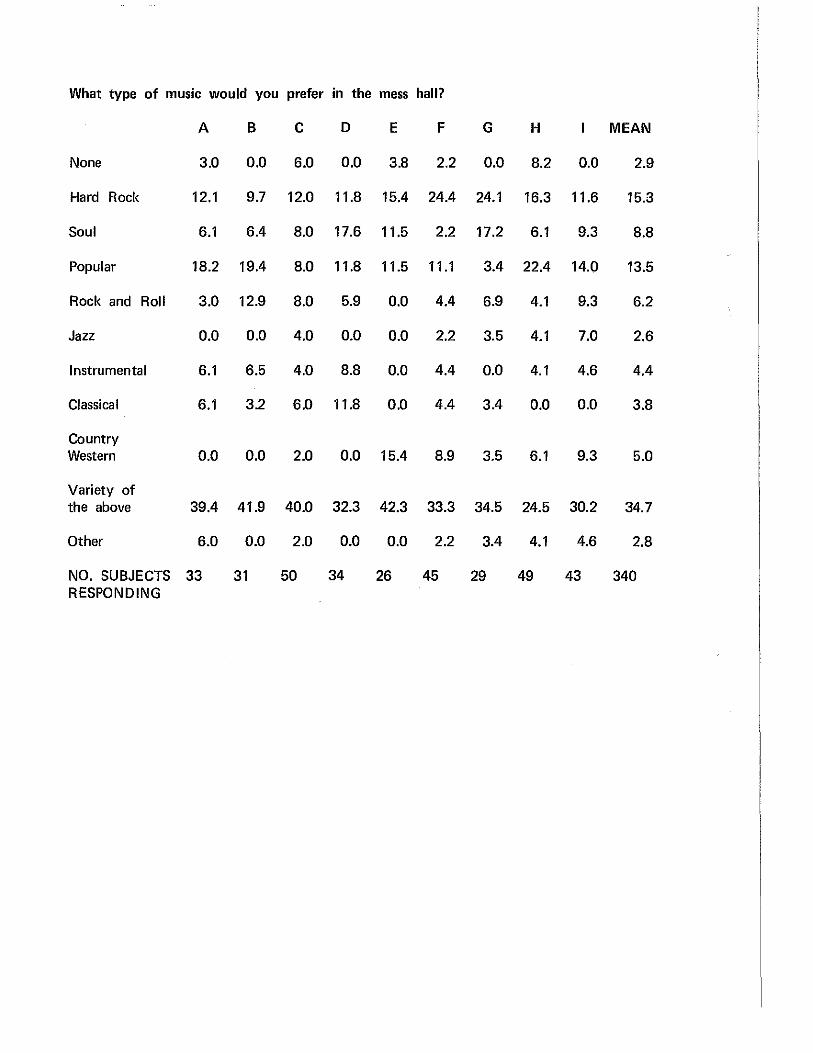
What type of music would you prefer in the mess hall?
A B c D E F G H MEAN
None 3.0 0.0 6.0 0.0 3.8 2.2 0.0 8.2 0.0 2.9
Hard Rock 12.1 9.7 12.0 11.8 15.4 24.4 24.1 16.3 11.6 15.3
Soul 6.1 6.4 8.0 17.6 11.5 2.2 17.2 6.1 9.3 8.8
Popular 18.2 19.4 8.0 11.8 11.5 11.1 3.4 22.4 14.0 13.5
Rock and Roll 3.0 12.9 8.0 5.9 0.0 4.4 6.9 4.1 9.3 6.2
Jazz 0.0 0.0 4.0 0.0 0.0 2.2 3.5 4.1 7.0 2.6
Instrumental 6.1 6.5 4.0 8.8 0.0 4.4 0.0 4.1 4.6 4.4
Classical 6.1 3.2 6.0 11.8 0.0 4.4 3.4 0.0 0.0 3.8
Country Western 0.0 0.0 2.0 0.0 15.4 8.9 3.5 6.1 9.3 5.0
Variety of the above 39.4 41.9 40.0 32.3 42.3 33.3 34.5 24.5 30.2 34.7
Other 6.0 0.0 2.0 0.0 0.0 2.2 3.4 4.1 4.6 2.8
NO. SUBJECTS 33 31 50 34 26 45 29 49 43 340 RESPONDING
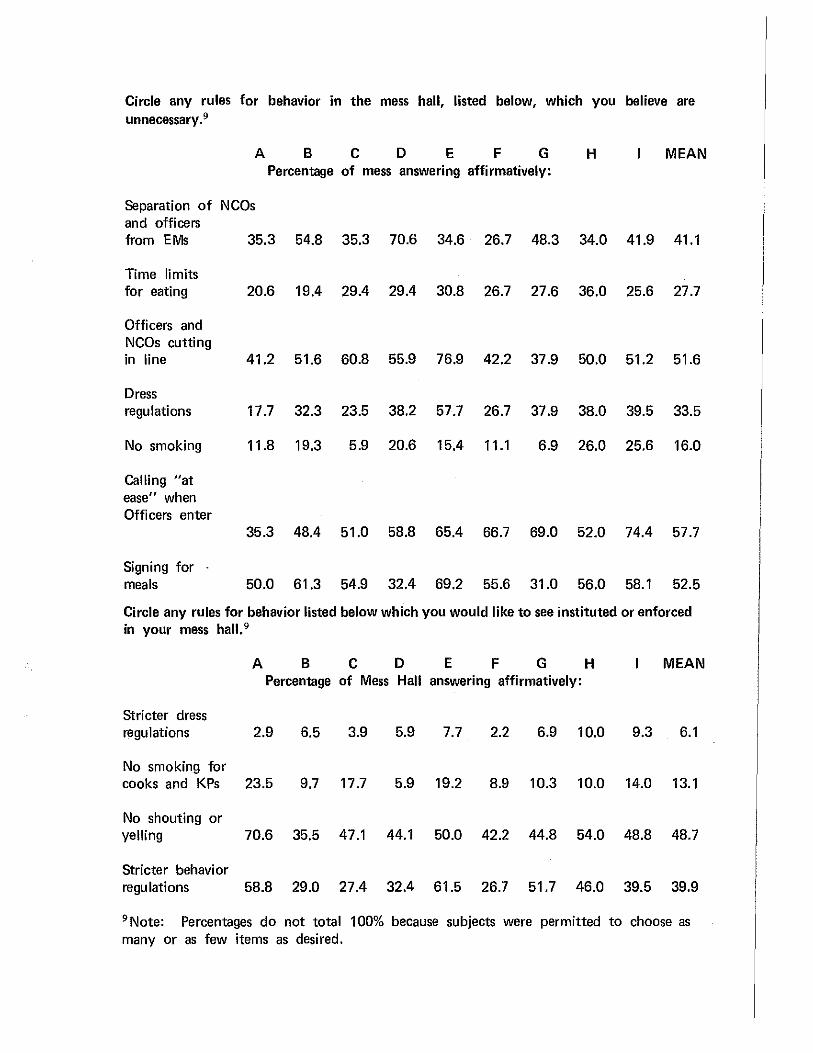
Circle any rules for behavior in the mess hall, listed below, which you believe are unnecessary.9
A B c D E F G H MEAN Percentage of mess answering affirmatively:
Separation of NCOs and officers from EMs 35.3 54.8 35.3 70.6 34.6 26.7 48.3 34.0 41.9 41.1
Time limits for eating 20.6 19.4 29.4 29.4 30.8 26.7 27.6 36.0 25.6 27.7
Officers and NCOs cutting in line 41.2 51.6 60.8 55.9 76.9 42.2 37.9 50.0 51.2 51.6
Dress regulations 17.7 32.3 23.5 38.2 57.7 26.7 37.9 38.0 39.5 33.5
No smoking 11.8 19.3 5.9 20.6 15.4 11.1 6.9 26.0 25.6 16.0
Calling "at ease" when Officers enter
35.3 48.4 51.0 58.8 65.4 66.7 69.0 52.0 74.4 57.7
Signing for meals 50.0 61.3 54.9 32.4 69.2 55.6 31.0 56.0 58.1 52.5
Circle any rules for behavior listed below which you would like to see instituted or enforced in your mess hall. 9
A B c D E F G H MEAN Percentage of Mess Hall answering affirmatively:
Stricter dress regulations 2.9 6.5 3.9 5.9 7.7 2.2 6.9 10.0 9.3 6.1
No smoking for cooks and KPs 23.5 9.7 17.7 5.9 19.2 8.9 10.3 10.0 14.0 13.1
No shouting or yelling 70.6 35.5 47.1 44.1 50.0 42.2 44.8 54.0 48.8 48.7
Stricter behavior regulations 58.8 29.0 27.4 32.4 61.5 26.7 51.7 46.0 39.5 39.9
9 Note: Percentages do not total 100% because subjects were permitted to choose as many or as few items as desired.
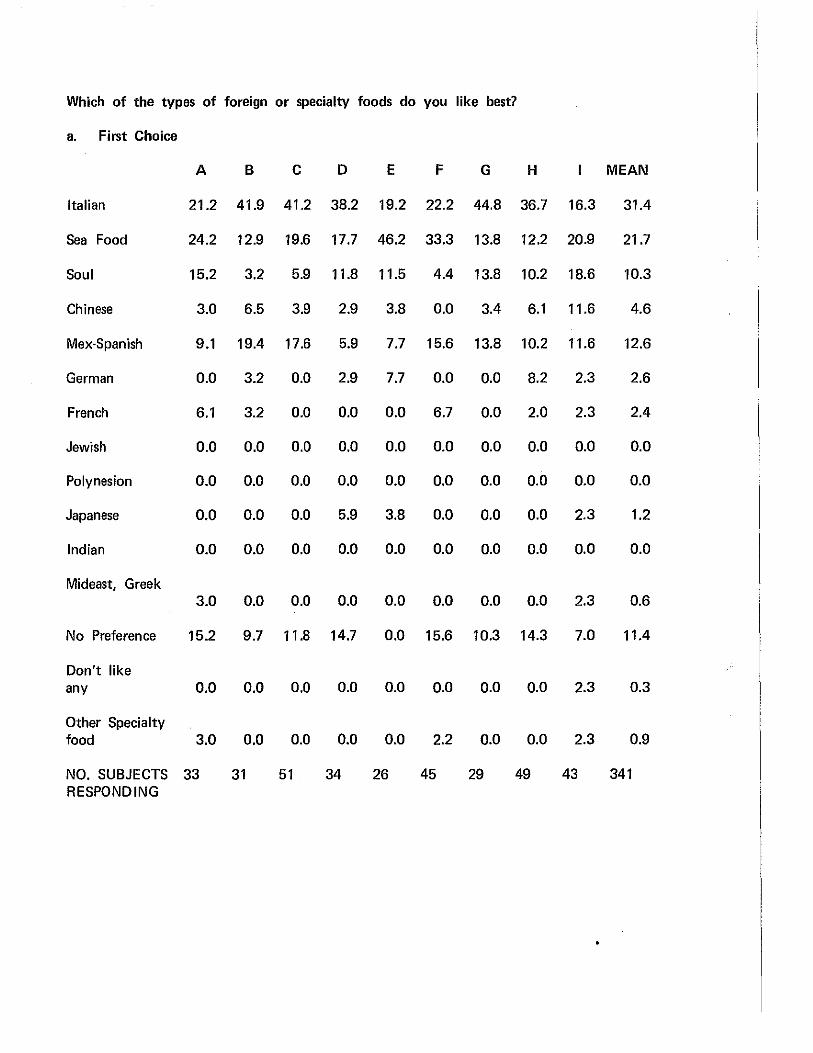
Which of the types of foreign or specialty foods do you like best?
a. First Choice
A B c D E F G H MEAN
Italian 21.2 41.9 41.2 38.2 19.2 22.2 44.8 36.7 16.3 31.4
Sea Food 24.2 12.9 19.6 17.7 46.2 33.3 13.8 12.2 20.9 21.7
Soul 15.2 3.2 5.9 11.8 11.5 4.4 13.8 10.2 18.6 10.3
Chinese 3.0 6.5 3.9 2.9 3.8 0.0 3.4 6.1 11.6 4.6
Mex-Spanish 9.1 19.4 17.6 5.9 7.7 15.6 13.8 10.2 11.6 12.6
German 0.0 3.2 0.0 2.9 7.7 0.0 0.0 8.2 2.3 2.6
French 6.1 3.2 0.0 0.0 0.0 6.7 0.0 2.0 2.3 2.4
Jewish 0.0 0.0 0.0 0.0 0.0 0.0 0.0 0.0 0.0 0.0
Polynesian 0.0 0.0 0.0 0.0 0.0 0.0 0.0 0.0 0.0 0.0
Japanese 0.0 0.0 0.0 5.9 3.8 0.0 0.0 0.0 2.3 1.2
Indian 0.0 0.0 0.0 0.0 0.0 0.0 0.0 0.0 0.0 0.0
Mideast, Greek 3.0 0.0 0.0 0.0 0.0 0.0 0.0 0.0 2.3 0.6
No Preference 15.2 9.7 11.8 14.7 0.0 15.6 10.3 14.3 7.0 11.4
Don't like any 0.0 0.0 0.0 0.0 0.0 0.0 0.0 0.0 2.3 0.3
Other Specialty food 3.0 0.0 0.0 0.0 0.0 2.2 0.0 0.0 2.3 0.9
NO. SUBJECTS 33 31 51 34 26 45 29 49 43 341 RESPONDING
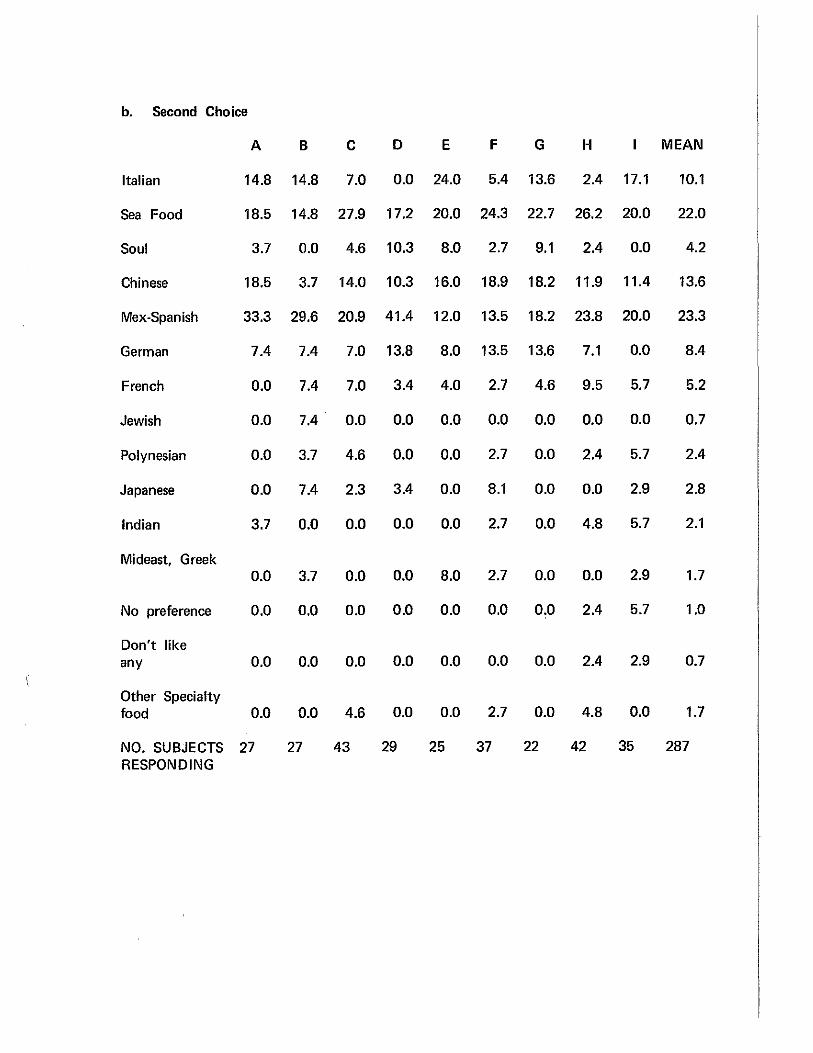
b. Second Choice
A B c D E F G H MEAN
Italian 14.8 14.8 7.0 0.0 24.0 5.4 13.6 2.4 17.1 10.1
Sea Food 18.5 14.8 27.9 17.2 20.0 24.3 22.7 26.2 20.0 22.0
Soul 3.7 0.0 4.6 10.3 8.0 2.7 9.1 2.4 0.0 4.2
Chinese 18.5 3.7 14.0 10.3 16.0 18.9 18.2 11.9 11.4 13.6
Mex -Span ish 33.3 29.6 20.9 41.4 12.0 13.5 18.2 23.8 20.0 23.3
German 7.4 7.4 7.0 13.8 8.0 13.5 13.6 7.1 0.0 8.4
French 0.0 7.4 7.0 3.4 4.0 2.7 4.6 9.5 5.7 5.2
Jewish 0.0 7.4 0.0 0.0 0.0 0.0 0.0 0.0 0.0 0.7
Polynesian 0.0 3.7 4.6 0.0 0.0 2.7 0.0 2.4 5.7 2.4
Japanese 0.0 7.4 2.3 3.4 0.0 8.1 0.0 0.0 2.9 2.8
Indian 3.7 0.0 0.0 0.0 0.0 2.7 0.0 4.8 5.7 2.1
Mideast, Greek 0.0 3.7 0.0 0.0 8.0 2.7 0.0 0.0 2.9 1.7
No preference 0.0 0.0 0.0 0.0 0.0 0.0 0.0 2.4 5.7 1.0
Don't like any 0.0 0.0 0.0 0.0 0.0 0.0 0.0 2.4 2.9 0.7
Other Specialty food 0.0 0.0 4.6 0.0 0.0 2.7 0.0 4.8 0.0 1.7
NO. SUBJECTS 27 27 43 29 25 37 22 42 35 287 RESPONDING

c. Third Choice
A B c D E F G H MEAN
Italian 25.9 7.4 7.0 20.7 21.7 14.3 10.0 11.1 5.9 13.1
Sea Food 11.1 11.1 7.0 13.8 0.0 5.7 10.0 19.4 11.8 10.2
Soul 0.0 0.0 2.3 0.0 4.4 0.0 0.0 0.0 0.0 0.7
Chinese 14.8 11.1 14.0 6.9 0.0 8.6 5.0 2.8 5.9 5.0
Mex-Spanish 22.2 14.8 14.0 13.8 26.1 14.3 30.0 11.1 5.9 15.7
German 7.4 11.1 16.3 10.3 4.4 8.6 5.0 8.3 11.8 9.8
French 0.0 18.5 18.6 10.3 8.7 8.6 15.0 13.9 5.9 11.3
Jewish 0.0 0.0 4.6 3.4 4.4 0.0 5.0 0.0 0.0 1.8
Polynesian 0.0 3.7 9.3 0.0 0.0 8.6 0.0 8.3 2.9 4.4
Japanese 7.4 11.1 4.6 6.9 4.4 14.3 10.0 8.3 29.4 11.0
Indian 3.7 3.7 2.3 0.0 4.4 2.9 0.0 5.6 2.9 2.9
Mideast, Greek 3.7 0.0 0.0 10.3 0.0 5.7 0.0 5.6 5.9 3.6
No Preference 0.0 0.0 0.0 0.0 13.0 2.9 0.0 2.8 5.9 2.6
Doesn't like any 0.0 3.7 0.0 0.0 4.4 0.0 0.0 0.0 2.9 1.1
Other Specialty food 3.7 3.7 0.0 3.4 4.4 5.7 10.0 2.8 2.9 3.6
NO. SUBJECTS 27 27 43 29 23 35 20 36 34 274
RESPONDING
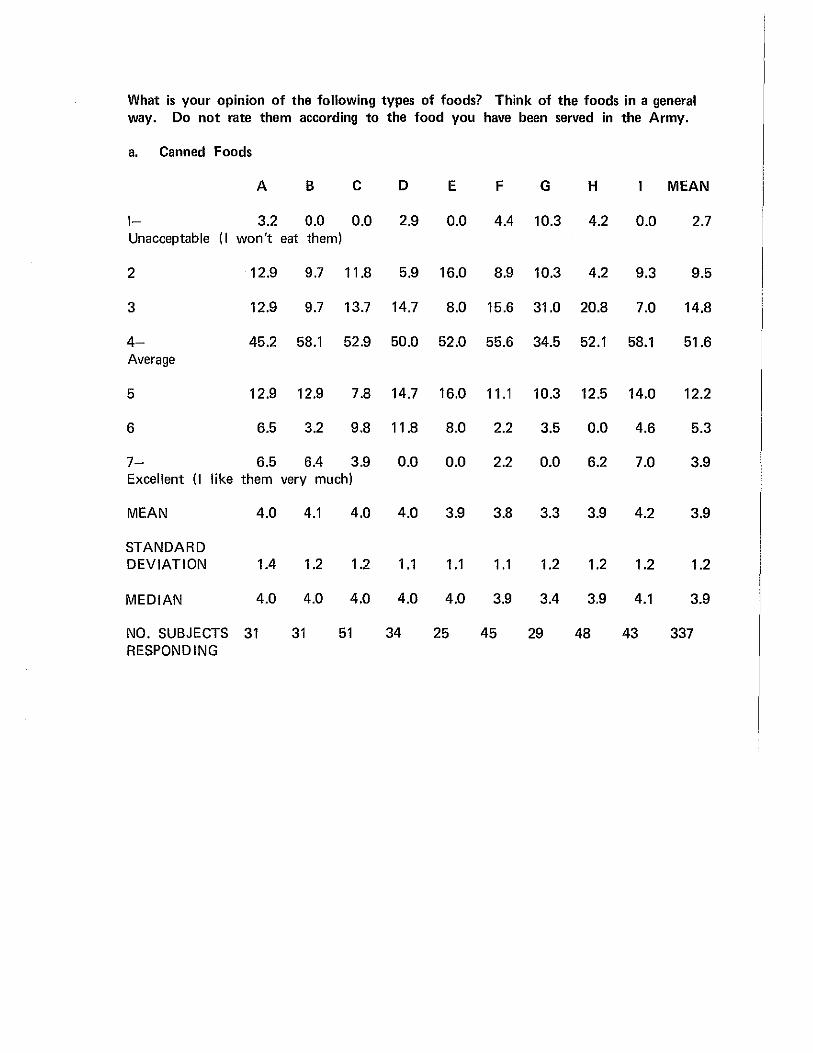
What is your opinion of the following types of foods? Think of the foods in a general way. Do not rate them according to the food you have been served in the Army.
a. Canned Foods
A B c D E F G H MEAN
1- 3.2 0.0 0.0 2.9 0.0 4.4 10.3 4.2 0.0 2.7 Unacceptable (I won't eat them)
2 12.9 9.7 11.8 5.9 16.0 8.9 10.3 4.2 9.3 9.5
3 12.9 9.7 13.7 14.7 8.0 15.6 31.0 20.8 7.0 14.8
4- 45.2 58.1 52.9 50.0 52.0 55.6 34.5 52.1 58.1 51.6 Average
5 12.9 12.9 7.8 14.7 16.0 11.1 10.3 12.5 14.0 12.2
6 6.5 3.2 9.8 11.8 8.0 2.2 3.5 0.0 4.6 5.3
7- 6.5 6.4 3.9 0.0 0.0 2.2 0.0 6.2 7.0 3.9 Excellent (I like them very much)
MEAN 4.0 4.1 4.0 4.0 3.9 3.8 3.3 3.9 4.2 3.9
STANDARD DEVIATION 1.4 1.2 1.2 1.1 1.1 1 .1 1.2 1.2 1.2 1.2
MEDIAN 4.0 4.0 4.0 4.0 4.0 3.9 3.4 3.9 4.1 3.9
NO. SUBJECTS 31 31 51 34 25 45 29 48 43 337 RESPONDING
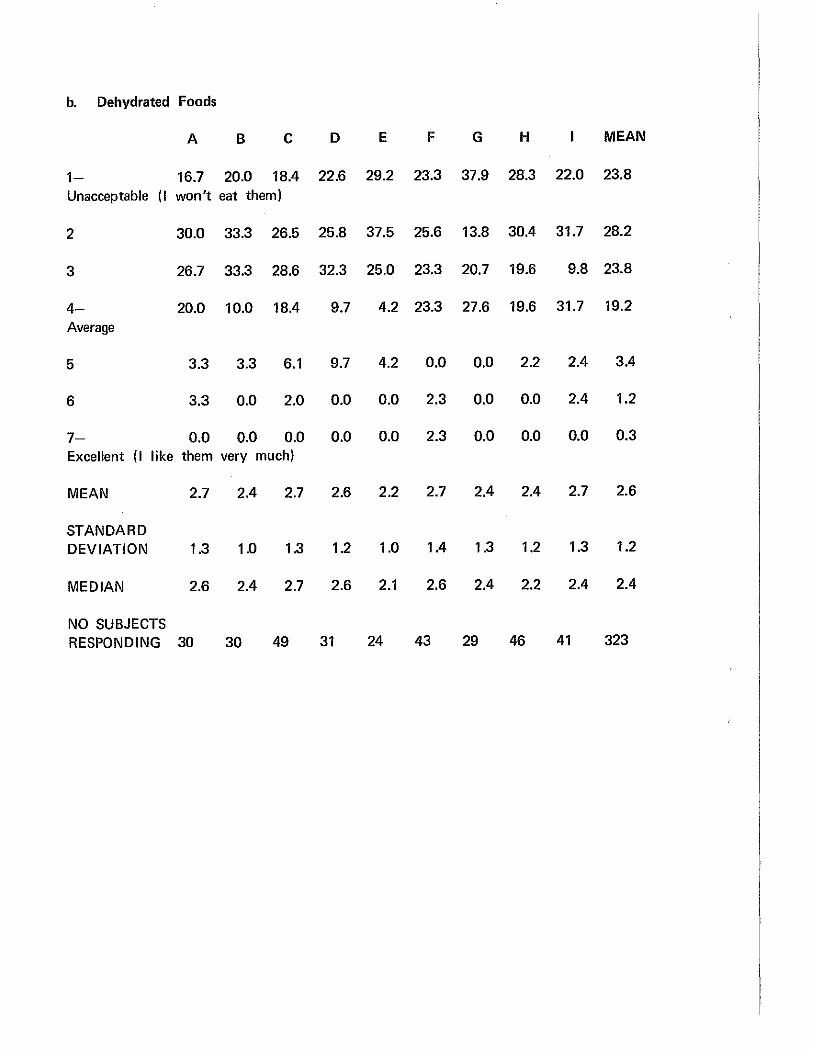
b. Dehydrated Foods
A B c D E F G H MEAN
1- 16.7 20.0 18.4 22.6 29.2 23.3 37.9 28.3 22.0 23.8 Unacceptable (I won't eat them)
2 30.0 33.3 26.5 25.8 37.5 25.6 13.8 30.4 31.7 28.2
3 26.7 33.3 28.6 32.3 25.0 23.3 20.7 19.6 9.8 23.8
4- 20.0 10.0 18.4 9.7 4.2 23.3 27.6 19.6 31.7 19.2
Average
5 3.3 3.3 6.1 9.7 4.2 0.0 0.0 2.2 2.4 3.4
6 3.3 0.0 2.0 0.0 0.0 2.3 0.0 0.0 2.4 1.2
7- 0.0 0.0 0.0 0.0 0.0 2.3 0.0 0.0 0.0 0.3 Excellent (I like them very much)
MEAN 2.7 2.4 2.7 2.6 2.2 2.7 2.4 2.4 2.7 2.6
STANDARD DEVIATION 1.3 1.0 1.3 1.2 1.0 1.4 1.3 1.2 1.3 1.2
MEDIAN 2.6 2.4 2.7 2.6 2.1 2.6 2.4 2.2 2.4 2.4
NO SUBJECTS RESPONDING 30 30 49 31 24 43 29 46 41 323
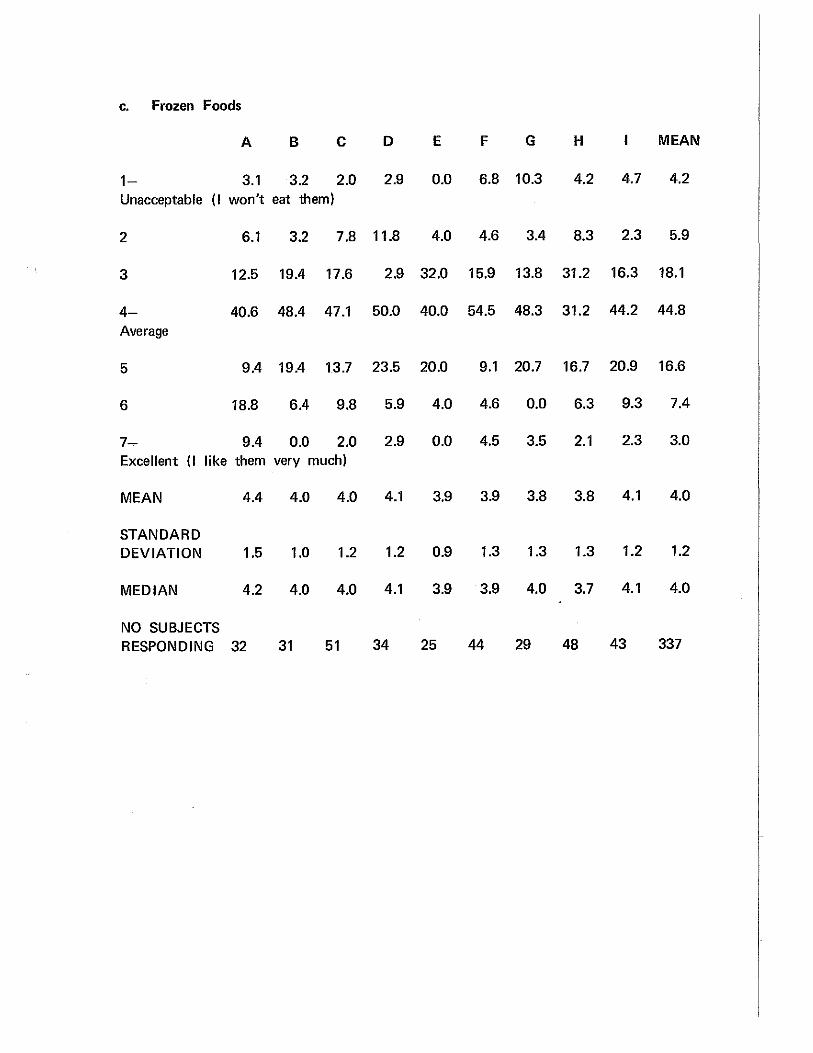
c. Frozen Foods
A B c D E F G H MEAN
1- 3.1 3.2 2.0 2.9 0.0 6.8 10.3 4.2 4.7 4.2 Unacceptable (I won't eat them)
2 6.1 3.2 7.8 11.8 4.0 4.6 3.4 8.3 2.3 5.9
3 12.5 19.4 17.6 2.9 32.0 15.9 13.8 31.2 16.3 18.1
4- 40.6 48.4 47.1 50.0 40.0 54.5 48.3 31.2 44.2 44.8 Average
5 9.4 19.4 13.7 23.5 20.0 9.1 20.7 16.7 20.9 16.6
6 18.8 6.4 9.8 5.9 4.0 4.6 0.0 6.3 9.3 7.4
7- 9.4 0.0 2.0 2.9 0.0 4.5 3.5 2.1 2.3 3.0 Excellent (I like them very much)
MEAN 4.4 4.0 4.0 4.1 3.9 3.9 3.8 3.8 4.1 4.0
STANDARD DEVIATION 1.5 1.0 1.2 1.2 0.9 1.3 1.3 1.3 1.2 1.2
MEDIAN 4.2 4.0 4.0 4.1 3.9 3.9 4.0 3.7 4.1 4.0
NO SUBJECTS RESPONDING 32 31 51 34 25 44 29 48 43 337

Would you like to be permitted to eat in any mess hall on your post?
A B c D E F G H MEAN
Yes 65.6 71.0 66.7 50.0 69.2 48.9 58.6 56.0 67.4 61.0
No 9.4 9.7 11.8 2.9 11.5 8.9 10.3 8.0 2.3 8.2
Doesn't matter 25.0 19.3 21.6 47.1 19.2 42.2 31.0 36.0 30.2 30.8
NO SUBJECTS RESPONDING 32 31 51 34 26 45 29 50 43 341
Do you think the military should operate some snack bars where you could eat free?
A B c D E F G H MEAN
Yes 87.9 83.3 80.4 73.5 69.2 68.9 75.9 83.7 72.1 77.3
No 0.0 10.0 5.9 0.0 7.7 13.3 6.9 2.0 9.3 6.2
Doesn't matter 12.1 6.7 13.7 26.5 23.1 17.8 17.2 14.3 18.6 16.5
NO SUBJECTS RESPONDING 33 30 51 34 26 45 29 49 43 340
How much time do you think you should be permitted to stay in the snack bar when you go there?
A B c D E F G H MEAN
Just to eat 52.9 41.9 50.0 45.5 44.0 61.4 55.2 51.0 38.5 49.4
No more than 14.7 22.6 10.4 21.2 16.0 15.9 24.1 32.7 23.1 20.2 one hour
As long as 32.4 35.5 39.6 33.3 40.0 22.7 20.7 16.3 38.5 30.4 you want
NO SUBJECTS RESPONDING 34 31 48 33 25 44 29 49 39 332
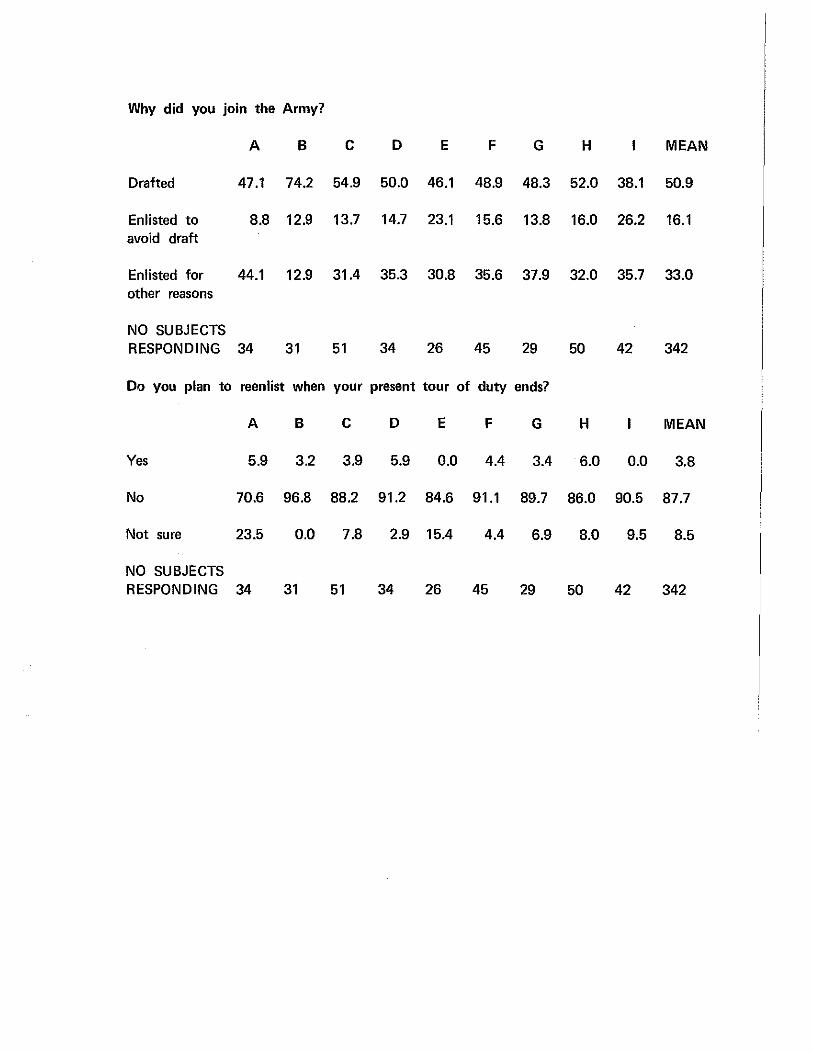
Why did you join the Army?
A B c D E F G H MEAN
Drafted 47.1 74.2 54.9 50.0 46.1 48.9 48.3 52.0 38.1 50.9
Enlisted to 8.8 12.9 13.7 14.7 23.1 15.6 13.8 16.0 26.2 16.1 avoid draft
Enlisted for 44.1 12.9 31.4 35.3 30.8 35.6 37.9 32.0 35.7 33.0 other reasons
NO SUBJECTS RESPONDING 34 31 51 34 26 45 29 50 42 342
Do you plan to reenlist when your present tour of duty ends?
A B c D E F G H MEAN
Yes 5.9 3.2 3.9 5.9 0.0 4.4 3.4 6.0 0.0 3.8
No 70.6 96.8 88.2 91.2 84.6 91.1 89.7 86.0 90.5 87.7
Not sure 23.5 0.0 7.8 2.9 15.4 4.4 6.9 8.0 9.5 8.5
NO SUBJECTS RESPONDING 34 31 51 34 26 45 29 50 42 342
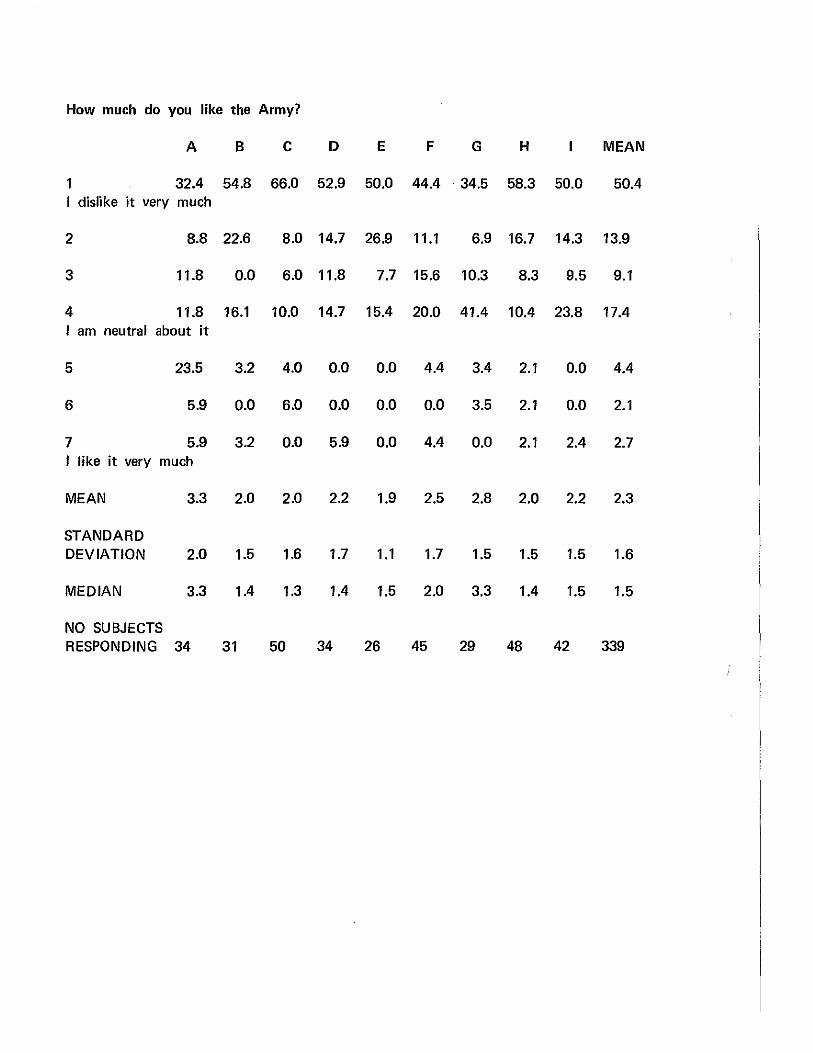
How much do you like the Army?
A B c D E F G H MEAN
1 32.4 54.8 66.0 52.9 50.0 44.4 34.5 58.3 50.0 50.4 I dislike it very much
2 8.8 22.6 8.0 14.7 26.9 11.1 6.9 16.7 14.3 13.9
3 11.8 0.0 6.0 11.8 7.7 15.6 10.3 8.3 9.5 9.1
4 11.8 16.1 10.0 14.7 15.4 20.0 41.4 10.4 23.8 17.4 I am neutral about it
5 23.5 3.2 4.0 0.0 0.0 4.4 3.4 2.1 0.0 4.4
6 5.9 0.0 6.0 0.0 0.0 0.0 3.5 2.1 0.0 2.1
7 5.9 3.2 0.0 5.9 0.0 4.4 0.0 2.1 2.4 2.7 I like it very much
MEAN 3.3 2.0 2.0 2.2 1.9 2.5 2.8 2.0 2.2 2.3
STANDARD DEVIATION 2.0 1.5 1.6 1.7 1.1 1.7 1.5 1.5 1.5 1.6
MEDIAN 3.3 1.4 1.3 1.4 1.5 2.0 3.3 1.4 1.5 1.5
NO SUBJECTS RESPONDING 34 31 50 34 26 45 29 48 42 339

Compared to other enlisted men that you know, do you believe the Army has treated
you fairly?
A B c D E F G H MEAN
Yes 60.6 58.1 46.0 61.8 30.8 52.3 51.7 39.6 38.1 48.4
No 39.4 41.9 54.0 38.2 69.2 47.7 48.3 60.4 61.9 51.6
NO SUBJECTS RESPONDING 33 31 50 34 26 44 29 48 42 337
Do you think the Army is using your talents and abilities effectively?
A B c D E F G H MEAN
Yes 39.4 35.5 16.0 11.8 19.2 20.0 34.5 12.8 21.4 22.3
No 60.6 64.5 84.0 88.2 80.8 80.0 65.5 87.2 78.6 77.7
NO SUBJECTS RESPONDING 33 31 50 34 26 45 29 47 42 337
RESULTS FOR BCT UNITS

Identification
BCT
Units
B-2-2
C-1-2
No- Interviewed
50
49
No- Discarded
1
0
Total
49
49
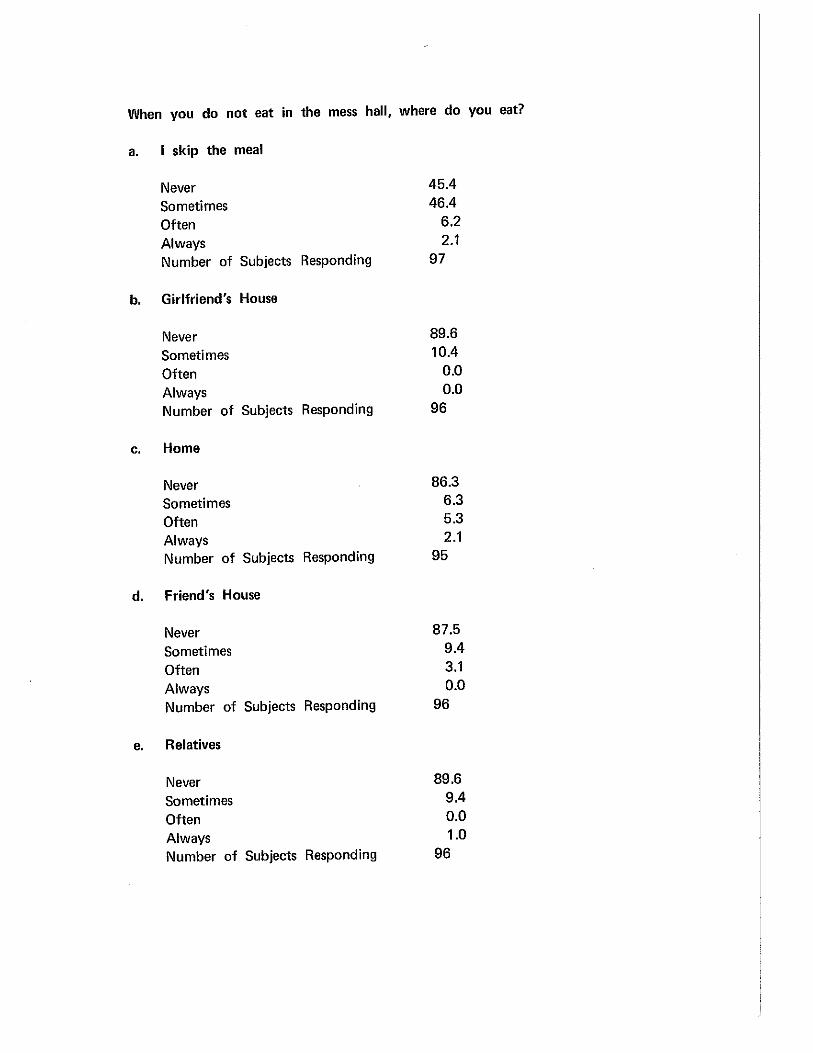
When you do not eat in the mess hall, where do you eat?
a. I skip the meal
Never Sometimes Often Always Number of Subjects Responding
b. Girlfriend's House
Never Sometimes Often Always Number of Subjects Responding
c. Home
Never Sometimes Often Always Number of Subjects Responding
d. Friend's House
Never Sometimes Often Always Number of Subjects Responding
e. Relatives
Never Sometimes Often Always Number of Subjects Responding
45.4 46.4
6.2 2.1
97
89.6 10.4
0.0 0.0
96
86.3 6.3 5.3 2.1
95
87.5 9.4 3.1 0.0
96
89.6 9.4 0.0 1.0
96
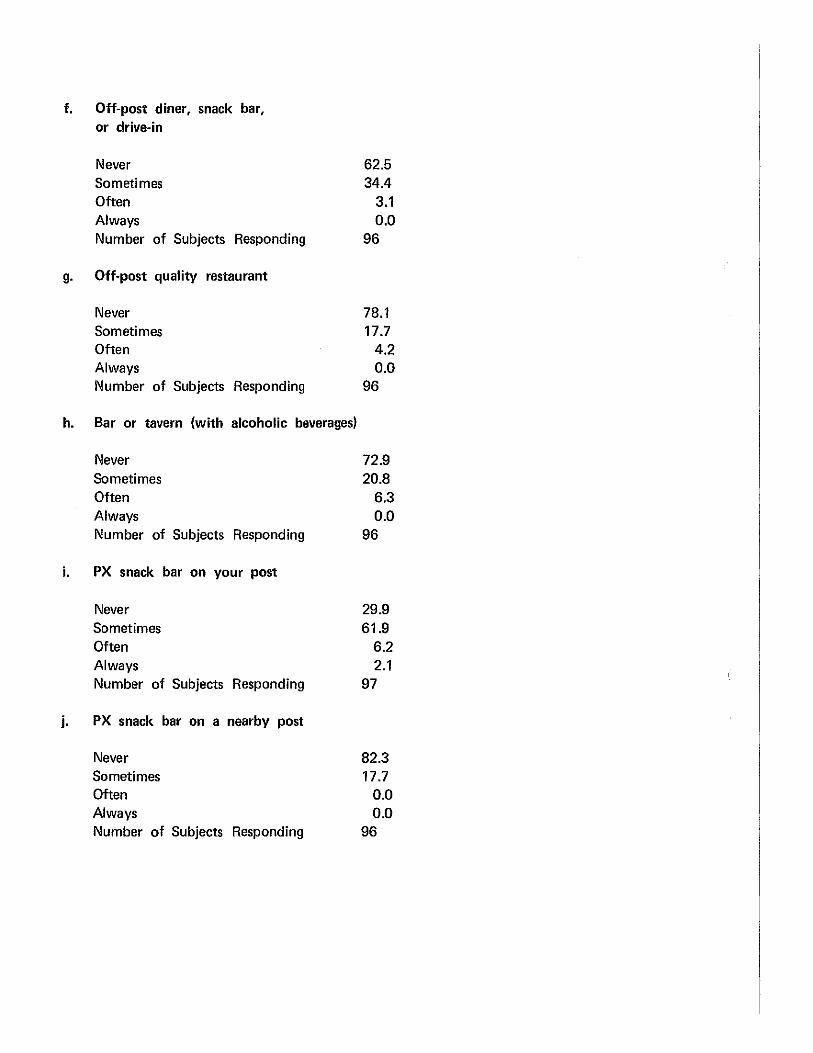
f. Off-post diner, snack bar, or drive-in
Never 62.5 ~m~m~ ~A
Often 3.1 Always 0.0 Number of Subjects Responding 96
g. Off-post quality restaurant
Never 78.1 Sometimes 17.7 Often 4.2 Always 0.0 Number of Subjects Responding 96
h. Bar or tavern {with alcoholic beverages)
Never 72.9 ~metimes 20.8 Often 6.3 Always 0.0 Number of Subjects Responding 96
i. PX snack bar on your post
Never 29.9 Sometimes 61.9 Often 6.2 Always 2.1 Number of Subjects Responding 97
j. PX snack bar on a nearby post
Never 82.3 Sometimes 17.7 Often 0.0 Always 0.0 Number of Subjects Responding 96

k. NCO service club on your post
Never 93.8 Sometimes 6.2 Often 0.0 Always 0.0 Number of Subjects Responding 96
1 •. NCO service club on a nearby post
Never 99.0 Sometimes 1.0 Often 0.0 Always 0.0 Number of Subjects Responding 96
m. PX donut shop
Never 80.0 Sometimes 19.0 Often 1.0 Always 0.0 Number of Subjects R sponding 95
n. EM club
Never 93.8 Sometimes 6.2 Often 0.0 Always 0.0 Number of Subjects Responding 96

Consider the normal meals that you are served at your mess hall (excluding the short order) during the weekdays (Monday thru Friday). Tell us your opinion of the variety of these meals from day to day.
a. Breakfast
1-No variety 2 3 4-About right 5 6 7-Too much variety
MEAN
STANDARD DEVAIATION
MEDIAN
Number of Subjects Responding
b. Midday Meal
1-No variety 2 3 4-About right 5 6 7-Too much variety
MEAN
STANDARD DEVIATION
MEDIAN
Number of Subjects Responding
29.6
22.4 16.3 19.4
8.2 4.1 0.0
2.7
1.5
2.4
98
2.0
10.2 31.6 42.9
10.2 2.0 1.0
3.6
1.0
3.6
98

c. Evening Meal
1-No variety 2 3 4-About right 5 6 7-Too much variety
MEAN
STANDARD DEVIATION
MEDIAN
Number of Subjects Responding
3.1
5.1 20.4 53.1
11.2 6.1 1.0
3.9
1.0
3.9
98
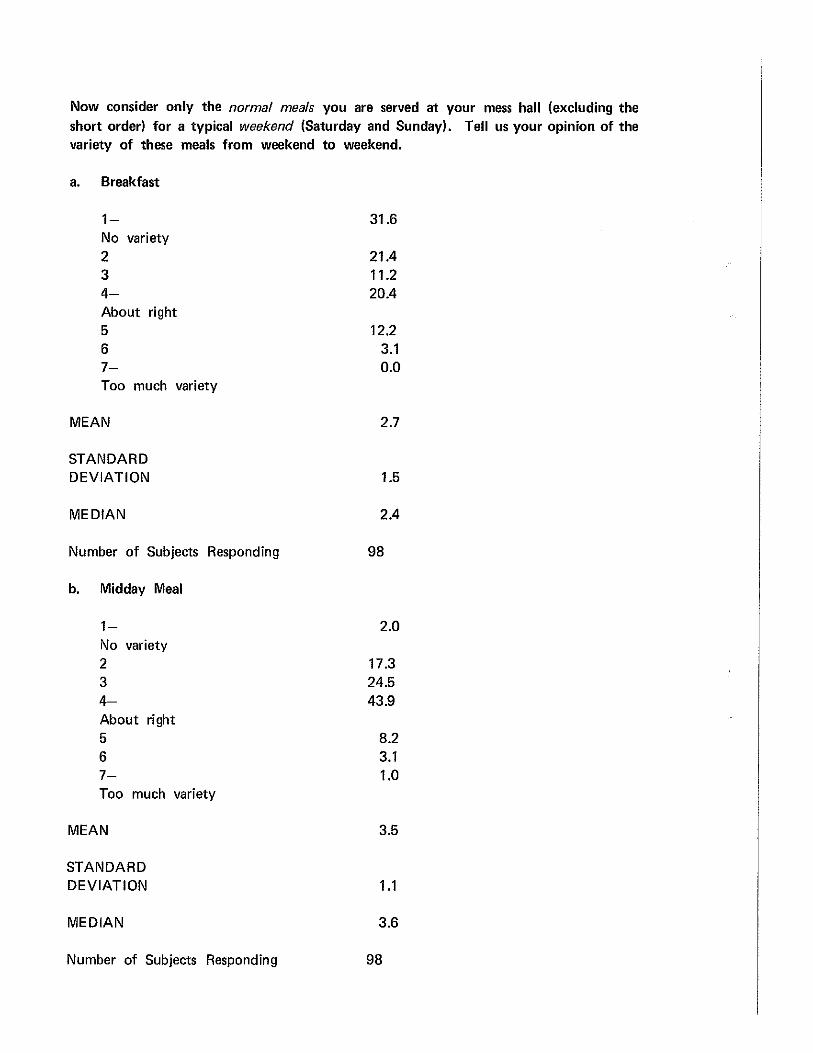
Now consider only the normal meals you are served at your mess hall (excluding the short order) for a typical weekend (Saturday and Sunday). Tell us your opinion of the variety of these meals from weekend to weekend.
a. Breakfast
1-No variety 2 3 4-About right 5 6 7-Too much variety
MEAN
STANDARD DEVIATION
MEDIAN
Number of Subjects Responding
b. Midday Meal
1-No variety 2 3 4-About right 5 6 7-Too much variety
MEAN
STANDARD DEVIATION
MEDIAN
Number of Subjects Responding
31.6
21.4 11.2 20.4
12.2 3.1 0.0
2.7
1.5
2.4
98
2.0
17.3 24.5 43.9
8.2 3.1 1.0
3.5
1.1
3.6
98

c. Evening Meal
1- 2.0 No variety 2 15.3 3 24.5 4- 40.8 About right 5 11.2 6 5.1 7- 1.0 Too much variety
MEAN 3.6
STANDARD DEVIATION 1.2
MEDIAN 3.7
Number of Subjects Responding 98
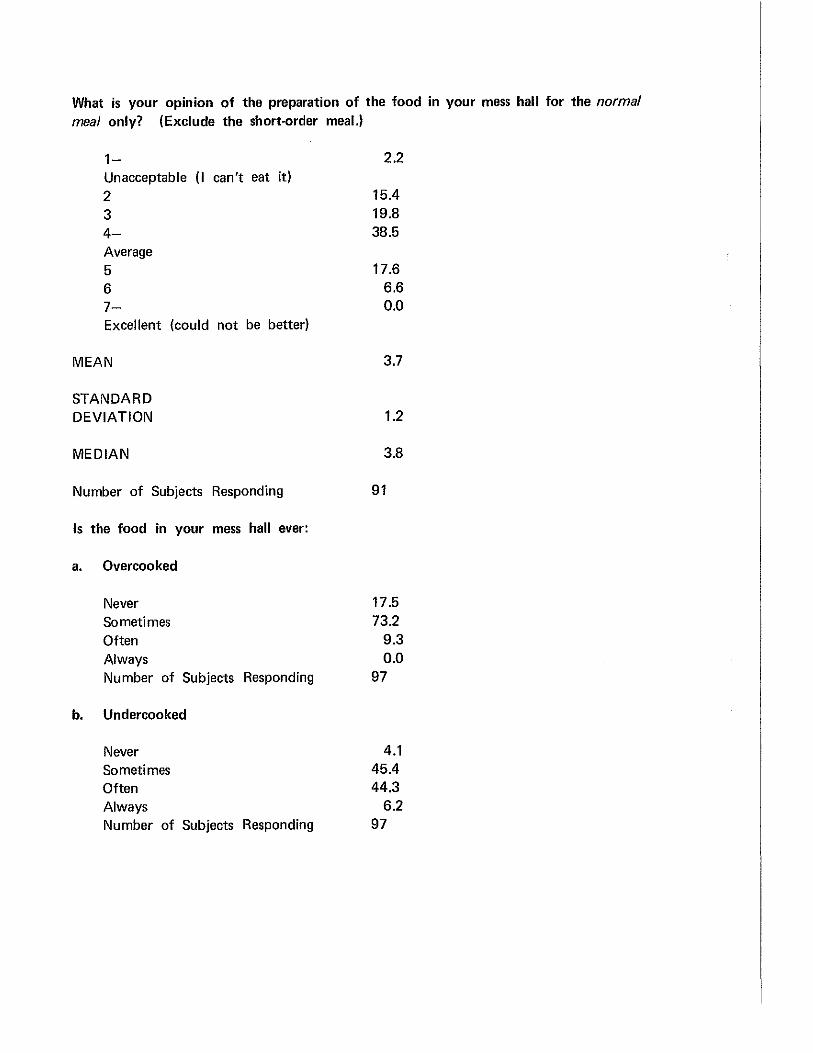
What is your opm1on of the preparation of the food in your mess hall for the normal meal only? (Exclude the short-order meal.)
,_ Unacceptable (I can't eat it) 2 3 4-Average 5 6 7-Excellent (could not be better)
MEAN
STANDARD DEVIATION
MEDIAN
Number of Subjects Responding
Is the food in your mess hall ever:
a. Overcooked
2.2
15.4 19.8 38.5
17.6 6.6 0.0
3.7
1.2
3.8
91
Never 17.5 Sometimes 73.2 Ofun 9~
Always 0.0 Number of Subjects Responding 97
b. Undercooked
Never 4.1 Sometimes 45.4 Ofun M~
Always 6.2 Number of Subjects Responding 97

c. Cold
Never 11.3 Sometimes 44.3 Often 38.1 Always 6.2 Number of Subjects Responding 97
d. Tasteless or bland
Never 11.3 Sometimes 44.3 Often 38.1 Always 6.2 Number of Subjects Responding 97
e. Burned
Never 35.0 Sometimes 56.7 Often 8.3 Always 0.0 Number of Subjects Responding 97
f. Dried out
Never 17.5 Sometimes 55.7 Often 25.8 Always 1.0 Number of Subjects Responding 97
g. Greasy
Never 17.5 Sometimes 44.3 Often 33.0 Always 5.2 Number of Subjects Responding 97
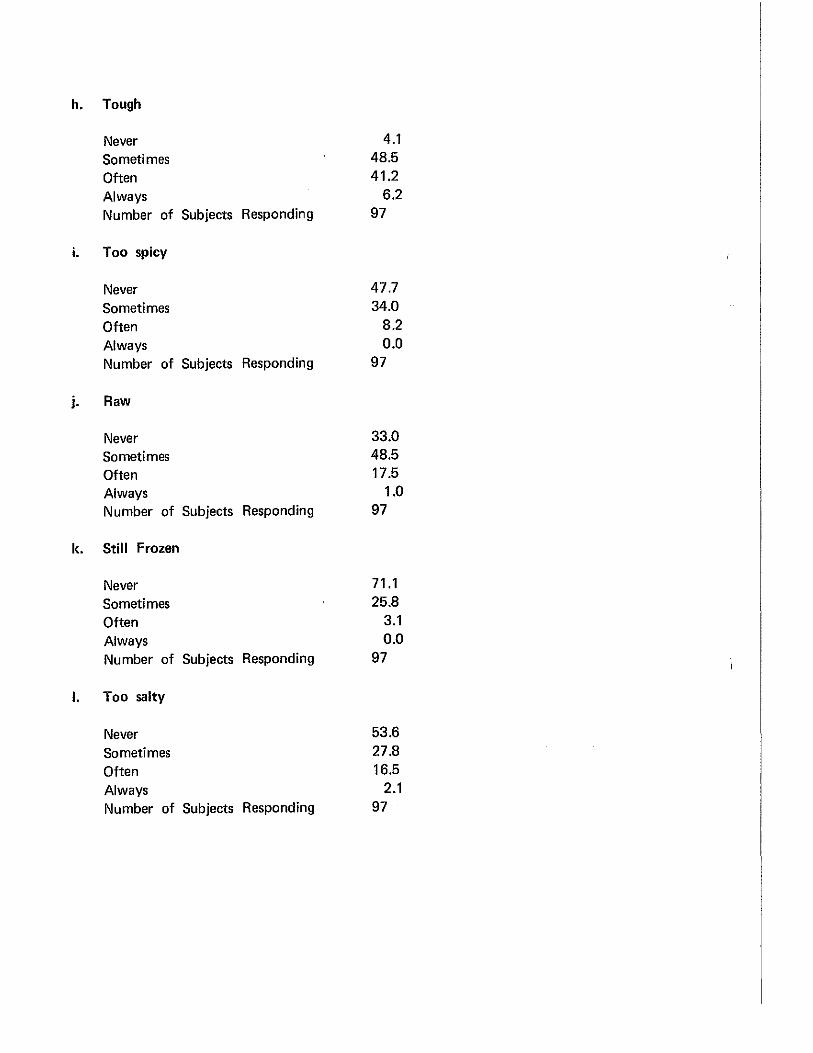
h. Tough
Never 4.1 Sometimes 48.5 Often 41.2 Always 6.2 Number of Subjects Responding 97
i. Too spicy
Never 47.7 Sometimes 34.0 Often 8.2 Always 0.0 Number of Subjects Responding 97
j. Raw
Never 33.0 Sometimes 48.5 Often 17.5 Always 1.0 Number of Subjects Responding 97
k. Still Frozen
Never 71.1 Sometimes 25.8 Often 3.1 Always 0.0 Number of Subjects Responding 97
I. Too salty
Never 53.6 Sometimes 27.8 Often 16.5 Always 2.1 Number of Subjects Responding 97
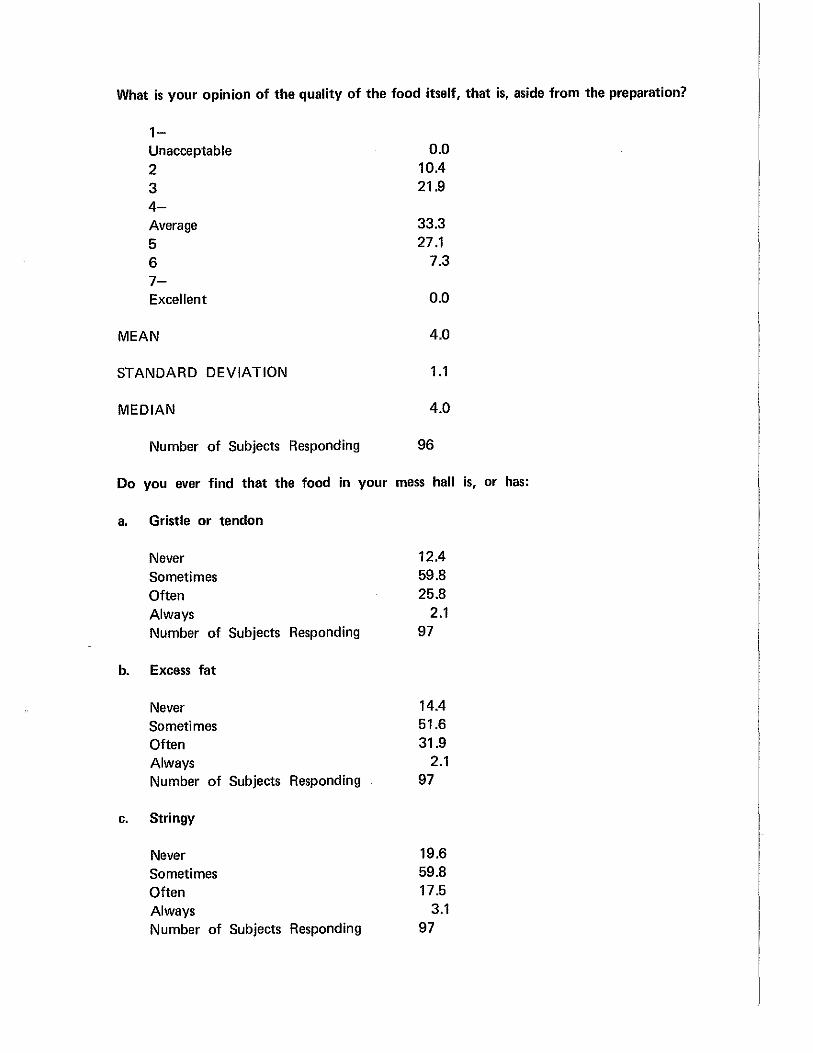
What is your opinion of the quality of the food itself, that is, aside from the preparation?
1-Unacceptable 0.0 2 10.4 3 21.9 4-Average 33.3 5 27.1 6 7.3 7-Excellent 0.0
MEAN 4.0
STANDARD DEVIATION 1.1
MEDIAN 4.0
Number of Subjects Responding 96
Do you ever find that the food in your mess hall is, or has:
a. Gristle or tendon
Never Sometimes Often Always Number of Subjects
b. Excess fat
Never Sometimes Often Always Number of Subjects
c. Stringy
Never Sometimes Often Always Number of Subjects
Responding
Responding
Responding
12.4 59.8 25.8
2.1 97
14.4 51.6 31.9
2.1 97
19.6 59.8 17.5
3.1 97
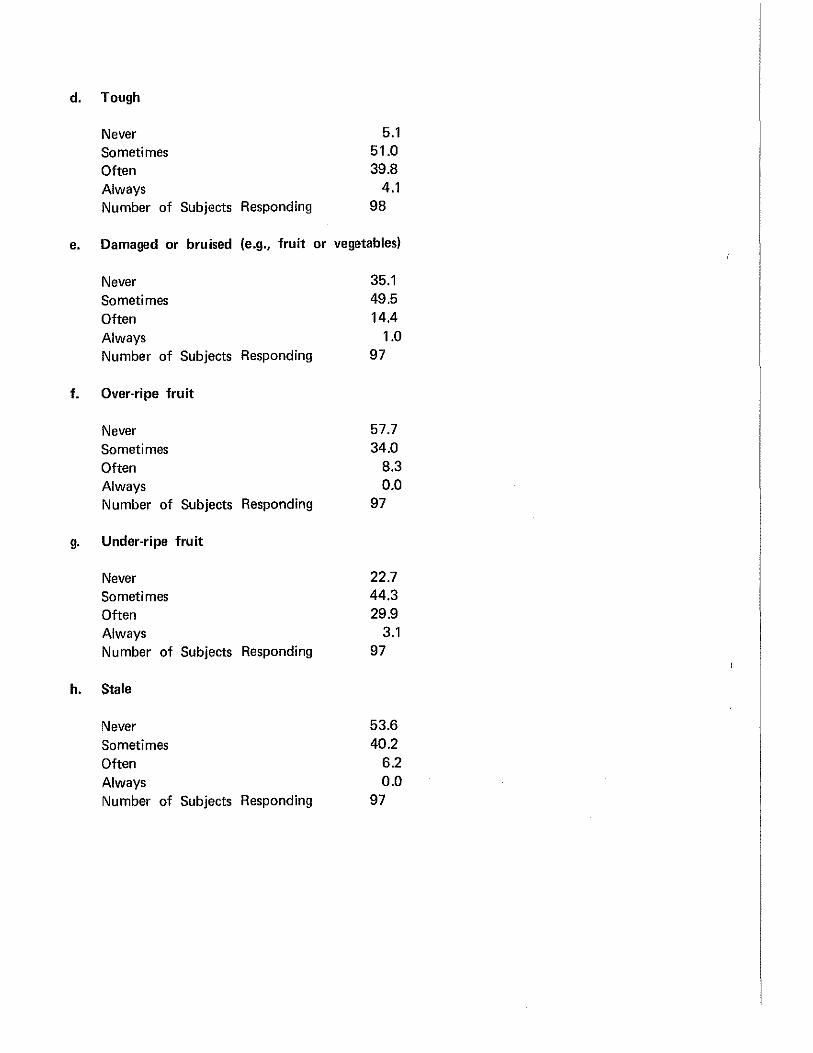
d. Tough
Never 5.1 Sometimes 51.0 Often 39.8 Always 4.1 Number of Subjects Responding 98
e. Damaged or bruised (e.g., fruit or vegetables)
Never 35.1 Sometimes 49.5 Often 14.4 Always 1.0 Number of Subjects Responding 97
f. Over·ripe fruit
Never 57.7 Sometimes 34.0 Often 8.3 Always 0.0 Number of Subjects Responding 97
g. Under·ripe fruit
Never 22.7 Sometimes 44.3 Often 29.9 Always 3.1 Number of Subjects Responding 97
h. Stale
Never 53.6 Sometimes 40.2 Often 6.2 Always 0.0 Number of Subjects Responding 97

i. Old looking
Never 49.5 Sometimes 37.1 Often 12.4 Always 1.0 Number of Subjects Responding 97
j. Sour (e.g., milk)
Never 86.6 Sometimes 10.3 Often 3.1
Always 0.0 Number of Subjects Responding 97
k. Spoiled
Never 83.5 Sometimes 15.5 Often 1.0 Always 0.0 Number of Subjects Responding 97
I. Off-flavor or odor
Never 58.8 Sometimes 35.0 Often 5.2 Always 1.0 Number of Subjects Responding 97
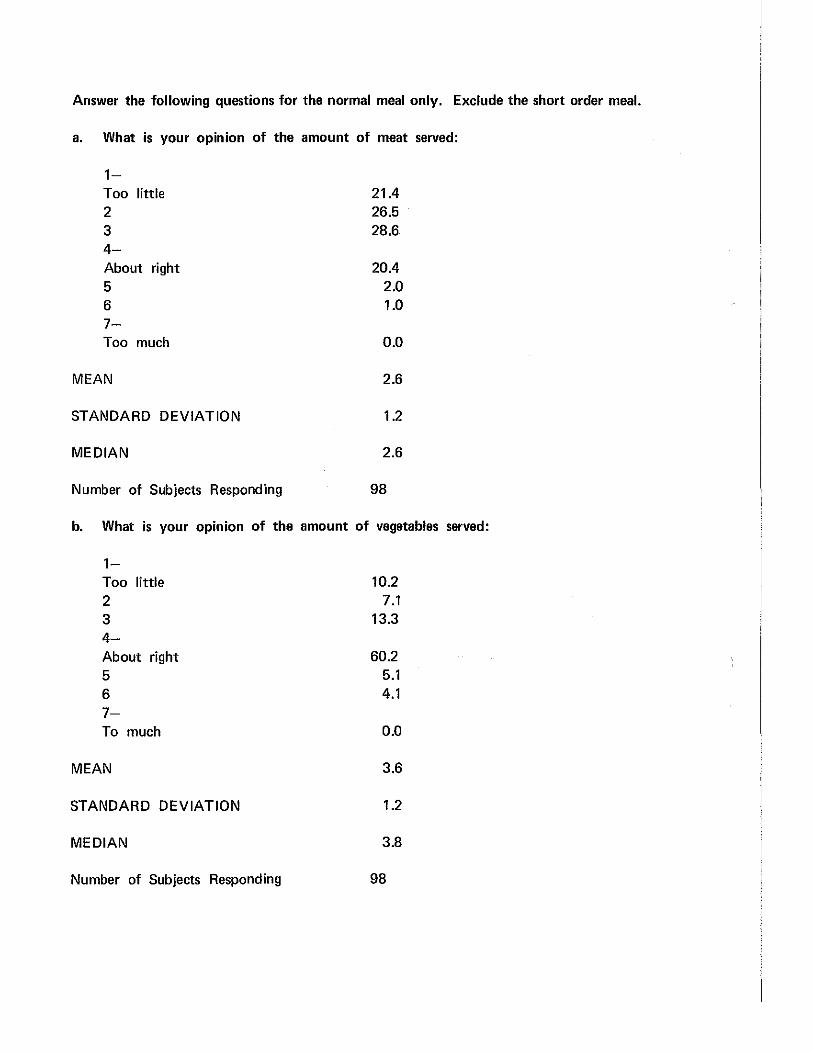
Answer the following questions for the normal meal only. Exclude the short order meal.
a. What is your opinion of the amount of meat served:
1-Too little 2 3 4-About right 5 6 7-Too much
MEAN
STANDARD DEVIATION
MEDIAN
Number of Subjects Responding
21.4 26.5 28.6
20.4 2.0 1.0
0.0
2.6
1.2
2.6
98
b. What is your opinion of the amount of vegetables served:
1-Too little 2 3 4-About right 5 6 7-To much
MEAN
STANDARD DEVIATION
MEDIAN
Number of Subjects Responding
10.2 7.1
13.3
60.2 5.1 4.1
0.0
3.6
1.2
3.8
98
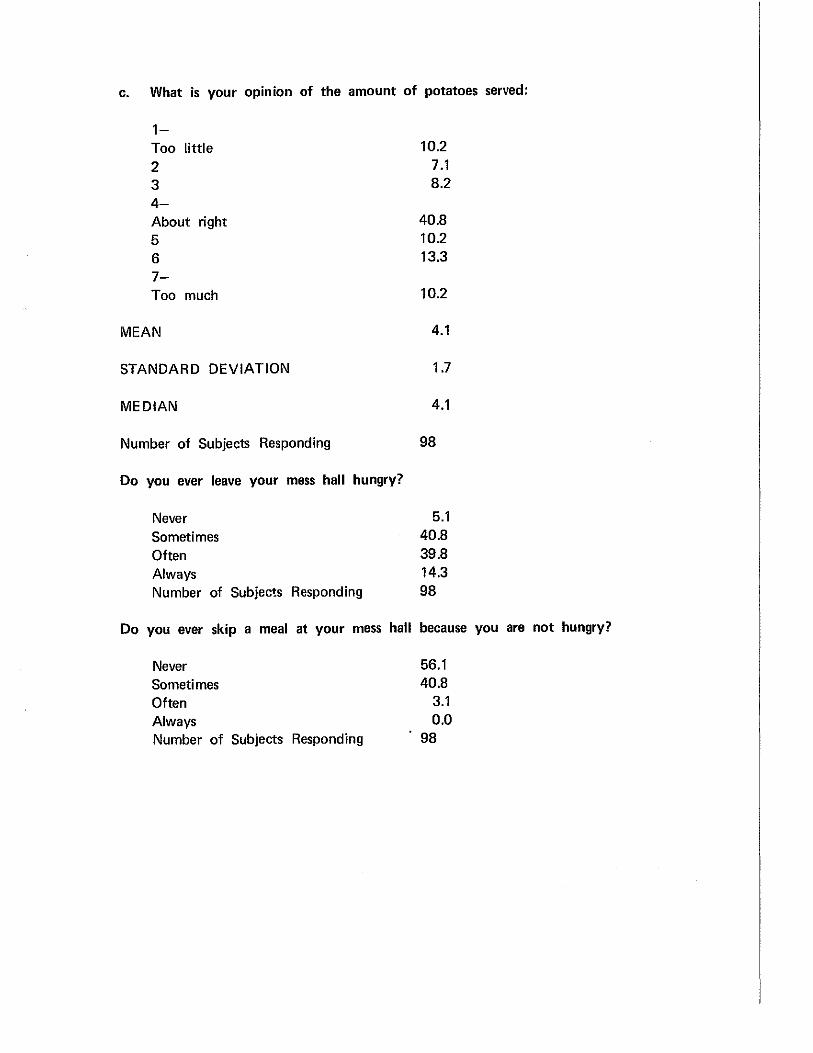
c. What is your opinion of the amount of potatoes served:
1-Too little 10.2
2 7.1 3 8.2 4-About right 40.8 5 10.2 6 13.3 7-Too much 10.2
MEAN 4.1
STANDARD DEVIATION 1.7
MEDIAN 4.1
Number of Subjects Responding 98
Do you ever leave your mess hall hungry?
Never 5.1 Sometimes 40.8 Often 39.8 Always 14.3 Number of Subjects Responding 98
Do you ever skip a meal at your mess hall because you are not hungry?
Never 56.1 Sometimes 40.8 Often 3.1 Always 0.0 Number of Subjects Responding 98

Do you ever skip a meal at your mess hall because you think you are gaining too much weight?
Never 85.7 Sometimes 12.2 moon 2D Always 0.0 Number of Subjects Responding 98
Do you serve yourself or do the mess hall personnel serve you the following items? Circle the items which you serve you rself.1 0
Meat item Potatoes Vegetables Salad Dessert Beverage
Percentage of BCTs answering affirmatively:
9.2 11.2 10.2 13.3 11.2 44.9
If you had your choice, which of the following items would you prefer to serve yourself? Circle those items which you would prefer to serve yourself.' 0
Meat item Potatoes Vegetables Salad Dessert Beverage
Percentage of BCTs answering affirmatively:
88.8 42.9 41.8 50.0 71.4 72.4
10 NOTE: Percentages do not total 100% because subjects were free to choose as many or as few items desired.

Do you ever not eat or throw away any of the food which you are served in your mess
hall?
a. Meat item
Never Sometimes Often Always Number of Subjects Responding
b. Potatoes
Never Sometimes Often Always Number of Subjects Responding
c. Vegetables
Never Sometimes Often Always Number of Subjects Responding
d. Salad
Never Sometimes Often Always Number of Subjects Responding
e. Dessert
Never Sometimes Often Always Number of Subjects Responding
66.0 27.8
6.2 0.0
97
34.0 43.3 21.7
1.0 97
29.9 49.5 18.6
2.1 97
53.1 38.5
7.3 1.0
96
71.9 24.0
4.2 0.0
96

f. Beverage
Never 93.8 Sometimes 6.2 Often 0.0 Always 0.0 Number of Subjects Responding 96
If you do throw food away or do not eat any of the food, tell us how much of each item.
a. Meat item
None A little A lot All Number of Subjects Responding
b. Potatoes
None A little A lot All Number of Subjects Responding
c. Vegetables
None A little A lot All Number of Subjects Responding
d. Salad
None A little A lot All Number of Subjects Responding
60.6 31.9 5.3 2.1
94
29.2 45.8 20.8 4.2
96
28.7 50.0 19.2
2.1 94
48.9 38.0 9.8 3.3
92
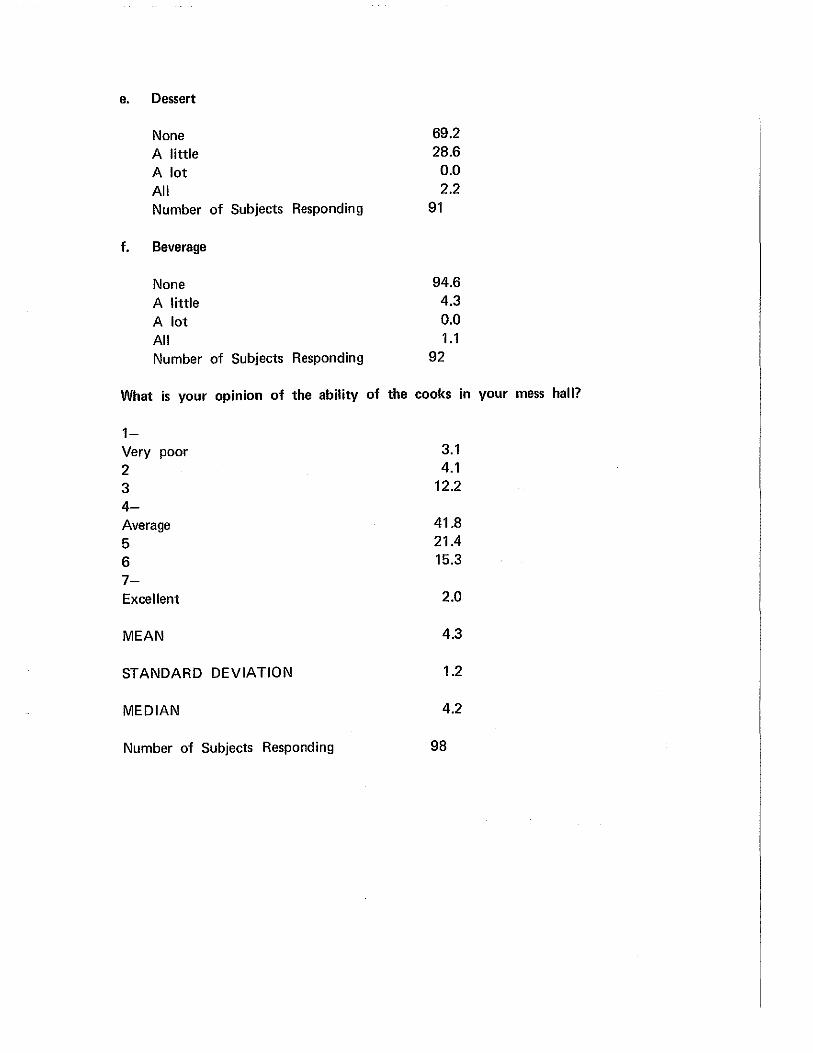
e. Dessert
None A little A lot All Number of Subjects
f. Beverage
None A little A lot All Number of Subjects
Responding
Responding
69.2 28.6
0.0 2.2
91
94.6 4.3 0.0 1.1
92
What is your opinion of the ability of the cooks in your mess hall?
1-Very poor 2 3 4-Average 5 6 7-Excellent
MEAN
STANDARD DEVIATION
MEDIAN
Number of Subjects Responding
3.1 4.1
12.2
41.8 21.4 15.3
2.0
4.3
1.2
4.2
98

Do you think the cooks in your mess hall are doing their job to the best of their ability?
1-No, definitely not 2 3 4 5 6 7-Very much so
MEAN
STANDARD DEVIATION
MEDIAN
Number of Subjects Responding
8.2 7.1
14.3 27.5 25.5
9.2
8.2
4.2
1.6
4.2
98
Do you consider the sanitary conditions in the dining room of your mess hall to be satisfactory or unsatisfactory?
Satisfactory Unsatisfactory Number of Subjects Responding
93.9 6.1
98
Do you consider the sanitary conditions of the kitchen area of your mess hall to be satisfactory or unsatisfactory?
Satisfactory Unsatisfactory Number of Subjects Responding
94.9 5.1
98
Do you consider the sanitary conditions of the outside of your mess hall to be satisfactory or unsatisfactory?
Satisfactory Unsatisfactory Number of Subjects Responding
93.8 6.2
97

Do you ever find the following in your mess hall?
a. Dirty silverware
Never 39.8 Sometimes 48.0 Often 10.2 Always 2.0 Number of Subjects Responding 98
b. Dirty trays
Never 19.4 Sometimes 52.0 O~n W.4 Always 8.2 Number of Subjects Responding 98
c. Dirty dishes and glasses
N~er ~B
Sometimes 45.9 Often 7.1 Always 1.0 Number of Subjects Responding 98
d. Dirty floors
Never 85.7 Sometimes 11.2 Often 3.1 Always 0.0 Number of Subjects Responding 98
e. Dirty tables and chairs
Never 72.5 Sometimes 21.4 Often 6.1 Always 0.0 Number of Subjects Responding 98

f. Dirty dispensing devices
Never 76.5 Sometimes 19.4 Often 4.1 Always 0.0 Number of Subjects Responding 98
Do the cooks in your mess hall have a clean and neat appearance?
Never 3.1 Sometimes 20.4 Often 43.9 Always 32.6 Number of Subjects Responding 98
Do the KPs have a clean appearance in your mess hall?
Never 4.1 Sometimes 27.5 O~n ~~
Always 24.5 Number of Subjects Responding 98
Circle those items below which you think are a problem in your mess hall.11
Percentage of BCTS answering affirmatively:
Flies 3.1 Cockroaches 2.0 Ants 2.0 Mice 2.0 Rats 2.0 Dogs 1.0 Cats 1.0
11 NOTE: Percentages do not total 100% because subjects were free to choose as many or as few items as desired.
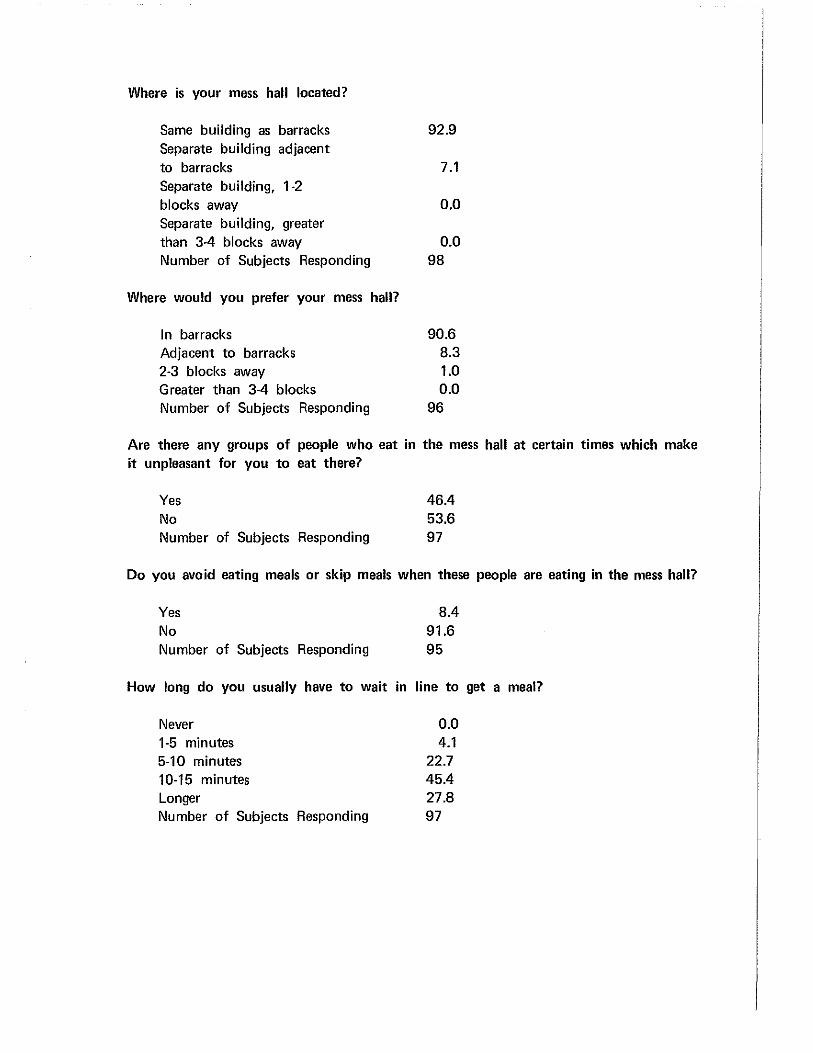
Where is your mess hall located?
Same building as barracks 92.9 Separate building adjacent to barracks 7.1 Separate building, 1-2 blocks away 0.0 Separate building, greater than 3-4 blocks away 0.0 Number of Subjects Responding 98
Where would you prefer your mess hall?
In barracks 90.6 Adjacent to barracks 8.3 2-3 blocks away 1.0 Greater than 3-4 blocks 0.0 Number of Subjects Responding 96
Are there any groups of people who eat in the mess hall at certain times which make it unpleasant for you to eat there?
Yes 46.4 No 53B Number of Subjects Responding 97
Do you avoid eating meals or skip meals when these people are eating in the mess hall?
Yes 8.4 No 91B Number of Subjects Responding 95
How long do you usually have to wait in line to get a meal?
Never 0.0 1-5 minutes 4.1 5-10 minutes 22.7 10-15 minutes 45.4 Longer 27.8 Number of Subjects Responding 97

Do you think the wait is too long?
Yes 59.4 No 40.6 Number of Subjects Responding 96
How often do you eat somewhere other than your mess hall because the wait in line at your mess hall is too long?
Never 78.1 Sometimes 17.7 Often 3.1 Always 1.0 Number of Subjects Responding 96
Once you arrive at the mess hall, how much time are you given to eat?
a. Breakfast
Less than 10 minutes 35.1 10-20 minutes 63.9 More than 20 minutes 1.0 Number of Subjects Responding 97
b. Midday Meal
Less than 10 minutes 35.0 10-20 minutes 61.9 More than 20 minutes 3.1 Number of Subjects Responding 97
c. Evening Meal
Less than 10 minutes 29.9 10-20 minutes 56.7 More than 20 minutes 13.4 Number of Subjects Responding 97
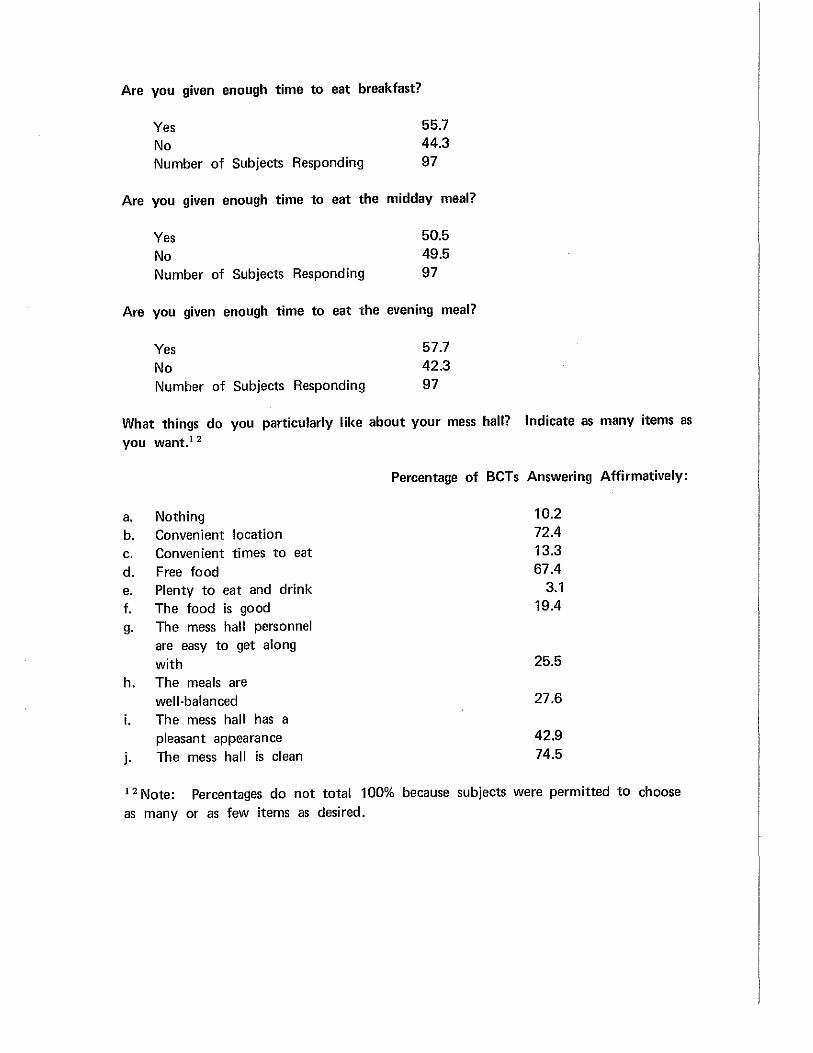
Are you given enough time to eat breakfast?
Yes 55.7 No 44.3 Number of Subjects Responding 97
Are you given enough time to eat the midday meal?
Yes 50.5 No G~ Number of Subjects Responding 97
Are you given enough time to eat the evening meal?
Yes 57.7 No ~3
Number of Subjects Responding 97
What things do you particularly like about your mess hall? Indicate as many items as you want.12
a. Nothing b. Convenient location c. Convenient times to eat d. Free food e. Plenty to eat and drink f. The food is good g. The mess hall personnel
are easy to get along with
h. The meals are well-balanced
i. The mess hall has a pleasant appearance
j. The mess hall is clean
Percentage of BCTs Answering Affirmatively:
10.2 72.4 13.3 67.4
3.1 19.4
25.5
27.6
42.9 74.5
12 Note: Percentages do not total 100% because subjects were permitted to choose as many or as few items as desired.
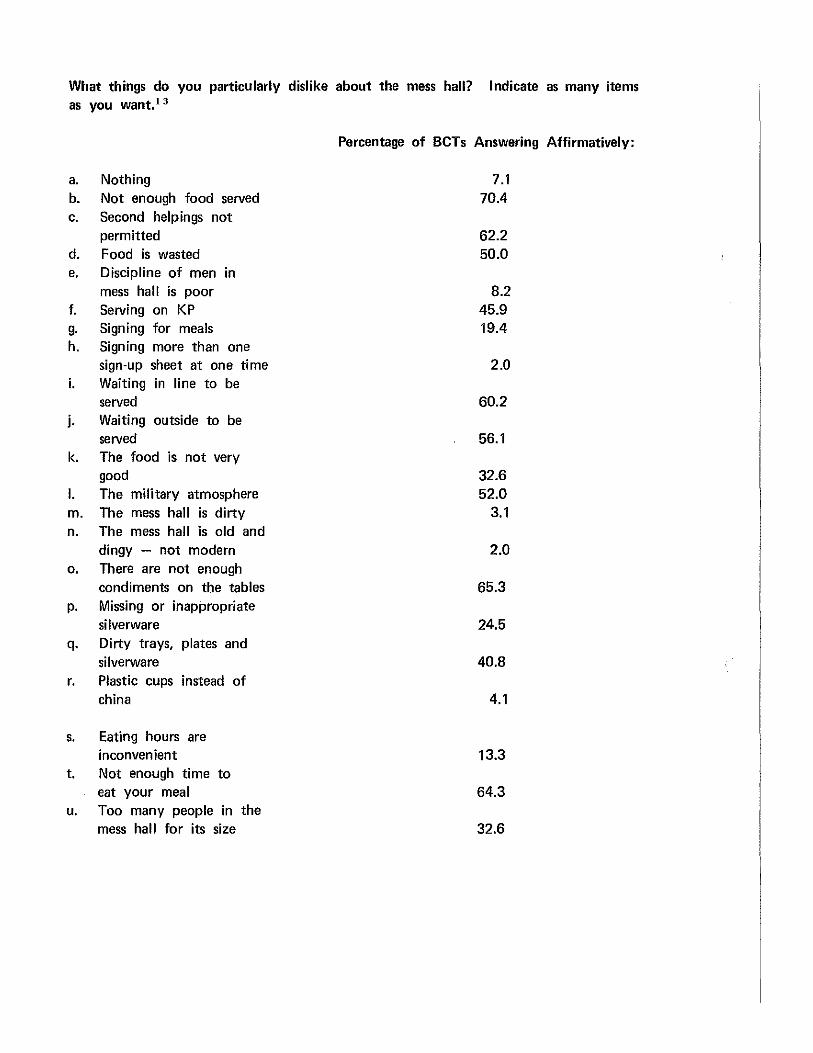
What things do you particularly dislike about the mess hall? Indicate as many items as you want. 1 3
a. Nothing b. Not enough food served c. Second helpings not
permitted d. Food is wasted e. Discipline of men in
mess hall is poor f. Serving on KP g. Signing for meals h. Signing more than one
sign·up sheet at one time i. Waiting in line to be
served j. Waiting outside to be
served k. The food is not very
good I. The military atmosphere m. The mess hall is dirty n. The mess hall is old and
dingy - not modern o. There are not enough
condiments on the tables p. Missing or inappropriate
silverware q. Dirty trays, plates and
silverware r. Plastic cups instead of
china
s. Eating hours are inconvenient
t. Not enough time to eat your meal
u. Too many people in the mess hall for its size
Percentage of BCTs Answering Affirmatively:
7.1 70.4
62.2 50.0
8.2 45.9 19.4
2.0
60.2
56.1
32.6 52.0
3.1
2.0
65.3
24.5
40.8
4.1
13.3
64.3
32.6
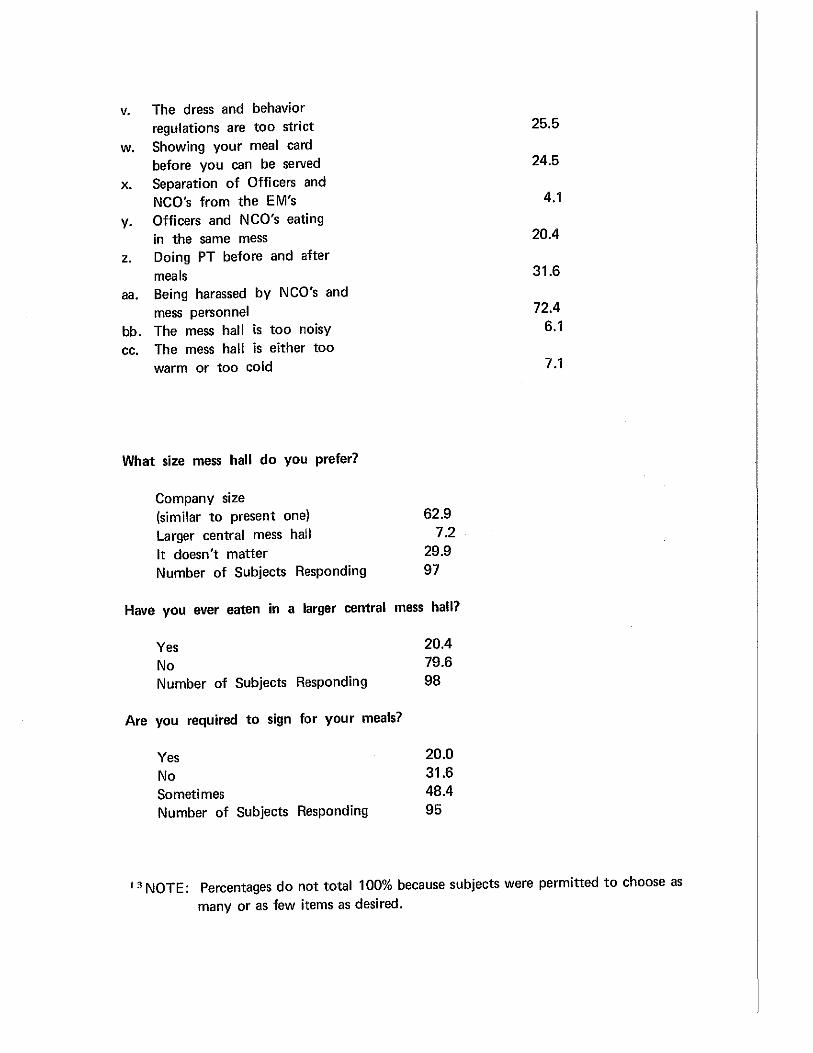
v. The dress and behavior regulations are too strict 25.5
w. Showing your meal card before you can be served 24.5
X. Separation of Officers and NCO's from the EM's 4.1
y. Officers and NCO's eating in the same mess 20.4
z. Doing PT before and after meals 31.6
aa. Being harassed by NCO's and mess personnel 72.4
bb. The mess hall is too noisy 6.1
cc. The mess hall is either too warm or too cold 7.1
What size mess hall do you prefer?
Company size (similar to present one) 62.9 Larger central mess hall 7.2 It doesn't matter 29.9 Number of Subjects Responding 97
Have you ever eaten in a larger central mess hall?
Yes 20.4 No 79.6 Number of Subjects Responding 98
Are you required to sign for your meals?
Yes 20.0 No 31B Sometimes 48.4 Number of Subjects Responding 95
1 3 NOTE: Percentages do not total 100% because subjects were permitted to choose as many or as few items as desired.

If you are required to sign for meals, when do you do it?
Before each meal 73.2 All meals of the day at one time 1.4 It varies from day to day 25.4 Number of Subjects Responding 71
Is you mess hall ever:
a. Too cold
Never 69.0 Sometimes 29.8 Often 1.2 Always 0.0 Number of Subjects Responding 84
b. Too warm
Never 70.6 Sometimes 25.9 Often 3.5 Always 0.0 Number of Subjects Responding 85
c. Stuffy
Never 55.7 Sometimes 37.5 Often 5.7 Always 1.1 Number of Subjects Responding 88
d. Smoky
Never 91.6 Sometimes 8.4 Often 0.0 Always 0.0 Number of Subjects Responding 83
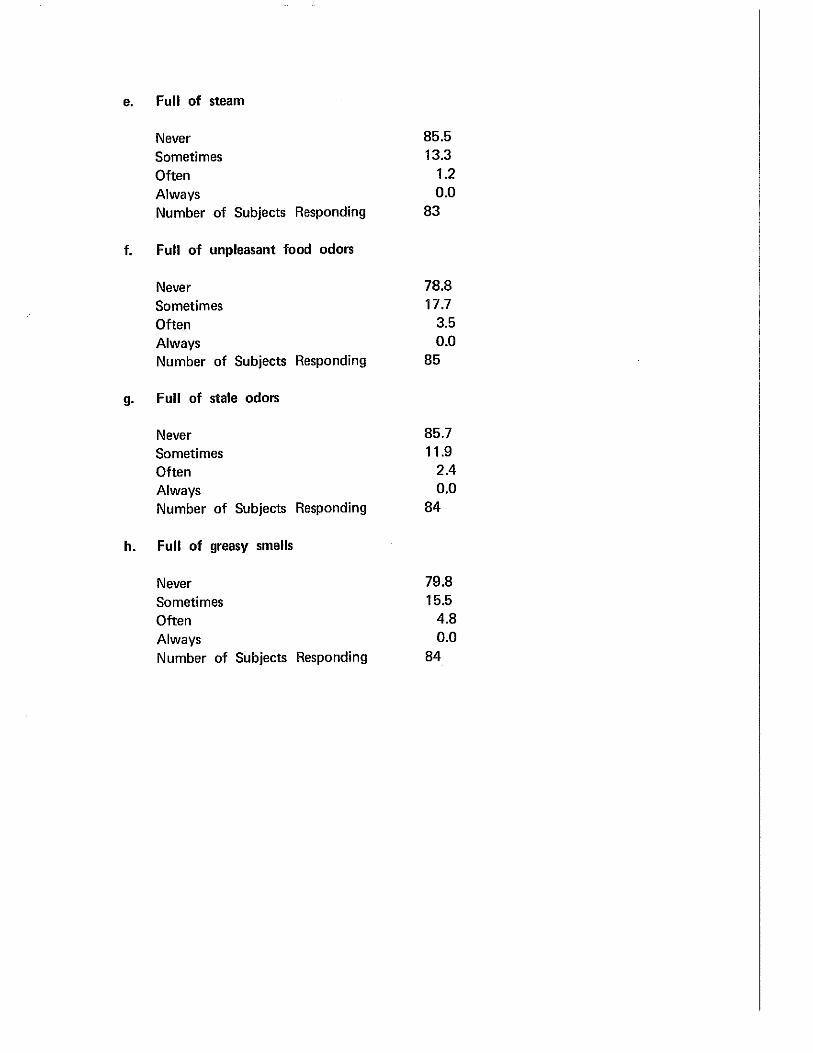
e. Full of steam
Never 85.5 Sometimes 13.3 Often 1.2 Always 0.0 Number of Subjects Responding 83
f. Full of unpleasant food odors
Never 78.8 Sometimes 17.7 Often 3.5 Always 0.0 Number of Subjects Responding 85
g. Full of stale odors
Never 85.7 Sometimes 11.9 Often 2.4 Always 0.0 Number of Subjects Responding 84
h. Full of greasy smells
Never 79.8 Sometimes 15.5 Often 4.8 Always 0.0 Number of Subjects Responding 84

What size tables would you like to see in your mess hall?
One man per table 0.0 Two men per table 6.2 Three men per table 3.1 Four men per table 80.4 Five men per table 1.0 Six men per table 8.3 Seven or more men per table 1.0
MEAN 4.1
STANDARD DEVIATION 0.8
MEDIAN 4.0
Number of Subjects Responding 97
Is your mess hall ever too crowded with people?
Never 9.2 Sometimes 59.2 Often 16.3 Always 15.3 Number of Subjects Responding 98
What types of changes in appearance would you like or not like in your mess hall?
a. Military pictures and posters
Like Not like Doesn't matter Number of Subjects Responding
b. Flags
Like Not like Doesn't matter Number of Subjects Responding
8.5 46.8 44.7 94
23.7 23.7 52.7 93

c. Trophies
Like 29.0
Not like 29.0
Doesn't matter 41.9
Number of Subjects Responding 93
d. Brighter colors
Like 66.3
Not like 5.3
Doesn't matter 28.4 Number of Subjects Responding 95
e. More decorative wall patterns
Like 73.4 Not like 2.1 Doesn't matter 24.5
Number of Subjects Responding 94
f. Curtains
Like 65.6 Not like 2.1
Doesn't matter 32.3 Number of Subjects Responding 93
g. Tablecloths
Like 71.0
Not like 2.1
Doesn't matter 26.9
Number of Subjects Responding 93
h. Music with meals
Like 90.4
Not like 0.0 Doesn't matter 9.6 Number of Subjects Responding 94
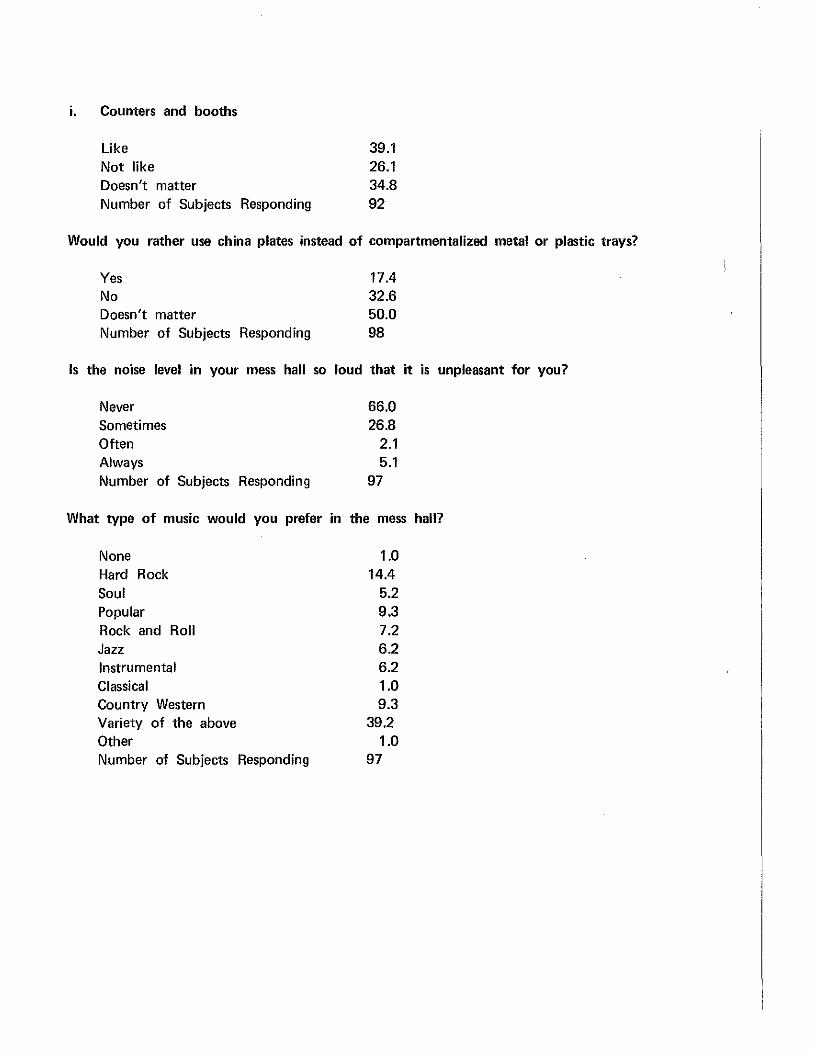
i. Counters and booths
Li~ ~.1
Not like 26.1 Doesn't matter 34.8 Number of Subjects Responding 92
Would you rather use china plates instead of compartmentalized metal or plastic trays?
Yes 17.4 No 32B Doesn't matter 50.0 Number of Subjects Responding 98
Is the noise level in your mess hall so loud that it is unpleasant for you?
Never 66.0 Sometimes 26.8 Often 2.1 Always 5.1 Number of Subjects Responding 97
What type of music would you prefer in the mess hall?
None 1.0 Hard Rock 14.4 Soul 5.2 Popular 9.3 Rock and Roll 7.2 Jazz 6.2 Instrumental 6.2 Classical 1.0 Country Western 9.3 Variety of the above 39.2 ~~ 1D Number of Subjects Responding 97

Circle any rules for behavior in the mess hall, listed below, which you believe are unnecessary. 1 4
Separation of NCOs and officers from EMs Time limits for eating Officers and NCOs cutting in line Dress regulations No smoking Calling "at ease" when officers enter Signing for meals
Percentage of BCTs answering affirmatively:
15.3 73.5
37.8 18.4 46.9
66.3 41.8
Circle any rules for behavior listed below which you would like to see instituted or enforced
in your mess hall.14
Stricter dress regulations No smoking for cooks and KPs No shouting or yelling Stricter behavior regulations
Percentage of BCTs pnswering affirmatively:
2.0 20.4 53.1 19.4
14 NOTE: Percentages do not total 100% because subjects were permitted to choose as many or as few items as desired.

Which of the types of foreign or specialty foods do you like best?
a. First Choice
Italian 42.9 Seafood 19.4 Soul 5.1 Chinese 4.1 Mex-Spanish 8.2 German 3.1 French 1.0 Jewish 0.0 Polynesian 0.0 Japanese 0.0 Indian 1.0 Mideast, Greek 0.0 No preference 12.2 Don't like any 1.0 Other Specialty Food 2.0 Number of Subjects Responding 98
b. Second Choice
Italian 11.9 Seafood 22.6 Soul 1.2 Chinese 19.0 Mex-Spanish 22.6 German 8.3 French 8.3 Jewish 0.0 ~lynes~n 12 Japanese 1.2 Indian 0.0 Mideast, Greek 0.0 No Preference 2.4 Don't like any 1.2 Other Specialty Food 0.0 Number of Subjects Responding 84

c. Third Choice
Italian 6.2 Seafood 12.4 Soul 2.5 Chinese 12.4 Mex-Spanish 16.0 German 11.1 French 22.2 Jewish 2.5 Polynesian 1.2 Japanese 2.5 Indian 0.0 Mideast, Greek 6.2 No Preference 1.2 Don't like any 1.2 Other Specialty Food 2.5 Number of Subjects Responding 81
What is your opinion of the following types of foods? Think of the foods in a general way. Do not rate them according to the food you have been served in the Army.
a. Canned Foods
1-Unacceptable (I won't eat them) 1.0 2 6.1 3 16.3 4-Average 52.0 5 15.3
6. 5.1 7-Excellent (I like them very much) 4.1
MEAN 4.1
STANDARD DEVIATION 1.1
MEDIAN 4.0
Number of Subjects Responding 98
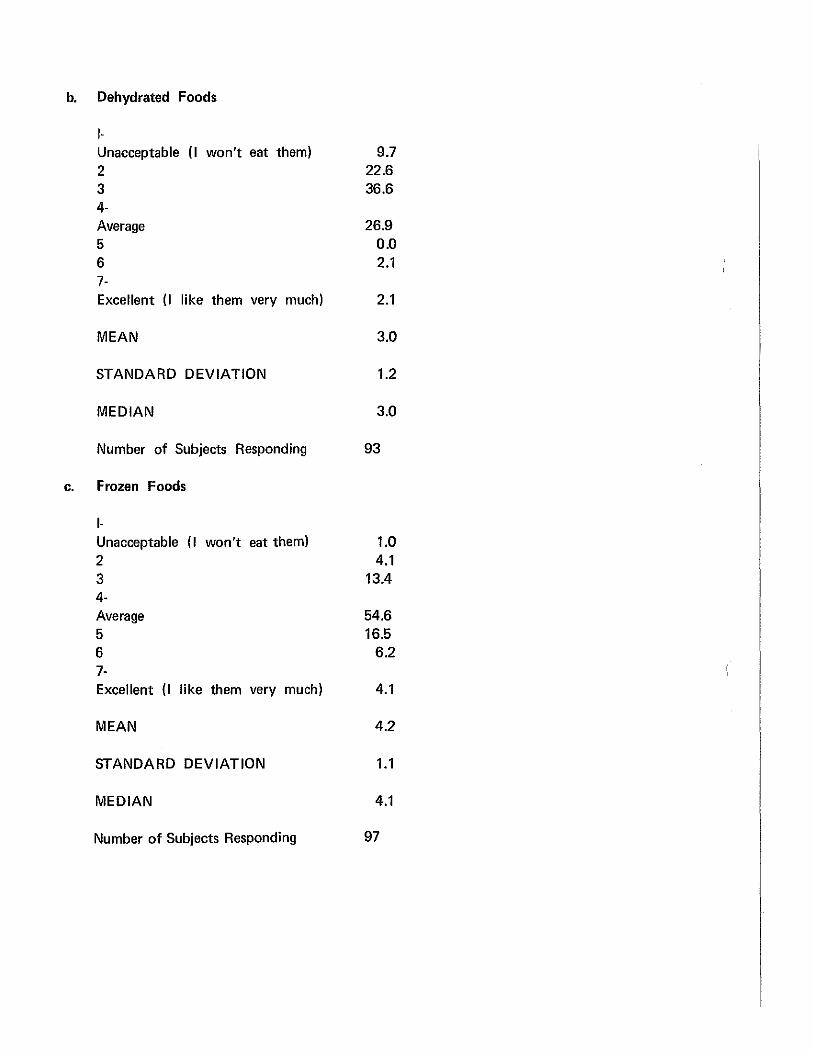
b. Dehydrated Foods
!-Unacceptable (I won't eat them) 9.7 2 ns 3 ~B
4-Average 5 6 ?-
26.9 0.0 2.1
Excellent (I like them very much) 2.1
MEAN 3.0
STANDARD DEVIATION 1.2
MEDIAN 3.0
Number of Subjects Responding 93
c. Frozen Foods
!-Unacceptable (I won't eat them) 1.0 2 4.1 3 13.4 4-Average 5 6 7-
54.6 16.5
6.2
Excellent (I like them very much) 4.1
MEAN 4.2
STANDARD DEVIATION 1.1
MEDIAN 4.1
Number of Subjects Responding 97
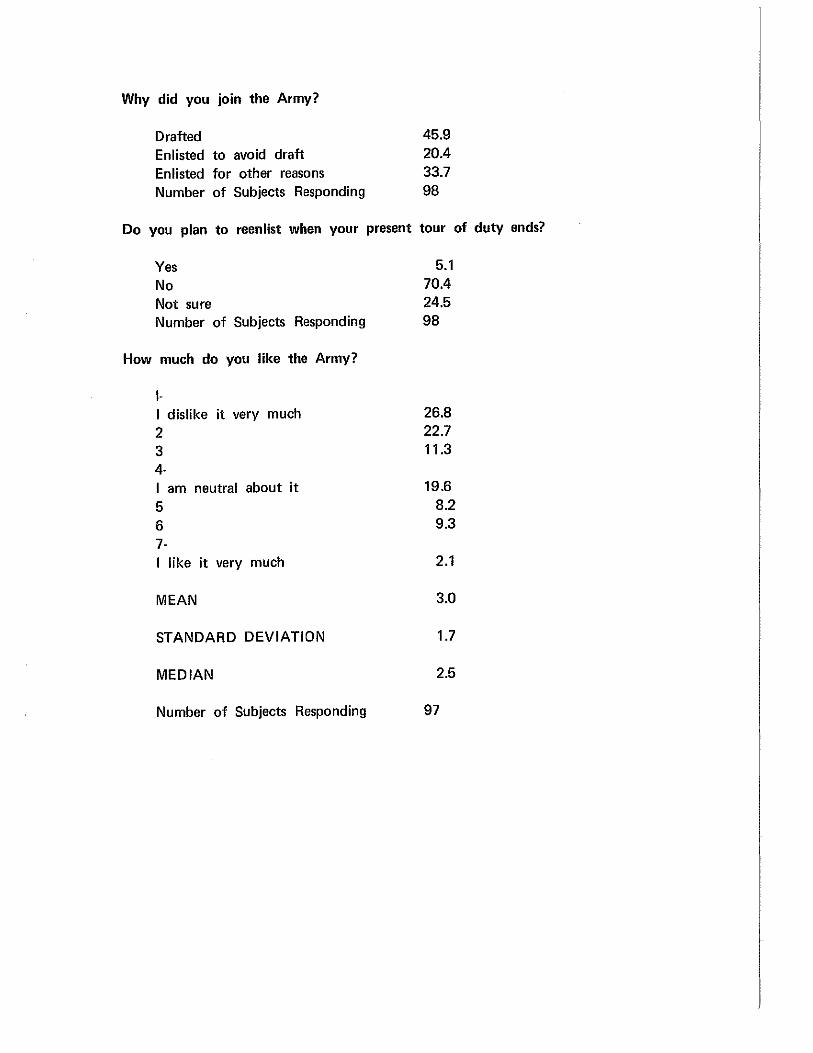
Why did you join the Army?
Drafted 45.9 Enlisted to avoid draft 20.4 Enlisted for other reasons 33.7 Number of Subjects Responding 98
Do you plan to reenlist when your present tour of duty ends?
Yes 5.1 No 70.4 Not sure 24.5 Number of Subjects Responding 98
How much do you like the Army?
I· I dislike it very much 2 3 4· I am neutral about it 5 6 7·
26.8 22.7 11.3
19.6 8.2 9.3
I like it very much 2.1
MEAN 3.0
STANDARD DEVIATION 1.7
MEDIAN 2.5
Number of Subjects Responding 97
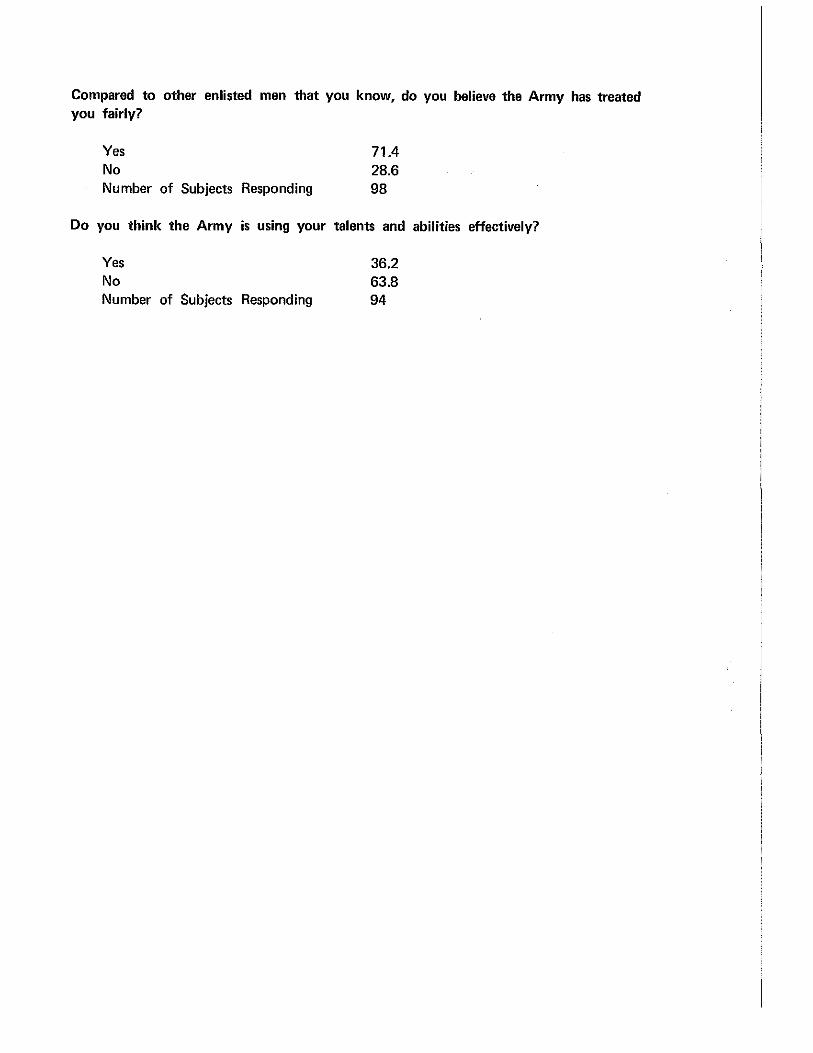
Compared to other enlisted men that you know, do you believe the Army has treated you fairly?
Yes 71.4 No 28.6 Number of Subjects Responding 98
Do you think the Army is using your talents and abilities effectively?
y~ ~2
No 63.8 Number of Subjects Responding 94

APPENDIX 5
COMMENTS

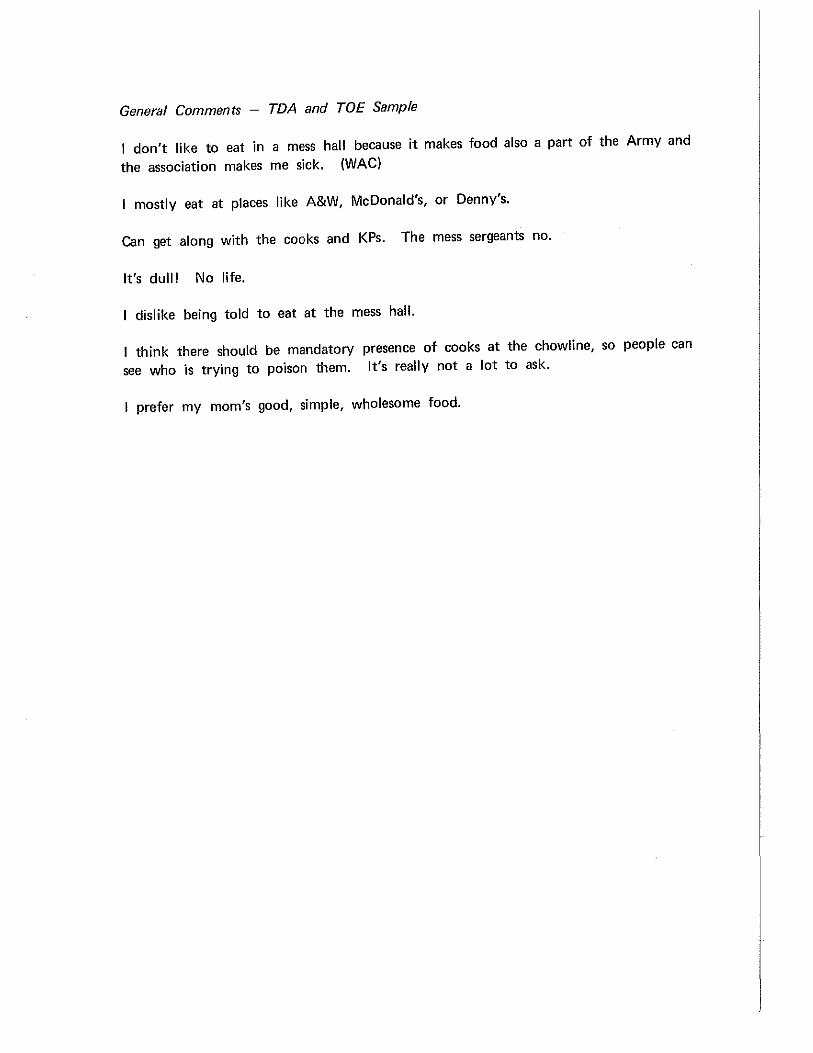
General Comments - TDA and TOE Sample
I don't like to eat in a mess hall because it makes food also a part of the Army and
the association makes me sick. (WAC)
I mostly eat at places like A&W, McDonald's, or Denny's.
Can get along with the cooks and KPs. The mess sergeants no.
It's dull! No life.
dislike being told to eat at the mess hall.
think there should be mandatory presence of cooks at the chowline, so people can see who is trying to poison them. It's really not a lot to ask.
I prefer my mom's good, simple, wholesome food.

When you do not eat in the mess hall, where do you eat?
TDA and TOE Sample
In the barracks or I cook my own. (WAC)
Mess hall other than the one I'm assigned to (serves better meals). (WAC) I cook at the barracks. (WAC)
I have my own supply of food. (WAC) cook myself. (WAC)
cook myself. (WAC)
At the office where I work--TV dinners, etc. Officers club. Bowling alley.
Snack machines.
I work at a ski area on weekends. I make my own meals. I buy food in the commissary and picnic. Fort Lewis golf course. Downtown. Vending machines. While working. "Soul Food" diners.
"Soul Food" diners. Service club.
Food at drag strips.
Food at drag strips.
I do my own cooking while camping. A&W Root Beer.
I bring a lunch from home.
In the barracks. In a store.
In a car.
At the donut shop. Apartment.
At someone's house, where there is a party.
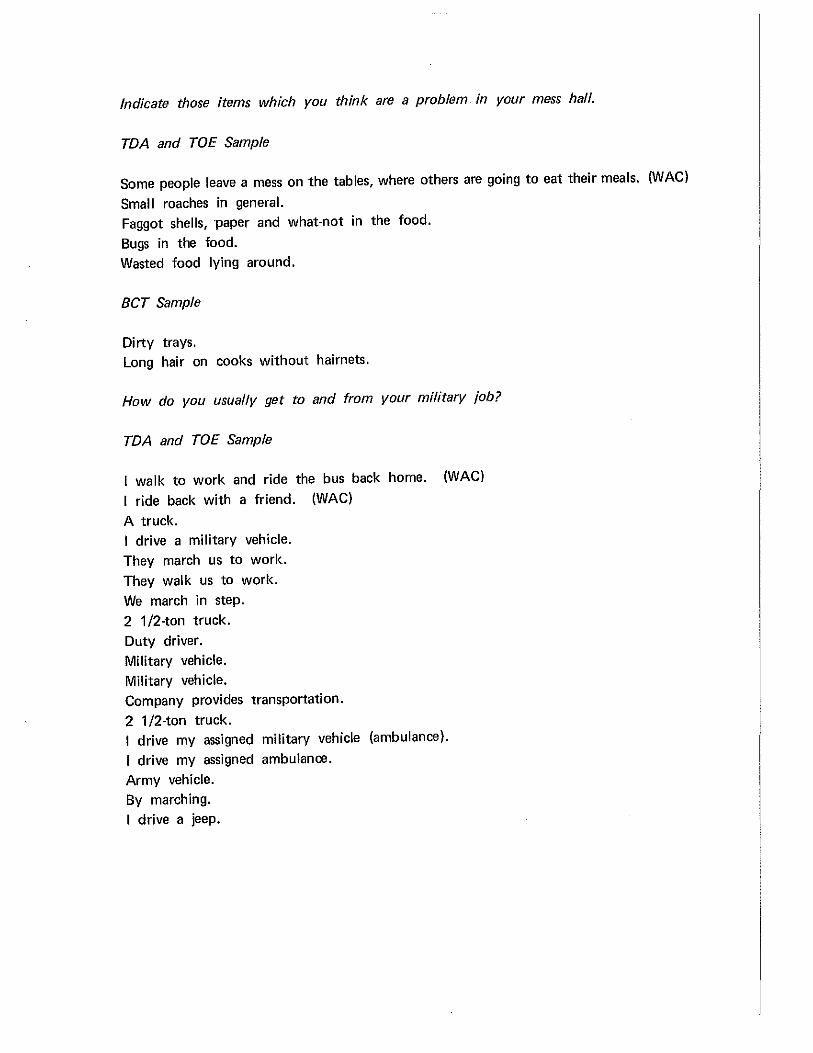
Indicate those items which you think are a problem in your mess hall.
TDA and TOE Sample
Some people leave a mess on the tables, where others are going to eat their meals. (WAC)
Small roaches in general. Faggot shells, ·paper and what-not in the food.
Bugs in the food. Wasted food lying around.
BCT Sample
Dirty trays. Long hair on cooks without hairnets.
How do you usually get to and from your military job?
TDA and TOE Sample
I walk to work and ride the bus back home. (WAC)
I ride back with a friend. (WAC)
A truck. I drive a military vehicle.
They march us to work.
They walk us to work.
We march in step.
2 1 /2-ton truck.
Duty driver. Military vehicle.
Military vehicle. Company provides transportation.
2 1 /2-ton truck. I drive my assigned military vehicle (ambulance).
I drive my assigned ambulance.
Army vehicle. By march in g. I drive a jeep.
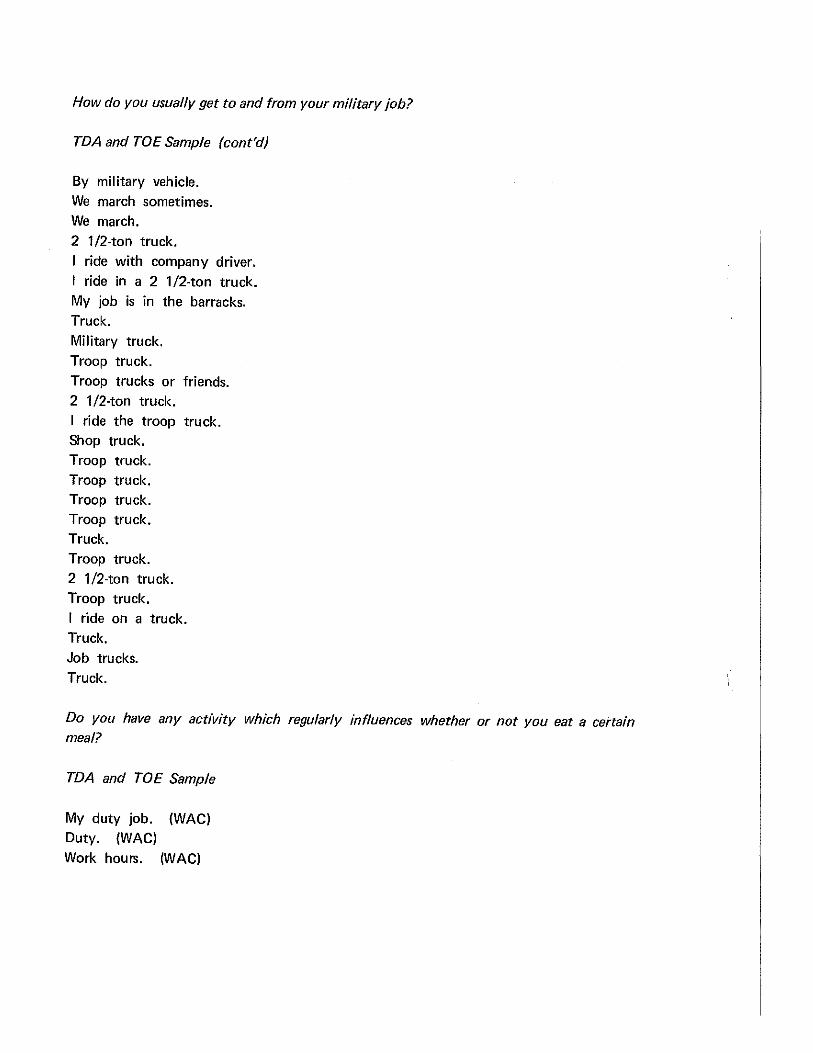
How do you usually get to and from your military job?
TDA and TOE Sample (cont'd}
By military vehicle. We march sometimes. We march. 2 1 /2-ton truck. I ride with company driver. I ride in a 2 1 /2-ton truck. My job is in the barracks. Truck. Military truck. Troop truck. Troop trucks or friends. 2 1/2-ton truck. I ride the troop truck. Shop truck. Troop truck. Troop truck. Troop truck. Troop truck. Truck. Troop truck. 2 1/2-ton truck. Troop truck. I ride on a truck. Truck. Job trucks. Truck.
Do you have any activity which regularly influences whether or not you eat a certain meal?
TDA and TOE Sample
My duty job. (WAC) Duty. (WAC) Work hours. (WAC)
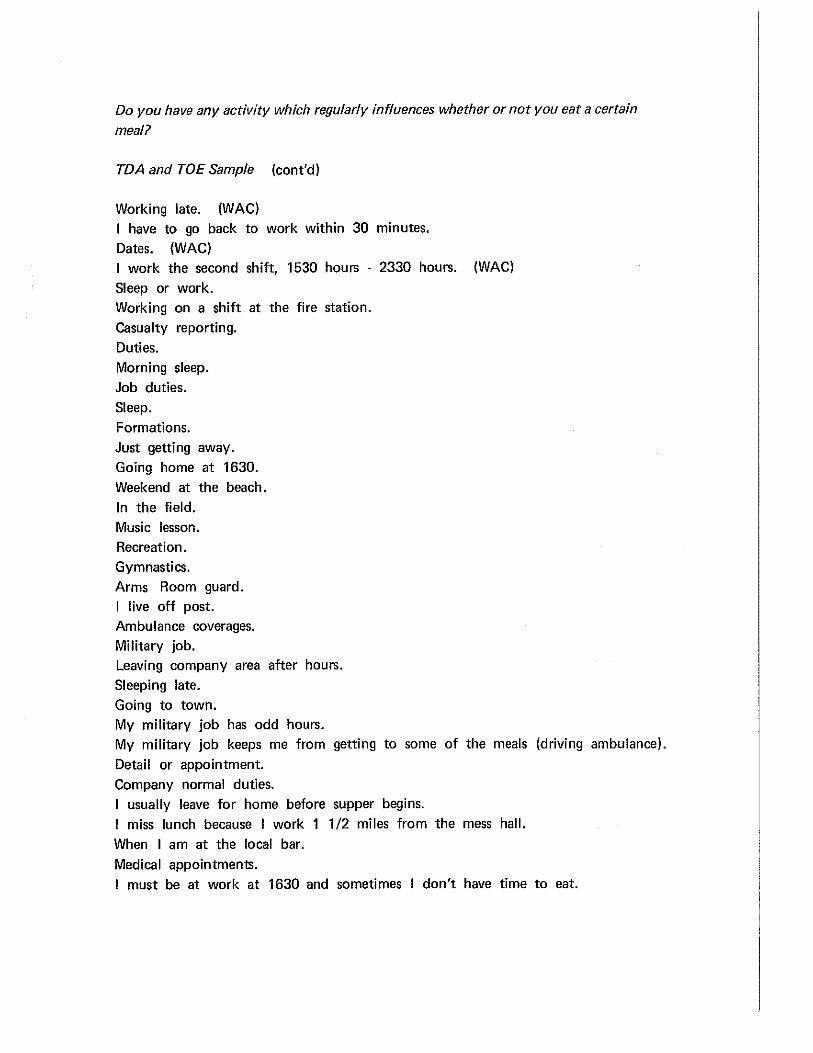
Do you have any activity which regularly influences whether or not you eat a certain
meal?
TDA and TOE Sample (cont'd)
Working late. (WAC) I have to go back to work within 30 minutes.
Dates. (WAC) I work the second shift, 1530 hours - 2330 hours. (WAC)
Sleep or work. Working on a shift at the fire station.
Casualty reporting.
Duties. Morning sleep.
Job duties. Sleep.
Formations. Just getting away. Going home at 1630.
Weekend at the beach.
In the field.
Music lesson. Recreation. Gymnastics.
Arms Room guard. I live off post. Ambulance coverages. Military job. Leaving company area after hours. Sleeping late.
Going to town. My military job has odd hours. My military job keeps me from getting to some of the meals (driving ambulance).
Detail or appointment.
Company normal duties. I usually leave for home before supper begins. I miss lunch because I work 1 1/2 miles from the mess hall.
When I am at the local bar.
Medical appointments. I must be at work at 1630 and sometimes I don't have time to eat.
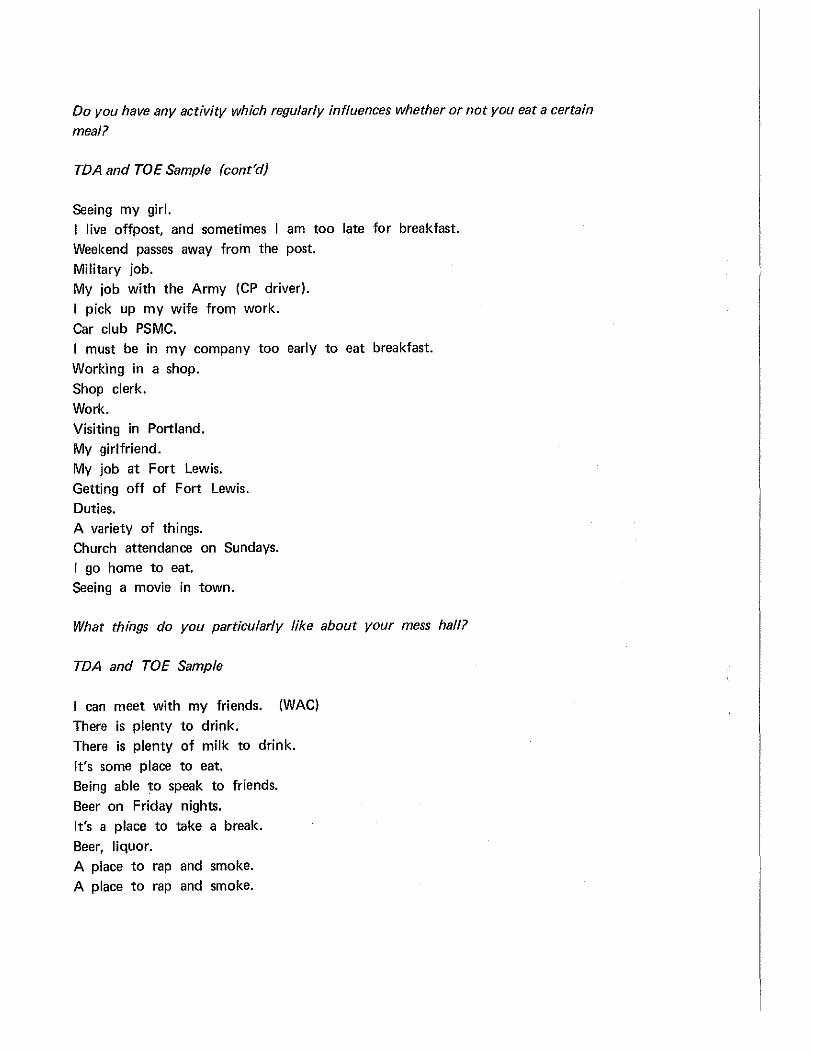
Do you have any activity which regularly influences whether or not you eat a certain meal?
TDA and TOE Sample (cont'd)
Seeing my girl. I live offpost, and sometimes I am too late for breakfast. Weekend passes away from the post.
Military job. My job with the Army (CP driver).
I pick up my wife from work.
Car club PSMC. I must be in my company too early to eat breakfast.
Working in a shop.
Shop clerk.
Work. Visiting in Portland.
My girlfriend.
My job at Fort Lewis. Getting off of Fort Lewis.
Duties. A variety of things. Church attendance on Sundays. I go home to eat. Seeing a movie in town.
What things do you particularly like about your mess hall?
TDA and TOE Sample
I can meet with my friends. (WAC)
There is plenty to drink. There is plenty of milk to drink.
It's some place to eat. Being able to speak to friends.
Beer on Friday nights. It's a place to take a break.
Beer, liquor. A place to rap and smoke.
A place to rap and smoke.
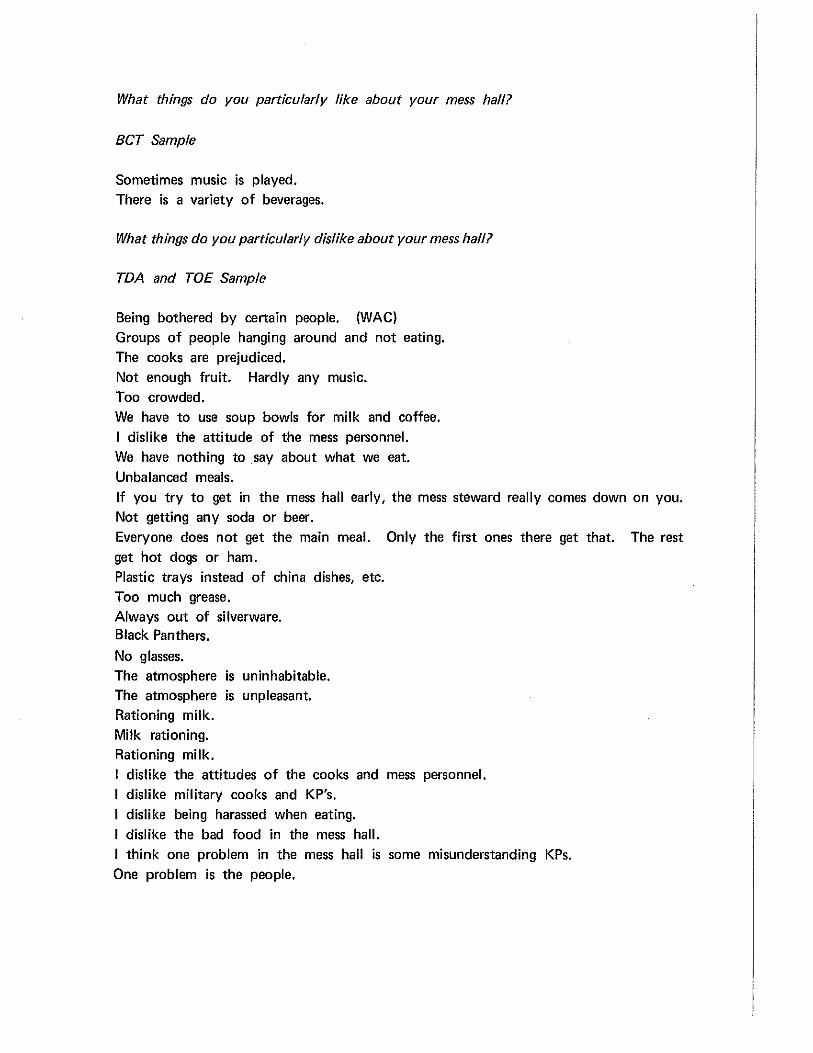
What things do you particularly like about your mess hall?
BCT Sample
Sometimes music is played. There is a variety of beverages.
What things do you particularly dislike about your mess hall?
TDA and TOE Sample
Being bothered by certain people. (WAC) Groups of people hanging around and not eating. The cooks are prejudiced. Not enough fruit. Hardly any music. Too crowded. We have to use soup bowls for milk and coffee. I dislike the attitude of the mess personnel. We have nothing to say about what we eat. Unbalanced meals. If you try to get in the mess hall early, the mess steward really comes down on you. Not getting any soda or beer. Everyone does not get the main meal. Only the first ones there get that. The rest get hot dogs or ham. Plastic trays instead of china dishes, etc. Too much grease. Always out of silverware. Black Panthers.
No glasses. The atmosphere is uninhabitable. The atmosphere is unpleasant. Rationing milk. Milk rationing. Rationing milk. I dislike the attitudes of the cooks and mess personnel. I dislike military cooks and KP's.
dislike being harassed when eating. dislike the bad food in the mess hall. think one problem in the mess hall is some misunderstanding KPs.
One problem is the people.

What things do you particularly dislike about your mess hall?
TDA and TOE Sample (cont'd)
Running out of food. Off-post personnel taking food from the serving line. Takes too long to serve the food. Lifers. The cooks have too much to say. The cooks. Sometimes the heat is turned on in mid-day and it gets too hot in the mess hall. I dislike keeping the food too long. People are a problem. Mess. Sgt.
Cooks. Lifers. Unnecessary harassment of KPs by the first cooks. etc. Hurried-up preparation of food. Too many NCOs booting you while you eat. NCOs in mess hall. The company CO and some of the troops. NCOs and officers. Cooks and KPs. Sgt. Major. Don't hassel the cooks; they're drafties too. Older NCOs in the same room. Eating at dirty tables.
BCT Sample
Sometimes officers harass mess personnel for no reason. The head cook and drill sergeant don't allow enough time to eat properly or slow enough. Colored people often order servers to give them more than anyone else. Colored people take more than their share, and they cut in lines. Dri II sergeants. Mess sergeant and first cook. Mess sergeant and first cook. Drill sergeant and mess steward harass troops and disturb appetite. Not enough to eat. Can't smoke No decorations, flowers, etc. No napkins.
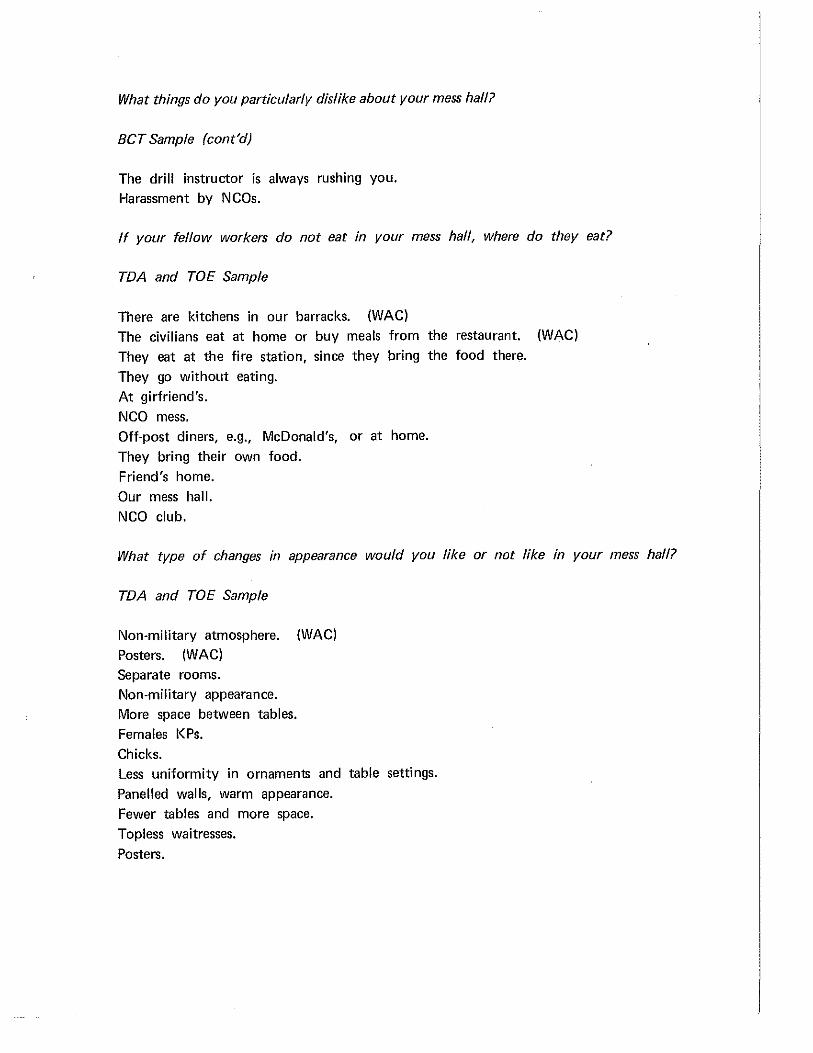
What things do you particularly dislike about your mess hall?
BCT Sample (cont'd)
The drill instructor is always rushing you. Harassment by NCOs.
If your fellow workers do not eat in your mess hall, where do they eat?
TDA and TOE Sample
There are kitchens in our barracks. (WAC) The civilians eat at home or buy meals from the restaurant. (WAC)
They eat at the fire station, since they bring the food there.
They go without eating.
At girfriend's.
NCO mess. Off-post diners, e.g., McDonald's, or at home.
They bring their own food.
Friend's home.
Our mess hall.
NCO club.
What type of changes in appearance would you like or not like in your mess hall?
TDA and TOE Sample
Non-military atmosphere. (WAC) Posters. (WAC)
Separate rooms. Non-military appearance.
More space between tables.
Females KPs.
Chicks. Less uniformity in ornaments and table settings.
Panelled walls, warm appearance.
Fewer tables and more space.
Topless waitresses.
Posters.
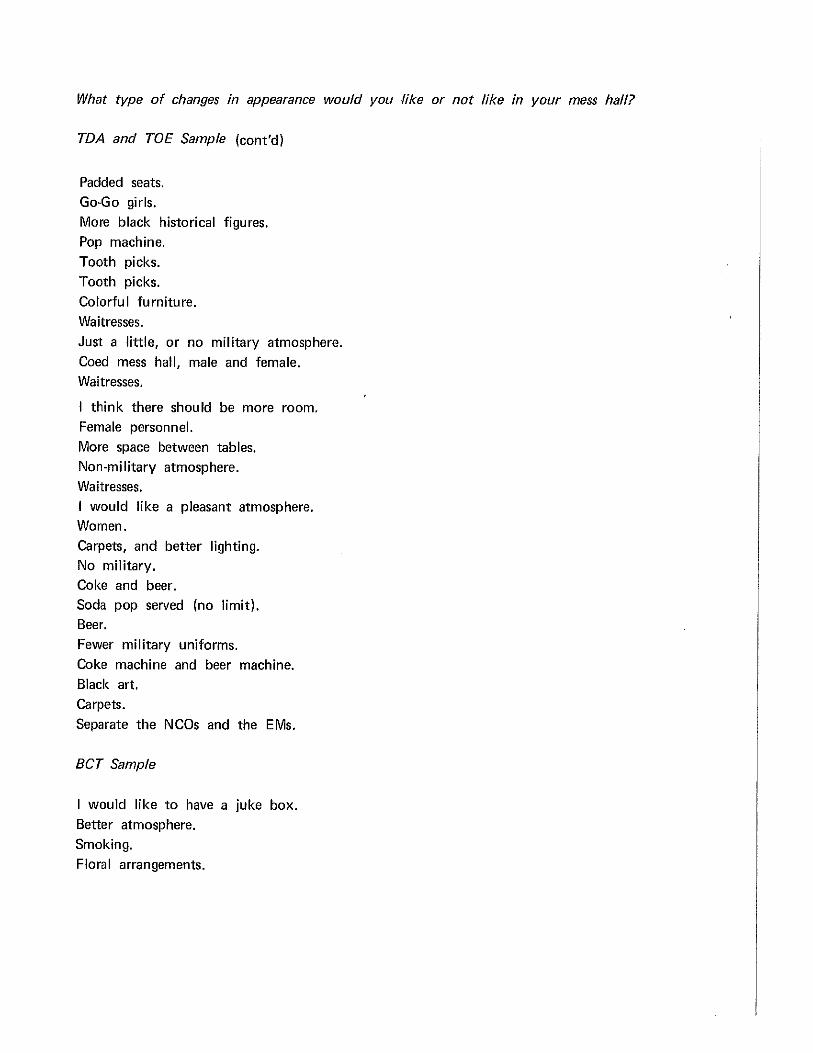
What type of changes in appearance would you like or not like in your mess hall?
TDA and TOE Sample (cont'd)
Padded seats. Go-Go girls.
More black historical figures.
Pop machine. Tooth picks.
Tooth picks.
Colorful furniture. Waitresses.
Just a little, or no military atmosphere.
Coed mess hall, male and female. Waitresses.
I think there should be more room. Female personnel.
More space between tables. Non-military atmosphere.
Waitresses. I would like a pleasant atmosphere. Women.
Carpets, and better lighting. No military. Coke and beer. Soda pop served (no limit). Beer.
Fewer military uniforms.
Coke machine and beer machine. Black art. Carpets.
Separate the NCOs and the EMs.
BCT Sample
I would like to have a juke box.
Better atmosphere. Smoking.
Floral arrangements.
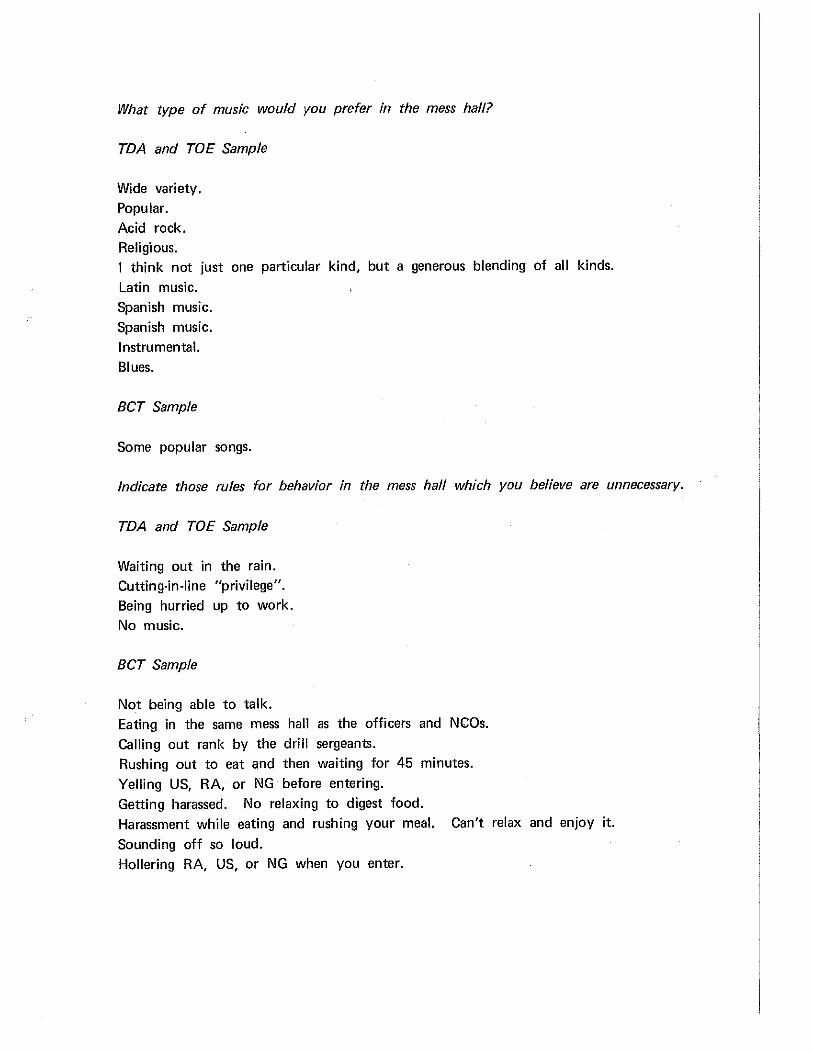
What type of music would you prefer in the mess hall?
TDA and TOE Sample
Wide variety. Popular.
Acid rock. Religious. I think not just one particular kind, but a generous blending of all kinds.
Latin music. Spanish music.
Spanish music.
Instrumental.
Blues.
BCT Sample
Some popular songs.
Indicate those rules for behavior in the mess hall which you believe are unnecessary.
TDA and TOE Sample
Waiting out in the rain. Cutting·in-line "privilege". Being hurried up to work.
No music.
BCT Sample
Not being able to talk. Eating in the same mess hall as the officers and NCOs.
Calling out rank by the drill sergeants. Rushing out to eat and then waiting for 45 minutes.
Yelling US, RA, or NG before entering.
Getting harassed. No relaxing to digest food. Harassment while eating and rushing your meal. Can't relax and enjoy it.
Sounding off so loud. Hollering RA, US, or NG when you enter.
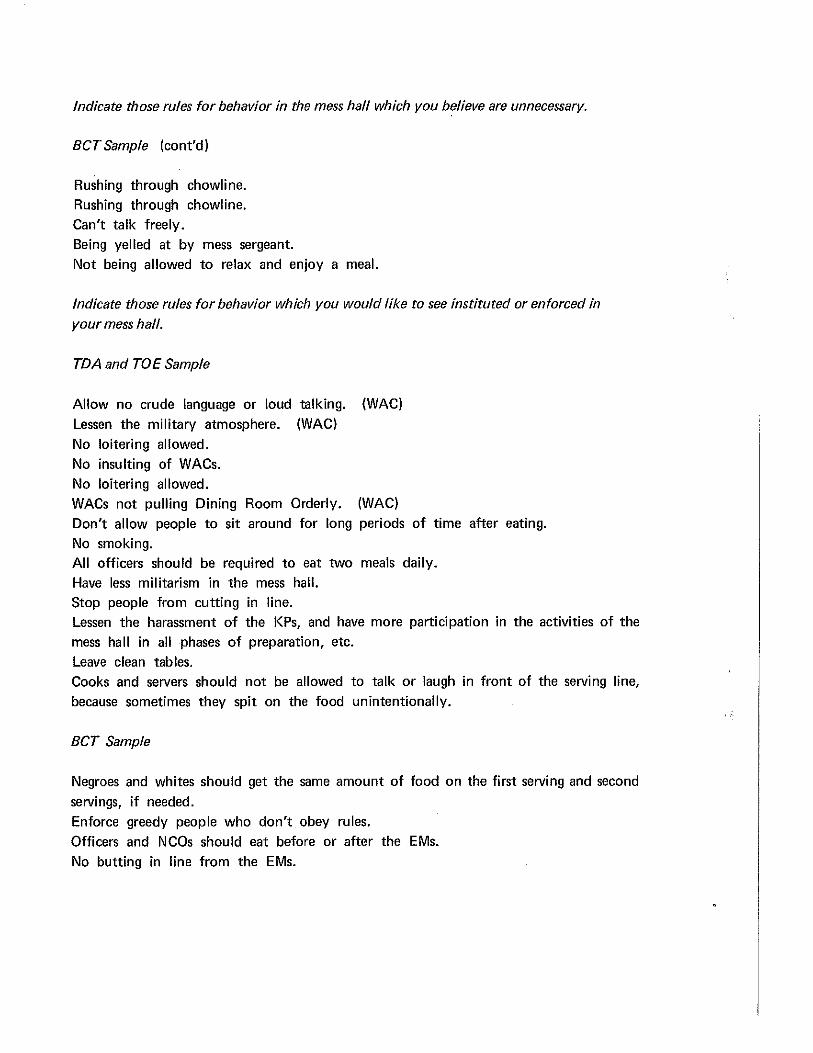
Indicate those rules for behavior in the mess hall which you believe are unnecessary.
BCT Sample (cont'd)
Rushing through chowline. Rushing through chowline. Can't talk freely.
Being yelled at by mess sergeant. Not being allowed to relax and enjoy a meal.
Indicate those rules for behavior which you would like to see instituted or enforced in your mess hall.
TDA and TOE Sample
Allow no crude language or loud talking. (WAC)
Lessen the military atmosphere. (WAC)
No loitering allowed.
No insulting of WACs. No loitering allowed. WACs not pulling Dining Room Orderly. (WAC)
Don't allow people to sit around for long periods of time after eating. No smoking. All officers should be required to eat two meals daily.
Have less militarism in the mess hall. Stop people from cutting in line. Lessen the harassment of the KPs, and have more participation in the activities of the
mess hall in all phases of preparation, etc.
Leave clean tables. Cooks and servers should not be allowed to talk or laugh in front of the serving line, because sometimes they spit on the food unintentionally.
BCT Sample
Negroes and whites should get the same amount of food on the first serving and second
servings, if needed. Enforce greedy people who don't obey rules.
Officers and NCOs should eat before or after the EMs.
No butting in line from the EMs.
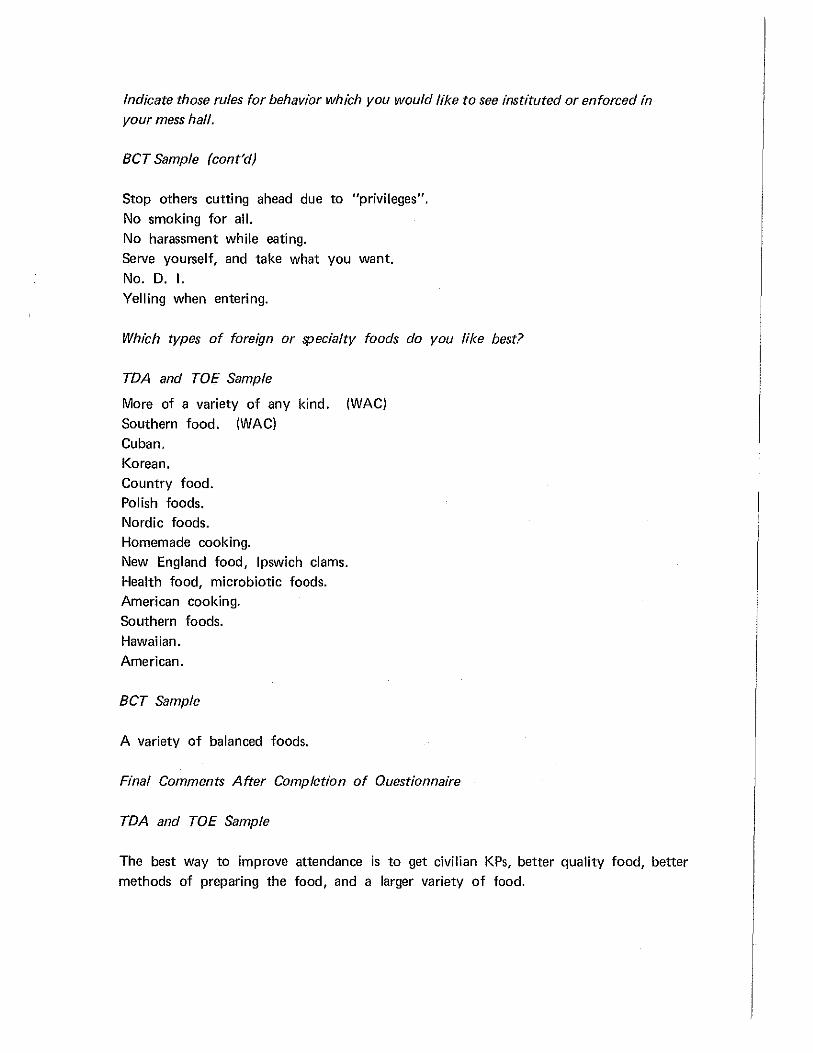
Indicate those rules for behavior which you would like to see instituted or enforced in your mess hall.
BCT Sample (cont'd)
Stop others cutting ahead due to "privileges".
No smoking for all. No harassment while eating.
Serve yourself, and take what you want.
No. D. I.
Yelling when entering.
Which types of foreign or specialty foods do you like best?
TDA and TOE Sample
More of a variety of any kind. (WAC)
Southern food. (WAC)
Cuban. Korean. Country food. Polish foods. Nordic foods. Homemade cooking. New England food, Ipswich clams.
Health food, microbiotic foods. American cooking. Southern foods.
Hawaiian.
American.
BCT Sample
A variety of balanced foods.
Final Comments After Completion of Questionnaire
TDA and TOE Sample
The best way to improve attendance is to get civilian KPs, better quality food, better methods of preparing the food, and a larger variety of food.

Final Comments After Completion of Questionnaire
TDA and TOE Sample (cont'd)
Separate rations for anyone who chooses is the most important change!
Anyone living off post (officially or unofficially) should be given a Separate Rations Allowance. One reason that I haven't been critical is that we are given a choice of short order or the main course for the Midday Meal, and I always eat the short order. Very seldom do I care for what is prepared for the main course.
I feel that we should be given a food allowance, so we can eat where and when we prefer.
The main reason I eat as many meals as I do at the mess hall is because the food is free.
The tables are too close together, not leaving enough space to pass by.
Two lines should be provided, one for short order, the other for the main meal. Then the troops could be served faster, and it would stop arguments such as, "Why can't I have this with my short order?", which holds up the line, and everybody complains. With two lines, the troops would have to make their choice before entering the mess, thus hastening the food service.
In many cases the quality of the mess hall meals is low, while the quantity is high. One must eat large amounts of poor·quality food to get enough nutrition.
Some improvements are the following: (1) Improve the sewage system and do away with grease traps, (2) Provide other means of disposal, and (3) Place rugs in the mess halls to help eliminate the noise in the dining room.
More attention is needed to keeping foods hot and fresh. As they are prepared and served now, hot foods are often cold and dried out, salads are wilted, desserts are dried out, and toast is soggy and cold. Breakfast meats are always undercooked.
Many foods (especially at breakfast) are cold. Toast, pancakes, french fries, vegetables, and flaccid lettuce prevail on weekends. The bacon is usually undercooked.
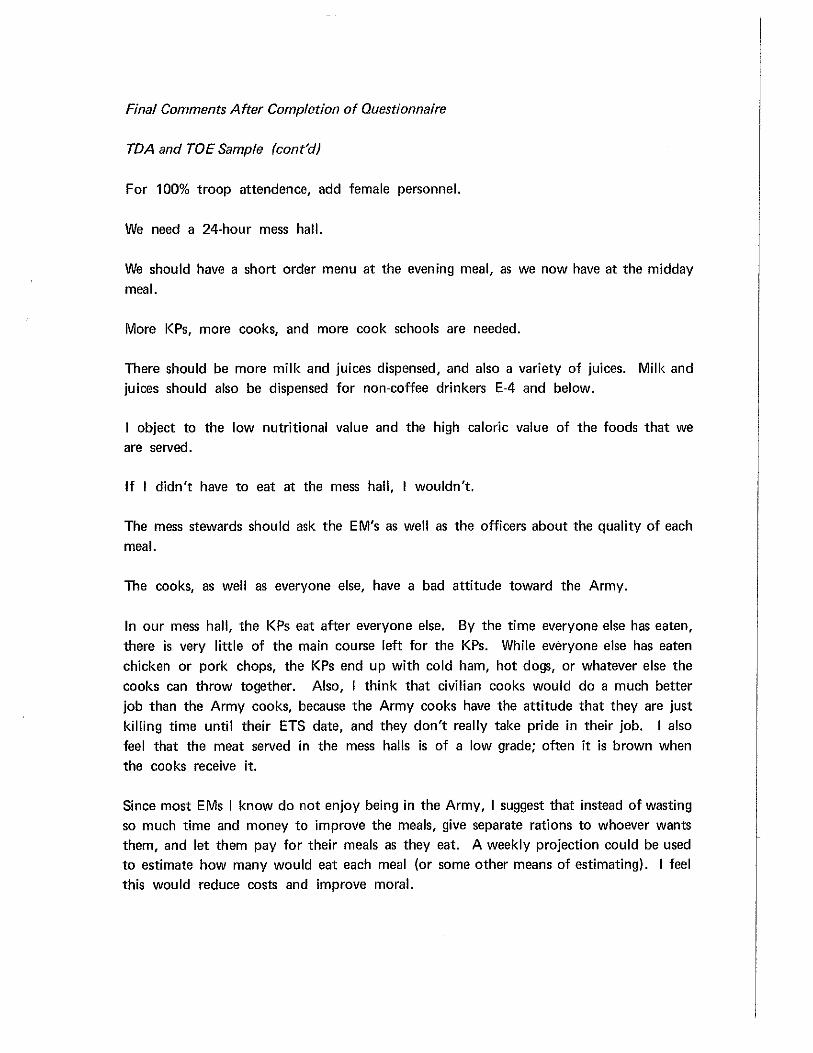
Final Comments After Completion of Questionnaire
TDA and TOE Sample (cont'd)
For 100% troop attendence, add female personnel.
We need a 24·hour mess hall.
We should have a short order menu at the evening meal, as we now have at the midday
meal.
More KPs, more cooks, and more cook schools are needed.
There should be more milk and juices dispensed, and also a variety of juices. Milk and juices should also be dispensed for non-coffee drinkers E-4 and below.
I object to the low nutritional value and the high caloric value of the foods that we are served.
If I didn't have to eat at the mess hall, I wouldn't.
The mess stewards should ask the EM's as well as the officers about the quality of each meal.
The cooks, as well as everyone else, have a bad attitude toward the Army.
In our mess hall, the KPs eat after everyone else. By the time everyone else has eaten, there is very little of the main course left for the KPs. While everyone else has eaten chicken or pork chops, the KPs end up with cold ham, hot dogs, or whatever else the cooks can throw together. Also, I think that civilian cooks would do a much better job than the Army cooks, because the Army cooks have the attitude that they are just killing time until their ETS date, and they don't really take pride in their job. I also feel that the meat served in the mess halls is of a low grade; often it is brown when the cooks receive it.
Since most EMs I know do not enjoy being in the Army, I suggest that instead of wasting so much time and money to improve the meals, give separate rations to whoever wants them, and let them pay for their meals as they eat. A weekly projection could be used to estimate how many would eat each meal (or some other means of estimating). I feel this would reduce costs and improve moral.
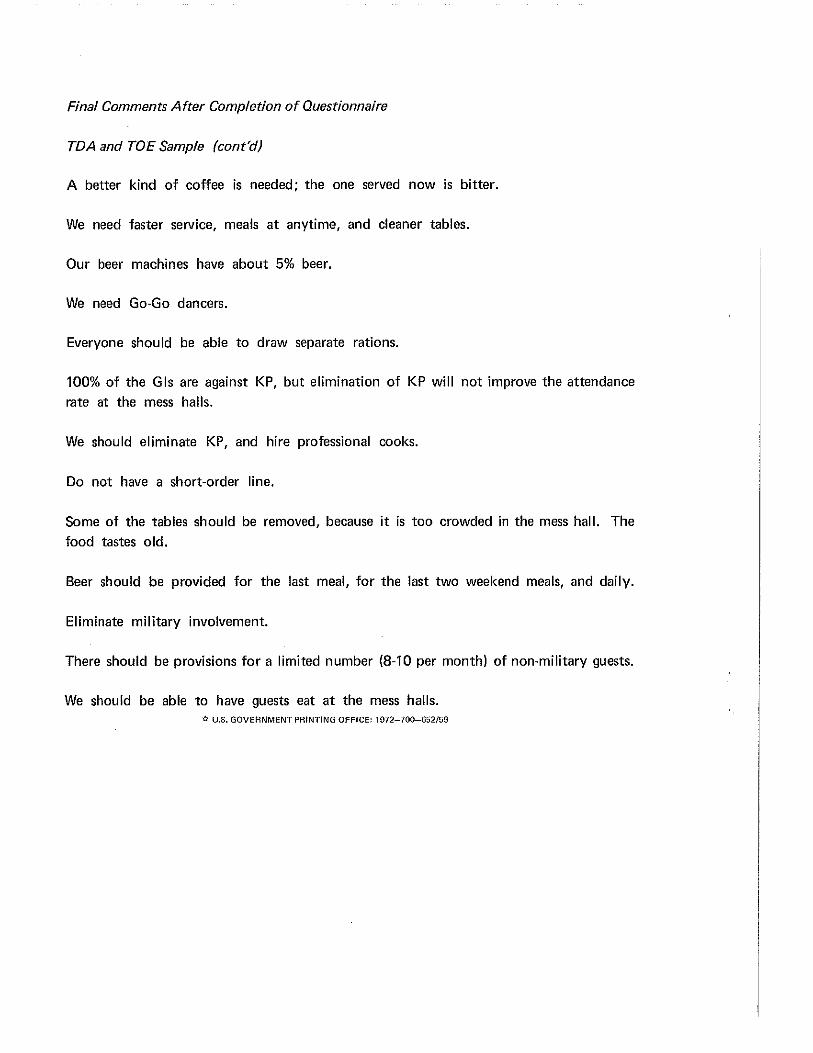
Final Comments After Completion of Questionnaire
TDA and TOE Sample (cont'd)
A better kind of coffee is needed; the one served now is bitter.
We need faster service, meals at anytime, and cleaner tables.
Our beer machines have about 5% beer.
We need Go-Go dancers.
Everyone should be able to draw separate rations.
100% of the Gls are against KP, but elimination of KP will not improve the attendance rate at the mess halls.
We should eliminate KP, and hire professional cooks.
Do not have a short-order line.
Some of the tables should be removed, because it is too crowded in the mess hall. The
food tastes old.
Beer should be provided for the last meal, for the last two weekend meals, and daily.
Eliminate military involvement.
There should be provisions for a limited number (8-10 per month) of non-military guests.
We should be able to have guests eat at the mess halls. fl U.S. GOVERNMENT PRINTING OFFICE: 1972-700-652/59
DISTRIBUTION LIST
Commanding General U. S. Army Materiel Command ATTN: AMCCG Washington, D. C. 20315
Commanding General U. S. Army Materiel Command RD&E Directorate, lndiv. Soldier Div. ATTN: AMCRD-JI (C. N. Gardner) Washington, D. C. 20315
Commanding General U. S. Army Materiel Command ATTN: AMCRD-RL (Research Div.) R&D Directorate, Bldg. T-7
4
Washington, D. C. 20315 1
Defense Director Technical Information Office of Director of Defense, Research and Engineering The Pentagon, Room 3D 1040 Washington, D. C. 20301
Director Air Force Hospital Food Service ATTN: LTC Chaska Hq., USAF/SCB-1 6B 153 James Forrestal Building Washington, D. C. 20314
Commander Science and Technology Division Hq., U. S. Air Force (AF/RDPS) Washington, D. C. 20330
Cdr. Harold J. Janson MSC USN Head, Food Service Branch Bureau of Medicine and Surgery Navy Department Washington, D. C. 20390
1
1
1
1
Commandant Hq., U. S. Marine Corps Code COE-2 (MAJ E. B. Cox) Washington, D. C. 203BO
Commanding General U. S. Army Materiel Command ATTN: AMCDL (Mr. Normand Klein) Washington, D. C. 20315
Commanding Officer U. S. Army Materiel Command Manpower Survey Office Washington, D. C. 20315
Commanding General U. S. Army Materiel Command ATTN: AMCRD-TC (Mr. Joseph Rivkin) R&D Directorate Washington, D. C. 20315
Office of The Surgeon General Department of Army
1
1
1
1
Washington, D. C. 20314 1
COL William S. Augerson MC USA Military Assistant for Medical and Life Sciences OAD/F&LS, The Pentagon (Room 3B 129) DDRE, Washington, D. C. 20301 1
The Army Library ATTN: Procurement Section Room 1 A552, The Pentagon Washington, D. C. 20301 1
Director U. S. Naval Research Laboratory ATTN: Code 6140 Washington, D. C. 20390 1
DISTRIBUTION LIST (cont'd)
Commanding Officer Navy Subsistence Office Washington Navy Yard - Building 166 . Washington, D. C. 20390 1
Commandant Hq., U. S. Marine Corps Code COE·2 (Miss Joan C. Niland) Washington, D. C. 20380
Deputy Chief of Staff for Logistics ATTN: DCSLOG-DTS·SUD·FS Department of Army Washington, D. C. 20310
Directorate for Subs. Mgmt. Policy Office Ass't. Sec. of Def. (I&L) ATTN: LTC J. L. Welbourn Room 2B 323 - The Pentagon Washington, D. C. 20301
Deputy Chief of Staff for Logistics Department of Army Washington, D. C. 20310
Deputy Chief of Staff for Logistics HQDA (DALO·TSS) ATTN: Mr. J. Carrol Washington, D. C. 20310
Commandant U. S. Army Quartermaster School ATTN: Quartermaster Library Fort Lee, VA 23801
Commanding Officer U. S. A. Combat Development Command ATTN: CDCQMA·F Fort Lee, VA 23801
Defense Logistics Studies Information Exchange
1
1
2
1
1
1
Fort Lee, VA 23801 2
2
Administrator Defense Documentation Center ATTN: DDC·TCA Cameron Station, BG5 Alexandria, VA 22314
Commanding Officer U. S. Army General Equipment Test Activity (STEGE) Fort Lee, VA 23801
Commandant U. S. A. Logistics Management Center Fort Lee, VA 23801
Director Army Technical Information USA Research Office OCRD, Room 209A Arlington, VA 22200
Commanding Officer USA Combat Development Command Combat Service Support Group Fort Lee, VA 23801
Commanding General USA Combat Development Command ATTN: CDCMR·O Fort Belvoir, VA 22060
Commander Defense General Supply Center CODE: DGSC/TSA (David H. Freedman) Defense Supply Agency Richmond, Virginia 23219
Chief U. S. Army Food Service Center ATTN: LTC Walter W. Tribbitt Bldg. T-11620 Fort Lee, Virginia 23801
12
1
1
1
1
1
1
1

DISTRIBUTION LIST (cont'd)
HODA (DAEN-2A/Mr. William Holmes) Forrestal Bldg. Washington, D. C. 20315
Commanding Officer U. S. Navy Subsistence Office ATTN: Mr. James Martin Bldg. 166 Navy Yard Annex Washington, D. C. 20390
Commander Naval Facilities Engineering Command Y-D Annex ATTN: Mr. Jesse Rocha Room 2-C-370 Washington, D. C. 203go
Commander U. S. Air Force Services Office ATTN: DPKFF, Mr. J. Dehart 2800 South 20th Street Philadelphia, Pennsylvania 19101
Commander Hq., U. S. Air Force ATTN: Mr. John Earl (AFPREED) Bldg. 626, Room 269 Boiling AFB Washington, D. C. 20330
Quartermaster General Hqs., U. S. Marine Corps ATTN: COB-2, LT. F. Towers Washington, D. C. 20380
1
1
1
1
1
1
3
Assistant Secretary of Defense (I&L) ATTN: Mr. M. Marshall Room 3D767 - The Pentagon Department of Defense Washington, D. C. 20301
Commanding General Hq., First U. S. Army ATTN: AHABD-SOC Fort George G. Meade Maryland 20755
Commanding General U. S. Continental Army Command ATTN: ATIT-RD-MD Fort Monroe, Virginia 23351
Commanding General Fort Lewis Washington 98433
Commanding General Fifth United States Army ATTN: AKADD-C-DMM Fort Sam Houston, Texas 78234
Commanding General Sixth United States Army Presidio of San Francisco ATTN: AMLOG-M4
1
1
1
2
1
San Francisco, California 94129 1
Director U. S. Army Advanced Concepts Agency Washington, D. C. 20315 1
DISTRIBUTION LIST (cont'd)
Commanding General U. S. Army Test & Evaluation Command ATTN: AMSTE-TAA Aberdeen Proving Grounds, MD 21005 2
Commanding Officer Hq., Medical Field Service Library Brooke Army Medical Center Fort Sam Houston, Texas 78234
Headquarters AMD-RD Brooks Air Force Base San Antonio, Texas 78235
Chief Programs & Policy Office Directorate of Technical Operations Defense Personnel Support Center 2800 South 20th Street
1
1
Philadelphia, Pennsylvania 19145 1
Commanding Officer U. S. Army Research Office - Durham ATTN: CRD-AA-IP Box CM, Duke Station Durham, North Carolina 27706
U. S. General Accounting Office ATTN: Robert G. Rockwell Defense Division, Room 6470 4416 Street, Northwest Washington, D. C. 20548
Defense Personnel Support Center ATTN: Mr. Armand Paci U. S. Army N LABS Representative 2800 South 20th Street
1
1
Philadelphia, Pennsylvania 19101 1
Hq., Tobyhanna Army Depot ATTN: AMXTO-PR Tobyhanna, Pennsylvania 18466 1
4
Hq., Air Force Logistics Command AFLC/DP5B Wright-Patterson, AFB, Ohio 45433
Director Bare Base Equipment SPO ATTN: ASD/SMB Wright-Patterson, AFB, Ohio 45433
Hq., Air Force Systems Command DLH Andrews AFB, Maryland 20331
Commanding General
1
1
1
Hq., U. S. Army Europe and Seventh Army ATTN: COL James L. Thayer Chief, Services Division, DCSLOG APO, New York 09403 1
Commanding General Hq., USARPAC ATTN: COL Hawthorne APO, San Francisco 96558 1

INTERNAL DISTRIBUTION
Commanding Officer
Scientific Director
Deputy Scientific Director for Engineering
Commanding Officer
U. S. Army Research Institute for Environmental Medicine
Commanding Officer, Airdrop Engineering Laboratory
Director, Clothing & Personnel Life Support Equipment Laboratory
Director, Food Laboratory
Director, General Equipment & Packaging Laboratory
Director, Pioneering Research Laboratory
Special Assistant for DOD Food Program
U. S. Army Representative for DOD Food Program
U. S. Air Force Representative for DOD Food Program
U. S. Marine Corps Representative for DOD Food Program
U. S. Navy Representative for DOD Food Program
U. S. Air Force Liaison Officer
Chief Quality Assurance & Engineering Office
Technical Library
Operations Research & Systems Analysis Office
5
1
1
1
1
1
1
3
3
3
1
1
1
4
3
2
2
20


tJnclas sified Security Classification
DOCUMENT CONTROL DATA. R & D (Security classif/catlon of tllle, body of abstract and index InA llnnottltlon muat be entered wheQ th~ overall report /a clai!JSllledl
1. ORIGINATING ACTIVIT_Y (Corporate author) ZB. REPORT SECURITY CLASSIFICATION
US Army Natick Laboratories Unclassified
Natick, Massachusetts 01760 2b. GROUP
3, REPORT TITLE
Fort Lewis Dining Facilities Consumer Survey
4, DESCRIPTIVE NOTES {Type of report Ellld Jnclualve datee)
s •. AUTHOR(S) (First name, middle Initial, laat ruune)
Harold 0. Kiess, J. Bradley Swanson, Richard F. Q. Johnson
' 6· REPORT· DATE 7a. TOTAL NO. OF PAGES rb· NO. oF RE':FS
January 1972 212 Sa, CONTRACT OR GRANT NO. OO.·ORIGINATOR'S REPORT NUM'BER(S)
b, PROJECT NO. Task 03 P/N 1J662713AJ45 72-44 PR
Task 06 P/N 1J662713A034 c. Ob. OTHER REPORT NO(S) (Any other numbe'rs that may be aulgnad this report)
d,
10. DISTRIBUTION STATEMENT
Approval for public release; distribution unlimited,
1J, SUPPLEMENTARY NOTES 12:PPONSORINSi MILitARY ACTI~Tl., b t 1oneer1ng esearc a ora ory US Army Natick Laboratories Natick, Massachusetts Ol.760
13. ABSTRACT
A survey of approximately 350 garrison and TOE troops from. nine dining halls
at Ft. Lewis, Washington was conducted in Aprill971. The purpose of the survey
was to identify those factors which have the potential for influencing or determin-ing consumer attendance at the dining hall, In general, the results showed that the
"typical" soldier did not consider the quality of the Army's food-service system
to be very good, Their most frequent complaints about the dining hall were food-
related, i.e., poor quality, poor preparation, and lack of 9ufficient quantity.
The conclusion could b.e made that an improvement of quality, preparation, and quantity of the food would be all that is necessary to draw the military
customer back into the dining hall. Indeed it may be, but we have no way of
knowing without an empirical test. The eating situation may well be an inter-
active one in which all factors, including attitude towards the Army, influence
eating behavior.
DD .'.::': •• 1473 Pl11PL.ACE8 DD P'ORM 1478, I JAN 04, WHICH 18 OBGOLIITI!£ P'OR ARMY USB. Unclassified
Security Claualfication
•••
Unclassified Security Classification
KEY WORDS
Attendance, Dining Facilities
Attitudes, Army
Attitudes, Dining Facility
Consumer
Dining Facilities
Eating Habits
Food
Ft. Lewis
Natick Laboratories
Survey
LINK A LINK B LINK C
ROLE WT ROLE WT ROLE WT
Unclassified Security Classificatlon