
Forsmark site investigation Pumping tests and flow … · Forsmark site investigation Pumping tests...
71
P-06-193 Forsmark site investigation Pumping tests and flow logging Boreholes HFM33, HFM34 and HFM35 Elin Gustavsson, Stig Jönsson, Jan-Erik Ludvigson Geosigma AB October 2006 Svensk Kärnbränslehantering AB Swedish Nuclear Fuel and Waste Management Co Box 5864 SE-102 40 Stockholm Sweden Tel 08-459 84 00 +46 8 459 84 00 Fax 08-661 57 19 +46 8 661 57 19
Transcript of Forsmark site investigation Pumping tests and flow … · Forsmark site investigation Pumping tests...

P-06-193
Forsmark site investigation
Pumping tests and flow logging
Boreholes HFM33, HFM34 and HFM35
Elin Gustavsson, Stig Jönsson, Jan-Erik Ludvigson
Geosigma AB
October 2006
Fo
rsmark site in
vestigatio
n – P
um
pin
g tests an
d flo
w lo
gg
ing
. Bo
reho
les HF
M33, H
FM
34 and
HF
M35
P-06
-193
Svensk Kärnbränslehantering ABSwedish Nuclear Fueland Waste Management CoBox 5864SE-102 40 Stockholm Sweden Tel 08-459 84 00 +46 8 459 84 00Fax 08-661 57 19 +46 8 661 57 19
CM
Gru
ppen
AB
, Bro
mm
a, 2
007
ISSN 1651-4416
SKB P-06-193
Forsmark site investigation
Pumping tests and flow logging
Boreholes HFM33, HFM34 and HFM35
Elin Gustavsson, Stig Jönsson, Jan-Erik Ludvigson
Geosigma AB
October 2006
Keywords: Forsmark, Hydrogeology, Hydraulic tests, Pumping tests, Flow meter logging, Water sampling, Hydraulic parameters, Transmissivity, Flow anomaly, AP PF 400-06-037.
This report concerns a study which was conducted for SKB. The conclusions and viewpoints presented in the report are those of the authors and do not necessarily coincide with those of the client.
A pdf version of this document can be downloaded from www.skb.se

�
Abstract
The main objectives of the hydraulic tests in the percussion boreholes HFM��, HFM�4 and HFM�5 were to investigate the hydraulic characteristics (e.g. occurrence and hydraulic transmissivity of different hydraulic conductors) and the water chemistry characteristics of the boreholes. No other hydraulic tests had been carried out in the actual boreholes before this campaign.
HFM�� was drilled to provide flush water to the core drilling at drill site 11 and to characterize a lineament (ZFMNE0809) parallel to the Singö Zone. The aim with the boreholes HFM�4 and HFM�5 was to characterize the Singö Zone in superficial sections and to achieve observation boreholes during the core drilling of borehole KFM11A.
In each borehole a short capacity test was performed to decide whether it was meaningful to make a pumping test in combination with flow logging or only a pumping test and to decide a suitable pumping flow rate for the pumping test. Since the flow rate capacity in all three boreholes was high enough, flow logging was performed in all boreholes.
Water samples were collected in all boreholes in conjunction with the pumping tests to investigate the hydrochemistry of the groundwater.
The total borehole transmissivity of HFM�� was estimated at 4.7·10–4 m2/s. During the flow logging only one flow anomaly close to the borehole bottom could be detected.
The total borehole transmissivity of HFM�4 was estimated at 1.1·10–� m2/s and five flow anomalies were found during the flow logging.
In HFM�5 the total transmissivity was estimated at 1.6·10–4 m2/s. A pumping test above a packer was carried out in the non-flowlogged borehole interval between 12.0 and 21.0 m and the transmissivity in this interval was calculated by Moye´s formula to 2.2·10–5 m2/s. During the flow logging five flow anomalies were detected.

4
Sammanfattning
Det övergripande syftet med de hydrauliska testerna i hammarborrhålen HFM��, HFM�4 och HFM�5 var att undersöka de hydrauliska egenskaperna (t ex förekomst och hydraulisk transmis-sivitet av enskilda hydrauliska ledare) och vattenkemin i borrhålen. Före dessa mätinsatser hade inga andra hydrauliska tester genomförts i borrhålen.
HFM�� vid borrplats BP11 borrades för att säkerställa spolvattenförsörjning till kärnborrhål på denna borrplats samt för att karaktärisera ett lineament (ZFMNE0809) som löper parallellt med Singözonen. Syftet med borrhålen HFM�4 och HFM�5 är att karaktärisera Singözonen i ytliga snitt samt att erhålla observationsborrhål inför kärnborrningen av KFM11A.
Ett kort kapacitetstest gjordes i varje borrhål för att utvisa om det var meningsfullt att genomföra en provpumpning kombinerad med flödesloggning eller om endast pumptest skulle göras samt för att fastställa ett lämpligt pumpflöde för pumptestet. Eftersom flödeskapaciteten var god i alla tre borrhålen kunde flödesloggning genomföras i samtliga.
Vattenprover för undersökning av grundvattnets hydrokemiska egenskaper togs i samband med pumptesterna i borrhålen.
Den totala transmissiviteten för HFM�� uppskattades till 4,7·10–4 m2/s. Under flödesloggningen kunde endast en anomali nära borrhålets botten hittas.
I HFM�4 uppskattades den totala transmissiviteten till 1,0·10–� m2/s och fyra flödesanomalier detekterades.
I borrhålet HFM�5 uppskattades den totala transmissiviteten till 1,6·10–4 m2/s. Ett pumptest ovanför en manschett gjordes i det icke flödesloggade borrhålsintervallet mellan 12,0 och 21,0 m och transmissiviteten i detta intervall beräknades med Moyes formel till 2,2·10–5 m2/s. Under flödesloggningen fann man fem flödesanomalier.

5
Contents
1 Introduction 7
2 Objectives 9
3 Scope 11�.1 Boreholes tested 11�.2 Tests performed 11�.� Equipment check 12
4 Descriptionofequipment 1�4.1 Overview 1�4.2 Measurement sensors 14
5 Execution 175.1 Preparations 175.2 Procedure 17
5.2.1 Overview 175.2.2 Details 17
5.� Data handling 185.4 Analyses and interpretation 18
5.4.1 Single-hole pumping tests 195.4.2 Flow logging 20
5.5 Nonconformities 22
6 Results 2�6.1 Nomenclature and symbols 2�6.2 Water sampling 2�6.� Single-hole pumping tests 2�
6.�.1 Borehole HFM��: 12.0–140.2 m 246.�.2 Borehole HFM�4: 12.0–200.8 m 266.�.� Borehole HFM�5: 12.0–200.8 m 296.�.4 Borehole HFM�5: 12.0–21.0 m �1
6.4 Flow logging ��6.4.1 Borehole HFM�� ��6.4.2 Borehole HFM�4 �66.4.� Borehole HFM�5 40
6.5 Summary of hydraulic tests 44
7 References 51
Appendix1 List of data files 5�Appendix2 Test diagrams 55Appendix3 Result tables to Sicada database 65

7
1 Introduction
This document reports the results of the hydraulic testing of boreholes HFM��, HFM�4 and HFM�5 within the Forsmark site investigation. The tests were carried out as pumping tests combined with flow logging. Water sampling was undertaken in conjunction with the tests. No other hydraulic tests had been carried out in the actual boreholes before this campaign.
All three boreholes are situated in the vicinity of drill site 11 close to SFR repository, see Figure 1-1.
All time notations in this report are made according to Swedish Summer Time (SSUT), UTC +2 h.
The work was carried out in accordance to SKB internal controlling documents; see Table 1-1. Data and results were delivered to the SKB site characterization database SICADA, where they are traceable by the Activity Plan number.
Figure 1-1. Map showing the location of boreholes HFM33, HFM34, HFM35 and KFM11A.

8
Table 1-1. SKB Internal controlling documents for performance of the activity.
Activity Plan Number VersionHydrotester och vattenprovtagning i hammarborrhålen HFM33, HFM34, HFM35
AP PF 400-06-037 1.0
Method documents Number VersionMetodbeskrivning för hydrauliska enhålspumptester SKB MD 321.003 1.0Metodbeskrivning för flödesloggning SKB MD 322.009 1.0Instruktion för analys av injektions- och enhålspumptester SKB MD 320.004 1.0Mätsystembeskrivning för HydroTestutrustning för HammarBorrhål. HTHB SKB MD 326.001 3.0

9
2 Objectives
The objective of the pumping tests and flow logging in boreholes HFM��, HFM�4 and HFM�5 was to investigate the hydraulic properties of the penetrated rock volumes, by analysing the pumping test and identify the position and hydraulic character of major inflows (which may represent e.g. sub-horizontal fracture zones). Furthermore, another aim was to investigate the hydrochemical properties of the groundwater.
11
3 Scope
3.1 Boreholes tested Technical data of the boreholes tested are displayed in Table �-1. The reference point in the boreholes is always top of casing (ToC). The Swedish National coordinate system (RT90 2.5 gon W) is used in the x-y-plane together with RHB70 in the z-direction. Northing and Easting refer to the top of the boreholes at top of casing. The borehole diameter in Table �-1, measured as the diameter of the drill bit, refers to the initial diameter just below the casing. The borehole diameter decreases more or less along the borehole due to wearing of the drill bit.
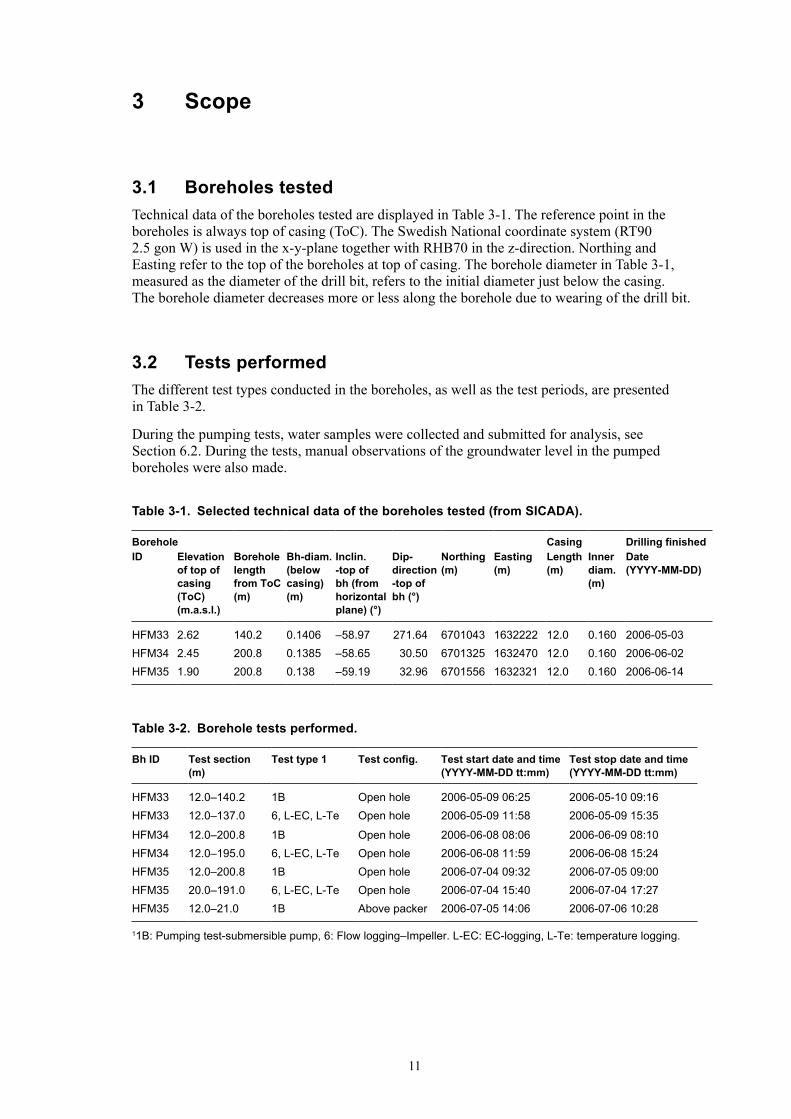
3.2 Tests performedThe different test types conducted in the boreholes, as well as the test periods, are presented in Table �-2.
During the pumping tests, water samples were collected and submitted for analysis, see Section 6.2. During the tests, manual observations of the groundwater level in the pumped boreholes were also made.
Table 3-1. Selected technical data of the boreholes tested (from SICADA).
Borehole Casing Drilling finishedID Elevation
of top of casing (ToC) (m.a.s.l.)
Borehole length from ToC (m)
Bh-diam. (below casing) (m)
Inclin. -top of bh (from horizontal plane) (°)
Dip-direction -top of bh (°)
Northing (m)
Easting (m)
Length (m)
Inner diam. (m)
Date (YYYY-MM-DD)
HFM33 2.62 140.2 0.1406 –58.97 271.64 6701043 1632222 12.0 0.160 2006-05-03HFM34 2.45 200.8 0.1385 –58.65 30.50 6701325 1632470 12.0 0.160 2006-06-02HFM35 1.90 200.8 0.138 –59.19 32.96 6701556 1632321 12.0 0.160 2006-06-14
Table 3-2. Borehole tests performed.
Bh ID Test section (m)
Test type 1 Test config. Test start date and time (YYYY-MM-DD tt:mm)
Test stop date and time (YYYY-MM-DD tt:mm)
HFM33 12.0–140.2 1B Open hole 2006-05-09 06:25 2006-05-10 09:16HFM33 12.0–137.0 6, L-EC, L-Te Open hole 2006-05-09 11:58 2006-05-09 15:35
HFM34 12.0–200.8 1B Open hole 2006-06-08 08:06 2006-06-09 08:10HFM34 12.0–195.0 6, L-EC, L-Te Open hole 2006-06-08 11:59 2006-06-08 15:24HFM35 12.0–200.8 1B Open hole 2006-07-04 09:32 2006-07-05 09:00HFM35 20.0–191.0 6, L-EC, L-Te Open hole 2006-07-04 15:40 2006-07-04 17:27HFM35 12.0–21.0 1B Above packer 2006-07-05 14:06 2006-07-06 10:28
11B: Pumping test-submersible pump, 6: Flow logging–Impeller. L-EC: EC-logging, L-Te: temperature logging.

12
3.3 Equipment checkPrior to the tests, an equipment check was performed to establish the operating status of sensors and other equipment. In addition, calibration constants were implemented and checked. To check the function of the pressure sensor P1 (cf. Figure 4-1), the pressure in air was recorded and found to be as expected. Submerged in the water while lowering, measured pressure coincided well with the total head of water (p/ρg). The temperature sensor displayed expected values in both air and water.
The sensor for electric conductivity displayed a zero value in air and a reasonable value in borehole water.
In boreholes HFM�� and HFM�4 the impeller used in the flow logging equipment worked well, as indicated by the rotation read on the data logger while lowering the flow logging probe in the boreholes. When lowering the probe in HFM�5 the number of revolutions per meter for the impeller was only c. a third of normal, indicating that the equipment was not in the best condi-tion. Due to a mistake when comparing the figures with the laboratory values this fact was not considered at this stage of the test performance and the field crew thought that the spinner was working well. When checking the equipment at the Geosigma workshop after the test campaign the reason for the malfunction showed to be a damaged bearing (see further Section 5.2.2).
The measuring wheel (used to measure the position of the flow logging probe) and the sensor attached to it indicated a length that corresponded well to the pre-measured length marks on the signal cable.

1�
4 Description of equipment
4.1 OverviewThe equipment used in these tests is referred to as HTHB (Swedish abbreviation for Hydraulic Test System for Percussion Boreholes) and is described in the user manual of the measurement system.
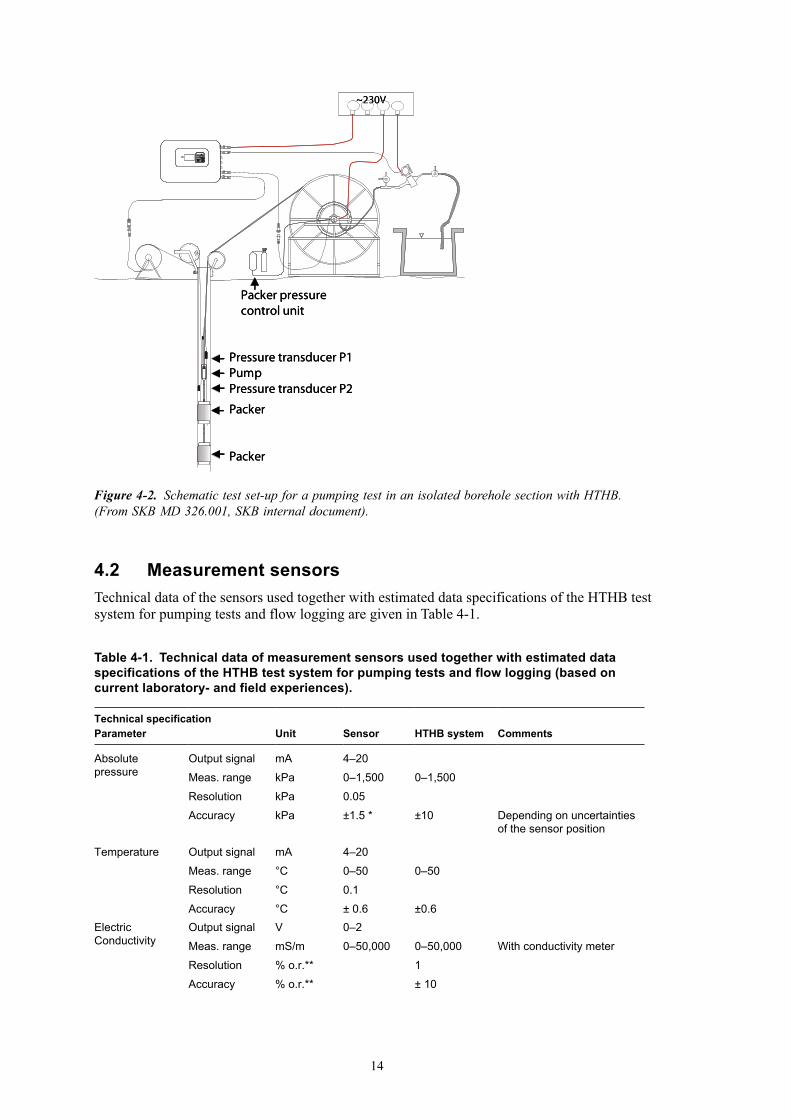
The HTHB unit is designed to perform pumping- and injection tests in open percussion drilled boreholes (Figure 4-1), and in isolated sections of the boreholes (Figure 4-2) down to a total depth (borehole length) of 200 m. With the HTHB unit, it is also possible to perform a flow logging survey along the borehole during an open-hole pumping test (Figure 4-1). For injection tests, however, the upper packer cannot be located deeper than c. 80 m due to limitations in the number of pipes available.
All equipment that belongs to the HTHB system is, when not in use, stored on a trailer and can easily be transported by a standard car. The borehole equipment includes a submersible borehole pump with housing, expandable packers, pressure sensors and a pipe string and/or hose. During flow logging, the sensors measuring temperature and electric conductivity as well as down-hole flow rate are also employed. At the top of the borehole, the total flow/injection rate is manually adjusted by a control valve and monitored by an electromagnetic flow meter. A data logger samples data at a frequency determined by the operator.
The packers are normally expanded by water (nitrogen gas is used for pressurization) unless the depth to the groundwater level is large, or the risk of freezing makes the use of water unsuitable. In such cases, the packers are expanded by nitrogen gas. A folding pool is used to collect and store the discharged water from the borehole for subsequent use in injection tests (if required).
Figure 4-1. Schematic test set-up for a pumping test in an open borehole in combination with flow logging with HTHB. (From SKB MD 326.001, SKB internal document).
14
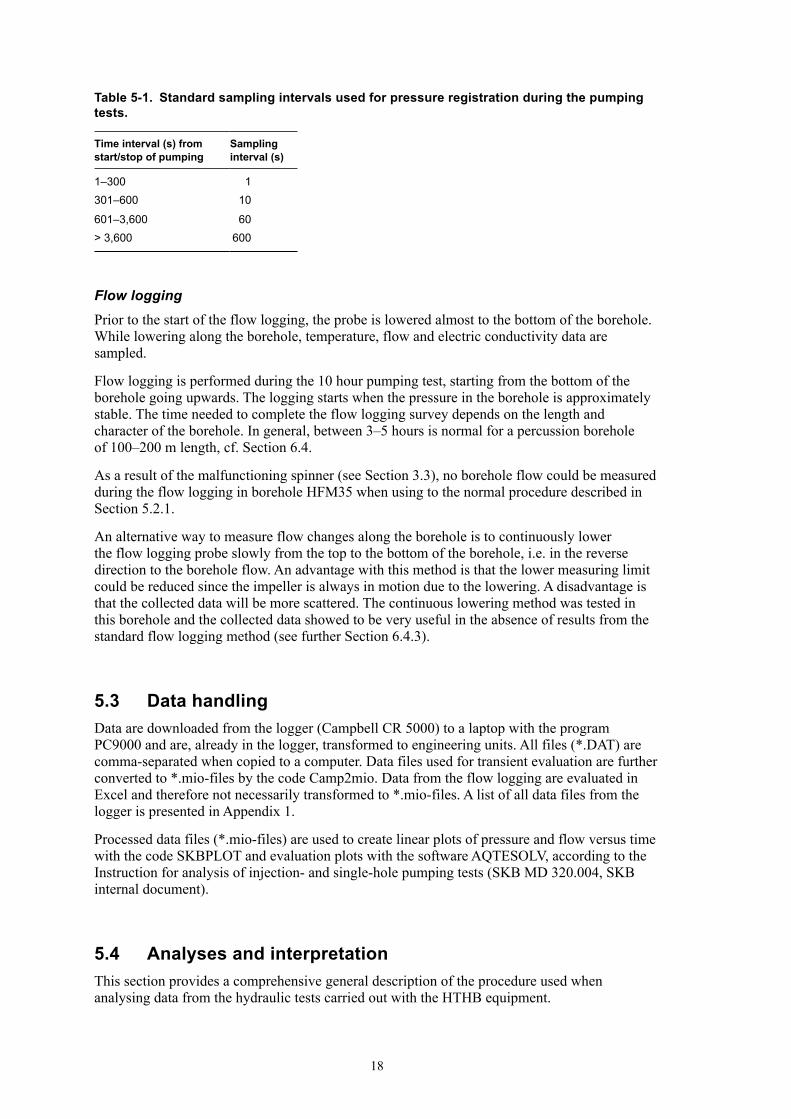
4.2 Measurement sensorsTechnical data of the sensors used together with estimated data specifications of the HTHB test system for pumping tests and flow logging are given in Table 4-1.
Table 4-1. Technical data of measurement sensors used together with estimated data specifications of the HTHB test system for pumping tests and flow logging (based on current laboratory- and field experiences).
Technical specificationParameter Unit Sensor HTHB system Comments
Absolute pressure
Output signal
Meas. range
Resolution
Accuracy
mA
kPa
kPa
kPa
4–20
0–1,500
0.05
±1.5 *
0–1,500
±10 Depending on uncertainties of the sensor position
Temperature Output signal
Meas. range
Resolution
Accuracy
mA
°C
°C
°C
4–20
0–50
0.1
± 0.6
0–50
±0.6Electric Conductivity
Output signal
Meas. range
Resolution
Accuracy
V
mS/m
% o.r.**
% o.r.**
0–2
0–50,000 0–50,000
1
± 10
With conductivity meter
Figure 4-2. Schematic test set-up for a pumping test in an isolated borehole section with HTHB. (From SKB MD 326.001, SKB internal document).
~230V
Packer pressure control unit
Pressure transducer P1PumpPressure transducer P2
Packer
Packer
~230V
Packer pressure control unit
Pressure transducer P1PumpPressure transducer P2
Packer
Packer

15
Technical specificationParameter Unit Sensor HTHB system Comments
Flow (Spinner) Output signal
Meas. range
Resolution***
Accuracy***
Pulses/s
L/min
L/min
% o.r.**
c. 0.1–c. 15
2–100
3–100
4–100
0.2
± 20
115 mm borehole diameter
140 mm borehole diameter
165 mm borehole diameter
140 mm borehole diameter and 100 s sampling time
Flow (surface) Output signal
Meas. range
Resolution
Accuracy
mA
L/min
L/min
% o.r.**
4–20
1–150
0.1
± 0.5
5–c. 80****
0.1
± 0.5
Passive
Pumping tests
* Includes hysteresis, linearity and repeatability.
** Maximum error in % of actual reading (% o.r.).
*** Applicable to boreholes with a borehole diameter of 140 mm and 100 s sampling time.
**** For injection tests the minimal flow rate is 1 L/min.
Errors in reported borehole data (diameter etc) may significantly increase the error in measured data. For example, the flow logging probe is very sensitive to variations in the borehole diameter, cf. Figure 4-�. Borehole deviation and uncertainties in determinations of the borehole inclination may also affect the accuracy of measured data.
The flow logging probe is calibrated for different borehole diameters (in reality different pipe diameters), i.e. 111.�, 1�5.5, 140 and 162 mm. During calibration the probe is installed in a vertically orientated pipe and a water flow is pumped through. The spinner rotations and total discharge are measured. Calibration gives excellent correlation (R2 > 0.99) between total discharge and the number of spinner rotations. The calibration also clearly demonstrates how sensible the probe is to deviations in the borehole diameter, cf. Figure 4-�.
The stabilisation time may be up to �0 s at flows close to the lower measurement limit, whereas the stabilisation is almost instantaneous at high flows.
Table 4-2 presents the position of sensors for each test together with the level of the pump-intake of the submersible pump. The following types of sensors are used: pressure (P), temperature (Te), electric conductivity (EC). Positions are given in metres from the reference
Figure 4-3. Total flow as a function of impeller rotations for two borehole diameters (140 and 135.5 mm).

16
point, i.e. top of casing (ToC), lower part. The sensors measuring temperature and electric conductivity are located in the impeller flow-logging probe and the position is thus varying (top-bottom-top of section) during a test. For specific information about the position at a certain time, the actual data files have to be consulted.
Equipment affecting the wellbore storage coefficient is given in terms of diameter of submerged item. Position is given as “in section” or “above section”. The volume of the submerged pump (~ 4 dm�) is not involved in the wellbore storage since the groundwater level always is kept above the top of the pump in open boreholes.
In addition, the theoretical wellbore storage coefficient C for the actual test configurations and geometrical data of the boreholes were calculated, see Section 5.4.1. These values on C may be compared with the estimated ones from the test interpretations described in Chapter 6.
For tests where the change of water level occurs below the casing, two different values of the theoretical wellbore storage coefficient C can be estimated. One is based on the casing diameter and the other one is based on the actual borehole diameter below the casing.
Table 4-2. Position of sensors (from ToC) and of equipment that may affect wellbore storage for the different hydraulic tests performed.
Borehole information Sensors Equipment affecting wellbore storage (WBS)ID Test interval
(m)Test config
Test type 1)
Type Position (m b ToC)
Function Position 2) relative test section
Outer diameter (mm)
C 3)
(m3/Pa)
HFM33 12.0–140.2 Open hole
1B Pump-intake 8.40 Pump hose In section 33.5 2.24∙10–6
1B Pump cable In section 14.51B Steel wire In section 51B Polyamide tube In section 61B P (P1) 5.72 Signal cable In section 86 EC, Te, Q 12.0–137.0 Signal cable In section 13.5
HFM34 12.0–200.8 Open hole
1B Pump-intake 8.40 Pump hose In section 33.5 2.25∙10–6
1B Pump cable In section 14.51B Steel wire In section 51B Polyamide tube In section 61B P (P1) 5.72 Signal cable In section 86 EC, Te, Q 12.0–195.0 Signal cable In section 13.5
HFM35 12.0–200.8 Open hole
1B Pump-intake 17.48 Pump hose In section 33.5 2.23∙10–6
1B Pump cable In section 14.51B Steel wire In section 51B Polyamide tube In section 61B P (P1) 14.8 Signal cable In section 86 EC, Te, Q 20–191 Signal cable In section 13.5
HFM35 12.0–21.0 Above packer
1B Pump-intake 17.62 Pump hose In section 33.5 2.23∙10–6
1B Pump cable In section 14.51B Steel wire In section 51B Polyamide tube In section 61B P (P1) 14.94 Signal cable In section 8
1) 1B: Pumping test-submersible pump, 3: Injection test, 6: Flow logging–Impeller incl. EC-logging (EC-sec) and temperature logging (Te-sec).2) Position of equipment that can affect wellbore storage. Position given as “In Section” or “Above Section”.3) Based on the casing diameter or the actual borehole diameter (Table 3-1) for open-hole tests together with the compressibility of water for the test in isolated sections, respectively (net values).

17
5 Execution
5.1 Preparations
All sensors included in the HTHB system are calibrated at the Geosigma engineering service station in Uppsala. Calibration is generally performed on a yearly basis, but more often if needed. The latest calibration was performed in September 2005. If a sensor is replaced at the test site, calibration of the new sensor can be carried out in the field (except the flow probe) or alternatively, in the laboratory after the measurements. Due to a breakage in the signal cable to the electric conductivity sensor during the latest calibration, the calibration constants achieved during the former calibration in April 2004 were used for the repaired sensor.
Functioning checks of the equipment used in the present test campaign were made prior to each hydraulic test. The results from the functioning checks are presented in Section �.�.
Before the tests, cleaning of equipment as well as time synchronisation of clocks and data loggers were performed according to the Activity Plan.
5.2 Procedure5.2.1 OverviewThe main pumping test is always preceded by a shorter capacity test (the day before) to deter-mine a proper pumping flow rate. During the capacity test the flow rate is changed considering the obtained response.
The main pumping is normally carried out as a single-hole, constant flow rate test followed by a pressure recovery period. At the end of the pumping period flow logging is performed.
Before flow logging is started, the intention is to achieve approximately steady-state conditions in the borehole. The flow logging is performed with discrete flow measurements made at fixed step lengths (5 m until the first flow anomaly is found and 2 m thereafter), starting from the bottom and upwards along the borehole. When a detectable flow anomaly is found, the flow logging probe is lowered and repeated measurements with a shorter step length (0.5 m) are made to determine a more correct position of the anomaly. The flow logging survey is terminated a short distance below the submersible pump in the borehole.
5.2.2 DetailsSingle-hole pumping tests
In HFM��, HFM�4 and HFM�5 the main test consisted of c. 10 h pumping in the open borehole in combination with flow logging at the end of the pumping period, followed by a recovery period of c. 17, 14 and 1� hours respectively. In HFM�5, since the pump due to the drawdown had to be lowered below the casing, it was not possible to perform the flow logging above 20 m borehole length. Therefore a complementary pumping test above a packer at 20–21 m was carried out in this borehole.
In general, the sampling frequency of pressure and flow during the pumping tests was according to Table 5-1, which corresponds to a predefined measurement sequence on the data logger. Sometimes, for practical reasons, the interval is shortened during certain periods of the test.
18
Table 5-1. Standard sampling intervals used for pressure registration during the pumping tests.
Time interval (s) from start/stop of pumping
Sampling interval (s)
1–300 1301–600 10
601–3,600 60> 3,600 600
Flow logging
Prior to the start of the flow logging, the probe is lowered almost to the bottom of the borehole. While lowering along the borehole, temperature, flow and electric conductivity data are sampled.
Flow logging is performed during the 10 hour pumping test, starting from the bottom of the borehole going upwards. The logging starts when the pressure in the borehole is approximately stable. The time needed to complete the flow logging survey depends on the length and character of the borehole. In general, between �–5 hours is normal for a percussion borehole of 100–200 m length, cf. Section 6.4.
As a result of the malfunctioning spinner (see Section �.�), no borehole flow could be measured during the flow logging in borehole HFM�5 when using to the normal procedure described in Section 5.2.1.
An alternative way to measure flow changes along the borehole is to continuously lower the flow logging probe slowly from the top to the bottom of the borehole, i.e. in the reverse direction to the borehole flow. An advantage with this method is that the lower measuring limit could be reduced since the impeller is always in motion due to the lowering. A disadvantage is that the collected data will be more scattered. The continuous lowering method was tested in this borehole and the collected data showed to be very useful in the absence of results from the standard flow logging method (see further Section 6.4.�).
5.3 Data handlingData are downloaded from the logger (Campbell CR 5000) to a laptop with the program PC9000 and are, already in the logger, transformed to engineering units. All files (*.DAT) are comma-separated when copied to a computer. Data files used for transient evaluation are further converted to *.mio-files by the code Camp2mio. Data from the flow logging are evaluated in Excel and therefore not necessarily transformed to *.mio-files. A list of all data files from the logger is presented in Appendix 1.
Processed data files (*.mio-files) are used to create linear plots of pressure and flow versus time with the code SKBPLOT and evaluation plots with the software AQTESOLV, according to the Instruction for analysis of injection- and single-hole pumping tests (SKB MD �20.004, SKB internal document).
5.4 Analyses and interpretation This section provides a comprehensive general description of the procedure used when analysing data from the hydraulic tests carried out with the HTHB equipment.

19
5.4.1 Single-hole pumping testsFirstly, a qualitative evaluation of the actual flow regimes (wellbore storage, pseudo-linear, pseudo-radial or pseudo-spherical flow) and possible outer boundary conditions during the hydraulic tests is performed. The qualitative evaluation is made from analyses of log-log diagrams of drawdown and/or recovery data together with the corresponding derivatives versus time. In particular, pseudo-radial flow (2D) is reflected by a constant (horizontal) derivative in the diagrams. Pseudo-linear and pseudo-spherical flow are reflected by a slope of the derivative of 0.5 and –0.5, respectively, in a log-log diagram. Apparent no-flow- and constant head boundaries are reflected by a rapid increase and decrease of the derivative, respectively.
From the results of the qualitative evaluation, appropriate interpretation models for the quantita-tive evaluation of the tests are selected. In general, a certain period with pseudo-radial flow can be identified during the pumping tests. Consequently, methods for single-hole, constant-flow rate or constant drawdown tests for radial flow in a porous medium described in Almén K-E et al 1986 /1/ and Morosini M et al. 2001 /2/ are generally used by the evaluation of the tests. For tests indicating a fractured- or borehole storage dominated response, corresponding type curve solutions are used by the routine analyses.
If possible, transient analysis is applied on both the drawdown- and recovery phase of the tests. The recovery data are plotted versus Agarwal equivalent time. Transient analysis of drawdown- and recovery data are made in both log-log and lin-log diagrams as described in the Instruction (SKB MD �20.004). In addition, a preliminary steady-state analysis (e.g. Moye’s formula) is made for all tests for comparison.
The transient analysis was performed using a special version of the aquifer test analysis software AQTESOLV which enables both visual and automatic type curve matching with different analytical solutions for a variety of aquifer types and flow conditions. The evaluation is performed as an iterative process of type curve matching and non-linear regression on the test data. For the flow period as well as the recovery period of the constant flow rate tests, a model presented by Dougherty-Babu (1984) /�/ for constant flow rate tests with radial flow, accounting for wellbore storage and skin effects, is generally used for estimating transmissivity, storativity and skin factor for actual values on the borehole- and casing radius. AQTESOLV also includes other models, for example a model for discrete fractures (horizontal and vertical, respectively) intersecting the borehole, causing pseudo-linear flow. If found advantageous, others than the Dougherty-Babu model may be used in a specific case.
The effective casing radius may be estimated from the regression analysis for tests affected by wellbore storage. The wellbore storage coefficient can be calculated from the simulated effective casing radius, see below. The effective wellbore radius concept is used to account for negative skin factors.
Rather than assuming a fixed value of the storativity of 1·10–6 by the analysis according to the instruction SKB MD �20.004, an empirical regression relationship between storativity and transmissivity, Equation 5-1 (Rhén et al. 1997) /4/ is used. Firstly, the transmissivity and skin factor are obtained by type curve matching on the data curve using a fixed storativity value of 10–6. From the transmissivity value obtained, the storativity is then calculated according to Equation 5-1 and the type curve matching is repeated.
S=0.0007 ∙ T0.5 (5-1)
S=storativity (–)
T=transmissivity (m2/s)
In most cases the change of storativity does not significantly alter the calculated transmissivity by the new type curve matching. Instead, the estimated skin factor, which is strongly correlated to the storativity, is altered correspondingly.

20
The nomenclature used for the simulations with the AQTESOLV code is presented in the beginning of Appendix 2.
Estimations of the borehole storage coefficient, C, based on actual borehole geometrical data (net values) according to Equation (5-2), are presented in Table 4-2. The borehole storage coefficient may also be estimated from the early test response with 1:1 slope in a log-log diagram /2/ or alternatively, from the simulated effective casing radius. These values on C may be compared with the net values of the wellbore storage coefficient based on actual borehole geometrical data. The estimated values on C from the test data may differ from the net values due to deviations of the actual geometrical borehole data from the anticipated, e.g. regarding the borehole diameter, or presence of fractures or cavities with significant volumes.
For pumping tests in an open borehole (and in the interval above a single packer) the wellbore storage coefficient may be calculated as:
C=π rwe2/ρg (5-2)
rwe = borehole radius where the changes of the groundwater level occur (either rw or rc) or alternatively, the simulated effective casing radius r(c)
rw = nominal borehole radius (m)
rc = inner radius of the borehole casing (m)
r(c) = simulated effective casing radius (m)
ρ = density of water (kg/m�)
g = acceleration of gravity (m/s2)
5.4.2 Flow logging The measured parameters during flow logging (flow, temperature and electric conductivity of the borehole fluid) are firstly plotted versus borehole length. From these plots, flow anomalies are identified along the borehole, i.e. borehole intervals over which changes of flow exceeding c. 1 L/min occur. The size of the inflow at a flow anomaly is determined by the actual change in flow rate across the anomaly. In most cases, the flow changes are accompanied by changes in temperature and/or electric conductivity of the fluid. If the actual borehole diameter differs from the one assumed by the calibration of the flow logging probe, corrections of the measured borehole flow rates may be necessary, cf. Figure 4-�.
Flow logging can be carried out from the borehole bottom up to a certain distance below the submersible pump (c. 2.5 m). The remaining part of the borehole (i.e. from the pump to the casing) cannot be flow-logged, although high inflow zones may sometimes be located here. Such superficial inflows may be identified by comparing the flow at the top of the flow-logged interval (QT) with the discharged flow rate (Qp) measured at the surface during the flow logging. If the latter flow rate is significantly higher, one or several inflow zones are likely to exist above the flow-logged interval. However, one must be careful when interpreting absolute flow values measured by the flow logging probe since it is very sensitive to the actual borehole diameter. The probe is calibrated in a tube with a certain diameter (see Section 4.2) but the actual borehole diameter, measured as the diameter of the drill bit, is most often deviating from the nominal diameter. Furthermore, the borehole diameter is normally somewhat larger than the diameter of the drill bit, depending, among other things, on the rock type. The diameter is also decreasing towards depth, due to successive wearing of the drill bit.
To account for varying diameter along the borehole, one may utilize the logging in the undisturbed borehole when lowering the flow logging probe before pumping. Under the assumption of a linear relationship between borehole diameter and gain in the calibration function, transforming counts per seconds from the flow sensor to engineering units (L/min),

21
and using known borehole diameters at two or more borehole lengths, one can obtain a relationship between gain and borehole length in the actual borehole. This relationship is then used for correction of the measured flow along the borehole.
Since the absolute value of the borehole diameter is uncertain and the measured borehole flow to some degree probably also depends on borehole inclination, it is often necessary to make a final correction to achieve correspondence between the measured borehole flow at the top of the flow logged interval and the pumped flow measured at surface. To make these corrections, all significant flow anomalies between the top of the flow logged interval and the casing must also be quantified. Therefore, it may be necessary to supplement the flow logging with injection or pumping tests above the highest logged level in the borehole, unless it is possible to carry out the flow logging to the casing. Alternatively, if other information (e.g. BIPS logging or drilling information) clearly shows that no inflow occurs in this part of the borehole, no supplementary tests are necessary.
Depending on if supplementary tests are carried out, two different methods are employed for estimating the transmissivity of individual flow anomalies in the flow logged interval of the borehole. In both cases the transmissivity of the entire borehole (T) is estimated from the transient analysis of the pumping test.
Method1If no significant inflow occurs above the flow logged interval, the corrected logged flow at a certain length, Q(L)corr, can be calculated according to:
Q(L)corr =Corr ⋅ Q(L) (5-�)
where
Corr = QP/QT
Q(L) = measured flow at a certain length L in the borehole, if necessary corrected for varying borehole diameter
QP = pumped flow from the borehole
QT = measured flow at the top of the logged interval
The transmissivity of an individual flow anomaly (Ti) is calculated from the measured inflow (dQi) at the anomaly, the discharge Qp and the calculated transmissivity of the entire borehole (T) according to:
Ti= Corr ⋅ dQi/Qp ⋅ T (5-4)
The cumulative transmissivity TF(L) versus the borehole length (L) as determined from the flow logging may be calculated according to:
TF(L) = Corr ⋅ Q(L)/Qp ⋅ T (5-5)
Method2If additional hydraulic tests show that there exist significant flow anomalies above the flow logged interval, the transmissivity TA for the non flow logged interval is estimated from these tests. In this case the resulting transmissivity of the flow-logged interval (TFT) is calculated according to:
TFT = ΣTi = (T–TA) (5-6)
where TA is the transmissivity of the non flow-logged interval.

22
The resulting flow at the top of the flow logged interval QFT may be calculated from:
QFT = QP ⋅ TFT/T (5-7)
and the corrected flow Q(L)corr from:
Q(L)corr = Corr ⋅ Q(L) (5-8)
where
Corr = QFT/QT
Q(L) = measured flow at a certain length L in the borehole, if necessary corrected for varying borehole diameter
The transmissivity of an individual flow anomaly (Ti) is calculated from the relative contribution of the anomaly to the total flow at the top of the flow logged interval (dQi/QT) and the calculated transmissivity of the entire flow-logged interval (TFT) according to:
Ti= Corr ⋅ dQi/QT ⋅ TFT (5-9)
The cumulative transmissivity TF(L) at the borehole length (L) as determined from the flow logging may be calculated according to:
TF(L) = Corr ⋅ Q(L)/QT ⋅ TFT (5-10)
The threshold value of transmissivity (Tmin) in flow logging may be estimated in a similar way:
Tmin = T ⋅ Qmin/Qp (5-11)
In a 140 mm borehole, Qmin=� L/min, see Table 4-1, whereas Qp is the actual flow rate during flow logging.
Similarly, the lower measurement limit of transmissivity of a flow anomaly can be estimated using dQi min = 1 L/min (1.7·10–5 m�/s) which is considered as the minimal change in borehole flow rate to identify a flow anomaly. The upper measurement limit of transmissivity of a flow anomaly corresponds to the transmissivity of the entire borehole.
5.5 NonconformitiesThe hydraulic test program was mainly performed in compliance with the Activity Plan, however with the following exceptions:
• Compared to the Methodology Description for single-hole pumping tests (SKB MD �21.00�), a deviation was made regarding the recommended test time (24 h + 24 h for drawdown + recovery). For the longer pumping tests during flow logging the test time was decreased to c. 10 h +12 h due to practical reasons (mainly to avoid uncontrolled pumping over-night and to eliminate the risk of freezing, theft/sabotage etc). Experience from similar tests in other boreholes indicates that c. 10 h of pumping and 12 h of recovery in general is sufficient to estimate the hydraulic properties of the borehole regarding e.g. wellbore storage effects and other disturbing factors.
• In borehole HFM�5 a malfunctioning impeller caused that no flow anomalies could be detected during the normal flow logging procedure with discrete flow measurements at fixed distances along the borehole. Instead the results from a complementary measurement during continuous lowering of the flow logging probe could be used to evaluate flow anomalies in the borehole. (See Sections �.� and 5.2.2.)

2�
6 Results
6.1 Nomenclature and symbols The nomenclature and symbols used for the results of the pumping tests and flow logging are according to the instruction for analysis of single-hole injection- and pumping tests, SKB MD �20.004, Version 1.0, and the methodology description for impeller flow logging, SKB MD �22.009, Version 1.0. Additional symbols used are explained in the text. The nomenclature for the analyses of the pumping tests by the AQTESOLV code is presented in Appendix 2.
6.2 Water sampling Water samples were taken during the pumping tests in the boreholes and submitted for analysis, see Table 6-1. The results are presented within the scope of another activity.
6.3 Single-hole pumping tests Below, the results of the single-hole pumping tests are presented test by test. The atmospheric pressure and precipitation were monitored at the site during the testing periods. However, no corrections of measured data, e.g. for changes of the atmospheric pressure or tidal fluctuations, have been made before the analysis of the data. For the actual type of single-hole tests such corrections are generally not needed considering the relatively short test time and large drawdown applied in the boreholes. However, for longer tests with a small drawdown applied, such corrections may be necessary.
Drilling records and other activities were checked to identify possible interference on the hydraulic test data from activities in nearby boreholes during the test periods. Reported activities are presented in Table 6-2.
Table 6-1. Water samples collected during the pumping tests in boreholes HFM33, HFM34 and HFM35 and submitted for analysis.
Bh ID Date and time of sample
Pumped section (m)
Pumped volume (m3)
Sample type
Sample ID no
Remarks
HFM33 2006-05-09 07:52 12.0–140.2 4.0 WC080 012245 Open-hole testHFM33 2006-05-09 11:55 12.0–140.2 15.8 WC080 012246 Open-hole test
HFM33 2006-05-09 15:55 12.0–140.2 27.4 WC080 012247 Open-hole testHFM34 2006-06-08 08:44 12.0–200.8 2.5 WC080 012289 Open-hole testHFM34 2006-06-08 11:55 12.0–200.8 15.7 WC080 012290 Open-hole testHFM34 2006-06-08 17:15 12.0–200.8 37.8 WC080 012291 Open-hole testHFM35 2006-07-04 10:40 12.0–200.8 2.3 WC080 012327 Open-hole testHFM35 2006-07-04 11:57 12.0–200.8 12.6 WC080 012328 Open-hole testHFM35 2006-07-04 20:01 12.0–200.8 24.7 WC080 012329 Open-hole test
24
Table 6-2. Activities at the PLU site that might have influenced the hydraulic tests in boreholes HFM33, HFM34 and HFM35.
Borehole ID Test period Ongoing activities
HFM33 2006-05-08–2006-05-10 No hydraulically disturbing activities were ongoing.HFM34 2006-06-07–2006-06-09 Overburden percussion drilling of borehole HFM35.
HFM35 2006-07-03–2006-07-06 No hydraulically disturbing activities were ongoing.
No obvious influence from other activities on the test results could be seen.
6.3.1 Borehole HFM33: 12.0–140.2 m General test data for the open-hole pumping test in HFM�� are presented in Table 6-�.
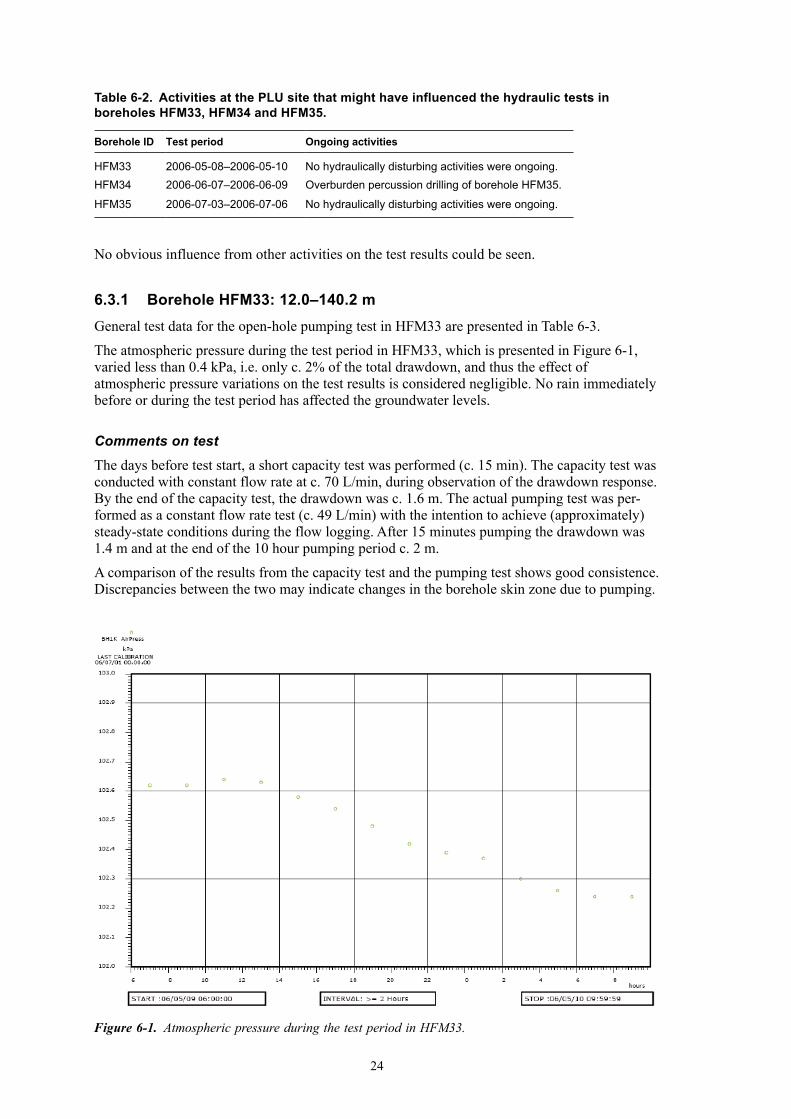
The atmospheric pressure during the test period in HFM��, which is presented in Figure 6-1, varied less than 0.4 kPa, i.e. only c. 2% of the total drawdown, and thus the effect of atmospheric pressure variations on the test results is considered negligible. No rain immediately before or during the test period has affected the groundwater levels.
Comments on test
The days before test start, a short capacity test was performed (c. 15 min). The capacity test was conducted with constant flow rate at c. 70 L/min, during observation of the drawdown response. By the end of the capacity test, the drawdown was c. 1.6 m. The actual pumping test was per-formed as a constant flow rate test (c. 49 L/min) with the intention to achieve (approximately) steady-state conditions during the flow logging. After 15 minutes pumping the drawdown was 1.4 m and at the end of the 10 hour pumping period c. 2 m.
A comparison of the results from the capacity test and the pumping test shows good consistence. Discrepancies between the two may indicate changes in the borehole skin zone due to pumping.
Figure 6-1. Atmospheric pressure during the test period in HFM33.

25
Table 6-3. General test data, pressure, groundwater level and flow data for the open-hole pumping test in borehole HFM33.
General test data
Borehole HFM33 (12.0–140.2 m)Test type Constant rate withdrawal and recovery testTest section (open borehole/packed-off section): Open borehole Test No 1Field crew C. Hjerne and J. Florberger, GEOSIGMA ABTest equipment system HTHBGeneral comment Single pumping borehole
Nomen-clature
Unit Value
Borehole length L m 140.2Casing length Lc m 12.0Test section – Secup Secup m 12.0Test section – Seclow Seclow m 140.2Test section length Lw m 128.2Test section diameter 2∙rw mm top 140.6
bottom 139.0 Test start (start of pressure registration) yymmdd hh:mm:ss 060509 06:25:19Packer expanded yymmdd hh:mm:ssStart of flow period yymmdd hh:mm:ss 060509 06:29:33Stop of flow period yymmdd hh:mm:ss 060509 16:30:40Test stop (stop of pressure registration) yymmdd hh:mm:ss 060510 09:16:44Total flow time tp Min 601
Total recovery time tF Min 1,006
Pressure data Nomen-clature
Unit Value GW Level (m.a.s.l.) 1)
Absolute pressure in test section before start of flow period pi kPa 130.9 –0.60Absolute pressure in test section at stop of flow period pp kPa 111.4 –2.61Absolute pressure in test section at stop of recovery period pF kPa 129.6 –0.68Maximal pressure change in test section during the flow period dpp kPa 19.5
Manual groundwater level measurements GW levelDate YYYY-MM-DD
Time tt:mm:ss
Time (min)
(m b ToC)
(m.a.s.l.)
2006-05-08 11:31:00 –1,139 3.55 –0.422006-05-08 16:43:00 –827 3.78 –0.622006-05-09 06:23:00 –7 3.75 –0.602006-05-09 16:10:00 580 6.10 –2.612006-05-10 09:13:00 1,603 3.85 –0.68
Flow data Nomenclature Unit Value
Flow rate from test section just before stop of flow period Qp m3/s 8.08∙10–4
Mean (arithmetic) flow rate during flow period 2) Qm m3/s 8.10∙10–4
Total volume discharged during flow period 2) Vp m3 29.21
1) From the manual measurements of groundwater level. Manual levelling was not possible during pumping.2) Calculated from integration of the transient flow rate curve during the flow period.

26
Interpreted flow regimes
Selected test diagrams according to the Instruction for analysis of injection – and single-hole pumping tests are presented in Figures A2:1–5 in Appendix 2.
After initial pseudo-linear flow a transition to a late pseudo-radial flow may be seen after c. �00 minutes during both the drawdown and the recovery. At the end of both phases, no flow boundary effects ca be interpreted. As an alternative to the generally used model /�/ (see Section 5.4.1) a model for a horizontal fracture, Gringarten and Ramey (1974) /5/, was tested. This model gives almost a comparable fit to measured data, indicating the existence of a dominating horizontal fracture.
Interpreted parameters
Transient evaluation of transmissivity was performed for both the flow- and recovery period and quantitative interpretation is presented in Figures A2:2–5 in Appendix 2. The quantitative analysis was performed according to the methods described in Section 5.4.1. The transmissivity was estimated by a model assuming pseudo-radial flow /�/ for both the flow- and recovery period. The representative transmissivity (TT) is considered from the transient evaluation assuming pseudo-radial flow including wellbore storage and skin. The agreement between the flow and the recovery period regarding transmissivity and skin factor is good.
The results are shown in the Test Summary Sheet (Table 6-16) and in Tables 6-1�, 6-14 and 6-15.
6.3.2 Borehole HFM34: 12.0–200.8 m General test data for the open-hole pumping test in HFM�4 in conjunction with flow logging are presented in Table 6-4.
The atmospheric pressure during the test period in HFM�4, which is presented in Figure 6-2, varied 0.2 kPa, i.e. c. 4% of the total drawdown of c. 5 kPa in the borehole during the test. A small rainfall, less than 1 mm, during the night before the test has not affected the groundwater levels.
Figure 6-2. Atmospheric pressure during the test period in HFM34.

27
Table 6-4. General test data, pressure, groundwater level and flow data for the open-hole pumping test in borehole HFM34.
General test data
Borehole HFM34 (12.0–200.8 m)Test type Constant rate withdrawal and recovery testTest section (open borehole/packed-off section): Open borehole Test No 1Field crew C. Hjerne and J. Harrström, GEOSIGMA ABTest equipment system HTHBGeneral comment Single pumping borehole
Nomen-clature
Unit Value
Borehole length L m 200.8Casing length Lc m 12.0Test section – Secup Secup m 12.0Test section – Seclow Seclow m 200.8Test section length Lw m 188.8
Test section diameter 2∙rw mm top 138.5 bottom 136.8
Test start (start of pressure registration) yymmdd hh:mm:ss 060608 08:06:34Packer expanded yymmdd hh:mm:ssStart of flow period yymmdd hh:mm:ss 060608 08:07:57Stop of flow period yymmdd hh:mm:ss 060608 18:08:17Test stop (stop of pressure registration) yymmdd hh:mm:ss 060609 08:10:26Total flow time tp Min 600Total recovery time tF Min 842
Pressure data Nomen-clature
Unit Value GW Level (m.a.s.l.) 1)
Absolute pressure in test section before start of flow period pi kPa 118.7 –0.27Absolute pressure in test section at stop of flow period pp kPa 113.8 –0.81Absolute pressure in test section at stop of recovery period pF kPa 118.9Maximal pressure change in test section during the flow period dpp kPa 5.0
Manual groundwater level measurements GW levelDate YYYY-MM-DD
Time tt:mm:ss
Time (min)
(m b ToC)
(m.a.s.l.)
2006-06-07 11:12:00 –1,255 3.22 –0.302006-06-07 13:10:00 –1,137 3.20 –0.282006-06-07 13:35:00 –1,112 3.63 –0.652006-06-08 08:05:00 –2 3.19 –0.272006-06-08 18:06:00 599 3.82 –0.81
Flow data Nomenclature Unit Value
Flow rate from test section just before stop of flow period Qp m3/s 1.16∙10–3
Mean (arithmetic) flow rate during flow period 2) Qm m3/s 1.16∙10–3
Total volume discharged during flow period 2) Vp m3 41.76
1) From the manual measurements of groundwater level. Manual levelling were not possible during pumping.2) Calculated from integration of the transient flow rate curve during the flow period.

28
Since the drawdown, due to a high hydraulic capacity of the borehole, is only c. 0.5 m, the influ-ence of external factors affecting the groundwater level in the borehole could not be neglected. The borehole is located only a few metres from the shore of the Baltic see and the groundwater level is probably, to some degree, correlated to the sea water level. The small decrease in air pressure during this period may also have a certain influence.
Especially during the last c. three hours of pumping the pressure response has a deviating appearance. Also during the recovery period small fluctuations in the groundwater level can be seen (see Figure A2-6 in Appendix 2).
Comments on test
The day before test start, a short capacity test was performed (c. 17 min). The capacity test was conducted with a nearly constant flow rate, during observation of the drawdown response. By the end of the capacity test, the flow rate was c. 71 L/min and the drawdown c. 0.�8 m. The actual pumping test was performed as a constant flow rate test (69.6 L/min) with the intention to achieve (approximately) steady-state conditions during the flow logging. After 17 minutes pumping the drawdown was c. 0.�2 m and at the end of the pumping test c. 0.51 m.
A comparison of the results from the capacity test and the pumping test shows good coincidence. Discrepancies between the two may indicate changes in the borehole skin zone due to pumping.
Interpreted flow regimes
Selected test diagrams according to the Instruction for analysis of injection- and single-hole pumping tests are presented in Figures A2:6–10 in Appendix 2.
Due to the probable influence of external factors on the groundwater level (see above), the interpretation of the pressure response is somewhat complicated.
A period of approximate pseudo-radial flow regime may be interpreted between c. 50–400 minutes. A pseudo-radial flow regime is more obvious between c. 7–�00 min during the recovery period while the flow period probably is affected by external influence on the measured pressure at the very end (�–4 hours). As an alternative to the generally used model /�/ (see Section 5.4.1) a model for a horizontal fracture, Gringarten and Ramey (1974) /5/, was tested. This model gives an almost comparable fit to measured data, indicating the existence of a dominating horizontal fracture.
Interpreted parameters
Transient evaluation of transmissivity was performed for both the flow- and recovery period and the quantitative interpretation is presented in Figures A2:7–10 in Appendix 2. The quantitative analysis was performed according to the methods described in Section 5.4.1. The transmissivity was estimated by a model assuming pseudo-radial flow /�/ for both the flow- and recovery period. The representative transmissivity (TT) is considered from the transient evaluation assuming pseudo-radial flow including wellbore storage and skin. The agreement between the flow period and the recovery period regarding transmissivity and skin factor is good.
The results are shown in the Test Summary Sheet (Table 6-17) and in Tables 6-1�, 6-14 and 6-15. The analysis from the recovery period was selected as representative for the test.

29
6.3.3 Borehole HFM35: 12.0–200.8 m General test data for the open-hole pumping test in HFM�5 are presented in Table 6-5.
Table 6-5. General test data, pressure, groundwater level and flow data for the open-hole pumping test in borehole HFM35.
General test data
Borehole HFM35 (12.0–200.8 m)Test type Constant rate withdrawal and recovery testTest section (open borehole/packed-off section): Open borehole Test No 1Field crew J. Harrström, E. Walger, GEOSIGMA ABTest equipment system HTHBGeneral comment Single pumping borehole
Nomen-clature
Unit Value
Borehole length L m 200.8Casing length Lc m 12.0Test section – Secup Secup m 12.0Test section – Seclow Seclow m 200.8Test section length Lw m 188.8Test section diameter 2∙rw mm top 138.0
bottom 135.6Test start (start of pressure registration) yymmdd hh:mm:ss 060704 09:32:29Packer expanded yymmdd hh:mm:ssStart of flow period yymmdd hh:mm:ss 060704 09:39:03Stop of flow period yymmdd hh:mm:ss 060704 20:03:01Test stop (stop of pressure registration) yymmdd hh:mm:ss 060705 09:00:49Total flow time tp Min 624Total recovery time tF Min 777
Pressure data Nomen-clature
Unit Value GW Level (m.a.s.l.) 1)
Absolute pressure in test section before start of flow period pi kPa 164.4 –3.99Absolute pressure in test section at stop of flow period pp kPa 105.2Absolute pressure in test section at stop of recovery period pF kPa 158.7 –4.68Maximal pressure change in test section during the flow period dpp kPa 59.2
Manual groundwater level measurements GW levelDate YYYY-MM-DD
Time tt:mm:ss
Time (min)
(m b ToC)
(m.a.s.l.)
2006-07-03 12:40:00 –1,259 6.30 –3.512006-07-03 15:55:00 –1,064 6.57 –3.742006-07-03 16:18:00 –1,041 6.57 –3.742006-07-04 09:15:00 –24 6.86 –3.992006-07-05 08:47:00 1,388 7.66 –4.68
Flow data Nomenclature Unit Value
Flow rate from test section just before stop of flow period Qp m3/s 6.66∙10–4
Mean (arithmetic) flow rate during flow period 2) Qm m3/s 6.66∙10–4
Total volume discharged during flow period 2) Vp m3 24.94
1) From the manual measurements of groundwater level. Manual levelling were not possible during pumping.2) Calculated from integration of the transient flow rate curve during the flow period.

�0
The atmospheric pressure during the test period in HFM�5, which is presented in Figure 6-�, varied less than 0.4 kPa, i.e. less than 1% of the total drawdown of 59 kPa, and thus the effect of atmospheric pressure variations on the test results is considered negligible. No rain immediately before or during the test period has affected the groundwater levels.
Comments on test
The day before test start, a short capacity test was performed (c. 64 min). The capacity test was conducted with the flow rate increasing in steps, during observation of the drawdown response. By the end of the capacity test, the flow rate was c. 60 L/min and the drawdown 5.7 m. The drawdown after 64 minutes pumping of the 10 hours pumping test, at a flow rate of 40 L/min, was �.7 m and at the end of the test 6.4 m.
A comparison of the results from the capacity test and the pumping test shows good coincidence. Discrepancies between the two may indicate changes in the borehole skin zone due to pumping.
Interpreted flow regimes
Selected test diagrams according to the Instruction for analysis of injection – and single-hole pumping tests are presented in Figures A2:11–15 in Appendix 2.
Initially both the flow and recovery periods are influenced by wellbore storage. A transition to pseudo-radial flow may be seen after c. 70 minutes. After c. �00 minutes a transition to an apparent no flow boundary can be observed. The boundary may possibly reflect a decreasing aperture of a single fracture at a certain distance from the borehole. As an alternative to the generally used model /�/ (see Section 5.4.1) a model for a horizontal fracture, Gringarten and Ramey (1974) /5/, was tested also in this case. The model gives an almost comparable fit to measured data, indicating the existence of a dominating horizontal fracture in the same way as in borehole �4.
Figure 6-3. Atmospheric pressure during the test period in HFM35.
�1
The somewhat disturbed appearance at the end of the flow period is caused by lowering and lifting the flow logging equipment, resulting in level changes in the borehole.
Interpreted parameters
Transient evaluation of transmissivity was performed for both the flow- and recovery period and the quantitative interpretation is presented in Figures A2:12–15 in Appendix 2. The quantitative analysis was made according to the methods described in Section 5.4.1. The transmissivity was estimated by a model assuming pseudo-radial flow /�/ for both the flow- and recovery period. The representative transmissivity (TT) is considered from the transient evaluation assuming pseudo-radial flow including wellbore storage and skin. The agreement between the flow and the recovery period regarding transmissivity and skin factor is good.
The results are shown in the Test Summary Sheet (Table 6-18) and in Tables 6-1�, 6-14 and 6-15. The analysis from the flow period was selected as representative for the test.
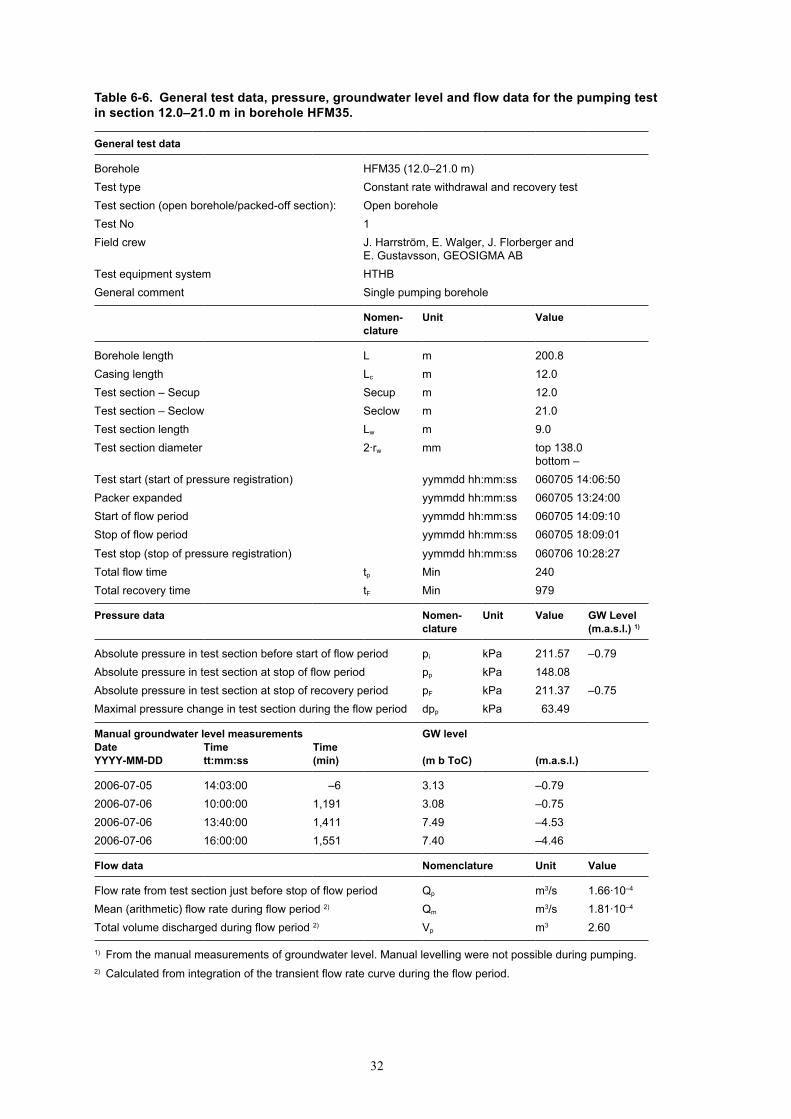
6.3.4 Borehole HFM35: 12.0–21.0 m In order to estimate the transmissivity of the borehole section between the highest flow-logged level and the casing, a supplementary pumping test was performed above a packer located at 21–22 m.
General test data for the pumping test above a packer in HFM�5 are presented in Table 6-6.
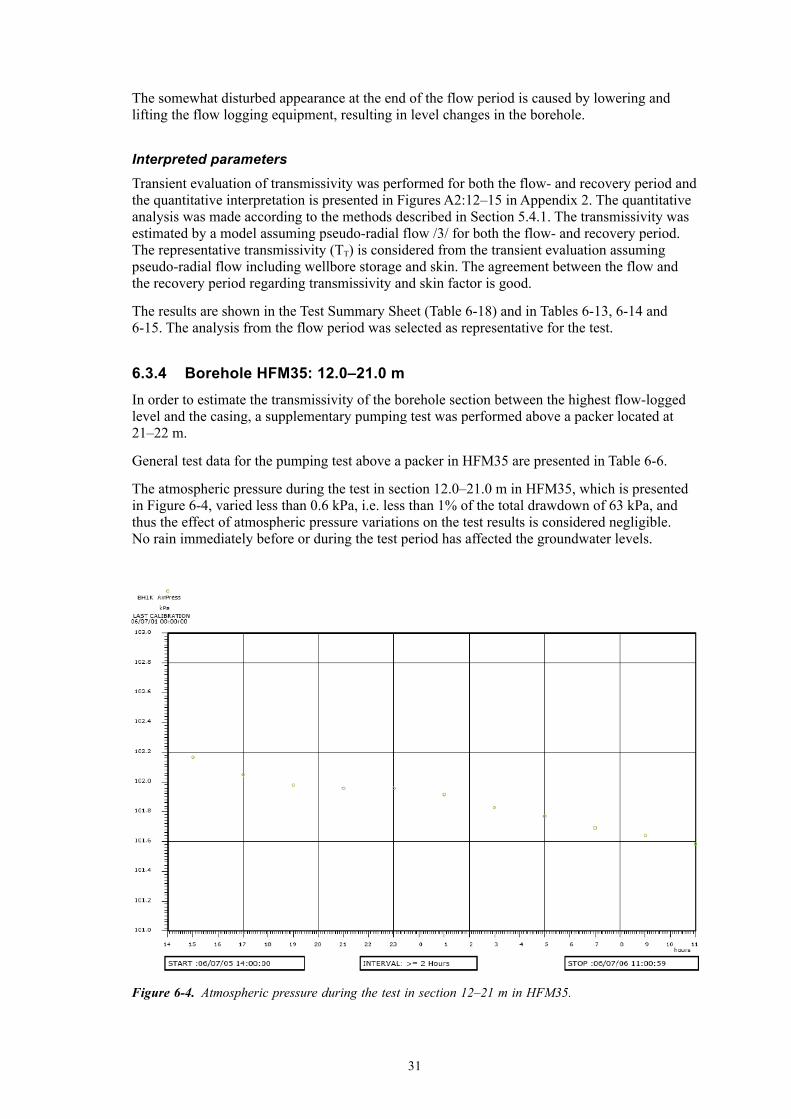
The atmospheric pressure during the test in section 12.0–21.0 m in HFM�5, which is presented in Figure 6-4, varied less than 0.6 kPa, i.e. less than 1% of the total drawdown of 6� kPa, and thus the effect of atmospheric pressure variations on the test results is considered negligible. No rain immediately before or during the test period has affected the groundwater levels.
Figure 6-4. Atmospheric pressure during the test in section 12–21 m in HFM35.
�2
Table 6-6. General test data, pressure, groundwater level and flow data for the pumping test in section 12.0–21.0 m in borehole HFM35.
General test data
Borehole HFM35 (12.0–21.0 m)Test type Constant rate withdrawal and recovery testTest section (open borehole/packed-off section): Open borehole Test No 1Field crew J. Harrström, E. Walger, J. Florberger and
E. Gustavsson, GEOSIGMA ABTest equipment system HTHBGeneral comment Single pumping borehole
Nomen-clature
Unit Value
Borehole length L m 200.8Casing length Lc m 12.0Test section – Secup Secup m 12.0Test section – Seclow Seclow m 21.0Test section length Lw m 9.0Test section diameter 2∙rw mm top 138.0
bottom –Test start (start of pressure registration) yymmdd hh:mm:ss 060705 14:06:50Packer expanded yymmdd hh:mm:ss 060705 13:24:00Start of flow period yymmdd hh:mm:ss 060705 14:09:10Stop of flow period yymmdd hh:mm:ss 060705 18:09:01
Test stop (stop of pressure registration) yymmdd hh:mm:ss 060706 10:28:27Total flow time tp Min 240Total recovery time tF Min 979
Pressure data Nomen-clature
Unit Value GW Level (m.a.s.l.) 1)
Absolute pressure in test section before start of flow period pi kPa 211.57 –0.79Absolute pressure in test section at stop of flow period pp kPa 148.08Absolute pressure in test section at stop of recovery period pF kPa 211.37 –0.75Maximal pressure change in test section during the flow period dpp kPa 63.49
Manual groundwater level measurements GW levelDate YYYY-MM-DD
Time tt:mm:ss
Time (min)
(m b ToC)
(m.a.s.l.)
2006-07-05 14:03:00 –6 3.13 –0.792006-07-06 10:00:00 1,191 3.08 –0.752006-07-06 13:40:00 1,411 7.49 –4.532006-07-06 16:00:00 1,551 7.40 –4.46
Flow data Nomenclature Unit Value
Flow rate from test section just before stop of flow period Qp m3/s 1.66∙10–4
Mean (arithmetic) flow rate during flow period 2) Qm m3/s 1.81∙10–4
Total volume discharged during flow period 2) Vp m3 2.60
1) From the manual measurements of groundwater level. Manual levelling were not possible during pumping.2) Calculated from integration of the transient flow rate curve during the flow period.
��
Comments on test
Since the flow logging, due to the malfunctioning spinner probe (see Section �.� and 5.2.2), indicated a rather high flow capacity in this section, a far too high flow rate was chosen for the supplementary pumping test. The flow rate had to be reduced from c. �0 L/min to c. 10 L/min after 10 minutes of pumping.
Interpreted flow regimes
Selected test diagrams according to the Instruction for analysis of injection – and single-hole pumping tests are presented in Figures A2:16–18 in Appendix 2. The main part of the drawdown and recovery seems to be affected by wellbore storage. Due to the flow rate change no further analyses of flow regimes could be done.
Interpreted parameters
Since it was difficult to achieve an unambiguous parameter solution with a transient analyses, the transmissivity calculated with Moye’s formula was used in the transient evaluation to esti-mate a value on the skin factor. The evaluation was made on both the flow and recovery period in one sequence. The transient, quantitative interpretation is presented in Figures A2:17–18 in Appendix 2. The quantitative analysis was performed according to the methods described in Section 5.4.1, assuming pseudo-radial flow /�/.
The results are shown in the Test Summary Sheet (Table 6-19) and in Tables 6-1�, 6-14 and 6-15.
6.4 Flow logging6.4.1 Borehole HFM33General test data for the flow logging in borehole HFM�� are presented in Table 6-7.
Comments on test
The flow logging was made from 1�7 m borehole length and upwards. The only detected inflow to the borehole was found at 1�6 m borehole length. The simultaneously measured electric conductivity and temperature are used as supporting information when interpreting flow anomalies.
Logging results
The nomenclature used for the flow logging is according to the methodology description for flow logging. The measured flow distribution along the borehole during the flow logging together with the electric conductivity (EC) and temperature of the borehole fluid are presented in Figure 6-5.
The figure presents measured borehole flow rates with calibration constants for a 140 mm pipe and corrected borehole flow rates. The correction is performed in two steps according to the method described in Section 5.4.2. In this case, it was possible to extend the flow logging to slightly above the end of the casing and therefore method 1 was used to evaluate the flow logging measurements.

�4
Table 6-7. General test data, groundwater level and flow data for the flow logging in borehole HFM33.
General test data
Borehole HFM33Test type(s) 1 6, L-EC, L-TeTest section: Open borehole Test No 1Field crew C. Hjerne and J. Florberger, GEOSIGMA ABTest equipment system HTHBGeneral comments Single pumping borehole
Nomenclature Unit Value
Borehole length m 140.2Pump position (lower level) m 9
Flow logged section – Secup m 12Flow logged section – Seclow m 137Test section diameter 2∙rw mm top 140.6
bottom 139.0 Start of flow period yymmdd hh:mm 060509 06:29Start of flow logging yymmdd hh:mm 060509 11:58Stop of flow logging yymmdd hh:mm 060509 15:35Stop of flow period yymmdd hh:mm 060509 16:30
Groundwater level Nomen-clature
Unit G.w-level (m b ToC)
G.w-level
(m.a.s.l.) 2
Groundwater level in borehole, at undisturbed conditions, open hole hi m 3.75 –0.60Groundwater level (steady state) in borehole, at pumping rate Qp hp m 6.10 –2.61Drawdown during flow logging at pumping rate Qp sFL m 2.01
Flow data Nomen-clature
Unit Flow rate
Pumping rate at surface Qp m3/s 8.08∙10–4
Corrected flow rate at Secup at pumping rate Qp QTcorr m3/s 8.08∙10–4
Threshold value for borehole flow rate during flow logging QMeasl m3/s 5∙10–5
Minimal change of borehole flow rate to detect flow anomaly dQAnom m3/s 1.7∙10–5
1) 6: Flow logging-Impeller, L-EC: EC-logging, L-TE: temperature logging.2) Calculated from the manual measurements of groundwater level.
Figure 6-5 shows that the only detected inflow, at c. 1�6 m borehole length, is supported by small changes in the EC- and temperature measurements. A change in electric conductivity and temperature at c. 28.5 m was not accompanied by any detectable change in borehole flow rate, but certainly a small inflow must exist.
The results of the flow logging in borehole HFM�� are presented in Table 6-8 below. Since now other flow anomalies were found, the corrected measured inflow for the identified flow anomaly (dQicorr) is equal to the total flow at surface and the transmissivity of the flow anomaly (Ti) is equal to the transmissivity for the entire borehole. The borehole transmissivity is taken from the transient evaluation of the flow period of the pumping test, performed in conjunction with the flow logging (cf. Section 6.�.2). An estimation of the transmissivity of the interpreted flow anomaly was also made by calculating the specific flow (dQi/sFL).

�5
Table 6-8. Results of the flow logging in borehole HFM33. QTcorr = corrected cumulative flow at the top of the logged interval, T = transmissivity from the pumping test, sFL = drawdown during flow logging and Qp = pumped flow rate from borehole.
Flow anomalies T=4.7∙10–4
(m2/s)sFL= 1.99 m Qp=8.1∙10–4
(m3/s)
Interval (m b ToC) B.h. length (m)
dQicorr (m3/s)
Ti (m2/s)
dQicorr/sFL (m2/s)
dQicorr/Qp (%)
Supporting information
136–136.5 0.5 8.1∙10–04 4.7∙10–04 4.1∙10–04 100 EC, TempTotal 8.1·10–04 4.7·10–04 4.1·10–04 100
Figure 6-5. Measured (blue) and corrected (red) inflow distribution together with measured (blue) and temperature compensated (red) electrical conductivity and temperature of the borehole fluid along borehole HMF33 during flow logging.
0
20
40
60
80
100
120
1406.52 6.54 6.56 6.58 6.6
Temperature (°C)
0
20
40
60
80
100
120
140900 1400
El. Cond. (mS/m)
0
20
40
60
80
100
120
1400 20 40 60
Flow in BH (L/min)
BHLe
ngth
(m b
elow
TO
C)
Measurement limit = 3L/min
Flow logging in HFM33
Casing end = 12 m
Qp = 48.4 l/min

�6
Figure 6-6 presents the cumulative transmissivity TF(L) along the borehole length (L) from the flow logging calculated from Equation (5-5). Since the width of the flow anomaly in the borehole is not known in detail, the change in transmissivity at the anomalies is represented by a sloping line across the anomaly. The estimated threshold value of T and the total transmissivity of the borehole are also presented in the figure, cf. Section 5.4.2.
6.4.2 Borehole HFM34General test data for the flow logging in borehole HFM�4 are presented in Table 6-9.
Figure 6-6. Calculated, cumulative transmissivity along the flow logged interval of borehole HFM33. The total borehole transmissivity was calculated from the pumping test during flow logging.

�7
Table 6-9. General test data, groundwater level and flow data for the flow logging in borehole HFM34.
General test data
Borehole HFM34Test type(s) 1 6, L-EC, L-TeTest section: Open borehole Test No 1Field crew C. Hjerne, and J. Harrström, GEOSIGMA ABTest equipment system HTHBGeneral comments Single pumping borehole
Nomenclature Unit Value
Borehole length m 200.8Pump position (lower level) m 9Flow logged section – Secup m 12.0Flow logged section – Seclow m 195.0Test section diameter 2∙rw mm top 138.5
bottom 136.8 Start of flow period yymmdd hh:mm 060608 08:07Start of flow logging yymmdd hh:mm 060608 11:59Stop of flow logging yymmdd hh:mm 060608 15:24Stop of flow period yymmdd hh:mm 060608 18:08
Groundwater level Nomen-clature
Unit G.w-level (m b ToC)
G.w-level
(m.a.s.l.) 2
Groundwater level in borehole, at undisturbed conditions, open hole hi m 3.19 –0.27Groundwater level (steady state) in borehole, at pumping rate Qp hp m 3.82 –0.81Drawdown during flow logging at pumping rate Qp sFL m 0.54
Flow data Nomen-clature
Unit Flow rate
Pumping rate at surface Qp m3/s 1.16∙10–3
Corrected flow rate at Secup at pumping rate Qp QTcorr m3/s 1.16∙10–3
Threshold value for borehole flow rate during flow logging QMeasl m3/s 5∙10–5
Minimal change of borehole flow rate to detect flow anomaly dQAnom m3/s 1.7∙10–5
1) 6: Flow logging-Impeller, L-EC: EC-logging, L-TE: temperature logging.2) Calculated from the manual measurements of groundwater level.
Comments on test
The flow logging was made from the bottom of the hole and upwards. The step length between flow logging measurements was maximally 5 m (below first measurable flow). Above first measurable flow (105.5 m), the step length was maximally 2 m, and decreased to 0.5 m when a flow anomaly was encountered.
Logged electric conductivity and temperature are used as supporting information when interpreting flow anomalies.

�8
Logging results
The nomenclature used for the flow logging is according to the methodology description for flow logging. The measured flow distribution along the borehole during the flow logging together with the electric conductivity (EC) and temperature of the borehole fluid are presented in Figure 6-7.
The figure presents measured borehole flow rates with calibration constants for a 140 mm pipe and corrected borehole flow rates. According to the drilling record the drill bit was 1�8.5 mm at the top of the borehole and 1�6.8 mm at the bottom. The correction is performed in two steps
Figure 6-7. Measured (blue) and corrected (red) inflow distribution together with temperature compensated electrical conductivity and temperature of the borehole fluid along borehole HMF34 during flow logging.
0
20
40
60
80
100
120
140
160
180
5 6 7
Temperature (°C)
0
20
40
60
80
100
120
140
160
180
820 840 860
El. Cond. (mS/m)
0
20
40
60
80
100
120
140
160
180
0 20 40 60
Flow in BH (L/min)
BH
Leng
th (m
bel
ow T
OC
)
Qp = 69.5 L/min
Measurement limit = 3 L/min
Below 105.5 m the flow was below the measurement limit
Flow loggning in HFM34
Casing end = 12 m

�9
according to the method described in Section 5.4.2. In this case, it was possible to extend the flow logging to slightly above the end of the casing and therefore method 1 was used to evaluate the flow logging measurements.
Figure 6-7 demonstrates five detected inflows between 1�.5 and 106 m. Three of the anomalies are supported by the EC-measurements. Above the first detected inflow at c. 105 m, borehole flow could not be measured at all spinner locations, indicating that the borehole flow rate was close to the measurement limit. Therefore the location of the deepest flow anomaly is uncertain. A change in temperature at c. 120 m indicates an inflow at this location and also borehole TV (BIPS) supports a location at c. 120 m where a section with partly crushed rock can be seen. One explanation why the threshold value for the borehole flow measurements seems to be somewhat higher than the laboratory value is probably that the borehole has an inclination of ca 59° (the calibration is made in a vertical pipe). For the same reason (flow close to measurement limit) the downward extent of the anomaly at c. 85 m is a bit difficult to determine but a reason-able guess is that the extent is quite limited, probably less than 0.5 m. A superficial anomaly is interpreted at 1�.5–14.5 m borehole length although the two uppermost measurements show decreasing flow rates. Decreasing flow rates near the casing have been observed in many boreholes and is probably an effect of the upper part of the logging device being located in the wider casing.
The results of the flow logging in borehole HFM�4 are presented in Table 6-10 below. The corrected measured inflow at the identified flow anomalies (dQicorr) and their estimated percentage of the total flow is shown. The transmissivity of individual flow anomalies (Ti) was calculated from Equation (5-4) using the corrected flow values (se above) and the cumulative transmissivity (TF(L)) from Equation (5-5). The transmissivity for the entire borehole used in Equation (5-4) and (5-5) was taken from the transient evaluation of the recovery of the pumping test (cf. Section 6.�.2). An estimation of the transmissivity of the interpreted flow anomalies was also made by calculating the specific flows (dQi/sFL).
Figure 6-8 presents the cumulative transmissivity TF(L) along the borehole length (L) from the flow logging calculated from Equation (5-5). Since the width of the flow anomaly in the borehole is not known in detail, the change in transmissivity at the anomalies is represented by a sloping line across the anomaly. The estimated threshold value of T and the total transmissivity of the borehole are also presented in the figure, cf. Section 5.4.2.
Table 6-10. Results of the flow logging in borehole HFM34. QTcorr = corrected cumulative flow at the top of the logged interval, T = transmissivity from the pumping test, sFL = drawdown during flow logging and Qp = pumped flow rate from borehole.
Flow anomalies T=1.1∙10–3
(m2/s)sFL= 0.5 m Qp=1.16∙10–3
(m3/s)
Interval (m b ToC) B.h. length (m)
dQicorr (m3/s)
Ti (m2/s)
dQicorr/sFL (m2/s)
dQicorr/Qp (%)
Supporting information
13.5–14.5 1.0 6.7∙10–05 6.3∙10–05 1.3∙10–04 5.815.5–17.5 2.0 8.8∙10–04 8.3 ∙10–04 1.7∙10–03 75.5 EC
76.5–78.0 1.5 3.3∙10–05 3.2∙10–05 6.6∙10–05 2.984.5–85.0 6.5 5.0∙10–05 4.8∙10–05 9.9∙10–05 4.3 EC
120–120.5 0.5 1.3∙10–04 1.3∙10–04 2.6∙10–04 11.5 EC
Total 1.2·10–03 1.1·10–03 2.3·10–03 100

40
Figure 6-8. Calculated, cumulative transmissivity along the flow logged interval of borehole HFM34. The total borehole transmissivity was calculated from the pumping test during flow logging.
6.4.3 Borehole HFM35General test data for the flow logging in borehole HFM�5 are presented in Table 6-11.
Comments on test
Depending on a malfunctioning impeller in the flow logging probe no borehole flow rate could be detected during the ordinary flow logging procedure, lifting the probe in fixed steps from the bottom to the top of the borehole. Instead an alternative method with measurements during continuous lowering was used (see Sections �.� and 5.2.2). A disadvantage with this method is that the results will be more scattered, to a certain degree though, compensated by the fact that many more values are collected.

41
Table 6-11. General test data, groundwater level and flow data for the flow logging in borehole HFM35.
General test data
Borehole HFM35Test type(s) 1 6, L-EC, L-TeTest section: Open borehole Test No 1Field crew E. Walger, and J. Harrström, GEOSIGMA ABTest equipment system HTHBGeneral comments Single pumping borehole
Nomenclature Unit Value
Borehole length m 200.8Pump position (lower level) m 18.1Flow logged section – Secup m 20.0Flow logged section – Seclow m 191.0Test section diameter 2∙rw mm top 138.0
bottom 135.6 Start of flow period yymmdd hh:mm 060704 09:39Start of flow logging yymmdd hh:mm 060704 15:40Stop of flow logging yymmdd hh:mm 060704 17:27Stop of flow period yymmdd hh:mm 060704 20:03
Groundwater level Nomen-clature
Unit G.w-level (m b ToC)
G.w-level (m.a.s.l.) 2
Groundwater level in borehole, at undisturbed conditions, open hole hi m 6.86 –3.99Groundwater level (steady state) in borehole, at pumping rate Qp hp mDrawdown during flow logging at pumping rate Qp sFL m
Flow data Nomen-clature
Unit Flow rate
Pumping rate at surface Qp m3/s 6.66∙10–4
Corrected flow rate at Secup at pumping rate Qp QTcorr m3/s 5.67∙10–4
Threshold value for borehole flow rate during flow logging QMeasl m3/s –3
Minimal change of borehole flow rate to detect flow anomaly dQAnom m3/s –3
1) 6: Flow logging-Impeller, L-EC: EC-logging, L-TE: temperature logging.2) Calculated from the manual measurements of groundwater level.3) Due to a defective impeller in the flow logging device an alternative method with continuous lowering of the probe was used. The threshold value and the detection flow rate should then be almost the same, however not determined for this method.
A calibration of the flow impeller, made after the test campaign, showed that the threshold value was more than 4 times greater than normal. Despite from this the linearity was still very good, implying that the results from the continuous logging could be used also to achieve estimations on borehole flow rates and transmissivity.
The logged electric conductivity and temperature are used as supporting information when interpreting flow anomalies.
Logging results
The nomenclature used for the flow logging is according to the methodology description for flow logging. The measured flow distribution along the borehole during the flow logging together with the electric conductivity (EC) and temperature of the borehole fluid are presented in Figure 6-9.

42
The method for correction of borehole flow rates for decreasing borehole diameter with depth was made in a slightly different way than normal but with the principles as described in Section 5.4.2. In this case, it was not possible to extend the flow logging to the lower end of the casing and therefore a complementary pumping test above a packer at the highest flow logged level was performed. Therefore, to achieve actual borehole flow rates and to calculate transmis-sivity values for the individual flow anomalies, method 2 in Section 5.4.2 was used.
Figure 6-9 shows five detected inflows in the flow logged interval between 20 and 195 m borehole length. Four inflows are supported by the temperature measurements, and for two of the inflows also changes in electric conductivity can be seen.
Figure 6-9. Corrected inflow distribution together with temperature compensated electrical conductiv-ity and temperature of the borehole fluid along borehole HMF35 during flow logging.
0
10
20
30
40
50
60
70
80
90
100
110
120
130
140
150
160
170
180
190
200
6.4 6.6 6.8
Tem perature (°C)
0
10
20
30
40
50
60
70
80
90
100
110
120
130
140
150
160
170
180
190
200
800 900 1000 1100 1200
El. Cond. (mS/m)
0
10
20
30
40
50
60
70
80
90
100
110
120
130
140
150
160
170
180
190
200
0 10 20 30 40Flow in bh
L/min
BH
Leng
th (m
bel
ow T
OC
)
Casing end = 12 m
Flow loggning in HFM 35
Q FT = 34.0 L/min
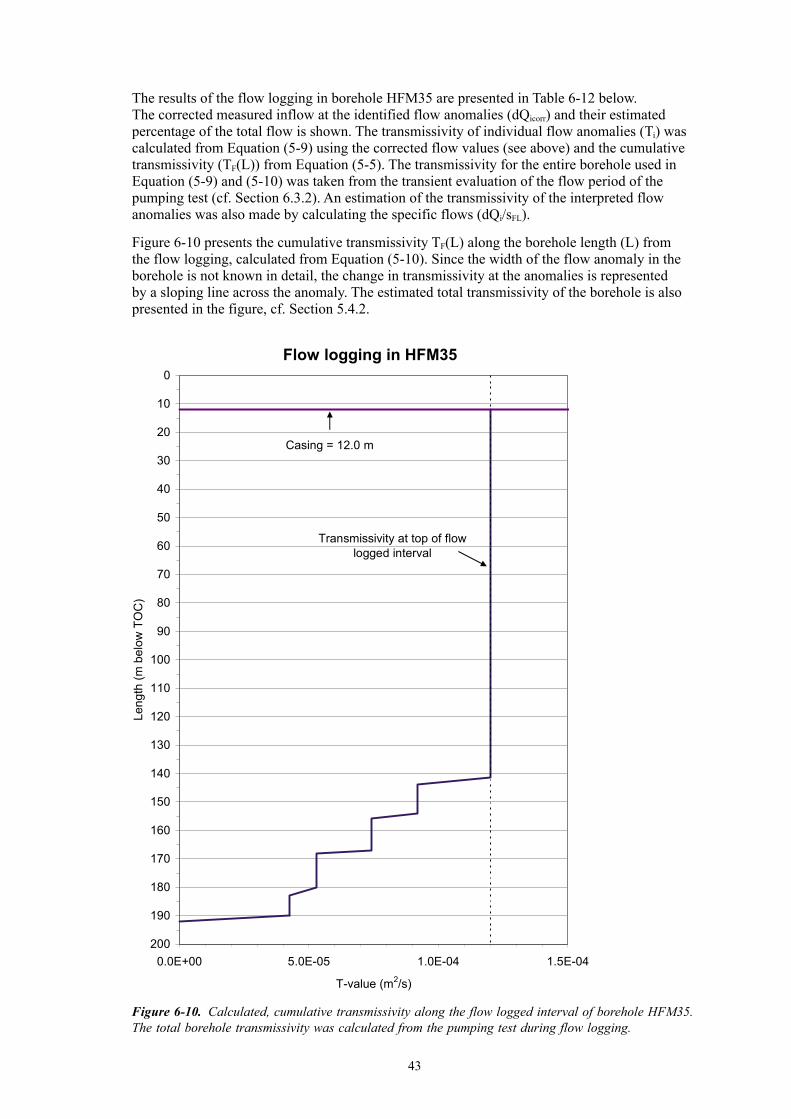
4�
The results of the flow logging in borehole HFM�5 are presented in Table 6-12 below. The corrected measured inflow at the identified flow anomalies (dQicorr) and their estimated percentage of the total flow is shown. The transmissivity of individual flow anomalies (Ti) was calculated from Equation (5-9) using the corrected flow values (see above) and the cumulative transmissivity (TF(L)) from Equation (5-5). The transmissivity for the entire borehole used in Equation (5-9) and (5-10) was taken from the transient evaluation of the flow period of the pumping test (cf. Section 6.�.2). An estimation of the transmissivity of the interpreted flow anomalies was also made by calculating the specific flows (dQi/sFL).
Figure 6-10 presents the cumulative transmissivity TF(L) along the borehole length (L) from the flow logging, calculated from Equation (5-10). Since the width of the flow anomaly in the borehole is not known in detail, the change in transmissivity at the anomalies is represented by a sloping line across the anomaly. The estimated total transmissivity of the borehole is also presented in the figure, cf. Section 5.4.2.
Figure 6-10. Calculated, cumulative transmissivity along the flow logged interval of borehole HFM35. The total borehole transmissivity was calculated from the pumping test during flow logging.
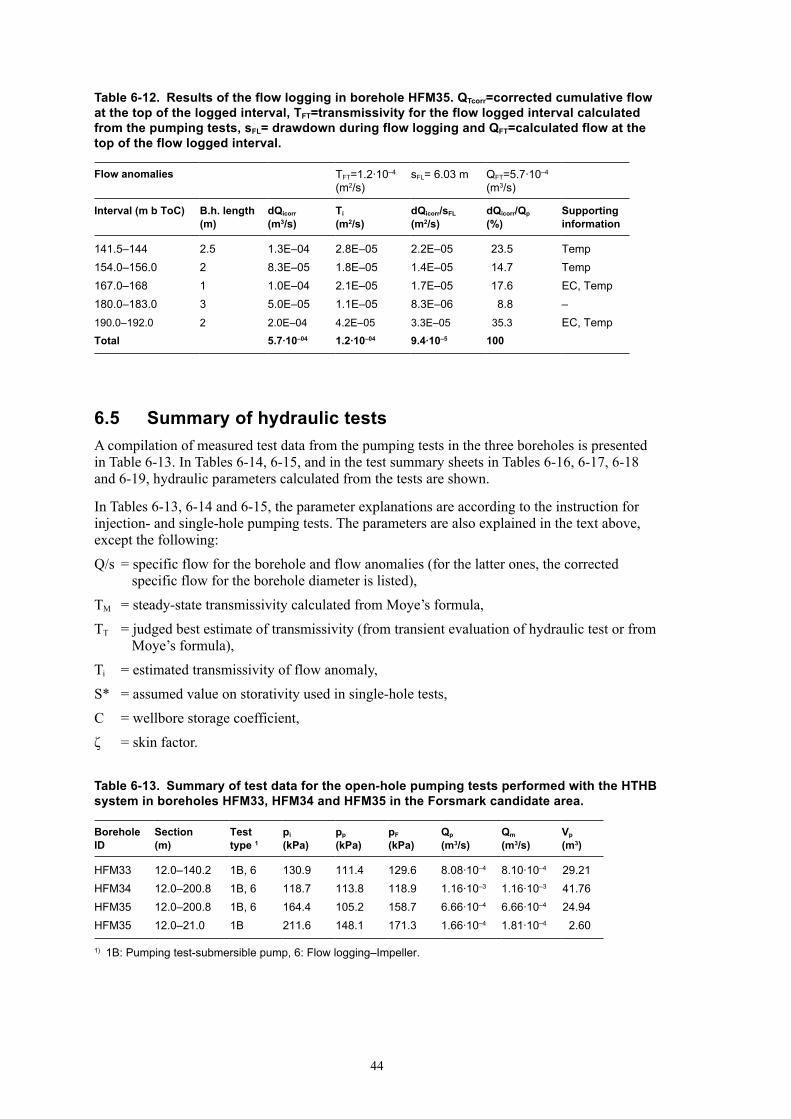
44
Table 6-12. Results of the flow logging in borehole HFM35. QTcorr=corrected cumulative flow at the top of the logged interval, TFT=transmissivity for the flow logged interval calculated from the pumping tests, sFL= drawdown during flow logging and QFT=calculated flow at the top of the flow logged interval.
Flow anomalies TFT=1.2∙10–4
(m2/s)sFL= 6.03 m QFT=5.7∙10–4
(m3/s)
Interval (m b ToC) B.h. length (m)
dQicorr (m3/s)
Ti (m2/s)
dQicorr/sFL (m2/s)
dQicorr/Qp (%)
Supporting information
141.5–144 2.5 1.3E–04 2.8E–05 2.2E–05 23.5 Temp154.0–156.0 2 8.3E–05 1.8E–05 1.4E–05 14.7 Temp167.0–168 1 1.0E–04 2.1E–05 1.7E–05 17.6 EC, Temp180.0–183.0 3 5.0E–05 1.1E–05 8.3E–06 8.8 –190.0–192.0 2 2.0E–04 4.2E–05 3.3E–05 35.3 EC, TempTotal 5.7·10–04 1.2·10–04 9.4·10–5 100
6.5 Summary of hydraulic tests A compilation of measured test data from the pumping tests in the three boreholes is presented in Table 6-1�. In Tables 6-14, 6-15, and in the test summary sheets in Tables 6-16, 6-17, 6-18 and 6-19, hydraulic parameters calculated from the tests are shown.
In Tables 6-1�, 6-14 and 6-15, the parameter explanations are according to the instruction for injection- and single-hole pumping tests. The parameters are also explained in the text above, except the following:
Q/s = specific flow for the borehole and flow anomalies (for the latter ones, the corrected specific flow for the borehole diameter is listed),
TM = steady-state transmissivity calculated from Moye’s formula,
TT = judged best estimate of transmissivity (from transient evaluation of hydraulic test or from Moye’s formula),
Ti = estimated transmissivity of flow anomaly,
S* = assumed value on storativity used in single-hole tests,
C = wellbore storage coefficient,
ζ = skin factor.
Table 6-13. Summary of test data for the open-hole pumping tests performed with the HTHB system in boreholes HFM33, HFM34 and HFM35 in the Forsmark candidate area.
Borehole ID
Section (m)
Test type 1
pi (kPa)
pp (kPa)
pF (kPa)
Qp (m3/s)
Qm (m3/s)
Vp (m3)
HFM33 12.0–140.2 1B, 6 130.9 111.4 129.6 8.08∙10–4 8.10∙10–4 29.21HFM34 12.0–200.8 1B, 6 118.7 113.8 118.9 1.16∙10–3 1.16∙10–3 41.76HFM35 12.0–200.8 1B, 6 164.4 105.2 158.7 6.66∙10–4 6.66∙10–4 24.94HFM35 12.0–21.0 1B 211.6 148.1 171.3 1.66∙10–4 1.81∙10–4 2.60
1) 1B: Pumping test-submersible pump, 6: Flow logging–Impeller.

45
Table 6-14. Summary of calculated hydraulic parameters of the formation from the hydraulic tests performed with the HTHB system in boreholes HFM33, HFM34 and HFM35 in the Forsmark candidate area.
Borehole ID
Section (m)
Flow Anomaly interval (m)
Test type 1
Q/s (m2/s)
TM (m2/s)
TT (m2/s)
Ti (m2/s)
HFM33 12.0–140.2 1B 4.1∙10–4 5.1∙10–4 4.7∙10–4
HFM33 12.0–137.0 (f) 136.0–136.5 6 4.1∙10–4 4.7∙10–4
HFM34 12.0–200.8 1B 2.3∙10–3 3.0∙10–3 1.1∙10–3
HFM34 12.0–195.0 (f) 13.5–14.5 6 1.3∙10–4 6.3∙10–5
HFM34 12.0–195.0 (f) 15.5–17.5 6 1.7∙10–3 8.3∙10–4
HFM34 12.0–195.0 (f) 76.5–78.0 6 6.6∙10–5 3.2∙10–5
HFM34 12.0–195.0 (f) 84.5–91.0 6 9.9∙10–5 4.8∙10–5
HFM34 12.0–195.0 (f) 105.5–106.0 6 2.6∙10–4 1.3∙10–4
HFM35 12.0–200.8 1B 1.1∙10–4 1.4∙10–4 1.6∙10–4
HFM35 12.0–21.0 1B 2.6∙10–5 2.2∙10–5 2.2∙10–5
HFM35 20.0–191.0 (f) 141.5–144 6 2.2∙10–05 2.8∙10–5
HFM35 20.0–191.0 (f) 154.0–156.0 6 1.4∙10–05 1.8∙10–5
HFM35 20.0–191.0 (f) 167.0–168 6 1.7∙10–05 2.1∙10–5
HFM35 20.0–191.0 (f) 180.0–183.0 6 8.3∙10–06 1.1∙10–5
HFM35 20.0–191.0 (f) 190.0–192.0 6 3.3∙10–05 4.2∙10–5
1) 1B: Pumping test-submersible pump, 6: Flow logging–Impeller.(f) Flowlogged interval.
Table 6-15. Summary of calculated hydraulic parameters from the hydraulic tests performed with the HTHB system in boreholes HFM33, HFM34 and HFM35 in the Forsmark candidate area.
Borehole ID
Section (m)
Test type1)
S* (–)
C2)
(m3/Pa)ζ (–)
HFM33 12.0–140.2 1B 1.4∙10–5 2.2∙10–6 –3.4HFM34 12.0–200.8 1B 2.3∙10–5 2.2∙10–6 –6.3HFM35 12.0–200.8 1B 6.0∙10–6 2.3∙10–6 –3.7
HFM35 12.0–21.0 1B 3.5∙10–6 2.2∙10–6 –3.2
1) 1B: Pumping test-submersible pump.2) When the fictive casing radius r(c) can be obtained from the parameter estimation in the transient analyses, C is calculated according to Equation 5-2. Otherwise the geometrical value of C is presented.
Appendix � includes the result tables delivered to the database SICADA. The lower measure-ment limit for the pumping tests with the HTHB system, presented in the result tables, is expressed in terms of specific flow (Q/s). For pumping tests, the practical lower limit is based on the minimum flow rate for which the system is designed (5 L/min) and an estimated maxi-mum allowed drawdown for practical purposes (c. 50 m) in a percussion borehole, cf. Table 4-1. These values correspond to a practical lower measurement limit (Q/s-L) of 2⋅10–6 m2/s of the pumping tests.
Similarly, the practical, upper measurement limit of the HTHB-system is estimated from the maximal flow rate (c. 80 L/min) and a minimal drawdown of c. 0.5 m, which is considered significant in relation to e.g. background fluctuations of the pressure before and during the test. These values correspond to an estimated, practical upper measurement limit (Q/s-U) of 2⋅10–� m2/s for pumping tests.

46
Table 6-16. Test Summary Sheet for the pumping test in HFM33, section 12.0–140.2 m.
ξ ξ
ξ

47
Table 6-17. Test Summary Sheet for the pumping test in HFM34 section 12.0–200.8 m.
ξ ξ
ξ

48
Table 6-18. Test Summary Sheet for the pumping test in HFM35, section 12.0–200.8 m.
ξ ξ
ξ

49
Table 6-19. Test Summary Sheet for the pumping test in HFM35, section 12.0–21.0 m.
ξ ξ
ξ

51
7 References
/1/ AlménK-E,AnderssonJ-E,CarlssonL,HanssonK,LarssonN-Å,1986. Hydraulic testing in crystalline rock. A comparative study of single-hole test methods. SKB Technical Report 86-27, Svensk Kärnbränslehantering AB.
/2/ MorosiniM,AlménK-E,FollinS,HanssonK,LudvigsonJ-EandRhénI,2001.Metoder och utrustningar för hydrauliska enhålstester. Metod och programaspekter för geovetenskapliga platsundersökningar. Tekniskt Dokument TD-01-6�, Svensk Kärnbränslehantering AB.
/�/ Dougherty,DEandDKBabu,1984.Flow to a partially penetrating well in a double-porosity reservoir, Water Resour. Res., 20 (8), 1116–1122.
/4/ RhénI(ed),GustafsonG,StanforsR,WikbergP,1997. Äspö HRL – Geoscientific evaluation 1997/5. Models based on site characterization 1986–1995. SKB TR 97-06, Svensk Kärnbränslehantering AB.
/5/ GringartenAC,RameyHJ,1974.Unsteady state pressure distribution created by a well with a single horizontal fracture, partial penetration or restricted entry. Soc. Petrol. Engrs. J, pp 41�-426.
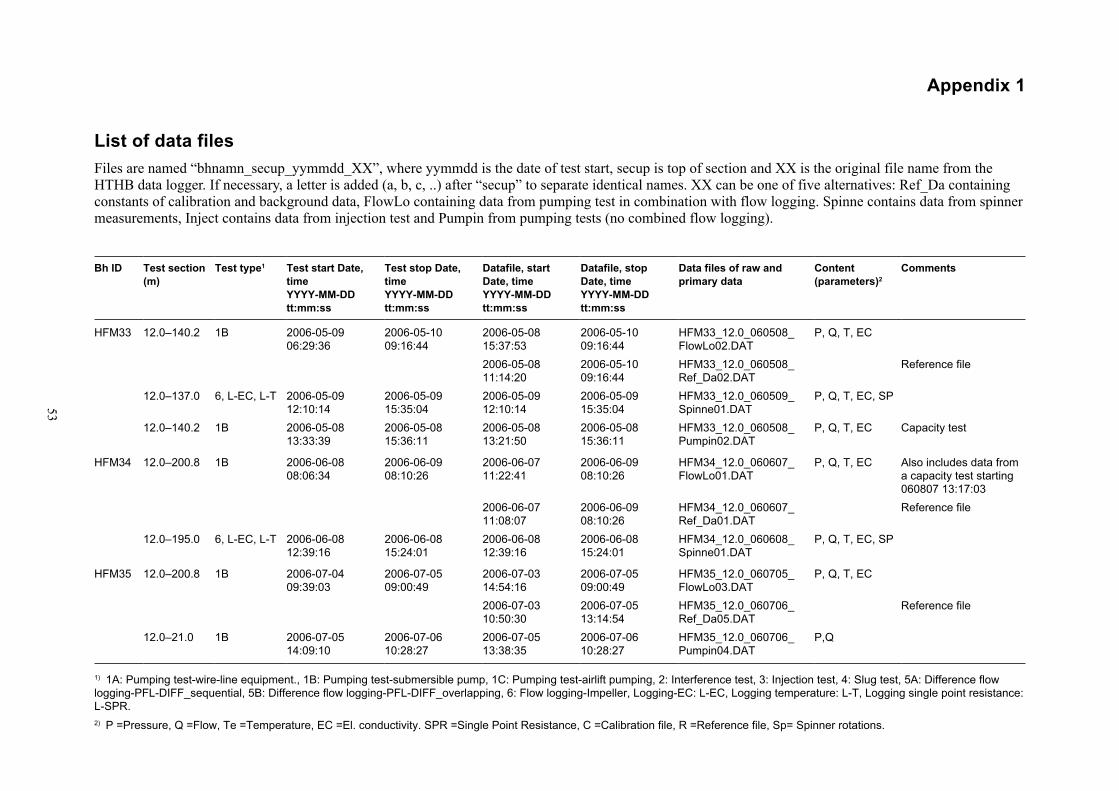
5�
Appendix 1
List of data filesFiles are named “bhnamn_secup_yymmdd_XX”, where yymmdd is the date of test start, secup is top of section and XX is the original file name from the HTHB data logger. If necessary, a letter is added (a, b, c, ..) after “secup” to separate identical names. XX can be one of five alternatives: Ref_Da containing constants of calibration and background data, FlowLo containing data from pumping test in combination with flow logging. Spinne contains data from spinner measurements, Inject contains data from injection test and Pumpin from pumping tests (no combined flow logging).
Bh ID Test section (m)
Test type1 Test start Date, time YYYY-MM-DD tt:mm:ss
Test stop Date, time YYYY-MM-DD tt:mm:ss
Datafile, start Date, time YYYY-MM-DD tt:mm:ss
Datafile, stop Date, time YYYY-MM-DD tt:mm:ss
Data files of raw and primary data
Content (parameters)2
Comments
HFM33 12.0–140.2 1B 2006-05-09 06:29:36
2006-05-10 09:16:44
2006-05-08 15:37:53
2006-05-10 09:16:44
HFM33_12.0_060508_FlowLo02.DAT
P, Q, T, EC
2006-05-08 11:14:20
2006-05-10 09:16:44
HFM33_12.0_060508_Ref_Da02.DAT
Reference file
12.0–137.0 6, L-EC, L-T 2006-05-09 12:10:14
2006-05-09 15:35:04
2006-05-09 12:10:14
2006-05-09 15:35:04
HFM33_12.0_060509_Spinne01.DAT
P, Q, T, EC, SP
12.0–140.2 1B 2006-05-08 13:33:39
2006-05-08 15:36:11
2006-05-08 13:21:50
2006-05-08 15:36:11
HFM33_12.0_060508_Pumpin02.DAT
P, Q, T, EC Capacity test
HFM34 12.0–200.8 1B 2006-06-08 08:06:34
2006-06-09 08:10:26
2006-06-07 11:22:41
2006-06-09 08:10:26
HFM34_12.0_060607_FlowLo01.DAT
P, Q, T, EC Also includes data from a capacity test starting 060807 13:17:03
2006-06-07 11:08:07
2006-06-09 08:10:26
HFM34_12.0_060607_Ref_Da01.DAT
Reference file
12.0–195.0 6, L-EC, L-T 2006-06-08 12:39:16
2006-06-08 15:24:01
2006-06-08 12:39:16
2006-06-08 15:24:01
HFM34_12.0_060608_Spinne01.DAT
P, Q, T, EC, SP
HFM35 12.0–200.8 1B 2006-07-04 09:39:03
2006-07-05 09:00:49
2006-07-03 14:54:16
2006-07-05 09:00:49
HFM35_12.0_060705_FlowLo03.DAT
P, Q, T, EC
2006-07-03 10:50:30
2006-07-05 13:14:54
HFM35_12.0_060706_Ref_Da05.DAT
Reference file
12.0–21.0 1B 2006-07-05 14:09:10
2006-07-06 10:28:27
2006-07-05 13:38:35
2006-07-06 10:28:27
HFM35_12.0_060706_Pumpin04.DAT
P,Q
1) 1A: Pumping test-wire-line equipment., 1B: Pumping test-submersible pump, 1C: Pumping test-airlift pumping, 2: Interference test, 3: Injection test, 4: Slug test, 5A: Difference flow logging-PFL-DIFF_sequential, 5B: Difference flow logging-PFL-DIFF_overlapping, 6: Flow logging-Impeller, Logging-EC: L-EC, Logging temperature: L-T, Logging single point resistance: L-SPR.2) P =Pressure, Q =Flow, Te =Temperature, EC =El. conductivity. SPR =Single Point Resistance, C =Calibration file, R =Reference file, Sp= Spinner rotations.

55
Appendix 2
Test diagramsNomenclature in AQTESOLV:T = transmissivity (m2/s)S = storativity (–)KZ/Kr = ratio of hydraulic conductivities in the vertical and radial direction (set to 1)Sw = skin factorr(w) = borehole radius (m)r(c) = effective casing radius (m)Kr = hydraulic conductivity, radial direction (m/s)Ss = specific storage (1/m)Rf = fracture radius (m)
Pumping test in HFM33: 12.0–140.2 m
Figure A2-1. Linear plot of flow rate (Q) and pressure (P) versus time during the open-hole pumping test in HFM33 in conjunction with flow logging.

56
Figure A2-2. Log-log plot of drawdown (blue □) and drawdown derivative (black +) versus time dur-ing the open-hole pumping test in HFM33.
Figure A2-3. Lin-log plot of drawdown (blue □) and drawdown derivative (black +) versus time dur-ing the open-hole pumping test in HFM33.
HFM33: Pumping test 12.0 - 140.2 m, in conjunction with flow logging
10-2
10-1
100
101
102
1030.
0.5
1.
1.5
2.
2.5
Time (min)
Dra
wd
own
(m)
Obs. Wells
HFM33
Aquifer Model
Confined
Solution
Dougherty-Babu
Parameters
T = 0.0004724 m 2/secS = 1.38E-5Kz/Kr = 1.Sw = -3.368r(w) = 0.07234 mr(c) = 0.08317 m

57
Figure A2-4. Log-log plot of pressure recovery (blue □) and -derivative (black +) versus equivalent time (dte) from the open-hole pumping test in HFM33.
Figure A2-5. Lin-log plot of pressure recovery (blue □) and -derivative (black +) versus equivalent time (dte) from the open-hole pumping test in HFM33.
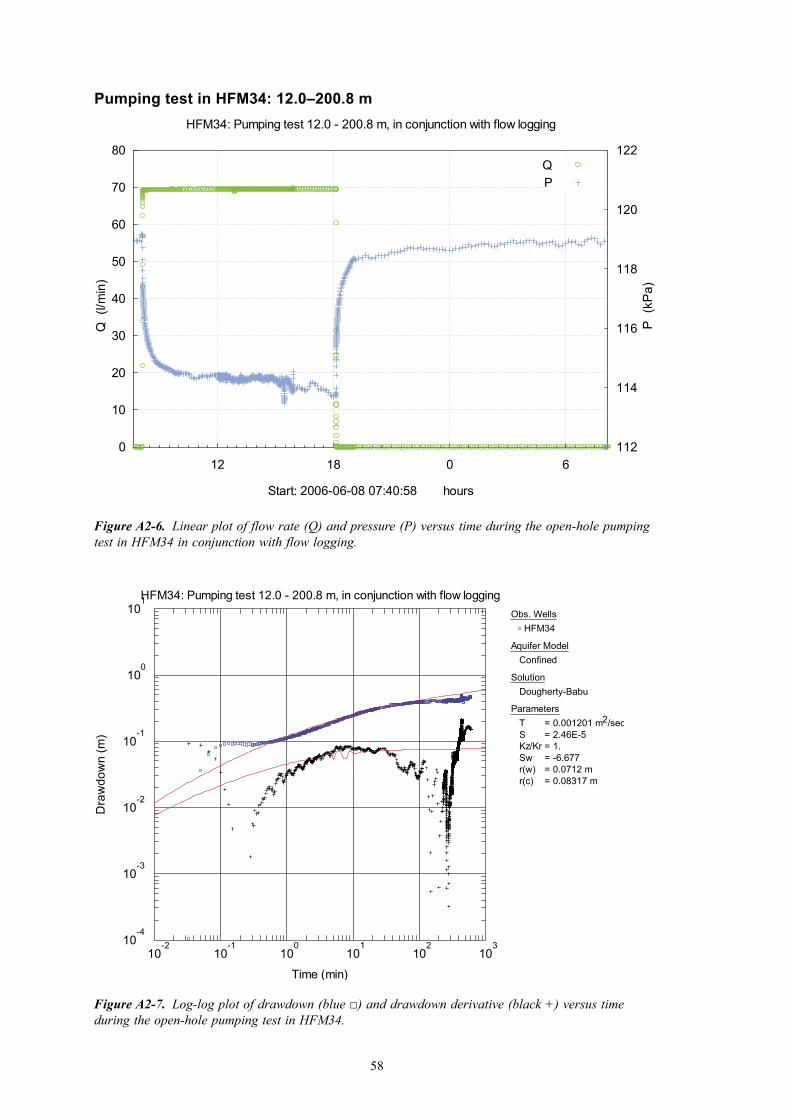
58
Pumping test in HFM34: 12.0–200.8 m
Figure A2-6. Linear plot of flow rate (Q) and pressure (P) versus time during the open-hole pumping test in HFM34 in conjunction with flow logging.
Figure A2-7. Log-log plot of drawdown (blue □) and drawdown derivative (black +) versus time during the open-hole pumping test in HFM34.

59
Figure A2-8. Lin-log plot of drawdown (blue □) and drawdown derivative (black +) versus time during the open-hole pumping test in HFM34.
Figure A2-9. Log-log plot of pressure recovery (blue □) and -derivative (black +) versus equivalent time (dte) from the open-hole pumping test in HFM34.

60
Pumping test in HFM35: 12.0–200.8 m
Figure A2-10. Lin-log plot of pressure recovery (blue □) and -derivative (black +) versus equivalent time (dte) from the open-hole pumping test in HFM34.
Figure A2-11. Linear plot of flow rate (Q) and pressure (P) versus time during the open-hole pumping test in HFM35.
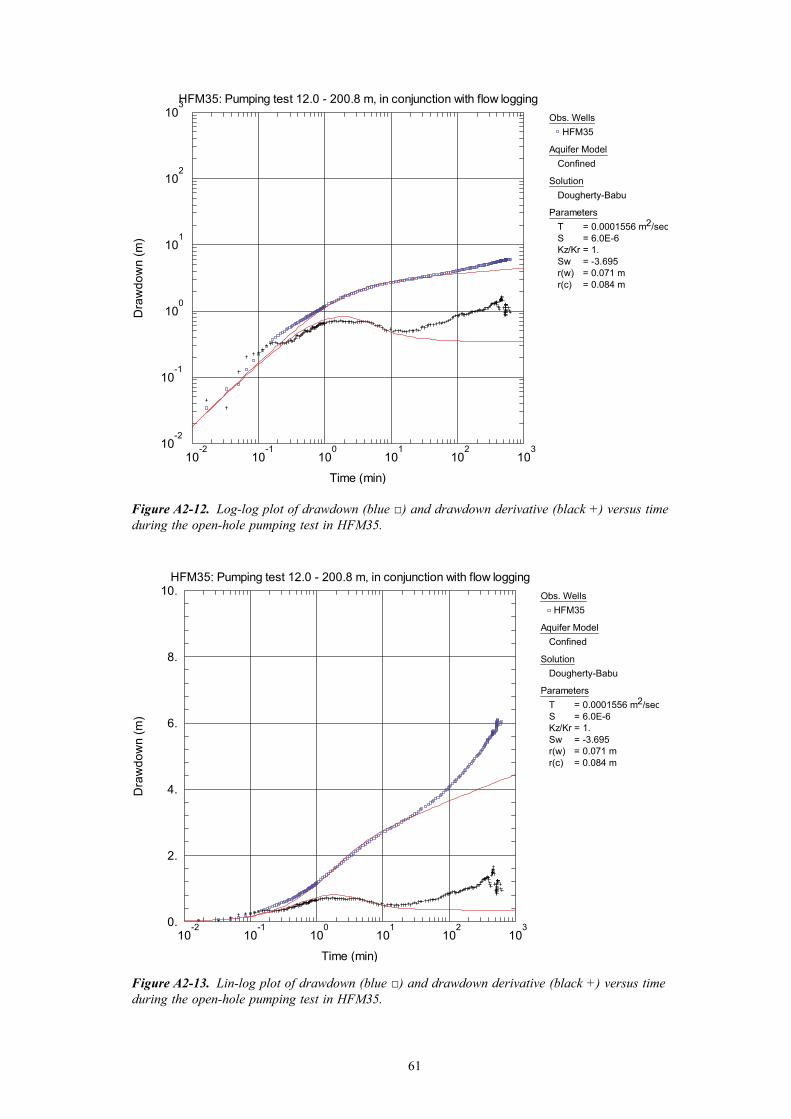
61
Figure A2-12. Log-log plot of drawdown (blue □) and drawdown derivative (black +) versus time during the open-hole pumping test in HFM35.
Figure A2-13. Lin-log plot of drawdown (blue □) and drawdown derivative (black +) versus time during the open-hole pumping test in HFM35.

62
Figure A2-14. Log-log plot of pressure recovery (blue □) and -derivative (black +) versus equivalent time (dte) from the open-hole pumping test in HFM35.
Figure A2-15. Lin-log plot of pressure recovery (blue □) and -derivative (black +) versus equivalent time (dte) from the open-hole pumping test in HFM35.
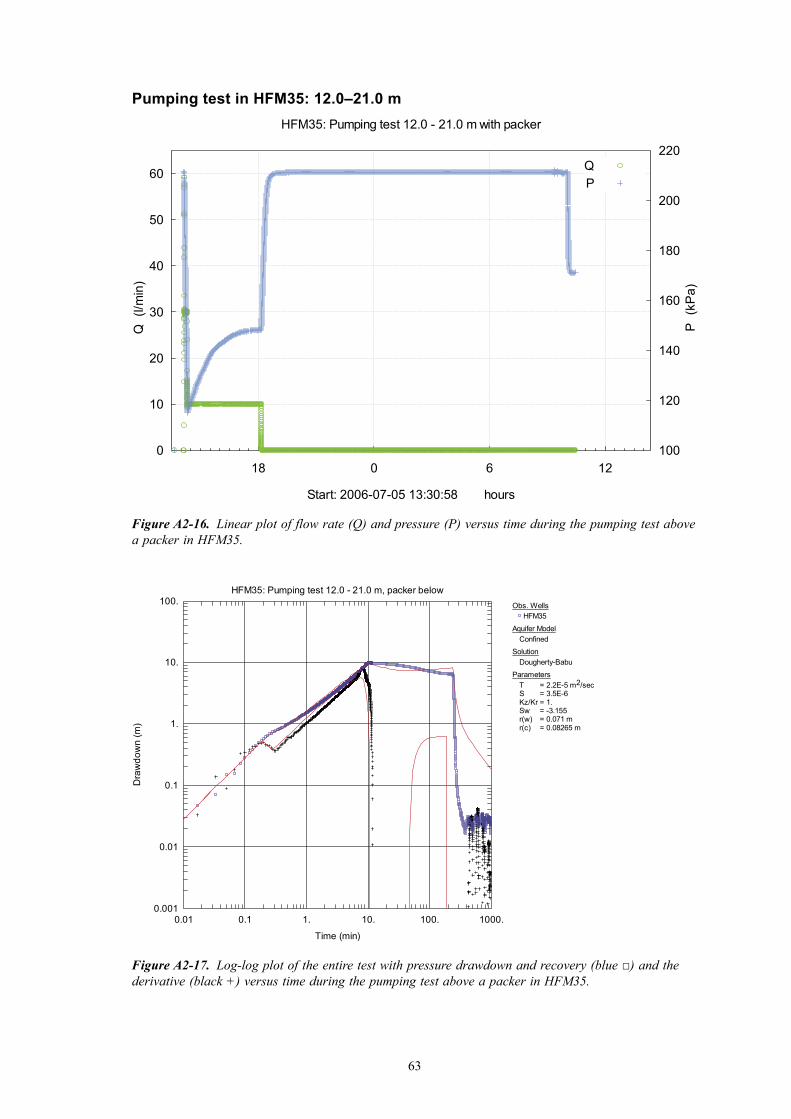
6�
Pumping test in HFM35: 12.0–21.0 m
Figure A2-16. Linear plot of flow rate (Q) and pressure (P) versus time during the pumping test above a packer in HFM35.
Figure A2-17. Log-log plot of the entire test with pressure drawdown and recovery (blue □) and the derivative (black +) versus time during the pumping test above a packer in HFM35.

64
Figure A2-18. Lin-log plot of the entire test with pressure drawdown and recovery (blue □) and the derivative (black +) versus time during the pumping test above a packer in HFM35.

65
Appendix 3
Result tables to Sicada databaseA. Result table for single-hole tests for submission to the Sicada databaseSINGLEHOLE TESTS, Pumping and injection, plu_s_hole_test_d; General information.
idcode start_date stop_date secup (m)
seclow (m)
section_no
test_type
formation_type
start_flow_period (yyyymmdd)
stop_flow_period (yyyymmdd)
flow_rate_end_qp (m**3/s)
value_type_qp
HFM33 060509 06:25:19 060510 09:16:44 12.0 140.2 1B 1 060509 06:29:33 060509 16:30:40 8.08E–04 0HFM34 060608 08:06:34 060609 08:10:26 12.0 200.8 1B 1 060608 08:07:57 060608 18:08:17 1.16E–03 0
HFM35 060704 09:32:29 060704 09:00:49 12.0 200.8 1B 1 060704 09:39:03 060704 20:03:01 6.66E–04 0HFM35 060705 14:06:50 060705 18:15:45 12.0 21.0 1B 1 060705 14:09:10 060705 18:09:01 1.66E–04 0
cont.
mean_flow_rate_qm (m**3/s)
q_measl__l (m**3/s)
q_measl__u (m**3/s)
tot_volume_vp (m**3)
dur_flow_phase_tp (s)
dur_rec_phase_tf (s)
initial_head_hi (m)
head_at_flow_end_hp (m)
final_head_hf (m)
initial_press_pi (kPa)
press_at_flow_end_pp (kPa)
final_press_pf (kPa)
1.81E–04 8.33E–05 1.33E–03 2.92E+01 36,060 60,360 –0.60 –2.61 –0.68 130.9 111.4 129.66.66E–04 8.33E–05 1.33E–03 4.18E+01 36,000 50,520 –0.27 –0.81 118.7 113.8 118.9
1.16E–03 8.33E–05 1.33E–03 2.49E+01 37,440 46,620 –3.99 –4.68 –4.68 164.4 105.2 158.78.10E–04 8.33E–05 1.33E–03 2.60E+00 14,400 58,740 –0.79 –0.75 211.6 148.08 171.30
cont.
fluid_temp_tew (oC)
fluid_elcond_ecw (mS/m)
fluid_salinity_tdsw (mg/l)
fluid_salinity_tdswm (mg/l)
reference comments lp (m)
13618
16717

66
Column Datatype Unit Column description
Site CHAR Investigation site nameActivity_type CHAR Activity type code
start_date DATE Date (yymmdd hh:mm:ss)stop_date DATE Date (yymmdd hh:mm:ss)Project CHAR Project codeIdcode CHAR Object or borehole identification codeSecup FLOAT m Upper section limit (m)Seclow FLOAT m Lower section limit (m)Section_no INTEGER number Section numbertest_type CHAR Test type code (1–7), see table descriptionformation_type CHAR 1: Rock, 2: Soil (superficial deposits)start_flow_period DATE yyyymmdd Date & time of pumping/injection start (YYYY-MM-DD hh:mm:ss)stop_flow_period DATE yyyymmdd Date & time of pumping/injection stop (YYYY-MM-DD hh:mm:ss)flow_rate_end_qp FLOAT m**3/s Flow rate at the end of the flowing periodvalue_type_qp CHAR 0: true value, –1: <lower meas.limit, 1: >upper meas.limitmean_flow_rate_qm FLOAT m**3/s Arithmetic mean flow rate during flow periodq_measl__l FLOAT m**3/s Estimated lower measurement limit of flow rateq_measl__u FLOAT m**3/s Estimated upper measurement limit of flow ratetot_volume_vp FLOAT m**3 Total volume of pumped or injected waterdur_flow_phase_tp FLOAT s Duration of the flowing period of the testdur_rec_phase_tf FLOAT s Duration of the recovery period of the testinitial_head_hi FLOAT m Hydraulic head in test section at start of the flow periodhead_at_flow_end_hp FLOAT m Hydraulic head in test section at stop of the flow period.final_head_hf FLOAT m Hydraulic head in test section at stop of recovery period.initial_press_pi FLOAT kPa Groundwater pressure in test section at start of flow periodpress_at_flow_end_pp FLOAT kPa Groundwater pressure in test section at stop of flow period.final_press_pf FLOAT kPa Groundwater pressure at the end of the recovery period.fluid_temp_tew FLOAT oC Measured section fluid temperature, see table descriptionfluid_elcond_ecw FLOAT mS/m Measured section fluid el. conductivity, see table descr.fluid_salinity_tdsw FLOAT mg/l Total salinity of section fluid based on EC, see table descr.fluid_salinity_tdswm FLOAT mg/l Tot. section fluid salinity based on water sampling, see...reference CHAR SKB report No for reports describing data and evaluationcomments VARCHAR Short comment to dataerror_flag CHAR If error_flag = “*” then an error occured and an errorin_use CHAR If in_use = “*” then the activity has been selected asSign CHAR Activity QA signatureLp FLOAT m Hydraulic point of application
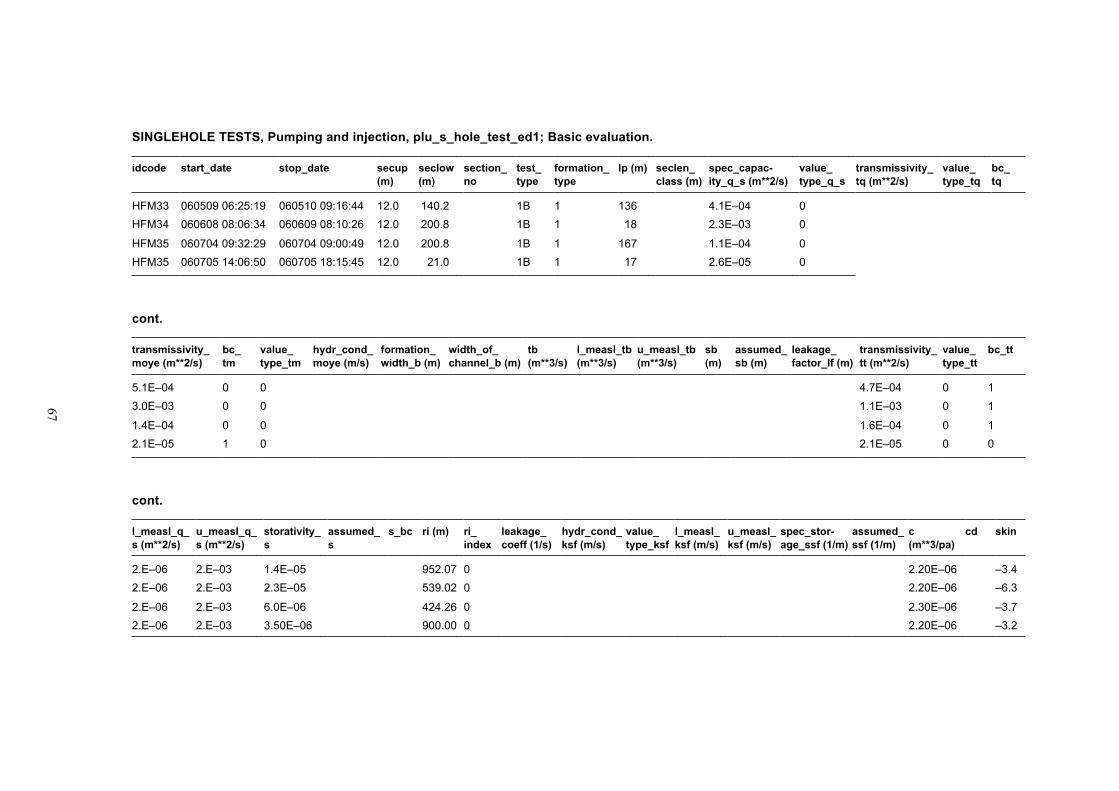
67
SINGLEHOLE TESTS, Pumping and injection, plu_s_hole_test_ed1; Basic evaluation.
idcode start_date stop_date secup (m)
seclow (m)
section_no
test_type
formation_type
lp (m) seclen_class (m)
spec_capac-ity_q_s (m**2/s)
value_type_q_s
transmissivity_tq (m**2/s)
value_type_tq
bc_tq
HFM33 060509 06:25:19 060510 09:16:44 12.0 140.2 1B 1 136 4.1E–04 0HFM34 060608 08:06:34 060609 08:10:26 12.0 200.8 1B 1 18 2.3E–03 0
HFM35 060704 09:32:29 060704 09:00:49 12.0 200.8 1B 1 167 1.1E–04 0HFM35 060705 14:06:50 060705 18:15:45 12.0 21.0 1B 1 17 2.6E–05 0
cont.
transmissivity_moye (m**2/s)
bc_tm
value_type_tm
hydr_cond_moye (m/s)
formation_width_b (m)
width_of_channel_b (m)
tb (m**3/s)
l_measl_tb (m**3/s)
u_measl_tb (m**3/s)
sb (m)
assumed_sb (m)
leakage_factor_lf (m)
transmissivity_tt (m**2/s)
value_type_tt
bc_tt
5.1E–04 0 0 4.7E–04 0 13.0E–03 0 0 1.1E–03 0 1
1.4E–04 0 0 1.6E–04 0 12.1E–05 1 0 2.1E–05 0 0
cont.
l_measl_q_s (m**2/s)
u_measl_q_s (m**2/s)
storativity_s
assumed_s
s_bc ri (m) ri_index
leakage_coeff (1/s)
hydr_cond_ksf (m/s)
value_type_ksf
l_measl_ksf (m/s)
u_measl_ksf (m/s)
spec_stor-age_ssf (1/m)
assumed_ssf (1/m)
c (m**3/pa)
cd skin
2.E–06 2.E–03 1.4E–05 952.07 0 2.20E–06 –3.42.E–06 2.E–03 2.3E–05 539.02 0 2.20E–06 –6.3
2.E–06 2.E–03 6.0E–06 424.26 0 2.30E–06 –3.72.E–06 2.E–03 3.50E–06 900.00 0 2.20E–06 –3.2

68
cont.
dt1 (s)
dt2 (s)
t1 (s) dte1 (s)
dte2 (s)
p_horner (kPa)
transmissivity_t_nlr (m**2/s)
storativ-ity_s_nlr
value_type_t_nlr
bc_t_nlr
c_nlr (m**3/pa)
cd_nlr
skin_nlr
transmissiv-ity_t_grf (m**2/s)
value_type_t_grf
bc_t_grf
storativity_s_grf
flow_dim_grf
comment (no_unit)
4,200300
00

69
Column Datatype Unit Column description
Site CHAR Investigation site nameActivity_type CHAR Activity type code
start_date DATE Date (yymmdd hh:mm:ss)stop_date DATE Date (yymmdd hh:mm:ss)Project CHAR project codeIdcode CHAR Object or borehole identification codeSecup FLOAT m Upper section limit (m)Seclow FLOAT m Lower section limit (m)Section_no INTEGER number Section numbertest_type CHAR Test type code (1–7), see table description!formation_type CHAR Formation type code. 1: Rock, 2: Soil (superficial deposits)Lp FLOAT m Hydraulic point of application for test section, see descr.seclen_class FLOAT m Planned ordinary test interval during test campaign.spec_capacity_q_s FLOAT m**2/s Specific capacity (Q/s) of test section, see table descript.value_type_q_s CHAR 0: true value, –1: Q/s<lower meas.limit,1: Q/s>upper meas.limittransmissivity_tq FLOAT m**2/s Tranmissivity based on Q/s, see table descriptionvalue_type_tq CHAR 0: true value, –1: TQ<lower meas.limit,1: TQ>upper meas.limit.bc_tq CHAR Best choice code. 1 means TQ is best choice of T, else 0transmissivity_moye FLOAT m**2/s Transmissivity,TM, based on Moye (1967)bc_tm CHAR Best choice code. 1 means Tmoye is best choice of T, else 0value_type_tm CHAR 0:true value, –1: TM<lower meas.limit, 1: TM>upper meas.limit.hydr_cond_moye FLOAT m/s K_M: Hydraulic conductivity based on Moye (1967)formation_width_b FLOAT m b: Aquifer thickness repr. for T(generally b=Lw), see descr.width_of_channel_b FLOAT m B: Inferred width of formation for evaluated TBTb FLOAT m**3/s TB: Flow capacity in 1D formation of T & width B, see descr.l_measl_tb FLOAT m**3/s Estimated lower meas. limit for evaluated TB, see descriptionu_measl_tb FLOAT m**3/s Estimated upper meas. limit of evaluated TB, see descriptionSb FLOAT m SB: S = storativity, B = width of formation,1D model, see descript.assumed_sb FLOAT m SB*: Assumed SB, S = storativity, B = width of formation, see...Leakage_factor_lf FLOAT m Lf: 1D model for evaluation of Leakage factortransmissivity_tt FLOAT m**2/s TT: Transmissivity of formation, 2D radial flow model,see...value_type_tt CHAR 0: true value, –1: TT<lower meas.limit, 1: TT>upper meas.limit,bc_tt CHAR Best choice code. 1 means TT is best choice of T, else 0l_measl_q_s FLOAT m**2/s Estimated lower meas. limit for evaluated TT, see table descru_measl_q_s FLOAT m**2/s Estimated upper meas. limit for evaluated TT, see descriptionstorativity_s FLOAT S: Storativity of formation based on 2D rad flow, see descr.assumed_s FLOAT Assumed Storativity, 2D model evaluation, see table descr.s_bc FLOAT Best choice of S (Storativity), see descr.Ri FLOAT m Radius of influenceri_index CHAR ri index = index of radius of influence: –1, 0 or 1, see descr.Leakage_coeff FLOAT 1/s K’/b’: 2D rad flow model evaluation of leakage coeff, see deschydr_cond_ksf FLOAT m/s Ksf: 3D model evaluation of hydraulic conductivity, see desc.value_type_ksf CHAR 0: true value, –1: Ksf<lower meas.limit, 1: Ksf>upper meas.limit,l_measl_ksf FLOAT m/s Estimated lower meas.limit for evaluated Ksf, see table desc.u_measl_ksf FLOAT m/s Estimated upper meas.limit for evaluated Ksf, see table descrspec_storage_ssf FLOAT 1/m Ssf: Specific storage,3D model evaluation, see table descr.assumed_ssf FLOAT 1/m Ssf*: Assumed Spec.storage,3D model evaluation, see table des.C FLOAT m**3/pa C: Wellbore storage coefficient; flow or recovery periodCd FLOAT CD: Dimensionless wellbore storage coefficient
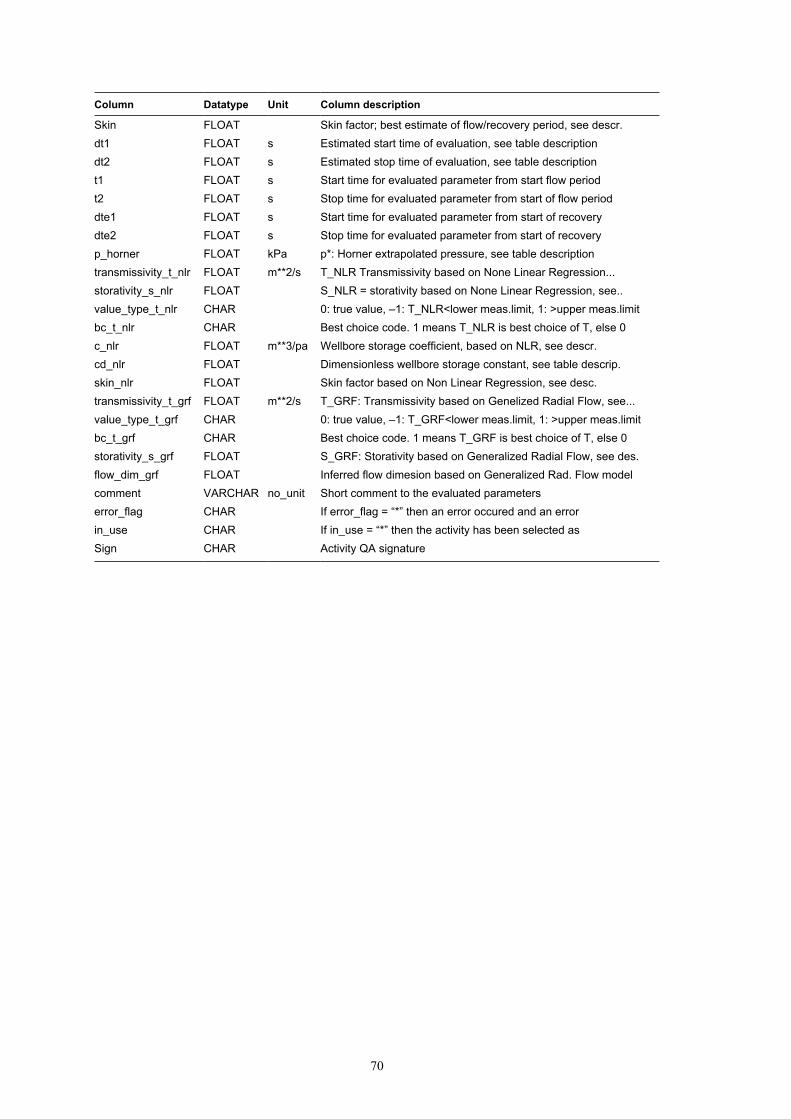
70
Column Datatype Unit Column description
Skin FLOAT Skin factor; best estimate of flow/recovery period, see descr.dt1 FLOAT s Estimated start time of evaluation, see table descriptiondt2 FLOAT s Estimated stop time of evaluation, see table descriptiont1 FLOAT s Start time for evaluated parameter from start flow periodt2 FLOAT s Stop time for evaluated parameter from start of flow perioddte1 FLOAT s Start time for evaluated parameter from start of recoverydte2 FLOAT s Stop time for evaluated parameter from start of recoveryp_horner FLOAT kPa p*: Horner extrapolated pressure, see table descriptiontransmissivity_t_nlr FLOAT m**2/s T_NLR Transmissivity based on None Linear Regression...storativity_s_nlr FLOAT S_NLR = storativity based on None Linear Regression, see..value_type_t_nlr CHAR 0: true value, –1: T_NLR<lower meas.limit, 1: >upper meas.limitbc_t_nlr CHAR Best choice code. 1 means T_NLR is best choice of T, else 0c_nlr FLOAT m**3/pa Wellbore storage coefficient, based on NLR, see descr.cd_nlr FLOAT Dimensionless wellbore storage constant, see table descrip.skin_nlr FLOAT Skin factor based on Non Linear Regression, see desc.transmissivity_t_grf FLOAT m**2/s T_GRF: Transmissivity based on Genelized Radial Flow, see...value_type_t_grf CHAR 0: true value, –1: T_GRF<lower meas.limit, 1: >upper meas.limitbc_t_grf CHAR Best choice code. 1 means T_GRF is best choice of T, else 0storativity_s_grf FLOAT S_GRF: Storativity based on Generalized Radial Flow, see des.flow_dim_grf FLOAT Inferred flow dimesion based on Generalized Rad. Flow modelcomment VARCHAR no_unit Short comment to the evaluated parameterserror_flag CHAR If error_flag = “*” then an error occured and an errorin_use CHAR If in_use = “*” then the activity has been selected asSign CHAR Activity QA signature

71
B. Result Table for Flow logging at the Forsmark site investigation for submission to the Sicada databasePlu_impeller_basic_d.
idcode start_date stop_date secup (m)
seclow (m)
section_no
start_flowlogging (yyyymmdd)
stop_flowlogging (yyyymmdd)
l (m)
test_type
formation_type
q_measl_l (m**3/s)
q_measl_u (m**3/s)
HFM33 060509 06:25:19 060510 09:16:44 12.0 137.0 2006-05-09 11:58:00 2006-05-09 15:35:00 140.20 6 1 5.0000E–05 1.3333E–03HFM34 060608 08:06:34 060609 08:10:26 12.0 195.0 2006-06-08 11:59:00 2006-06-08 15:24:00 200.80 6 1 5.0000E–05 1.3333E–03HFM35 060704 09:32:29 060705 09:00:49 20.0 191.0 2006-07-04 15:40:00 2006-07-04 17:27:00 200.80 6 1 5.0000E–05 1.3333E–03
cont.
pump_flow_q1 (m**3/s)
pump_flow_q2 (m**3/s)
dur_flow_phase_tp1 (s)
dur_flow_phase_tp2 (s)
dur_flow-log_tfl_1 (s)
dur_flow-log_tfl_2 (s)
drawdown_s1 (m)
drawdown_s2 (m)
initial_head_ho (m.a.s.l.)
hydraulic_head_h1 (m.a.s.l.)
hydraulic_head_h2 (m.a.s.l.)
reference comments
8.08E–04 36,060 13,020 1.99 –0.60 –2.591.16E–03 36,000 12,300 0.50 –0.27 –0.77
6.66E–04 37,440 6,420 6.04 –3.99 –10.03

72
Column Datatype Unit Column description
Site CHAR Investigation site namestart_date DATE Date (yymmdd hh:mm:ss)stop_date DATE Date (yymmdd hh:mm:ss)Secup FLOAT m Upper section limit (m)Seclow FLOAT m Lower section limit (m)Sign CHAR Activity QA signaturestart_flowlogging DATE yyyymmdd Date and time of flowlogging start (YYYY-MM-DD hh:mm:ss)stop_flowlogging DATE yyyymmdd Date and time of flowlogging stop (YYYY-MM-DD hh:mm:ss)L FLOAT m Corrected borehole length during logging, see table descr.test_type CHAR Type of test,(1–7); see table descriptionformation_type CHAR 1: Rock, 2: Soil (supeficial deposits)q_measl_l FLOAT m**3/s Estimated lower measurement limit of borehole flow, see des.q_measl_u FLOAT m**3/s Estimated upper measurement limit of borehole flow, see desc.pump_flow_q1 FLOAT m**3/s Flow rate at surface during flow logging period 1pump_flow_q2 FLOAT m**3/s Flow rate at surface during flow logging period 2dur_flow_phase_tp1 FLOAT s Duration of flow period 1dur_flow_phase_tp2 FLOAT s Duration of flow period 2dur_flowlog_tfl_1 FLOAT s Duration of the flowlogging survey 1dur_flowlog_tfl_2 FLOAT s Duration of the flowlogging survey 2drawdown_s1 FLOAT m Representative drawdown in borehole during flowlog period 1drawdown_s2 FLOAT m Representative drawdown in borehole during flowlog period 2initial_head_ho FLOAT m.a.s.l. Initial hydraulic head (open borehole),see table descriptionhydraulic_head_h1 FLOAT m.a.s.l. Represen. hydr.head during flow period 1, see table descr.hydraulic_head_h2 FLOAT m.a.s.l. Represen. hydr.head during flow period 2, see table descr.reference CHAR SKB report number for reports describing data & evaluationcomments VARCHAR Short comment to the evaluated parameters (optional))
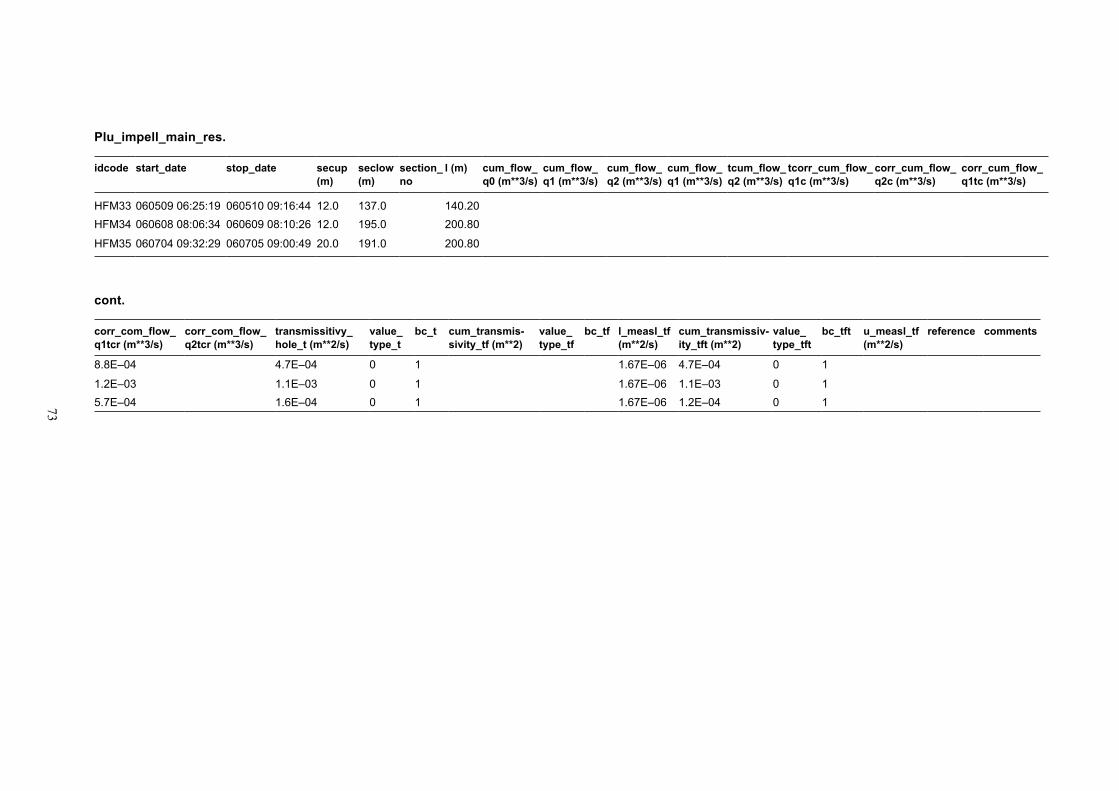
7�
Plu_impell_main_res.
idcode start_date stop_date secup (m)
seclow (m)
section_no
l (m) cum_flow_q0 (m**3/s)
cum_flow_q1 (m**3/s)
cum_flow_q2 (m**3/s)
cum_flow_q1 (m**3/s)
tcum_flow_q2 (m**3/s)
tcorr_cum_flow_q1c (m**3/s)
corr_cum_flow_q2c (m**3/s)
corr_cum_flow_q1tc (m**3/s)
HFM33 060509 06:25:19 060510 09:16:44 12.0 137.0 140.20HFM34 060608 08:06:34 060609 08:10:26 12.0 195.0 200.80
HFM35 060704 09:32:29 060705 09:00:49 20.0 191.0 200.80
cont.
corr_com_flow_q1tcr (m**3/s)
corr_com_flow_q2tcr (m**3/s)
transmissitivy_hole_t (m**2/s)
value_type_t
bc_t cum_transmis-sivity_tf (m**2)
value_type_tf
bc_tf l_measl_tf (m**2/s)
cum_transmissiv-ity_tft (m**2)
value_type_tft
bc_tft u_measl_tf (m**2/s)
reference comments
8.8E–04 4.7E–04 0 1 1.67E–06 4.7E–04 0 1
1.2E–03 1.1E–03 0 1 1.67E–06 1.1E–03 0 15.7E–04 1.6E–04 0 1 1.67E–06 1.2E–04 0 1

74
Column Datatype Unit Column description
Site CHAR Investigation site nameActivity_type CHAR Activity type code
start_date DATE Date (yymmdd hh:mm:ss)stop_date DATE Date (yymmdd hh:mm:ss)Project CHAR Project code Idcode CHAR Object or borehole identification codeSecup FLOAT m Upper section limit (m)Seclow FLOAT m Lower section limit (m)Section_no INTEGER number Section numberL FLOAT m Corrected borehole lengthcum_flow_q0 FLOAT m**3/s Undisturbed cumulative flow rate, see table descriptioncum_flow_q1 FLOAT m**3/s Cumulative flow rate at pumping flow Q1/head h1, see descr.cum_flow_q2 FLOAT m**3/s Cumulative flow rate at pumping flow Q2/head h2, see descr.cum_flow_q1t FLOAT m**3/s Cumulative flow at the top of measured interval,pump flow Q1cum_flow_q2t FLOAT m**3/s Cumulative flow at the top of measured interval,pump flow Q2corr_cum_flow_q1c FLOAT m**3/s Corrected cumulative flow q1 at pump flow Q1, see tabledescr.corr_cum_flow_q2c FLOAT m**3/s Corrected cumulative flow q2 at pump flow Q2, see tabledescr.corr_cum_flow_q1tc FLOAT m**3/s Corrected cumulative flow q1T at pump flow Q1, see...
corr_cum_flow_q2tc FLOAT m**3/s Corrected cumulative flow q2T at pump flow Q2, see...corr_com_flow_q1tcr FLOAT m**3/s Corrected q1Tc for estimated borehole radius (rwa)corr_com_flow_q2tcr FLOAT m**3/s Corrected q2Tc for estimated borehole radius (rwa)transmissitivy_hole_t FLOAT m**2/s T: Transmissivity of the entire hole, see table descriptionvalue_type_t CHAR 0: true value, –1: T<lower meas.limit, 1: T>upper meas.limitbc_t CHAR Best choice code: 1 means T is best transm. choice, else 0cum_transmissivity_tf FLOAT m**2 T_F: Cumulative transmissivity, see table descriptionvalue_type_tf CHAR 0: true value, –1: TF<lower meas.limit, 1: TF>upper meas.limitbc_tf CHAR Best choice code: 1 means TF is best transm. choice, else 0l_measl_tf FLOAT m**2/s Lower measurement limit of T_F, see table descriptioncum_transmissivity_tft FLOAT m**2 T_FT: Cumulative transmissivity, see table descriptionvalue_type_tft CHAR 0: true value, –1: TFT<lower meas.limit, 1: TFT>upper meas.limitbc_tft CHAR Best choice code: 1 means TFT is best transm. choice,else 0u_measl_tf FLOAT m**2/s Upper measurement limit of T_F, see table descriptionreference CHAR SKB number for reports describing data and resultscomments CHAR Short comment to evaluated data (optional)error_flag CHAR If error_flag = “*” then an error occured and an errorin_use CHAR If in_use = “*” then the activity has been selected asSign CHAR Activity QA signature
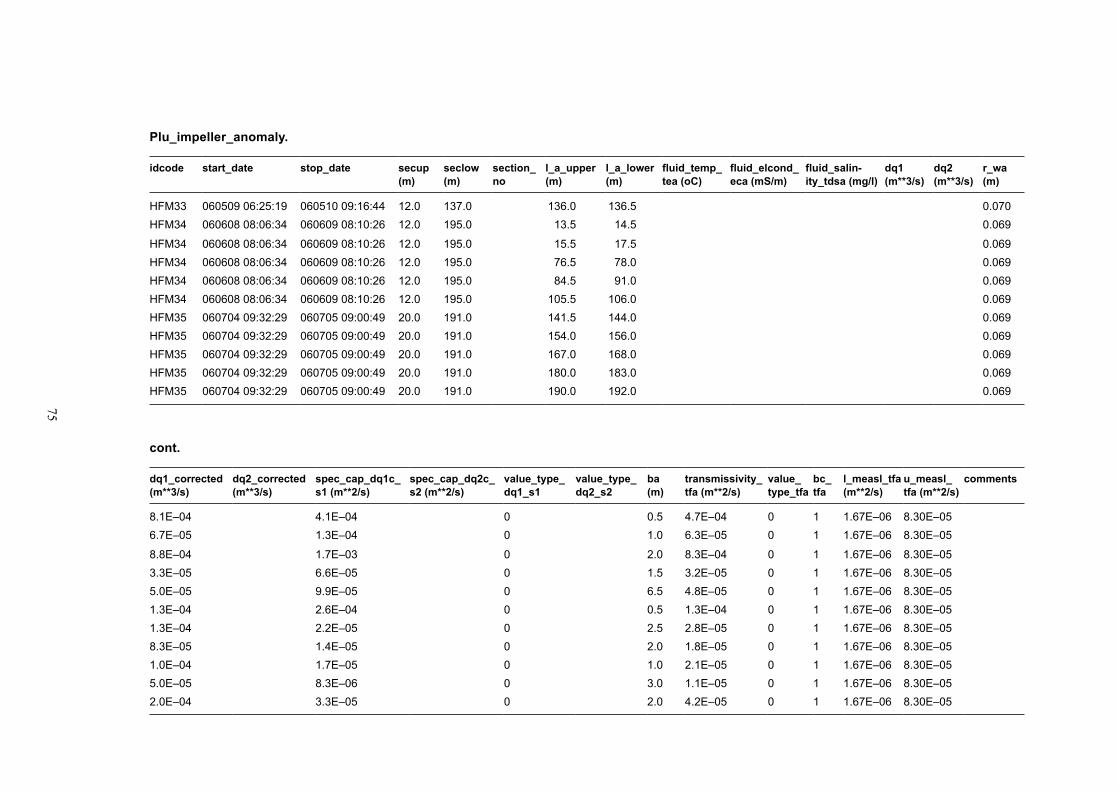
75
Plu_impeller_anomaly.
idcode start_date stop_date secup (m)
seclow (m)
section_no
l_a_upper (m)
l_a_lower (m)
fluid_temp_tea (oC)
fluid_elcond_eca (mS/m)
fluid_salin-ity_tdsa (mg/l)
dq1 (m**3/s)
dq2 (m**3/s)
r_wa (m)
HFM33 060509 06:25:19 060510 09:16:44 12.0 137.0 136.0 136.5 0.070HFM34 060608 08:06:34 060609 08:10:26 12.0 195.0 13.5 14.5 0.069
HFM34 060608 08:06:34 060609 08:10:26 12.0 195.0 15.5 17.5 0.069HFM34 060608 08:06:34 060609 08:10:26 12.0 195.0 76.5 78.0 0.069HFM34 060608 08:06:34 060609 08:10:26 12.0 195.0 84.5 91.0 0.069HFM34 060608 08:06:34 060609 08:10:26 12.0 195.0 105.5 106.0 0.069HFM35 060704 09:32:29 060705 09:00:49 20.0 191.0 141.5 144.0 0.069HFM35 060704 09:32:29 060705 09:00:49 20.0 191.0 154.0 156.0 0.069HFM35 060704 09:32:29 060705 09:00:49 20.0 191.0 167.0 168.0 0.069HFM35 060704 09:32:29 060705 09:00:49 20.0 191.0 180.0 183.0 0.069HFM35 060704 09:32:29 060705 09:00:49 20.0 191.0 190.0 192.0 0.069
cont.
dq1_corrected (m**3/s)
dq2_corrected (m**3/s)
spec_cap_dq1c_s1 (m**2/s)
spec_cap_dq2c_s2 (m**2/s)
value_type_dq1_s1
value_type_dq2_s2
ba (m)
transmissivity_tfa (m**2/s)
value_type_tfa
bc_tfa
l_measl_tfa (m**2/s)
u_measl_tfa (m**2/s)
comments
8.1E–04 4.1E–04 0 0.5 4.7E–04 0 1 1.67E–06 8.30E–056.7E–05 1.3E–04 0 1.0 6.3E–05 0 1 1.67E–06 8.30E–05
8.8E–04 1.7E–03 0 2.0 8.3E–04 0 1 1.67E–06 8.30E–053.3E–05 6.6E–05 0 1.5 3.2E–05 0 1 1.67E–06 8.30E–055.0E–05 9.9E–05 0 6.5 4.8E–05 0 1 1.67E–06 8.30E–051.3E–04 2.6E–04 0 0.5 1.3E–04 0 1 1.67E–06 8.30E–051.3E–04 2.2E–05 0 2.5 2.8E–05 0 1 1.67E–06 8.30E–058.3E–05 1.4E–05 0 2.0 1.8E–05 0 1 1.67E–06 8.30E–051.0E–04 1.7E–05 0 1.0 2.1E–05 0 1 1.67E–06 8.30E–055.0E–05 8.3E–06 0 3.0 1.1E–05 0 1 1.67E–06 8.30E–052.0E–04 3.3E–05 0 2.0 4.2E–05 0 1 1.67E–06 8.30E–05

76
Column Datatype Unit Column description
site CHAR Investigation site nameactivity_type CHAR Activity type codestart_date DATE Date (yymmdd hh:mm:ss)stop_date DATE Date (yymmdd hh:mm:ss)project CHAR Project codeidcode CHAR Object or borehole identification codesecup FLOAT m Upper section limit (m)seclow FLOAT m Lower section limit (m)section_no INTEGER number Section numberl_a_upper FLOAT m Borehole length to upper limit of inferred flow anomalyl_a_lower FLOAT m Borehole length to lower limit of inferred flow anomalyfluid_temp_tea FLOAT oC Measured borehole fluid temperature at inferred anomaly.fluid_elcond_eca FLOAT mS/m Measured fluid el conductivity of borehole fluid at anomalyfluid_salinity_tdsa FLOAT mg/l Calculated total dissolved solids of fluid at anomaly, see.dq1 FLOAT m**3/s Flow rate of inferred flow anomaly at pump flow Q1or head h1dq2 FLOAT m**3/s Flow rate of inferred flow anomaly at pump flowQ2 or head h2r_wa FLOAT m Estimated borehole radiusdq1_corrected FLOAT m**3/s Corrected flow rate of anomaly at pump flow Q1 or see descr.dq2_corrected FLOAT m**3/s Corrected flow rate of anomaly at pump flow Q2, or see descrspec_cap_dq1c_s1 FLOAT m**2/s dq1/s1.Spec. capacity of anomaly at pump flow Q1 or .., seespec_cap_dq2c_s2 FLOAT m**2/s dq2/s2.Spec. capacity of anomaly at pump flow Q2 or., see desvalue_type_dq1_s1 CHAR 0: true value, –1: <lower meas.limit, 1: >upper meas.limit.value_type_dq2_s2 CHAR 0: true value, –1: <lower meas.limit, 1: >upper meas.limit.ba FLOAT m Representative thickness of anomaly for TFa,see descriptiontransmissivity_tfa FLOAT m**2/s Transmissivity of inferred flow anomaly.value_type_tfa CHAR 0: true value, –1: TFa<lower meas.limit, 1: TFa>upper meas.limit.bc_tfa CHAR Best choice code.1 means TFa is best choice of T, else l_measl_tfa FLOAT m**2/s Lower measurement limit of TFa, see table descriptionu_measl_tfa FLOAT m**2/s Upper measurement limit of TFa, see table descriptioncomments CHAR Short comment on evaluated parameterserror_flag CHAR If error_flag = “*” then an error occured and an errorin_use CHAR If in_use = “*” then the activity has been selected assign CHAR Activity QA signature