Formulation and Evaluation of SR Tablets of Anti-diabetic ...
15
RESEARCH ARTICLE Am. J. PharmTech Res. 2019; 9(03) ISSN: 2249-3387 Please cite this article as: Tiwari P., Formulation and Evaluation of SR Tablets of Anti-diabetic drug Gliclazide . American Journal of PharmTech Research 2019. Formulation and Evaluation of SR Tablets of Anti-diabetic drug Gliclazide Priya Tiwari * Faculty of pharmaceutical sciences Rama University Mandhana Kanpur, up (209217) Lucknow (U.P.), India. ABSTRACT Recent advances in Sustained Release Drug delivery System (SRDDS) aim to enhance safety and efficacy of drug molecule by formulating a convenient dosage form for administration and to achieve better patient compliance. This present study showed that the Gliclazide is an oral hypoglycemic (anti-diabetic drug) and is classified as a sulfonylurea. Its classification has been ambiguous, as literature used it as both a first generation and second generation sulfonylurea. Gliclazide was shown to protect human pancreatic beta-cells from hypoglycemia-induced apoptosis. It was shown to have an anti-atherogenic effect (preventing accumulation of fat in arteries) in type II diabetes. Gliclazide is used in the tablet form for antidiabetic effect. Keyword: Gliclazide, Sustained release tablet, Pharmacokinetic study, diabetes, GLI, glipizide. *Corresponding Author Email: [email protected] Received 04 April 2019, Accepted 18 April 2019 Journal home page: http://www.ajptr.com/
Transcript of Formulation and Evaluation of SR Tablets of Anti-diabetic ...
RESEARCH ARTICLE Am. J. PharmTech Res. 2019; 9(03) ISSN: 2249-3387
Please cite this article as: Tiwari P., Formulation and Evaluation of SR Tablets of Anti-diabetic drug
Gliclazide . American Journal of PharmTech Research 2019.
Formulation and Evaluation of SR Tablets of Anti-diabetic drug
Gliclazide
Priya Tiwari*
Faculty of pharmaceutical sciences Rama University Mandhana Kanpur, up (209217) Lucknow
(U.P.), India.
ABSTRACT
Recent advances in Sustained Release Drug delivery System (SRDDS) aim to enhance safety and
efficacy of drug molecule by formulating a convenient dosage form for administration and to
achieve better patient compliance. This present study showed that the Gliclazide is an oral
hypoglycemic (anti-diabetic drug) and is classified as a sulfonylurea. Its classification has been
ambiguous, as literature used it as both a first generation and second generation sulfonylurea.
Gliclazide was shown to protect human pancreatic beta-cells from hypoglycemia-induced
apoptosis. It was shown to have an anti-atherogenic effect (preventing accumulation of fat in
arteries) in type II diabetes. Gliclazide is used in the tablet form for antidiabetic effect.
Keyword: Gliclazide, Sustained release tablet, Pharmacokinetic study, diabetes, GLI, glipizide.
*Corresponding Author Email: [email protected] Received 04 April 2019, Accepted 18 April 2019
Journal home page: http://www.ajptr.com/
Tiwari., Am. J. PharmTech Res. 2019;9(03) ISSN: 2249-3387
www.ajptr.com 2
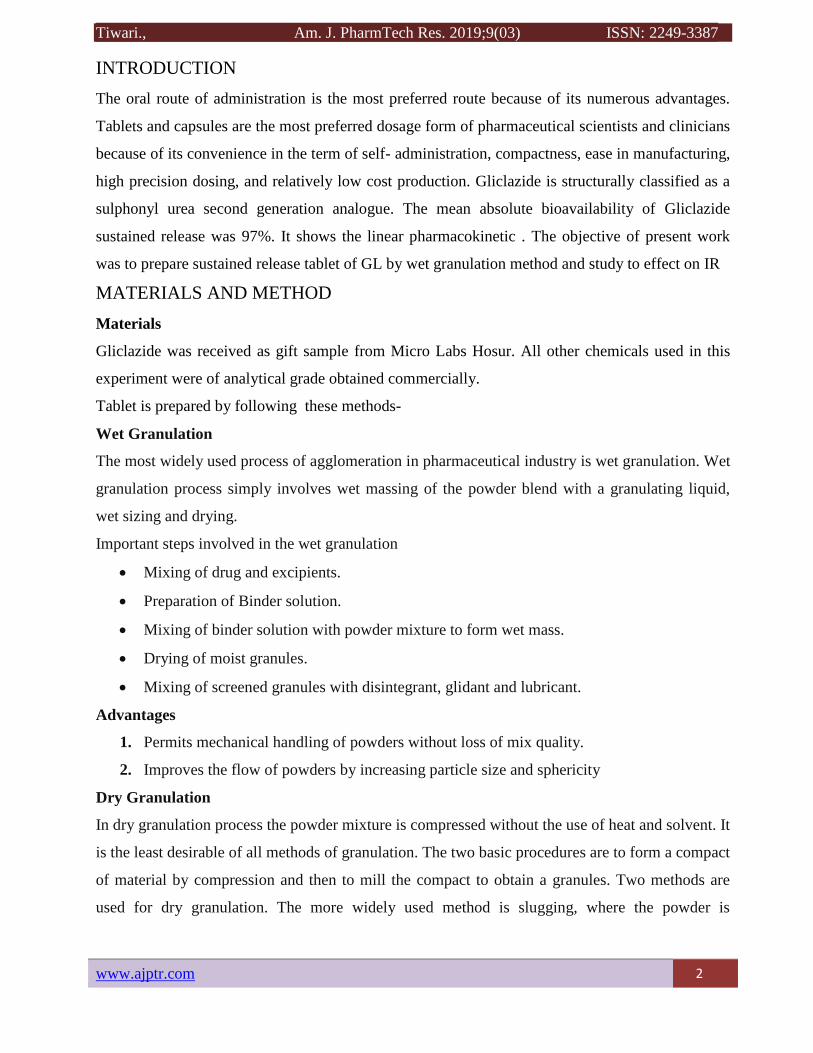
INTRODUCTION
The oral route of administration is the most preferred route because of its numerous advantages.
Tablets and capsules are the most preferred dosage form of pharmaceutical scientists and clinicians
because of its convenience in the term of self- administration, compactness, ease in manufacturing,
high precision dosing, and relatively low cost production. Gliclazide is structurally classified as a
sulphonyl urea second generation analogue. The mean absolute bioavailability of Gliclazide
sustained release was 97%. It shows the linear pharmacokinetic . The objective of present work
was to prepare sustained release tablet of GL by wet granulation method and study to effect on IR
MATERIALS AND METHOD
Materials
Gliclazide was received as gift sample from Micro Labs Hosur. All other chemicals used in this
experiment were of analytical grade obtained commercially.
Tablet is prepared by following these methods-
Wet Granulation
The most widely used process of agglomeration in pharmaceutical industry is wet granulation. Wet
granulation process simply involves wet massing of the powder blend with a granulating liquid,
wet sizing and drying.
Important steps involved in the wet granulation
Mixing of drug and excipients.
Preparation of Binder solution.
Mixing of binder solution with powder mixture to form wet mass.
Drying of moist granules.
Mixing of screened granules with disintegrant, glidant and lubricant.
Advantages
1. Permits mechanical handling of powders without loss of mix quality.
2. Improves the flow of powders by increasing particle size and sphericity
Dry Granulation
In dry granulation process the powder mixture is compressed without the use of heat and solvent. It
is the least desirable of all methods of granulation. The two basic procedures are to form a compact
of material by compression and then to mill the compact to obtain a granules. Two methods are
used for dry granulation. The more widely used method is slugging, where the powder is
Tiwari., Am. J. PharmTech Res. 2019; 9(03) ISSN: 2249-3387
3 www.ajptr.com
recompressed and the resulting tablet or slug are milled to yield the granules. The other method is
to recompress the powder with pressure rolls using a machine such as Chilosonator.
Roller Compaction
The compaction of powder by means of pressure roll can also be accomplished by a machine
called chilsonator. Unlike tablet machine, the chilsonator turns out a compacted mass in a steady
continuous flow. The powder is fed down between the rollers from the hopper which contains a
spiral auger to feed the powder into the compaction zone. Like slugs, the aggregates are screened
Use. Use in the production of directly compressible excipients, the compaction of drugs and drug
formulations, the granulation of inorganic materials, the granulation of dry herbal material and the
production of immediate/sustained release formulations.
Direct compression.
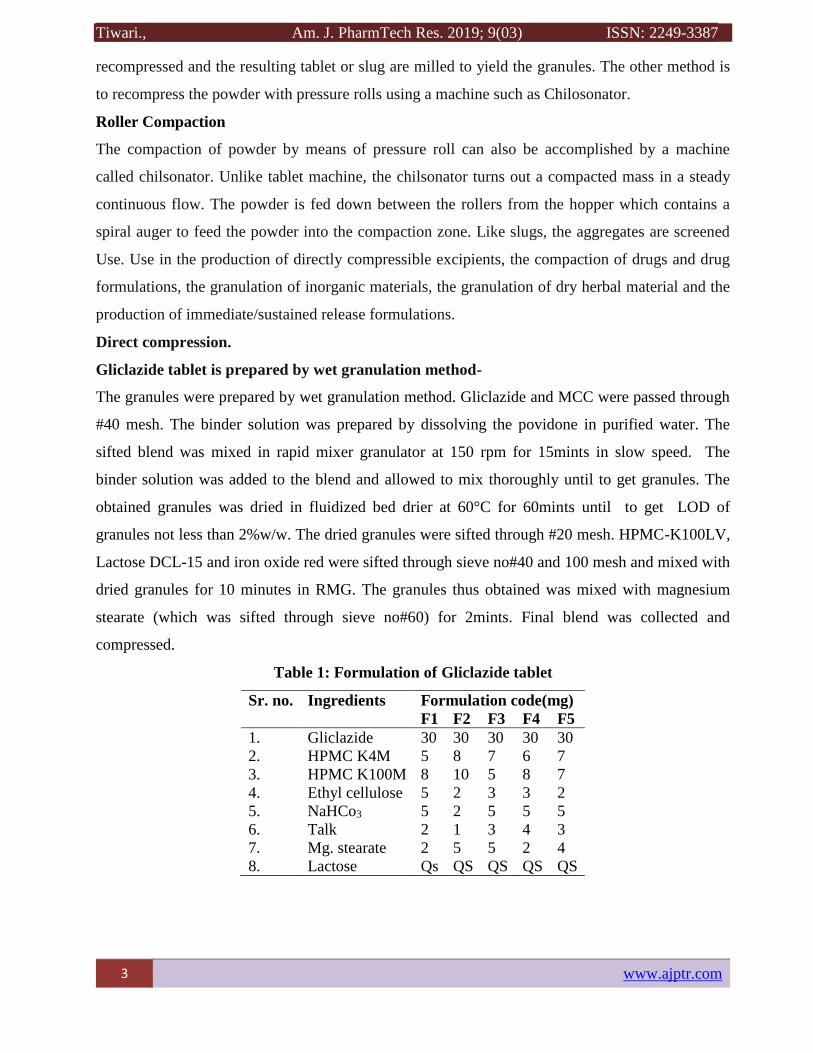
Gliclazide tablet is prepared by wet granulation method-
The granules were prepared by wet granulation method. Gliclazide and MCC were passed through
#40 mesh. The binder solution was prepared by dissolving the povidone in purified water. The
sifted blend was mixed in rapid mixer granulator at 150 rpm for 15mints in slow speed. The
binder solution was added to the blend and allowed to mix thoroughly until to get granules. The
obtained granules was dried in fluidized bed drier at 60°C for 60mints until to get LOD of
granules not less than 2%w/w. The dried granules were sifted through #20 mesh. HPMC-K100LV,
Lactose DCL-15 and iron oxide red were sifted through sieve no#40 and 100 mesh and mixed with
dried granules for 10 minutes in RMG. The granules thus obtained was mixed with magnesium
stearate (which was sifted through sieve no#60) for 2mints. Final blend was collected and
compressed.
Table 1: Formulation of Gliclazide tablet
Sr. no. Ingredients Formulation code(mg)
F1 F2 F3 F4 F5
1. Gliclazide 30 30 30 30 30
2. HPMC K4M 5 8 7 6 7
3. HPMC K100M 8 10 5 8 7
4. Ethyl cellulose 5 2 3 3 2
5. NaHCo3 5 2 5 5 5
6. Talk 2 1 3 4 3
7. Mg. stearate 2 5 5 2 4
8. Lactose Qs QS QS QS QS
Tiwari., Am. J. PharmTech Res. 2019;9(03) ISSN: 2249-3387
www.ajptr.com 4
Evaluation of Tablets Blend
Pre- compression
The quality of tablet, once formulated, is generally dictated by the quality of physicochemical
properties of blend. There are many formulation and process variables involved in mixing step and
all these can affect the characteristics of blends produced.
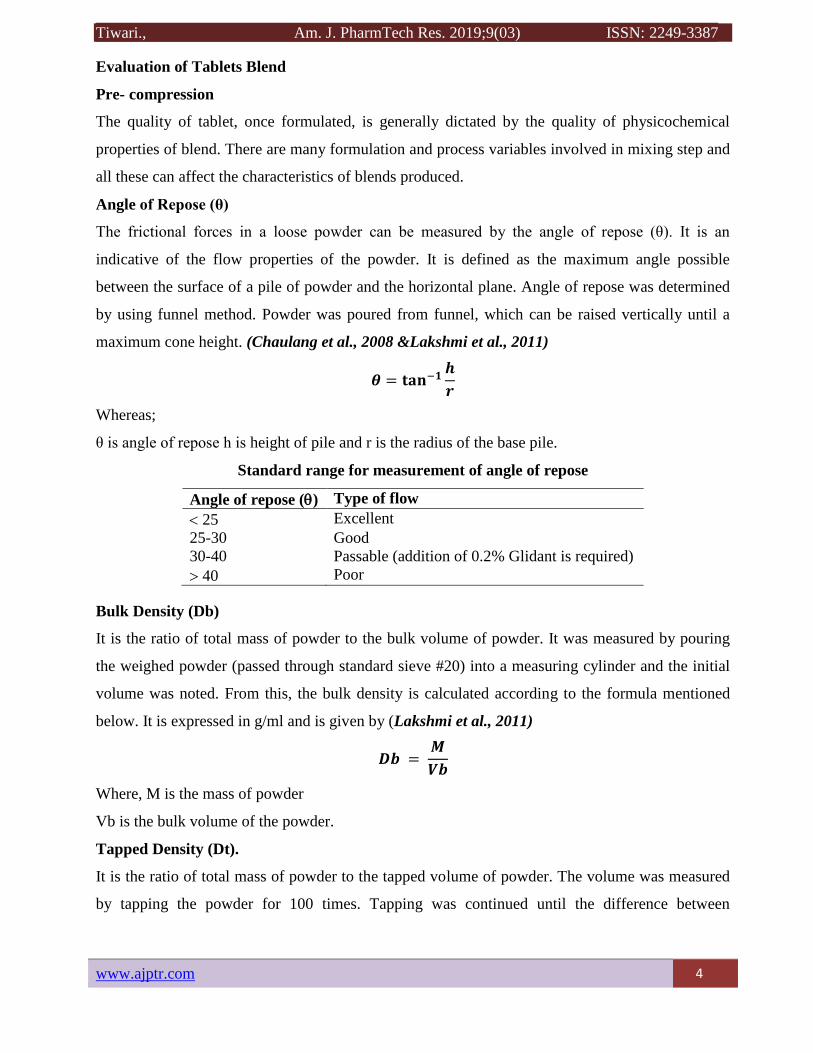
Angle of Repose (θ)
The frictional forces in a loose powder can be measured by the angle of repose (θ). It is an
indicative of the flow properties of the powder. It is defined as the maximum angle possible
between the surface of a pile of powder and the horizontal plane. Angle of repose was determined
by using funnel method. Powder was poured from funnel, which can be raised vertically until a
maximum cone height. (Chaulang et al., 2008 &Lakshmi et al., 2011)
𝜽 = 𝐭𝐚𝐧−𝟏𝒉
𝒓
Whereas;
θ is angle of repose h is height of pile and r is the radius of the base pile.
Standard range for measurement of angle of repose
Angle of repose () Type of flow
25 Excellent
25-30 Good
30-40 Passable (addition of 0.2% Glidant is required)
40 Poor
Bulk Density (Db)
It is the ratio of total mass of powder to the bulk volume of powder. It was measured by pouring
the weighed powder (passed through standard sieve #20) into a measuring cylinder and the initial
volume was noted. From this, the bulk density is calculated according to the formula mentioned
below. It is expressed in g/ml and is given by (Lakshmi et al., 2011)
𝑫𝒃 = 𝑴
𝑽𝒃
Where, M is the mass of powder
Vb is the bulk volume of the powder.
Tapped Density (Dt).
It is the ratio of total mass of powder to the tapped volume of powder. The volume was measured
by tapping the powder for 100 times. Tapping was continued until the difference between
Tiwari., Am. J. PharmTech Res. 2019; 9(03) ISSN: 2249-3387
5 www.ajptr.com
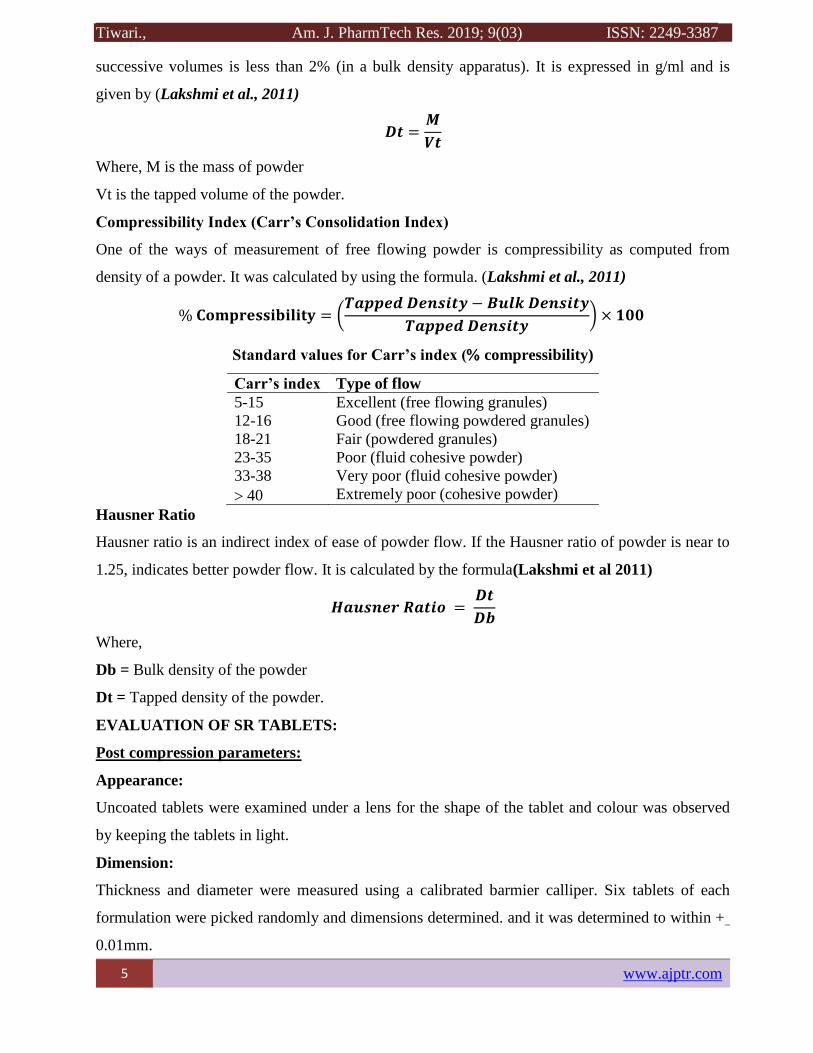
successive volumes is less than 2% (in a bulk density apparatus). It is expressed in g/ml and is
given by (Lakshmi et al., 2011)
𝑫𝒕 =𝑴
𝑽𝒕
Where, M is the mass of powder
Vt is the tapped volume of the powder.
Compressibility Index (Carr’s Consolidation Index)
One of the ways of measurement of free flowing powder is compressibility as computed from
density of a powder. It was calculated by using the formula. (Lakshmi et al., 2011)
% 𝐂𝐨𝐦𝐩𝐫𝐞𝐬𝐬𝐢𝐛𝐢𝐥𝐢𝐭𝐲 = (𝑻𝒂𝒑𝒑𝒆𝒅 𝑫𝒆𝒏𝒔𝒊𝒕𝒚 − 𝑩𝒖𝒍𝒌 𝑫𝒆𝒏𝒔𝒊𝒕𝒚
𝑻𝒂𝒑𝒑𝒆𝒅 𝑫𝒆𝒏𝒔𝒊𝒕𝒚) × 𝟏𝟎𝟎
Standard values for Carr’s index ( compressibility)
Carr’s index Type of flow
5-15 Excellent (free flowing granules)
12-16 Good (free flowing powdered granules)
18-21 Fair (powdered granules)
23-35 Poor (fluid cohesive powder)
33-38 Very poor (fluid cohesive powder)
40 Extremely poor (cohesive powder)
Hausner Ratio
Hausner ratio is an indirect index of ease of powder flow. If the Hausner ratio of powder is near to
1.25, indicates better powder flow. It is calculated by the formula(Lakshmi et al 2011)
𝑯𝒂𝒖𝒔𝒏𝒆𝒓 𝑹𝒂𝒕𝒊𝒐 = 𝑫𝒕
𝑫𝒃
Where,
Db = Bulk density of the powder
Dt = Tapped density of the powder.
EVALUATION OF SR TABLETS:
Post compression parameters:
Appearance:
Uncoated tablets were examined under a lens for the shape of the tablet and colour was observed
by keeping the tablets in light.
Dimension:
Thickness and diameter were measured using a calibrated barmier calliper. Six tablets of each
formulation were picked randomly and dimensions determined. and it was determined to within +_
0.01mm.

Tiwari., Am. J. PharmTech Res. 2019;9(03) ISSN: 2249-3387
www.ajptr.com 6
Weight Variation Test
Twenty tablets were weighed individually and all together. Average weight was calculated from
the total weight of all tablets. The individual weights were compared with the average weight. The
percentage difference in the weight variation should be within the permissible limits (±7.5%). The
percent deviation was calculated using the following formula.(Kuchekar et al., 2004).
𝐏𝐞𝐫𝐜𝐞𝐧𝐭𝐚𝐠𝐞 𝐃𝐢𝐯𝐢𝐚𝐭𝐢𝐨𝐧 = (𝐈𝐧𝐝𝐢𝐯𝐢𝐝𝐮𝐚𝐥 𝐰𝐞𝐢𝐠𝐡𝐭 − 𝐀𝐯𝐞𝐫𝐚𝐠𝐞 𝐰𝐞𝐢𝐠𝐡𝐭
𝐀𝐯𝐞𝐫𝐚𝐠𝐞 𝐰𝐞𝐢𝐠𝐡𝐭) × 𝟏𝟎𝟎
The weight was determined by using Sartorius balance and there is shown that every individual in
a batch should be in uniform weight and weight variation within the permissible limits.
IP Standards for Percentage Weight Variation
Average weight. Percentage deviation
80 mg or less. 10
More than 80 mg but less then 250 mg 7.5
250 mg or more 5
Hardness test:
Hardness indicates the ability of a tablet to withstand mechanical shocks while handling. The
hardness of the tablets was determined using Monsanto hardness tester. It is expressed in kg/cm2.
Six tablets were randomly picked and analyzed for hardness. The mean and standard deviation
values were also calculated. (Lachman et al., 1991)
A tablet hardness about is 6-8kg was considered adequate for mechanical stability.
Friability test
Friability is the loss of weight of tablet in the container/package, due to removal of fine particles
from the surface. This in process quality control test is performed to ensure the ability of tablets to
withstand the shocks during processing, handling, transportation, and shipment. Permitted
friability limit is 1.0 %. Roche Friabilator was used to measure the friability of the tablets. Ten
tablets were weighed collectively and placed in the chamber of the friabilator. In the friabilator, the
tablets were exposed to rolling, resulting from free fall of tablets within the chamber of the
friabilator. It was rotated at a rate of 25 rpm. After 100 rotations (4 minutes), the tablets were taken
out from the friabilator and intact tablets were again weighed collectively. The percent friability
was determined using the following formula ;(Lachman et al., 1991).
𝑭𝒓𝒊𝒂𝒃𝒊𝒍𝒊𝒕𝒚 = [𝑾𝟏 – 𝑾𝟐
𝑾𝟏] × 𝟏𝟎𝟎
Where,
W1 = weight of the tablet before test,

Tiwari., Am. J. PharmTech Res. 2019; 9(03) ISSN: 2249-3387
7 www.ajptr.com
W2 = weight of the tablets after test
Drug Content Estimation
Twenty tablets were weighed and powdered, 20 mg of equivalent of Gliclazide was weighed and
dissolved in 100 ml of pH 7.4 phosphate buffer, filtered, diluted suitably and analyzed for drug
content at 226 nm using UV- spectrophotometer (UV 1800 Shimadzu, Japan).(Kumaran V et al.,
2004)
In vitro dissolution studies:
In vitro drug release of Miloxicame mouth dissolving tablet was determined using USP
Dissolution Apparatus II (Paddle type) (Electrolab TDT-08L, India). The dissolution test was
performed using 900 ml of Phosphate buffer SSF pH 6.8 at 37±0.50C. The speed of rotation of
paddle was set at 50 rpm. 2 ml sample were withdrawn at time points of 2, 4, 6, 8, and 10 min and
same volume was replaced with fresh media. The samples were filtered and from the filtrate 1ml
was taken and diluted to 10ml with pH 6.8 Phosphate buffer. Absorbance of solution was checked
by using UV- spectrophotometer (UV 1800 Shimadzu, Japan) at a wavelength of 302 nm and drug
release was determined from standard curve.
Wetting time:
Wetting time of dosage form is related with the contact angle. Wetting time of the mouth
dissolving tablets is another important parameter, which needs to be assessed to give an insight
into the disintegration properties of the tablets; a lower wetting time implies a quicker
disintegration of the tablet. The wetting time of the tablet can be measured using a simple
procedure.
Method
Five circular tissue papers of 10 cm diameter are placed in a petridish with a 10 cm diameter. 10
ml of water containing methylene blue 2 % w/v, a water soluble dye is added to petridish. A tablet
is carefully placed on the surface of the tissue paper. The time required for water to reach upper
surface of the tablet is noted as wetting time. (Park et al., 2008& Gattani et al., 2009).
It shown in table no. 1.
Water absorption ratio:
A piece of tissue paper folded twice was placed in a small petridish containing 10 ml of PB pH 6.8.
A tablet was put on the paper and time required for complete wetting was measured. The wetted
tablet was then weighed. Water absorption ratio, R, was determined using equation –
𝐑 = (𝐖𝐚 − 𝐖𝐛
𝐖𝐛) × 𝟏𝟎𝟎
Tiwari., Am. J. PharmTech Res. 2019;9(03) ISSN: 2249-3387
www.ajptr.com 8
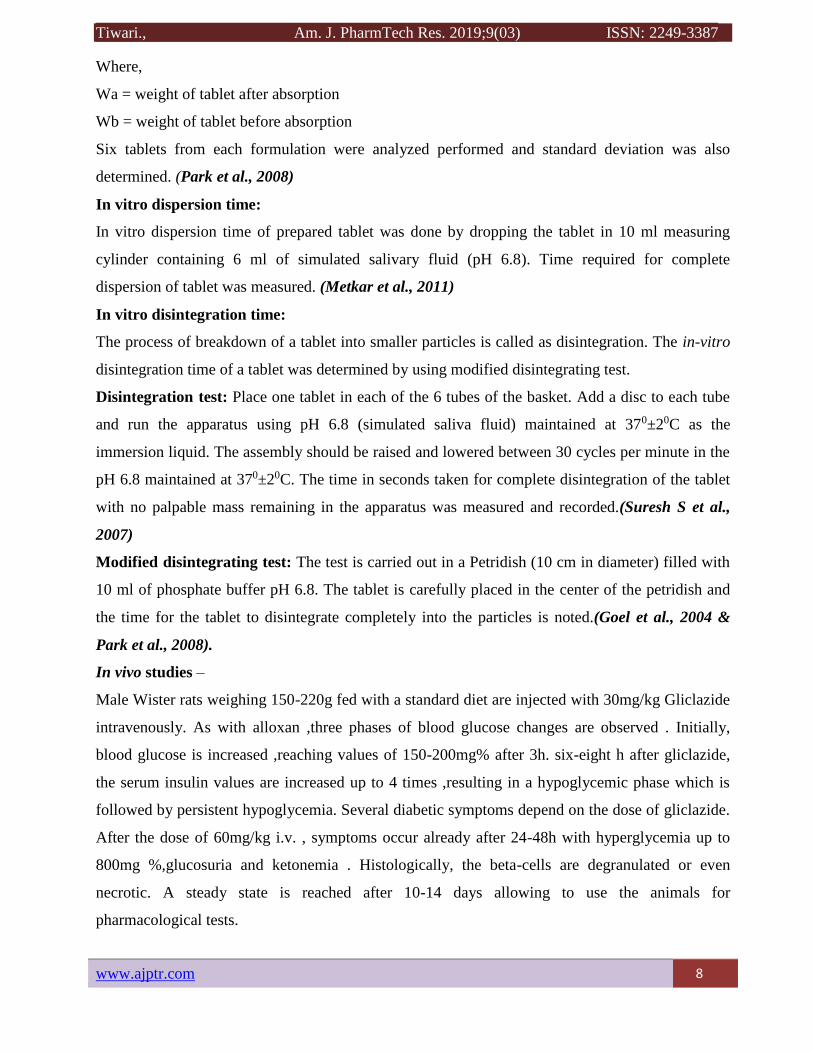
Where,
Wa = weight of tablet after absorption
Wb = weight of tablet before absorption
Six tablets from each formulation were analyzed performed and standard deviation was also
determined. (Park et al., 2008)
In vitro dispersion time:
In vitro dispersion time of prepared tablet was done by dropping the tablet in 10 ml measuring
cylinder containing 6 ml of simulated salivary fluid (pH 6.8). Time required for complete
dispersion of tablet was measured. (Metkar et al., 2011)
In vitro disintegration time:
The process of breakdown of a tablet into smaller particles is called as disintegration. The in-vitro
disintegration time of a tablet was determined by using modified disintegrating test.
Disintegration test: Place one tablet in each of the 6 tubes of the basket. Add a disc to each tube
and run the apparatus using pH 6.8 (simulated saliva fluid) maintained at 370±20C as the
immersion liquid. The assembly should be raised and lowered between 30 cycles per minute in the
pH 6.8 maintained at 370±20C. The time in seconds taken for complete disintegration of the tablet
with no palpable mass remaining in the apparatus was measured and recorded.(Suresh S et al.,
2007)
Modified disintegrating test: The test is carried out in a Petridish (10 cm in diameter) filled with
10 ml of phosphate buffer pH 6.8. The tablet is carefully placed in the center of the petridish and
the time for the tablet to disintegrate completely into the particles is noted.(Goel et al., 2004 &
Park et al., 2008).
In vivo studies –
Male Wister rats weighing 150-220g fed with a standard diet are injected with 30mg/kg Gliclazide
intravenously. As with alloxan ,three phases of blood glucose changes are observed . Initially,
blood glucose is increased ,reaching values of 150-200mg% after 3h. six-eight h after gliclazide,
the serum insulin values are increased up to 4 times ,resulting in a hypoglycemic phase which is
followed by persistent hypoglycemia. Several diabetic symptoms depend on the dose of gliclazide.
After the dose of 60mg/kg i.v. , symptoms occur already after 24-48h with hyperglycemia up to
800mg %,glucosuria and ketonemia . Histologically, the beta-cells are degranulated or even
necrotic. A steady state is reached after 10-14 days allowing to use the animals for
pharmacological tests.

Tiwari., Am. J. PharmTech Res. 2019; 9(03) ISSN: 2249-3387
9 www.ajptr.com
RESULTS AND DISCUSSION
From the result it is concluded that there was no interference in the functional groups as the
principle peak of the drug gliclazide were found to be unaltered in the drug polymer physical
mixture indicating that they were compatible chemically.
The granules from the different formulation are evaluated for angle of repose, bulk density, tapped
density, compressibility index, Hausner ratio and then the result were shown in the table no.
The in vitro result of all the formulations were obtained by dissolution testing and similarity
factors value was calculated.
Pre-compression Parameters-
Evaluation of Granules.
This is the first parameter of pre-compression parameters. Which shows the- The angle of repose-
for all the formulations was within 35º indicates all the formulations have good flow property. The
compressibility index and Hausner’s ratio- it was 11.76 to 14.54 and 1.13 to 1.17 indicating good
flow character of the granules. So, all the results are within the prescribed limits. It indicates all the
formulations have good flow property.
Evaluation of compressed tablets
Hardness of the tablets was in the range of 6.10 to 8.10 kg/cm2.This ensures good handling
characteristics of all the batches. Weight loss in the friability test was less than 1% in all the cases,
ensuring that the tablets were mechanically stable. All the tablets prepared contained the drug
within 99.93 and 100.63±5% of the label claim. All the formulated tablets passed the weight
variation test as the % weight variation was within the Pharmacopoeial limits of ± 5% of the
average weight.
IR Spectral Analysis
FTIR spectral studies.-
The FTIR spectra of pure GLI (crystalline), amorphous GLI, and all the substances. The IR
spectrum of GLI presents characteristics peak at 3,273.57 and 3,192.58 cm-1 (NH amide stretch)
3,112.55 cm-1 (C-H aromatic streatch), 2,949.59 cm-1 (C-H aliphatic streatch –
asymmetric),2,867.63 cm-1 (C-H aliphatic streatch- symmetric),1,709.59 cm-1 (C=O amide
carbonyl streatch),1,595.81 cm-1 (N-H amide bend), 1,590 and 1,473.35 cm-1 (C=C aromatic
streatch), 1,348 cm-1 (S=O sulfonyl streatch), 1,240.97 cm-1 (C-N ring streatch , heterocyclic),
and 811.885cm-1 (p- phenyl group in fingerprint region ).
Tiwari., Am. J. PharmTech Res. 2019;9(03) ISSN: 2249-3387
www.ajptr.com 10
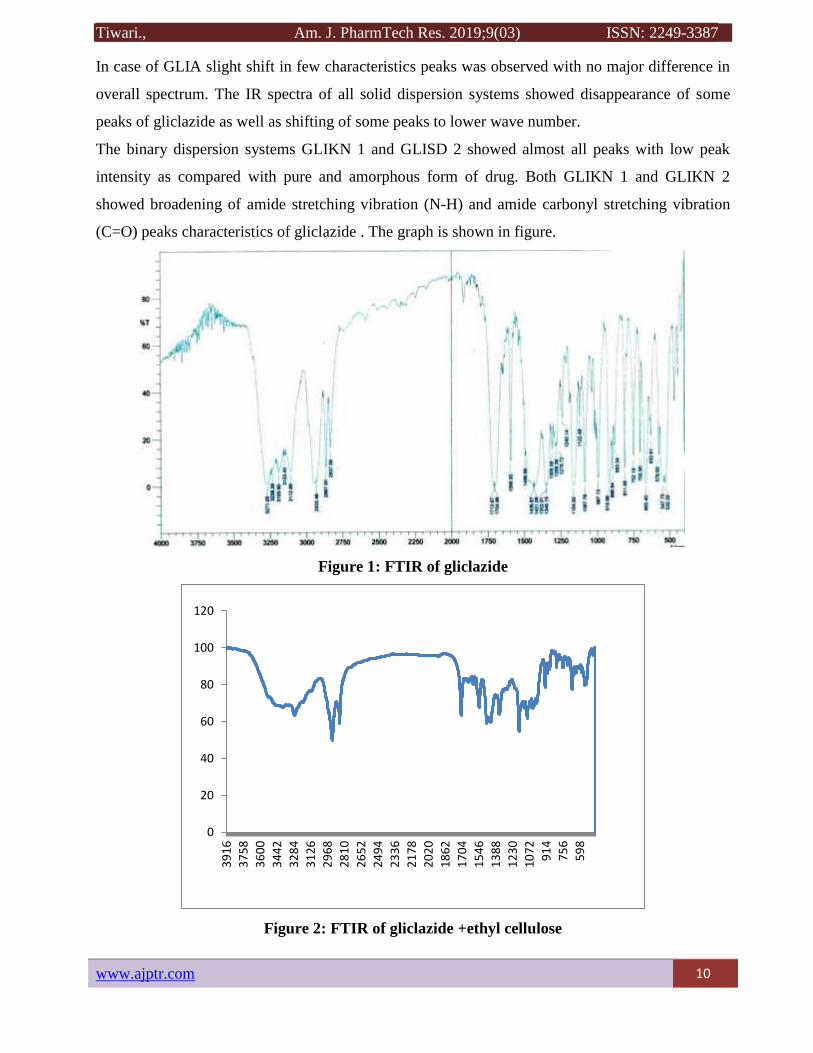
In case of GLIA slight shift in few characteristics peaks was observed with no major difference in
overall spectrum. The IR spectra of all solid dispersion systems showed disappearance of some
peaks of gliclazide as well as shifting of some peaks to lower wave number.
The binary dispersion systems GLIKN 1 and GLISD 2 showed almost all peaks with low peak
intensity as compared with pure and amorphous form of drug. Both GLIKN 1 and GLIKN 2
showed broadening of amide stretching vibration (N-H) and amide carbonyl stretching vibration
(C=O) peaks characteristics of gliclazide . The graph is shown in figure.
Figure 1: FTIR of gliclazide
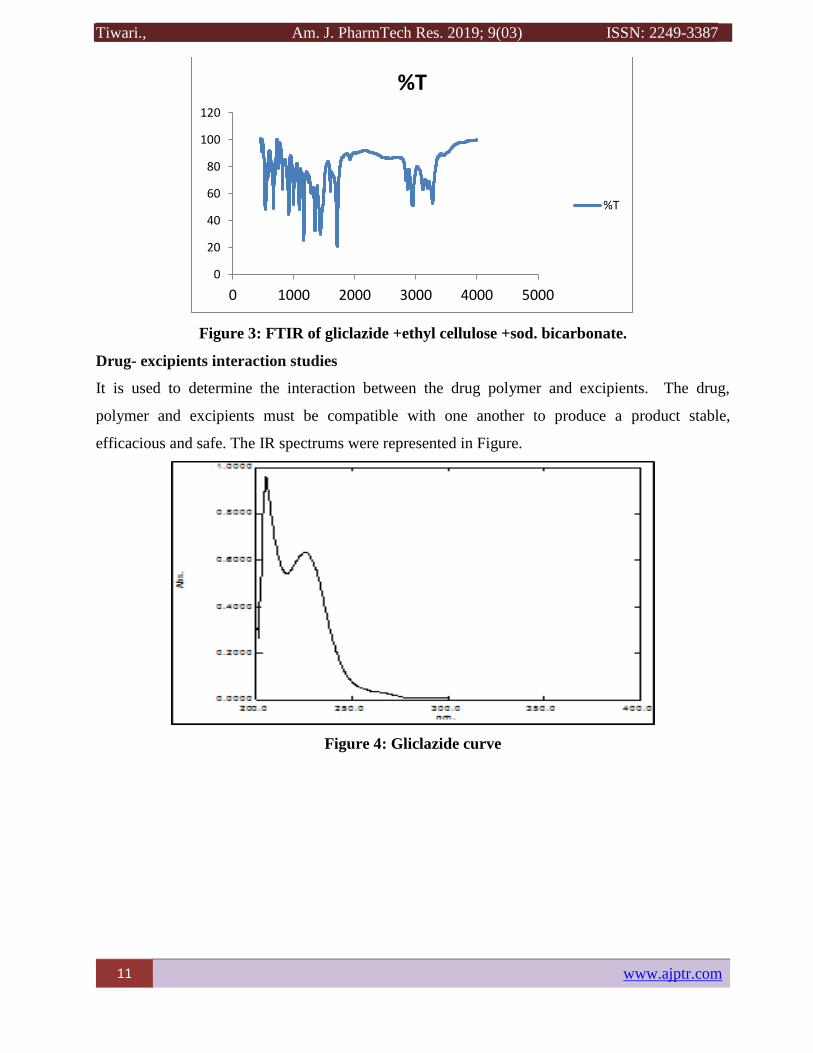
Figure 2: FTIR of gliclazide +ethyl cellulose
0
20
40
60
80
100
120
39
16
37
58
36
00
34
42
32
84
31
26
29
68
28
10
26
52
24
94
23
36
21
78
20
20
18
62
17
04
15
46
13
88
12
30
10
72
91
4
75
6
59
8
Tiwari., Am. J. PharmTech Res. 2019; 9(03) ISSN: 2249-3387
11 www.ajptr.com
Figure 3: FTIR of gliclazide +ethyl cellulose +sod. bicarbonate.
Drug- excipients interaction studies
It is used to determine the interaction between the drug polymer and excipients. The drug,
polymer and excipients must be compatible with one another to produce a product stable,
efficacious and safe. The IR spectrums were represented in Figure.
Figure 4: Gliclazide curve
0
20
40
60
80
100
120
0 1000 2000 3000 4000 5000
%T
%T
Tiwari., Am. J. PharmTech Res. 2019;9(03) ISSN: 2249-3387
www.ajptr.com 12
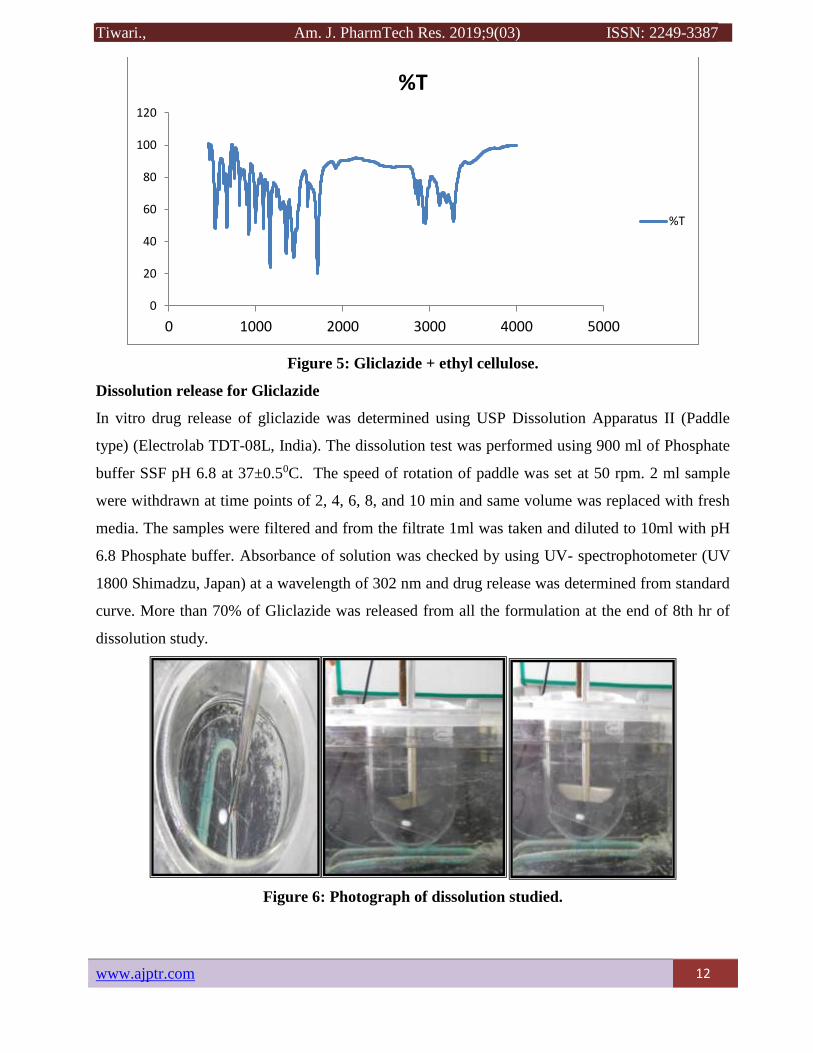
Figure 5: Gliclazide + ethyl cellulose.
Dissolution release for Gliclazide
In vitro drug release of gliclazide was determined using USP Dissolution Apparatus II (Paddle
type) (Electrolab TDT-08L, India). The dissolution test was performed using 900 ml of Phosphate
buffer SSF pH 6.8 at 37±0.50C. The speed of rotation of paddle was set at 50 rpm. 2 ml sample
were withdrawn at time points of 2, 4, 6, 8, and 10 min and same volume was replaced with fresh
media. The samples were filtered and from the filtrate 1ml was taken and diluted to 10ml with pH
6.8 Phosphate buffer. Absorbance of solution was checked by using UV- spectrophotometer (UV
1800 Shimadzu, Japan) at a wavelength of 302 nm and drug release was determined from standard
curve. More than 70% of Gliclazide was released from all the formulation at the end of 8th hr of
dissolution study.
Figure 6: Photograph of dissolution studied.
0
20
40
60
80
100
120
0 1000 2000 3000 4000 5000
%T
%T

Tiwari., Am. J. PharmTech Res. 2019; 9(03) ISSN: 2249-3387
13 www.ajptr.com
Figure 7: Standard curve of dissolution
STABILITY STUDIES
Accelerated Stability study.
After determining the drug content and release studies, the optimized formulation was charged for
the accelerated stability studies according to ICH guidelines (40+_20c and 75 +_ 5% RH) for a
period of 3 months in a stability chamber (Thermolab, Mumbai, India). The optimized
formulations were placed in USP type-1 flint vials and hermatically closed with bromobutyl rubber
plugs and sealed with aluminium caps . The samples were withdrawn at 15, 30, 60, 90 days and
evaluated for the drug content and in vitro drug release.
CONCLUSION
From these results, it was found that all the pre-formulation characteristics of the formulation were
found to be within the specified limits. From the drug content, post-compression parameters, in-
vitro drug release studies it was found that among the various formulations. The formulation is
further taken for pilot scale up studies and stability studies.
ACKNOWEDGEMENT
The authors are thankful to Dr. Rishikesh Gupta Assistant professor of Pharmaceutics in
Bundelkhand University. And special thanks to my beloved parents. Our thanks to all the members
those who helped for this project work.
REFERENCES
1. Demirturk E.,Oner L. Solubility & dissolution properties of Gliclazide . FABAD Journal
of Pharmaceutical Sciences 2004; 29; 21-25.
0
0.1
0.2
0.3
0.4
0.5
0.6
0.7
0.8
0 5 10 15 20
Series1
Tiwari., Am. J. PharmTech Res. 2019;9(03) ISSN: 2249-3387
www.ajptr.com 14
2. Palmer K J. Brogden R N .Gliclazide; An update of its pharmacological properties &
therapeutic efficacy in non-insulin –dependent diabetes mellitus . Drugs 1993; 46 (1) ;92-
125.
3. Raghuram R K , Srinivas M, Srinivas R. Once – daily sustained –release matrix tablets of
nicorandil ; formulation & in-vitro evaluation . American Association of Pharmaceutical
Sciences & Technology 2003; 4: E61.
4. Krishnaiah YSR, Rama Rao T, Ushasree M, Satyanarayna SA. Study on the in-vitro
evaluation of guar gum as a carrier for oral controlled drug delivery. Saudi Pharmaceutical
Journal 2001; 9: 91-98 ,
5. The Official Compendium of Standards , The United States Pharmacopoeial Convention .
2007, USP 30 – NF 25.
6. Ei-Arini SK, Leuenberger H., Modelling of drug release from polymer matrices: Effect of
drug loading , International Journal of Pharmaceutics 1995; 121 : 141-148.
7. Ronald H, Schmidt HK . Molecularly Imprinted Polymer Films with Binding Properties
Enhancement by the Reaction-Induced Phase Separation of a Sacrificial Polymeric
Porogen . Chemical Materials 2005 ., 17 (5); 1007 – 1016.
8. European Pharmacopoeia , Published by the directed for the quality of medicines of the
council of Europe 9EDQM . Strasbourg , France 2002 , 4 (suppl.4.1).
9. Aulton ME. Pharmaceutics- The science of dosage form design. 2nd ed. London;
ELBS/Churchill Livingstone; 2002. P. 4.
10. Aulton ME. Pharmaceutics- The science of dosage form design. 2nd ed. London;
ELBS/Churchill Livingstone; 2002. P. 4.
11. N.K. Jain Controlled & novel drug delivery. 1st ED. New Delhi: CBS Publication ;2004. P.
1-2.
12. A.R. Gennaro Extended Release Dosage Forms. In: Remington: The Science & Practice of
Pharmacy . 20th ed. Vol 1. U.S.A. Lippincott Williams & Wilkins; 2000. P. 660-63.
13. Sansom Lloyd N. Oral extended-release products. In; Therapeutic Guidelines Ltd, 1999:
22: 88-90.
14. Remington. The science & practice of pharmacy . 20th ed. Vol. 1. New York : Lippincott
Williams & Wilkins : 2000. P. 903.
15. Robinson JR, Eriksen, J.Pharm.Sci. 1966; 55: 1254.
16. Ennis BJ, Litster JD. Particle enlargement. Perry RH, Greens D, eds. Perry’s Chemical
17. Engineer’s Handbook. 7th ed. New York: McGraw Hill, 1997:20-56–20-89.

Tiwari., Am. J. PharmTech Res. 2019; 9(03) ISSN: 2249-3387
15 www.ajptr.com
18. Charoenchaitrakool M, Dehghani F, Foster NR. Micronization by RESS to enhance the
19. dissolution rates of poorly water soluble pharmaceuticals. Proceedings of the 5th
International.
20. Symposium on Supercritical Fluids, Atlanta, GA, April 8–12, 2000.
21. Matson DW, Fulton JL, Petersen RC, Smith RD. Rapid expansion of supercritical fluid
solutions: solute formation of powders, thin films, and fibers. Ind Eng Chem Res 1987;
26:2298–2306.
22. Subra P, Boissinot P, Benzaghou S. Precipitation of pure and mixed caffeine and
anthracene by rapid expansion of supercritical solutions. Proceedings of the 5th Meeting on
Supercritical Fluids, Tome I, Nice, France, March 23–25, 1998.
23. Gilbert DJ, Palakodaty S, Sloan R, York V. Particle engineering for pharmaceutical
applications—a process scale up. Proceedings of the 5th International Symposium on
Supercritical Fluids, Atlanta, GA, April 8–12, 2000.
24. York P, et al. Supercritical fluids ease drug delivery. Manuf Chemist 2000; 26–29.
25. Food and Drug Administration. Guidance for Industry PAT—A Framework for Innovative
Pharmaceutical Development, Manufacturing and Quality Assurance.
AJPTR is
Peer-reviewed
bimonthly
Rapid publication
Submit your manuscript at: [email protected]