FORMULATION AND EVALUATION OF NIOSOMES CONTAINING
12
Priya et al Journal of Drug Delivery & Therapeutics; 2012, 2(6), 56-67 56 © 2011, JDDT. All Rights Reserved ISSN: 2250-1177 CODEN (USA): JDDTAO Available online at http://jddtonline.info RESEARCH ARTICLE FORMULATION AND EVALUATION OF NIOSOMES CONTAINING PUNICALAGIN FROM PEELS OF PUNICA GRANATUM *Priya Hanu 1 , Singh Harmanpreet 2 1 Department of Pharmaceutics, Lovely Professional University, Phagwara, Punjab, India 2 Department of Pharmaceutics, Lovely Professional University, Phagwara, Punjab, India Corresponding Author’s Email: [email protected] Received 13 Oct 2012; Review Completed 25 Oct 2012; Accepted 01 Nov 2012, Available online 15 Nov 2012 ABSTRACT Plant based formulations have been used since ancient times and playing a role as a remedial against various human and animal diseases. The interest in traditional medicines has increased in various parts of world. A well known ancient fruit named as Punica granatum (family- Punicaceae) which is commonly known as Pomegranate, Anar or Dalim in North India whose therapeutic qualities have rebounded and echoed throughout the millennia and regarded as an agent of resurrection for Babylonians; symbol of invincibility on the battle fields for the Persians, while for the ancient Chinese, symbolized for longevity and immortality. Punicalagin is chemically named as 2,3-(S)-hexahydroxydiphenoyl-4,6- (S,S)-gallagyl-D-glucose and belongs to a category of hydrolysable tannin. In this vein, present investigation was an endeavor to formulate the vesicular formulation of Punicalagin. For this, the Punicalagin was extracted, isolated and purified from peels of Punica granatum. Thus, to protect its hydrolysis, it is formulated into a nanocarrier system known as niosomes which is based on the preparation of niosomes by using a non- ionic surfactant in varying amounts and keeping the amount of cholesterol constant. The formulations were evaluated on the basis of evaluation parameters and thus optimized for the best formulation. Keywords: Punica granatum, Punicalagin, Novel Drug Delivery System, Niosomes, Vesicular system. Abbreviations used- EA- Ellagic acid, NSV- Non-ionic surfactant vesicles, TEM- transmission electron microscopy, rpm- revolutions per minute, v/v- volume by volume INTRODUCTION Plants itself offer an immense and prodigious, but not impossible challenge for anyone trying to work out in detail the products of their chemical machinery. Tannins are one of the most widely occurring groups of substances in different families of higher plants. They are high molecular weight plant polyphenols 1 and the secondary metabolites which are present in solution form in cell sap and also in distinct vacuoles. Chemically, tannins contain the mixture of complex organic substances in which polyphenols are present, generally with o-dihydroxy or o- trihydroxy groups on phenyl ring and they are devoid of nitrogen 2 . The pomegranate (L. Punica granatum) belongs to family Punicaceae is commonly known as Anar or Dalim in North India 3 . It is an ancient fruit which has been widely consumed in various cultures for thousands and thousands of years. The Babylonians regarded pomegranate seeds as an agent of resurrection; the Persians believed the seeds conferred invincibility on the battle fields, while for the ancient Chinese, the seeds symbolized longevity and immortality 4 .Pomegranate husk is a traditional Chinese medicine used as antibacterial, anti-inflammatory and hemostasis agent which is rich in phenolic compounds. Among these polyphenols, the most abundant compound is Punicalagin. Punicalagin levels in husk depend upon the area for fruit growth, processing conditions as well as storage conditions 5 . Punicalagin is a potent antioxidant whose bioactivity can be explained by its ability to hydrolyze into Ellagic acid (EA) in vivo and across the mitochondrial membrane in vitro. For the better performance of pharmaceutical formulations with respect to controlled release, bioavailability, storage stability and lesser side effects constitute the main motivation for research of novel drug delivery systems 6 . Novel drug delivery systems are used to improve the drug potency, control drug release to give sustained therapeutic effect, provide safety and reduces toxic effects. It may target/delivery of drugs specifically to tissue, organ or location in the body. There are various novel drug delivery strategies like liposomes, niosomes, aquasomes, microsponges, microemulsions, and solid lipid nanoparticles to enhance the topical delivery of agents. Among different carriers, liposomes and niosomes are well documented for dermal drug delivery 7 .Vesicles formed on hydration of mixture of cholesterol and single alkyl-chain non-ionic surfactants were first introduced by Handjani-Vila. Initially reported as a feature of cosmetic industry, they are now extensively used as drug delivery systems 6 . Niosomes may be defined as a unilamellar or multilamellar vesicles in which the aqueous solution is enclosed in highly ordered bilayers made up of non-ionic surfactants with or without cholesterol and dicetylphosphate and exhibit behaviour similar to liposomes in-vivo 7 . They are capable of entrapping both hydrophilic and hydrophobic drugs as shown in figure 1. Surfactants play an important role in the development of such formulations. A number of non-ionic surfactants have been used to prepare vesicles viz. polyglycerol alkyl ethers, glucosyl dialkyl ethers, crown ethers, ester linked surfactants, polyoxyethylene alkyl ether, brij, and series of spans and tweens. They are made up of biocompatible, non-toxic, non-immunogenic, and non-carcinogenic agents. NSV’s are highly r esistant to hydrolytic degradation. NSVs result from the self assembly of hydrated surfactant monomers. The surfactant molecules self-assemble in aqueous media in such a fashion that the hydrophobic tails face each other to minimize the high energy interactions between the solvent and tails 6 .
Transcript of FORMULATION AND EVALUATION OF NIOSOMES CONTAINING

Priya et al Journal of Drug Delivery & Therapeutics; 2012, 2(6), 56-67 56
© 2011, JDDT. All Rights Reserved ISSN: 2250-1177 CODEN (USA): JDDTAO
Available online at http://jddtonline.info
RESEARCH ARTICLE
FORMULATION AND EVALUATION OF NIOSOMES CONTAINING PUNICALAGIN
FROM PEELS OF PUNICA GRANATUM
*Priya Hanu1, Singh Harmanpreet
2
1Department of Pharmaceutics, Lovely Professional University, Phagwara, Punjab, India
2Department of Pharmaceutics, Lovely Professional University, Phagwara, Punjab, India
Corresponding Author’s Email: [email protected]
Received 13 Oct 2012; Review Completed 25 Oct 2012; Accepted 01 Nov 2012, Available online 15 Nov 2012
ABSTRACT
Plant based formulations have been used since ancient times and playing a role as a remedial against various human and animal diseases. The
interest in traditional medicines has increased in various parts of world. A well known ancient fruit named as Punica granatum (family-
Punicaceae) which is commonly known as Pomegranate, Anar or Dalim in North India whose therapeutic qualities have rebounded and echoed
throughout the millennia and regarded as an agent of resurrection for Babylonians; symbol of invincibility on the battle fields for the Persians,
while for the ancient Chinese, symbolized for longevity and immortality. Punicalagin is chemically named as 2,3-(S)-hexahydroxydiphenoyl-4,6-
(S,S)-gallagyl-D-glucose and belongs to a category of hydrolysable tannin. In this vein, present investigation was an endeavor to formulate the
vesicular formulation of Punicalagin. For this, the Punicalagin was extracted, isolated and purified from peels of Punica granatum. Thus, to
protect its hydrolysis, it is formulated into a nanocarrier system known as niosomes which is based on the preparation of niosomes by using a non-
ionic surfactant in varying amounts and keeping the amount of cholesterol constant. The formulations were evaluated on the basis of evaluation
parameters and thus optimized for the best formulation.
Keywords: Punica granatum, Punicalagin, Novel Drug Delivery System, Niosomes, Vesicular system.
Abbreviations used- EA- Ellagic acid, NSV- Non-ionic surfactant vesicles, TEM- transmission electron microscopy, rpm- revolutions per minute, v/v- volume by volume
INTRODUCTION
Plants itself offer an immense and prodigious, but not impossible challenge for anyone trying to work out in
detail the products of their chemical machinery. Tannins
are one of the most widely occurring groups of substances
in different families of higher plants. They are high
molecular weight plant polyphenols1 and the secondary
metabolites which are present in solution form in cell sap
and also in distinct vacuoles. Chemically, tannins contain
the mixture of complex organic substances in which
polyphenols are present, generally with o-dihydroxy or o-
trihydroxy groups on phenyl ring and they are devoid of
nitrogen2.
The pomegranate (L. Punica granatum) belongs to family
Punicaceae is commonly known as Anar or Dalim in
North India3. It is an ancient fruit which has been widely
consumed in various cultures for thousands and thousands
of years. The Babylonians regarded pomegranate seeds as
an agent of resurrection; the Persians believed the seeds
conferred invincibility on the battle fields, while for the
ancient Chinese, the seeds symbolized longevity and
immortality4.Pomegranate husk is a traditional Chinese
medicine used as antibacterial, anti-inflammatory and
hemostasis agent which is rich in phenolic compounds.
Among these polyphenols, the most abundant compound is Punicalagin. Punicalagin levels in husk depend upon the
area for fruit growth, processing conditions as well as
storage conditions5. Punicalagin is a potent antioxidant
whose bioactivity can be explained by its ability to
hydrolyze into Ellagic acid (EA) in vivo and across the
mitochondrial membrane in vitro.
For the better performance of pharmaceutical formulations
with respect to controlled release, bioavailability, storage
stability and lesser side effects constitute the main
motivation for research of novel drug delivery systems6.
Novel drug delivery systems are used to improve the drug
potency, control drug release to give sustained therapeutic effect, provide safety and reduces toxic effects. It may
target/delivery of drugs specifically to tissue, organ or
location in the body. There are various novel drug
delivery strategies like liposomes, niosomes, aquasomes,
microsponges, microemulsions, and solid lipid
nanoparticles to enhance the topical delivery of agents.
Among different carriers, liposomes and niosomes are
well documented for dermal drug delivery7.Vesicles
formed on hydration of mixture of cholesterol and single
alkyl-chain non-ionic surfactants were first introduced by
Handjani-Vila. Initially reported as a feature of cosmetic industry, they are now extensively used as drug delivery
systems6.
Niosomes may be defined as a unilamellar or
multilamellar vesicles in which the aqueous solution is
enclosed in highly ordered bilayers made up of non-ionic
surfactants with or without cholesterol and
dicetylphosphate and exhibit behaviour similar to
liposomes in-vivo7. They are capable of entrapping both
hydrophilic and hydrophobic drugs as shown in figure 1.
Surfactants play an important role in the development of
such formulations. A number of non-ionic surfactants
have been used to prepare vesicles viz. polyglycerol alkyl ethers, glucosyl dialkyl ethers, crown ethers, ester linked
surfactants, polyoxyethylene alkyl ether, brij, and series of
spans and tweens. They are made up of biocompatible,
non-toxic, non-immunogenic, and non-carcinogenic
agents. NSV’s are highly resistant to hydrolytic
degradation. NSVs result from the self assembly of
hydrated surfactant monomers. The surfactant molecules
self-assemble in aqueous media in such a fashion that the
hydrophobic tails face each other to minimize the high
energy interactions between the solvent and tails6.

Priya et al Journal of Drug Delivery & Therapeutics; 2012, 2(6), 56-67 57
© 2011, JDDT. All Rights Reserved ISSN: 2250-1177 CODEN (USA): JDDTAO
Figure 1: Microscopic structure of a niosome
Advantages of niosomes are: accommodate hydrophilic,
lipophilic as well as amphiphilic drug moieties; niosomes
exhibit flexibility in their structural characteristics
(composition, fluidity and size) and can be designed
according to the desired situation; improve the therapeutic
performance of the drug, protect from the biological
environment, restricts its effect to target cells, thereby
reducing the clearance of drug; act as depot to release the
drug slowly and offer a controlled/sustained release;
increase oral bioavailability of drug; increase the stability of entrapped drug; enhance the skin penetration of
drugs8,9. They can be made to reach the site of action by
oral, parenteral as well as topical routes; surfactants used
are biodegradable, biocompatible and non-immunogenic;
handling and storage of surfactants do not require any
special conditions; the vesicle suspension being water
based offers greater patient compliance over oily dosage
forms10, 11.
The objective of the present study is to develop and
validate a simple, precise, accurate, and economical
analytical method for the estimation of Punicalagin extracted from peels of Punica granatum. To perform the
compatibility study of drug, Punicalagin with the
excipients used in formulating niosomes. To develop a
vesicular system like niosomes which act as carriers and
hence will help in penetration of drug through skin and
provide a prolong release.
MATERIALS
Punicalagin was extracted from pomegranates which were
purchased from local market in Bhiwani, Haryana (India).
Peels were authenticated from National Institute of
Science Communication and Information Resources, New
Delhi, India. The common excipients like methanol, ethanol, acetone, potassium dihydrogen phosphate,
disodium hydrogen phosphate and sodium chloride were
obtained from Loba Chemie Pvt. Ltd., Mumbai. Diethyl
ether was obtained from Central Drug House Pvt. Ltd.,
New Delhi. Span 60 and Cholesterol were obtained from
S.D. Fine Chemicals Ltd., Mumbai, India.
METHODS
1. Extraction, Isolation and Purification of Punicalagin
from peels of Punica granatum
1.1 Extraction and Isolation of Punicalagin from peels
of Punica granatum
Fruits were washed, separated from seeds and juice and
cleaned to yield husks/peels. Peels of the Punica
granatum were dried in shade and powdered them with
the help of blender. Powdered husk was macerated with
water and methanol for 7 days with occasional stirring.
After maceration process was completed, thick husk puree
was squeezed by hand and filtered through muslin cloth to
yield dark brown aqueous extract. The column having
Sephadex LH-20 used as stationary phase and prepared
for chromatography by pre-washing in methanol and pre-
equilibrated in water for 12 hr. The aqueous extract was
divided into portions and adsorbed onto the Sephadex LH-
20. Each column was eluted with excess amount of distilled water until sugary pale yellow elute was clear in
colour. The adsorbed tannins were eluted with methanol to
yield dark brown solution. The collected fractions were
then passed through C18 catridges (Waters Sep-Pak® Vac
20cc) and eluted with methanol to obtain the yellowish
brown solution which contained pure compound,
Punicalagin. The methanol was removed by Rota-
evaporator in vacuo at low temp. (37⁰C) and obtained the
dark brown powder as TPT (total pomegranate tannins)1.
1.2 Purification of Punicalagin from TPT Sephadex
LH-20 resin column was used to isolate the pure compound from TPT. TPT obtained was adsorbed onto a
Sephadex LH-20 column that was pre-equilibrated with
water: methanol (8:2 v/v) and eluted with increasing
amount of methanol. The fraction was evaporated in
vacuo and then re-chromatography was done by pre-
equilibrating column with ethanol. Elution was done with
increasing amounts of water and acetone then to ethanol:
water: acetone (6:3:1 v/v/v) and finally with ethanol:
acetone (1:1 v/v). The fraction was collected and then
evaporated in vacuo to obtain yellowish brown powder as
Punicalagin1.
2. Preformulation Studies of Punicalagin
2.1 Organoleptic Properties The organoleptic properties
include physical state, colour and odour was done by
visual inspection.
2.2 TLC Identification Test
i) Preparation of sample- The powdered drug (0.5g) was
macerated in methanol for 4 days. The extract was filtered
and process was repeated thrice. The filtered extract was
pooled, evaporated to dryness under reduced pressure and
residue was dissolved in methanol.
ii) Preparation of Solvent system- Chloroform: Ethyl
acetate: Formic acid: Methanol in a ratio of 4: 5.2: 0.6: 0.2 was mixed to prepare solvent system. Spotting of the
sample was done with the help of capillary on TLC plate.
The plate was then placed in the solvent system till the
saturation point was reached.
Priya et al Journal of Drug Delivery & Therapeutics; 2012, 2(6), 56-67 58
© 2011, JDDT. All Rights Reserved ISSN: 2250-1177 CODEN (USA): JDDTAO
iii) Visualisation- TLC plate was dipped in a solution
consisting of anisaldehyde (0.5ml), glacial acetic acid (9.5
ml), methanol (85ml) and conc. sulphuric acid (5ml) for a
few seconds. It was then heated at 110⁰C in hot air oven till coloured band appeared and Rf value was then
calculated as in equation (1).
2.3 Chemical identification test- To identify the drug
chemically, a pinch of drug was taken in a test tube and 2
ml of ferric chloride solution was added to it. Presence of a colour shows the presence of tannin.
2.4 Characterisation of Punicalagin
2.4.1 UV spectroscopy Punicalagin was dissolved in
phosphate buffer saline pH 7.4 and the sample was
scanned at wavelength ranging from 200-400nm by UV
spectrophotometer. The absorption maxima were
compared with that available in the literature12.
2.4.2 IR spectroscopy IR spectroscopy of Punicalagin
was performed using FTIR 8400S (Shimadzu). KBr
pellets of Punicalagin were prepared by applying a
pressure of 8 tons in a hydraulic press. The pellets were scanned over a wave number range of 4000–400 cm-1.The
spectrum obtained was interpreted by the literature13.
3. Standard UV Plots
3.1 Determination of absorbance maxima (λmax)
Punicalagin (10mg) was accurately weighed and
transferred to a 100 ml volumetric flask. To this, pH 7.4
PBS was added to dissolve the drug. From this solution, 1
ml of solution was pipetted out in 10 ml volumetric flask
and volume was made upto 10 ml with distilled water. The
sample was scanned on a double beam UV-visible
spectrophotometer. An absorbance maximum of
Punicalagin was determined in pH 7.4 PBS.
3.2 Standard plot of Punicalagin in pH 7.4 Phosphate
buffer The standard plot of Punicalagin was prepared in
pH 7.4 PBS. 10 mg of drug was weighed accurately and
dissolved in 100 ml of pH 7.4 PBS. Appropriate dilutions
were made with buffer to obtain test solutions ranging
from 5µg/ml to 35µg/ml. The absorbance of the drug in
the buffer was measured on a double beam UV-visible
spectrophotometer at λmax of 253.6nm against the
respective blank.
4. Compatibility Study
4.1 Physical characterisation of drug excipient mixture Drug and each excipient were separately passed through
sieve # 20. Drug and each excipient were weighed in the
ratio of 1:1 and mixed properly with 15 ml of water for
injection (WFI) as shown in table 1. Different drug
excipient mixtures were introduced into glass vials
containing 15 ml of water covered with rubber caps which
were followed by labelling. Then the vials were kept
under three different conditions, one at 5 ± 3°C
(refrigerated temperature), 25 ± 2°C (room temperature)
and 40 ± 2°C/ 75 ± 5% RH. Observations were taken on
0th, 7th, 14th, 21st and 28th day for physical compatibility.
4.2 Chemical characterisation of drug excipient
mixture
For chemical compatibility, the study was carried out by
taking the different drug excipient mixtures after 28th day
and analyzed spectrophotometrically by UV.
Table 1: Composition for compatibility study of
Punicalagin with excipients
S.No. Drug+ Excipient+ WFI Ratio of drug and
excipients
1. Drug + WFI 1:1
2. Drug+ Span 60+ WFI 1:1
3. Drug+ Cholesterol+ WFI 1:1
4. All excipients+ WFI 1:1
5. Drug+ all excipients+ WFI 1:1
5. Preparation and Purification of Niosomes
5.1 Preparation of niosomes by ether injection method
Niosomes were prepared using Ether injection method14.
Drug, surfactant and cholesterol were used in the ratios as
indicated in Table 2. Mixture of surfactant (Span 60) and
cholesterol dissolved in a mixture of diethyl ether and
chloroform was slowly introduced through 20-gauge
needle into warm aqueous solution of Punicalagin
maintained at 20°C. Evaporation of ether leads to
formation of single layered vesicles.
5.2 Purification of niosomes by centrifugation method
The prepared niosomes were separated from unentrapped
drug by centrifugation method15. Niosome suspension was
centrifuged at 40,000 rpm (1,37,088 G) for 30 minutes.
Clear supernatant was removed by pipetting and
remaining sediment i.e. niosomes containing only
entrapped drug were obtained for further evaluation.
Table 2: Composition of niosomal formulations of
Punicalagin
S.No. Formulation Surfactant
used
Surfactant:
Cholesterol:
Drug
1. F1 Span 60 1:1:1
2. F2 Span 60 2:1:1
3. F3 Span 60 3:1:1
4. F4 Span 60 4:1:1
5. F5 Span 60 5:1:1
6. F6 Span 60 6:1:1
7. F7 Span 60 7:1:1
8. F8 Span 60 8:1:1
9. F9 Span 60 9:1:1
10. F10 Span 60 10:1:1
6. Evaluation of niosomes
6.1 Optical microscopy The morphology of prepared
niosomes was done by optical microscopy. The
photomicrographs of the preparations were obtained with
the help of photomicroscope at 1000 X.
6.2 Micromeritics studies For the micromeritics study,
the niosomes were probe sonicated and then the vesicle
size and size distribution profile were determined using
dynamic light scattering (DLS) method (Malvern
Instruments Ltd, Worcestershire, UK). Particle size
analysis was done by using particle size analyser.
--- (1)

Priya et al Journal of Drug Delivery & Therapeutics; 2012, 2(6), 56-67 59
© 2011, JDDT. All Rights Reserved ISSN: 2250-1177 CODEN (USA): JDDTAO
6.3 Entrapment efficiency Ultracentrifugation technique
was adopted for the removal of the unentrapped drug. The
centrifuged niosomes were lysed with 0.1% v/v Triton X-
100 and left for 1 hour and filtered to separate drug from
vesicles. Thereafter dilutions were made and solution was analyzed spectrophotometrically employing ultraviolet-
visible spectrophotometer. The entrapment efficiency was
calculated by using following equation:
6.4 Morphology and structure of vesicles The prepared
and optimized formulations were characterized for
morphology (i.e. shape and lamellarity) employing Hitachi TEM analyzer.
6.5 Zeta potential analysis Zeta potential of niosomal
preparation is related to the stability of niosomes. Zeta
potential indicates the degree of repulsion between
adjacent similarly charged particles for small molecules
and particles, a high value of zeta potential confers
stability, i.e. the solution or dispersion will resist
aggregation. Zeta potential for niosomal formulation was
performed using Zeta sizer Beckman coulter instrument.
6.6 Stability studies of Punicalagin containing
niosomes Physical stability studies were carried out to investigate the leaching of drug from niosomes (in a
suspension form) during storage. The optimized niosomal
formulation (F7) composed of Span 60 and cholesterol in
7:1 molar ratio were sealed in 20 ml glass vials and stored
at refrigeration temperature (5 ± 3°C) for a period of 2
months. Samples were withdrawn at definite time interval
of 15 days and the percentage entrapment of the drug was
determined as described previously after separation from
unentrapped drug.
RESULTS
1. Preformulation studies
1.1 Organoleptic properties
Figure 2: Punicalagin
1.2 TLC Identification test Purple pink colour was
appeared and Rf value was observed 0.53 (whereas
reported value of Rf is 0.58 in ICMR) as shown in figure
3.
Figure 3: TLC showing detection of Punicalagin
1.3 Chemical identification test On addition of ferric
chloride to small amount of drug, a blue colour was
appeared that indicated the presence of hydrolysable
tannin.
1.4 Characterisation of Punicalagin
1.4.1 UV spectroscopy the absorbance maximum (λmax)
of Punicalagin in PBS pH7.4 was determined which are
shown in figure 4. The max of Punicalagin in phosphate buffer pH 7.4 was found to be 253.6 nm.
Figure 4: UV absorption spectra of Punicalagin in phosphate buffer pH 7.4
Priya et al Journal of Drug Delivery & Therapeutics; 2012, 2(6), 56-67 60
© 2011, JDDT. All Rights Reserved ISSN: 2250-1177 CODEN (USA): JDDTAO
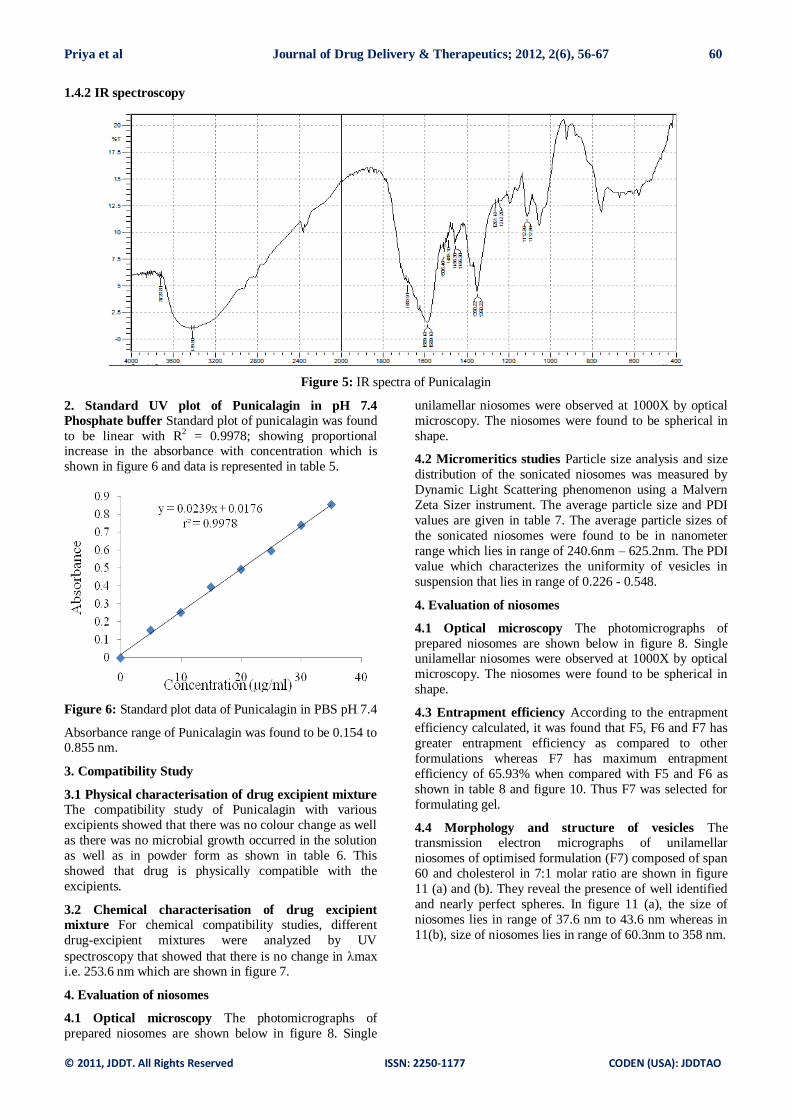
1.4.2 IR spectroscopy
Figure 5: IR spectra of Punicalagin
2. Standard UV plot of Punicalagin in pH 7.4
Phosphate buffer Standard plot of punicalagin was found
to be linear with R2 = 0.9978; showing proportional increase in the absorbance with concentration which is
shown in figure 6 and data is represented in table 5.
Figure 6: Standard plot data of Punicalagin in PBS pH 7.4
Absorbance range of Punicalagin was found to be 0.154 to 0.855 nm.
3. Compatibility Study
3.1 Physical characterisation of drug excipient mixture
The compatibility study of Punicalagin with various
excipients showed that there was no colour change as well
as there was no microbial growth occurred in the solution
as well as in powder form as shown in table 6. This
showed that drug is physically compatible with the
excipients.
3.2 Chemical characterisation of drug excipient
mixture For chemical compatibility studies, different
drug-excipient mixtures were analyzed by UV
spectroscopy that showed that there is no change in max i.e. 253.6 nm which are shown in figure 7.
4. Evaluation of niosomes
4.1 Optical microscopy The photomicrographs of
prepared niosomes are shown below in figure 8. Single
unilamellar niosomes were observed at 1000X by optical
microscopy. The niosomes were found to be spherical in
shape.
4.2 Micromeritics studies Particle size analysis and size
distribution of the sonicated niosomes was measured by
Dynamic Light Scattering phenomenon using a Malvern
Zeta Sizer instrument. The average particle size and PDI
values are given in table 7. The average particle sizes of
the sonicated niosomes were found to be in nanometer
range which lies in range of 240.6nm – 625.2nm. The PDI
value which characterizes the uniformity of vesicles in
suspension that lies in range of 0.226 - 0.548.
4. Evaluation of niosomes
4.1 Optical microscopy The photomicrographs of
prepared niosomes are shown below in figure 8. Single unilamellar niosomes were observed at 1000X by optical
microscopy. The niosomes were found to be spherical in
shape.
4.3 Entrapment efficiency According to the entrapment
efficiency calculated, it was found that F5, F6 and F7 has
greater entrapment efficiency as compared to other
formulations whereas F7 has maximum entrapment
efficiency of 65.93% when compared with F5 and F6 as
shown in table 8 and figure 10. Thus F7 was selected for
formulating gel.
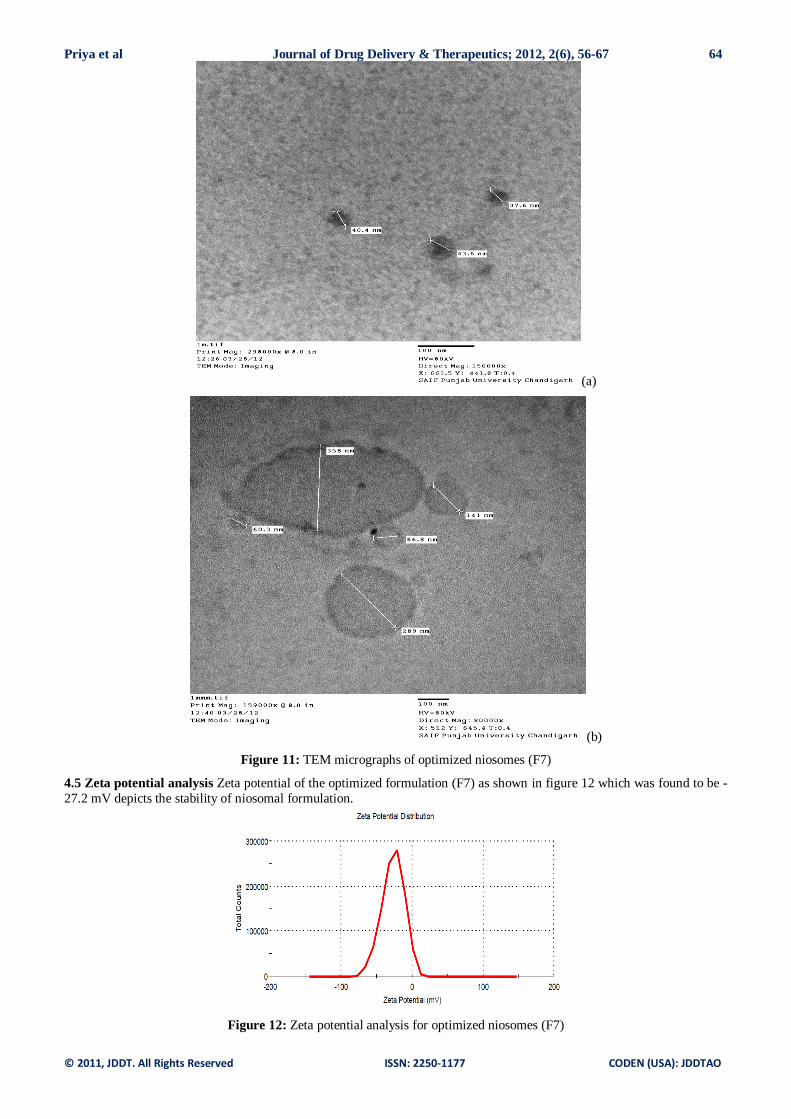
4.4 Morphology and structure of vesicles The transmission electron micrographs of unilamellar
niosomes of optimised formulation (F7) composed of span
60 and cholesterol in 7:1 molar ratio are shown in figure
11 (a) and (b). They reveal the presence of well identified
and nearly perfect spheres. In figure 11 (a), the size of
niosomes lies in range of 37.6 nm to 43.6 nm whereas in
11(b), size of niosomes lies in range of 60.3nm to 358 nm.

Priya et al Journal of Drug Delivery & Therapeutics; 2012, 2(6), 56-67 61
© 2011, JDDT. All Rights Reserved ISSN: 2250-1177 CODEN (USA): JDDTAO
(a) (b)
(c) (d)
(e) (f)
(g) (h)
Figure 7: Compatibility study data of Punicalagin with different excipients done and by UV spectroscopy (a) Drug at 0 th
day (b) Drug at 28th day (c) Drug+ Span60 at 0
th day (d) Drug+ Span60 at 28
th day (e) Drug+ Cholesterol at 0
th day (f)
Drug+ Cholesterol at 28th day (g) Drug+ Mixture of all excipients at 0th day (h) Drug+ Mixture of all excipients at 28th day.

Priya et al Journal of Drug Delivery & Therapeutics; 2012, 2(6), 56-67 62
© 2011, JDDT. All Rights Reserved ISSN: 2250-1177 CODEN (USA): JDDTAO
(a) (b) (c)
(d) (e) (f)
(g) (h) (i)
(j)
Figure 8: Photomicrographs of different formulations at 1000 X (a) F1 (b) F2 (c) F3 (d) F4 (e) F5 (f) F6 (g) F7 (h) F8 (i) F9
(j) F10

Priya et al Journal of Drug Delivery & Therapeutics; 2012, 2(6), 56-67 63
© 2011, JDDT. All Rights Reserved ISSN: 2250-1177 CODEN (USA): JDDTAO
Figure 9: Graphs showing (a) Particle size (b) PDI range for all niosomal formulations
Figure 10: Comparison of entrapment efficiency of all formulations
Formulations (a)
Particle size range
Formulations (b)
P.D.I. range
Priya et al Journal of Drug Delivery & Therapeutics; 2012, 2(6), 56-67 64
© 2011, JDDT. All Rights Reserved ISSN: 2250-1177 CODEN (USA): JDDTAO
(a)
(b)
Figure 11: TEM micrographs of optimized niosomes (F7)
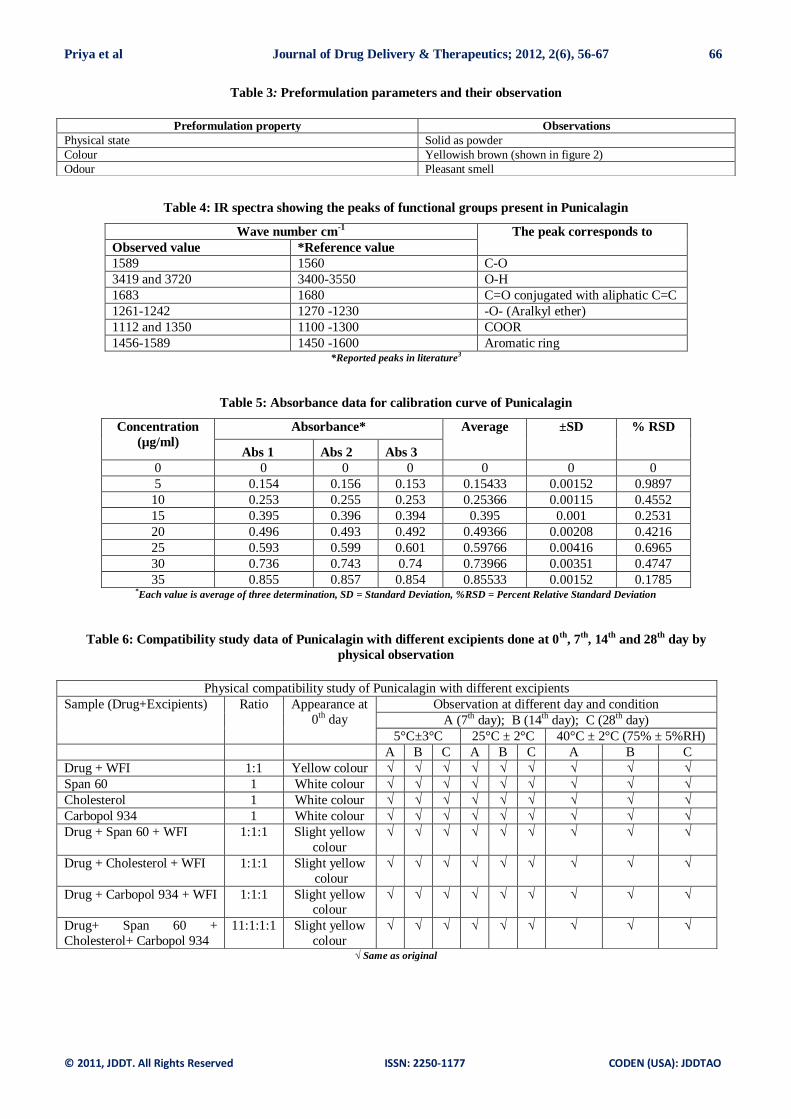
4.5 Zeta potential analysis Zeta potential of the optimized formulation (F7) as shown in figure 12 which was found to be -
27.2 mV depicts the stability of niosomal formulation.
Figure 12: Zeta potential analysis for optimized niosomes (F7)

Priya et al Journal of Drug Delivery & Therapeutics; 2012, 2(6), 56-67 65
© 2011, JDDT. All Rights Reserved ISSN: 2250-1177 CODEN (USA): JDDTAO
4.6 Stability studies: Drug leakage study Physical
stability studies were carried out to investigate the
leaching of drug from the niosomes of optimized
formulation (F7) during storage at refrigerator
temperature. The percentage of entrapment efficiency of Punicalagin after a period of 2 months got reduced to 25%
as shown in table 9.
DISCUSSION
Punicalagin which was extracted, isolated and purified
from the peels of the Punica granatum, was identified by
carrying out chemical identification test, thin layer
chromatography (TLC), UV spectrophotometry and FTIR.
Compatibility studies of Punicalagin with the excipients
used during the work were conducted for 28 days and
observed that drug is compatible with the excipients
physically and chemically. On the basis of the findings, it
can be stated that the formulation F7 is the best
formulation from all the other formulations which were
prepared by different compositions of Span 60. The F7
formulation has greater entrapment efficiency as
compared to other formulations, as F7 showed 65.93% whereas F5 and F6 showed 56.68% and 59% respectively.
Also, F7 has particle size of lowest value as compared to
others i.e. 259.5 nm as shown in figure 13. TEM, zeta
potential and stability studies were conducted for the best
formulation F7. TEM studies showed that niosomes in F7
are nearly perfectly spheres whereas zeta potential study
showed the stability of formulation F7. The future
perspective of this study is that further experiments can be
carried out by incorporating this drug into different
vesicular system and their comparison or by using
different non-ionic surfactants in different ratios or by
changing the amount of cholesterol
Figure 13: Particle size distribution and Particle size analysis of F7
ACKNOWLEDGEMENTS
I wish to acknowledge and give special thanks to the
Assistant Professor Dr. Umaranjan Lal and Ms. Purnima
Verma for their help and guidance during the research.
CONFLICT OF INTEREST
This research work has been conducted as there is very
less research work done on the aspect of its formulation
part as well as on the particular constituent extracted from the Punica granatum.
REFERENCES
1. Seeram N, Lee R, Hardy M, Heber D, Rapid large scale purification of
Ellagitannins from pomegranate husk a byproduct of the commercial
juice industry, Separation and Purification Technology, 2005, 41 (1),
49-55.
2. Kokate CK, Purohit AP, Gokhale SB. Text book of Pharmacognosy.
33rd ed. Pune: Nirali Prakshan; 2006. p. 255- 257.
3. Agli MD, Germana, GV, Bulgari M, Basilico N, Romeo S,
Bhattacharya D, Taramelli D, Bosisio E, Ellagitannins of the fruit rind
of pomegranate anatagonoze in vitro the host inflammatory response
mechanisms involved in the onset of malaria. Malaria Journal, 2010,
208(9), 1-9.
4. Martos MV, Fernandez L, Alvarej JAP, Pomegranates and its many
functional components as related to human health – A review,
Comprehensive Reviews in Food Science and Food Safety, 2010, 9(6),
1-20.
5. Lu J, Ding K, Yuan Q, Determination of Punicalagin isomers in
pomegranate husk, Chromatographia, 2008, 68(3/4), 303-306.
6. Mehta RT, Keyhani A, Mcqueen TJ, Rosenbaum B, Rolston KV,
Tarrand JJ, In vitro activities of free and liposomal drugs against
Mycobacterium avium –M. Intracellulare complex and M.
Tuberculosis. Antimicrobial Agents and Chemotherapy, 1993, 37(12),
2584-2587.
7. Shahiwala A, Misra A, Studies in topical application of niosomally
entrapped Nimesulide, Journal of Pharmacy and Pharmaceutical
Science, 2002, 5(3), 220-225.
8. Choi MJ, Maibach HI, Liposomes and niosomes as topical drug
delivery system, Skin Pharmacology and Physiology, 2005, 18(5),
209-219.
9. Honeywell-Nguyen PL, Bouwstra JA, Vesicles as a tool for
transdermal and dermal delivery, Drug Delivery Formulation
Nanotechnology, 2005, 2(1), 67-74.
10. Karim K, Mandal AS, Biswas N, Guha A, Chatterjee S, Behera M,
Kuotsu K, Niosomes- A Future of Targeted Drug Delivery System,
Journal of Advanced Technology and Research, 2010, 1(4), 374-380.
11. Muzzalupo R, Tavano L, Trombino S, Cassano R, Picci N, Mesa CL,
Niosomes from α,ώ,-trioxyethylene-bis(sodium2-dodecyloxy-
propylenesulfonate): Preparation, characterization, Colloids and
Surfaces B: Biointerfaces 2008, 64(2), 200–207.
12. Gil MI, Barberan FAT, Pierce BH, Holcroft DM, Kader AA,
Antioxidant activity of pomegranate juice and its relationship with
phenolic composition and processing, Journal of Agricultural and Food
Chemistry 2000, 48(10), 4581-4589.
13. Furniss BS, Hannaford AJ, Smith PWG, Tatchell AR, Vogel’s
textbook of practical organic chemistry. 5th edition. New York:
Longman Scientific and Technical; 1988. p. 271- 316.
14. Karki R, Mamatha GC, Subramanya G, Udupa N, Preparation,
characterization and tissue disposition of niosomes containing
isoniazid, Rasayan Journal of Chemistry, 2008, 1(2), 224-227.
15. Hao Y, Zhao F, Li N, Yang Y, Studies on a high encapsulation of
colchicine by a niosome system, International Journal of
Pharmaceutics, 2002, 244(1-2), 73-80.
Priya et al Journal of Drug Delivery & Therapeutics; 2012, 2(6), 56-67 66
© 2011, JDDT. All Rights Reserved ISSN: 2250-1177 CODEN (USA): JDDTAO
Table 3: Preformulation parameters and their observation
Table 4: IR spectra showing the peaks of functional groups present in Punicalagin
Wave number cm-1
The peak corresponds to
Observed value *Reference value
1589 1560 C-O
3419 and 3720 3400-3550 O-H
1683 1680 C=O conjugated with aliphatic C=C
1261-1242 1270 -1230 -O- (Aralkyl ether)
1112 and 1350 1100 -1300 COOR
1456-1589 1450 -1600 Aromatic ring *Reported peaks in literature
3
Table 5: Absorbance data for calibration curve of Punicalagin
Concentration
(µg/ml)
Absorbance* Average ±SD % RSD
Abs 1 Abs 2 Abs 3
0 0 0 0 0 0 0
5 0.154 0.156 0.153 0.15433 0.00152 0.9897
10 0.253 0.255 0.253 0.25366 0.00115 0.4552
15 0.395 0.396 0.394 0.395 0.001 0.2531
20 0.496 0.493 0.492 0.49366 0.00208 0.4216
25 0.593 0.599 0.601 0.59766 0.00416 0.6965
30 0.736 0.743 0.74 0.73966 0.00351 0.4747
35 0.855 0.857 0.854 0.85533 0.00152 0.1785 *Each value is average of three determination, SD = Standard Deviation, %RSD = Percent Relative Standard Deviation
Table 6: Compatibility study data of Punicalagin with different excipients done at 0th
, 7th
, 14th
and 28th
day by
physical observation
√ Same as original
Preformulation property Observations
Physical state Solid as powder
Colour Yellowish brown (shown in figure 2)
Odour Pleasant smell
Physical compatibility study of Punicalagin with different excipients
Sample (Drug+Excipients) Ratio Appearance at
0th day
Observation at different day and condition
A (7th day); B (14th day); C (28th day)
5°C±3°C 25°C ± 2°C 40°C ± 2°C (75% ± 5%RH)
A B C A B C A B C
Drug + WFI 1:1 Yellow colour √ √ √ √ √ √ √ √ √
Span 60 1 White colour √ √ √ √ √ √ √ √ √
Cholesterol 1 White colour √ √ √ √ √ √ √ √ √
Carbopol 934 1 White colour √ √ √ √ √ √ √ √ √
Drug + Span 60 + WFI 1:1:1 Slight yellow
colour
√ √ √ √ √ √ √ √ √
Drug + Cholesterol + WFI 1:1:1 Slight yellow
colour
√ √ √ √ √ √ √ √ √
Drug + Carbopol 934 + WFI
1:1:1 Slight yellow colour
√ √ √ √ √ √ √ √ √
Drug+ Span 60 +
Cholesterol+ Carbopol 934
11:1:1:1 Slight yellow
colour
√ √ √ √ √ √ √ √ √

Priya et al Journal of Drug Delivery & Therapeutics; 2012, 2(6), 56-67 67
© 2011, JDDT. All Rights Reserved ISSN: 2250-1177 CODEN (USA): JDDTAO
Table 7: Values of Average particle size and Polydispersity index (P.D.I) for different formulations
Formulation Particle size range (in nm) P.D.I. range
F1 334.8 0.548
F2 279.6 0.227
F3 291.7 0.214
F4 278.7 0.236
F5 240.6 0.304
F6 336.8 0.270
F7 259.5 0.226
F8 294.1 0.324
F9 440.7 0.505
F10 625.2 0.438
Table 8: Entrapment efficiency of niosomal formulations
S. No. Formulation name % drug entrapment*
1 F1 28.97 ± 0.06
2 F2 32.18 ± 0.06
3 F3 35.29 ± 0.06
4 F4 44.96 ± 0.04
5 F5 56.68 ± 0.12
6 F6 59.00 ± 0.06
7 F7 65.93 ± 0.06
8 F8 55.70 ± 0.08
9 F9 46.73 ± 0.12
10 F10 42.50 ± 0.13 *Average of three determinants ± S.D.
Table 9: Stability data of niosomal formulation F7
*Average of three determinations ± S.D
Days 5±3°C
0th day 65.66 ± 0.14
15th day 62.66 ± 0.03
30th day 60.16 ± 0.04
45th day 52.20 ± 0.11
60st day 49.63 ± 0.10


![ISSN: 2538-5887; Pathobiology Research. 2019;22(3):113-120 ...jast.modares.ac.ir/article-30-20850-fa.pdf · [9] Formulation and in vitro assessment of minoxidil niosomes for enhanced](https://static.fdocuments.in/doc/165x107/5fc16794f9df477382129322/issn-2538-5887-pathobiology-research-2019223113-120-jast-9-formulation.jpg)