Formulation and Characterization of Nanoclay...
58
Defence R&D Canada – Atlantic DEFENCE DÉFENSE & Formulation and Characterization of Nanoclay Composites Towards Multifunctional Materials for the Dismounted Soldier Royale S. Underhill Allison Nolting Gary Fisher Irv Keough Defence R&D Canada – Atlantic Nathalie Chapleau Industrial Materials Institute National Research Council Canada Technical Memorandum DRDC Atlantic TM 2009-017 September 2009 Copy No. _____ Defence Research and Development Canada Recherche et développement pour la défense Canada
Transcript of Formulation and Characterization of Nanoclay...

Defence R&D Canada – Atlantic
DEFENCE DÉFENSE&
Formulation and Characterization of Nanoclay
Composites
Towards Multifunctional Materials for the DismountedSoldier
Royale S. UnderhillAllison NoltingGary FisherIrv KeoughDefence R&D Canada – Atlantic
Nathalie ChapleauIndustrial Materials InstituteNational Research Council Canada
Technical Memorandum
DRDC Atlantic TM 2009-017
September 2009
Copy No. _____
Defence Research andDevelopment Canada
Recherche et développementpour la défense Canada

This page intentionally left blank.
Formulation and Characterization of NanoclayCompositesTowards Multifunctional Materials for the Dismounted Soldier
Royale S. UnderhillAllison NoltingGary FisherIrv KeoughDefence R&D Canada — Atlantic
Nathalie ChapleauIndustrial Materials InstituteNational Research Council Canada
Defence R&D Canada – AtlanticTechnical MemorandumDRDC Atlantic TM 2009-017September 2009
Principal Author
Royale S. Underhill
Approved by
Leon M. ChengHead/Dockyard Laboratory (Atlantic)
Approved for release by
Calvin V. HyattChair/Document Review Panel
c© Her Majesty the Queen in Right of Canada as represented by the Minister of NationalDefence, 2009
c© Sa Majeste la Reine (en droit du Canada), telle que representee par le ministre de laDefense nationale, 2009
Original signed by Royale S. Underhill
Original signed by Leon M. Cheng
Original signed by Ron Kuwahara for

Abstract
Nanocomposites are a promising new area in material science. Many researchers havedescribed the benefits of nanoscale fillers. The incorporation of nanosized particles withhigh aspect ratios into polymers has led to new composites with improved physical prop-erties such as improved strength, UV absorbance and fire resistance. The work reportedhere compared the physical properties of various nanoclay formulations. Degree of clayloading, the use of compatibilizing agent and natural vs. synthetic clay were all examined.Polyamide and polypropylene were chosen as the matrix materials, with Cloisite 15A asthe natural clay and Perkalite F100, Somasif ME or Lucentite SWN as the synthetic clays.Samples of neat, 2 wt.% and 4 wt.% clay were prepared and analyzed using scanning elec-tron micrography and x-ray diffraction to determine dispersion. The physical propertiesof the nanocomposites were then examined using thermogravimetric analysis, dynamicmechanical analysis, quasistatic tensile testing, impact testing, abrasion testing and conecalorimetry. The particles in the polyamide nanocomposites appeared to be better dispersedthan in the polypropylene nanocomposites. The physical properties of the nanocompositesshowed minor improvements over the parent polymer, while the addition of nanoclaysto the polyamide system imparted better physical properties than the polypropylene. Itis believed that poor dispersion played a role in the lack of significant improvements inmaterial properties.
Resume
L’etude des nanocomposites constitue un nouveau domaine prometteur de la science desmateriaux. De nombreux chercheurs ont deja decrit les avantages que comporte l’utilisationde matieres de charge nanometriques. L’incorporation de nanoparticules possedant un rap-port de forme eleve a des polymeres a permis de produire de nouveaux composites dontles proprietes physiques ameliorees comprennent une resistance accrue, une meilleure ab-sorption du rayonnement UV et une resistance au feu superieure. Les travaux decrits dansle present rapport visaient a comparer les proprietes physiques de diverses formulations abase de nanoargile. On a examine les effets de l’importance de la charge de nanoargiles, del’utilisation d’agents de compatibilite et de l’emploi d’argile naturelle ou synthetique. Lesmateriaux de matrice etudies etaient un polyamide et un polypropylene, l’argile naturellechoisie etait la Cloisite 15A, et les argiles synthetiques comprenaient la Perkalite F100, laSomasif ME et la Lucentite SWN. On a prepare des echantillons purs et des echantillonscontenant 2% en poids et 4% en poids d’argile ; leur analyse a ete effectuee par microscopieelectronique a balayage et par diffraction des rayons X afin de determiner le degre de dis-persion des particules. On a ensuite etudie les proprietes physiques des nanocomposites aumoyen des techniques d’analyse thermogravimetrique et d’analyse mecanique dynamique,d’essais de traction en mode quasi statique, d’essais au choc, d’essais d’abrasion et d’essaisau calorimetre a cone. Les resultats semblent indiquer que la dispersion des particules est
DRDC Atlantic TM 2009-017 i

meilleure dans les nanocomposites de polyamide que dans ceux de polypropylene. Lesproprietes physiques des nanocomposites sont legerement superieures a celles du polymereinitial ; d’autre part, l’ajout de nanoargiles au polyamide a produit des nanocompositespresentant de meilleures proprietes physiques que dans le cas de leur ajout au polypropylene.On considere que la mauvaise dispersion des particules a joue un role dans la pietre ame-lioration des proprietes physiques des produits finaux.
ii DRDC Atlantic TM 2009-017

Executive summary
Formulation and Characterization of NanoclayComposites: Towards Multifunctional Materials for theDismounted Soldier
Royale S. Underhill, Allison Nolting, Gary Fisher, Irv Keough, NathalieChapleau; DRDC Atlantic TM 2009-017; Defence R&D Canada – Atlantic;September 2009.
Background: Nanocomposites are a promising new area in material science. Many re-searchers have described the benefits of nanoscale fillers. The incorporation of nanosizedparticles with high aspect ratios into polymers has led to new materials with unique proper-ties. Nanoclay/polymer composites are polymers reinforced with nanosized clay particles.The nanosized clay particles are achieved by either intercalating the polymer into theclay galleries or completely exfoliating the clay platelets to yield particles with averagedimensions of 1 nm in thickness and 70–150 nm in width.
It has been shown that incorporating nanoclays into polymers can increase the mechanicaland thermal properties of the polymers. These include improved strength, modulus, UVabsorbance and fire resistance. This project compares the physical properties of variousnanocomposite formulations to determine the degree of improvement. The core of thisresearch is the examination of the effects of different levels of exfoliation and differentdegrees of loading on polypropylene and polyamide.
Polyamide and polypropylene were chosen as the matrix material for these nanocompositesbecause they can be used in clothing. Polyamide is also known as nylon, while polypropy-lene has been used as a synthetic material for thermal clothing (i.e., long johns). By addingnanoclays to these materials, it is hoped that the resulting nanocomposites will be impartedwith multifunctionality; regular clothing will have improved fire resistance, UV protection,etc.
Results: The progress to date in preparing and characterizing polypropylene and polyamidenanoclay composites is reported here. Samples of neat, 2 wt.% and 4 wt.% Cloisite15A have been prepared. Micrographs and X-ray Diffractometry data suggest that theparticles in the polyamide nanocomposites are better dispersed than in the polypropylenenanocomposites. The physical properties of the nanocomposites show minor improvementsover the parent polymer, while the addition of nanoclays to the polyamide system impartsbetter physical properties than the polypropylene. It is believed that poor dispersion playeda role in the lack of significant improvements in material properties.
DRDC Atlantic TM 2009-017 iii
Significance of Results: This work represents an initial examination of nanoclay compos-ites as multifunctional materials for the dismounted soldier. The predicted improvementsin physical properties were not realized, likely due to poor dispersion of the clay. Thistechnology has a low technology readiness level (TRL 2-3). More basic research focusedon dispersion issues is needed to determine if the physical property improvements andmultifunctionality can be achieved, before these composites can be evaluated as viabletechnologies for military applications.
Future Plans: The primary concern is the dispersion of the clays. Improved dispersionwas explored through the examination of synthetic clays that were chosen to optimizeinteractions with the polymer matrices. The polyamide/synthetic clay systems showed themost significant improvements in physical properties, thus they will be further character-ized using cone calorimetry.
In situ synthesis of the polymer, such that it is “grown” within the clay galleries is anotheroption to improve clay/polymer dispersion. This method for making polyamide nanoclaycomposites will be explored.
The goal was to create materials with multifunctionality. One possible function is theability to prevent transmittance of UV light, yielding a nanocomposite with a sun protectionfactor (SPF). Thus the transmittance of UV wavelengths will also be investigated.
iv DRDC Atlantic TM 2009-017
Sommaire
Formulation and Characterization of NanoclayComposites: Towards Multifunctional Materials for theDismounted Soldier
Royale S. Underhill, Allison Nolting, Gary Fisher, Irv Keough, NathalieChapleau ; DRDC Atlantic TM 2009-017 ; R & D pour la defense Canada –Atlantique ; septembre 2009.
Contexte : L’etude des nanocomposites constitue un nouveau domaine prometteur de lascience des materiaux. De nombreux chercheurs ont deja decrit les avantages que com-porte l’utilisation de matieres de charge nanometriques. L’incorporation de nanopartic-ules possedant un rapport de forme eleve a des polymeres a permis de produire de nou-veaux materiaux aux proprietes exceptionnelles. Les composites a base de polymere etde nanoargile sont composes d’un polymere renforce de particules d’argile nanometriques.Celles-ci sont obtenues en effectuant l’intercalation du polymere dans les strates d’argile ouen executant une exfoliation complete des plaquettes d’argile afin de produire des particulesayant, en moyenne, 1 nanometre d’epaisseur et de 70 a 150 nanometres de largeur.
Les resultats de certaines etudes demontrent que l’incorporation de nanoargiles aux poly-meres peut entraıner une amelioration des proprietes mecaniques et thermiques des poly-meres, et se traduire, entre autres, par une resistance et un module accrus, une meilleureabsorption du rayonnement UV et une resistance au feu superieure. Le projet faisant l’objetdu present rapport avait pour but de comparer les proprietes physiques de diverses formu-lations de nanocomposites afin d’etablir l’importance de leur amelioration par rapport acelles des composes initiaux. L’objectif principal des travaux de recherche etait d’etudierles effets de differents degres d’exfoliation des argiles et de differentes quantites de matierede charge ajoutees au polypropylene et au polyamide.
Un polyamide et un polypropylene ont ete choisis comme materiaux de matrice des nano-composites, car ces types de polymeres peuvent etre utilises pour fabriquer des vetements.Le polyamide le plus courant est appele nylon, alors que le polypropylene est utilise commemateriau synthetique dans les vetements thermiques (c. a-d. les calecons longs). On s’at-tend a ce que l’ajout de nanoargiles a ces materiaux donne des nanocomposites de naturemultifonctionnelle et que les vetements courants fabriques avec ceux-ci possedent, entreautres proprietes, une resistance au feu superieure et une meilleure protection contre lerayonnement UV.
Resultats : Le present rapport contient la description des progres realises jusqu’ici enmatiere de preparation et de caracterisation de composites a base de nanoargiles et d’un
DRDC Atlantic TM 2009-017 v
polymere (un polypropylene ou un polyamide). On a prepare des echantillons purs et desechantillons contenant 2% en poids et 4% en poids de Cloisite 15A. Leurs micrographieset les donnees de leur analyse par diffraction des rayons X semblent indiquer que la disper-sion des particules est meilleure dans les nanocomposites de polyamide que dans ceux depolypropylene. Les proprietes physiques des nanocomposites sont legerement superieuresa celles du polymere initial ; d’autre part, l’ajout de nanoargiles au polyamide a produit desnanocomposites presentant de meilleures proprietes physiques que dans le cas de leur ajoutau polypropylene. On considere que la mauvaise dispersion des particules a joue un roledans la pietre amelioration des proprietes physiques des produits finaux.
Portee : Les travaux decrits dans le present rapport constituent une etude initiale de l’u-tilisation possible de composites a base de nanoargile comme materiaux multifonctionnelspour le soldat de l’infanterie debarquee. L’amelioration prevue des proprietes physiques nes’est toutefois pas concretisee, probablement a cause de la pietre dispersion des nanopar-ticules d’argile. La technologie associee a ces travaux presente un faible niveau d’etat depreparation de la technologie (TRL de 2 a 3). Avant d’entreprendre l’evaluation de com-posites ce type comme materiaux techniques ayant des applications militaires pratiques,il faudra executer d’autres travaux de recherche fondamentale portant sur les questionsde dispersion des particules dans ceux-ci et determiner s’il est possible d’ameliorer leursproprietes physiques et de les integrer a des materiaux multifonctionnels.
Travaux futurs : Le probleme de dispersion des particules d’argile constitue le principalsujet d’interet. On a etudie des moyens d’ameliorer la dispersion, notamment en examinantdes argiles synthetiques choisies en fonction de leur capacite d’optimiser les interactionsavec les matrices polymeres. Les composites de polyamide et d’argile synthetique etantceux dont les proprietes physiques presentent les plus importantes ameliorations, leur car-acterisation plus poussee sera realisee en effectuant des essais au calorimetre a cone.
La synthese in situ du polymere utilise dans les composites, c’est-a-dire sa � croissance �dans les strates memes de l’argile, constitue une autre solution possible au probleme dedispersion des particules d’argile. On envisage donc d’etudier en detail l’emploi de cettemethode pour produire des composites de nanoargile et de polyamide.
L’objectif global du projet etait de fabriquer des materiaux multifonctionnels. Parmi lesnombreuses fonctions que pourraient presenter ces materiaux, on trouve la capacite dereduire le facteur de transmission du rayonnement UV, ce qui correspondrait a un nanocom-posite possedant un facteur de protection solaire (FPS) intrinseque. Par consequent, lesfuturs travaux de recherche comprendront aussi l’etude du facteur de transmission deslongueurs d’onde du rayonnement UV.
vi DRDC Atlantic TM 2009-017

Table of contents
Abstract . . . . . . . . . . . . . . . . . . . . . . . . . . . . . . . . . . . . . . . . . i
Resume . . . . . . . . . . . . . . . . . . . . . . . . . . . . . . . . . . . . . . . . . i
Executive summary . . . . . . . . . . . . . . . . . . . . . . . . . . . . . . . . . . . iii
Sommaire . . . . . . . . . . . . . . . . . . . . . . . . . . . . . . . . . . . . . . . . v
Table of contents . . . . . . . . . . . . . . . . . . . . . . . . . . . . . . . . . . . . vii
List of figures . . . . . . . . . . . . . . . . . . . . . . . . . . . . . . . . . . . . . . ix
List of tables . . . . . . . . . . . . . . . . . . . . . . . . . . . . . . . . . . . . . . . x
Acknowledgements . . . . . . . . . . . . . . . . . . . . . . . . . . . . . . . . . . . xi
1 Background . . . . . . . . . . . . . . . . . . . . . . . . . . . . . . . . . . . . . 1
2 Materials . . . . . . . . . . . . . . . . . . . . . . . . . . . . . . . . . . . . . . 3
3 Nanoclay dispersion . . . . . . . . . . . . . . . . . . . . . . . . . . . . . . . . . 5
3.1 Polypropylene . . . . . . . . . . . . . . . . . . . . . . . . . . . . . . . . 5
3.2 Polyamide . . . . . . . . . . . . . . . . . . . . . . . . . . . . . . . . . . 8
4 Nanocomposite physical properties . . . . . . . . . . . . . . . . . . . . . . . . . 12
4.1 Thermogravimetric analysis . . . . . . . . . . . . . . . . . . . . . . . . . 12
4.2 Differential scanning calorimetry . . . . . . . . . . . . . . . . . . . . . . 13
4.3 Dynamic mechanical analysis . . . . . . . . . . . . . . . . . . . . . . . . 14
4.4 Quasi-static tensile testing . . . . . . . . . . . . . . . . . . . . . . . . . . 15
4.5 Impact testing . . . . . . . . . . . . . . . . . . . . . . . . . . . . . . . . 24
4.6 Abrasion testing . . . . . . . . . . . . . . . . . . . . . . . . . . . . . . . 24
4.7 Flammability testing . . . . . . . . . . . . . . . . . . . . . . . . . . . . . 26
5 Conclusions . . . . . . . . . . . . . . . . . . . . . . . . . . . . . . . . . . . . . 29
6 Future work . . . . . . . . . . . . . . . . . . . . . . . . . . . . . . . . . . . . . 30
DRDC Atlantic TM 2009-017 vii
References . . . . . . . . . . . . . . . . . . . . . . . . . . . . . . . . . . . . . . . . 31
Annex A: Abrasion Test Data . . . . . . . . . . . . . . . . . . . . . . . . . . . . . 33
Annex B: Cone Calorimetry Test Data . . . . . . . . . . . . . . . . . . . . . . . . . 35
viii DRDC Atlantic TM 2009-017

List of figures
Figure 1: Preparation of clay nanocomposites. a) conventional microcomposite,b) intercalated, c) exfoliated (i.e., nanocomposite). . . . . . . . . . . . . 1
Figure 2: SEM images of natural and synthetic clay PP nanocomposites. . . . . . . 6
Figure 3: XRD of uncompatibilized natural clay (Cloisite 15A) in PP. . . . . . . . 7
Figure 4: XRD of synthetic clay (Perkalite F100) in PP. . . . . . . . . . . . . . . . 7
Figure 5: SEM images of natural clay (Cloisite 15A) PA nanocomposites. . . . . . 9
Figure 6: SEM images of synthetic clay PA nanocomposites. . . . . . . . . . . . . 10
Figure 7: XRD of uncompatibilized natural clay (Cloisite 15A) in PA. . . . . . . . 11
Figure 8: XRD of synthetic clay (Somasif ME) in PA. . . . . . . . . . . . . . . . . 11
Figure 9: Example of dogbone specimens . . . . . . . . . . . . . . . . . . . . . . 16
Figure 10: Schematic drawing of a typical stress-strain curve. . . . . . . . . . . . . 17
Figure 11: Stress-displacement curve for PA nanocomposites incorporatingdifferent nanoclays, measured at a crosshead displacement rate of25 mm/min. . . . . . . . . . . . . . . . . . . . . . . . . . . . . . . . . 18
Figure 12: Stress-displacement curve for PP nanocompsites incorporating differentconcentrations of uncompatibilized and compatibilized Cloisite 15A,measured at a crosshead displacement rate of 25 mm/min. . . . . . . . . 18
Figure 13: Maximum and necking strength of PA nanocomposites. . . . . . . . . . 19
Figure 14: Maximum and necking strength of PP nanocomposites. . . . . . . . . . . 19
Figure 15: Stress-displacement curve for PA/ 5% wt. Lucentite SWNnanocomposites at 10, 25 and 50 mm/min crosshead displacement rates. . 21
Figure 16: Stress-displacement curve for PP/ 4% wt. Cloisite 15A nanocompositesat 10, 25 and 50 mm/min crosshead displacement rates. . . . . . . . . . 21
Figure 17: Maximum stress vs. loading rate for the PA nanocomposites. . . . . . . . 22
Figure 18: Maximum stress vs. loading rate for the PP nanocomposites. . . . . . . . 22
DRDC Atlantic TM 2009-017 ix
Figure 19: Necking stress vs. loading rate for the PA nanocomposites. . . . . . . . . 23
Figure 20: Necking stress vs. loading rate for the PP nanocomposites. . . . . . . . . 23
Figure 21: Relative total energy to break PP samples with natural Cloisite 15Afiller and compatibilized Cloisite 15A filler during impact. . . . . . . . . 24
Figure 22: Abrasion data for all samples studied: weight loss after 1000 cycles. . . . 25
Figure 23: Abrasion data: weight loss as a function of number of cycles forPA-based nanocomposites. . . . . . . . . . . . . . . . . . . . . . . . . . 26
Figure 24: Comparison of heat release rate for all samples . . . . . . . . . . . . . . 27
Figure 25: Comparison of ignition time for all samples . . . . . . . . . . . . . . . . 27
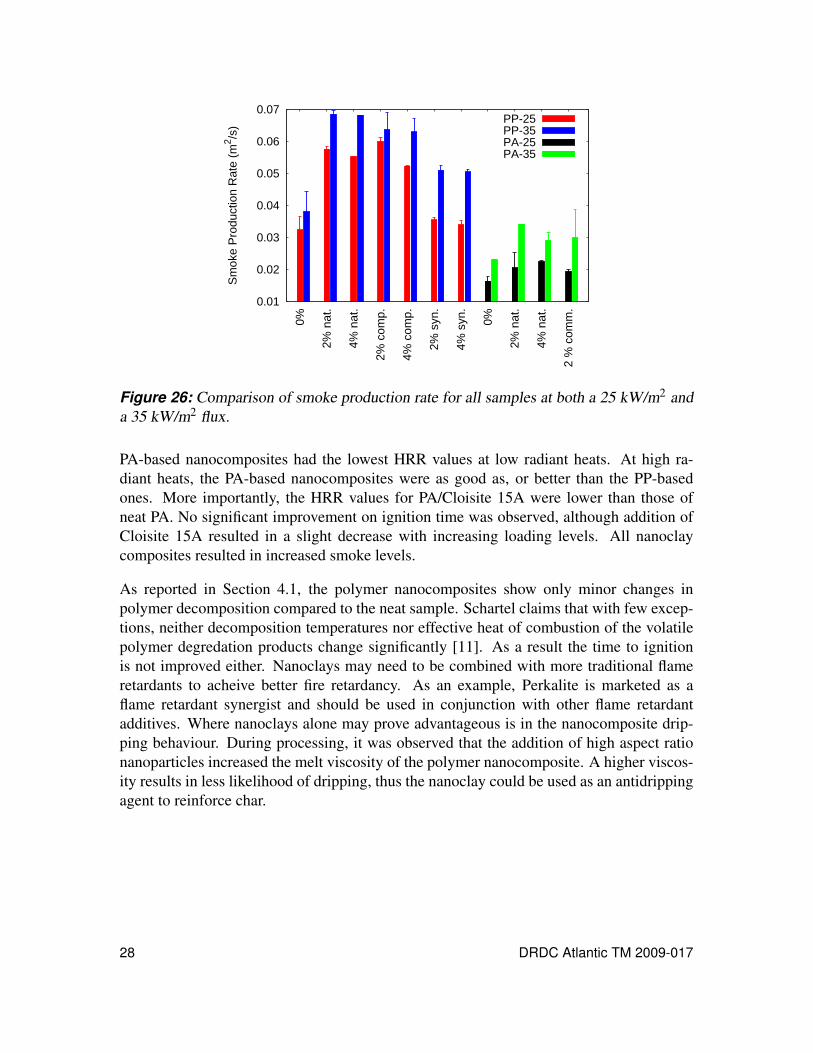
Figure 26: Comparison of smoke production rate for all samples . . . . . . . . . . . 28
List of tables
Table 1: Matrix of nanoclay composite samples prepared. . . . . . . . . . . . . . 3
Table 2: Decomposition temperatures of the nanoclay composites of PP and PA. . 13
Table 3: Crystallization temperatures of the nanoclay composites of PP and PA. . 14
Table 4: Young’s modulus (at 1 Hz) of the nanoclay composites of PP and PA. . . 15
Table A.1: Abrasion (weight loss) after 1000 cycles for all nanocomposites studied. 33
Table A.2: Abrasion (weight loss) as a function of number of cycles for PA series. . 33
Table B.1: Cone calorimetry data for all samples studied, exposed at 25 kW/m2. . . 35
Table B.2: Cone calorimetry data for all samples studied, exposed at 35 kW/m2. . . 35
x DRDC Atlantic TM 2009-017

Acknowledgements
The authors would like to thank Dr. Shannon Farrell (XRD), Ms. Manon Plourde (abrasiontests), Mr. Yves Simard (compounding), Mr. Michel Carmel (sheet casting and injectionmoulding) and the group of Dr. Joseph Su (cone calorimetry) for their technical contribu-tions.
DRDC Atlantic TM 2009-017 xi

This page intentionally left blank.
xii DRDC Atlantic TM 2009-017

1 Background
In the Canadian Forces (CF) the dismounted soldier is being referred to as a system ofsystems. In the future s/he will have the requirement to be a system that integrates all thats/he wears and/or carries. The future soldier will carry more, utilize more technology andwithstand more extreme environments. To accomplish this, the integrated soldier systemproject (ISSP) is considering multifunctional materials; materials that are lightweight whileenhancing stealth, ballistic protection, chemical/biological protection, supply power, orexhibit increased durability/comfort. One possible class of materials to meet these demandsare nanocomposites.
Nanocomposites are a promising new area in material science. Many review articles havebeen written describing the benefits that can be achieved from the nanoscale manipulationof fillers [1–3]. The incorporation of nanosized particles with high aspect ratios intopolymers has led to new materials with unique properties. The platelet structures of claysmake them interesting high aspect ratio fillers. Clays have aluminosilicate layers (i.e.,platelets) interspersed with interlayer cations (i.e., the space between the parallel layers ofclay platelets is the gallery. The gallery spacing changes depending on what cation occupiesthe space). Although the bulk clay particle is not nanosized, each platelet has an in-planedimension of >100 nm and a thickness of 1–10 nm. To achieve nanoclay composites, theclay layers must be delaminated and dispersed in a polymer matrix. The smectic class ofclays can be swollen, such that the gallery spacing is increased. Montmorillonite is themost common type of smectite clay. To fully disperse the clay, the particles are shearedapart, giving tactoids or polymer intercalated particles (Figure 1(b)). The intercalatedparticles contain stacks of clay layers approximately 100–150 nm high. These can befurther exfoliated and dispersed when polymer enters the galleries of the clay, pushing theplatelets apart (Figure 1(c)). Nanoclay/polymer composites were first utilized industriallyby Toyota in 1990, where clays were incorporated into Nylon-6.
It has been shown that incorporating nanoclays into polymers can increase the mechanicaland thermal properties of the polymers [4–8]. These include improved strength, modu-
Clay Filler
Polymer Chain
(a) (b) (c)
Figure 1: Preparation of clay nanocomposites. a) conventional microcomposite, b) inter-calated, c) exfoliated (i.e., nanocomposite).
DRDC Atlantic TM 2009-017 1

lus, UV absorbance and fire resistance. In this study, the physical properties of variousnanocomposite formulations are examined to determine the degree of improvement. Thegoal of this project is the examination of the effects of different levels of nanoclay exfolia-tion and different degrees of nanoclay loading on polypropylene (PP) and polyamide (PA).PA and PP were chosen as the matrix materials for these nanocomposites because they canbe used in clothing. By adding nanoclays to these materials, it is hoped that they will beimparted with multifunctionality, yielding regular clothing with improved fire resistance,UV protection, etc.
2 DRDC Atlantic TM 2009-017

2 Materials
The matrices consisted of a PP homopolymer (Profax 1274 from Basell) or a PA-6 ho-mopolymer (PA 1015B from UBE). The natural clay used was Cloisite 15A (SouthernClay Products). In the case of the PP series, a compatibilization strategy was developed inorder to increase the adhesion between the matrix and the clay. Two low molecular weightgrafted polypropylenes (Epolen 3015; Eastman and Polybond 3150; Chemtura) were used.Compatibilization was achieved by grafting these two low molecular weight PP to the clayprior to compounding with the PP matrix polymer. The two compatibilizers were blendedin equal parts and then mixed 1:1 with the Cloisite 15A. In the case of the PA series, nocompatibilization was needed.
In addition to the formulations produced at the National Research Council of Canada— Industrial Materials Institute (NRC—IMI), a commercially available PA-based nano-composite was tested for comparison purposes. A 2 % wt. Cloisite 15A in PA waspurchased from UBE (PA 1015C2).
Synthetic clays were also investigated. For PP, the synthetic clay chosen was Perkalite F100.In the case of PA, two clays were investigated; Lucentite SWN (low aspect ratio: 50) andSomasif ME100 (high aspect ratio: 6000). The sample matrix is shown in Table 1.
Preparation of nanocomposites at NRC-IMI utilized a 34 mm Leistritz co-rotating twin-
Table 1: Matrix of nanoclay composite samples prepared.
Polymer Clay Conc. (% wt.)Polypropylene (PP) None 0(Profax 1274) Natural 2
(Cloisite 15A) 4Compatibilized Natural 2(Cloisite + Low MW PP) 4Synthetic 2(Perkalite F100) 4
Polyamide-6 (PA) None 0(a.k.a. Nylon 6) Natural 2(PA1051B) (Cloisite 15A) 4
Synthetic 2.5∗
(Lucentite SWN) 5∗
Synthetic 2.5∗
(Somasif ME100) 5∗∗ 2 % wt. and 4 % wt. loadings were used for dynamic mechanical analysis (DMA)and abrasion tests
DRDC Atlantic TM 2009-017 3

screw extruder having a length to diameter ratio of 42. All materials were dried beforeany processing. Master batches containing 20 % wt. clay were prepared and subsequentlydiluted, also by twin-screw extrusion, to the final clay content (see Table 1). The screwspeed was 100 rpm and the throughput was 5 kg/h. The melt temperature was maintainedat 200◦C and 240◦C for the polypropylene and polyamide systems, respectively. The neatPP and PA matrices were also processed under the same conditions so that all materialsexperienced the same thermomechanical history. The nanocomposites were pelletized andkept for further processing.
Three types of specimens were prepared for characterization. To evaluate mechanicalproperties, Type I dogbones were prepared by injection moulding using a 30 ton Boyinjection press [9]. The mould was kept at 20◦C. For abrasion and flammability tests,cast sheets (PP system) or square plaques (PA system) were produced. The cast sheetswere extruded using a RandCastle cast film line equipped with a flat die. The sheets were1 mm thick and 8 inches wide. The Boy injection press was also used to produce 10 cm ×10 cm × 1 mm square plaques.
4 DRDC Atlantic TM 2009-017

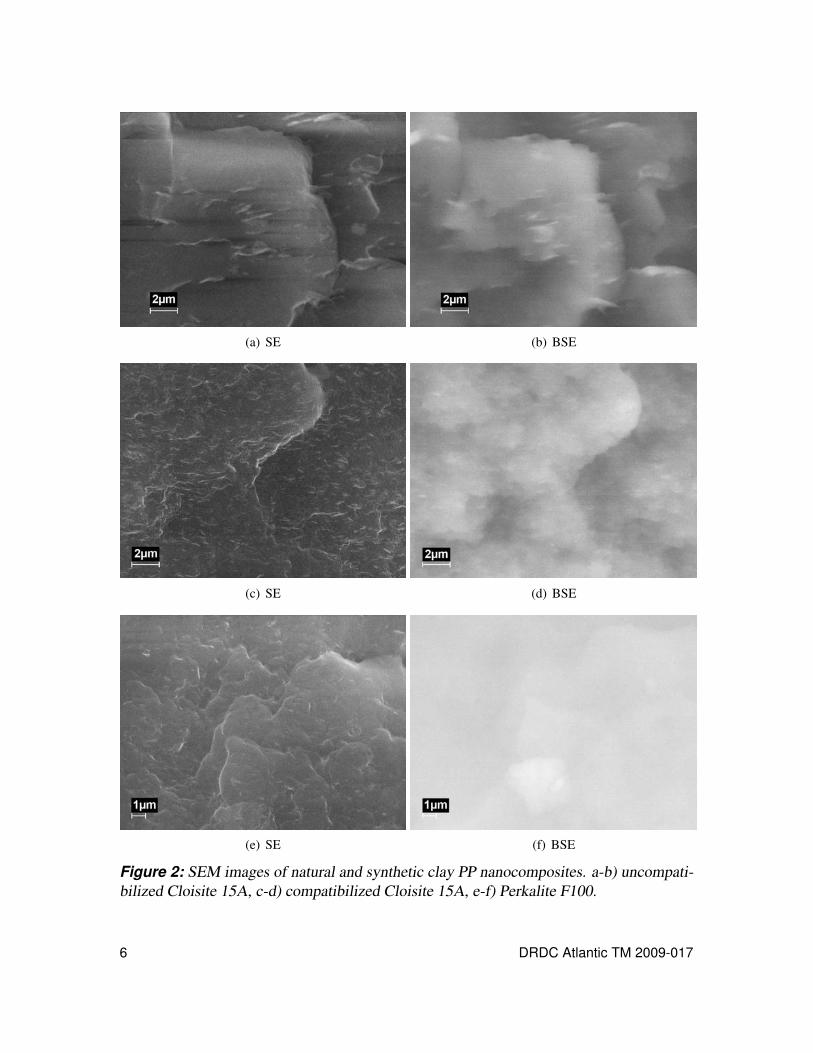
3 Nanoclay dispersion3.1 PolypropyleneSamples of PP were taken as prepared and freeze fractured by dipping in liquid nitrogenand hitting with a hammer. The resulting fracture surface was examined using scanningelectron microscopy (SEM). The SEM was a Leo 1455VP model. Samples were imagedusing an accelerating voltage of 20 kV and a working distance of 8 mm. Variable pressurewas used to eliminate the need to gold coat the samples. The two detection techniquesused were secondary electron (SE) imaging and back-scattered electron (BSE) imaging. InSE imaging, the primary contrast mechanism is the variation in topography. Since it is afracture surface being examined, the changes in contrast show areas where failure initiatedor where crack growth faces joined. The BSE images primarily show variations in atomicnumber. High atomic numbers appear bright. For the current nanocomposites, the claywill appear bright, while the polymer will appear darker. The SEM images for PP loadedwith 4 % wt. clay, both natural and synthetic, are shown in Figure 2. Comparing the SEimages (i.e., left hand side of figure) with the BSE images (i.e., right hand side of figure),both show similar features. In many instances, the areas that are “bright” in the secondaryelectron image are also “bright” in the back-scattered electron image. This indicates thatthe fracture occurred where the clay particle concentration was highest, possibly due topoor dispersion. The exception to this is for the Perkalite F100 sample (Figures 2(e) and2(f)). In this case, the secondary electron image shows the variations in topography but theback-scattered electron image shows a near uniform distribution of atomic number. Thisindicates that the clay is dispersed, which is to be expected since the Perkalite F100 waschosen because of its compatibility with PP.
Intercalation rather than exfoliation for the PP samples was evidenced through X-ray Dif-fractography (XRD). XRD analysis measures the order in a sample and can provide thegallery spacing between the platelets of the clay. As polymer intercalates into the clay, thegallery spacing is increased (i.e., swells). This swelling can be followed using XRD.
X-ray diffractograms were collected on a Philips X’Pert system using CuKα radiation.Samples were analyzed from 1.5 to 10 or 15◦ 2θ, as appropriate. Divergence slits of 1◦ and14◦
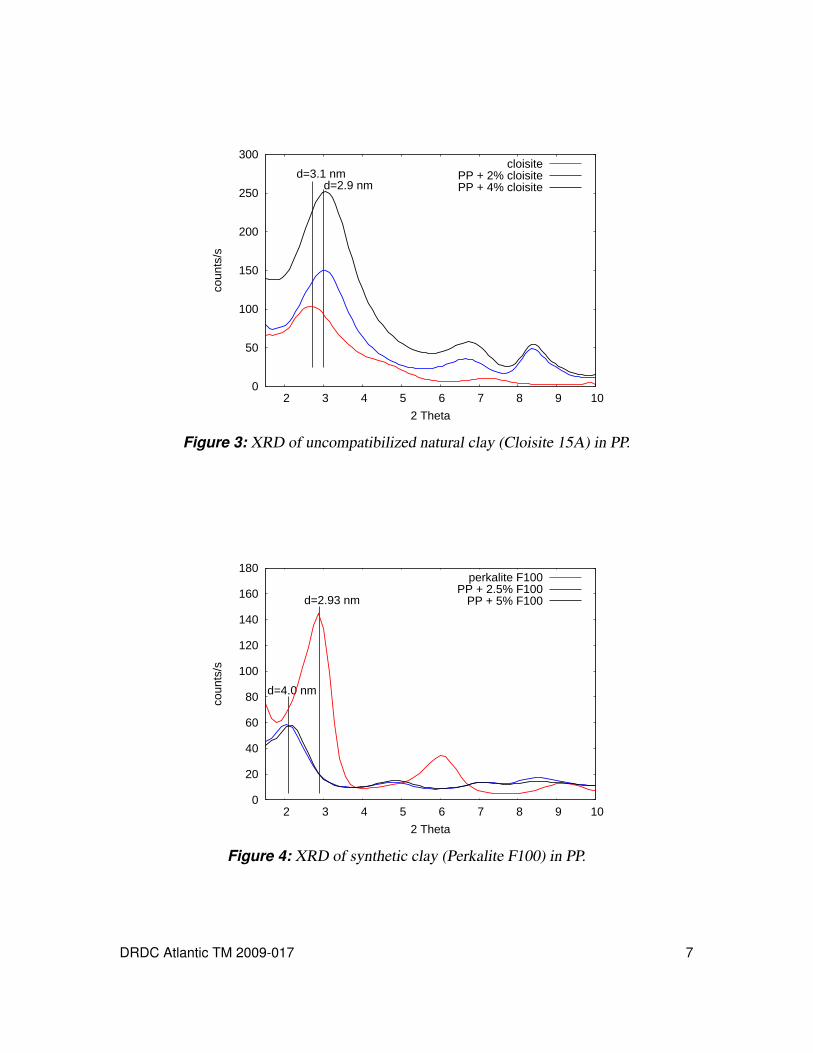
were used for the incident and diffracted beams respectively to minimize signal receivedby the detector as a result of the low analysis angles. Figure 3 shows the X-ray diffrac-togram for uncompatibilized Cloisite 15A in PP, where d is the gallery spacing. Comparingthe gallery spacing of pure Cloisite 15A to the PP/Cloisite nanoclay composites, the d-spacing decreased from 3.1 nm to 2.9 nm. This is contrary to prediction. Introductionof the polymer should result in an increase of the gallery spacings. The decrease waspossibly due to heating during processing. The twin screw extruder used to compoundthese materials is operated at >100◦C, as a result it is possible that it drove water out of theclay, resulting in a contraction of the galleries. If the clay was not mixing well with the PP,then intercalation/exfoliation would not offset this contraction.
DRDC Atlantic TM 2009-017 5
(a) SE (b) BSE
(c) SE (d) BSE
(e) SE (f) BSE
Figure 2: SEM images of natural and synthetic clay PP nanocomposites. a-b) uncompati-bilized Cloisite 15A, c-d) compatibilized Cloisite 15A, e-f) Perkalite F100.
6 DRDC Atlantic TM 2009-017
0
50
100
150
200
250
300
2 3 4 5 6 7 8 9 10
coun
ts/s
2 Theta
d=3.1 nmd=2.9 nm
cloisitePP + 2% cloisitePP + 4% cloisite
Figure 3: XRD of uncompatibilized natural clay (Cloisite 15A) in PP.
0
20
40
60
80
100
120
140
160
180
2 3 4 5 6 7 8 9 10
coun
ts/s
2 Theta
d=2.93 nm
d=4.0 nm
perkalite F100PP + 2.5% F100
PP + 5% F100
Figure 4: XRD of synthetic clay (Perkalite F100) in PP.
DRDC Atlantic TM 2009-017 7

Figure 4 shows the X-ray diffractogram for Perkalite F100 in PP. Here, the synthetic claywas chosen to be compatible with PP, and the d-spacing reflects the intercalation witha shift from 2.9 nm to 4.0 nm. The presence of a peak indicates that intercalation hasoccured, but full exfoliation was not reached. In the case of fully exfoliated clay platelets,the XRD would show no peaks due to a lack of ordering in the sample.
3.2 PolyamideSamples of PA were taken as prepared and freeze fractured using the same method de-scribed for PP. The SE and BSE SEM images for PA loaded with 4 % wt natural clay areshown in Figure 5. Figures 5(a) and 5(b) show the images of the PA samples prepared inthis study, while Figures 5(c) and 5(d) are the commercially available PA/Cloisite nanoclaycomposite. Again, the secondary electron image shows the variations in topography. Theimages for the commercial nanocomposite appear identical to the in-house composites. Thesynthetic clays Lucentite SWN and Somasif ME 100 were also examined (Figure 6). Theseshow similar results to the natural clay nanocomposites. Comparing the images from boththe PP and PA nanocomposites (Figures 2, 5 and 6), it can be seen that as the clay becomesmore compatible with the matrix, the SE images show smoother fracture surfaces and theBSE images become more uniform, losing detail.
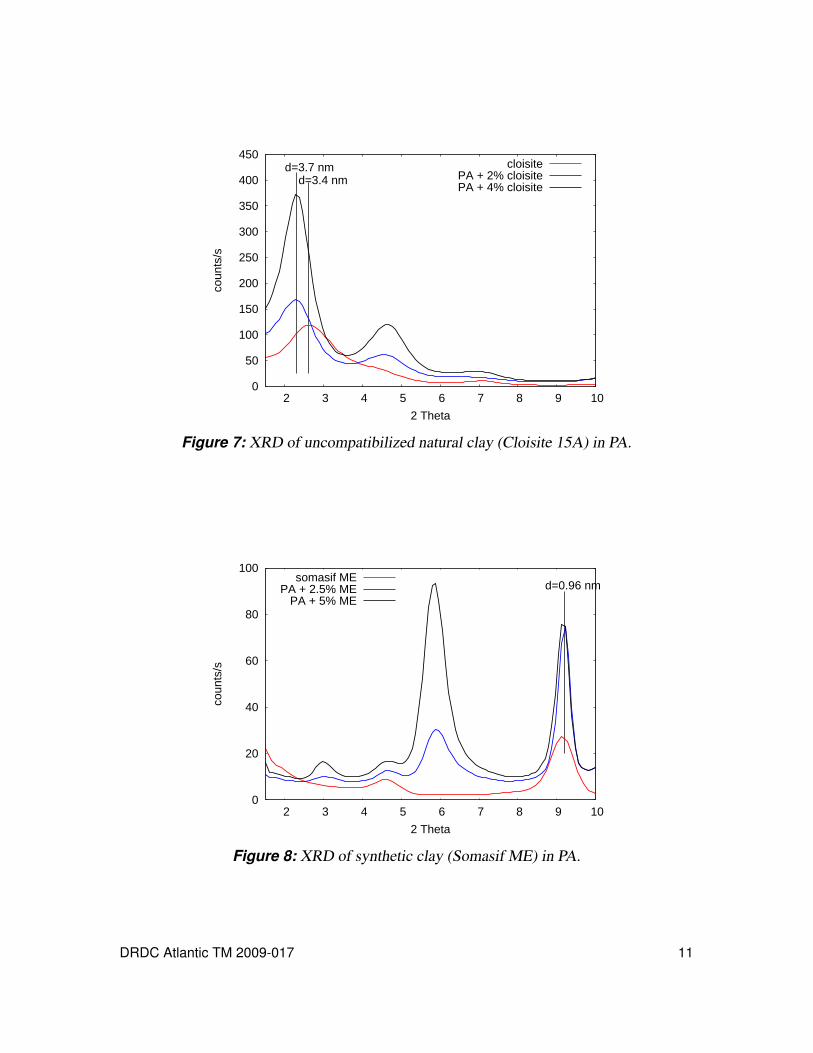
XRD analysis of PA with Cloisite 15A (Figure 7) shows that the d-spacing increases from3.4 nm to 3.7 nm. With the PA and Somasif ME 100, the d-spacing increased only 0.01 nm.The initial d-spacing for the Somasif ME 100 was only 0.96 nm (Figure 8). It is believedthat this spacing is too low and the CuKα radiation used in this XRD method is not preciseenough to measure changes in its value. Since peaks were observed, there were still claygalleries, and full exfoliation did not occur. The additional peaks at 2θ=3 and 6◦ are aresult of the crystalline portions of the PA. Polyamide-6 is typically approximately 50%crystalline [10]. In the case of the commercially available nanocomposite, no clay peakswere detected, indicating full exfoliation.
Lucentite SWN was also analysed using XRD. Unfortunately, no usable peaks were iden-tified in the neat clay sample, so further analysis of the nanocomposite was impossible.
Micrographs and XRD data suggest that PA has better dispersion than PP nanoclay com-posites.
8 DRDC Atlantic TM 2009-017

(a) SE (b) BSE
(c) SE (d) BSE
Figure 5: SEM images of natural clay (Cloisite 15A) PA nanocomposites. a-b) in-housesamples, c-d) commercial sample.
DRDC Atlantic TM 2009-017 9

(a) SE (b) BSE
(c) SE (d) BSE
Figure 6: SEM images of synthetic clays in PA nanocomposites. a-b) Lucentite SWNsamples, d-e) Somasif ME 100 sample.
10 DRDC Atlantic TM 2009-017
0
50
100
150
200
250
300
350
400
450
2 3 4 5 6 7 8 9 10
coun
ts/s
2 Theta
d=3.4 nmd=3.7 nm cloisite
PA + 2% cloisitePA + 4% cloisite
Figure 7: XRD of uncompatibilized natural clay (Cloisite 15A) in PA.
0
20
40
60
80
100
2 3 4 5 6 7 8 9 10
coun
ts/s
2 Theta
d=0.96 nmsomasif ME
PA + 2.5% MEPA + 5% ME
Figure 8: XRD of synthetic clay (Somasif ME) in PA.
DRDC Atlantic TM 2009-017 11
4 Nanocomposite physical properties4.1 Thermogravimetric analysisDecomposition of the nanocomposites was examined using thermogravimetric analysis(TGA) on a TGA Q500 Thermogravimetric Analyzer (TA Instruments, New Castle, Dela-ware). Between 5 and 20 mg of the sample was placed in the TGA weigh pan and analyzedusing a high resolution dynamic TGA technique. Nitrogen was used as the purge gas(flow rate 100 mL/min). The sample was equilibrated at 35◦C and then heated at a rate of50◦C/min to 800◦C. The high resolution mode allows the TGA to auto adjust the heatingrate as the sample undergoes decomposition. As the sample decomposes and loses weight,the heating rate is lowered to near isothermal conditions. The lowering of the heating rateprevents thermal lag in the sample and allows for separation of components in the samplethat may decompose at similar temperatures. Once the decomposition of the sample hadslowed, the heating rate returns to the original conditions of 50◦C/min. The purge gas wasswitched from nitrogen to air at 650◦C to burn off any remaining organics and allow forthe determination of the amount of inorganic residue present in the samples.
Depending on the polymer, the decomposition occurred between 400 and 500◦C (Table 2).The temperature of maximum weight loss was determined by the location of the firstderivative peak of weight loss versus temperature. The mass of the remaining inorganicash was used to confirm the sample weight percent compositions.
The PP/Cloisite 15A showed an increase in decomposition temperature of 9◦C over neatPP. The PP/Perkalite F100 showed a decrease of 3◦C from neat PP. For the PA samples,the change in decomposition temperature was more significant; PA/Cloisite 15A showed a31◦C drop (Table 2). There appears to be no trend relative to concentration of filler.
Schartel claims that [11]:
The results reported on the thermal and thermooxidative decomposition oflayered silicate nanocomposites are rather contradictory and do not lead tounambiguous or consistant conclusions. The results vary from enhanced de-composition to no significant influence, to a strong improvement dependingon the source and system discussed.
The influence on thermal decomposition is determined by specific interactionswith the nanoscaled additive during polymer decomposition. The influence onthe thermal and thermooxidative decomposition is a specific characteristic foreach system.
The results reported here are consistent with Schartel [11]. Better nanoparticle dispersionwould yield increased nanoclay/polymer interactions, causing their influence on the ther-mal decomposition to be more pronounced.
12 DRDC Atlantic TM 2009-017

Table 2: Decomposition temperatures of the nanoclay composites of PP and PA. Temper-atures reported are averaged of three trials.
Polymer Clay % wt. Decomp.clay Temp. (◦C)
Polypropylene (PP) None 0 456(Profax 1274) Natural 2 465
(Cloisite 15A) 4 465Compatibilized Natural 2 465(Cloisite + Low MW PP) 4 465
Polypropylene (PP) None 0 463(Profax 1274) Synthetic 2 460(2nd round) (Perkalite F100) 4 460Polyamide-6 (PA) None 0 441(a.k.a. Nylon 6) Natural 2 410(PA1051B) (Cloisite 15A) 4 410
Commercial 2 450Synthetic 2.5 438(Lucentite SWN) 5 430Synthetic 2.5 444(Somasif ME100) 5 444
4.2 Differential scanning calorimetryDifferential scanning calorimetry (DSC) was used to determine the crystallization tem-peratures of the nanocomposites (Table 3). Samples were analyzed using a DSC Q1000Differential Scanning Calorimeter equipped with a DSC Refrigerated Cooling System (TAInstruments, New Castle, Delaware). Between 3 and 10 mg of sample was encapsulated inan aluminum sample pan. Nitrogen was used as the purge gas (flow rate 50 mL/min). Thesamples were cooled to –80◦C and then exposed to a heat/cool/heat cycle up to 250◦C at aheating and cooling rate of 10◦C/min. As the samples were heated and then cooled, theyunderwent melting and crystallization phase changes. The melting temperature was deter-mined to be the maximum of the endothermic peak while the crystallization temperaturewas determined to be the maximum of the exothermic peak. The degree of crystallinitywas taken as the area under the exothermic peak.
For the PP nanocomposite, a 3–5◦C drop in crystallization temperature was observed whenuncompatibilized Cloisite 15A was used. When 4% wt. compatibilized Cloisite 15A wasadded, the amount of crystallinity decreased and the crystallization temperature decreasedby 7◦C. When the Perkalite F100 synthetic clay was added, the crystallinity didn’t change,but the crystallization temperature increased by 8◦C. This last result is counter-intuitivebecause addition of an impurity is usually accompanied by a freezing point depression. The
DRDC Atlantic TM 2009-017 13
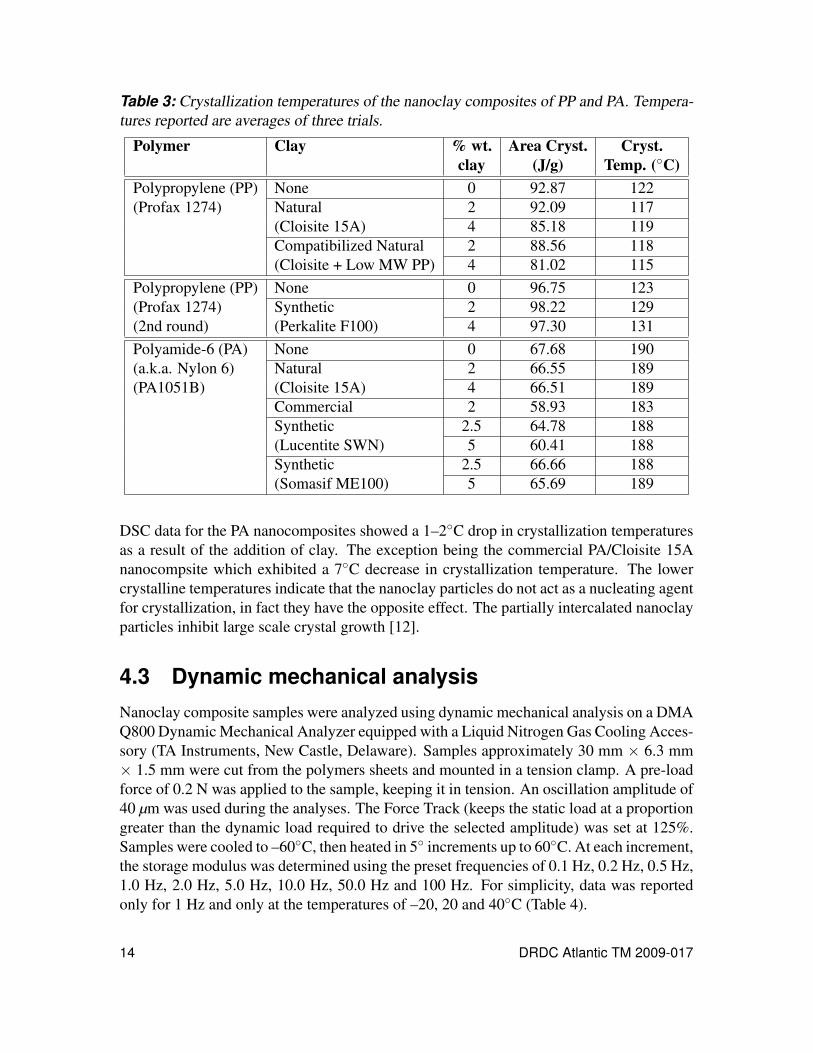
Table 3: Crystallization temperatures of the nanoclay composites of PP and PA. Tempera-tures reported are averages of three trials.
Polymer Clay % wt. Area Cryst. Cryst.clay (J/g) Temp. (◦C)
Polypropylene (PP) None 0 92.87 122(Profax 1274) Natural 2 92.09 117
(Cloisite 15A) 4 85.18 119Compatibilized Natural 2 88.56 118(Cloisite + Low MW PP) 4 81.02 115
Polypropylene (PP) None 0 96.75 123(Profax 1274) Synthetic 2 98.22 129(2nd round) (Perkalite F100) 4 97.30 131Polyamide-6 (PA) None 0 67.68 190(a.k.a. Nylon 6) Natural 2 66.55 189(PA1051B) (Cloisite 15A) 4 66.51 189
Commercial 2 58.93 183Synthetic 2.5 64.78 188(Lucentite SWN) 5 60.41 188Synthetic 2.5 66.66 188(Somasif ME100) 5 65.69 189
DSC data for the PA nanocomposites showed a 1–2◦C drop in crystallization temperaturesas a result of the addition of clay. The exception being the commercial PA/Cloisite 15Ananocompsite which exhibited a 7◦C decrease in crystallization temperature. The lowercrystalline temperatures indicate that the nanoclay particles do not act as a nucleating agentfor crystallization, in fact they have the opposite effect. The partially intercalated nanoclayparticles inhibit large scale crystal growth [12].
4.3 Dynamic mechanical analysisNanoclay composite samples were analyzed using dynamic mechanical analysis on a DMAQ800 Dynamic Mechanical Analyzer equipped with a Liquid Nitrogen Gas Cooling Acces-sory (TA Instruments, New Castle, Delaware). Samples approximately 30 mm × 6.3 mm× 1.5 mm were cut from the polymers sheets and mounted in a tension clamp. A pre-loadforce of 0.2 N was applied to the sample, keeping it in tension. An oscillation amplitude of40 µm was used during the analyses. The Force Track (keeps the static load at a proportiongreater than the dynamic load required to drive the selected amplitude) was set at 125%.Samples were cooled to –60◦C, then heated in 5◦ increments up to 60◦C. At each increment,the storage modulus was determined using the preset frequencies of 0.1 Hz, 0.2 Hz, 0.5 Hz,1.0 Hz, 2.0 Hz, 5.0 Hz, 10.0 Hz, 50.0 Hz and 100 Hz. For simplicity, data was reportedonly for 1 Hz and only at the temperatures of –20, 20 and 40◦C (Table 4).
14 DRDC Atlantic TM 2009-017
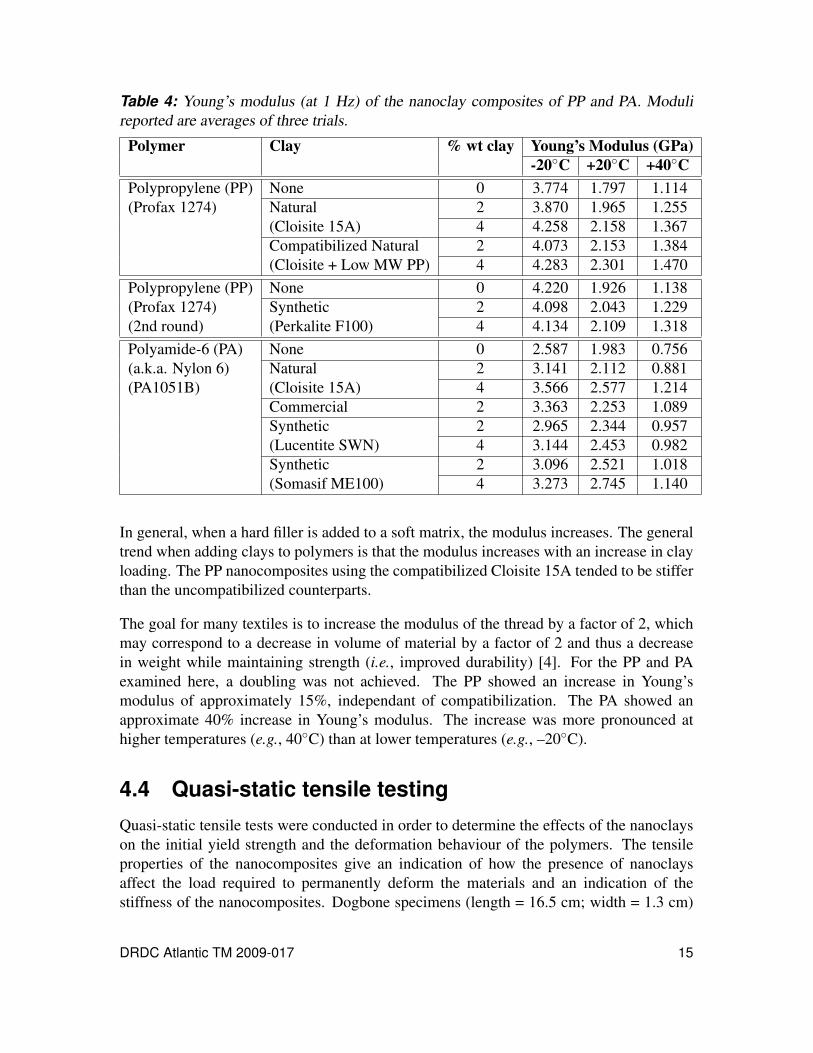
Table 4: Young’s modulus (at 1 Hz) of the nanoclay composites of PP and PA. Modulireported are averages of three trials.
Polymer Clay % wt clay Young’s Modulus (GPa)-20◦C +20◦C +40◦C
Polypropylene (PP) None 0 3.774 1.797 1.114(Profax 1274) Natural 2 3.870 1.965 1.255
(Cloisite 15A) 4 4.258 2.158 1.367Compatibilized Natural 2 4.073 2.153 1.384(Cloisite + Low MW PP) 4 4.283 2.301 1.470
Polypropylene (PP) None 0 4.220 1.926 1.138(Profax 1274) Synthetic 2 4.098 2.043 1.229(2nd round) (Perkalite F100) 4 4.134 2.109 1.318Polyamide-6 (PA) None 0 2.587 1.983 0.756(a.k.a. Nylon 6) Natural 2 3.141 2.112 0.881(PA1051B) (Cloisite 15A) 4 3.566 2.577 1.214
Commercial 2 3.363 2.253 1.089Synthetic 2 2.965 2.344 0.957(Lucentite SWN) 4 3.144 2.453 0.982Synthetic 2 3.096 2.521 1.018(Somasif ME100) 4 3.273 2.745 1.140
In general, when a hard filler is added to a soft matrix, the modulus increases. The generaltrend when adding clays to polymers is that the modulus increases with an increase in clayloading. The PP nanocomposites using the compatibilized Cloisite 15A tended to be stifferthan the uncompatibilized counterparts.
The goal for many textiles is to increase the modulus of the thread by a factor of 2, whichmay correspond to a decrease in volume of material by a factor of 2 and thus a decreasein weight while maintaining strength (i.e., improved durability) [4]. For the PP and PAexamined here, a doubling was not achieved. The PP showed an increase in Young’smodulus of approximately 15%, independant of compatibilization. The PA showed anapproximate 40% increase in Young’s modulus. The increase was more pronounced athigher temperatures (e.g., 40◦C) than at lower temperatures (e.g., –20◦C).
4.4 Quasi-static tensile testingQuasi-static tensile tests were conducted in order to determine the effects of the nanoclayson the initial yield strength and the deformation behaviour of the polymers. The tensileproperties of the nanocomposites give an indication of how the presence of nanoclaysaffect the load required to permanently deform the materials and an indication of thestiffness of the nanocomposites. Dogbone specimens (length = 16.5 cm; width = 1.3 cm)
DRDC Atlantic TM 2009-017 15

Figure 9: Example of dogbone specimens; 4% wt. compatibilized Cloisite 15A in PP.
of the nanocomposites (Figure 9), were injection moulded. The thickness of the specimensvaried for the different nanocomposite compositions due to differences in the shrinkagethat occurred during curing. The target thickness for the specimens was 0.125′′, however,shrinkage that occurred during curing resulted in slight variations. The flash was carefullyremoved using a sharp utility knife. Care was taken to remove the flash in a single cut,thus avoiding the introduction of “nicks” or stress concentrators along the gage length.The width and the thickness of the specimens were measured using Vernier calipers and amicrometer, respectively.
The tensile specimens were tested on a 100 kN servo-hydraulic load frame with closed-loop feedback control. The use of an extensometer to measure strain resulted in prematurefailures that initiated at the extensometer knife edges. To avoid these failures, the crossheaddisplacement was used to calculate the strain during the tensile test. The maximum actuatordisplacement was approximately 130 mm, which was inadequate to cause failure in most ofthe specimens. When the specimens did not fail before the maximum actuator displacementwas achieved, the test was stopped at the maximum actuator displacement.
Three tensile tests were conducted at a constant crosshead displacement rate of 25 mm/minfor each nanocomposite composition. As extra specimens were manufactured for some ofthe nanoclay formulation, some additional tests were conducted at crosshead displacementrates of 5, 10, 50 and 100 mm/min to assess the effects of strain rate on the mechanical prop-erties. It was found that the mechanical behaviour and the failure mode of the nanocom-posites were sensitive to strain rate. Consequently, the behaviour of these nanocompositesin high strain rate spinning processes may not be well represented by the quasi-static stress-
16 DRDC Atlantic TM 2009-017

Figure 10: Schematic drawing of a typical stress-strain curve.
strain curves. However, these quasi-static tests should give a good indication of the relativebehaviour of the nanocomposite materials.
A schematic drawing of a typical stress-strain curve is shown in Figure 10. The maximumstress was calculated as the peak stress sustained by the specimen before necking occurred.The necking stress was calculated as the average stress sustained by the specimen as thenecked area propagated along the gage length of the specimen. As indicated above, thetest was arrested when the limit of the actuator displacement was reached. The stress-strain curves of specimens that failed during testing typically did not experience significantnecking prior to failure.
Representative stress-displacement curves for the various PA-based and PP-based nanocom-posites are shown in Figures 11 and 12, respectively. For the PA nanocomposites, the con-centration of nanoclay particles had significantly less effect on the mechanical behaviourthan the type of particle, so for clarity only the lower concentrations are presented inFigure 11.
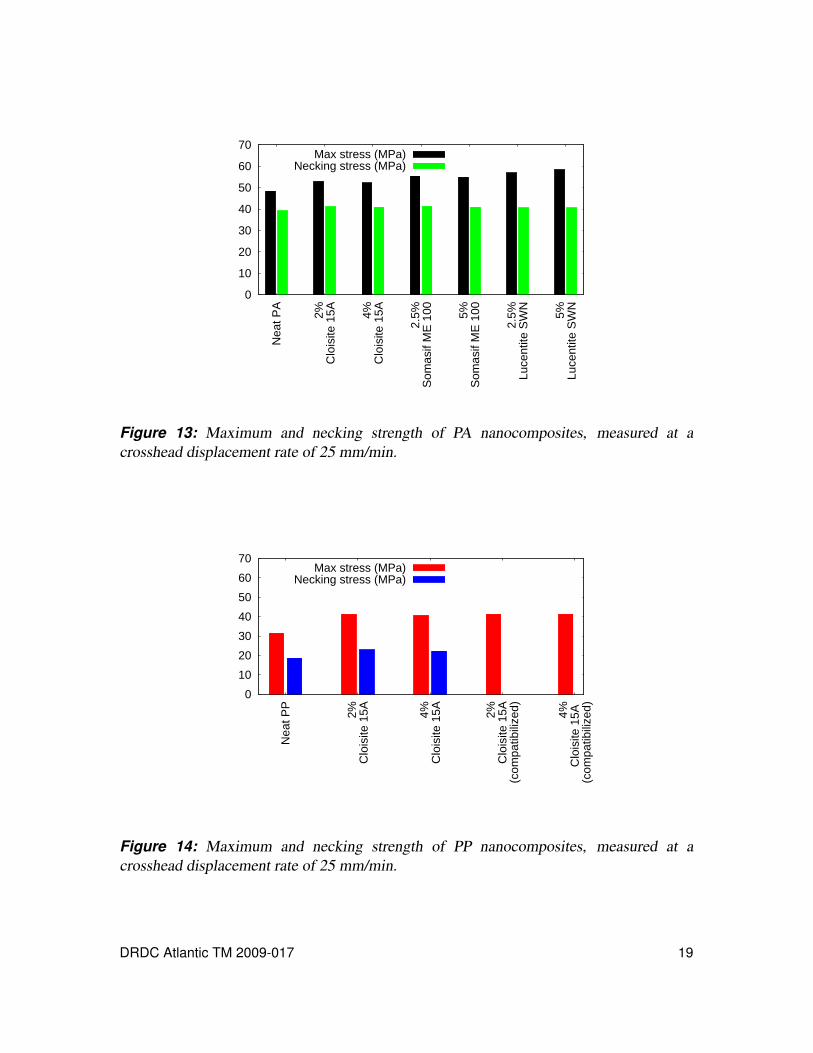
The maximum and necking stresses for the various nanocomposites are shown in Figures13 and 14. The values reported are the average of three tests. The presence of nanoclaysincreased both the maximum stress and the necking stress for both the PP and PA.
For the PA nanocomposites, the 5% synthetic Lucentite SWN caused the largest increasein maximum stress (approx. 21%). The 4% Cloisite 15A had the least influence onthe maximum strength, with an increase of approximately 8%. The increase in neckingstrength was approximately 5% for all of the additives. The percentage of nanoclay addedto the specimens did not seem to have a large effect on the mechanical properties.
The addition of nanoclays to PP resulted in maximum stress increases of approximately30%. The necking stress of the uncompatabalized Cloisite 15A nanocomposites increased
DRDC Atlantic TM 2009-017 17
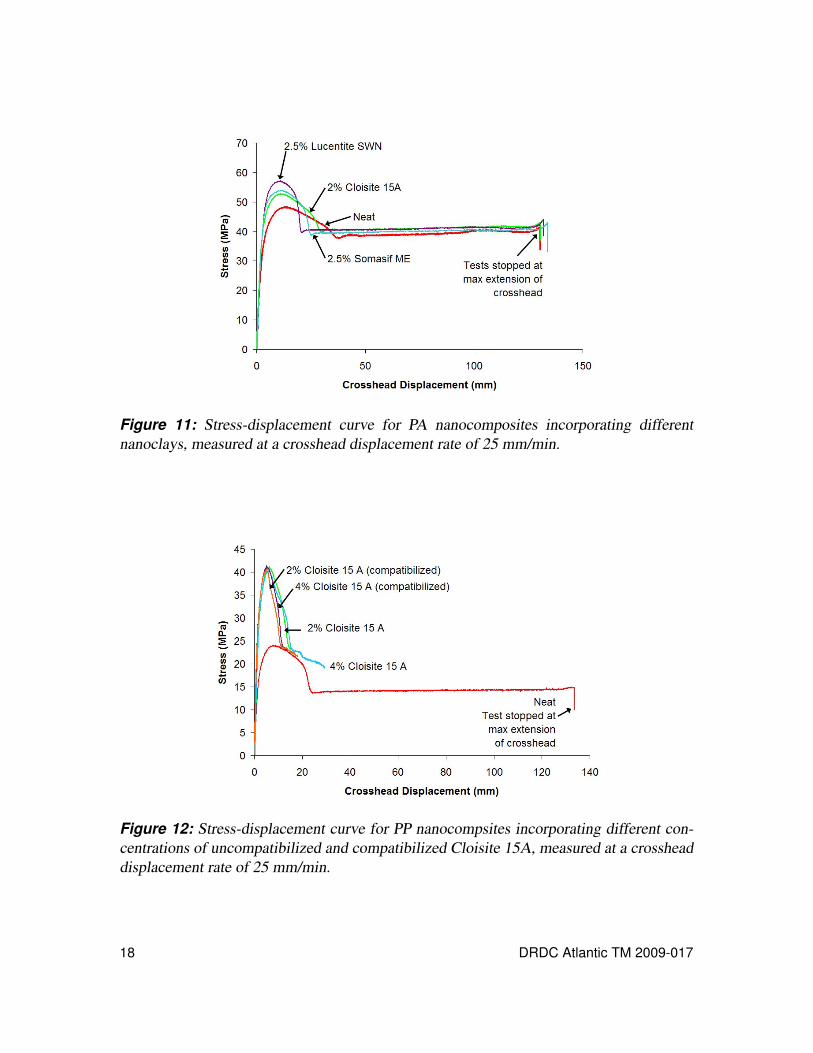
Figure 11: Stress-displacement curve for PA nanocomposites incorporating differentnanoclays, measured at a crosshead displacement rate of 25 mm/min.
Figure 12: Stress-displacement curve for PP nanocompsites incorporating different con-centrations of uncompatibilized and compatibilized Cloisite 15A, measured at a crossheaddisplacement rate of 25 mm/min.
18 DRDC Atlantic TM 2009-017
0
10
20
30
40
50
60
70
Nea
t PA
2% C
lois
ite 1
5A 4% C
lois
ite 1
5A
2.5%
Som
asif
ME
100 5%
Som
asif
ME
100
2.5%
Luc
entit
e S
WN
5% L
ucen
tite
SW
N
Max stress (MPa)Necking stress (MPa)
Figure 13: Maximum and necking strength of PA nanocomposites, measured at acrosshead displacement rate of 25 mm/min.
0
10
20
30
40
50
60
70
Nea
t PP
2% C
lois
ite 1
5A 4% C
lois
ite 1
5A 2% C
lois
ite 1
5A (
com
patib
ilize
d) 4% C
lois
ite 1
5A
(co
mpa
tibili
zed)
Max stress (MPa)Necking stress (MPa)
Figure 14: Maximum and necking strength of PP nanocomposites, measured at acrosshead displacement rate of 25 mm/min.
DRDC Atlantic TM 2009-017 19
by approximately 19%. One of the 4% wt. uncompatabalized Cloisite 15A specimensfailed before distinguishable necking occurred. All of the compatabalized Cloisite 15Asamples failed before significant necking occurred. Compatabalizing the Cloisite 15A onlycaused a marginal effect on the maximum strength (compared to the uncompatabalizedCloisite 15A), yet had a significant and detrimental effect on the nanocomposite ductility.
Figures 15 and 16 show the stress-displacement curves measured at different strain rates forthe PA/ 5% wt. Lucentite SWN and PP/ 4% wt. Cloisite 15A nanocomposites, respectively.
For the PA nanocomposites (Figure 15), the strain rate of the tests affected the maximumstresses of the nanocomposites, but had a very small effect on the necking stress. For the PPnanocomposites, the strain rate affected the maximum strength and the fracture elongation(i.e., ductility).
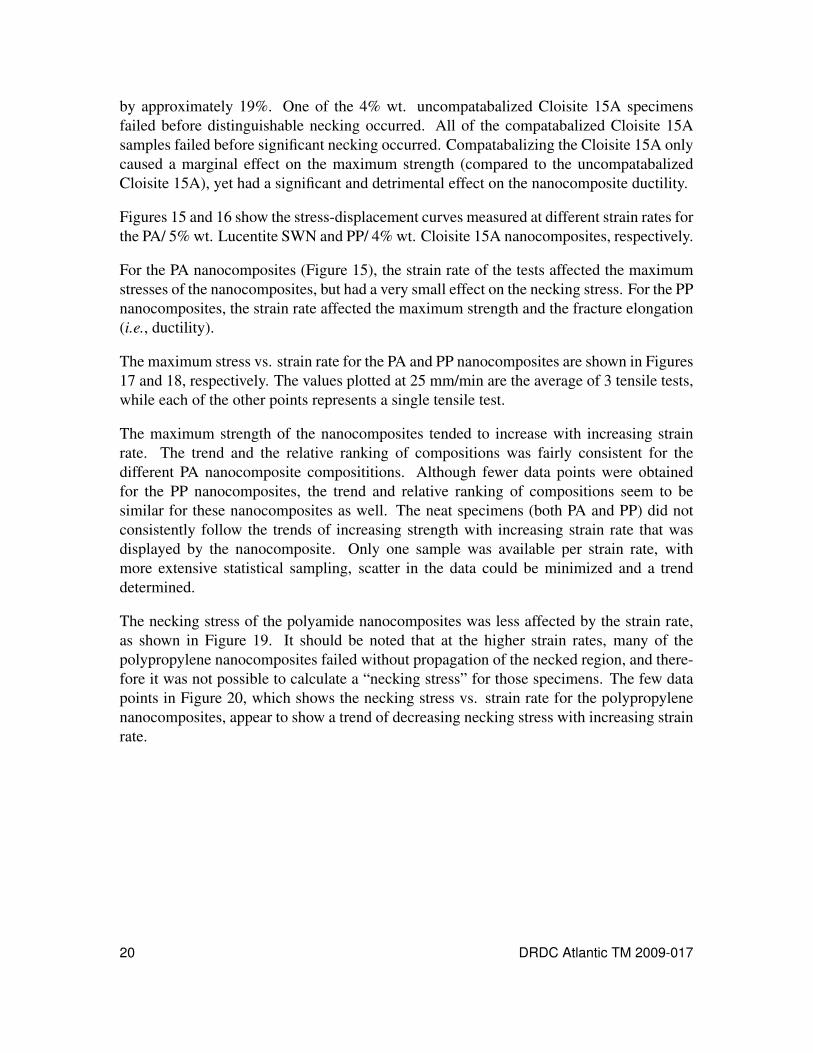
The maximum stress vs. strain rate for the PA and PP nanocomposites are shown in Figures17 and 18, respectively. The values plotted at 25 mm/min are the average of 3 tensile tests,while each of the other points represents a single tensile test.
The maximum strength of the nanocomposites tended to increase with increasing strainrate. The trend and the relative ranking of compositions was fairly consistent for thedifferent PA nanocomposite composititions. Although fewer data points were obtainedfor the PP nanocomposites, the trend and relative ranking of compositions seem to besimilar for these nanocomposites as well. The neat specimens (both PA and PP) did notconsistently follow the trends of increasing strength with increasing strain rate that wasdisplayed by the nanocomposite. Only one sample was available per strain rate, withmore extensive statistical sampling, scatter in the data could be minimized and a trenddetermined.
The necking stress of the polyamide nanocomposites was less affected by the strain rate,as shown in Figure 19. It should be noted that at the higher strain rates, many of thepolypropylene nanocomposites failed without propagation of the necked region, and there-fore it was not possible to calculate a “necking stress” for those specimens. The few datapoints in Figure 20, which shows the necking stress vs. strain rate for the polypropylenenanocomposites, appear to show a trend of decreasing necking stress with increasing strainrate.
20 DRDC Atlantic TM 2009-017

Figure 15: Stress-displacement curve for PA/ 5% wt. Lucentite SWN nanocomposites at10, 25 and 50 mm/min crosshead displacement rates.
Figure 16: Stress-displacement curve for PP/ 4% wt. Cloisite 15A nanocomposites at 10,25 and 50 mm/min crosshead displacement rates.
DRDC Atlantic TM 2009-017 21
25
30
35
40
45
50
55
60
65
0 20 40 60 80 100 120
Max
imum
Str
ess
(MP
a)
Loading Rate (mm/min)
Neat PA2.5% Somasif ME 100
5% Somasif ME 1002.5% Lucentite SWN
5% Lucentite SWN
Figure 17: Maximum stress vs. loading rate for the PA nanocomposites.
25
30
35
40
45
50
55
60
65
0 20 40 60 80 100 120
Max
imum
Str
ess
(MP
a)
Loading Rate (mm/min)
Neat PP2% Cloisite 15A4% Cloisite 15A
2% Cloisite 15A (compatibilized)4% Cloisite 15A (compatibilized)
Figure 18: Maximum stress vs. loading rate for the PP nanocomposites.
22 DRDC Atlantic TM 2009-017

34
36
38
40
42
44
0 20 40 60 80 100 120
Nec
king
Str
ess
(MP
a)
Loading Rate (mm/min)
Neat PA2.5% Somasif ME 100
5% Somasif ME 1002.5% Lucentite SWN
5% Lucentite SWN
Figure 19: Necking stress vs. loading rate for the PA nanocomposites.
18
20
22
24
26
28
0 5 10 15 20 25 30
Nec
king
Str
ess
(MP
a)
Loading Rate (mm/min)
Neat PP2% Cloisite 15A4% Cloisite 15A
2% Cloisite 15A (compatibilized)
Figure 20: Necking stress vs. loading rate for the PP nanocomposites.
DRDC Atlantic TM 2009-017 23

4.5 Impact testingHigh velocity impact testing was performed to determine the energy required to break thesample. A Dynatup R© MiniTowerTM instumented impact tester was used following ASTMD3763-02 [13]. The test specimens were 3.2 mm thick, 60 mm diameter disks. A 12.7 mmdiameter steel rod with a hemispherical end was used with testing speed of 200 m/min.Integration of the area under the force vs. time curve yields the toughness of the material.Figure 21 shows the relative total energy needed to break 2 mm thick cast sheet samples ofPP nanocomposites with Cloisite 15A; each value is the average of 5 measurements. The4% compatibilized Cloisite 15A showed the best result for these nanocomposites.
0
0.5
1
1.5
2
2.5
3
3.5
4N
eat P
P
2% n
at.
4% n
at.
2% c
omp.
4% c
omp.
Rel
ativ
e T
otal
Ene
rgy
Figure 21: Relative total energy to break PP samples with natural Cloisite 15A filler andcompatibilized Cloisite 15A filler during impact. Absolute total energy of a 1mm thicksheet of neat PP was 2 J.
4.6 Abrasion testingAbrasion tests were performed on 1 mm thick square plaques (10 cm × 10 cm). The PP-based and PA-based nanocomposites were tested. The neat matrices were also evaluated.The plaques were cut from cast sheets (PP series) or injection moulded (PA series). Thespecimens were tested according to ASTM D1044-08 and D1242-87 on a Taber PlatformAbraser (model 5155) [14, 15]. Preliminary trials were performed using CS-10 abradingwheels, designed to simulate abrading actions such as normal handling, cleaning andpolishing (medium grade). It was observed that the abrasion was very low (abraded weightsoften below 10 mg) and the reproducibility of the results was poor. A second, slightlycoarser grade of abrasive wheel was utilized (model H-18). Results were more reproducibleand the abraded weights larger: therefore, the H-18 wheel was used for the rest of the trials.
24 DRDC Atlantic TM 2009-017

20
25
30
35
40
45
50
55
60
65
70
0%
2% n
at.
4% n
at.
2% c
omp.
4% c
omp.
2% s
yn.
4% s
yn.
0%
2% n
at.
4% n
at.
2 %
com
m.
Wei
ght L
oss
(mg)
PPPA
Figure 22: Abrasion data for all samples studied: weight loss after 1000 cycles.
Figure 22 shows the weight loss for both PP and PA systems after 1000 cycles. Thespecimens (3 for each test) were cleaned and weighed prior to testing, and at the end ofthe abrasion test. The frequency was 1 Hz and the weight of the abrading device (weightapplied on sample) was 500 g. Since the values of abraded material for the PA series wererelatively low and the effect of the clay addition appeared to be more significant than in thecase of PP, additional tests were carried out on the PA nanocomposites, exploring highernumbers of cycles (Figure 23). In this case, the PA sample was cleaned and weighed atseveral intervals. The degree of weight loss of PA as a function of the number of cycleswas recorded. As the clay loading increased, the mass loss due to abrasion increased,indicating that the abrasion resistance is lower at larger concentrations.
It has been reported that the mechanism by which nanoparticles improve abrasion resis-tance involves them supporting part of the applied load, thus reducing the penetrationinto the polymer surface [16]. This hypothesis may hold for solid nanoparticles such asthe calcium carbonate used by Lu and Liu, but the nanoclays reported here had layeredstructures. It is possible that the clay platelets cleaved, in an analogous way to mica. Theplatelet cleaving is a possible explanation as to why the nanoclay loaded polymers behavedworse than the neat polymers. This phenomena would be more pronounced if the clay wasnot fully exfoliated. To prevent cleaving of the platelets, a strong polymer/clay surfaceinteraction was needed. It can be seen in Figure 22 where the synthetic clay, which waschosen for its compatibility with the PP, performed better than the natural one.
DRDC Atlantic TM 2009-017 25

0
20
40
60
80
100
120
200 400 600 800 1000 1200 1400 1600 1800 2000
Wei
ght L
oss
(mg)
Number of cycles
neat PAcommercial PA (2% clay)
PA + 2% nat. clayPA + 4% nat. clay
Figure 23: Abrasion data: weight loss as a function of number of cycles for PA-basednanocomposites.
4.7 Flammability testingFlammability tests were performed on 1 mm thick square plaques (10 cm × 10 cm).The PP-based and PA-based nanocomposites were tested. The neat matrices were alsoevaluated. The plaques were cut from cast sheets (PP series) or injection moulded (PAseries). The specimens were tested according to ASTM E1354 using a cone calorimeter[17]. This test measures the response of materials exposed to controlled levels of radiantheating. This method is used to determine the time to ignition, heat release rate, mass lossrate, effective heat of combustion and visible smoke development of materials. The rate ofheat release is determined by measurement of the oxygen consumption as determined bythe oxygen concentration and the flow rate in the exhaust. In this work, the samples wereexposed to heating fluxes of 25 and 35 kW/m2. Tests were performed in duplicate on eachnanocomposite.
From each set of cone calorimetry results and for all samples studied, the following prop-erties were determined:
• Ignition time (s) — time to sustained flaming
• Heat release rate (HRR, kW/m2) — heat evolved from the specimen per unit of time
• Smoke production rate (SPR, m2/s)
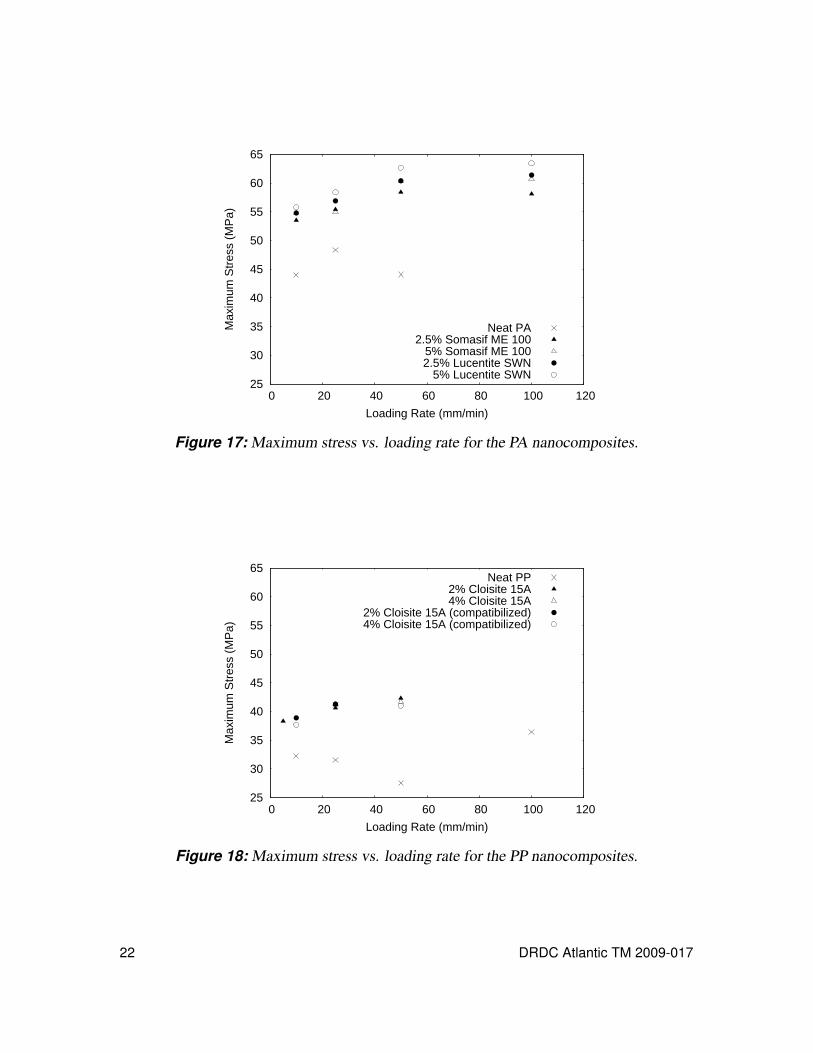
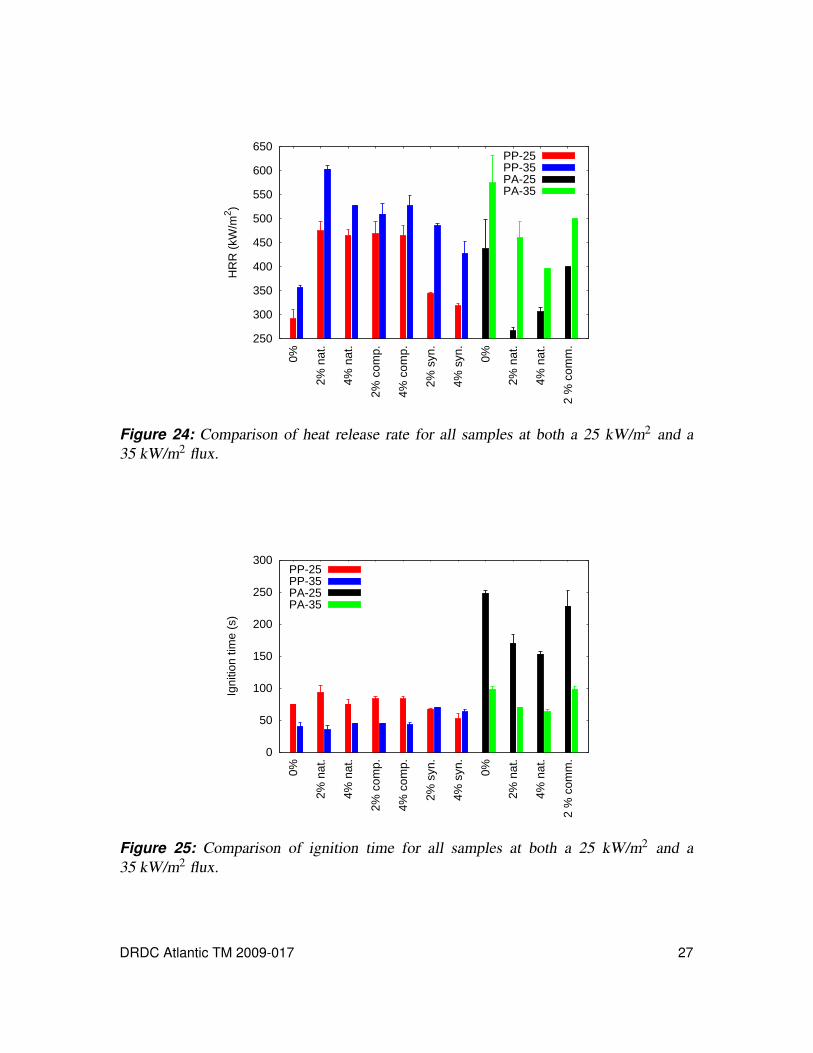
The data for all conditions (both heat fluxes and all samples) are reported in the tablesof Annex B. The results are summarized in the form of histograms in Figures 24–26.
26 DRDC Atlantic TM 2009-017
250
300
350
400
450
500
550
600
650
0%
2% n
at.
4% n
at.
2% c
omp.
4% c
omp.
2% s
yn.
4% s
yn.
0%
2% n
at.
4% n
at.
2 %
com
m.
HR
R (
kW/m
2 )
PP-25PP-35PA-25PA-35
Figure 24: Comparison of heat release rate for all samples at both a 25 kW/m2 and a35 kW/m2 flux.
0
50
100
150
200
250
300
0%
2% n
at.
4% n
at.
2% c
omp.
4% c
omp.
2% s
yn.
4% s
yn.
0%
2% n
at.
4% n
at.
2 %
com
m.
Igni
tion
time
(s)
PP-25PP-35PA-25PA-35
Figure 25: Comparison of ignition time for all samples at both a 25 kW/m2 and a35 kW/m2 flux.
DRDC Atlantic TM 2009-017 27
0.01
0.02
0.03
0.04
0.05
0.06
0.07
0%
2% n
at.
4% n
at.
2% c
omp.
4% c
omp.
2% s
yn.
4% s
yn.
0%
2% n
at.
4% n
at.
2 %
com
m.
Sm
oke
Pro
duct
ion
Rat
e (m
2 /s)
PP-25PP-35PA-25PA-35
Figure 26: Comparison of smoke production rate for all samples at both a 25 kW/m2 anda 35 kW/m2 flux.
PA-based nanocomposites had the lowest HRR values at low radiant heats. At high ra-diant heats, the PA-based nanocomposites were as good as, or better than the PP-basedones. More importantly, the HRR values for PA/Cloisite 15A were lower than those ofneat PA. No significant improvement on ignition time was observed, although addition ofCloisite 15A resulted in a slight decrease with increasing loading levels. All nanoclaycomposites resulted in increased smoke levels.
As reported in Section 4.1, the polymer nanocomposites show only minor changes inpolymer decomposition compared to the neat sample. Schartel claims that with few excep-tions, neither decomposition temperatures nor effective heat of combustion of the volatilepolymer degredation products change significantly [11]. As a result the time to ignitionis not improved either. Nanoclays may need to be combined with more traditional flameretardants to acheive better fire retardancy. As an example, Perkalite is marketed as aflame retardant synergist and should be used in conjunction with other flame retardantadditives. Where nanoclays alone may prove advantageous is in the nanocomposite drip-ping behaviour. During processing, it was observed that the addition of high aspect rationanoparticles increased the melt viscosity of the polymer nanocomposite. A higher viscos-ity results in less likelihood of dripping, thus the nanoclay could be used as an antidrippingagent to reinforce char.
28 DRDC Atlantic TM 2009-017
5 Conclusions
In this study, nanocomposites using natural and synthetic clays were made with PP and PAmatrices. Micrographs and XRD data suggest that Cloisite 15A was better dispersed in PAthan in PP, although not as well as in the commercially available sample. To optimizedispersion, ideally PA nanoclay composites are made by intercalating the caprolactammonomer into the clay galleries and polymerizing in situ. The physical properties of thenanocomposites showed minor improvements over the parent polymers. It is believed thatpoor dispersion played a role in the lack of significant improvements.
This study suggests that processing plays an important role in realizing the improvedproperties of nanoclay composites. In the work reported here, adequate dispersion of theclays was not accomplished. PA (i.e., nylon) appears to be the better matrix for nanoclaycomposites. More basic research is needed before these composites can be transitioned toviable technology for military applications.
DRDC Atlantic TM 2009-017 29
6 Future work
The primary concern for realizing true nanocompositions is the dispersion of the clays.Future work will include an investigation of the in situ polymerization of PA. Physicalproperties testing will focus on durability testing (i.e., the effect of UV, humidity, andtemperature) as well as chemical/biological resistance. If an appropriate nanocomposite isdeveloped, further testing of microfibre and nanofibre properties will be of interest.
30 DRDC Atlantic TM 2009-017
References
[1] Mai, Y. and Yu, Z., (Eds.) (2006), Polymer Nanocomposites, Cambridge England:Woodhead Publishing Limited.
[2] Jang, B., Costache, M., and Wilkie, C. (2005), The relationship between thermaldegradation behavior of polymer and the fire retardancy of polymer/claynanocomposites, Polymer, 46(24), 10678–10687.
[3] Zheng, Q., Yu, A., Lu, G., and Paul, D. (2005), Clay-Based PolymerNanocomposites: Research and Commercial Development, Journal of Nanoscienceand Nanotechnology, 5, 1574–1592.
[4] Fornes, T. and Paul, D. (2003), Formation and Properties of Nylon 6Nanocomposites, Polimeros: Ciencia e Tecnologia, 13(4), 212–217.
[5] Kanny, K. and Moodley, V. (2007), Characterization of PolypropyleneNanocomposite Structures, Journal of Engineering Materials and Technology, 129,105–112.
[6] Sarkar, M., Dana, K., Ghatak, S., and Banerjee, A. (2008), Polypropylene-claycomposite prepared from Indian bentonite, Bull. Mater. Sci., 31(1), 23–28.
[7] Dong, W., Zhang, X., Liu, Y., Wang, Q., Gui, H., Gao, J., Song, Z., Lai, J., Huang, F.,and Qiao, J. (2006), Flame retardant nanocomposites of polyamide 6/clay/siliconerubber with high toughness and good flowability, Polymer, 47, 6874–6879.
[8] Zhang, J., Jiang, D., and Wilkie, C. (2006), Thermal and flame properties ofpolyethylene and polypropylene nanocomposites based on anoligomerically-modified clay, Polymer Degradation and Stability, 91, 298–304.
[9] ASTM Standard D638–99 (2000), Standard Test Method for Tensile Properties ofPlastics. ASTM International, West Conshohocken, PA.
[10] Odian, G. (1991), Principles of Polymerization, 3 ed, Ch. 2, pp. 102–106, New York:Wiley-Interscience.
[11] Schartel, B. (2007), Flame Retardant Polymer Nanocomposites, Ch. 5, pp. 115–116,New Jersey: Wiley-Interscience.
[12] Bhat, G., Hegde, R., Kamath, M., and Deshpande, B. (2008), Nanoclay ReinforcedFibers and Nonwovens, Journal of Engineered Fibers and Fabrics, 3(3), 22–34.
[13] ASTM Standard D3763–02 (2002), Standard Test Method for High Speed PunctureProperties of Plastics Using Load and Displacement Sensors. ASTM International,West Conshohocken, PA.
DRDC Atlantic TM 2009-017 31

[14] ASTM Standard D1044 - 08 (2008), Standard Test Method for Resistance ofTransparent Plastics to Surface Abrasion. ASTM International, West Conshohocken,PA.
[15] ASTM Standard D1242-87 (1987), Standard Test Methods for Resistance of PlasticMaterials to Abrasion. ASTM International, West Conshohocken, PA.
[16] Lu, X. and Liu, T. (2006), Polymer Nanocomposites, Ch. 16, p. 433, Cambridge,England: Woodhead Publishing Limited.
[17] ASTM Standard E1354-08 (2008), Standard Test Method for Heat and VisibleSmoke Release Rates for Materials and Products Using an Oxygen ConsumptionCalorimeter. ASTM International, West Conshohocken, PA.
32 DRDC Atlantic TM 2009-017

Annex A: Abrasion Test DataTable A.1: Abrasion (weight loss) after 1000 cycles for all nanocomposites studied.
Matrix Comment Wt.% clay Weight loss (mg)0 47.2±0.72 55.7±3.9
PP 4 61.2±3.6compatibilized 2 60.5±7.5
4 63.8±1.30 21.6±1.42 36.2±1.6
PA 4 43.4±2.6commercial grade 2 49.3±2.2
Table A.2: Abrasion (weight loss) as a function of number of cycles for PA series.
Number Weight loss (mg)of cycles Neat PA Comm. PA PA + 2 Wt% PA + 4 Wt%
250 0.72 0.97 5.74 10.2500 3.59 13.9 11.8 20.2750 9.95 22.3 17.9 31.61000 15.2 36.5 29.0 48.01500 35.0 65.4 60.1 83.02000 55.4 97.2 83.6 119
DRDC Atlantic TM 2009-017 33

This page intentionally left blank.
34 DRDC Atlantic TM 2009-017

Annex B: Cone Calorimetry Test DataTable B.1: Cone calorimetry data for all samples studied, exposed at 25 kW/m2: ignitiontime, heat release rate, time at peak, smoke production rate, carbon monoxide and carbondioxide yields at peak.
Matrix Comment wt.% Ignition HRR Time at SPR CO Yield CO2 Yieldclay time (s) (kW/m2) peak (s) (m2/s) (×103 g/s) (g/s)
0 75 277 140 0.0295 3.30 0.17175 304 140 0.0353 3.62 0.189
2 100 487 180 0.0569 5.67 0.28985 460 160 0.0582 5.41 0.278
PP 4 80 474 155 0.0553 5.20 0.28370 454 150 0.0550 4.87 0.257
Compatibilized 2 80 485 150 0.0592 5.63 0.28985 450 155 0.0607 5.38 0.267
4 80 452 150 0.0524 5.28 0.26785 423 155 0.0522 4.93 0.252
0 250 394 290 0.0154 2.82 0.231245 480 305 0.0173 3.89 0.310
2 160 270 290 0.0238 3.04 0.178180 262 340 0.0173 2.96 0.176
PA 4 155 311 265 0.0226 2.76 0.189150 300 255 0.0223 3.14 0.199
Commercial 2 245 400 295 0.0197 3.58 0.259Grade 210 397 275 0.0190 3.46 0.255
Table B.2: Cone calorimetry data for all samples studied, exposed at 35 kW/m2: ignitiontime, heat release rate, time at peak, smoke production rate, carbon monoxide and carbondioxide yields at peak.
Matrix Comment wt.% Ignition HRR Time at SPR CO Yield CO2 Yieldclay time (s) (kW/m2) peak (s) (m2/s) (×103 g/s) (g/s)
0 45 352 95 0.0337 3.79 0.20835 359 100 0.0424 3.68 0.215
2 30 609 115 0.0676 7.17 0.35740 597 115 0.0694 6.60 0.349
PP 4 45 527 105 0.0682 5.95 0.314– – – – – –
Compatibilized 2 45 493 105 0.0598 5.52 0.29345 525 100 0.0675 6.14 0.316
4 40 491 100 0.0599 5.14 0.29445 520 110 0.0660 5.97 0.307
0 100 533 150 0.0230 4.07 0.348135 615 180 0.0230 4.57 0.401
2 70 483 150 0.0342 4.40 0.31570 436 155 0.0342 4.18 0.282
PA 4 65 396 150 0.0308 3.74 0.25960 394 155 0.0273 3.68 0.256
Commercial 2 100 500 145 0.0361 3.96 0.325Grade 95 498 145 0.0238 3.93 0.324
DRDC Atlantic TM 2009-017 35

This page intentionally left blank.
36 DRDC Atlantic TM 2009-017

Distribution list
DRDC Atlantic TM 2009-017
Internal distribution2 Royale Underhill (1 hard copy, 1 CD)
1 Allison Nolting
1 Gary Fisher
1 Irv Keough
1 Leon Cheng (H/DLA)
5 DRDC ATLANTIC LIBRARY FILE COPIES
Total internal copies: 11
External distribution2 Nathalie Chapleau (1 hard copy, 1 CD)
Industrial Materials InstituteNational Research Council Canada75 de Mortagne Blvd.Boucherville QC J4B 6Y4
1 NDHQ/DRDC/DRDKIM 3
1 Library & Archives CanadaAttention: Military Archivist, Government Records Branch
1 Suzanne ParadisRDDC Valcartier2459 Pie-XI Blvd NorthVal-Belair QC G3J 1X5
Total external copies: 5
Total copies: 16
DRDC Atlantic TM 2009-017 37

This page intentionally left blank.
38 DRDC Atlantic TM 2009-017

DOCUMENT CONTROL DATA(Security classification of title, body of abstract and indexing annotation must be entered when document is classified)
1. ORIGINATOR (The name and address of the organization preparing thedocument. Organizations for whom the document was prepared, e.g. Centresponsoring a contractor’s report, or tasking agency, are entered in section 8.)
Defence R&D Canada – AtlanticPO Box 1012, Dartmouth NS B2Y 3Z7, Canada
2. SECURITY CLASSIFICATION (Overallsecurity classification of the documentincluding special warning terms if applicable.)
UNCLASSIFIED
3. TITLE (The complete document title as indicated on the title page. Its classification should be indicated by the appropriateabbreviation (S, C or U) in parentheses after the title.)
Formulation and Characterization of Nanoclay Composites: Towards Multifunctional Materialsfor the Dismounted Soldier
4. AUTHORS (Last name, followed by initials – ranks, titles, etc. not to be used.)
Underhill, R. S.; Nolting, A.; Fisher, G.; Keough, I.; Chapleau, N.
5. DATE OF PUBLICATION (Month and year of publication ofdocument.)
September 2009
6a. NO. OF PAGES (Totalcontaining information.Include Annexes,Appendices, etc.)
54
6b. NO. OF REFS (Totalcited in document.)
17
7. DESCRIPTIVE NOTES (The category of the document, e.g. technical report, technical note or memorandum. If appropriate, enterthe type of report, e.g. interim, progress, summary, annual or final. Give the inclusive dates when a specific reporting period iscovered.)
Technical Memorandum
8. SPONSORING ACTIVITY (The name of the department project office or laboratory sponsoring the research and development –include address.)
Defence R&D Canada – AtlanticPO Box 1012, Dartmouth NS B2Y 3Z7, Canada
9a. PROJECT OR GRANT NO. (If appropriate, the applicableresearch and development project or grant number underwhich the document was written. Please specify whetherproject or grant.)
12si11
9b. CONTRACT NO. (If appropriate, the applicable number underwhich the document was written.)
10a. ORIGINATOR’S DOCUMENT NUMBER (The officialdocument number by which the document is identified by theoriginating activity. This number must be unique to thisdocument.)
DRDC Atlantic TM 2009-017
10b. OTHER DOCUMENT NO(s). (Any other numbers which maybe assigned this document either by the originator or by thesponsor.)
11. DOCUMENT AVAILABILITY (Any limitations on further dissemination of the document, other than those imposed by securityclassification.)( X ) Unlimited distribution( ) Defence departments and defence contractors; further distribution only as approved( ) Defence departments and Canadian defence contractors; further distribution only as approved( ) Government departments and agencies; further distribution only as approved( ) Defence departments; further distribution only as approved( ) Other (please specify):
12. DOCUMENT ANNOUNCEMENT (Any limitation to the bibliographic announcement of this document. This will normally correspondto the Document Availability (11). However, where further distribution (beyond the audience specified in (11)) is possible, a widerannouncement audience may be selected.)
13. ABSTRACT (A brief and factual summary of the document. It may also appear elsewhere in the body of the document itself. It is highlydesirable that the abstract of classified documents be unclassified. Each paragraph of the abstract shall begin with an indication of thesecurity classification of the information in the paragraph (unless the document itself is unclassified) represented as (S), (C), or (U). It isnot necessary to include here abstracts in both official languages unless the text is bilingual.)
Nanocomposites are a promising new area in material science. Many researchers havedescribed the benefits of nanoscale fillers. The incorporation of nanosized particles with highaspect ratios into polymers has led to new composites with improved physical properties suchas improved strength, UV absorbance and fire resistance. The work reported here comparedthe physical properties of various nanoclay formulations. Degree of clay loading, the useof compatibilizing agent and natural vs. synthetic clay were all examined. Polyamide andpolypropylene were chosen as the matrix materials, with Cloisite 15A as the natural clay andPerkalite F100, Somasif ME or Lucentite SWN as the synthetic clays. Samples of neat, 2 wt.%and 4 wt.% clay were prepared and analyzed using scanning electron micrography and x-raydiffraction to determine dispersion. The physical properties of the nanocomposites were thenexamined using thermogravimetric analysis, dynamic mechanical analysis, quasistatic tensiletesting, impact testing, abrasion testing and cone calorimetry. The particles in the polyamidenanocomposites appeared to be better dispersed than in the polypropylene nanocomposites.The physical properties of the nanocomposites showed minor improvements over the parentpolymer, while the addition of nanoclays to the polyamide system imparted better physicalproperties than the polypropylene. It is believed that poor dispersion played a role in the lackof significant improvements in material properties.
14. KEYWORDS, DESCRIPTORS or IDENTIFIERS (Technically meaningful terms or short phrases that characterize a document and couldbe helpful in cataloguing the document. They should be selected so that no security classification is required. Identifiers, such asequipment model designation, trade name, military project code name, geographic location may also be included. If possible keywordsshould be selected from a published thesaurus. e.g. Thesaurus of Engineering and Scientific Terms (TEST) and that thesaurus identified.If it is not possible to select indexing terms which are Unclassified, the classification of each should be indicated as with the title.)
Cloisite, Perkalite, Lucentite, Somasif, polyamide, polypropylene, nanocomposite, nanoclay

This page intentionally left blank.