Formation of the First Star Clusters - Institut f¼r Theoretische
65
Formation of the First Star Clusters Ralf Klessen Zentrum für Astronomie der Universität Heidelberg Institut für Theoretische Astrophysik
Transcript of Formation of the First Star Clusters - Institut f¼r Theoretische
Formation of the First Star Clusters
Ralf KlessenZentrum für Astronomie der Universität Heidelberg
Institut für Theoretische Astrophysik

thanks to ...
... people in the group in Heidelberg:
Robi Banerjee, Simon Glover, Rahul Shetty, Sharanya Sur, Daniel Seifried, Milica Milosavljevic, Florian Mandl, Christian Baczynski, Rowan Smith, Gustavo Dopcke, Jonathan Downing, Jayanta Dutta, Faviola Molina, Christoph Federrath, Erik Bertram, Lukas Konstandin, Paul Clark, Stefan Schmeja, Ingo Berentzen, Thomas Peters, Hsiang-Hsu Wang
... many collaborators abroad!

First star formation
agenda

Star cluster formation
First star formation
Magnetic fields in the primordial universe
agenda

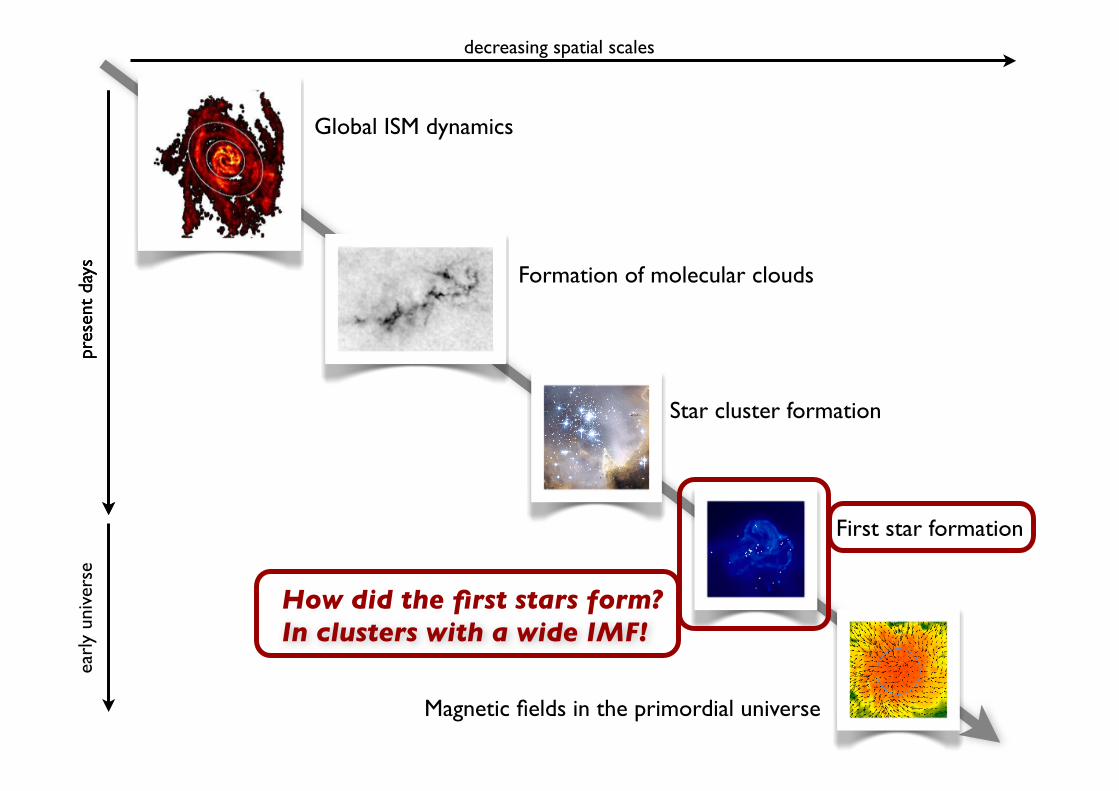
Global ISM dynamics
Formation of molecular clouds
Star cluster formation
First star formation
Magnetic fields in the primordial universe
agenda
decreasing spatial scales
pres
ent
days
pres
ent
days
earl
y un
iver
se
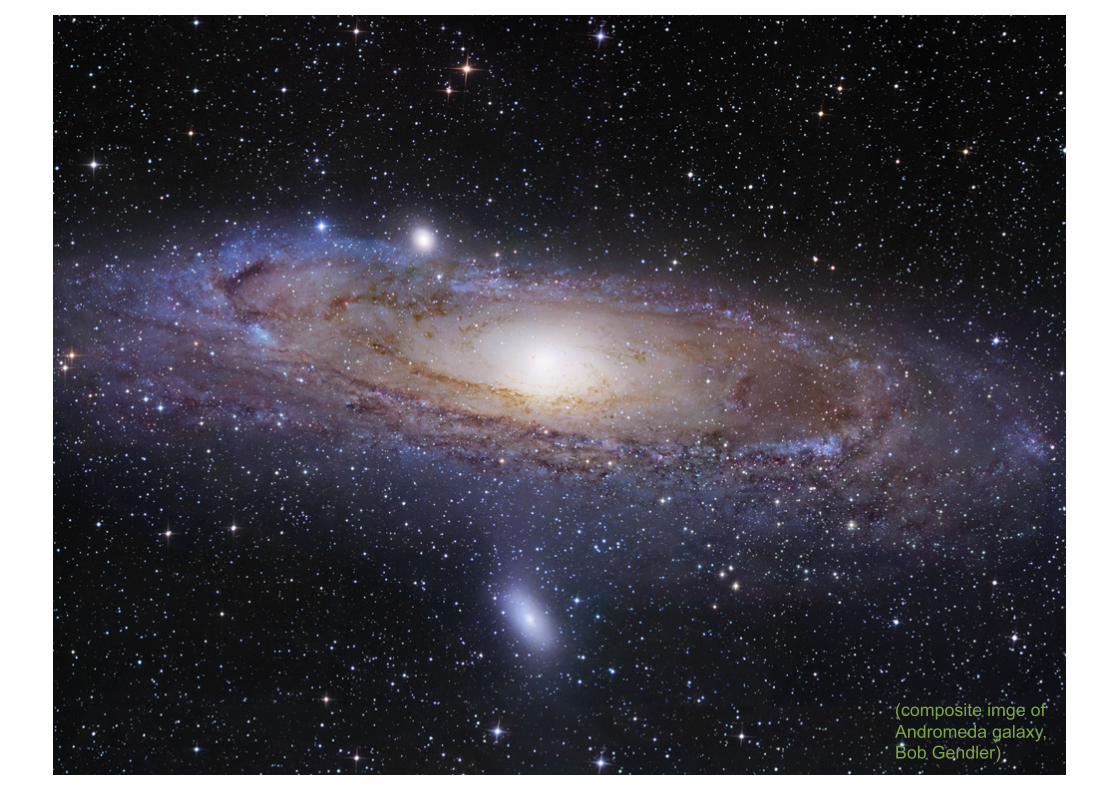
(composite imge of Andromeda galaxy, Bob Gendler)

NGC 602 in the LMC: Hubble Heritage Image

stellar mass fuctionstars seem to follow a universal mass function at birth --> IMF
(Kroupa 2002) Orion, NGC 3603, 30 Doradus (Zinnecker & Yorke 2007)

dynamical SF in a nutshell
interstellar gas is highly inhomogeneousgravitational instability
thermal instability
turbulent compression (in shocks δρ/ρ ∝ M2; in atomic gas: M ≈ 1...3)
cold molecular clouds can form rapidly in high-density regions at stagnation points of convergent large-scale flows
chemical phase transition: atomic molecularprocess is modulated by large-scale dynamics in the galaxy
inside cold clouds: turbulence is highly supersonic (M ≈ 1...20) → turbulence creates large density contrast, gravity selects for collapse
⎯⎯⎯⎯→ GRAVOTUBULENT FRAGMENTATION
turbulent cascade: local compression within a cloud provokes collapse formation of individual stars and star clusters
(e.g. Mac Low & Klessen, 2004, Rev. Mod. Phys., 76, 125-194)
space
dens
ity

controversial
issues

Global ISM dynamics
Formation of molecular clouds
Star cluster formation
First star formation
Magnetic fields in the primordial universe
decreasing spatial scales
pres
ent
days
pres
ent
days
earl
y un
iver
se

Global ISM dynamics
Formation of molecular clouds
Star cluster formation
First star formation
Magnetic fields in the primordial universe
decreasing spatial scales
pres
ent
days
pres
ent
days
earl
y un
iver
se
What are the initial conditions for star clusters? The density profile matters big time!

ICs of star cluster formation
one of the key questions in star formation:what is the initial density profile of cluster forming cores? how does it compare low-mass cores?

ICs of star cluster formation
one of the key questions in star formation:what is the initial density profile of cluster forming cores? how does it compare low-mass cores?
observational answer:

ICs of star cluster formation
one of the key questions in star formation:what is the initial density profile of cluster forming cores? how does it compare low-mass cores?
theorists answer:top hat (Larson Penston)Bonnor Ebert (like low-mass cores)power law ρ∝r -1 (logotrop)power law ρ∝r -3/2 (Krumholz, McKee, etc)power law ρ∝r -2 (Shu)and many more
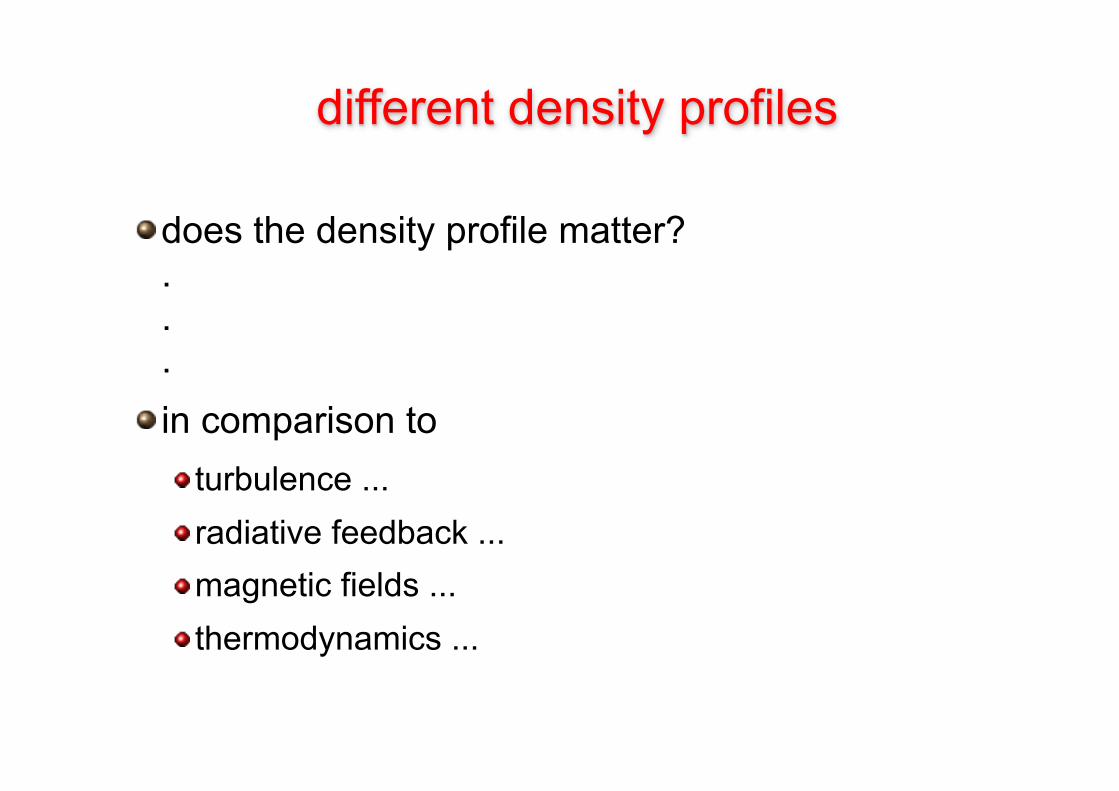
different density profiles
does the density profile matter?...in comparison to
turbulence ...radiative feedback ...magnetic fields ...thermodynamics ...

different density profiles
answer: YES! it matters big time!approach: extensive parameter study
different profiles (top hat, BE, r-3/2, r-3)different turbulence fields● different realizations● different Mach numbers ● solenoidal turbulence
dilatational turbulenceboth modes
no net rotation, no B-fields (at the moment)
Girichids et al. (2011)

Girichids et al. (2011)

for the r-2 profile you need to crank up turbulence a lot to get some fragmentation!
M=3 M=6 M=12 M=18
Girichids et al. (2011)
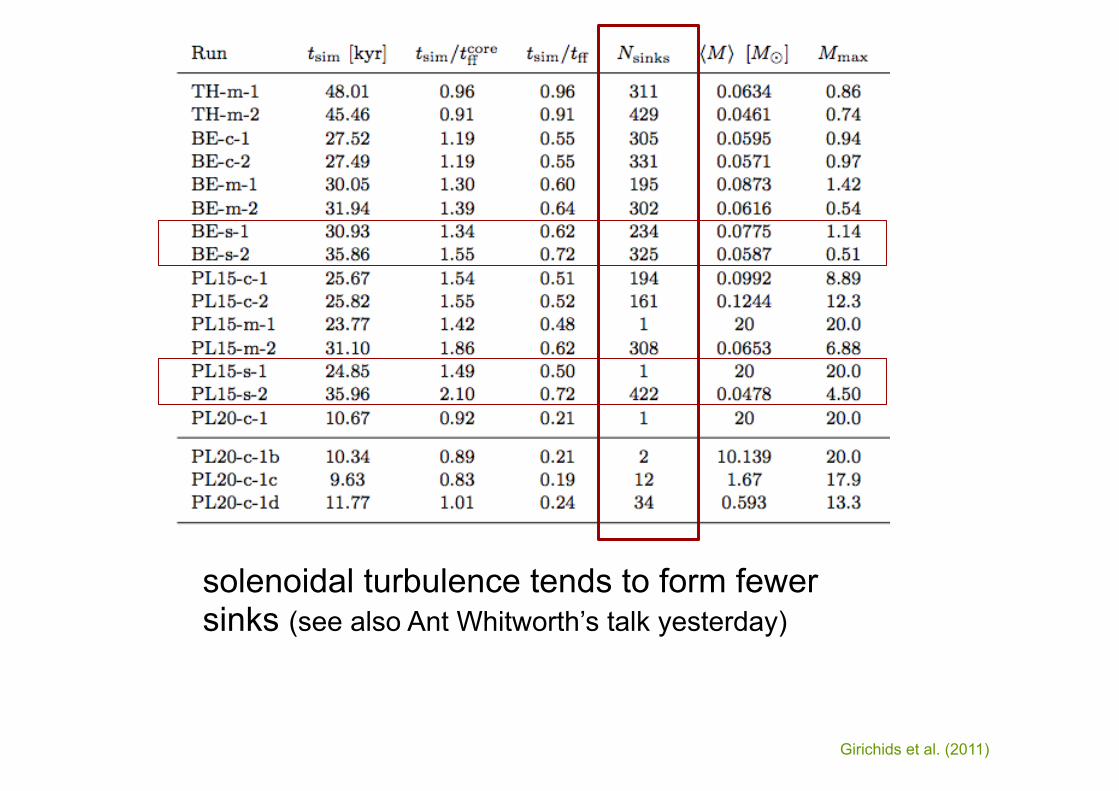
solenoidal turbulence tends to form fewer sinks (see also Ant Whitworth’s talk yesterday)
Girichids et al. (2011)

however, the real situation is more complex: need to analyze time scales for local collapse with the one of global collapse, which depends on details of realization.....
Girichids et al. (2011)

different density profiles
answer: YES! it matters big time!
however: this is good, because it may explain some of the theoretical controversy, we (currently) have in the field (hopefully).
Girichids et al. (2011)

Global ISM dynamics
Formation of molecular clouds
Star cluster formation
First star formation
Magnetic fields in the primordial universe
decreasing spatial scales
pres
ent
days
pres
ent
days
earl
y un
iver
se
Global ISM dynamics
Formation of molecular clouds
First star formation
Magnetic fields in the primordial universe
decreasing spatial scales
pres
ent
days
pres
ent
days
earl
y un
iver
se
How did the first stars form?In clusters with a wide IMF!
Star cluster formation

stellar masses• distribution of stellar masses depends on
- turbulent initial conditions --> mass spectrum of prestellar cloud cores
- collapse and interaction of prestellar cores--> competitive accretion and N-body effects
- thermodynamic properties of gas--> balance between heating and cooling--> EOS (determines which cores go into collapse)
- (proto) stellar feedback terminates star formationionizing radiation, bipolar outflows, winds, SN
application to first star formation

(1) p ∝ ργ ρ ∝ p1/ γ
(2) Mjeans ∝ γ3/2 ρ(3γ-4)/2
fragmentation depends on EOS
• γ<1: large density excursion for given pressure 〈Mjeans〉 becomes small number of fluctuations with M > Mjeans is large
• γ>1: small density excursion for given pressure 〈Mjeans〉 is large only few and massive clumps exceed Mjeans

EOS as function of metallicity
(Omukai et al. 2005)

(Omukai et al. 2005)
τ = 1
EOS as function of metallicity

(Omukai et al. 2005)
τ = 1
102 M0 1 M0
10-2 M0
EOS as function of metallicity

(Omukai et al. 2005, Jappsen et al. 2005, Larson 2005)
Z = 0
τ = 1
present-day star formation

IMF in nearby molecular clouds
(Jappsen et al. 2005, A&A, 435, 611)
with ρcrit ≈ 2.5×105 cm-3
at SFE ≈ 50%
need appropriateEOS in order to getlow mass IMF right

transition: Pop III to Pop II.5
(Omukai et al. 2005)
Z = - 5
τ = 1

The effect of dust cooling in the fragmentation of star-forming clouds 3
where [He] is the helium abundance, and n is the number den-sity of hydrogen nuclei. At other temperatures, κ ∝ T 2
gr, solong as Tgr < 200 K. For grain temperatures larger than 200 K,it is necessary to account for the effects of ice-mantle evapo-ration, while at much higher grain temperatures, the opacityfalls off extremely rapidly due to the melting of the grains.We account for these effects (see Semenov et al., 2003) andso our opacity varies with dust temperature following the re-lationship
κ = κ(T0) ×
T 2 T < 200KT 0 200K < T < 1500KT−12 T > 1500K
(6)
2.2. Setup and Initial conditions2.3. Thermodynamical evolution of gas and dust
Fig. 1.— Results of our low-resolution simulations, showing the dependenceof gas and dust temperatures on gas density for metallicities 10−4 and 10−5
times the solar value. In red, we show the gas temperature, and in blue thedust temperature for the turbulent and rotating cloud. The simple core col-lapse is overploted in dark red and green. The points with thinner featuresare from the simulations without rotation or turbulence, while those showingmore scatter come from the simulations with rotation and turbulence. Thedashed lines show constant Jeans mass values.
Resolution Number of Particle Turbulence AngularLevel Particles Mass Momentum
(10−5M⊙) (Eturb/|Egrav|) (Erot/|Egrav|)High 40 × 106 2.5 0.1 0.02Low 4 × 10⁶ 25.0 0.1 0.02
0.0 0.00
TABLE 1Simulation properties.
Fig. 2.— Number density maps for a slice through the high density region.The image shows a sequence of zooms in the density structure in the gasimmediately before the formation of the first protostar.
We performed three sets of simulations, two at low resolutionand one at high resolution. The details are shown in Table 1.Our low resolution simulations were performed to explore thethermal evolution of the gas during the collapse, and had 4million SPH particles which was insufficient to fully resolvefragmentation. We used these simulations to model the col-lapse of an initially uniform gas cloud with an initial num-ber density of 105 cm−3 and an initial temperature of 300 K.We modelled two different metallicities (10−4Z⊙ and 10−5Z⊙).The initial cloud mass was 1000 M⊙, and the mass resolu-tion was 25 × 10−3 M⊙. In one set of low-resolution simula-tions the gas was initially at rest, while in the other, we in-cluded small amounts of turbulent and rotational energy, withEturb/|Egrav| = 0.1 and β = Erot/|Egrav| = 0.02, where Egrav isthe gravitational potential energy, Eturb is the turbulent kineticenergy and Erot is the rotational energy. For our high resolu-tion simulations, which were designed to investigate whetherthe gas would fragment, we employed 40 million SPH par-ticles. We adopted initial conditions similar to those in thelow-resolution run with turbulence and rotation. As with thelow resolution runs, we simulated two metallicities, 10−4Z⊙and 10−5Z⊙. The mass resolution (taken to be 100 times theSPH particle mass) was 2.5 × 10⁻³M⊙.
3. ANALYSIS
In Figure 1, we compare the evolution of the dust and gastemperatures in the low-resolution simulations. The dust tem-perature, shown in the lower part of the panels, varies from the
transition: Pop III to Pop II.54 Dopcke et al.
CMB temperature in the low density region to the gas temper-ature at much higher densities. At densities higher than 1011–1012 cm−3, dust cooling starts to be effective and begins tocool the gas. The gas temperature decreases to roughly 600 Kin the 10−5 Z⊙ simulations, and 300 K in the Z = 10−4Z⊙ case.This temperature decrease significantly increases the numberof Jeans masses present in the collapsing region, making thegas unstable to fragmentation. The dust and the gas temper-atures couple for densities higher then 1013cm−3, when thecompressional heating starts to dominate again over the dustcooling. The subsequent evolution of the gas is close to adia-batic. If we compare the results of the runs with and withoutrotation and turbulence, then the most obvious difference isthe much greater scatter in the n − T diagram in the formercase. Variations in the infall velocity lead to different fluid el-ements undergoing different amounts of compressional heat-ing. The overall effect is to reduce both the infall velocityand the average compressional heating rate. This allows dustcooling to dominate at a density that is up to five times smallerthan in the case without rotation or turbulence. The gas alsoreaches a lower temperature, cooling down to ≈ 200K (insteadof 300K) for the Z = 10−4Z⊙ case, and to ≈ 400K (instead of600K) for the Z = 10−5Z⊙ case. This behavior shows thatit is essential to use 3D simulations to follow the evolutionof the collapsing gas. A similar effect can be seen in Clarket al. (2010). If we compare our results to the calculations ofOmukai et al. (2010), we find that dust cooling is considerablyless effective than predicted by the one-zone models, but theagreement is better with their one-zone plus 1D hydrodynam-ical models. We find that a metallicity of 10−4Z⊙ is requiredto cool the gas down to 300 K, while for the same metallicity,Omukai et al. (2010) find that the gas cools down to 200 K.
3.1. FragmentationWe follow the thermodynamical evolution of the gas up to
very high densities of order 1017cm−3, where the Jeans massis ≈ 10−2M⊙, and so we need a high resolution simulation tostudy the fragmentation behaviour. The transport of angularmomentum to smaller scales during the collapse leads to theformation of a dense disk-like structure, supported by rotationwhich then fragments into several objects. Figure 2 shows thedensity structure in the gas immediately before the formationof the first protostar. The top-left panel shows a density sliceon a scale comparable to the size of the initial gas distribu-tion. The structure is very filamentary and there are two mainoverdense clumps in the center. If we zoom in on one of theclumps, we see that its internal structure is also filamentary.We can follow the collapse down to scales of the order of anAU, but at this point we reach the limit of our computationalapproach: as the gas collapses further, the Courant timestepbecomes very small, making it difficult to follow the furtherevolution of the cloud. In order to avoid this difficulty, wereplace very dense, gravitationally bound, and collapsing re-gions by sink particles. Once the conditions for sink particlecreation are met, they start to form in the highest density re-gions (Figure 3). Due to interactions with other sink particlesthat result in an increase in velocity, some sink particles canbe ejected from the high-density region, but most of the par-ticles still remain within the dense gas. Within 137 years ofthe formation of the first sink particle, 45 sink particles haveformed. At this time, approximately 4.6M⊙ of gas has beenaccreted by the sink particles.
Fig. 3.— Number density map showing a slice in the densest clump, and thesink formation time evolution, for the 40 million particles simulation, and Z= 10−4Z⊙. The box is 100AU x 100AU and the time is measured from theformation of the first sink particle.
Fig. 4.— Sink particle mass function at the end of the simulations. Highand low resolution results and corresponding resolution limits are shown. Toresolve the fragmentation, the mass resolution should be smaller than theJeans mass at the point in the temperature-density diagram where dust andgas couple and the compressional heating starts to dominate over the dustcooling. At the time shown, around 5 M⊙ of gas had been accreted by thesink particles in each simulation.
3.2. Properties of the fragmentsFigure 4 shows the mass distribution of sink particles when
we stop the calculation. We typically find masses below 1M⊙,with somewhat smaller values in the 10−4Z⊙ case comparedto the 10−5Z⊙ case. Both histograms have the lowest sink par-ticle mass well above the resolution limit of 0.0025M⊙. Notethat in both cases, we are still looking at the very early stagesof star cluster evolution. As a consequence, the sink particlemasses in Figure 4 are not the same as the final protostellarmasses – there are many mechanisms that will affect the massfunction, such as continuing accretion, mergers between thenewly formed protostars, feedback from winds, jets and lu-minosity accretion, etc. Nevertheless, we can speculate thatthe typical stellar mass is similar to what is observed for PopII stars in the Milky Way. This suggests that the transitionfrom high-mass primordial stars to Population II stars withmass function similar to that at the present day occurs earlyin the metal evolution history of the universe, at metallicitiesZcrit < 10−5Z⊙. The number of protostars formed by the end
Dopcke et al. (2011, ApJ 729, L3)

transition: Pop III to Pop II.5
Dopcke et al. (2011, ApJ 729, L3)
The effect of dust cooling in the fragmentation of star-forming clouds 3
where [He] is the helium abundance, and n is the number den-sity of hydrogen nuclei. At other temperatures, κ ∝ T 2
gr, solong as Tgr < 200 K. For grain temperatures larger than 200 K,it is necessary to account for the effects of ice-mantle evapo-ration, while at much higher grain temperatures, the opacityfalls off extremely rapidly due to the melting of the grains.We account for these effects (see Semenov et al., 2003) andso our opacity varies with dust temperature following the re-lationship
κ = κ(T0) ×
T 2 T < 200KT 0 200K < T < 1500KT−12 T > 1500K
(6)
2.2. Setup and Initial conditions2.3. Thermodynamical evolution of gas and dust
Fig. 1.— Results of our low-resolution simulations, showing the dependenceof gas and dust temperatures on gas density for metallicities 10−4 and 10−5
times the solar value. In red, we show the gas temperature, and in blue thedust temperature for the turbulent and rotating cloud. The simple core col-lapse is overploted in dark red and green. The points with thinner featuresare from the simulations without rotation or turbulence, while those showingmore scatter come from the simulations with rotation and turbulence. Thedashed lines show constant Jeans mass values.
Resolution Number of Particle Turbulence AngularLevel Particles Mass Momentum
(10−5M⊙) (Eturb/|Egrav|) (Erot/|Egrav|)High 40 × 106 2.5 0.1 0.02Low 4 × 10⁶ 25.0 0.1 0.02
0.0 0.00
TABLE 1Simulation properties.
Fig. 2.— Number density maps for a slice through the high density region.The image shows a sequence of zooms in the density structure in the gasimmediately before the formation of the first protostar.
We performed three sets of simulations, two at low resolutionand one at high resolution. The details are shown in Table 1.Our low resolution simulations were performed to explore thethermal evolution of the gas during the collapse, and had 4million SPH particles which was insufficient to fully resolvefragmentation. We used these simulations to model the col-lapse of an initially uniform gas cloud with an initial num-ber density of 105 cm−3 and an initial temperature of 300 K.We modelled two different metallicities (10−4Z⊙ and 10−5Z⊙).The initial cloud mass was 1000 M⊙, and the mass resolu-tion was 25 × 10−3 M⊙. In one set of low-resolution simula-tions the gas was initially at rest, while in the other, we in-cluded small amounts of turbulent and rotational energy, withEturb/|Egrav| = 0.1 and β = Erot/|Egrav| = 0.02, where Egrav isthe gravitational potential energy, Eturb is the turbulent kineticenergy and Erot is the rotational energy. For our high resolu-tion simulations, which were designed to investigate whetherthe gas would fragment, we employed 40 million SPH par-ticles. We adopted initial conditions similar to those in thelow-resolution run with turbulence and rotation. As with thelow resolution runs, we simulated two metallicities, 10−4Z⊙and 10−5Z⊙. The mass resolution (taken to be 100 times theSPH particle mass) was 2.5 × 10⁻³M⊙.
3. ANALYSIS
In Figure 1, we compare the evolution of the dust and gastemperatures in the low-resolution simulations. The dust tem-perature, shown in the lower part of the panels, varies from the
red / blue: turbulence and rotationdark red / green: simple collapse
4 Dopcke et al.
CMB temperature in the low density region to the gas temper-ature at much higher densities. At densities higher than 1011–1012 cm−3, dust cooling starts to be effective and begins tocool the gas. The gas temperature decreases to roughly 600 Kin the 10−5 Z⊙ simulations, and 300 K in the Z = 10−4Z⊙ case.This temperature decrease significantly increases the numberof Jeans masses present in the collapsing region, making thegas unstable to fragmentation. The dust and the gas temper-atures couple for densities higher then 1013cm−3, when thecompressional heating starts to dominate again over the dustcooling. The subsequent evolution of the gas is close to adia-batic. If we compare the results of the runs with and withoutrotation and turbulence, then the most obvious difference isthe much greater scatter in the n − T diagram in the formercase. Variations in the infall velocity lead to different fluid el-ements undergoing different amounts of compressional heat-ing. The overall effect is to reduce both the infall velocityand the average compressional heating rate. This allows dustcooling to dominate at a density that is up to five times smallerthan in the case without rotation or turbulence. The gas alsoreaches a lower temperature, cooling down to ≈ 200K (insteadof 300K) for the Z = 10−4Z⊙ case, and to ≈ 400K (instead of600K) for the Z = 10−5Z⊙ case. This behavior shows that itis essential to use 3D simulations to follow the evolution ofthe collapsing gas. A similar effect can be seen in Clark et al.(2011).
3.2. FragmentationWe follow the thermodynamical evolution of the gas up to
very high densities of order 1017cm−3, where the Jeans massis ≈ 10−2M⊙, and so we need a high resolution simulation tostudy the fragmentation behaviour. The transport of angularmomentum to smaller scales during the collapse leads to theformation of a dense disk-like structure, supported by rotationwhich then fragments into several objects. Figure 2 shows thedensity structure in the gas immediately before the formationof the first protostar. The top-left panel shows a density sliceon a scale comparable to the size of the initial gas distribu-tion. The structure is very filamentary and there are two mainoverdense clumps in the center. If we zoom in on one of theclumps, we see that its internal structure is also filamentary.We can follow the collapse down to scales of the order of anAU, but at this point we reach the limit of our computationalapproach: as the gas collapses further, the Courant timestepbecomes very small, making it difficult to follow the furtherevolution of the cloud. In order to avoid this difficulty, wereplace very dense, gravitationally bound, and collapsing re-gions by sink particles. Once the conditions for sink particlecreation are met, they start to form in the highest density re-gions (Figure 3). Due to interactions with other sink particlesthat result in an increase in velocity, some sink particles canbe ejected from the high-density region, but most of the par-ticles still remain within the dense gas. Within 137 years ofthe formation of the first sink particle, 45 sink particles haveformed. At this time, approximately 4.6M⊙ of gas has beenaccreted by the sink particles.
Fig. 3.— Number density map showing a slice in the densest clump, and thesink formation time evolution, for the 40 million particles simulation, and Z= 10−4Z⊙. The box is 100AU x 100AU and the time is measured from theformation of the first sink particle.
Fig. 4.— Sink particle mass function at the end of the simulations. Highand low resolution results and corresponding resolution limits are shown. Toresolve the fragmentation, the mass resolution should be smaller than theJeans mass at the point in the temperature-density diagram where dust andgas couple and the compressional heating starts to dominate over the dustcooling. At the time shown, around 5 M⊙ of gas had been accreted by thesink particles in each simulation.
3.3. Properties of the fragmentsFigure 4 shows the mass distribution of sink particles when
we stop the calculation. We typically find masses below 1M⊙,with somewhat smaller values in the 10−4Z⊙ case comparedto the 10−5Z⊙ case. Both histograms have the lowest sink par-ticle mass well above the resolution limit of 0.0025M⊙. Notethat in both cases, we are still looking at the very early stagesof star cluster evolution. As a consequence, the sink particlemasses in Figure 4 are not the same as the final protostellarmasses – there are many mechanisms that will affect the massfunction, such as continuing accretion, mergers between thenewly formed protostars, feedback from winds, jets and lu-minosity accretion, etc. Nevertheless, we can speculate thatthe typical stellar mass is similar to what is observed for PopII stars in the Milky Way. This suggests that the transitionfrom high-mass primordial stars to Population II stars withmass function similar to that at the present day occurs earlyin the metal evolution history of the universe, at metallicitiesZcrit < 10−5Z⊙. The number of protostars formed by the end
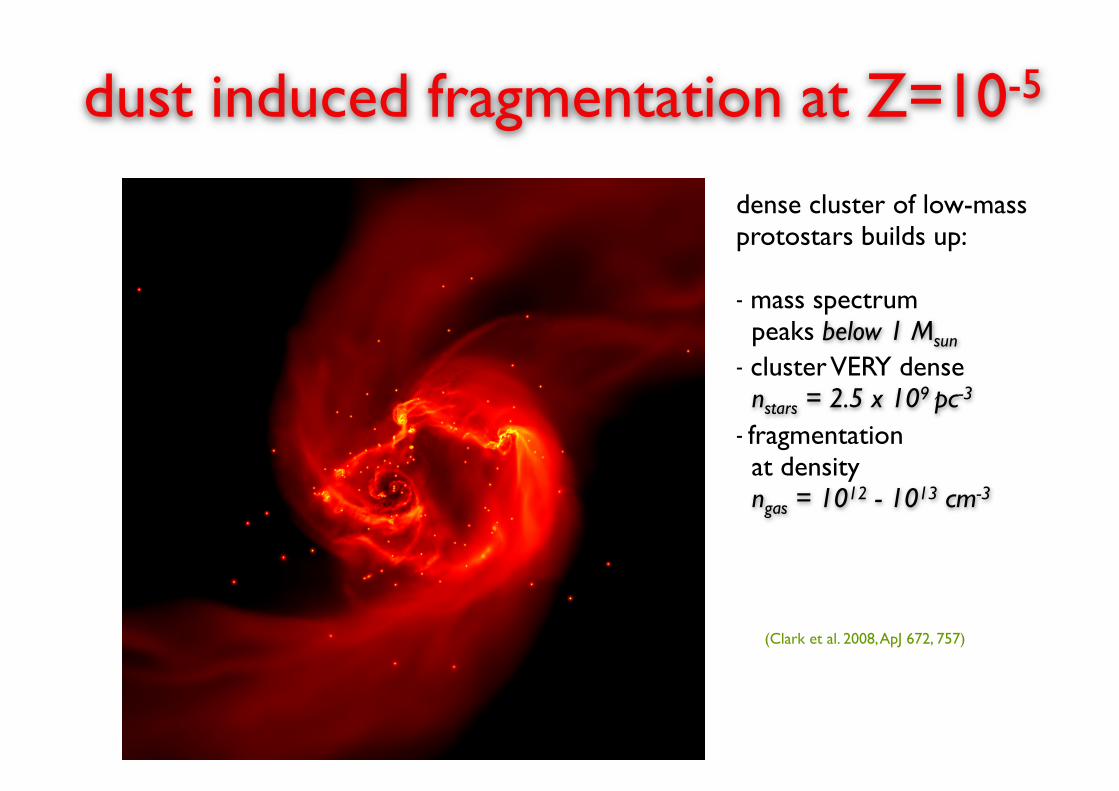
dense cluster of low-mass protostars builds up:
- mass spectrum peaks below 1 Msun
- cluster VERY dense nstars = 2.5 x 10⁹ pc-3
- fragmentation at density ngas = 1012 - 1013 cm-3
400 AU
(Clark et al. 2008, ApJ 672, 757)
dust induced fragmentation at Z=10-5

metal-free star formation
(Omukai et al. 2005)
Z = - ∞
τ = 1
• slope of EOS in the density range 5 cm-3 ≤ n ≤ 16 cm-3 is γ≈1.06.
• with non-zero angular momentum, disk forms.
• disk is unstable against frag- mentation at high density
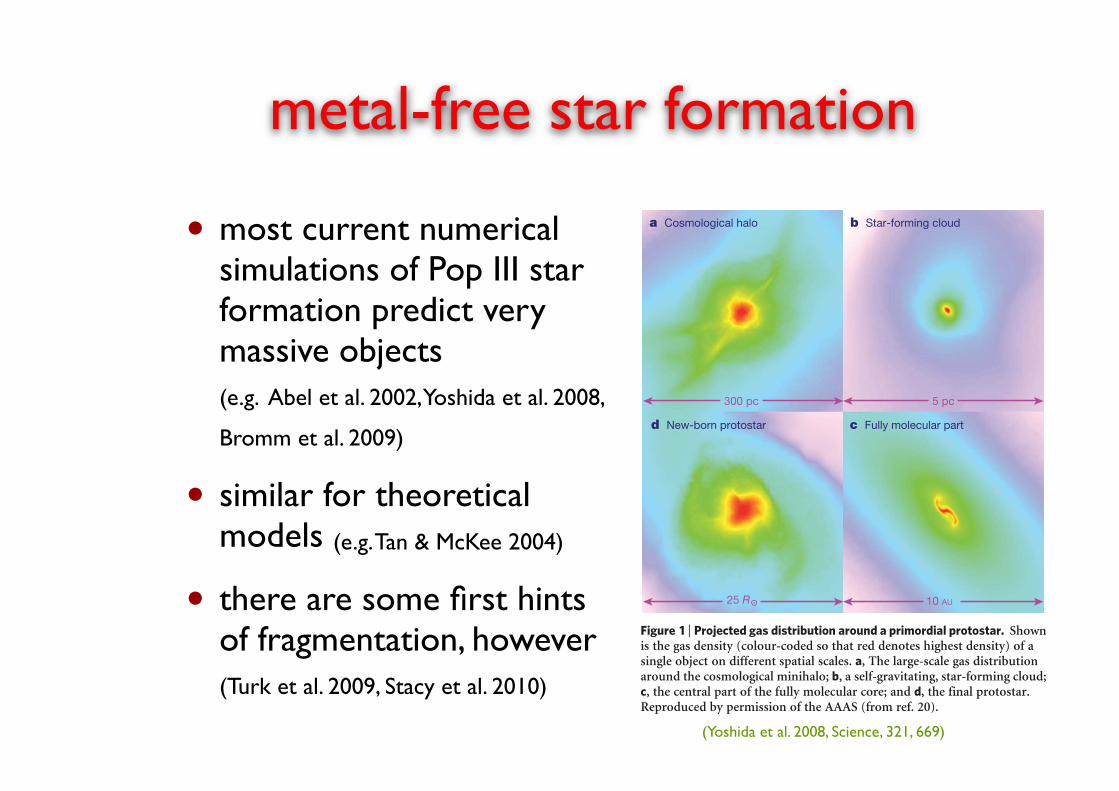
• most current numerical simulations of Pop III star formation predict very massive objects(e.g. Abel et al. 2002, Yoshida et al. 2008,
Bromm et al. 2009)
• similar for theoretical models (e.g. Tan & McKee 2004)
• there are some first hints of fragmentation, however(Turk et al. 2009, Stacy et al. 2010)
metal-free star formation(so-called ‘minihaloes’; M8, solar mass). In the standard CDMmodel, the minihaloes that were the first sites for star formationare expected to be in place at redshift z< 20–30, when the age ofthe Universe was just a few hundred million years14. These systemscorrespond to (3–4)s peaks in the cosmic density field, which isstatistically described as a Gaussian random field. Such high-densitypeaks are expected to be strongly clustered15, and thus feedbackeffects from the first stars are important in determining the fate ofthe surrounding primordial gas clouds. It is very likely that only onestar can be formed within a gas cloud, because the far-ultravioletradiation from a single massive star is sufficient to destroy all theH2 in the parent gas cloud16,17. In principle, a cloud that formed oneof the first stars could fragment into a binary or multiple star sys-tem18,19, but simulations based on self-consistent cosmological initialconditions do not show this20. Although the exact number of stars percloud cannot be easily determined, the number is expected to besmall, so that minihaloes will not be galaxies (see Box 1).
Primordial gas clouds undergo runaway collapse when sufficientmass is accumulated at the centre of a minihalo. The minimummassat the onset of collapse is determined by the Jeans mass (more pre-cisely, the Bonnor–Ebert mass), which can be written as:
MJ<500M8T
200
! "3=2 n
104
# ${1=2ð1Þ
for an atomic gas with temperature T (in K) and particle numberdensity n (in cm23). The characteristic temperature is set by theenergy separation of the lowest-lying rotational levels of the traceamounts of H2, and the characteristic density corresponds to thethermalization of these levels, above which cooling becomes lessefficient12. A number of atomic andmolecular processes are involvedin the subsequent evolution of a gravitationally collapsing gas. It hasbeen suggested that a complex interplay between chemistry, radiativecooling and hydrodynamics leads to fragmentation of the cloud21,but vigorous fragmentation is not observed even in extremely high-resolution cosmological simulations11–13,20,22. Interestingly, however,simulations starting from non-cosmological initial conditions haveyielded multiple cloud cores19,23. It appears that a high initial degreeof spin in the gas eventually leads to the formation of a disk and itssubsequent break-up. It remains to be seen whether such conditionsoccur from realistic cosmological initial conditions.
Although the mass triggering the first runaway collapse is well-determined, it provides only a rough estimate of the mass of the star(s)to be formed. Standard star-formation theory predicts that a tiny proto-star forms first and subsequently grows by accreting the surrounding gasto become a massive star. Indeed, the highest-resolution simulations offirst-star formation verify that this also occurs cosmologically20 (Fig. 1).However, the ultimatemass of the star is determinedbothby themass ofthe cloud out of which it forms and by a number of feedback processesthat occur during the evolution of the protostar. In numerical simula-tions, the finalmass of a population III star is usually estimated from thedensity distribution and velocity field of the surrounding gas when thefirst protostellar fragment forms, but thismaywell be inaccurate even inthe absence of protostellar feedback. Whereas protostellar feedbackeffects are well studied in the context of the formation of contemporarystars24, they differ in several important respects in primordial stars25.
First, primordial gas does not contain dust grains. As a result,radiative forces on the gas are much weaker. Second, it is generallyassumed that magnetic fields are not important in primordial gasbecause, unless exotic mechanisms are invoked, the amplitudes ofmagnetic fields generated in the early Universe are so small that theynever become dynamically significant in primordial star-forminggas26. Magnetic fields have at least two important effects in contem-porary star formation: they reduce the angular momentum of the gasoutofwhich stars form, and theydrive powerful outflows that dispersea significant fraction of the parent cloud. It is likely that the pre-stellargas has more angular momentum in the primordial case, and this isborne out by cosmological simulations. Third, primordial stars are
much hotter than contemporary stars of the same mass, resulting insignificantly greater ionizing luminosities27.
State-of-the-art numerical simulations of the formation of the first(population III.1) stars represent a computational tour de force, inwhich the collapse is followed from cosmological (comoving mega-parsec) scales down to protostellar (sub-astronomical-unit) scales,revealing the entire formationprocess of a protostar.However, furthergrowth of the protostar cannot be followed accurately without imple-menting additional radiative physics. For now, inferring the sub-sequent evolution of the protostar requires approximate analyticcalculations. By generalizing a theory for contemporary massive-starformation28, it is possible to approximately reproduce the initial con-ditions found in the simulations and to then predict the growth of theaccretion disk around the star29. Several feedback effects determine thefinal mass of a first star25: photodissociation of H2 in the accreting gasreduces the cooling rate, but does not stop accretion. Lyman-a radi-ation pressure can reverse the infall in the polar regions when theprotostar grows to 20–30 M8, but cannot significantly reduce theaccretion rate. The expansion of the H II region produced by the largeflux of ionizing radiation can significantly reduce the accretion ratewhen the protostar reaches 50–100M8, but accretion can continue inthe equatorial plane. Finally, photoevaporation-drivenmass loss fromthe disk30 stops the accretion and fixes themass of the star (see Fig. 2).The finalmass depends on the entropy and angularmomentumof thepre-stellar gas; for reasonable conditions, themass spans 60–300M8.
A variety of physical processes can affect and possibly substantiallyalter thepicture outlined above.Magnetic fields generated through themagneto-rotational instability may become important in the proto-stellar disk31, although their strength is uncertain, and may play animportant role in the accretion phase18. Cosmic rays and otherexternal ionization sources, if they existed in the early Universe, couldsignificantly affect the evolution of primordial gas32. A partiallyionized gas cools more efficiently because the abundant electronspromoteH2 formation. Such a gas cools to slightly lower temperaturesthan a neutral gas can, accentuating the fractionation of D into HD sothat cooling by HD molecules becomes important33–36.
300 pc 5 pc
10 AU
a Cosmological halo b Star-forming cloud
c Fully molecular partd New-born protostar
25 R .
Figure 1 | Projected gas distribution around a primordial protostar. Shownis the gas density (colour-coded so that red denotes highest density) of asingle object on different spatial scales. a, The large-scale gas distributionaround the cosmological minihalo; b, a self-gravitating, star-forming cloud;c, the central part of the fully molecular core; and d, the final protostar.Reproduced by permission of the AAAS (from ref. 20).
REVIEWS NATUREjVol 459j7 May 2009
50 Macmillan Publishers Limited. All rights reserved©2009
(Yoshida et al. 2008, Science, 321, 669)
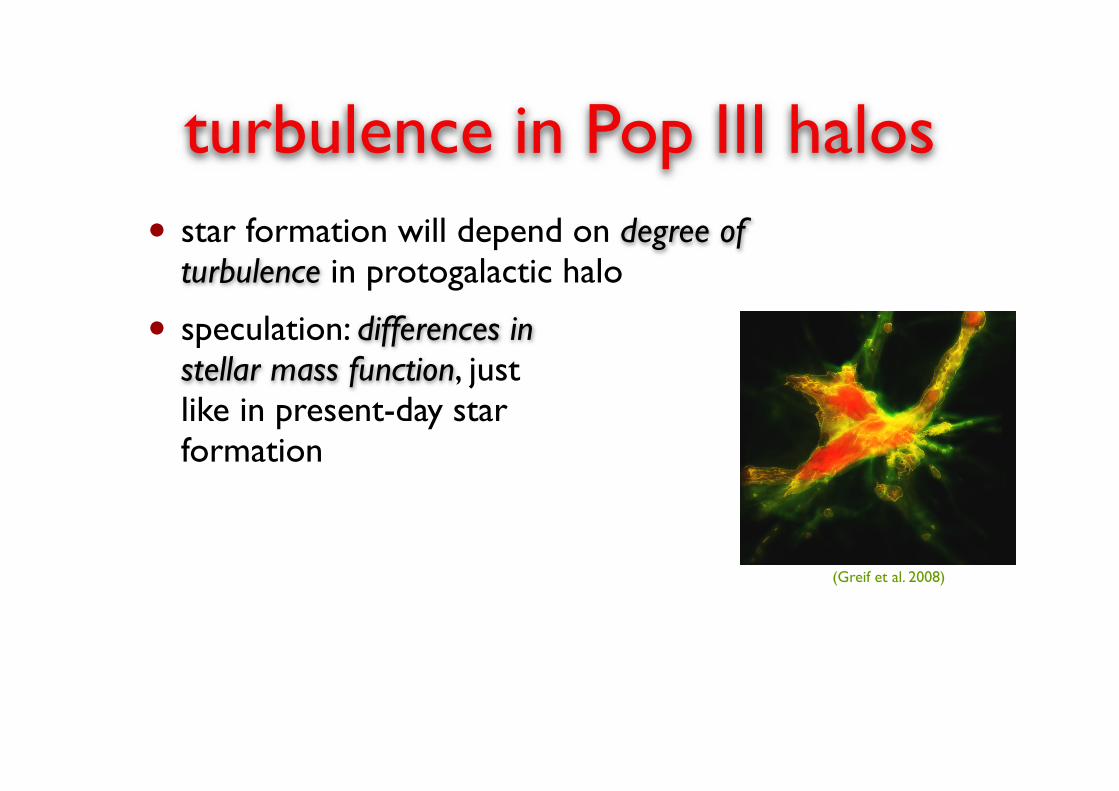
turbulence in Pop III halos• star formation will depend on degree of
turbulence in protogalactic halo
• speculation: differences in stellar mass function, just like in present-day star formation
(Greif et al. 2008)

turbulence in Pop III halos• star formation will depend on degree of
turbulence in protogalactic halo
• speculation: differences in stellar mass function, just like in present-day star formation
(Greif et al. 2008)
turbulence developing in an atomic cooling halo

multiple Pop III stars in halo
• parameter study with different strength of turbulence using SPH: study Pop III.1 and Pop III.2 case (Clark et al., 2011a, ApJ, 727, 110)
• 2 very high resolution studies of Pop III star formation in cosmological context
- SPH: Clark et al. 2011b, Science (arXiv:1101.5284)
- Arepo: Greif et al. 2011a, ApJ, submitted (arXiv:1101.5491)
- complementary approaches with interesting similarities and differences....

Pop III.1
(Clark et al, 2011a)

Pop III.2
(Clark et al, 2011a)

(Clark et al. 2011b, Science)
SPH study: face on look at accretion diskFigure 1: Density evolution in a 120 AU region around the first protostar, showing the build-up
of the protostellar disk and its eventual fragmentation. We also see ‘wakes’ in the low-densityregions, produced by the previous passage of the spiral arms.
3
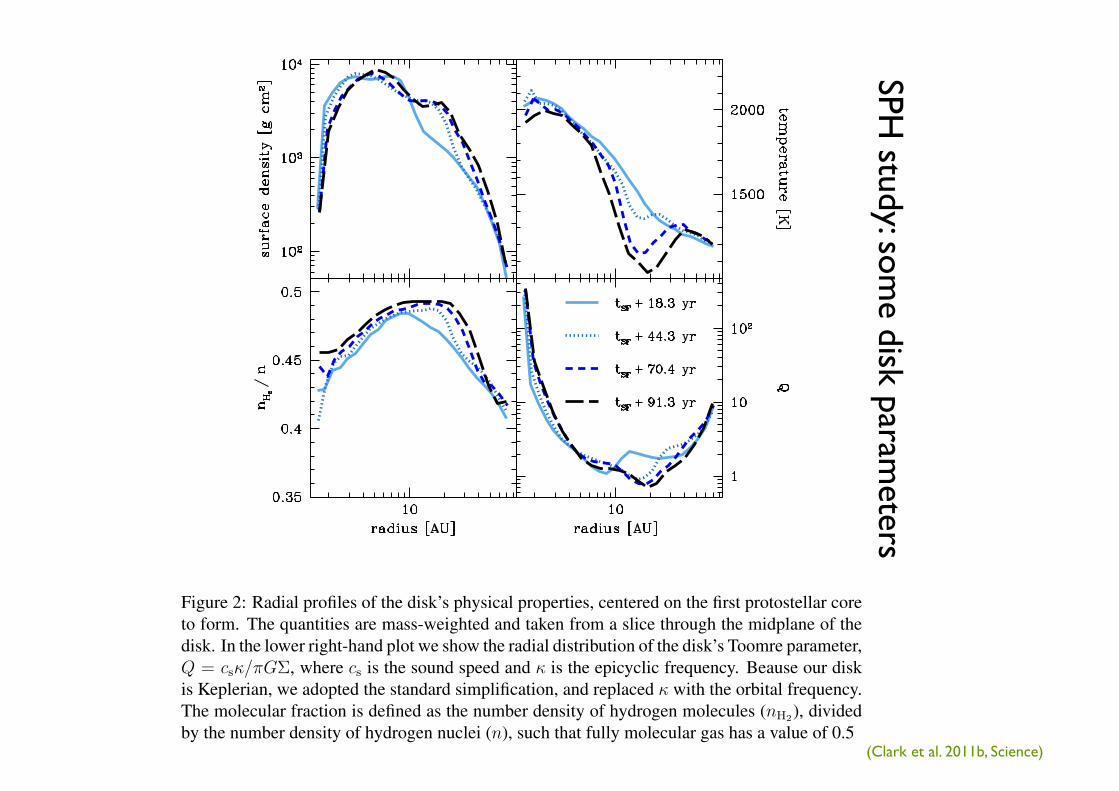
SPH study: som
e disk parameters
(Clark et al. 2011b, Science)
Figure 2: Radial profiles of the disk’s physical properties, centered on the first protostellar coreto form. The quantities are mass-weighted and taken from a slice through the midplane of thedisk. In the lower right-hand plot we show the radial distribution of the disk’s Toomre parameter,Q = csκ/πGΣ, where cs is the sound speed and κ is the epicyclic frequency. Beause our diskis Keplerian, we adopted the standard simplification, and replaced κ with the orbital frequency.The molecular fraction is defined as the number density of hydrogen molecules (nH2), dividedby the number density of hydrogen nuclei (n), such that fully molecular gas has a value of 0.5
5

SPH study: m
ass accretion onto disk and onto protostars
(Clark et al. 2011b, Science)
Figure 3: The mass transfer rate through the disk is denoted by the solid black line, whilethe mass infall rate through spherical shells with the specified radius is shown by the darkblue dashed line. The latter represents the total amount of material flowing through a givenradius, and is thus a measure of the material flowing through and onto the disk at each ra-dius. Both are shown at the onset of disk fragmentation. In the case of the disk accretionwe have denoted annuli that are moving towards the protostar with blue dots, and those mov-ing away in pink (further details can be found in Section 6 of the online material). The lightblue dashed lines show the accretion rates expected from an ‘alpha’ (thin) disk model, whereM(r) = 3 π α cs(r) Σ(r) H(r), with two global values of alpha and where cs(r), Σ(r), andH(r) are (respectively) the sound speed, surface density and disk thickness at radius r.
7

Figure 7: (a) Dominant heating and cooling processes in the gas that forms the second sink
particle. (b) Upper line: ratio of the thermal timescale, tthermal, to the free-fall timescale, tff ,
for the gas that forms the second sink particle. Periods when the gas is cooling are indicated in
blue, while periods when the gas is heating are indicated in red. Lower line: ratio of tthermal to
the orbital timescale, torbital, for the same set of SPH particles (c) Temperature evolution of the
gas that forms the second sink (d) Density evolution of the gas that forms the second sink
22
SPH study: com
parison of all relevant heating and cooling processes
(Clark et al. 2011b, Science)

(Greif et al. 2011a, submitted)
Arepo study: surface density at different times
one out of five halos

(Greif et al. 2011a, submitted)

0.1
1.0
10.0
10 100 103
t [yr]
0.1
1.0
10.0
M* [
MO • ]
Standard sink particles
’Sticky’ sink particles
14
(Greif et al. 2011a, submitted)
Arepo study: protostellar
mass accretion rates

1
MH-1
1
MH-1
MH-2
MH-2
MH-3
MH-3
0.1 1 10
1
MH-4
0.1 1 10
1
MH-4
0.1 1 10
MH-5
0.1 1 10
MH-5
0.1 1 10
0.1 1 10
Sum / 2
M* [MO • ]
num
ber
15
Arepo study: mass spectrum of fragments
(Greif et al. 2011a, submitted)

primordial star formation
first star formation is not less complex than present-day star formation
brave claim: all Pop III stars form in multiple systems
even braver claim: some Pop III stars fall in the mass range < 0.5 M☉ ---> they should still be around!!!!

questions
• is claim of Pop III stars with M ~ 0.5 M☉ really justified?
- stellar collisions
- magnetic fields
- radiative feedback
• how would we find them?
- spectral features
• where should we look?
• what about magnetic fields?

Global ISM dynamics
Formation of molecular clouds
Star cluster formation
First star formation
Magnetic fields in the primordial universe
decreasing spatial scales
pres
ent
days
pres
ent
days
earl
y un
iver
se

Global ISM dynamics
Formation of molecular clouds
Magnetic fields in the primordial universe
decreasing spatial scales
pres
ent
days
pres
ent
days
earl
y un
iver
se Are there dynamically significant B-fields in the early universe? YES!
Star cluster formation
First star formation


B fields in the early universe?
• we know the universe is magnetized (now)
• knowledge about B-fields in the high-redshift universe is extremely uncertain
- inflation / QCD phase transition / Biermann battery / Weibel instability
• they are thought to be extremely small
• however, THIS MAY BE WRONG!

small-scale turbulent dynamo
• idea: the small-scale turbulent dynamo can generate strong magnetic fields from very small seed fields
• approach: model collapse of primordial gas ---> formation of the first stars in low-mass halo at redshift z ~ 20
• method: solve ideal MHD equations with very high resolution
- grid-based AMR code FLASH (effective resolution 655363)

magnetic field structure density structure
(Sur et al. 2010, ApJ, 721, L734)

(Sur et al. 2010, ApJ, 721, L734)
Field amplification during first collapse seems unavoidable.
QUESTIONS:
• Is it really the small scale dynamo? • What is the saturation value? Can the field reach dynamically important strength?
radial density profile
radial velocity profile
Mach number profile

analysis of magnetic field spectra
Slope +3/2 of Kazantsev theory
initial slope of B fluctuations
initial peak of B fluctuation spectrum
(e.g. Brandenburg & Subramanian, 2005, Phys. Rep., 417, 1)
(Federrath et al., 2011, ApJ in press)

analysis of magnetic field spectra
B fluctuation spectrum in flat inner core
B fluctuation spectrum in 1/r2 fall-off
(Federrath et al., 2011, ApJ in press)

(Sur et al., in prep.)
Jeans mass
ratio of magnetic to kinetic energy
We seem to get a saturation level of ~10%
QUESTIONS: • Is this true in a proper cosmological context? • What does it mean for the formation of the first stars
first attempts to calculate the saturation level.

questions
• small-scale turbulent dynamo is expected to operate during Pop III star formation
• simple models indicate saturation levels of ~10% --> larger values via αΩ dynamo?
• QUESTIONS:
- does this hold for “proper” halo calculations (with chemistry and cosmological context)?
- what is the strength of the seed magnetic field?

Global ISM dynamics
Formation of molecular clouds
decreasing spatial scales
pres
ent
days
pres
ent
days
earl
y un
iver
se
Magnetic fields in the primordial universeIs there a minimum primordial field?What is the influence of B on Pop III star?
First star formationAre there still Pop III stars around?How can we see them? And where?
Star cluster formationWhat is the density profile of IRDCs?
summary


![arXiv:1211.3663v1 [astro-ph.CO] 15 Nov 2012 · 2 Institut fur Theoretische Astrophysik, Zentrum fur As-tronomie, Institut fur Theoretische Astrophysik, Albert-Ueberle-Str. 2, 29120](https://static.fdocuments.in/doc/165x107/5ed6fb95651f8a5a0134a5ae/arxiv12113663v1-astro-phco-15-nov-2012-2-institut-fur-theoretische-astrophysik.jpg)