Formation of Massive Stars: IIw.astro.berkeley.edu/~ay216/05/NOTES/Lecture30.pdf · l Implied...
50
Formation of Massive Stars: II James R. Graham UC, Berkeley
Transcript of Formation of Massive Stars: IIw.astro.berkeley.edu/~ay216/05/NOTES/Lecture30.pdf · l Implied...

Formation of Massive Stars: II
James R. Graham
UC, Berkeley
AY 216 528
Stellar Winds
l OB stars possess strong stellar windsl It is possible that the kinematics of UCHII
regions are dominated by the wind energy &momentum• Winds have been proposed as the mechanism for
producing shell morphologies of UC HII regions(Castor, McCray, & Weaver 1975; Shull 1980)
• It is not known when winds begin in OB stars+ Probably before stellar winds begin bipolar outflows
produced in the formation process will have a major inputof mechanical energy and momentum
AY 216 529
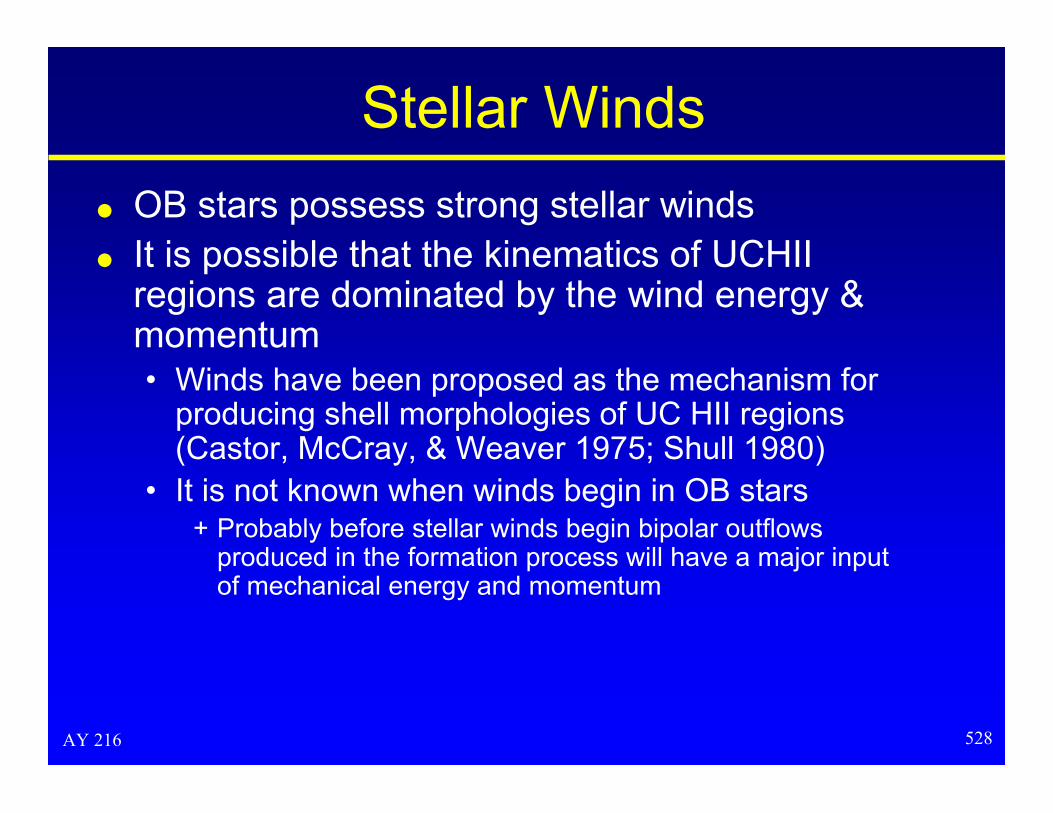
Stellar Wind Models
l An UC HII region is confined bythe dense, ambient moleculargas providing the thermalpressure required forconfinement
l Infalling ambient molecular gascreates both an increase indensity and pressure at theionized front of the UC HIIregion

AY 216 530
Stellar Winds
l If stellar winds are important from the start ofthe compact HII region phase evolution mightproceeds as follows• Interaction of the wind with the ISM produces a
dense shell of circumstellar gas that expands awayfrom the star
+ This shell is exposed to the UV from the new OB star, thusit will be either totally or partially ionized
+ Evolution of the HII region is closely tied to the evolution ofthe circumstellar shell

AY 216 531
Stellar Winds
l When the shell is driven by the pressure of the hotbubble of shocked stellar wind, the expansion law is(Castor et al. 1975 ApJL 200 107)
LW is the wind mechanical luminosity
l The expansion velocity is
†
Rsh ª 0.042 LW
1036 erg s-1
Ê
Ë Á
ˆ
¯ ˜
1/ 5n0
105cm-3
Ê
Ë Á
ˆ
¯ ˜
-1/ 5
t
103yr
Ê
Ë Á
ˆ
¯ ˜
3/5
pc
†
Vsh ª 24.7 LW
1036 erg s-1
Ê
Ë Á
ˆ
¯ ˜
1/ 5n0
105cm-3
Ê
Ë Á
ˆ
¯ ˜
-1/ 5
t
103yr
Ê
Ë Á
ˆ
¯ ˜
-2/5
km/s

AY 216 532
Expansion of UC HII Regionsl Kawamura & Masson (1998 ApJ 509
270) measured the angular expansion ofthe shell-like UC HII region W3(OH)deriving a speed of ~ 35 km/s dynamicalage of ~ 2300 years• Difference map of W3(OH) with a time
baseline of 9.3 yr• The 15 GHz (gray scale)• Difference map (contour)
+ Top: observed difference map+ Bottom: difference map generated from
subtracting the 1986 image from a simulatedself-similar expansion of the 1986 data
l Best fit model is a slowly expandingshell-like H II region• Inconsistent with a freely expanding shell
or a bow shock

AY 216 533
Young Dynamical Ages?l The angular expansion rate of the
shell-like UC HII region G5.89-0.39yields a dynamical age of ~ 600 yr(Acord, Churchwell, & Wood 1998ApJL 495 107)• LW ~ 3 x 1036 erg/s for the O6 star• n0 ~ 107 - 108 cm-3
l The observed shell radius andexpansion velocity can be explainedby the simple stellar wind model if thenebula is very young ~ 500 yr• Consistent with the derived dynamical
age

AY 216 534
Importance of the Wind
l Under what conditions is the wind dynamicallymore important than the classical expansiondue to the difference in pressure between theionized gas and ambient medium?• Shull (1980) shows that the wind is more important
when
• Observational data to test this are not yet availabledue to the difficulty of deriving LW
†
LW
1036 erg s-1
Ê
Ë Á
ˆ
¯ ˜ > 0.33 NU
1049s-1
Ê
Ë Á
ˆ
¯ ˜
2 / 3
n0
105cm-3
Ê
Ë Á
ˆ
¯ ˜
-1/3

AY 216 535
Champagne Flowsl “Champagne flow” or blister models assume that the massive star
is born in a medium with large density gradients
• The star evacuates acavity of ionized gas
• At the boundary of thecloud the ionized cavitybreaks out creating aflow of gas away fromthe cloud due to thepressure gradientbetween respectivelythe cloud and theambient ISM

AY 216 536
Champagne Flowsl Champagne flow gives rise to an HII
region that expands super sonicallyaway from the high density region• Evolution of the HII region has two main
phases+ The ionization front rushes rapidly into the
ambient medium+ If r falls faster than r-3/2 the I-front is not
trapped and the whole zone facing the lowdensity region is ionized
• The pressure gradient left behind by theI-front produces a strong shock whichmoves supersonically into the ionizedlow density medium marking the secondstage of evolution, in which the ionizedgas begins to stream away toward thedirection of decreasing density
Tenorio-T
agle (1979 AA
71 59)

AY 216 537
Champagne Flows(Yorke, Tenorio-Tagle, & Bodenheimer 1984)

AY 216 538
Champagne Flows
l Fluid simulations show that a blister type HII region results, whichis ionization bounded on the high density side and densitybounded on the side of outward champagne flow• The HII is fan shaped
• Numerical calculations of the kinematics show that HII is acceleratedaway from the molecular cloud up to several times cHII (Yorke,Tenorio-Tagle, & Bodenheimer 1984 AA 127 313)
• Velocity increases with increasing distance from the cloud, attaining ~30 km/s
• The average velocity of the HII gas is shifted by a small amount (5km/s) with respect to the molecular cloud.

AY 216 539
G32.9+0.19: A Champagne Flow?
l H 92 a maps show a fan-shaped HII region a velocitygradient running along of thesymmetry axis of cometary-like structures
l Velocity increases smoothlyfrom the head leading edgeto the tail by ~ 10 km/s
l The observed velocity fieldsand morphologies are ingood agreement with thosepredicted by the champagnemodel• Similar velocities of HII and
CO at the head positionsuggests that this is achampagne flow
H 92 aGaray et al. 1994
V sV

AY 216 540
W3 (OH) as a Champagne Flow
l Compact HII region W3(OH)has a• 12 km/s velocity gradient• Weak radio continuum emission
feature aligned with the velocitygradient & extending away fromthe high density gas immediatelyaround the newly formed star
l Suggest that the W3(OH) HIIregion is undergoing asupersonic champagne flow
Top: 18 cm continuumBottom: Intensity weighted average velocityfrom H92 a. Velocity ranges from -44 in the E to-62 km/s in the W. 3 km/s contour interval (Ketoet al. 1995 444 765)

AY 216 541
Bow Shocks
l An alternative hypothesis is that cometary HII regionsstellar wind bow shocks of an ionizing star movingsupersonically through a molecular cloud (Van Burenet al. 1990; MacLow et al. 1991)• Bow shocks explain details of the morphology
+ Limb brightening+ Emission pinches back down to the symmetry axis
u Not easily explained within the champagne models

AY 216 542
Bow Shocks
l The characteristic size of a cometary HIIregion in the bow shock model given by thelocation of the terminal wind shock occurs• This distance is where the momentum flux in the
wind equals the ram pressure of the ambientmedium is
†
lBS = 0.015 M*
•
10-6 Mo yr-1
Ê
Ë
Á Á
ˆ
¯
˜ ˜
1/ 2
vw
103 km s-1
Ê
Ë Á
ˆ
¯ ˜
1/ 2
n0
105 cm-3
Ê
Ë Á
ˆ
¯ ˜
-1/ 2 v*
103 km s-1
Ê
Ë Á
ˆ
¯ ˜
-1
pc
AY 216 543
Bow Shocksl Both the champagne and bow shock models reproduce the
morphology of cometary HII regionsl Differences between the models is the kinematic properties of the
ionized gas and lifetimes• Bow shock model predicts velocity gradient should be steeper in the
head than in the tail• Champagne model predict the largest gradients are expected in the
tail, where the gas is accelerated out the nozzle• Contrary to the champagne flow, the bow shock predicts that the
lines should be broader along the leading edge of the ionization frontthan they are behind
• In the champagne flow the HII at the head of the cometary structureshould be at rest with respect to the molecular gas while the bowshock model predicts it should be moving with the velocity of the star.

AY 216 544
G29.96-0.02
l Left: Observations of G29.96-0.02 (Wood & Churchwell 1991). Right:VanBuren & MacLow's (1992) bow shock model. The PV diagram is for aslit placed along the symmetry axis.

AY 216 545
Bow Shock Models for Cometary HII Regions
l Cometary HII regions for which the observations seemto be best explained by a bow shock model are• G29.96-0.02 and G13.87+0.28 (van Buren & Mac Low 1992
ApJ 394 534; Afflerbach et al. 1994 ApJ 437 697)
l Champagne flows have been proposed to explainG29.96-0.02 (Fey et al. 1995; Lumsden & Hoare 1996)• Contradictory results reflect the difficulty in discriminating
between models!

AY 216 546
Age & Evolutionary Status
l Regions of ionized gas formed in amedium of constant density expand intothe ambient gas at ~ cHII until pressureequilibrium is reached• If HII regions are smaller than Rf their sizes
indicate their ages+ A HII region excited by an O7 star in a medium
with 105 cm-3 expands to Ri = 0.1 pc pc in20,000 years
+ Small sizes of the UC HII regions (0.05 pc)implies that they are young
+ Lifetimes < 5000 years

AY 216 547
Statistics of UCHII Regionsl IRAS point source catalog and a far-IR color criterion selects UC
HII regions• Wood & Churchwell (1989) counted 1650 Galactic UC HII• If these objects have physical parameters similar to a much smaller
number of radio-observed UC HII then+ R ~ 0.05 pc+ NU ~ 4 x 1048 s-1
+ n0 ~ 105 cm-3
• Dynamical ages are typically ~ 5000 yr
l Implied Galactic formation rate of massive stars is ~ 0.3 O starsyr-1
• Considerably larger than that estimated from other means+ Typical estimates give 0.82 M§ yr-1 (10 < M/M§ < 60) (Güsten & Mezger
1983 or Downes 1987)+ An IMF-weighted of <MOB> 23 M§ implies ~ 0.04 O stars yr-1
+ 10 times smaller than that derived from compact HII regions

AY 216 548
Statistics of UCHII Regions
l Why do we see so many UC HII regions?• The IRAS UCHII catalog may be contaminated
• 65% of diffuse HII regions in a large (462) samplehave IRAS colors that satisty the Wood &Churchwell selection criterion (Codella, Felli, &Natale 1994)
+ Source confusion in the IRAS point source catalog

AY 216 549
Ages of UC HII Regions
l Hollenbach et al. (1994 ApJ 428 654) proposed that newly formedOB stars are surrounded by a massive primordial disk• The disk is photoevaporated by the UV photons from the star
• Dense gas ionized close to the star flows away giving rise to theobserved UC HII region
• The reservoir of gas in the disks may last for > 106 yr, depending onthe mass of the disk
l UC HII regions could live much longer than their dynamical agesbecause they are constantly being replenished by a densecircumstellar reservoir

AY 216 550
Photoevaporating Disks
Hollenbach et al. (1994
ApJ 428 654)

AY 216 551
+ A molecular cloud contains a star+diskaccreting material
+ Left: temperature+ Right: density & velocity
+ At t=0 T < 100 K (black) + The O star turns on at t=0, an I-front
enters from the top. At the same time theO star's FUV radiation begins to heat thematerial at the surface of the disk.
The I-front encounters theexpanding disk material and is stoppedhere. It begins to wrap itself around thestar+disk configuration.
+ Zoom into the central portions at t =100 yr and increase the frame rate
+ White contours are steps oftemperature (x10) & density (x100)
Photoevaporating Disks

AY 216 552
Ages of UCHII
l Several authors
have argued that
the dynamical time
scale does not give
the age because the
primordial ambient
medium is clumpy
• Mass loading due to the ablation of clumps could result in longlived UC HII regions
• Mass injection from photoevaporated globules into a stellarwind causes trapping of the ionization front resulting incompact (0.1 pc) long-lived (105 yrs) HII regions

AY 216 553
Photoevaporating Columns in M16

AY 216 554
Lifetime of UC HII Regions
l A simple explanation invokes a denser and warmerambient medium than previously believed• Results in very small equilibrium radii
l Recent observations show temperatures and densitiesof the molecular gas around UC HII regions are ~100K and 107 cm-3
• Under these conditions, the equilibrium radius of a region ofionized gas excited by an O9 star (NU = 1.2 x 1048 s) is ~ 0.02pc and the time to reach pressure equilibrium is ~ 10,000 yr
l UC HII regions could have have already reached theequilibrium radius and are much older than thedynamical age• A large fraction of UC HII regions are excited by stars later
than O9 and therefore should have smaller equilibrium radii

AY 216 555
Natal Material
l UC HII regions are not the earliest stage of massivestar formation• Star formation begins in dense cores of giant molecular clouds
(GMCs)
l Structure of GMCs appear to be self-similar over awide range of sizes & masses• Often described as consisting of clumps and cores
+ Clumps (103-4 M§) are where massive stars & cluster stars formu dN/dM ~ M-1.6 the most massive clumps contain most of the mass
+ These clumps provide the natal material for the formation ofstellar clusters
• Cores are substructure in clumps+ Smaller, denser, and lower mass (~ 102 M§) than clumps+ Sites of star formation within clumps

AY 216 556
Cores
l Hot, dense molecular cores are not isolatedbut compact features within larger, lowerdensity molecular structure• Molecular clouds are inhomogeneous with a
hierarchy of structures with densities spanningseveral orders of magnitude
+ Cores fill only a small fraction of the total GMC projectedarea and concentrated in regions of active star formation(or visa versa)
+ 20% of the total gas in GMCs is in massive cores
• Cores constitute the molecular environment whichsurrounding hot cores and compact HII regions

AY 216 557
Cores & UC HII Regions
l NH3 emission in the (1,1) and (2,2) inversiontransitions is commonly (~ 70%) detected towardscompact HII regions (Churchwell et al. 1990)• Cores associated with regions of recent massive star
formation have+ Sizes of 0.3-1.0 pc+ TK ~ 30-50 K+ nH2 ~ 2 x 10⁴ - 3 x 106 cm-3
+ M ~ 103 - 104 M§+ Line widths are largely turbulent with thermal contributions of only
~ 0.3 km/s
• NH3 (1,1) through (5,5) probe progressively warmer, densergas
+ Massive cores associated with embedded YSOs areindistinguishable from massive starless cores (Caselli & Myers1995 ApJ 446 665)
u Physical conditions are assumed representative of a phase prior tothe formation of an OB cluster

AY 216 558
G34.3+0.15l Massive star-forming
region G34.3+0.15l Top left: NH3(1, 1) at 2.'2
resolution (Heaton et al.1985)
l Top right: HCO+ (1-0) at6'' resolution (Carral &Welch 1992)
l Bottom right: NH3 (3, 3)at 1" resolution (Heatonet al. 1989)• Dashed contour is the
lowest level of the 15GHz continuum fromthe bright cometary H IIregion
NH3 (1,1)
NH3 (3,3)
HCO+ (1,0)
?

AY 216 559
Class 0 Protostars & Prestellar Cores
l Pre-stellar cores (PSCs) are the earliestidentifiable stage of a star in the process offorming• Dense, gravitationally bound, molecular ``cloudlets''
undergoing quasistatic gravitational contraction• PSCs have not yet formed a central protostar and
do not appear in the near-IR• PSCs are only heated by the ambient interstellar
UV radiation field
l T ~ 10-20 K and SED peaking at ~ 200 µmdefine Class 0 protostars

AY 216 560
Class 0 Objects
l SED of the class 0protostar or prestellarcore L1544 (Bacmann etal. 1998)
• The solid line is agreybody T = 13 K
l The study of PSCs is inits infancy
l Rare & difficult to find
l PSCs detected so farare low-mass cloudletsthat will give rise to low-mass stars
l PSCs that producemassive stars have yetto be discovered

AY 216 561
L1689B in mm Continuum
l André et al. (1996 AA314 626) used 1.3mm dust continuumto derive the spatialdistribution of densityfor L1689B
l 1.3 mm map ofL1689B core ~ 0.05 x0.07 pc
l Central column of 1.5x 1022 cm-2
l About ~ 0.6 M§within the FWHM.

AY 216 562
Dust Distributionl Average radial
profile of L1689bderived from mmcontinuumobservations for twodifferentdeprojections• Solid line: assumes
disk-like magneticsupported model
• Dashed line:spheroidalgeometry

AY 216 563
Structure of Protostellar Cores
l The distribution of nH2 (r) with radius is anindicator of the support mechanism(s) of PSCs• Inside-out collapse predicts a power law
distribution, n ~ r -2 consistent with an isothermalsphere for the protostellar precursor cloud

AY 216 564
Hot Molecular Coresl Hot cores are defined obsevationally as
• Compact (d < 0.1 pc), dense ( nH2 > 107 cm-3 ) & warm ( T > 100 K)
l CS (7-6) observations towards a large sample of star formingregions with H2 O masers show a ~60% detection rate (Plume etal. 1992)• nCRIT ~ 2 x 107 cm-3
• Single dish observations of excited NH3 indicates the presence of hotmolecular gas, (Cesaroni, Walmsley, & Churchwell 1992)
l NH3 (4,4) interferometer data (1” beam) shows• Hot (T ~ 50 K) dense ( >105 cm-3 ) molecular gas localized in small (<
0.1 pc) structures with masses 10 - 102 M§ (Cesaroni et al. 1998 AA331 709)

AY 216 565
Association of UCHII & Hot NH3 Cores
l Hot NH3 cores are invariably located nearand in most cases intimately associatedwith UC/C HII regions• NH3 (solid contours)• Radio continuum (gray in the top & middle
panels & dashed contours in the bottom)+ Top: G10.47+0.03 & Middle: G29.96-0.02
(Cesaroni et al. 1998)+ Bottom: G61.48+0.09 (Gómez et al 1995)
• Not all compact HII regions are associatedwith hot, dense NH3 clumps
+ NH3 gas may have been disrupted by theexpansion of the HII region and/or outflows

AY 216 566
PUCHs & Agglomerationl The observational definition of a hot core applies to any luminous
enshrouded object including regions heated by:• Adjacent ultracompact HII regions• Evolved hot stars that have moved into a dense molecular cloud• Massive protostars still undergoing rapid accretion.
l Churchwell (2002 AARA 40 27) defines a class of hot corescontaining rapidly accreting, massive protostars• These are the pre-cursors of ultracompact HII regions or PUCHs• PUCHs are internally heated by a protostar(s)• Likely to be surrounded by an accretion disk and a massive bipolar
outflow
l Because of rapid accretion no detectable HII region, even thoughit has a large UV photon flux

AY 216 567
Accretion vs. Agglomeration
l This distinction is useful only if massive stars areformed via accretion through an equatorial disk• Massive stars (> 10 M§) may form via coalescence of
intermediate mass protostars (Bonnell et al. 1998; Stahler etal. 2000)
• This idea is supported by the central location of the mostmassive stars in young open clusters and the high stellardensity of many open clusters
l How can collapse can form massive stars in the centerof dense clusters such at the Orion Trapezium, wherethe Jeans mass is estimated to be 0.3 M§ for an initial~ 20 K?• To form q1 C (50 M§ ) would require T ~ 600 K (Bonnell et al.
1998)

AY 216 568
Outflows and Accretion Disks
l If massive stars form by accretion then PUCHsmust exhibit a period of rapid accretionaccompanied by an equatorial accretion diskand a massive bipolar outflow• Accretion disks in massive star formation regions
are difficult to detect because of+ Large distances
+ Brightness of the central protostar
+ Difficulty of distinguishing a disk from the natal hot core,which is bright and may have large non-Keplerian velocitygradients

AY 216 569
Molecular Outflows
l Molecular outflows have been observedtoward numerous massive star formationregions• The molecular outflows from massive protostars
have very large+ Masses+ Mass fluxes+ Momenta
• Mechanical luminosities• There is a correlation between the outflow mass flux
and bolometric luminosity of protostars that holdsover at least six orders of magnitude in luminosity

AY 216 570
Molecular Outflows
l Mass outflow rate of bipolar molecular outflows driven byprotostars of bolometric luminosity. From Cabrit & Bertout (1992),Shepherd & Churchwell (1996), Henning et al. (2000), Cesaroni etal. (1997), Shepherd & Kurtz (1999)

AY 216 571
Molecular Outflowsl Continuity of the L-dM/dt relation may indicate that the formation
of massive stars is simply an extension of the process of low-mass star formation to more massive stars• Seems unlikely for several reasons
+ Luminosity reflects the mass of the protostar+ Mass determines the gravitational potential+ Mass governs the rate of accretion
• It is not surprising that a continuous L-dM/dt relationship holds for alarge range of luminosities!
l The correlation may have nothing to do with the process of starformation but may simply reflect the central role of gravity

AY 216 572
Molecular Outflowsl Molecular outflows from
massive protostars althoughsimilar to those from lowmass stars are not as wellcollimated• There is no general theory
for how 10-100 M§ of coldmolecular gas can beaccelerated and collimatedon short timescales whilematter is simultaneouslyrapidly accreted
+ X-winds invokes magneticfields to redirect andcollimate outflows
+ Developed for low-massprotostars that involve smallmasses
+ Probably is not applicable tomassive outflows
H2 1-0S(1)
AY 216 573
Disks?
l Evidence for accretion disks around massiveprotostars exists for only a very few objects• Protostars with detected accretion disks have
masses ranging from 10-370 M§ & radii from 500-10,000 AU
• All have observed outflows
• High resolution observations of CH3OH masershave been interpreted as originating in accretiondisks
• Controversial

AY 216 574
Outflows in G192.16-3.82
a): 12-m CO(1-0) molecularclump emission ± 1.3 km/s ofvLSR. A dot marks the 3 mmcontinuum source
b): 12-m map of the red (thicklines) and blueshifted (thinlines) emission from 10.9 to7.0 km/s and 4.4 to 0.5 km/s,respectively
c): OVRO image showsredshifted (thick lines) andblueshifted (thin lines) COemission

AY 216 575
Disk in G192.16-3.82
l Left: 7 mm continuum emission with data from the VLAl Right: 7 mm VLA A array + VLBA's Pie Town antenna
• Evidence for a solar-system sized disk around a 8-10 M§ massiveprotostar

AY 216 576
Young Massive Objects with Disks & Outflows
(1) Wilner et al. 1995; (2) Reid et al. 1995; (3) Nakamura et al. 1991; (4) Snell et al. 1984; (5) Chini, Henning, & Pfau 1991; (6) Hunter et al. 1999;(7) Shepherd & Kurtz 1999; (8) Shepherd et al. 1998; (9) Yamashita et al. 1991; (10) Yamashita et al. 1989; (11) Martí, J., Rodríguez, L.F., &Reipurth, B. 1993; (12) Cesaroni et al. 1997; (13) Hofner et al. 1999; (14) Zhang et al. 1998b; (15) Gómez et al. 1999; (16) Torrelles et al. 1996;(17) Molinari et al. 1998. (18) Shepherd et al. 2001
18yy1308-103000G192.16-3.82
17ny10,00037016,000IRAS23385+6053
15,16yy75020010,000Cep A HW2
12,13,14yy8501013,000IRAS20126+4104
9,10,11yy<40003017,000HH 80-81
7,8yy1000153000G192.16-3.82
6ny60001504000AFGL 5142
3,4,5ny8500102000GL 490
1,2yy< 50010-20~10,000W3(H2 O)
(R§ )(M§ )(L§ )
RefJetMolecularOutflow
RdiskMdiskLSource