Formation and growth rates of ultrafine atmospheric ...
32
Formation and growth rates of ultrafine atmospheric particles: A review of observations M. Kulmala 1 , H. Vehkamäki 1 , T. Petäjä 1 , M. Dal Maso 1 , A. Lauri 1 , V.-M. Kerminen 2 , W. Birmili 3 , P.H. McMurry 4 1 Department of Physical Sciences, Division of Atmospheric Sciences P.O. Box 64, FIN-00014 University of Helsinki, Finland 2 Finnish Meteorological Institute, Air Quality Research Sahaajankatu 20E, FIN-00880 Helsinki, Finland 3 Division of Environmental Health and Risk Management, University of Birmingham, Edgbaston, B15 2TT, United Kingdom 4 Department of Mechanical Engineering, 111 Church Street SE, Minneapolis MN 35455 USA. Accepted for Publication in Journal of Aerosol Science (2003) Abstract Over the past decade, the formation and growth of nanometer-size atmospheric aerosol particles have been observed at a number of sites around the world. Measurements of particle formation have been performed on different platforms (ground, ships, aircraft) and over different time periods (campaign or continuous-type measurements). The development during the 1990’s of new instruments to measure nanoparticle size distributions and several gases that participate in nucleation have enabled these new discoveries. Measurements during nucleation episodes of evolving size distributions down to 3 nm can be used to calculate the apparent source rate of 3-nm particles and the particle growth rate. We have collected existing data from the literature and data banks (campaigns and continuous measurements), representing more than 100 individual investigations. We conclude that the formation rate of 3-nm particles is often in the range 0.01-10 cm -3 s -1 in the boundary layer. However, in urban areas formation rates are often higher than this (up to 100 cm -3 s -1 ), and rates as high as 10 4 -10 5 cm -3 s -1 have been observed in coastal areas and industrial plumes. Typical particle growth rates are in the range 1-20 nm hour -1 in mid latitudes depending on the temperature and the availability of condensable vapors. Over polar areas the growth rate can be as low as 0.1 nm hour -1 . Because nucleation can lead to a significant increase in the number concentration of cloud condensation nuclei, global climate models will require reliable models for nucleation. 1. Introduction Aerosol particles are ubiquitous in the Earth’s atmosphere and influence our quality of life in many different ways. In urban environments, aerosol particles can affect human health through their inhalation (Wichmann and Peters, 2000; Stieb et al., 2002). In a global troposphere, and particularly downwind from major pollution sources, aerosol particles are thought to contribute to climate change patterns (Stott et al., 2000; Ramanathan et al., 2001; Yu et al., 2001; Menon et al., 2002). Understanding these effects requires detailed information on how aerosol particles enter the atmosphere and how they are transformed there before being removed by dry or wet deposition. Key processes in this respect are the formation of new atmospheric particles and their subsequent growth to larger sizes.
Transcript of Formation and growth rates of ultrafine atmospheric ...

Formation and growth rates of ultrafine atmospheric particles: A review of observations M. Kulmala1, H. Vehkamäki1, T. Petäjä1, M. Dal Maso1, A. Lauri1, V.-M. Kerminen2, W. Birmili3, P.H. McMurry4 1Department of Physical Sciences, Division of Atmospheric Sciences P.O. Box 64, FIN-00014 University of Helsinki, Finland 2 Finnish Meteorological Institute, Air Quality Research Sahaajankatu 20E, FIN-00880 Helsinki, Finland 3 Division of Environmental Health and Risk Management, University of Birmingham, Edgbaston, B15 2TT, United Kingdom
4 Department of Mechanical Engineering, 111 Church Street SE, Minneapolis MN 35455 USA. Accepted for Publication in Journal of Aerosol Science (2003) Abstract Over the past decade, the formation and growth of nanometer-size atmospheric aerosol particles have been observed at a number of sites around the world. Measurements of particle formation have been performed on different platforms (ground, ships, aircraft) and over different time periods (campaign or continuous-type measurements). The development during the 1990’s of new instruments to measure nanoparticle size distributions and several gases that participate in nucleation have enabled these new discoveries. Measurements during nucleation episodes of evolving size distributions down to 3 nm can be used to calculate the apparent source rate of 3-nm particles and the particle growth rate. We have collected existing data from the literature and data banks (campaigns and continuous measurements), representing more than 100 individual investigations. We conclude that the formation rate of 3-nm particles is often in the range 0.01-10 cm-3 s-1 in the boundary layer. However, in urban areas formation rates are often higher than this (up to 100 cm-3 s-1), and rates as high as 104-105 cm-3 s-1 have been observed in coastal areas and industrial plumes. Typical particle growth rates are in the range 1-20 nm hour-1 in mid latitudes depending on the temperature and the availability of condensable vapors. Over polar areas the growth rate can be as low as 0.1 nm hour-1. Because nucleation can lead to a significant increase in the number concentration of cloud condensation nuclei, global climate models will require reliable models for nucleation.
1. Introduction Aerosol particles are ubiquitous in the Earth’s atmosphere and influence our quality of life in many different ways. In urban environments, aerosol particles can affect human health through their inhalation (Wichmann and Peters, 2000; Stieb et al., 2002). In a global troposphere, and particularly downwind from major pollution sources, aerosol particles are thought to contribute to climate change patterns (Stott et al., 2000; Ramanathan et al., 2001; Yu et al., 2001; Menon et al., 2002). Understanding these effects requires detailed information on how aerosol particles enter the atmosphere and how they are transformed there before being removed by dry or wet deposition. Key processes in this respect are the formation of new atmospheric particles and their subsequent growth to larger sizes.

Aitken, (1897) was the first to report evidence for new particle formation in the atmosphere. However, quantitative measurements of aerosol formation and growth rates have required the recent developments in instrumentation for measuring size distributions down to sizes as small as 3 nm in diameter (McMurry, 2000a). We refer to the 3-20 nm particles as the “nucleation mode” (called sometimes also the ultrafine mode), since nucleation and growth from gaseous precursors leads to the formation of such very small particles. Other particle modes that have been previously documented are the Aitken nuclei (20-90 nm), accumulation (90-1000 nm) and coarse (particles >1000 nm in diameter) modes. Many studies conducted in the free troposphere, and especially near clouds and close to the tropopause, have detected large numbers of very small, 3-15 nm diameter aerosol particles (e.g. Hoffmann, 1993; Perry and Hobbs, 1994; Hoppel et al., 1994; Clarke et al., 1998b, 1999a, 1999b; Nyeki et al., 1999; Keil and Wendisch, 2001; Weber et al., 2001b; Twohy et al. 2002). In the continental boundary layer, there are frequent observations of recent nucleation events, i.e. the formation of ultrafine particles detected at a few nm, accompanied by the subsequent growth of these particles to ~100 nm within the next 1-2 days. Such observations span from the northernmost sub-arctic Lapland to the remote boreal forest (Kulmala et al., 1998; Mäkelä et al., 1997) to suburban Helsinki (Väkevä et al., 2000), to urban Atlanta, Pittsburgh and St. Louis (Woo et al., 2001; Stanier and Pandis, 2002; Shi, 2003), to industrialised agricultural regions in Germany (Birmili and Wiedensohler, 2000a; Birmili et al., 2003) and also to coastal environments around Europe (O'Dowd et al., 1999). Nucleation has been observed with monitors on mountains (Weber et al., 1995, 1996, 1997), and evidence for the role of biogenic emissions in aerosol formation has also been reported (Kavouras et al. 1998; Weber et al., 1998). A limitation of most observations is that measurements were either made at a fixed point (ground), or on platforms not necessarily moving along with the same air parcel. Observations of new particle formation may therefore be biased by spatial variations of constituents in different air parcels. A variety of different nucleation mechanisms have been proposed for the atmosphere. The most widely studied ones are the binary water-sulphuric acid nucleation (e.g. Kulmala and Laaksonen, 1990), ternary water-sulphuric acid-ammonia nucleation (Kulmala et al., 2000c) and ion-induced nucleation (Yu and Turco, 2000). A technique is available for measuring sulfuric acid vapor, and such measurements have been reported for a few nucleation studies. Techniques for measuring ammonia with high time resolution at ppt levels are now becoming available, but measurements of ammonia during nucleation events are rare (e.g. Berresheim et al., 2002). Organic vapours could, in principle, participate in nucleation, but nucleation mechanisms that involve organics have not yet been identified. It appears very likely, however, that organics contribute to growth of nucleated particles (O'Dowd et al., 2002b). In practise it is very important to investigate nucleation and growth processes separately, since different species can participate in these processes. In this review we summarize recent observations of particle formation and growth. Altogether these measurements span a broad range of both geographical locations and ambient conditions. Where possible, we report the formation rate of 3 nm particles, because 3 nm is the current minimum detectable size. Some studies involved the use of instruments with a minimum detectable size that is larger than 3 nm. In such cases we estimated particle formation rates at the minimum detectable size. Growth rates can also be determined from measured nucleation mode size distributions. There are several studies in which there is clear evidence on aerosol formation but no quantitative estimation of particle production rates is possible (e.g. Aitken, 1897). An ideal situation in this regard is when continuous size distribution measurements of particles >3 nm are available. This is the case at the SMEAR II station in Finland (Kulmala et al., 2001) and at several U.S.E.P.A supersites, including those in Atlanta (Woo et al, 2001), Pittsburgh

(Stanier and Pandis, 2002) and St. Louis (Shi, 2003). Such data enable the determination of both particle formation and growth rates. 2. On Observations In this study we review more than 100 publications that report observations of ultrafine particles in the atmosphere. The studies included are presented in Table 1, from which one can see the number of each paper (to be used later), the authors, and the location (latitude, longitude, name of the place) and the measurement time period. A global map showing the measurement locations is presented in Figure 1. As can be seen, measurements have been performed all over the world, even though Europe and North America are much better represented than other regions of the world. The investigations are based on either long-term monitoring or intensive short-term measurements. Only a few continuous long-term studies have been carried out. Given the benefits of data analysis on a climatological basis, more measurements of this type are clearly desirable. The measurement platforms can be divided into three different types: ground-based, ship-based and airborne. In airborne measurements often only particle number concentrations have been measured, with no information on particle formation and growth rates. In some cases this kind of information is available, as was the case for aircraft measurements conducted in the plume from a penguin colony over the Macquarie Island (Weber et al., 1998) or for more recent measurements in the polluted continental boundary layer by Brock et al. (2002, 2003). Observations can also be categorized by altitude, latitude, degree of pollution influence, etc. In this respect, a distinction can made between different altitudes (the boundary layer and the lower, middle and upper free troposphere), latitudes (tropics, mid latitudes, high latitudes, polar regions) and the overall degree of pollution (remote marine, polluted marine, remote continental, rural, urban). Table 1 summarises also the different measurement platforms used, along with the air mass type. 3. Instrumentation Studies of atmospheric particle formation and growth require measurements of nucleation mode particles (<20 nm). Simultaneous measurements of nucleating gases can provide further insights into mechanisms. Here, we give a brief summary of the relevant methods, their characteristics, and limitations. For more detailed and historical aspects of aerosol measurement technology, the reader is referred to the rich body of literature on the subject (e.g. McMurry, 2000a, b; Flagan, 1998). Particle formation and growth rates can be inferred from measurements of nanoparticle size distributions. The following should be considered when selecting measurement strategies: • detection of small particles (current limit is ca. 3 nm, but smaller would be better) • time resolution ~10 min for ground-based or ship measurements, or between about a
second and minute for aircraft measurements • size resolution involving multiple channels in the 3-20 nm range in order to detect a
possible growth of particles after nucleation • the ability to measure low nucleation mode concentrations (< 500 cm-3), such as are
found in clean and remote atmospheres • the ability to measure high nucleation mode concentrations (> 105 cm-3), such as are
found during intense nucleation bursts occurring in coastal and continental environments Measurements that provide information on the concentrations of the nucleating gases (or their precursors) and the composition of freshly nucleated particles provide further insights.

A technique for the measurement of gas phase sulfuric acid at concentrations down to about 104 cm-3 is available (Eisele and Tanner, 1993), and techniques for measuring ammonia in the ppt range with high time resolution have recently been deployed. The hygroscopicity and volatility of freshly nucleated particles can be measured with the nano-TDMA (Hämeri et al., 2001); such measurements provide constraints on the composition of growing particles. Also, progress on measurements of the composition of sub-10 nm particles has recently been reported (Voisin et al., 2003). Information on the charging state of nucleated particles can help to differentiate ion-induced from other nucleation mechanisms. 3.1. Condensation Nucleus Counter (CNC) The laminar flow CNC is the instrument most widely used to measure atmospheric particle number concentrations. Its basic working principle is that the sampled aerosol flows over a warm reservoir of a working fluid where it becomes saturated with a condensable vapor (Agarwal and Sem, 1980). During subsequent cooling in a condensor the vapor becomes supersaturated, causing particles to grow into large liquid droplets of ca. 10 µm in size, which are individually detected by light scattering. CNCs detect the particles larger than a particular cut-off size, which is a function of the supersaturation achieved in the condensor section of the CNC. A particular improvement regarding the lowest detectable size was made by wrapping the particle sample flow in a saturated sheath flow, thus activating 50 % of all 3 nm particles (UCPC Model 3025, TSI Inc., St Paul, Minnesota; Stolzenburg and McMurry, 1991). The size dependent collection efficiencies of various commercial types of CNCs have been compared, e.g., in Wiedensohler et al. (1997). As a CNC detects single particles it is able to detect low particle concentrations. Operating two CNCs in parallel, each having different lower cut-off diameters, enables the measurement of nucleation mode number concentrations in a specified size range (e.g., 3-10 nm) by subtracting their readings. The high time resolution that can be achieved with this method (1 s) makes it a preferred choice for deployment on mobile platforms, such as an aircraft. CNCs have been used in almost all studies presented in this overview. 3.2. Pulse height analysis (PHA) Measurements have shown that within laminar flow CNCs, the final droplet size after condensation decreases with decreasing size for particles smaller than 10 nm (Saros et al., 1996). This size-dependent growth can be used to infer size distributions of sub-10 nm particles. Such measurements are carried out by measuring the “pulse height” produced by the optical detector in the CNC. Pulse heights decrease with decreasing size; size distributions are obtained by mathematically “inverting” measured pulse height distributions (Weber et al., 1998). Measurements have shown that particles larger than 10 nm all grow to the same final size, so the PHA technique can only provide information on size distributions of sub-10 nm particles. The drawback of the PHA is that the resolution of particle size distribution is not as good as obtained with SMPS or DMPS systems (Wiedensohler et al., 1994). A recent methodological development involved a laboratory calibration of the PHA system with nanoparticles of various compositions, including pure ionic and organic compounds. It was found that the final droplet size of pure organic nanoparticles of a given size was larger than the final droplet size of ionic particles of the same initial size. This observation was used to conclude that newly formed particles in Hyytiälä behave more like pure organic particles than like ionic particles (O'Dowd et al., 2002). 3.3. Electromobility classification Operating an electrical classifier upstream of a CNC enables the measurement of particle size distributions. Differential mobility analysers (DMA) segregate particles in an electrical field, and yield particles of a narrow monodisperse electrical mobility (Knutson and Whitby,

1975). A particle’s electrical mobility varies in proportion to its electrical charge and inversely with its Stokes’ diameter. Mobility distributions are obtained by using a CNC to measure the concentration downstream of a DMA for a range of classifying voltages. Particle size distributions are obtained from such measurements by carrying out a mathematical inversion that takes account of the size-dependent distribution of charges on particles (e.g., Alofs and Balkumar, 1982). DMAs are available in various designs, with recent developments focussing on a more efficient transmission of the smallest sizes <10 nm (Winklmayr et al., 1991; Chen et al., 1998). A frequently used instrumental set-up of a Differential Mobility Particle Sizer (DMPS) in ground-based or ship-based experiments involves two DMAs covering a wide size range, such as 3 to 700 nm, and two separate CNCs to count particles (e.g., Birmili et al., 1999a; Aalto et al., 2001). The time required to measure an atmospheric aerosol size distribution depends primarily on the time required to obtain a statistically significant number of CNC counts at each classifying voltage. A measurement period of often 10 minutes provides a viable compromise between size resolution, time resolution, and particle counting statistics for most atmospheric applications. DMA-CNC systems may also be operated as Scanning Mobility Particle Sizers (SMPS; Wang and Flagan, 1990), whereby particle concentrations are measured as the classifying voltage is increased at a continuous rate. SMPS scan times as short as 2 minutes are possible, albeit in a trade-off against sizing accuracy and particle counting statistics. An alternative class of instruments based on electric mobility analysis are air ion mobility spectrometers (e.g., Misaki, 1961; Horrak, 1998, and references therein). Ion mobilities are segregated very similarly as in a DMPS, but an array of electrometers is typically used to simultaneously measure the various mobility fractions. Unlike DMPS and SMPS systems, which utilize bipolar chargers to bring the aerosol to Boltzmann equilibrium before they are classified by the DMA, ion mobility spectrometers measure naturally occurring mobility distributions. Ion mobility spectrometers can detect charged particles of any size, extending down to the range of molecular ions (ca. 0.4 nm). A limitation is that the sensitivity of electrometers limits the lowest detectable particle concentration to ~ 50 cm-3. 3.4 Future needs The body of available experimental studies suggests that a full understanding of atmospheric new particle formation processes depends on further instrumental improvements. It would clearly be an advantage to be able to count neutral particles smaller than 3 nm. Further needs address the determination of physico-chemical properties (e.g., solubility in different solvents), and the chemical composition of nucleation mode particles. Measurements of gas phase species that participate in nucleation and growth are also essential. 4. Formation and growth rates of atmospheric aerosol particles 4.1. Estimation of the particle formation and growth rates Critical clusters formed by atmospheric nucleation events cannot yet be measured quantitatively due to instrumental limitations. Only one measurement of clusters during nucleation events has been reported, and it showed that clusters were present when 2.7-4 nm particles were detected (Weber et al., 1995). More work on the distribution and composition of such clusters is needed to refine our understanding of atmospheric nucleation. Because critical clusters cannot yet be measured, we are unable to measure the true atmospheric nucleation rate but rather the formation rate of particles of some larger diameter D. The diameter D corresponds typically to the CNC detection limit, which is presently 3 nm or greater.

Mathematically, the particle formation rate, JD, is equal to the flux of particles past the size D because of their growth:
D
p
Dp
pD dt
dDdD
tDdntJ ×=
),()( . (1)
Here t is the time and n(Dp, t) is the particle number size distribution. In order to apply equation (1), both the particle number size distribution function and particle growth rate at the size D must be known. This kind of information is rarely available. Rather than estimating an instantaneous particle formation rate JD(t), one usually averages JD over some time interval ∆t. The most frequently used selection for ∆t is the duration of the particle formation event, although shorter time intervals are also sometimes used. After time averaging, we obtain
transport
DD
scavcoag
DD
coagself
DDD
observed
DD
tN
tN
tN
Jt
N∆
∆−
∆
∆−
∆
∆−=
∆
∆
−−
maxmaxmaxmax ,,,, , (2)
where ND,Dmax is the total particle number concentration in the size range [D, Dmax] and Dmax is the maximum size the critical clusters can reach because of their growth during ∆t. The first term in equation (2) is the observed change in ND,Dmax during ∆t and can be obtained from particle size distribution or number concentration measurements. The second and third terms in the right hand side represent the loss of particles in the size range [D, Dmax] by self-coagulation and coagulational scavenging to larger pre-existing particles (particles with sizes Dp>Dmax), respectively. The last term in equation (2) represents the influence of air mass transport to ND,Dmax. This term may become important in fixed-site measurements exposed to inhomogeneous air masses, or in systems subject to strong dilution. When the effects of both coagulation and transport are small compared with particle production, equation (2) reduces to
observed
DDD t
NJ
∆
∆≈ max, . (3)
This is perhaps the most common formula used to estimate an atmospheric particle formation rate. Equation (3) is often an excellent approximation to (2) in relatively clean, homogenous air masses. However, it may significantly underestimate the true particle production rate when the nuclei particle number concentration is very high (>105 cm-3). Also if the pre-existing particle concentration is very high JD values are underestimated. Estimating the particle growth rate, GR, requires information on the time evolution of the mean diameter of the new particle (nucleation) mode, Dm. With this information, GR can be calculated from the formula
tD
GR m
∆∆
= , (4)
where Dm belongs to the size range [D, Dmax]. Equation (4) fails in the case of high continuous nucleation producing new particles during the particle growth (see e.g. Clement et al., 2002; O’Dowd et al., 1999). Frequently, suitable data on particle number size distributions to calculate GR are not available. In this case GR can be estimated if one has

information on the time evolution of nucleating precursors and the total nuclei number concentration:
nucprod
crit
ttDDGR−
−= . (5)
Here Dcrit is the critical size of nucleated particles tprod is the time at which particle formation is observed to begin, and tnuc is the time nucleation is assumed to have begun. The quantity Dcrit is obtained from a nucleation theory, while tnuc is typically set equal to the time at which the concentration of the assumed nucleating precursors such as sulfuric acid is observed to increase. Equation (5) can be applied to systems having a regular diurnal cycle for both nanoparticles and nucleating precursors. Due to the many necessary assumptions, however, growth rates determined using equation (5) are subject to significant uncertainties. 4.2. Observations Due to instrumental limitations we cannot observe the very smallest ultrafine particles (less than 3 nm in diameter) during nucleation bursts. Therefore, we assume that we are not discussing nucleation directly. Usually particles start to be observed at an instrumental detection limit of round 3-5 nm, which means that they have already grown for some time starting from the size of a nucleated cluster that is around one nanometer. In the case of J10 and J15 the needed growth time is much longer. Ion mobility spectrometer data can be used to infer formation rates of charged particles smaller than 3 nm (e.g. Horrak et al., 1998) when ion-induced nucleation is occurring or to detect charged fraction of growing stable neutral clusters. It is also worth noting that the evolution towards larger particle sizes seen in the particle size spectra during the particle formation process is always interpreted as a particle growth process. Since most measurement spots are actually fixed, they record the data in an “Eulerian system”. This interpretation of growth already includes the assumption that the aerosol must be quite homogeneous in a larger-scale air mass. An example of a typical particle formation event measured by a DMPS is shown in Figure 2 as a contour plot (Mäkelä et al., 1997; Mäkelä et al., 2000). The ordinate of Figure 2 is particle diameter and the abscissa is time of day. The grey-scale shading indicates the value of the particle size distribution. Before midday newly formed particles with diameters between about 4 and 10 nm enter the detectable size range, after which they grow at a rate of a few nm hour-1, reaching sizes between about 20 and 50 nm by the evening. From the data sets similar to Figure 2 it is possible to estimate the quantities ∆t, ∆ND,Dmax and ∆Dm, after which both JD and GR can obtained using equations (3) and (4), respectively. The main problem in this approach is to distinguish between new and pre-existing particles. If there are plenty of background particles, or if the size distribution fluctuates much, it is rather difficult to pinpoint which size classes belong to the event mode and one has to make an educated guess. Also the start and the end of an event are often difficult to determine because of fluctuations in the number concentrations in the smallest DMPS-channels. These uncertainties could result in rather large errors in the calculated values. Figure 3 shows an example of mean size of nucleated particles versus time of day. The diameter growth rate is the slope of this line. The data in Figure 3 show that particle growth rates are remarkably constant during daylight hours. Such constant growth rates appear to be typical during regional nucleation events.

Table 2 summarises observed particle formation and growth rates. Most of the data are from literature, in addition to which our own unpublished data have been used. The particle formation rates have been divided into three subgroups: J3, J10 and J15, which correspond to the formation rates of 3, 10 and 15 nm particles, respectively. The number of observed particle formation events is also included. This number gives information on the data reliability: the higher the number the more reliable the data can be considered. In practise we have more than 60 studies from which the formation rate can be estimated, and correspondingly more than 50 studies for the growth rate. From all other studies we can conclude that aerosol formation has been observed. However, no quantitative numbers for formation or growth rates can be estimated. It appears that several types of atmospheric processes lead to particle formation. Figure 2 shows an example of a “regional nucleation event.” During such events the growth of nucleated particles continues throughout the day, regardless of the wind direction. Several studies using multiple measurement stations (Kulmala et al., 2001; Stanier and Pandis, 2002) have shown that such events can occur more or less uniformly in air masses that extend over distances of hundreds of kilometers. Nucleation in the outflows of convective clouds are likely to be of global significance due to the large volumes of air near the inter-tropical convergence zone where such nucleation events are routinely observed (Clarke, 1993; Clarke et al., 1996, 1998a, 1999b). Similar phenomena have also been observed in outflows of mid-latitude convective storms (Twohy et al., 2002). Intense nucleation bursts have also been observed over the exposed surface zone at Mace Head (O’Dowd 2001; 2002a) and in industrial plumes that contain SO2 (Woo, 2001; Brock et al., 2002, 2003). During most observed nucleation bursts, the maximum in the particle size distribution occurred at sizes below 15 nm, thus indicating their recent formation. Observations from the ground of the Amazon rain forest (Zhou et al., 2002) report the regular occurrence of newly formed particles at relatively large diameters (about 30 nm), which could be indicative of an abundant vapour reservoir in that region, being responsible for the rapid particle growth prior to observation. With only one exception (Wiedensohler et al., 1997a), observed nucleation events always occur during daytime, suggesting that photochemistry plays a central role in this process. Typical observed formation rates of 3-nm particles, J3, in boundary layer regional nucleation events are in the range 0.01-10 cm-3 s-1. Rates higher than this (up to 100 cm-3 s-1) are often observed in urban areas. Very high values of J3 are observed over coastal zones (104-105 cm-
3 s-1) and in SO2-laden industrial plumes. Typical particle growth rates are between 1 and 20 nm hour-1, although exceptions can be found. Some estimates in coastal areas give growth rates as high as 200 nm hour-1. The smallest reported growth rates are around 0.1 nm hour-1 and have been observed in clean polar areas. 5. Discussion The annual variations in growth rates during regional nucleation events in the Hyytiälä forest (Mäkelä et al., 2000), rural Hohenpeissenberg (Birmili et al., 2003), and urban St. Louis (Shi, 2003) are shown in Figure 4. Note that in all locations the growth rates during the summer range from 4 to 10 nm hour-1. The growth rates during the winter are considerably lower (0.5-2.5 nm hour-1). The GR data in Table 2 show qualitatively that the rates are significantly lower at the poles than at mid-latitudes. When growth rates and gaseous H2SO4 concentrations were both measured during nucleation events, calculations show that H2SO4 condensation typically accounts for only 10 to 30% of the observed growth (Weber et al., 1997; Weber et al., 1998; Birmili et al., 2003).
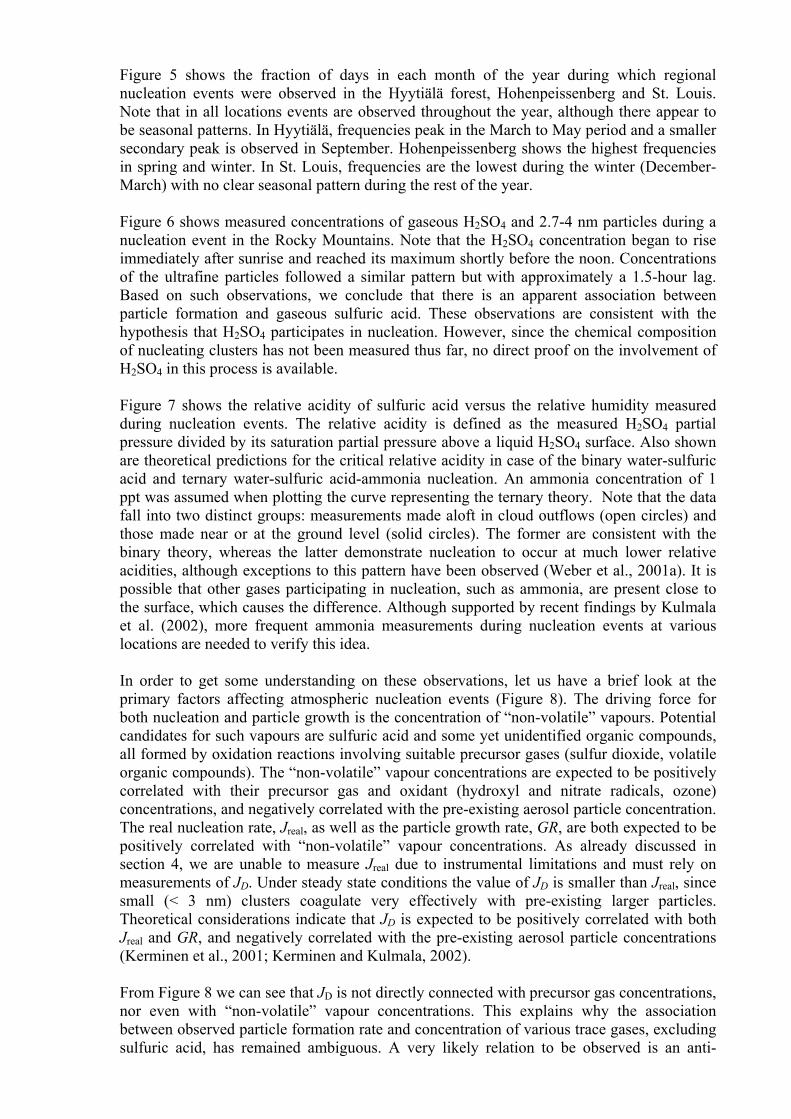
Figure 5 shows the fraction of days in each month of the year during which regional nucleation events were observed in the Hyytiälä forest, Hohenpeissenberg and St. Louis. Note that in all locations events are observed throughout the year, although there appear to be seasonal patterns. In Hyytiälä, frequencies peak in the March to May period and a smaller secondary peak is observed in September. Hohenpeissenberg shows the highest frequencies in spring and winter. In St. Louis, frequencies are the lowest during the winter (December-March) with no clear seasonal pattern during the rest of the year. Figure 6 shows measured concentrations of gaseous H2SO4 and 2.7-4 nm particles during a nucleation event in the Rocky Mountains. Note that the H2SO4 concentration began to rise immediately after sunrise and reached its maximum shortly before the noon. Concentrations of the ultrafine particles followed a similar pattern but with approximately a 1.5-hour lag. Based on such observations, we conclude that there is an apparent association between particle formation and gaseous sulfuric acid. These observations are consistent with the hypothesis that H2SO4 participates in nucleation. However, since the chemical composition of nucleating clusters has not been measured thus far, no direct proof on the involvement of H2SO4 in this process is available. Figure 7 shows the relative acidity of sulfuric acid versus the relative humidity measured during nucleation events. The relative acidity is defined as the measured H2SO4 partial pressure divided by its saturation partial pressure above a liquid H2SO4 surface. Also shown are theoretical predictions for the critical relative acidity in case of the binary water-sulfuric acid and ternary water-sulfuric acid-ammonia nucleation. An ammonia concentration of 1 ppt was assumed when plotting the curve representing the ternary theory. Note that the data fall into two distinct groups: measurements made aloft in cloud outflows (open circles) and those made near or at the ground level (solid circles). The former are consistent with the binary theory, whereas the latter demonstrate nucleation to occur at much lower relative acidities, although exceptions to this pattern have been observed (Weber et al., 2001a). It is possible that other gases participating in nucleation, such as ammonia, are present close to the surface, which causes the difference. Although supported by recent findings by Kulmala et al. (2002), more frequent ammonia measurements during nucleation events at various locations are needed to verify this idea. In order to get some understanding on these observations, let us have a brief look at the primary factors affecting atmospheric nucleation events (Figure 8). The driving force for both nucleation and particle growth is the concentration of “non-volatile” vapours. Potential candidates for such vapours are sulfuric acid and some yet unidentified organic compounds, all formed by oxidation reactions involving suitable precursor gases (sulfur dioxide, volatile organic compounds). The “non-volatile” vapour concentrations are expected to be positively correlated with their precursor gas and oxidant (hydroxyl and nitrate radicals, ozone) concentrations, and negatively correlated with the pre-existing aerosol particle concentration. The real nucleation rate, Jreal, as well as the particle growth rate, GR, are both expected to be positively correlated with “non-volatile” vapour concentrations. As already discussed in section 4, we are unable to measure Jreal due to instrumental limitations and must rely on measurements of JD. Under steady state conditions the value of JD is smaller than Jreal, since small (< 3 nm) clusters coagulate very effectively with pre-existing larger particles. Theoretical considerations indicate that JD is expected to be positively correlated with both Jreal and GR, and negatively correlated with the pre-existing aerosol particle concentrations (Kerminen et al., 2001; Kerminen and Kulmala, 2002). From Figure 8 we can see that JD is not directly connected with precursor gas concentrations, nor even with “non-volatile” vapour concentrations. This explains why the association between observed particle formation rate and concentration of various trace gases, excluding sulfuric acid, has remained ambiguous. A very likely relation to be observed is an anti-

correlation between JD and the concentration of pre-existing aerosol particles. This is because larger pre-existing particle concentrations decrease JD by accelerating the coagulational scavenging of small nuclei and by decreasing “non-volatile” vapour concentrations (which reduces both Jreal and GR). However, if pre-existing particle and precursor gas concentrations are strongly correlated to each other, as might be the case in plumes, also a positive correlation between the particle formation rate and the concentration of pre-existing aerosol particles can be observed. Since concentrations of “non-volatile” vapours are proportional to the concentration ratio between their precursor gases and pre-existing aerosol particles, the nucleation itself can take place in both clean and polluted environments. However, due to the strong coupling of JD to both pre-existing particle concentrations and GR, we never observe these events unless the nuclei grow fast enough to avoid being scavenged by coagulation before reaching detectable sizes. For this reason, low particle growth rates of the order 0.1 nm hour-1 can be observed only in very clean air (which have low pre-existing particle concentrations), such as the air encountered over polar areas. Altogether, most observations made so far support the idea that nucleation and subsequent particle growth are uncoupled under atmospheric conditions (Kulmala et al., 2000c). The associations between JD and H2SO4 vapour concentration are suggestive of the involvement of H2SO4 in atmospheric nucleation, yet the actual nucleation mechanism remains to be definitively identified. The few observations made in the free troposphere are consistent with the binary water-sulfuric acid nucleation, whereas in the boundary layer a third nucleating component (such as ammonia) or a totally different nucleation mechanism is clearly needed. We are not able to rule out the possibility that ion-induced nucleation occurs in the boundary layer. Observed growth rates of nucleated particles cannot usually be explained by the condensation of sulfuric and associated inorganic compounds (water and ammonia). While organic compounds having a very low saturation vapour pressure would appear to be the most likely candidates for the growth of nucleated particles, the identity of these compounds remains to be revealed. 6. Summary and Conclusions The formation and growth of new aerosol particles is of growing interest due to their climatic and health effects. The question “How and under what conditions does new particle formation occur?” has exercised the minds of meteorologists and physicists since the time of John Aitken, who in the late 1880's built the first apparatus to measure the number of dust and fog particles. However, only during the last 10 years has the measurement technology developed to such a level that size distributions nanometer-size particles can be measured in the atmosphere. In recent years the formation and growth of nanometer-size atmospheric aerosol particles have been observed at many different sites. These measurements have been performed on ships, aircraft and fixed sampling sites during both intensive campaigns and continuous ground-based measurements. From measured size distributions one can infer the particle growth rate, whereas from measured number concentrations an apparent source rates of 3 nm (or 10 nm or 15 nm) particles is obtained. We have collected existing data from more than 100 studies reported in the literature and existing data banks (campaigns and continuous measurements). Aerosol formation has been observed in many different locations and environmental conditions, including the free troposphere, urban plumes, clean arctic air, coastal environments, etc. Aerosol formation is often related to atmospheric mixing processes, such as the evolution of a continental boundary layer or the mixing of stratospheric and tropospheric air near the tropopause.

Based on this review we conclude that typical particle growth rates are 1-20 nm hour-1 in mid latitudes, depending on the temperature and concentration of condensable vapours. However, growth rates as low as 0.1 nm hour-1 can be seen over in Antarctic and Arctic regions. The formation rate of 3 nm particles during regional nucleation events lies typically in the range 0.01-10 particles cm-3 s-1 in the boundary layer. In coastal environments and industrial plumes, however, formation rates as high as 104-105 particles cm-3 s-1 have been reported. Particle formation and growth events can be observed throughout the year, but particle growth rates are clearly bigger during the summer than in winter. From the present study it is not possible to decide what is the most relevant nucleation mechanism in the atmosphere. It may be that more than one nucleation process is operating in the atmosphere. The most realistic candidate mechanisms include 1) homogeneous binary water-sulfuric acid nucleation when ammonia concentrations are very low, 2) homogeneous water-sulphuric acid-ammonia nucleation, 3) ion-induced nucleation of binary (water-sulphuric acid) or ternary vapours or of organic vapours, and 4) barrierless (kinetically controlled) homogeneous nucleation. Recent studies (Napari et al., 2002a,b) have shown that some other inorganic systems are not able to make particles under atmospheric conditions. However, the data presented in this paper generally supports the hypothesis that sulphuric acid, while participating in nucleation, accounts usually for only a portion of the particle growth. This supports the proposed uncoupling between the nucleation and growth of atmospheric aerosols, particularly in lower troposhere. Globally, the formation of new particles and their subsequent growth seem to occur almost everywhere. The new particle can, depending on the location, increase the concentration of cloud condensation nuclei by a factor more than two over the course of one day. We can therefore conclude that atmospheric new-particle production is an important process that must be understood and include when developing global climate models. Future work should include continuous observations of aerosol particle size distributions in diverse locations, measurements of gaseous compounds participating in nucleation and growth, and determination of the chemical composition and other properties of nucleated particles. Measurements concerning the distribution and composition of nucleating clusters would significantly add to our understanding of the nucleation process itself. Finally, the possibility that ion-induced nucleation is occurring cannot be overlooked. Future work should include measurements of ion mobility distributions and ion compositions. Acknowledgements: The authors are grateful to several groups collecting and publishing the data. Particularly we would like to thank Dr. E.D. Nilsson, Mrs S.-P- Malvikko Mr. M. Savimaa, Mr. I.K. Koponen and Mr. Pasi Aalto for their help.We acknowledge financial support by the Academy of Finland (project number 47668). WB acknowledges support by EU Marie Curie grant EKV4-CT-2000-50002. PHM acknowledges support from the U.S. DOE through grant No. DE-FG02-98R62556 and EPA through Grant No. R829620, and the assistance of Hiromu Sakurai and Qian Shi in analyzing the data from St. Louis. Although the research described in this article has been funded wholly or in part by the United States Environmental Protection Agency, it has not been subjected to the Agency’s required peer and policy review and therefore does not necessarily reflect the views of Agency and no official endorsement should be iferred.

REFERENCES Alofs D.J. and Balakumar P. (1982): Inversion to obtain aerosol size distributions from measurements with a
differential mobility analyzer, J. Aerosol Sci. 13, 513-527. Aalto, P., Kulmala, M., and Nilsson, E. D. (1995): Nucleation events on the Värriö measurement station.
Journal of Aerosol Science 26, S411-S412. Aalto, P.,Hämeri, K., Becker, E., Weber, R., Salm, J., Mäkelä, J. M., Hoell, C., O´Dowd, C. D., Karlsson, H.,
Hansson, H.- C., Väkevä, M., Koponen, I. K., Buzorius, G., and Kulmala, M. (2001): Physical characterization of aerosol particles in boreal forests. Tellus B 53, 344-358.
Aalto, P. P. and Nilsson E.D. (2003): personal communication. Agarwal J. K. and G. J. Sem (1980): Continuous Flow Single-Particle-Counting Condensation Nuclei Counter.
Journal of Aerosol Science 11, 343-357. Aitken, J. A. (1897): On some nuclei of cloudy condensation. Trans. Roy. Soc. XXXIX. Andreae, M. O., Chapuis, A., Cros, B., Fontan, J., Helas, G., Justice, C., Kaufman, Y. J., Minga, A., and
Nganga, D. (1992): Ozone and Aitken nuclei over equatorial Africa:airborne observations during DECAFE 88. Journal of Geophysical Research D 97, 6137-6148.
Baltensperger, U., Gäggeler, H. W., Jost, D. T., Lugauer, M., Schwikowski, M., Weingartner, E., and Seibert, P. (1997): Aerosol climatology at the high-alpine site Jungfraujoch, Switzerland.. Journal of Geophysical Research D 102, 19707-19715.
Bates, T. S., Kapustin, V. N., Quinn, P. K., Covert, D. S., Coffman, D. J., Mari, C., Durkee, P. A., De Bruyn, W. J., and Saltzman, E. S. (1998): Processes controlling the distribution of aerosol particles in the lower marine boundary layer during the first aerosol characterization experiment (ACE 1). Journal of Geophysical Research D 103, 16369-16383.
Baumgartner, D., Raga, G. B., Kok, G., Ogren, J., Rosas, I., Baez, A., and Novakov, T. (2000): On the evolution of aerosol properties at a mountain site above Mexico City. Journal of Geophysical Research D 105, 22243-22253.
Berresheim, H., T. Elste, H.G. Tremmel, A.G. Allen, H.-C. Hansson, K. Rosman, M. Dal Maso, J.M. Mäkelä, M. Kulmala, C.D. O'Dowd (2002) Gas-aerosol relationships of H2SO4, MSA and OH: Observations in the coastal marine boundary layer at Mace Head, Ireland. J. Geophys. Res., 107, D19, 8100, 10.1029/2000JD000229
Birmili W., F. Stratmann, and A. Wiedensohler (1999a), Design of a DMA-Based Size Spectrometer for a Large Particle Size Range and Stable Operation, J. Aerosol Sci., 30, 549-553.
Birmili, W., Yuskiewicz, B., Stratmann, F., Wiedensohler, A., Choularton, T. W., and Bower, K. N. (1999b): Climate-relevant Modification of the Aerosol Size Distribution by Processes Associated with Orographic Clouds. Atmos. Res. 50, 241-264.
Birmili, W. and Wiedensohler, A. (2000a): New particle formation in the continental boundary layer: Meteorological and gas phase parameter influence. Geophysical Research Letters 27, 3325-3328.
Birmili, W., Wiedensohler, A., Plass-Duelmer, C., and Berresheim, H. (2000b): Evolution of newly formed aerosol particles in the continental boundary layer: A case study including OH and H2SO4 measurements. Geophysical Research Letters 27, 2205-2208.
Birmili, W., Galgon, D., Wiedensohler, A., Müller, K., Choularton, T. W., Bower, K. N., Frank, G., Karlsson, M., Martinsson, B. (2001a): Evolution of the fine particle distribution in the outflow of a city. Journal of Aerosol Science 32, S193-194.
Birmili, W., Wiedensohler, A., Heintzenberg, J., and Lehmann, K. (2001b): Atmospheric particle number size distribution in central Europe: statistical relations to air masses and metorology. Journal of Geophysical Research D 106, 32005-32018.
Birmili, W., Berresheim, H., Plass-Dülmer, C., Elste, T., Gilge, S., Wiedensohler, A., and Uhrner, U. (2003): The Hohenpeissenberg aerosol formation experiment (HAFEX): a long-term study including size-resolved aerosol, H2SO4, OH, and monoterpenes measurements. Atmospheric Chemistry and Physics 3, 361-376.
Brock, C. A.,Hamill, P., Wilson, J.C., Jonsson, H.H., Chan, K.R.(1995):Particle formation in the upper ropical troposphere: a source of nuclei for the startospheric aerosol, Scince 270,1650-1653.
Brock, C. A., Schröder, F., Kärcher, B., Petzold, A., Busen, R., and Fiebig, M. (2000): Ultrafine particle size distributions measured in aircraft exhaust plumes. Journal of Geophysical Research D 105, 26555-26567.
Brock, C. A., Washenfelder, R. A., Trainer, M., Ryerson, T. B., Wilson, J. C., Reeves, J. M., Huey, L. G., Holloway, J. S., Parrish, D. D., Hübler, G., and Fehsenfeld, F. C. (2002): Particle growth in the plumes of coal-fired power plants. Journal of Geophysical Research 107 (D12), doi: 10.1029/2001JD001062.
Brock, C. A., Trainer, M., Ryerson, T. B., Neuman, J. A., Parrish, D. D., Holloway, J. S., Nicks, D. K., Jr., Frost, G. J., Hübler, G., Fehsenfeld, F. C., Wilson, J. C., Reeves, J. M., Lafleur, B. G., Hilbert, H., Atlas, E. L., Donnelly, S. G., Schauffler, S. M., Stroud, V. R., and Wiedinmyer, C. (2002a): Particle
growth in urban and industrial plumes in Texas. Journal of Geophysical Research 108 (D3), doi: 10.1029/2002JD002746.
Charlson, R. J., Lovelock, J. E., Andreas, M. D., and Warren, S. G. (1987): Oceanic phytoplankton, atmospheric sulphur, cloud albedo and climate. Nature 326, 655-661.
Chen D.-R., Pui, D.Y.H., Hummes, D., Fissan, H., Quandt, F.R., and Sem G. J. (1998): Design and Evaluation of a Nanometer Aerosol Differential Mobility Analyzer (Nano-DMA). Journal of Aerosol Science 29, 497-509.
Clarke, A.D. (1993): Atmospheric nuclei in the Pacific midtroposhere: Their nature, concentration and evolution. Journal of Geophysical Research D 98, 20633-20647.
Clarke, A. D., Li, Z., and Litchy M. (1996): Aerosol dynamics in the equatorial Pacific Marine boundary layer: Microphysics, diurnal cycles and entrainment. Geophysical Research Letters 23, 733-736.
Clarke, A. D., Varner, J. L., Eisele, F., Mauldin, R. L., Tanner, D., and Litchy, M. (1998a): Particle production in the remote marine atmosphere: Cloud outflow and subsidence during ACE 1. Journal of Geophysical Research D 103, 16397-16409.
Clarke, A. D., Davis, D., Kapustin, V. N., Eisele, F., Chen, G., Paluch, I., Lenschow, D., Bandy, A. R., Thornton, D., Moore, K., Mauldin, L., Tanner, D., Litchy, M., Carroll, M. A., Collins, J., and Albercook, G. (1998b): Particle nucleation in the tropical boundary layer and its coupling to marine sulfur sources. Science 282, 89-92.
Clarke, A. D., Kapustin, V. N., Eisele, F. L., Weber, R. J., and McMurry, P. H. (1999a): Particle production near marine clouds: sulfuric acid and predictions from classical binary nucleation. Geophysical Research Letters 26, 2425-2428.
Clarke, A. D., Eisele, F., Kapustin, V. N., Moore, K., Tanner, D., Mauldin, L., Litchy, M., Lienert, B., Carroll, M. A., and Albercook, G. (1999b): Nucleation in the equatorial free troposphere: Favorable environments during PEM-tropics. Journal of Geophysical Research D 104, 5735-5744.
Clarke, A. D. and Kapustin, V. N. (2002): A Pacific aerosol survey: Part I: A decade of data on particle production, transport, evolution, and mixing in the troposphere. Journal of Atmospheric Sciences 59, 363-382
Clement, C.F., Ford, I.J., Twohy, C.H., Weinheimer, A. and Campos, T. (2002) Particle production in the outflow of a midlatitude storm. Journal of Geophysical Research D 107, 4559, doi:10,1029/2001JD001352.
Coe, H., Williams, P. I., McFiggans, G., Gallagher, M. W., Beswick, K. M., Bowler, K. N., and Choularton, T. W. (2000): Behavior of ultrafine particles in continental and marine air masses at a rural site in the United Kingdom. Journal of Geophysical Research D 105, 26891-26905.
Covert, D. S., Kapustin, V. N., Quinn, P. K., and Bates, T. S. (1992): New particle formation in the marine boundary layer. Journal of Geophysical Research D 97, 20581-20589.
Covert, D. S., Kapustin, V. N., Bates, T. S., and Quinn, P. K. (1996a): Physical properties of marine boundary layer aerosol particles of the mid-Pacific in relation to sources and meteorological transport. Journal of Geophysical Research D 101, 6919-6930.
Covert, D. S., Wiedensohler, A., Aalto, P., Heintzenberg, J., McMurry, P. H., and Leck, C. (1996b): Aerosol number size distributions from 3 to 500 nm diameter in the arctic marine boundary layer during summer and autumn. Tellus B 48, 197-212.
Dal Maso, M. (2002): personal communication . Dal Maso, M., Kulmala, M., Mäkelä, J., Pirjola, L., and Laaksonen, A. (2000): Characterization of the aerosol
nucleation events in Hyytiälä. Finnish association for aerosol reserach: Report Series in Aerosol Science 47, 23-32.
Dal Maso, M., Kulmala, M., Lehtinen, K. E. J., Mäkelä, J. M., Aalto, P., and O'Dowd, C. D. (2002): Condensation and coagulation sinks and formation of nucleation mode particles in coastal and boreal forest boundary layers. Journal of Geophysical Research D 107, 10.1029/2001JD001053.
Davison, B., Hewitt, C.N., O’Dowd, C. D., Lowe, J. A., Smith, M. A., Schwikowski, M., Baltensperger, U. and Harrison, R. M. (1996): Dimethyl sulfide, methane sulfonic acid and physiochemical aerosol properties in the Atlantic air from the United Kingdom to Halley Bay. Journal of Geophysical Research D 101, 22855-22867.
de Reus, M., Ström, J., Kulmala, M., Pirjola, L., Lelieveld, J., Schiller, C., and Zöger, M. (1998): Airborne aerosol measurements in the tropause region and the dependence of new particle foramtion on preexisting particle number concentrations. Journal of Geophysical Research D 103, 31255-31263.
de Reus, M., Ström, J., Curtius, J., Pirjola, L., Vignati, E., Arnold, F., Hansson, H.-C., Kulmala, M., Lelieveld, J., and Raes, F. (2000): Aerosol production and growth in the upper free troposphere. Journal of Geophysical Research D 105, 24751-24762.
de Reus, M., Krejci, R., Williams, J., Fischer, H., Scheele, R., and Ström, J. (2001): Vertical and horizontal distributions of the aerosol number concentration and size distribution over the northern Indian Ocean. Journal of Geophysical Research D 106, 28629-28641.
Eisele F.L. and Tanner D. J. (1993): Measurement of the gas phase concentration of H2SO4 and methane sulfonic acid and estimates of H2SO4 production and loss in the atmosphere. Journal of Geophysical Research D 98, 9001-9010.

Ferek, R. J., Hobbs, P.V., Radke, L.F., Herring, J.A. (1995): Dimethyl sulphide in the arctic atmosphere. Journal of Geophysical Research D 100 , 26093-26104.
Flagan, R. C. (1998): History of electrical aerosol measurements. Aerosol Science and Technology 28, 301-380.
Gras, J. L. (1993): Condensation nucleus size distribution at Mawson, Antarctica: Seasonal cycle. Atmospheric Environment A 27, 1417-1425.
Grenfell, J. L., Harrison, R. M., Allen, A. G., Shi, J. P., Penkett, S. A., O'Dowd, C. D., Smith, M. H., Hill, M. K., Robertson, L., Hewitt, C. N., Davison, B., Lewis, A. C., Creasey, D. J., Heard, D. E., Heberstreit, K., Alicke, B., and James, J. (1999): An analysis of rapid increases in condensation nuclei concentrations at a remote coasal site in western Ireland. Journal of Geophysical Research D 104, 13771-13780.
Hämeri, K., Kulmala, M., Aalto, P., Leszczynski, K., Visuri, R., and Hämekoski, K. (1996): The investigations of aerosol particle formation in urban background area in Helsinki. Atmospheric Research 41, 281-298.
Hämeri, K.,Väkevä, M., Aalto, P. P., Kulmala, M., Swietlicki, E., Zhou, J., Seidl, W., Becker, E., and O´Dowd, C. D. (2001): Hygroscopic and CCN properties of aerosol particles in boreal forests. Tellus B 53, 359-379.
Harrison, R. M., Grenfell, J. L., Savage, N., Allen, A., Clemitshaw, K. C., Penkett, S., Hewitt, C. N., and Davison, B. (2000): Observations of new particle production in the atmosphere of a moderately polluted site in eastern England. Journal of Geophysical Research D 105, 17819-17832.
Hegg, D. A., Radke, L. F., and Hobbs, P. V. (1990): Particle production assiciated with marine clouds. Journal of Geophysical Research D 95, 13917-13926.
Hegg, D. A., Radke, L. F., and Hobbs, P. V. (1991): Measurements of Aitken nuclei and cloud condensation nuclei in the marine atmosphere and their relation to the DMS-cloud-climate hypothesis. Journal of Geophysical Research D 96, 18727-18733.
Hegg, D. A., Covert, D. A., and Kapustin, V. N. (1992): Modeling a case of particle nucleation in the marine boundary layer. Journal of Geophysical Research D 97, 9851-9857.
Hoffman, D.J. (1993):Twenty years of balloon-borne tropospheric aerosol measurements at Laramie, Wyoming. Journal of Geophysical Research D 98, 12753-12766.
Hoppel, W. A. and Frick, G. M. (1990a): Submicron aerosol size distributions measured over the tropical and south pacific. Atmospheric Environment A 24, 645-659.
Hoppel, W. A., Fitzgerald, J. W., Frick, G. M., Larson, R. E., and Mack, E. J. (1990b): Aerosol size distributions and optical properties found in the marine boundary layer in the atlantic ocean. Journal of Geophysical Research D 95, 3659-3686.
Hoppel, W. A., Frick, G. M., Fitzgerald, J. W., and Larson, R. E. (1994): Marine boundary layer measurements of new particle formation and the effects nonprecipitating clouds have on aerosol size distribution. Journal of Geophysical Research D 99, 14443-14459.
Horrak, U., Salm, J., and Tammet, H. (1998): Bursts of intermediate ions in atmospheric air. Journal of geophycical research D 103, 13909-13915.
Horrak, U., Salm, J., and Tammet, H. (2000): Statistical characterisation of air ion mobility spectra at Tahkuse observatory:Classification of air ions. Journal of geophycical research D 105, 9291-9302.
Ito, T. (1980): On the size distribution of submicron aerosol in the north pacific air. Journal of meteorological society in Japan 58, 81-91.
Ito, T. (1993): Size distribution of Antarctic submicron aerosols. Tellus B 45, 145-159. Jaenicke, R., Dreiling, V., Lehmann, E., Koutsenoguii, P. K., and Stingl, J. (1992): Condensation nuclei at the
German Antarctic Station "Georg von Neumayer". Tellus B 44, 311-317. Kavouras, I. G., Mihalopoulos, N., and Stephanou, E. G. (1998): Formation of atmospheric particles from
organic acids produced by forests. Nature 395, 683-686. Kavouras, I. G., Mihalopoulos, N., and Stephanou, E. G. (1999a): Secondary organic aerosol formation vs
primary organic aerosol emission: in situ evidence for the chemical coupling between monoterpene acidic photooxidation products and new particle formation over forests. Environmental Science and Technology 33, 1028-1037.
Kavouras, I. G., Mihalopoulos, N., and Stephanou, E. G. (1999b): Formation and gas/particle partitioning of monotrepenes photo-oxidation products over forests. Geophysical Research Letters 26, 55-58.
Keil, A. and Wendisch, M. (2001): Bursts of Aitken mode and ultrafine particles observed at the top of continetal boundary layer clouds. J. Aerosol Science 32, 649-660.
Kerminen, V.-M., Pirjola, L., and Kulmala, M. (2001): How significantly does coagulational scavenging limit atmospheric particle production? Journal of Geophysical Research 106, 24119-24125.
Kerminen, V.-M., and Kulmala, M. (2002) Analytical formulae connecting the “real” and the “apparent” nucleation rate and the nuclei number concentration for atmospheric nucleation events. Journal of Aerosol Science 33, 609-622.
Knutson, E. O., and Whitby, K. T. (1975): Aerosol classification by elctric mobility: apparatus, theory, and applications. Journal of Aerosol Science 6, 443-451.
Koponen, I. K. (2003): Antarctic aerosols, personal communication.

Koutsenogii, P. K. and Jaenicke, R. (1994): Number concentration and size ditribution of atmospheric aerosol in Siberia. Journal of Aerosol Science 25, 377-383.
Kulmala, M., and Laaksonen, A. (1990): Binary nucleation of water-sulfuric acid system: Comparison of classical theories with different H2SO4 saturation vapor pressures. J. Chem. Phys. 93, 696-701.
Kulmala, M., Laaksonen, A., Aalto, P., Vesala, T., Pirjola, L., Kerminen, V.-M., Korhonen, P., Hillamo, R., Virkkula, A., and Aurala, M. (1996): Formation, growth and properties of atmospheric aerosol particles and cloud droplets. Geophysica 32, 217-233.
Kulmala, M., Toivonen, A., Mäkelä J. M., and Laaksonen, A. (1998): Analysis of the growth of nucleation mode particles observed in Boreal forest. Tellus B 50, 449-462.
Kulmala, M., Pirjola, L., Aalto, P., Miikkulainen, P., Mäkelä, J. M., and Hämeri, K. (2000a): Growth and composition of nucleation mode particles. Finnish association for aerosol reserach: Report Series in Aerosol Science 47, 195-200.
Kulmala, M., Dal Maso, M., Mäkelä, J. M., and O'Dowd, C. D. (2000b): Formation and growth nucleation mode particles. Finnish association for aerosol reserach: Report Series in Aerosol Science 48, 83-88.
Kulmala, M., Pirjola, L., and Mäkelä, J. M. (2000c): Stable sulphate clusters as a source of new atmospheric particles. Nature 404, 66-69.
Kulmala, M., Dal Maso, M. , Mäkelä, J. M., Pirjola, L., Väkevä, M., Aalto, P., Miikkulainen, P., Hämeri, K., and O'Dowd, C. D. (2001): On the formation, growth and composition of nucleation mode particles. Tellus B 53, 479-490.
Kulmala, M., P. Korhonen, I. Napari, A. Karlsson, H. Berresheim, C.D. O'Dowd: Aerosol formation during PARFORCE: Ternary Nucleation of H2SO4, NH3 and H2O. J. Geophys. Res., 107, D19, 8111, 10.1029/2001JD000900, 2002
Kulmala, M., Boy, M., Gaman, A., Raivonen, M., Suni, T., Aaltonen, V., Adler, H., Anttila, T., Fiedler, V., Grönholm, T., Hellen, H., Herrmann, E., Jalonen, R., Jussila, M., Komppula, M., Kosmale, M., Plauskaite, K., Reis, R., Rinollo, A., Savola, N., Soini, P., Virtanen, S., Aalto, P., Dal Maso, M., Hakola, H., Keronen, P., Lehtinen, K.E.J., Vehkamäki, H., Rannik, Ü., and Hari, P. (2003): Aerosols in boreal forest: wintertime relations between formation events and bio-geo-chemical activity. Boreal Environment Research (in press).
Leaitch, W. R., Bottenheim, J. W., Biesenthal, T. A., Li, S.-M., Liu, P. S. K., Asalian, K., Dryfhout-Clark, H., and Hopper, F. (1999): A case stydy of gas-to -particle conversion in an eastern Canadianforest. Journal of Geophysical Research D 104, 8095-8111.
Leck, C. and Bigg, K. E. (1999): Aerosol production over remote marine areas- a new route. Geophysical Research Letters 26, 3577-3580.
Mäkelä, J. M., Aalto, P., Jokinen, V., Pohja, T., Nissinen, A., Palmroth, S., Markkanen, T., Seitsonen, K., Lihavainen, H., and Kulmala, M. (1997): Observations of ultrafine particle formation and growth in boreal forest. Geophysical Research Letters 24, 1219-1222.
Mäkelä, J. M., Koponen, I. K., Aalto, P., and Kulmala, M. (1999): One -year data of submicron size modes of tropospheric background aerosol in southern Finland. Journal of Aerosol Science 31, 595-611.
Mäkelä, J., Dal Maso, M., Pirjola, L. Keronen, P., Laakso, L., Kulmala, M., and Laaksonen, A. (2000): Charactristics of the atmospheric partyicle formation events observed at a boreal forest site in southern Finland. Boreal Environment Research 5, 299-313.
Marti, J. J., Weber, R. J., McMurry, P. H., Eisele, F., Tanner, D., and Jefferson, A. (1997): New particle formation at a remote continental site: Assessing the contributions of SO2 and organic precursors. Journal of Geophysical Research D 102, 6331-6339.
McGovern, F. M. (1999): An analysis of condensation nuclei levels at Mace Head, Ireland. Atmospheric Environment 33, 1711-1723.
McGovern, F. M., Jennings, S. G., Connor, T. C., and Simmonds, P. G. (1996): Aerosol and trace gas measurements during the Mace Head experiment. Atmospheric Environment 30, 3891-3902.
McMurry, P. H. (2000a): A review of atmospheric aerosol measurements. Atmospheric Environment 34, 1959-1999.
McMurry, P. H. (2000b): The history of condensation nucleus counters. Aerosol Science and Technology 33, 297-322.
McMurry, P. H., Woo, K. S., Weber, R., Chen, D.-R., and Pui, P. Y. H. (2000): Size distributions of 3-10 nm atmopheric particles: implications for nucleation mechanisms. Phil. Trans. R. Soc. Lond. A 358, 1-18.
McMurry, P. H., Woo, K. S., and Shi, Q. (2003): Manuscript in preparation. Menon , S., Del Genio, A. D., Koch, D. and Tselioudis, G. (2002): GCM simulations of the aerosol indirect
effect: Sensitivity to cloud parameterization and aerosol burden. Journal of Atmospheric Sciences 59, 692-713.
Mihalopoulos, N., Nguyen, B. C., Boissard, C., Campin, J. M., Putaud, J. P., Belviso, S., Barnes, I., and Becker, K. H. (1992): Field study of dimethylsulfide oxidation in the boundary layer: variations of dimethylsulfide, methanesulfonic acid, sulfur dioxide, non-sea salt sulfate and Aitken nuclei at a coastal site. Journal of Atmospheric Chemistry 14, 459-477.
Misaki, M. (1964): Mobility spectrums of large ions un the new mexico semidesert. Journal of Geophysical Research 16, 3309-.
Napari, I., Noppel, M., Vehkamäki, H., and Kulmala, M. (2002): An improved model for ternary nucleation of sulfuric acid - ammonia - water. J. Chem. Phys. 116, 4221-4227.
Napari, I., M. Kulmala, H. Vehkamäki (2002): Ternary nucleation of inorganic acids, ammonia, and water. J. Chem. Phys., 117, 8418-8425
Neusüss, C., Wex, H., Birmili, W., Wiedensohler, A., Koziar, C., Busch, B., Brüggemann, E., Gnauk, T., Ebert, M., and Covert, D. S. (2002): Characterization and parameterization of atmospheric particle number, mass, and chemical size distributions in central Europe during LACE-98 MINT. J. Geophys. Res. , October 1, 2002.
Nyeki, S., Kalberer, M., Lugauer, M., Weingartner, E., Petzold, A., Schröder, F., Colbeck, I., and Baltensperger, U. (1999): Condensation Nuclei (CN) and ultrafine CN in the free troposphere to 12 km: A case study over the Jungfraujoch high-alpine research station. Geophysical Research Letters 14, 2195-2198.
O'Connor, T. C. and McGovern, F. M. (1991): Aerosol climatology measurements with a Nolan-Pollack counter. Atmospheric Environment A 25, 563-567.
O'Dowd, C. D. (2001): Biogenic coastal aerosol production and its influence on aerosol radiative properties. Journal of Geophysical Research D 106, 1545-1549.
O'Dowd, C. D., Geever, M., Hill, M. K., Smith, M. H., and Jennings, S. G. (1998a): New particle formation: Nucleation rates and spatial scales in the cleam marine coastal environment. Geophysical Research Letters 25, 1661-1664.
O'Dowd, C. D., Hill, M. K., Smith, M. H., Geever, M., and Jennings, S. G. (1998b): New particle formation: Nucleation rates & spatial scales in the coastal environment. Journal of Aerosol Science 29, S183-S184.
O'Dowd, C. D., McFiggans, G., Greasey, D. J., Pirjola, L., Hoell, C., Smith, M. H., Allan, B. J., Plane, J. M. C., Heard, D. E., Lee, J. D., Pilling, M. J., and Kulmala, M. (1999): On the photochemical production of new particles in the coastal boundary layer. Geophysical Research Letters 26, 1707-1710.
O'Dowd, C., Hoell, C., and Becker, E. (2000a): PARFORCE intensive field campaign results: particle concentration and low tide. Finnish Association for Aerosol Reserach: Report Series in Aerosol Science 48, 22-27.
O'Dowd, C., Hoell, C., and Becker, E. (2000b): Regional scales of coastal particle production and the evolution of coastal aerosol plumes. Finnish Association for Aerosol Research: Report Series in Aerosol Science 48, 34-39.
O'Dowd, C.D., Hämeri, K., Mäkelä, J. M., Pirjola, L., Kulmala, M., Jennings, S. G., Berresheim, H., Hansson, H.-C., de Leeuw, G., Kunz, G. J., Allen, A. G., Hewitt, C. N., Jackson, A., Viisanen, Y., and Hoffmann, T. (2002a): A dedicated study of New Particle Formation and Fate in the Coastal Environment (PARFORCE): Overview of objectives and achievements. Journal of Geophysical Research 107 (D19), doi: 10.1029/2001JD000555.
O'Dowd, C. D., Aalto, P., Hämeri, K., Kulmala, M., and Hoffmann, T. (2002b): Atmospheric particles from organic vapours. Nature 416, 497-498.
Park, J., Sakurai, H., Vollmers, K., and McMurry, P. H. (2003): Aerosol Size Distributions Measured at the South Pole During ISCAT. Atmospheric Environment submitted.
Perry, K. D. and Hobbs, P. V. (1994): Further evidence for particle nucleation in clean air adjacent to marine cumulus clouds. Journal of Geophysical Research D 99, 22803-22818.
Petzold, A., Döpelheuer, A., Brock, C. A., and Schröder, F. (1999): In situ observations and model calculations of black carbon emission by aircraft at cruise altitude. Journal of Geophysical Research D 104, 22171-22181.
Pirjola, L., Laaksonen, A., Aalto, P., and Kulmala, M. (1998): Sulfate aerosol formation in the arctic boundary layer. Journal of Geophysical Research D 103, 8309-8321.
Radke, L. F. and Hobbs, P. V. (1991): Humidity and particle fields around some small cumulus clouds. Journal of Atmospheric Sciences, 48, 1190-1193.
Raes, F., Van Dingenen, R., Cuevas, E., Van Velhoven, P. F. J., and Prospero, J. M. (1997): Observations of aerosols in the free troposphere and marine boundary layer of subtropical Northeast Atlantic: Discusiion of processes determining their size distribution. Journal of Geophysical Research D 102, 21315-21328.
Ramanathan, V., Crutzen, P. J., Kiehl, J. T., and Rosenfeld, D. (2001): Aerosol, climate, and the hydrological cycle. Science 294, 2119-2124.
Salm, J. and Tamm, E. (2000): Air ion measurement in hyytiälä during BIOFOR 3. Finnish Association for Aerosol Research: Report Series in Aerosol Science 47, 87-90.
Saros, M. T., Weber, R. J., Marti, J. J., and McMurry, P. H. (1996): Ultrafine aerosol measurements using a condensation nucleus counter with pulse height analysis. Aerosol Science and Technology 25, 200-213.
Schröder, F. and Ström, J. (1997): Aircraft measurements of sub micrometer aerosol particles (> 7 nm) in the midlatitude free troposphere and tropopause region. Atmospheric Research 44, 333-356.
Shi, Qian (2003) Continuous measurements of 3 nm to 10 µm aerosol size distributions in St. Louis, M.S. Thesis, Department of Mechanical Engineering, University of Minnesota, Minneapolis, MN 55455

Shi, J. P., Evans, D. E., Khan, A. A., and Harrison, R. M. (2001): Sources and concentration of nanoparticles (< 10 nm in diameter) in the urban atmosphere. Atmospheric Environment 35, 1193-1202.
Stanier, C. O., Khlystov, A. Y., and Pandis, S. N. (2002): Investigation of nucleation bursts during the Pittsburgh air quality study. Abstracts of the Sixth International Aerosol Conference , 1291-1292.
Stieb, D. M., Judek, S., and Burnett, R. T. (2002): Meta-analysis of time-series studies of air pollution and mortality: Effects of gases and particles and their influence of cause of death, age and season. J. Air & Manage. Assoc. 52, 470-484.
Stolzenburg M. R. and P. H. McMurry (1991): An Ultrafine Condensation Nucleus Counter. Aerosol Science and Technology 14, 48-65.
Stott, P. A., Tett, S. F. B., Jones, G. S., Allen, M. R., Mitchell, J. F. B., and Jenkins, G. J. (2000) External control of 20th century temperature by natural and anthropogenic forcings. Science 290, 2133-2137.
Thornton, D. C., Bandy, A. R., Blomquist, B. W., Bradshaw, J. D. and Blake, D. R. (1997): Vertical transport of sulfur dioxide and dimethyl sulfide in deep convection and its role in new particle formation. Journal of Geophysical Research D 102, 28501-28509.
Twohy, C. H., Clement, C. F., Gandrud, B. W., Weinheimer, A. J., Campos, T. L., Baumgardner, D., Brune, W. H., Faloona, I., Sachse, G. W., Vay, S. A., and Tan, D. (2002): Deep convection as a source of new particles in the midlatitude upper troposphere. Journal of Geophysical Research D 107, 10.1029/2001JD000323.
Ulevicius, V., Mordas G., and Plauskaite K. (2002): Evolution of aerosol particle size distribution in the coastal environment: effect of relative humidity, SO2 and NO2. Environmental and Chemical Physics 24, 13-17.
Väkevä,M., Hämeri, K., Puhakka, T., Nilsson, E. D., Hohti, H., and Mäkelä, J. M. (2000): Effects of meteorological processes on aeroso areal particle soze distribution in an urban background. Journal of Geophysical Research D 105, 9807-9821.
Van Dingenen, R., Raes, F., and Jensen, N. R. (1995): Evidence for anthropogenic impact on number concentration and sulfate content of cloud-processed aerosol particles over the North Atlantic. Journal of Geophysical Research D 100, 21057-21067.
Verheggen, B. and Mozurkewich, M. (2002): Determination of nucleation and growth rates from observation of a SO2 induced atmospheric nucleation event. Journal of Geophysical Research D 107, 10.1029/2001JD000683.
Voisin, D., J. N. Smith, H. Sakurai, P. H. McMurry, F. L. Eisele (2003): Thermal desorption chemical ionization mass spectrometer for ultrafine particle chemical composition. Aerosol Science and Technology 37, 471-475
Wang, S. C., and Flagan, R. C. (1990): Scanning electrical mobility spectrometer. Aerosol Science and Technology 13, 230-240.
Wang, Y., Liu, S. C., Anderson, B. E., Kondo, Y., Gregory, G. L., Sachse, G. W., Vay, S. A., Blake, D. R., Singh, H. B. and thompson, A. M. (2000): Evidence of convection as a major source of condensation nuclei in the northern midlatitude upper troposphere. Geophysical Research Letters 27, 369-372.
Weber, R. J., McMurry, P. H., Eisele, F. L., and Tanner, J. (1995): Measurement of expected nucleation precursor species and 3-500-nm diameter partciles at Mauna Loa observatory, Hawaii. Journal of Atmospheric Sciences 52, 2242-2257.
Weber, R. J., Marti, J. J., McMurry, P. H., Eisele, F. L., Tanner, D. J., and Jefferson, A. (1996): Measured atmospheric new particle formation rates: Implications for nucleation mechanisms. Chemical Engineering Communications 151, 53-64.
Weber, R. J., Marti, J. J., McMurry, P. H., Eisele, F. L., Tanner, D. J., and Jefferson, A. (1997): Measurements of new particle formation and ultrafine particle growth rates at a clean continental site. Journal of Geophysical Research D 102, 4375-4385.
Weber, R. J., McMurry, P. H., Mauldin, L., Tanner, D. J., Eisele, F. L., Brechtel, F. J., Kreidenweis, S. M., Kok, G. L., Schillawski, R. D., and Baumgardner, D. (1998): A study of new particle formation and growth involving biogenic and trace gas species measured during ACE1. Journal of Geophysical Research D 103, 16385-16396.
Weber, R. J. , McMurry, P. H., Mauldin III, R. L., Tanner, D., Eisele, F. L., Clarke, A. D., and Kapustin, V. N. (1999): New particle formationin the remote troposhere: A comparison of observations at various sites. Geophysical Research Letters 26, 307-310.
Weber, R. J., Moore, K., Kapustin, V., Clarke, A., Mauldin, R. L., Kosciuch, E., Cantrell, C., Eisele, F., Andersson B., and Thornhill, L. (2001a): Nucleation in the equatorial pacific during PEM tropics B: Enhanced boundary layer H2SO4 but no particle production. Journal of Geophycical Research D 106, 32767-32776.
Weber, R. J., Chen, G., Davis, D. D., Mauldin III, R. L., Tanner, D. J., Eisele, F. L., Clarke, A. D., Thornton, D. C., and Bandy, A. R. (2001b): Measurements on enhanced H2SO4 and 3-4 nm particles near a frontal cloud during the first aerosol characterization experiment (ACE 1). Journal of Geophysical Research D 106, 24107-24117.
Wehner, B. and Wiedensohler, A. (2002): Long term measurements of submicrometer urban aerosols: statistical analysis for correlations with meteorological conditions and trace gases. Atmos. Chem. Phys. Discuss. 2, 1699-1733.
Weingartner, E., Nyeki, S., and Baltensperger, U. (1999): Seasonal and diurnal variation of aerosol size distributions (10<D<750nm) at a high-alpine site (Jungfraujoch 3580 m asl). Journal of Geophysical Research D 104, 26809-26820.
Weise, D., Birmili, W., Wiedensohler, A., and Covert, D. S. (1998): New particle occurrence in the polluted marine boundary layer during the ACE-2 experiment. Journal of Aerosol Science 29, S1103-S1104.
Wichmann, H.-H., Peters, A. (2000): Epidemiological evidence of the effects of ultrafine particle exposure. Phil. Trans. R. Soc. Lond. A. 358, 2751-2769.
Wiedensohler A., Aalto, P., Covert D., Heintzenberg J., and McMurry P. H. (1994): Intercomparison of four methods to determine size distributions of low concentration (100 cm-3) ultrafine aerosols (3<Dp<10 nm) with illustrative data from the Arctic. Aerosol Science and Technology, 21, 95-109.
Wiedensohler, A., Covert, D. S., Swietlicki, E., Aalto, P., Heintzenberg, J., and Leck, C. (1996): Occurence of an ultrafine particle mode less tha 20 nm in diameter in themarine boundary layer during Arctic summer and autumn. Tellus B 48, 213-222.
Wiedensohler, A., Hansson, H.-C., Orsini, D., Wendisch, M., Wagner, F., Bower, K. N., Chourlaton, T. W., Wells, M., Parkin, M., Acker, K., Wieprecht, W., Facchini, M. C., Lind, J. A., Fuzzi, S., Arends, B. G., and Kulmala, M. (1997a): Night-time formation and occurrence of new particles associated with orographic clouds. Atmospheric Environment 31, 2545-2559.
Wiedensohler, A., D. Orsini, D. S. Covert, D. Coffmann, W. Cantrell, M. Hawlicek, F. J. Brechtel, L. M. Russell, R. J. Weber, J. Gras, J. G. Hudson, M. Litchy (1997b): Intercomparison Study of the Size-dependent Counting Efficiency of 26 Condensation Particle Counters. Aerosol Science and Technology 27, 224-242.
Williams, P. I., Choularton, T. W., Gallagher, M. W., Coe, H., and Bower, K. N. (1998): Results of monitoring ultra-fine, fine and accumulation mode particles above an urban canyon within the city of Manchester. Journal of Aerosol Science 29, S593-S594.
Williams, P. I., Gallagher, M. W., Choularton, T. W., Coe, H., Bower, K. N., and McFiggans, G. (2000): Aerosol development and interaction in an urban plume. Aerosol Science and Technology 32, 120-126.
Winklmayer, W. (1987): Untersuchung des ultrafeinen aerosols in der urbanen atmosphäre von Wien. Ph. D. thesis, Univ.of Vienna , .
Winklmayr W., G. P. Reischl, A. O. Linde, and A. Berner (1991): A New Electromobility Spectrometer for the Measurement of Aerosol Size Distributions in the Size Range from 1 to 1000 nm. Journal of Aerosol Science 22, 289-296.
Woo, K. S., Chen, D. R., Pui, D. Y. H., and McMurry, P. H. (2001): Measurements of Atlanta Aerosol Size Distributions: Observations of Ultrafine Partyicle Events. Aerosol Science and Technology 34, 75-87.
Yu, F., and Turco, R. P. (2000): Ultrafine aerosol formation via ion-mediated nucleation. Geophysical Research Letters 27, 883-886.
Yu, S., Saxena, V. K., and Zhao, Z. (2001) A comparison of signals of regional aerosol-induced forcing in eastern China and southeastern United States. Geophysical Research Letters 28, 713-716.
Zaizen, Y., Ikegami, M., Tsutsumi, Y., Makino, Y., and Okada, K. (1996): Number concentration and size distribution of aerosol particles in the middle troposhere over the western pacific ocean. Atmospheric Environment 30, 1755-1762.
Zeromskiene, K., Ulevicius V., and Mordas G (2000): Formation of new aerosol particles and hygroscopic growth in coastal environment. Environmental and Chemical Physics 22, 54-58.
Zhou, J., Swietlicki E., Hansson, H.-C., and Artaxo P. (2002): Sub-micrometer aerosol particle size distribution and hygroscopic growth measured in the Amazon rain forest during the wet season. Journal of Geophysical Research 107, 8055.

Tables Ref. Authors (year) Place Latitude Longitude Time Air mass
1 Koponen (2003) Antarctica S 73 03 W13 25 January 2000, 2001
CBL Arctic
2 Jaenicke et al. (1992) Atka Bay, Antarctic S70 37 W008 22 82-90 CBL Arctic 3 Gras (1993) Mawson, Antarctica S67 36 E062 53 85-91 CBL Arctic 4 Park et al. (2003) South Pole S89.997 W102.0 12/98 & 12/00 CBL Arctic 5 Ito (1993) Syowa, Antarctica S69 00 E039 35 8/78-12/78 CBL Arctic 6 Aalto et al. (1995) Värriö N67 46 E029 35 6/93-8/94 CBL Sub-Arctic 7 Kulmala et al. (1996) Värriö N67 46 E029 35 CBL Sub-Arctic 8 Pirjola et al. (1998) Värriö N67 46 E029 35 6/93-8/94 CBL Sub-Arctic 9 Dal Maso (2002) Värriö N67 46 E029 35 12/97-7/01 CBL Sub-Arctic 10 McMurry et al. (2003) Atlanta, GA N33.777 W84.414 8/1/98-8/30/99 CBL Mid-latitudes 11 Shi et al. (2001) Birmingham N52 30 W001 52 10/98-2/99 CBL Mid-latitudes 12 Weber et al. (1997) Colorado Rockies N39 59 W105 35 ?93 CBL Mid-latitudes 13 Keil et al. (2001) Dresden area N51 40 ,
N52 20 E013 2 , E014 5
96-98 CBL Mid-latitudes
14 Neusüss et al. (2002) Falkenberg/Germany N52 E14 7/98-8/98 CBL Mid-latitudes 15 Wiedensohler et al. (1997a) Great Dun Fell N54 41 W002 27 4/93-5/93 CBL Mid-latitudes 16 Birmili et al. (1999b) Great Dun Fell/United Kingdom N55 E-3 3/95-4/95 CBL Mid-latitudes 17 Verheggen et al. (2002) Hastings, Canada 25.8.1993 CBL Mid-latitudes 18 Birmili et al. (2000b) Hohenpeissneberg N47 48 E011 1 1998-2000 CBL Mid-latitudes 19 Birmili et al. (2003) Hohenpeissneberg N47 48 E011 1 1998-2000 CBL Mid-latitudes 20 Birmili et al. (2001a) Holme Moss/United Kingdom N54 E-1 3/2001 CBL Mid-latitudes 21 Mäkelä et al. (1997) Hyytiälä N61 51 E024 17 2/96-10/96 CBL Mid-latitudes 22 Kulmala et al. (1998) Hyytiälä N61 51 E024 17 2/96-1/97 CBL Mid-latitudes 23 Mäkelä et al. (1999) Hyytiälä N61 51 E024 17 2/96-1/97 CBL Mid-latitudes 24 Dal Maso et al. (2000) Hyytiälä N61 51 E024 17 96-99 CBL Mid-latitudes 25 Kulmala et al. (2000a) Hyytiälä N61 51 E024 17 3/99-4/99 CBL Mid-latitudes 26 Mäkelä et al. (2000) Hyytiälä N61 51 E024 17 1/96-9/99 CBL Mid-latitudes 27 Aalto et al. (2001) Hyytiälä N61 51 E024 17 4/98-
5/98,7/98-8/98,3/99-4/99
CBL Mid-latitudes
28 Hämeri et al. (2001) Hyytiälä N61 51 E024 17 3/99-4/99 CBL Mid-latitudes 29 Kulmala et al. (2001) Hyytiälä N61 51 E024 17 04/99 CBL Mid-latitudes 30 Kulmala et al. (2003) Hyytiälä N61 51 E024 17 CBL Mid-latitudes 31 Salm et al. (2000) Hyytiälä/Tahkuse N61 51 E024 17 3/99-4/99 CBL Mid-latitudes 32 Marti et al. (1997) Idaho Hill, Rocky Mountains
(Boulder, Colorado) N40 00 W105 16 09/93 CBL Mid-latitudes
33 Leaitch et al. (1999) Kejimkujik N44 26 W065 12 07/96 CBL Mid-latitudes 34 Wehner et al. (2002) Leipzig, Germany N52 E13 2/97-3/00 CBL Mid-latitudes 35 Hämeri et al. (1996) Luukki N60 18 E024 41 4/93-5/93 CBL Mid-latitudes 36 Väkevä et al. (2000) Luukki N60 18 E024 41 2/97-3/07 CBL Mid-latitudes 37 O'Connor et al. (1991) Mace Head N53 19 W009 54 CBL Mid-latitudes 38 McGovern et al. (1996) Mace Head N53 19 ,
N58 W009 54 4/91 CBL Mid-latitudes
39 O'Dowd et al. (1998b) Mace Head N53 19 W009 54 6/96? CBL Mid-latitudes 40 McGovern (1999) Mace Head N53 19 W009 54 90-92 CBL Mid-latitudes 41 Grenfell et al. (1999) Mace Head N53 19 W009 54 96-97 CBL Mid-latitudes 42 O'Dowd et al. (1999) Mace Head N53 19 W009 54 05/97 CBL Mid-latitudes 43 O'Dowd et al. (2000a) Mace Head N53 19 W009 54 9/98,6/99 CBL Mid-latitudes 44 O'Dowd et al. (2000b) Mace Head N53.2 –
N54.2 W009.2 – W010.2
06/99 CBL Mid-latitudes
45 Kulmala et al. (2000b) Mace Head N53 19 W009 54 CBL Mid-latitudes 46 O'Dowd (2001) Mace Head N53 19 W009 54 05/97 CBL Mid-latitudes 47 O'Dowd et al. (2002a) Mace Head N53 19 W009 54 CBL Mid-latitudes 48 Dal Maso et al. (2002) Mace Head N53 19 W009 54 CBL Mid-latitudes 49 O'Dowd et al. (1998a) Mace Head/Outer Hebrides N53 19 ,
N58 W009 54 W7 96/94 CBL Mid-latitudes
50 Williams et al. (1998) Manchester N53 30 W002 15 11/97-12/97 CBL Mid-latitudes 51 Williams et al. (2000) Manchester N53 30 W002 15 12/97 CBL Mid-latitudes 52 Birmili et al. (2000b) Melpitz N51 32 E012 56 3/96-8/97 CBL Mid-latitudes 53 Birmili et al. (2001b) Melpitz N51 32 E012 56 3/96-8/97 CBL Mid-latitudes 54 Mihalopoulos et al. (1992) Penmarch (Brittany) N47 47 W006 40 06/89 CBL Mid-latitudes 55 Stanier et al. (2002) Pittsburgh, USA CBL Mid-latitudes 56 Zeromskiene et al. (2000) Preila N55 21 E021 04 6/97-8/97 CBL Mid-latitudes 57 Ulevicius et al. (2002) Preila N55 21 E021 04 7/97-8/97 CBL Mid-latitudes 58 Koutsenogii et al. (1994) Siberia:Lake Baikal/Novosibirsk N53 , N55 E104 , E83 7/91-
8/91,6/92-7/92 CBL Mid-latitudes
59 Horrak et al. (1998) Tahkuse N58 31 E024 56 9/93-10/94 CBL Mid-latitudes 60 Horrak et al. (2000) Tahkuse N58 31 E024 56 9/93-10/94 CBL Mid-latitudes 61 Winklmayer (1987) Vienna N48 15 E016 25 85-86 CBL Mid-latitudes 62 Harrison et al. (2000) Weyborne N52 57 E001 7 06/95 CBL Mid-latitudes 63 Coe et al. (2000) Weyborne N52 57 E001 7 06/98 CBL Mid-latitudes 64 McMurry et al. (2000) CBL Mid-latitudes 65 Woo et al. (2001) Atlanta N33 45 W084 23 8/98-8/99 CBL Subtropic 66 Kavouras et al. (1999b) Pertouli, Greece N39 32 E021 20 7/97-8/97 CBL Subtropic 67 Weise et al. (1998) Sagres/Portugal N37 W9 6/97-7/97 CBL Subtropic 68 Misaki (1964) Socorro N34 02 W106 54 63 CBL Subtropic 69 Kavouras et al. (1998) Tabua, Portugal N40 21 W008 02 08/96 CBL Subtropic

Ref. Authors (year) Place Latitude Longitude Time Air mass
70 Kavouras et al. (1999a) Tabua, Portugal N40 21 W008 02 08/96 CBL Subtropic 71 Andreae et al. (1992) Congo N01 27 E018 04 02/88 CBL Tropic 72 Baumgartner et al. (2000) Mexico City N19 15 W099 11 11/97 CBL Tropic 73 Zhou et al. (2002) Balbina, Brasil S1 W59 3-4/98 CBL Tropic 74 Baltensperger et al. (1997) Jungfraujoch N46 33 W007 59 4/92-5/92 CBL
& FT Mid-latitudes
75 Weingartner et al. (1999) Jungfraujoch N46 33 W007 59 3/97-5/98 CBL & FT
Mid-latitudes
76 Brock et al. (2002) Eastern USA N31-40 W86-94 7/99 FT Mid-latitudes 77 Brock et al. (2003) Houston, Texas N29 –
N30.5 W94.5 – W96 8/2000 –
9/2000 FT Mid-latitudes
78 Nyeki et al. (1999) Jungfraujoch N46 33 W007 59 07/97 FT Mid-latitudes 79 Weber et al. (2001b) South Pacific S40-S60 E145-E159 11/95 FT Mid-latitudes 80 de Reus et al. (2000) Tenerife N29 W018 07/97 FT Mid-latitudes 81 Schröder et al. (1997) Western Europe N51 - N55 W004 - E011 07/94 FT Mid-latitudes 82 Twohy et al. (2002) Wisconsin N42 - N47 W88 – W91 5/96 FT Mid-latitudes 83 Clarke et al. (1999b) Pacific N20 -S20 W100 - W160 8/96-10/96 FT Tropic 84 Clarke (1993) Pacific Ocean N75-S60 W120- E130 5/90-6/90 FT Tropic &
Mid-latitudes 85 Petzold et al. (1999) Germany FT 86 Brock et al. (2000) FT 87 de Reus et al. (1998) Ireland N50 - N58 W000 - W015 5/96-6/96 FT &
Lower S
Mid-latitudes
88 Wiedensohler et al. (1996) Arctic ocean N70 - N90 8/91-10/91 MBL Arctic 89 Covert et al. (1996b) Arctic ocean N70 - N90 8/91-10/91 MBL Arctic 90 Leck et al. (1999) Arctic ocean N85 - N87 7/96-8/96 MBL Arctic 91 Aalto et al. (2003) Arctic ocean 19,911,996 MBL Arctic 92 Weber et al. (1998) Macquarie Island S54 30 E159 11/95-12/95 MBL Mid-latitudes 93 Hoppel et al. (1994) Oregon coast N44 W125 08/92 MBL Mid-latitudes 94 Perry et al. (1994) Pacific Ocean (off Oregon coast) N44 W130 11/92 MBL Mid-latitudes 95 Bates et al. (1998) South of Australia S40 - S55 E135 - E160 11/95-12/95 MBL Mid-latitudes 96 Hegg et al. (1991) Washington state coast N40 - N55 W125 - W135 6/89, 4/90 MBL Mid-latitudes 97 Covert et al. (1992) Washington state coast N40 - N55 W125 - W135 4/91-1/91 MBL Mid-latitudes 98 Hegg et al. (1992) Washington state coast N40 - N55 W125 - W135 04/91 MBL Mid-latitudes 99 Weber et al. (1995) Mauna Loa, HI N19 32 W155 34 6/28/92-
7/27/92 MBL Subtropic
100 Ito (1980) Minamitorishima/Chichijima Is. N24, N27 E154, E142 10/75-11/75,10/76-11/76
MBL Subtropic
101 Van Dingenen et al. (1995) North Atlantic N25 - N45 W010 - W065 9/92-10/92 MBL Subtropic 102 Hoppel et al. (1990b) North Atlantic N20 - N55 W000 - W80 3/83-4/84 MBL Subtropic &
Mid-latitudes 103 Hegg et al. (1990) Southern California coast
Washington state coast N23 , N40 - N55
W112 , W125 - W135
7/87 6/89 MBL Subtropic & Mid-latitudes
104 Clarke et al. (1998b) Coast of Ecuador/Panama N08 W085 - W086 09/96 MBL Tropic 105 Weber et al. (2001a) Hawaii-Tahiti N21 - S22 W194 - W220 2/99-3/99 MBL Tropic 106 Covert et al. (1996a) mid-Pacific N55 - S70 W060 -W150 92-93 MBL Tropic &
Mid-latitudes 107 Hoppel et al. (1990a) Seattle-Hawaii-Tahiti N20 - S55 W150 2/84-5/84 MBL Tropic &
Mid-latitudes 108 Zaizen et al. (1996) Pacific Ocean (Australia to
Japan) N38 - S38 E140 - E154 01/94 MBL Tropic &
Subtropic 109 Clarke et al. (1999a) MBL 110 Weber et al. (1999) MBL 111 Weber et al. (1996) Mauna Loa, Colorado Rockies N19 32 ,
N39 59 W155 34 , W105 35
6/28/92-7/27/92; 90/5/93-9/29/93
MBL & CBL
Subtropic & Mid-latitudes
112 Clarke et al. (1998a) South of Australia and the Equator
S40 - S44 E140 - E147 11/95-12/95 MBL & FT
Mid-latitudes
113 Raes et al. (1997) Tenerife N28 18 W016 30 07/94 MBL & FT
Subtropic
114 de Reus et al. (2001) Indian Ocean N10 - S10 E67 - E80 2/99-3/99 MBL & FT
Tropic
115 Clarke et al. (2002) MBL & FT
116 McMurry (2000) 117 Shi (2003) St. Louis N38.6 W90.2 4/01-4/02 CBL mid latitude 118 Brock et al. (1995) 87-94 UT&
lowerS
tropic, mid-latitudes & polar
119 Ferek et al. (1995) Barrow/Deadhoese, Alaska N71.18 W156.47 6/90-5/92 MBL Arctic 120 Hoffman et al. (1993) Laramie, Wyoming N41 W105 1971-1990 TS Mid-latitudes 121 Radke and Hobbs (1991) Cascade Mnts, Washington, N45-50 W120 May 11, 1989 FT Mid-latitudes 122 Thornton et al. (1997) Western Pacific Ocean N38 – S38 E140 – E154 1991,1994 MBL
& FT Tropic & Subtropic
123 Wang et al. (2000) North Atlantic N20-N70 W80-E10 10-11/97 UT Mid-latitudes 124 Davison et al. (1996) Antarctic S68-S73 0-W20 12/92 MBL Antarctic Table 1.

NO Air mass type PLATFORM 1 Coastal (?) Land 2 Coastal Land 3 Coastal (?) Land 4 Remote Land 5 Coastal Land 6 Remote rural Land 7 Remote rural Land 8 Remote rural Land 9 Remote rural Land 10 Urban Land 11 Urban land 12 Rural Land 13 Rural Aircraft 14 Rural Land 15 Rural, cloud
interaction Land
16 Rural, cloud interaction
Land
17 Rural Land 18 Rural Land 19 Rural Land 20 Rural Land 21 Rural Land 22 Rural Land 23 Rural Land 24 Rural Land 25 Rural Land 26 Rural Land 27 Rural Land 28 Rural Land 29 Rural Land 30 Rural 31 Rural Land 32 Rural Land 33 Rural Land 34 Urban Land 35 Urban Land 36 Urban Land 37 Coastal Land 38 Coastal Land 39 Coastal Land 40 Coastal Land 41 Coastal Land 42 Coastal 43 Coastal Land 44 Coastal Aircraft 45 Coastal 46 Coastal Land 47 Coastal Land 48 Coastal Land 49 Coastal Land 50 Urban Land 51 Urban Land 52 Rural Land 53 Rural Land 54 Coastal Land 55 urban Land 56 Coastal Land 57 Coastal Land 58 Rural Land 59 Rural Land 60 Rural Land 61 Urban Land 62 Rural Land 63 Rural Land 64 Urban modelling type 65 Urban Land 66 Rural Land 67 Coastal Land 68 Rural, desert Land 69 Rural Land 70 Rural Land 71 Rural Aircraft/balloon

72 Urban plume land 73 Rural, rain
forest Land
74 Remote rural Land 75 Remote rural Land 76 Exhaust plume/
industiral Aircraft
77 Exhaust plume /industrial
Aircraft
78 Aircraft 79 Cloud
interaction Aircraft
80 Aircraft 81 Aircraft 82 Aircraft 83 Aircraft 84 Aircraft 85 Exhaust plume
/aircraft aircraft
86 aircraft exhaust plume
aircraft
87 aircraft 88 ship 89 ship 90 ship 91 92 Biogenic
emissions aircraft+land
93 airship 94 Cloud
interaction aircraft
95 ship 96 aircraft 97 ship 98 ship/aircraft 99 Volcanic
emissions Land
100 land 101 ship 102 ship 103 Cloud
interaction aircraft
104 aircraft 105 aircraft 106 ship 107 ship 108 aircraft 109 review 110 review 111 Refers to 2
other papers land
112 aircraft 113 Coastal land 114 aircraft 115 review 116 Review 117 Urban land 118 aircraft 119 Coastal aircraft + land 120 Rural balloon 121 Rural aircraft 122 aircraft 123 aircraft 124 Remote ship Table 1b

Ref. Authors (year) # events J3 (cm-3s-1) J10 (cm-3s-1) J15 (cm-3s-1) GR (nm/h) 1 Koponen (2003) couple 0.5 1-2 3 Gras (1993) 0.1 4 Park et al. (2003) 1 0.13 5 Ito (1993) 3.8x10^-4
(needed to eplain observations)
8 Pirjola et al. (1998) 155 1.9-3.8 9 Dal Maso (2002) 141 J7: 0.38 (+/-
0.07) 1-10
10 McMurry et al. (2003) 23 20-70 (regional)
2-6
11 Shi et al. (2001) 1 5-50 - - 4 12 Weber et al. (1997) 9 0.1-1 0.5 – 2 13 Keil et al. (2001) 5 250 110 - - 14 Neusüss et al. (2002) 7 5.7(+/-1.1) 3.5(+/-1.0) 15 Wiedensohler et al. (1997a) 0.1 ~1 16 Birmili et al. (1999a) 1 20(+/-10) ~20 17 Verheggen et al. (2002) 1 5-40? 4 18 Birmili et al. (2000b) 1 3 2.1 19 Birmili et al. (2003) 117 1.11
(0.01-8.8) 2.61(0.5-8.41)
20 Birmili et al. (2001a) 10 1.41(+/-0.3) 3.0(+/-1.1) 21 Mäkelä et al. (1997) roughly 50 (3) 3? 3.3 22 Kulmala et al. (1998) 55 (10) 3-6 3-8 ? 5-20 23 Mäkelä et al. (1999) 2 0.4-0.5 2—3 24 Dal Maso et al. (2000) 50-60 0.1-1 Median=5, range
2-8 25 Kulmala et al. (2000a) 1-2 2.2-2.8 26 Mäkelä et al. (2000) 184 0.001-1 1-17 27 Aalto et al. (2001) 30 0.002-0.6 3-4 29 Kulmala et al. (2001) 3? 1 2.2-10.5 30 Kulmala et al. (2003) 0.1-3.4 1.3-5.0 31 Salm et al. (2000) J1.9: 0.05-0.1 3.5-5 nm/h 32 Marti et al. (1997) 0.1 33 Leaitch et al. (1999) 0.3 5.0-10 34 Wehner et al. (2002) 105 13(+/-1.2) 36 Väkevä et al. (2000) 3 4-6 37 O’Connor et al. (1991) 0.4 38 McGovern et al. (1996) 5 39 O’Dowd et al. (1998b) 10^3-1.5x10^4 8 40 McGovern (1999) 8 10-10000 41 Grenfell et al. (1999) 100-10000 42 O’Dowd et al. (1999) 1000-10000 20 43 O’Dowd et al. (2000a) 25 20000-100000 44 O’Dowd et al. (2000b) 10 45 Kulmala et al. (2000b) 300-60000 8—10 47 O’Dowd et al. (2002a) 600 1e4-1e5 15-200 48 Dal Maso et al. (2002) 400-1e5 15-200 49 O’Dowd et al. (1998a) 1000-15000 8 50 Williams et al. (1998) >>0.2 52 Birmili et al. (2000a) 151 11.1
(0.06-74) - - < 10nm:4.1(1.1-6-
1) 53 Birmili et al. (2001b) 151 11.1
(0.06-74) - - < 10nm:4.1(1.1-6-
1) 2.1 54 Mihalopoulos et al. (1992) 10 16 55 Stanier et al. (2002) 42 4-May 56 Zeromskiene et al. (2000) 1-1.5 57 Ulevicius et al. (2002) 30-40 8—12 58 Koutsenogii et al. (1994) 1.0
(J_tot)
59 Horrak et al. (1998) 4 0.1-1.0 4-5 60 Horrak et al. (2000) 101 0.1-1.0 61 Winklmayer (1987) 2 2.5 62 Harrison et al. (2000) 4 0.91 1.3 63 Coe et al. (2000) 6 <0.05 2.6-8 65 Woo et al. (2001) 23 10-15 - - 66 Kavouras et al. (1999b) 3-5 67 Weise et al. (1998) 8 ~2 ~4 68 Misaki (1964) 1 0.5 8.9 69 Kavouras et al. (1998) ~2 70 Kavouras et al. (1999a) 0.9 3 74 Baltensperger et al. (1997) 1-2 0.5 75 Weingartner et al. (1999) 4 0.14 3-4.5 78 Nyeki et al. (1999) 10-100 79 Weber et al. (2001b) >0.33 80 de Reus et al. (2000) 1 83 Clarke et al. (1999b) ~0.4
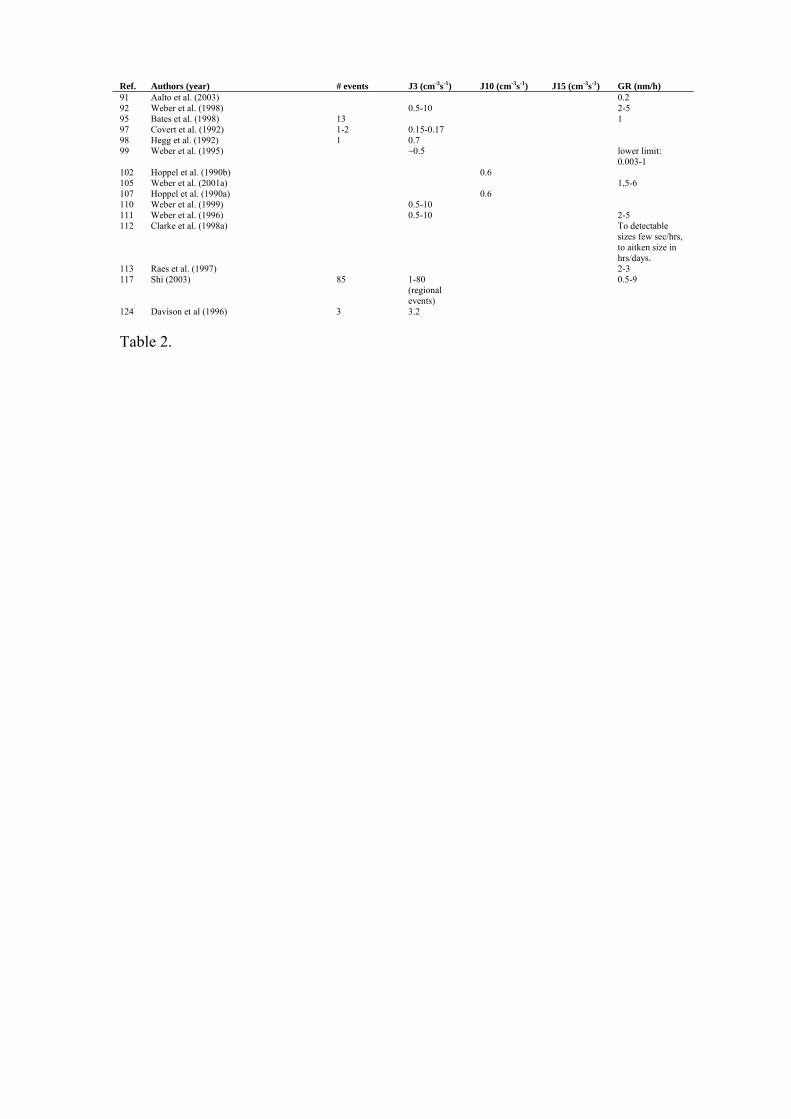
Ref. Authors (year) # events J3 (cm-3s-1) J10 (cm-3s-1) J15 (cm-3s-1) GR (nm/h) 91 Aalto et al. (2003) 0.2 92 Weber et al. (1998) 0.5-10 2-5 95 Bates et al. (1998) 13 1 97 Covert et al. (1992) 1-2 0.15-0.17 98 Hegg et al. (1992) 1 0.7 99 Weber et al. (1995) ~0.5 lower limit:
0.003-1 102 Hoppel et al. (1990b) 0.6 105 Weber et al. (2001a) 1,5-6 107 Hoppel et al. (1990a) 0.6 110 Weber et al. (1999) 0.5-10 111 Weber et al. (1996) 0.5-10 2-5 112 Clarke et al. (1998a) To detectable
sizes few sec/hrs, to aitken size in hrs/days.
113 Raes et al. (1997) 2-3 117 Shi (2003) 85 1-80
(regional events)
0.5-9
124 Davison et al (1996) 3 3.2 Table 2.

Figure 1. Global map. The dots indicate observation sites, the dashed lines and rectangles indicate regions where airborne or ship observations have been made.

Figure 2. Typical particle formation event in Hyytiälä boreal forest site on March 13th 1996: particle size distribution data as a surface plot (a), and total particle number concentration versus time (b).
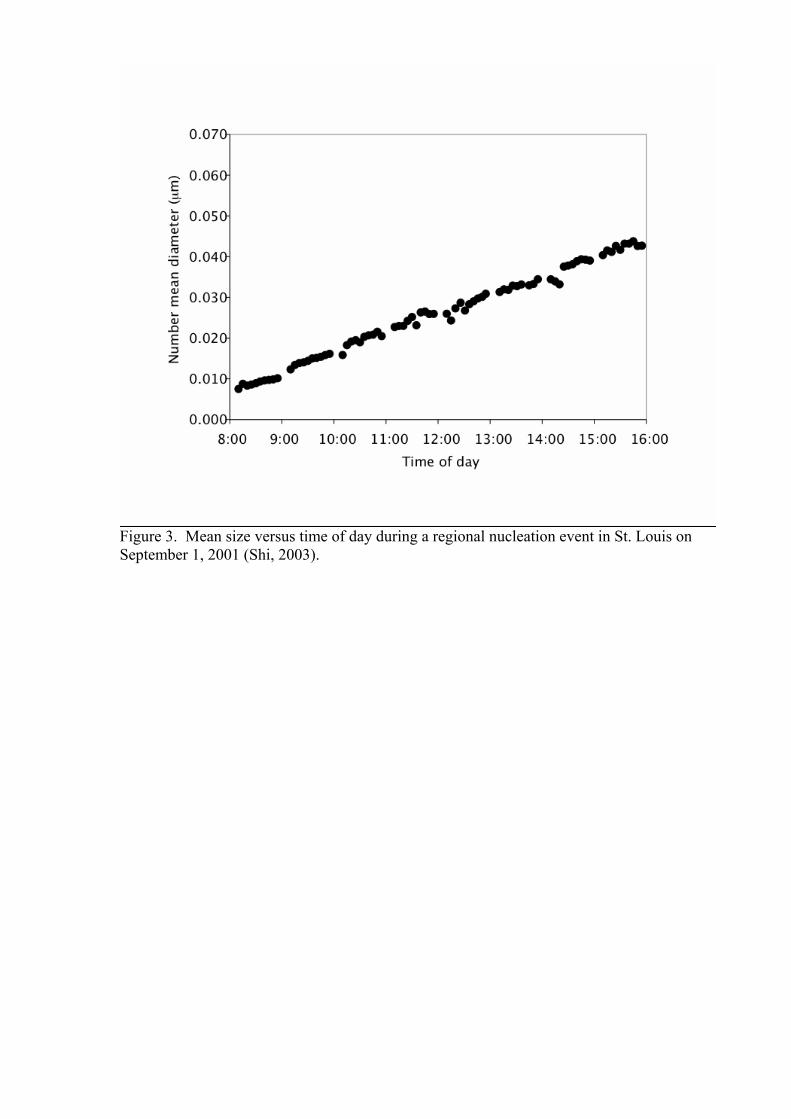
Figure 3. Mean size versus time of day during a regional nucleation event in St. Louis on September 1, 2001 (Shi, 2003).

Figure 4a. Monthly variations of the growth rate during regional nucleation events in (a) Hyytiälä , (b) Hohenpeissenberg (Birmili et al., 2003), and (c) urban St. Louis (Shi, 2003).
0
4
8
12
16
20
0 1 2 3 4 5 6 7 8 9 10 11 12month of year
grow
th ra
te, n
m h
-1
(a) Hyytiälä 1996-1999
0
2
4
6
8
10
0 1 2 3 4 5 6 7 8 9 10 11 12
grow
th ra
te, n
m h
-1
St Louis 2001-2002(c)
0
2
4
6
8
10
12
0 1 2 3 4 5 6 7 8 9 10 11 12month of year
grow
th ra
te, n
m h
-1
(b) Hohenpeissenberg 1998-2000

1 2 3 4 5 6 7 8 9 10 11 120.0
0.1
0.2
0.3
0.4
0.5 St Louis 2001-2002(c)
Eve
nts
per d
ay
month of year
1 2 3 4 5 6 7 8 9 10 11 120.0
0.1
0.2
0.3
0.4
0.5
1998-2000Hohenpeissenberg(b)
Even
ts p
er d
ay
1 2 3 4 5 6 7 8 9 10 11 120.0
0.1
0.2
0.3
0.4
0.5 (a) Hyytiälä 1996-1999
Even
ts p
er d
ay
Figure 5 Frequency of regional particle formation events versus month for (a) Hyytiälä (b) Hohenpeissenberg (Birmili et al., 2003), and (c) St. Louis (Shi, 2003).

0 10 0
2 10 6
4 10 6
6 10 6
8 10 6
1 10 7
0
50
100
150
200
250
0 400 800 1200 1600 2000 2400
Sul
furic
Aci
d (c
m-3
)U
FA C
onc
TIME
H2SO4
UltrafinesSunrise Sunset
1.5 hr
Figure 6. Time series plot of sulfuric acid vapor and 2.7-4 nm particles during a nucleation event at Idaho Hill, CO on September 21, 1993 (Weber et al., 1997)

Figure 7. Sulfuric acid relative acidity versus relative humidity during nucleation events in various locations. The data shown in open circles were measured aloft, while the solid circles were measured at or close to the surface. Both modelled ternary and binary nucleation rates (1 cm-3s-1) are also indicated . See also Weber et al., (1999).

Figure 8. Schematic picture on relations between the new-particle formation rate (Jreal and JD) and the concentrations of precursor gases, their oxidants and pre-existing aerosol particles. Plusses (minuses) indicate a positive (negative) correlation between the two quantities. Meteorological factors other than temperature (T) have not been included.