FORMALIZING PLACE IN GEOGRAPHIC …good/papers/502.pdf1 FORMALIZING PLACE IN GEOGRAPHIC INFORMATION...
22
1 FORMALIZING PLACE IN GEOGRAPHIC INFORMATION SYSTEMS Michael F. Goodchild, University of California, Santa Barbara ABSTRACT The past four decades have witnessed a rapid and accelerating growth in the use of computers to handle geographic information. As machines, computers require that inputs be formalized, following well-defined rules and using shared definitions of terms. This requirement has created a fundamental tension with the informal world of human discourse, and nowhere is this more apparent than over the vague concept of place. The chapter explores this tension from various perspectives: current methods of geographic representation in digital form, inherent ambiguities, the case of the gazetteer, the role of volunteered geographic information, and place as an expression of context. Examples are used to illustrate the basic principles. INTRODUCTION The concept of place has a long history in geography and related disciplines, but has been plagued by a fundamental vagueness of definition: what, exactly, does the term mean? Within any one area of application, such as the study of migration, it may be possible to approach precision, but definition has remained elusive across the wide spectrum of domains in which the term is used. In the mid 1960s it became possible to reduce the contents of maps to digital form for the first time (Foresman, 1998), allowing them to be processed by the new digital computers that were then becoming available. The first driving motivation was simple
Transcript of FORMALIZING PLACE IN GEOGRAPHIC …good/papers/502.pdf1 FORMALIZING PLACE IN GEOGRAPHIC INFORMATION...

1
FORMALIZING PLACE IN GEOGRAPHIC INFORMATION SYSTEMS
Michael F. Goodchild, University of California, Santa Barbara
ABSTRACT
The past four decades have witnessed a rapid and accelerating growth in the use of
computers to handle geographic information. As machines, computers require that inputs
be formalized, following well-defined rules and using shared definitions of terms. This
requirement has created a fundamental tension with the informal world of human
discourse, and nowhere is this more apparent than over the vague concept of place. The
chapter explores this tension from various perspectives: current methods of geographic
representation in digital form, inherent ambiguities, the case of the gazetteer, the role of
volunteered geographic information, and place as an expression of context. Examples are
used to illustrate the basic principles.
INTRODUCTION
The concept of place has a long history in geography and related disciplines, but has been
plagued by a fundamental vagueness of definition: what, exactly, does the term mean?
Within any one area of application, such as the study of migration, it may be possible to
approach precision, but definition has remained elusive across the wide spectrum of
domains in which the term is used.
In the mid 1960s it became possible to reduce the contents of maps to digital form
for the first time (Foresman, 1998), allowing them to be processed by the new digital
computers that were then becoming available. The first driving motivation was simple

2
measurement, given the historic frustration with obtaining even the most basic measures
of mapped features, such as length and area, from paper copies (Maling, 1989). In time, it
became possible to see and exploit the advantages of computer-based handling of map
data in many areas besides measurement -- in the editing processes of map compilation,
in managing complex geographically distributed operations, and in scientific research. By
1980 the concept of a geographic information system (GIS) had taken hold, as a system
that would support a vast array of operations on geographic information, and the first
commercial software products began to appear. Today GIS is a major computer
application, used in and indispensable to many forms of human activity. The average
citizen is likely to encounter a simple form of GIS in seeking driving directions from
Web services, zooming to his or her local neighborhood using Google Earth, or tracking
jogging routes with GPS (the Global Positioning System).
It is easy to underestimate the profound effect that the development of GIS has
had on all aspects of geographic data production, analysis, and use. Instead of the tedium
and inherent errors of map measurement, it offers precision. Instead of vaguely defined
locations, it captures and manages coordinates to as many decimal places as the data can
justify (and frequently many more). And more importantly, it formalizes many of the
previous vague terms of geographic research. In order to represent geographic
information in the precise environment of a digital computer, with its binary alphabet of
0s and 1s, it is necessary to reduce everything being represented to a simple code, using
agreed and explicit rules. Because of this, GIS has often been accused of taking an
excessively simplistic view of the complexity of many geographic ideas (Pickles, 1995);
but when those ideas are rigorously defined and readily formalized, as they hopefully are

3
in scientific applications, then the benefits are obvious in the ease with which data can be
analyzed, visualized, modeled, and shared.
The purpose of this chapter is to explore the formalization of one such concept,
place. In essence, the chapter addresses the relationship between the informal world of
human discourse on the one hand, and the formal world of digitally represented
geography on the other. Much effort over the past four decades has gone into ensuring the
accuracy of digital geographic data, into ensuring that terms used by one community are
understood by another, and into ensuring that the GIS enterprise meets the norms of
scientific research (Goodchild et al., 1999). Special attention has been devoted to
concepts that are inherently vague, such as the definition and limits of many geographic
features (Burrough and Frank, 1996). The chapter addresses the formalization of place,
and returns at the end to the question of whether place is simply too vague to be
formalized, except in very narrowly defined circumstances.
The next section discusses alternative definitions and examples. This is followed
by sections on inherent ambiguities, on placenames and the formal gazetteer, on the role
of volunteered geographic information or user-generated geographic content, and on
defining place as context. The final substantive section reviews the role of place as one of
a number of fundamental spatial concepts.
DEFINITIONS AND EXAMPLES
A GIS can be defined as a computer application designed to perform virtually any
conceivable operation on geographic information. It is a means of acquiring, storing,
communicating (Sui and Goodchild, 2001), and analyzing what is known about the

4
geographic world. In turn, geographic information can be defined as knowledge about the
geographic world; as information linking properties to locations on or near the Earth’s
surface. Every item of information in a GIS must be associated with some location,
expressed in the coordinates of latitude/longitude or some equally universal system.
Finally, a map is a compilation of one or more types of geographic information, or layers,
for a defined area. Maps are typically printed on flat paper, which requires that the true
curved surface of the Earth be distorted through the use of a projection. Much geographic
information is now dynamic, including a vast number of real-time information sources
fed through the Internet, so the concept of an inherently static map as a repository of
geographic information is today somewhat limiting.
Figure 1 shows an example of this modern concept of a map: a display of real-
time information in the Advanced Emergency GIS, developed through a collaboration
between ESRI, the leading vendor of GIS software, and the Loma Linda University
Medical Center. It shows the situation during a fire emergency in Southern California,
with icons depicting real-time sources of information, such as the locations of rescue
vehicles and helicopters, the perimeters of the fires, and the locations of hospitals and
freeway surveillance cameras. The actual display from which this screen shot was
obtained is dynamic, allowing the user to zoom, pan, click on icons to obtain more
information, and plan actions.
[Figure 1 about here]
Figure 2 illustrates the power of GIS as an engine for visualization and analysis.
The list on the left represents a typical table of data -- a list of states in alphabetical order,
with one variable, median value of housing in the state, exemplifying the vast amount of

5
information that is available from official sources through programs such as the decennial
Census. On the right is a map showing the same variable, along with major freeways.
Seeing the data in spatial perspective immediately suggests a number of questions that
would not be as readily suggested by the table: why is high housing value a phenomenon
of the Northeast and California? Why are houses in Delaware cheaper than those in
neighboring Maryland? Why is housing in New Hampshire more expensive than in its
neighbor Vermont? Making an alphabetical list of states removes from view any of the
insights that can be gained from spatial context, with the exception of Indiana/Illinois and
Florida/Georgia, which are adjacent both in space and in the alphabetically ordered table.
[Figure 2 about here]
AMBIGUITIES
One of the complications of GIS stems from the vast number of ways in which simple
items of geographic information can be coded. Information may be available about
points, lines, or areas, and may include a vast array of attributes that are often quantitative
(e.g., population) but also qualitative (text descriptions, images, sound). To be useful as a
means of communicating geographic knowledge, however, the coding scheme must be
both replicable, in the sense that two people would independently arrive at the same code,
and understood by both sender and receiver of information. Unfortunately lack of
standards and rigorous definitions has meant that all too often geographic information is
not interoperable, in other words intelligible and informative across divides of distance,
discipline, or application (Goodchild et al., 1999).
6
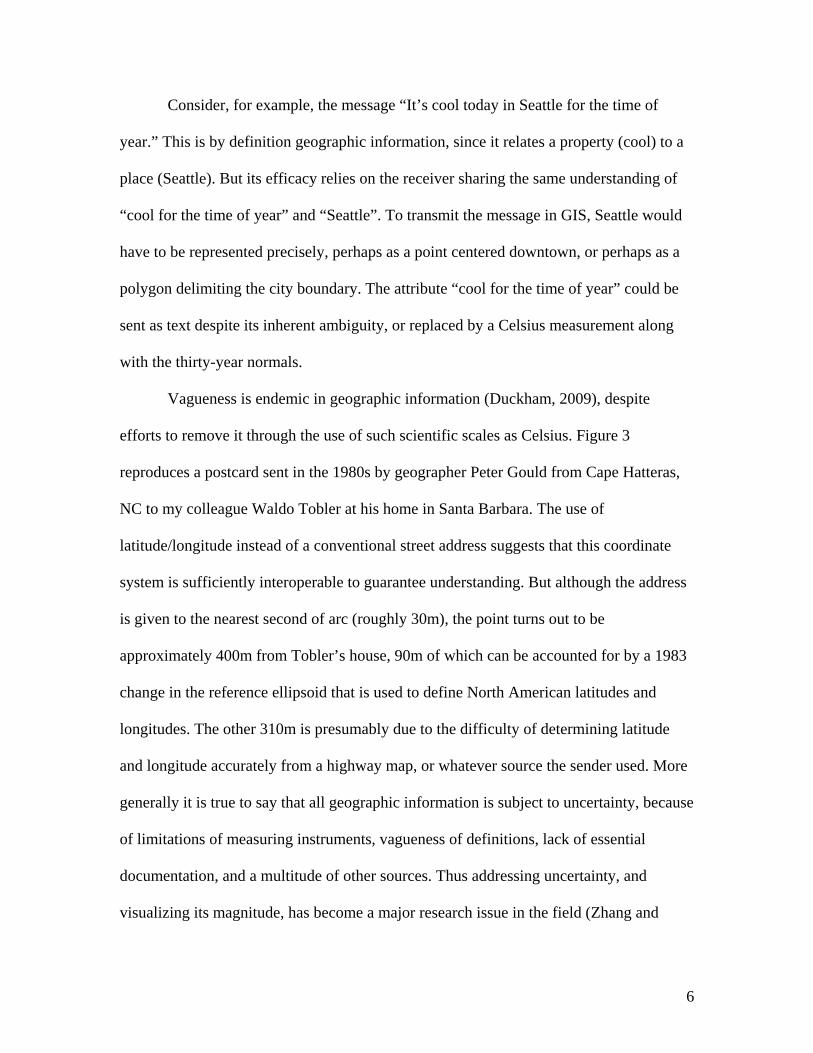
Consider, for example, the message “It’s cool today in Seattle for the time of
year.” This is by definition geographic information, since it relates a property (cool) to a
place (Seattle). But its efficacy relies on the receiver sharing the same understanding of
“cool for the time of year” and “Seattle”. To transmit the message in GIS, Seattle would
have to be represented precisely, perhaps as a point centered downtown, or perhaps as a
polygon delimiting the city boundary. The attribute “cool for the time of year” could be
sent as text despite its inherent ambiguity, or replaced by a Celsius measurement along
with the thirty-year normals.
Vagueness is endemic in geographic information (Duckham, 2009), despite
efforts to remove it through the use of such scientific scales as Celsius. Figure 3
reproduces a postcard sent in the 1980s by geographer Peter Gould from Cape Hatteras,
NC to my colleague Waldo Tobler at his home in Santa Barbara. The use of
latitude/longitude instead of a conventional street address suggests that this coordinate
system is sufficiently interoperable to guarantee understanding. But although the address
is given to the nearest second of arc (roughly 30m), the point turns out to be
approximately 400m from Tobler’s house, 90m of which can be accounted for by a 1983
change in the reference ellipsoid that is used to define North American latitudes and
longitudes. The other 310m is presumably due to the difficulty of determining latitude
and longitude accurately from a highway map, or whatever source the sender used. More
generally it is true to say that all geographic information is subject to uncertainty, because
of limitations of measuring instruments, vagueness of definitions, lack of essential
documentation, and a multitude of other sources. Thus addressing uncertainty, and
visualizing its magnitude, has become a major research issue in the field (Zhang and

7
Goodchild, 2002). On the other hand the apparent precision of the products of a GIS,
whether in the form of maps or numbers, is clearly one of its attractive features, and it has
been difficult at times to persuade the users of GIS to address uncertainty explicitly.
[Figure 3 about here]
DIGITAL GAZETTEERS
The vagueness of place, and the interface between the informal world of human discourse
and the formal world of GIS, is nowhere as apparent as with the gazetteer. A gazetteer is
defined as a table of records about named features, each record containing three elements:
a location defined in a suitable coordinate system, a type of the feature using a controlled
vocabulary, and a name (Goodchild and Hill, 2008). Gazetteers reflect the modernist
view that every feature should have a single, officially recognized name. Digital
gazetteers are an essential though hidden part of many Web sites, since they allow
placenames provided by users to be converted into coordinates, and used to provide
associated services such as driving directions.
There has been much interest recently in automating the use of placenames,
especially when they occur in text. The term geoparsing is often used to describe the
process of detecting placename references in text and automating their formalization, a
process that has found abundant applications in the gathering of intelligence from email
and phone conversations. Many entries in Wikipedia are now geotagged by the addition
of hidden codes (microformats) that represent location in a formal coordinate system. The
geoparsing task is enormously difficult, however, because of the role of context in
defining the meaning of placenames. For example the placename Shanghai can appear in

8
English as a verb (to kidnap), and the placename Los Angeles may have different
meanings when spoken in New York or in San Bernardino, CA. A simple example is
provided by the clustering of geotags that has appeared recently around the small town of
Boston, NY, because of confusion in geoparsing texts that contain lists of major US
cities.
Formalization of placenames, in other words removal of ambiguity, poses very
substantial research challenges. The identification of places is a subjective, cognitive act
(e.g., the Italian term poggio for a rounded hill has no single-word English equivalent), is
culturally situated (e.g., bordering countries can give different names to features), and is
often time-variant (e.g., Lake Bonneville is now dry). In the case of Lake Tahoe, all three
elements of its gazetteer entry are ambiguous: it has had at least six names through
history; it is alternatively classified either as a lake or a reservoir; and its location varies
depending on the scale of the source mapping. Hastings (2008) has argued that the three
elements should be strictly prioritized in addressing ambiguity. Location should be
treated first, since all locations assigned to a feature will be similar; type should be
second, because conflicting types will be semantically related even in a controlled
vocabulary; and name should be last, because alternative names need have no
resemblance to each other.
While gazetteers normally limit themselves to officially recognized features,
Montello et al. (2003) have addressed the problem of formalizing informal or vernacular
features. Using the example of Downtown Santa Barbara, they have shown how
experiments with human subjects can be used to elicit a feature’s geographic limits, and
how such limits can be represented in a GIS, despite a lack of complete consensus. Jones

9
(e.g., Jones et al., 2008) has conducted a number of experiments aimed at automatically
eliciting similar geographic limits from vernacular placenames used in Web text.
VOLUNTEERED GEOGRAPHIC INFORMATION
The production of gazetteers has traditionally been the responsibility of authorities such
as the US Geological Survey, and its equivalent national mapping agencies in other
countries. These agencies have ensured that naming is standardized, so that users can
communicate without ambiguity. It is important to realize, however, that this modernist
approach is confined to the past century or two. If we go back to 1507, for example, we
find an instance of naming that involved no authority, but nevertheless came in time to be
accepted as standard by much of humanity (Fernández-Armesto, 2007). I refer to the
naming of America, which occurred in that year in St-Dié-des-Vosges, a small town in
Eastern France. Martin Waldseemüller and Vautrin Lud needed a name to identify the
large land mass that explorers had found to the west of the Atlantic. They were excited to
receive letters from Florence that appeared to give credit to Amerigo Vespucci for being
first to recognize the land as a New World, a new continent. They feminized his first
name, and placed the word “America” on the map of what we would now call South
America. Although it seems they later regretted their decision (Fernández-Armesto,
2007), the map had by then been widely distributed and the name stuck. No government
agency was involved, and Waldseemüller had no recognizable form of authority.
In today’s post-modern world such practices are becoming common once again,
supported by the participatory information technology that we today know as the Web
and that permit ordinary citizens with no authority, training, or financial reward to

10
publish names for features that reflect their own interests, cultural or linguistic
affiliations, or whatever suits their fancy. This form of user-generated content is part of a
larger movement often termed Web 2.0, to distinguish it from earlier visions of the Web
as a top-down mechanism for information dissemination.
An excellent example of a post-modern, Web 2.0 equivalent of the gazetteer is
Wikimapia, a site that uses procedures somewhat similar to the better-known Wikipedia
to place names on maps, or as the site itself proclaims, to “describe the whole world”.
Wikimapia allows users to find features in a familiar map interface, to outline their limits
as polygons, and to provide descriptions that may be as short as a single name, or as long
as an extensive text -- together with hyperlinks to other Web-based information. The
number of entries in Wikimapia is currently approaching 11 million, which is roughly
twice as many as in the world’s most extensive gazetteer. Wikimapia entries may be
formally recognized or vernacular, and the descriptions are in many cases far richer than
those of a gazetteer, which are limited to a simple type.
Many hundreds of examples of such citizen-created VGI can be found on the
Web, ranging from entertaining efforts to map the use of language to serious citizen
science. In the latter category are such programs as the Christmas Bird Count of the
Audubon Society, and Project Budburst, a large-scale effort to provide phenological data.
Hundreds of millions of volunteered, geo-registered photographs are now available at the
Flickr site, and Open Street Map is an international effort to create a detailed global map
using volunteer effort.
Effort such as these have powerful practical implications for studies of place,
since information elicited from the average citizen can potentially help us to define and

11
thus formalize associated concepts. Zook and Graham (2009) have made extensive
analyses of VGI, searching for culturally significant terms that can be used to delimit
community. By searching for instances of “Jesus” and “Allah”, for example, they are able
to make detailed maps of the distributions of Christianity and Islam within Europe. By
searching for instances of “Polish” they have produced detailed delimitations of the
Polish community in Chicago.
PLACE AS CONTEXT
Like many terms, place performs a variety of functions in different settings. Social
scientists are most likely to be interested in its role in defining context, or the geographic
area within which humans live their lives. As such it is likely to be of value in linking
individual behavior to context, in studies of links between humans and their environment.
For example, it may be helpful in studies of the effects of air pollution, or in links
between obesity and urban design (Lopez, 2007). Place often is used in the sense of
action space, or the space within which humans carry out habitual aspects of their lives,
such as shopping, work, recreation, and sleeping. Such spaces are largely unique to the
individual, and likely also to vary through time as habits change, as spaces are learned, or
as people migrate. Place is often used in the sense of community or neighborhood,
implying an informal relationship to an area surrounding the individual’s place of
residence. In this case also the boundaries of place are likely to be specific to the
individual and time-dependent, and perhaps inherently vague.
Set against this perspective of individual, time-dependent definitions are the
various administrative tesselations. A tesselation can be defined as a partitioning of space

12
into irregularly shaped areas, such that every location lies in exactly one area. Counties,
states, local municipalities, and census tracts all satisfy this definition. All are
administrative in origin and fixed (though most are annoyingly subject to revision from
time to time). As formalizations of place they are highly unsatisfactory, allowing none of
the individual variation or time-dependence discussed above. However their role as
reporting zones for social statistics makes them particularly attractive for research, to the
degree that many researchers are willing to overlook their inherently unsatisfactory
aspects and to adopt an individual’s containing reporting zone as a convenient surrogate
for that individual’s neighborhood.
One of the most egregious examples is the US county, an adminstrative unit that
is often used for research, since an abundance of data are available for these units. Far
from reflecting a single scale or level of geographic detail, the counties of the
conterminous US vary by a factor of 104 in area (from Manassas City County, VA to San
Bernardino County, CA) and 105 in population (from Yellowstone National Park County,
MT to Los Angeles County, CA).
Techniques have been developed for estimating statistics for specialized areas,
and in principle these might be used to provide better definitions of context. Statistical
agencies such as the US Bureau of the Census may be willing to provide custom
tabulations for specialized areas, and more generally methods of areal interpolation
provide a stop-gap solution. In areal interpolation we define areas for which statistics are
available as source zones, and areas for which statistics need to be estimated as target
zones. The simplest of these methods (Goodchild and Lam, 1980) apportions counts for
source zones according to the areas of overlap between them and target zones, based on

13
the assumption that populations are uniformly distributed within source zones. A variety
of more elaborate techniques have been investigated, based on different assumptions
about spatial distributions (e.g., Goodchild, Anselin, and Deichmann, 1993; Tobler,
1979).
Figure 4 shows an example application of the simplest technique. The population
of Los Angeles County, which is concentrated near the coast, is clearly better represented
in the interpolated estimates for 3-digit ZIP boundaries, since these are generally smaller
than counties in areas of high density.
[Figure 4 about here]
Spatial convolution describes a different set of techniques that are perhaps more
useful in approaching individual definitions of place. Instead of equating context with the
contents of some administratively defined unit that happens to contain the individual’s
location, these methods define context geometrically and centered on the individual. One
might, for example, define context as a circle of radius x centered on the individual. The
value of x would have to be set, of course, but could be rationalized based on some
program of empirical research. Using GIS, this circle could then be overlaid on reporting-
zone boundaries, areas of overlap computed, and estimates made using these areas as
weights. A rather more sophisticated and theoretically more acceptable version would
weight according to distance, using a suitable mathematical function to provide the
weights.
Figure 5 shows a simple illustration of this approach. The blue polygons represent
three reporting zones, which have been overlaid with a raster of cells. Each zone’s
population (or whatever variable is most relevant to context) is distributed among the

14
cells that overlap it based on area. The cells are then summed weights computed from a
decreasing function of distance known as a kernel function. The method bears a strong
resemblance to density estimation (Silverman, 1986).
[Figure 5 about here]
PLACE AS A SPATIAL CONCEPT
We have seen in this chapter how the concept of place underlies many investigations of
the nature of geographic reality, and the processes that play themselves out on the
geographic landscape. As such it ranks with many other spatial concepts, from the
simplest (location, distance) to the most advanced (spatial dependence, spatial
heterogeneity) that provide many of the primitive elements of disciplines that deal with
phenomena distributed in space and time. There have been many attempts over the past
few decades to enumerate these concepts, and to study how an understanding of them is
acquired during the cognitive development of humans. Gardner (1999), for example, has
argued that these concepts are the foundation of a distinct form of intelligence, one of a
number of such discrete intelligences that underlie human learning and reasoning (Eliot,
1987).
The concepts of spatial intelligence have recently been the subject of a major
report by the National Research Council on spatial thinking, which the report describes as
“pervasive” and “vital across a wide range of domains of practical and scientific
knowledge; yet it is underrecognized, undervalued, underappreciated, and therefore
underinstructed” (NRC, 2006). At the Center for Spatial Studies at the University of
California, Santa Barbara, we have constructed a comprehensive directory to this

15
literature (www.teachspatial.org), and identified almost 200 fundamental concepts from
the literatures of many disciplines.
CONCLUDING COMMENTS
The digital world that has come to dominate information in the 21st Century is harsh and
unforgiving, requiring as it does that all knowledge be expressed in a code of just two
symbols, 0 and 1. Rigid rules are required to translate information into this alphabet, rules
that are in many cases alien to the much less formal world of the humanities and social
sciences. The advantages, however, are obvious: digital information can be shared,
analyzed, and verified in ways that are impossible with less rigorously structured forms.
This chapter has examined the concept of place from this perspective.
Comparisons are often drawn between place and space, arguing that the latter is rigidly
scientific but substantively uninteresting. What role, for example, have latitude and
longitude ever played in explaining society? Place is a rich concept, yet its inherent
vagueness appears to make it irrelevant to the brave new world of digital scholarship.
Like other words such as system and object, place as a term is overloaded with
alternative meanings. Separating those meanings may allow some of them to be defined
with sufficient rigor to be formalized. This chapter has presented several examples of this
nature, and shown how GIS techniques can be used to operationalize place in specific
areas of research, whether it be by eliciting definitions of place from human subjects, or
by the use of mathematical functions in convolution, or by searching the Web for patterns
of usage.

16
Several conferences over the past few years have drawn attention to the growing
interest in spatially detailed analyses of human dynamics. Yet at this time there is no
single, comprehensive text on the topic, and courses in universities are few and far
between. Given time, perhaps a new field will emerge at this intersection between digital
technology, social science, and digital data. If it does, the concept of place will clearly
occupy a central position.

17
ACKNOWLEDGMENTS
I thank Donald Janelle and Karl Grossner for their work in building the teachspatial.org
site with its ontology of spatial concepts.

18
REFERENCES
Burrough, P.A. and A.U. Frank, editors, 1996. Geographic Objects with Indeterminate
Boundaries. London: Taylor and Francis.
Duckham, M., 2009. Keynote paper: Representation of the natural environment. In N.
Mount, G. Harvey, P. Aplin, and G. Priestnall, editors, Representing, Modeling, and
Visualizing the Natural Environment, pp. 11-20. Boca Raton: CRC Press.
Eliot, J., 1987. Models of Psychological Space: Psychometric, Developmental and
Experimental Approaches. New York: Springer-Verlag.
Foresman, T.W., editor, 1998. The History of Geographic Information Systems:
Perspectives from the Pioneers. Upper Saddle River, NJ: Prentice Hall.
Fernández-Armesto, F., 2007. Amerigo: The Man Who Gave His Name to America. New
York: Random House.
Gardner, H., 1999. Intelligence Reframed: Multiple Intelligences for the 21st Century.
New York: Basic Books.
Goodchild, M.F., L. Anselin, and U. Deichmann, 1993. A framework for the areal
interpolation of socioeconomic data. Environment and Planning A 25: 383-397.

19
Goodchild, M.F., M.J. Egenhofer, R. Fegeas, and C.A. Kottman, editors, 1999.
Interoperating Geographic Information Systems. Boston: Kluwer Academic Publishers.
Goodchild, M.F. and L.L. Hill, 2008. Introduction to digital gazetteer research.
International Journal of Geographical Information Science. 22(10): 1039-1044.
Goodchild, M.F. and N. Lam, 1980. Areal interpolation: A variant of the traditional
spatial problem. Geoprocessing 1: 297-312.
Hastings, J.T., 2008. Automated conflation of digital gazetteer data. International
Journal of Geographical Information Science 22(10): 1109-1127.
Jones, C.B., R.S. Purves, P.D. Clough, and H. Joho, 2008. Modelling vague places with
knowledge from the Web. International Journal of Geographical Information Science
22(10): 1045-1065.
Lopez, R.P., 2007. Neighborhood risk factors for obesity. Obesity 15: 2111-2119.
Maling, D.H., 1989. Measurement from Maps: Principles and Methods of Cartometry.
New York: Pergamon.

20
Montello, D.R., M.F. Goodchild, J. Gottsegen, and P. Fohl, 2003. Where's downtown?
Behavioral methods for determining referents of vague spatial queries. Spatial Cognition
and Computation 3(2,3): 185-204.
National Research Council, 2006. Learning to Think Spatially: GIS as a Support System
in the K-12 Curriculum. Washington, DC: National Academies Press.
Pickles, J., editor, 1995. Ground Truth: The Social Implications of Geographic
Information Systems. New York: Guilford.
Silverman, B.W., 1986. Density Estimation for Statistics and Data Analysis. London:
Chapman and Hall.
Sui, D.Z. and M.F. Goodchild, 2001. Guest Editorial: GIS as media? International
Journal of Geographical Information Science 15(5): 387-389.
Tobler, W.R., 1979. Smooth pycnophylactic interpolation for geographical regions.
Journal of the American Statistical Association 74(367): 519-536.
Zhang, J.-X. and M.F. Goodchild, 2002. Uncertainty in Geographical Information. New
York: Taylor and Francis.

21
Zook, M. and M. Graham, 2009. Mapping the GeoWeb: The spatial contours of Web 2.0
cyberspace. Paper presented at the Annual Meetings of the Association of American
Geographers, Las Vegas.

22
FIGURE CAPTIONS
1. Screen shot of the Advanced Emergency GIS, showing the situation during an
outbreak of wildfires in Southern California in 2007. Each clickable icon denotes the
availability of real-time information about a feature or asset relevant to the emergency,
such as a rescuer vehicle, hospital, or freeway camera.
2. Contrasting the insights available from a table (left) and a map (right). The same
information (median value of housing by state) is displayed in both, but the map places
that information in context, allowing a range of inferences to be drawn from the spatial
pattern.
3. Reproduction of a postcard sent in 1980 from Cape Hatteras, NC, by Prof Peter Gould.
Despite the use of latitude/longitude to code and formalize street address, the card was
successfully delivered to Prof Waldo Tobler in Santa Barbara, CA by the US Postal
Service.
4. Areal interpolation of median value of housing from the source zones (the counties of
California) to target zones defined by the first three digits of ZIP codes.
5. A simple example of convolution to obtain an estimate of the context of a person
located at the point shown. Statistics associated with three polygonal reporting zones are
assigned to an overlay of cells, weighted according to distance from the point, and
summed.